
Medpace Holdings, Inc. - s3.amazonaws.coms3.amazonaws.com/ipo_candy/MEDP_IPO_Prospectus.pdf ·...
208
The information in this prospectus is not complete and may be changed. We may not sell these securities until the registration statement filed with the Securities and Exchange Commission is effective. The prospectus is not an offer to sell these securities nor a solicitation of an offer to buy these securities in any jurisdiction where the offer and sale is not permitted. SUBJECT TO COMPLETION DATED AUGUST 1, 2016 PRELIMINARY PROSPECTUS 7,000,000 Shares Medpace Holdings, Inc. Common Stock Medpace Holdings, Inc. is offering 7,000,000 shares of its common stock. This is our initial public offering, and no public market currently exists for our common stock. We expect the initial public offering price to be between $20.00 and $23.00 per share. We have applied to list our common stock on the NASDAQ Global Select Market under the symbol “MEDP.” We are an “emerging growth company” as defined by the Jumpstart Our Business Startups Act of 2012 and, as such, we have elected to comply with certain reduced public company reporting requirements for this prospectus and future filings. Investing in our common stock involves risks. See “Risk Factors” beginning on page 20 to read about factors you should consider before purchasing our common stock. Neither the Securities and Exchange Commission nor any state securities commission nor any other regulatory body has approved or disapproved of these securities or passed upon the accuracy or adequacy of this prospectus. Any representation to the contrary is a criminal offense. PER SHARE TOTAL Public Offering Price ........................................ $ $ Underwriting Discounts and Commissions (1) ...................... $ $ Proceeds to Medpace Holdings, Inc., before expenses .............. $ $ (1) We have agreed to reimburse the underwriters for certain expenses in connection with this offering. See “Underwriting.” Our Chief Executive Officer and founder, Dr. August J. Troendle, has indicated an interest to purchase up to $20.0 million in shares of our common stock in this offering at the initial public offering price. However, because indications of interest are not binding agreements or commitments to purchase, Dr. Troendle may determine to increase or reduce the amount of his indication of interest, or otherwise elect not to purchase any shares. It is also possible that the number of shares, if any, allocated to Dr. Troendle in the offering may be smaller than the amount of his indication of interest. Any allocation of shares in the offering to Dr. Troendle will be made at our direction. The underwriters will receive the same underwriting discount on any shares purchased by Dr. Troendle as they will on any other shares sold to the public in this offering. Delivery of the shares of common stock is expected to be made on or about . We have granted the underwriters an option for a period of 30 days to purchase up to an additional 1,050,000 shares of our common stock. If the underwriters exercise the option in full, the total underwriting discounts and commissions payable by us will be $ , and the total proceeds to us, before expenses will be $ . Joint Book-Running Managers Jefferies Credit Suisse UBS Investment Bank Wells Fargo Securities Co-Managers Baird William Blair Prospectus dated , 2016.
-
Upload
truongphuc -
Category
Documents
-
view
218 -
download
0
Transcript of Medpace Holdings, Inc. - s3.amazonaws.coms3.amazonaws.com/ipo_candy/MEDP_IPO_Prospectus.pdf ·...

The
info
rmat
ion
inth
ispr
ospe
ctus
isno
tco
mpl
ete
and
may
bech
ange
d.W
em
ayno
tse
llth
ese
secu
riti
esun
tilt
here
gist
rati
onst
atem
ent
file
dw
ith
the
Sec
urit
ies
and
Exc
hang
eC
omm
issi
onis
effe
ctiv
e.Th
epr
ospe
ctus
isno
tan
offe
rto
sell
thes
ese
curi
ties
nor
aso
licit
atio
nof
anof
fer
tobu
yth
ese
secu
riti
esin
any
juri
sdic
tion
whe
reth
eof
fer
and
sale
isno
tpe
rmit
ted.
SUBJECT TO COMPLETION DATED AUGUST 1, 2016
PRELIMINARY PROSPECTUS
7,000,000 Shares
Medpace Holdings, Inc.Common Stock
Medpace Holdings, Inc. is offering 7,000,000 shares of its common stock. This is our initial public offering,and no public market currently exists for our common stock. We expect the initial public offering price to bebetween $20.00 and $23.00 per share. We have applied to list our common stock on the NASDAQ GlobalSelect Market under the symbol “MEDP.”
We are an “emerging growth company” as defined by the Jumpstart Our Business Startups Act of 2012 and,as such, we have elected to comply with certain reduced public company reporting requirements for thisprospectus and future filings.
Investing in our common stock involves risks. See “Risk Factors” beginning on page 20 to read about factorsyou should consider before purchasing our common stock.
Neither the Securities and Exchange Commission nor any state securities commission nor any other regulatorybody has approved or disapproved of these securities or passed upon the accuracy or adequacy of thisprospectus. Any representation to the contrary is a criminal offense.
PER SHARE TOTAL
Public Offering Price . . . . . . . . . . . . . . . . . . . . . . . . . . . . . . . . . . . . . . . . $ $Underwriting Discounts and Commissions (1) . . . . . . . . . . . . . . . . . . . . . . $ $Proceeds to Medpace Holdings, Inc., before expenses . . . . . . . . . . . . . . $ $
(1) We have agreed to reimburse the underwriters for certain expenses in connection with this offering. See “Underwriting.”
Our Chief Executive Officer and founder, Dr. August J. Troendle, has indicated an interest to purchase up to $20.0million in shares of our common stock in this offering at the initial public offering price. However, becauseindications of interest are not binding agreements or commitments to purchase, Dr. Troendle may determine toincrease or reduce the amount of his indication of interest, or otherwise elect not to purchase any shares. It is alsopossible that the number of shares, if any, allocated to Dr. Troendle in the offering may be smaller than the amountof his indication of interest. Any allocation of shares in the offering to Dr. Troendle will be made at our direction. Theunderwriters will receive the same underwriting discount on any shares purchased by Dr. Troendle as they will on anyother shares sold to the public in this offering.
Delivery of the shares of common stock is expected to be made on or about . We have granted theunderwriters an option for a period of 30 days to purchase up to an additional 1,050,000 shares of our commonstock. If the underwriters exercise the option in full, the total underwriting discounts and commissions payable by uswill be $ , and the total proceeds to us, before expenses will be $ .
Joint Book-Running Managers
Jefferies Credit SuisseUBS Investment Bank Wells Fargo Securities
Co-ManagersBaird William Blair
Prospectus dated , 2016.


TABLE OF CONTENTS
PAGE
PROSPECTUS SUMMARY . . . . . . . . . . . . . . . . . . . . . . . . . . . . . . . . . . . . . . . . . . . . . . . . . . . . . . . . . . . . . . . . . . 1
RISK FACTORS . . . . . . . . . . . . . . . . . . . . . . . . . . . . . . . . . . . . . . . . . . . . . . . . . . . . . . . . . . . . . . . . . . . . . . . . . . 20
CAUTIONARY NOTE REGARDING FORWARD LOOKING STATEMENTS . . . . . . . . . . . . . . . . . . . . . . . . . . . . . . 46
USE OF PROCEEDS . . . . . . . . . . . . . . . . . . . . . . . . . . . . . . . . . . . . . . . . . . . . . . . . . . . . . . . . . . . . . . . . . . . . . . 48
DIVIDEND POLICY . . . . . . . . . . . . . . . . . . . . . . . . . . . . . . . . . . . . . . . . . . . . . . . . . . . . . . . . . . . . . . . . . . . . . . . . 49
CAPITALIZATION . . . . . . . . . . . . . . . . . . . . . . . . . . . . . . . . . . . . . . . . . . . . . . . . . . . . . . . . . . . . . . . . . . . . . . . . 50
DILUTION . . . . . . . . . . . . . . . . . . . . . . . . . . . . . . . . . . . . . . . . . . . . . . . . . . . . . . . . . . . . . . . . . . . . . . . . . . . . . . 51
SELECTED HISTORICAL CONSOLIDATED FINANCIAL AND OTHER DATA . . . . . . . . . . . . . . . . . . . . . . . . . . . . 53
MANAGEMENT’S DISCUSSION AND ANALYSIS OF FINANCIAL CONDITION AND RESULTS OFOPERATIONS . . . . . . . . . . . . . . . . . . . . . . . . . . . . . . . . . . . . . . . . . . . . . . . . . . . . . . . . . . . . . . . . . . . . . . . . . 58
BUSINESS . . . . . . . . . . . . . . . . . . . . . . . . . . . . . . . . . . . . . . . . . . . . . . . . . . . . . . . . . . . . . . . . . . . . . . . . . . . . . . 88
MANAGEMENT . . . . . . . . . . . . . . . . . . . . . . . . . . . . . . . . . . . . . . . . . . . . . . . . . . . . . . . . . . . . . . . . . . . . . . . . . . 104
EXECUTIVE AND DIRECTOR COMPENSATION . . . . . . . . . . . . . . . . . . . . . . . . . . . . . . . . . . . . . . . . . . . . . . . . . 110
CERTAIN RELATIONSHIPS AND RELATED PERSON TRANSACTIONS . . . . . . . . . . . . . . . . . . . . . . . . . . . . . . . 120
PRINCIPAL SHAREHOLDERS . . . . . . . . . . . . . . . . . . . . . . . . . . . . . . . . . . . . . . . . . . . . . . . . . . . . . . . . . . . . . . . 125
DESCRIPTION OF CAPITAL STOCK . . . . . . . . . . . . . . . . . . . . . . . . . . . . . . . . . . . . . . . . . . . . . . . . . . . . . . . . . . 127
SHARES ELIGIBLE FOR FUTURE SALE . . . . . . . . . . . . . . . . . . . . . . . . . . . . . . . . . . . . . . . . . . . . . . . . . . . . . . . 132
MATERIAL U.S. FEDERAL INCOME TAX CONSEQUENCES TO NON-U.S. HOLDERS . . . . . . . . . . . . . . . . . . . . 134
UNDERWRITING . . . . . . . . . . . . . . . . . . . . . . . . . . . . . . . . . . . . . . . . . . . . . . . . . . . . . . . . . . . . . . . . . . . . . . . . . 138
LEGAL MATTERS . . . . . . . . . . . . . . . . . . . . . . . . . . . . . . . . . . . . . . . . . . . . . . . . . . . . . . . . . . . . . . . . . . . . . . . . 145
EXPERTS . . . . . . . . . . . . . . . . . . . . . . . . . . . . . . . . . . . . . . . . . . . . . . . . . . . . . . . . . . . . . . . . . . . . . . . . . . . . . . . 145
WHERE YOU CAN FIND MORE INFORMATION . . . . . . . . . . . . . . . . . . . . . . . . . . . . . . . . . . . . . . . . . . . . . . . . . 145
INDEX TO CONSOLIDATED FINANCIAL STATEMENTS . . . . . . . . . . . . . . . . . . . . . . . . . . . . . . . . . . . . . . . . . . . F-1
You should rely only on the information contained in this prospectus or in any free writing prospectus we mayauthorize to be delivered or made available to you. Neither we nor the underwriters (or any of our or their respectiveaffiliates) have authorized anyone to provide any information other than that contained in this prospectus or in anyfree writing prospectus prepared by or on behalf of us or to which we have referred you. Neither we nor theunderwriters (or any of our or their respective affiliates) take any responsibility for, and can provide no assurance as
i

to the reliability of, any other information that others may give you. We and the underwriters (or any of our or theirrespective affiliates) are not making an offer to sell these securities in any jurisdiction where the offer or sale is notpermitted. You should assume that the information appearing in this prospectus is only accurate as of the date onthe front cover of this prospectus. Our business, financial condition, results of operations and prospects may havechanged since that date.
TRADEMARKS
We own or have the rights to use various trademarks referred to in this prospectus, including, among others,Medpace and ClinTrak and their respective logos. Solely for convenience, we may refer to trademarks in thisprospectus without the TM and ® symbols. Such references are not intended to indicate, in any way, that we will notassert, to the fullest extent permitted by law, our rights to our trademarks. Other trademarks appearing in thisprospectus are the property of their respective owners.
MARKET AND INDUSTRY INFORMATION
Market data used throughout this prospectus is based on management’s knowledge of the industry and the goodfaith estimates of management. All of management’s estimates presented herein are based on industry sources,including analyst reports and management’s knowledge. We also relied, to the extent available, upon management’sreview of independent industry surveys and publications prepared by a number of sources and other publiclyavailable information. We are responsible for all of the disclosure in this prospectus and while we believe that eachof the publications, studies and surveys used throughout this prospectus are prepared by reputable sources, neitherwe nor the underwriters have independently verified market and industry data from third-party sources.
All of the market data used in this prospectus involves a number of assumptions and limitations, and you arecautioned not to give undue weight to such estimates. While we believe the estimated market position, marketopportunity and market size information included in this prospectus is generally reliable, such information, which inpart is derived from management’s estimates and beliefs, is inherently uncertain and imprecise and has not beenverified by any independent source. Projections, assumptions and estimates of our future performance and the futureperformance of the industry in which we operate are necessarily subject to a high degree of uncertainty and risk dueto a variety of factors, including those described in “Risk Factors” and elsewhere in this prospectus. These and otherfactors could cause results to differ materially from those expressed in our estimates and beliefs and in the estimatesprepared by independent parties. See “Cautionary Note Regarding Forward Looking Statements.”
GLOSSARY
We define the terms below that appear throughout this prospectus as follows:
“Backlog.” Backlog represents anticipated future net service revenue from net new business awards that have notcommenced or are currently in process but not complete.
“Large pharmaceutical companies.” Large pharmaceutical companies represent the top 20 pharmaceuticalcompanies by worldwide prescription drug sales in the year ended December 31, 2014 as classified by Evaluate Ltdin EvaluatePharma© World Preview 2015 Outlook to 2020, an industry report.
“Mid-sized biopharmaceutical companies.” Mid-sized biopharmaceutical companies represent biopharmaceuticalcompanies with at least $250 million in sales in the year ended December 31, 2014, based on publicly availabledata and management’s knowledge, that are not classified as a top 20 pharmaceutical company by Evaluate Ltd inEvaluatePharma© World Preview 2015 Outlook to 2020, an industry report.
“Net new business awards.” Net new business awards are new business awards net of award modifications andcancellations that had previously been recognized in backlog during the period. New business awards represent thevalue of anticipated future net service revenue that has been awarded during the period that is recognized inbacklog. This value is recognized upon the signing of a contract or receipt of a written pre-contract confirmation froma customer that confirms an agreement in principle on budget and scope. New business awards also include contractamendments, or changes in scope, where the customer has provided written authorization for changes in budget andscope or has approved us to perform additional work as of the measurement date. Awards may not be recognized as
ii

backlog after consideration of a number of factors, including whether (i) the relevant net service revenue is expectedonly after a pending regulatory hurdle, which might result in cancellation of the study, (ii) the customer fundingneeded for commencement of the study is not believed to have been secured or (iii) study timelines are uncertain ornot well defined. In addition, study amounts that extend beyond a three-year timeline are not included in backlog.
“Phase I.” Phase I trials are typically conducted in healthy individuals or, on occasion, in patients, and typicallyinvolve 20 to 80 subjects and range from a few months to several years. These trials are designed to establish thebasic safety, dose tolerance, absorption, metabolism, distribution and excretion of the clinical product candidate,the side effects associated with increasing doses, and if possible, early evidence of effectiveness. If the trialestablishes the basic safety and metabolism of the clinical product candidate, Phase II trials are generally initiated.
“Phase II.” Phase II trials are conducted in a limited population of patients with the disease or condition that theclinical product candidate is intended to treat. These trials typically test a few hundred patients and last onaverage 12 to 18 months. Phase II trials are typically designed to identify possible adverse effects and safety risks,to preliminarily evaluate the efficacy of the clinical product candidate for specific targeted diseases or conditions,and to determine dose tolerance, optimal dosage and dosing schedule. Phase II trials are sometimes divided into twophases: Phase IIa trials typically evaluate the dose response of the clinical product candidate and Phase IIb trialstypically evaluate the efficacy of the clinical product candidate at the prescribed doses. If the Phase II trials indicatethat the clinical product candidate may be safe and effective, Phase III trials are generally initiated.
“Phase III.” Phase III trials evaluate the clinical product candidate in significantly larger and more diverse patientpopulations than Phase I and II trials and are conducted at multiple, geographically dispersed sites. On average, thisphase lasts from one to three years. Depending on the size and complexity, Phase III CRO contracts may includemultiple sequential trials. During this phase, the clinical product candidate’s overall benefit/risk ratio and the basisfor product approval are established. If the clinical product candidate successfully completes Phase III, then thesponsor may submit a New Drug Application, or NDA, or Biologics License Application for approval by the UnitedStates Food and Drug Administration, or FDA, or a similar marketing authorization application for approval by non-U.S. regulatory agencies.
“Phase IV.” Phase IV or “post-approval” trials are intended to monitor the drug’s long-term risks and benefits, toanalyze different dosage levels, to evaluate different safety and efficacy parameters in target populations or tosubstantiate marketing claims. Phase IV trials typically enroll thousands of patients and last from six months toseveral years. The FDA may require Phase IV testing and surveillance programs to monitor the effect of approveddrugs which have been commercialized, and the FDA has the power to prevent or limit further marketing of a productbased on the results of post-marketing programs.
“Small biopharmaceutical companies.” Small biopharmaceutical companies represent biopharmaceutical companiesthat have less than $250 million in sales in the year ended December 31, 2014, based on publicly available dataand management’s knowledge.
NON-GAAP FINANCIAL MEASURESCertain financial measures presented in this prospectus, such as EBITDA, Adjusted EBITDA, Adjusted Net Incomeand Free Cash Flow, are not recognized under generally accepted accounting principles in the United States ofAmerica, or U.S. GAAP. Management uses EBITDA, Adjusted EBITDA, Adjusted Net Income and Free Cash Flow orcomparable metrics:
■ as a measurement used in evaluating our operating performance on a consistent basis;■ as a consideration to assess incentive compensation for our employees;■ for planning purposes, including the preparation of our internal annual operating budget; and■ to evaluate the performance and effectiveness of our operational strategies.
We believe that EBITDA and Adjusted EBITDA are useful to provide additional information to investors about certainmaterial non-cash and non-recurring items. While we believe these financial measures are commonly used byinvestors to evaluate our performance and that of our competitors, because not all companies use identicalcalculations, this presentation of EBITDA and Adjusted EBITDA may not be comparable to other similarly titledmeasures of other companies and should not be considered as an alternative to performance measures derived in
iii

accordance with U.S. GAAP. EBITDA is calculated as net income (loss) attributable to Medpace Holdings, Inc.before income tax expense, interest expense, net, depreciation and amortization with Adjusted EBITDA being furtheradjusted for unusual and other items. Our presentation of Adjusted EBITDA should not be construed as an inferencethat our future results will be unaffected by unusual or non-recurring items.
We utilize Free Cash Flow as a measure of profitability and an assessment of our ability to generate cash. Free CashFlow is a commonly utilized metric that companies provide to investors, although the calculation of Free Cash Flowmay not be comparable to other similarly titled metrics of other companies and should not be considered as analternative to cash flow measures derived in accordance with U.S. GAAP. We define Free Cash Flow as net cashprovided by operating activities, less capital expenditures and the principal portion of payments related to campusleases classified for accounting purposes as deemed landlord liabilities.
Adjusted Net Income measures our operating performance by adjusting net income (loss) attributable to MedpaceHoldings, Inc. to include cash expenditures related to rental payments on leases classified for accounting purposesas deemed landlord liabilities, and exclude amortization expense, certain stock based compensation award non-cashexpenses, certain litigation expenses, deferred financing fees and certain other non-recurring items. Managementuses this measure to evaluate our core operating results as it excludes certain items whose fluctuations from period-to-period do not necessarily correspond to changes in the core operations of the business, but includes certain itemssuch as depreciation, interest expense and tax expense, which are otherwise excluded from Adjusted EBITDA. Webelieve the presentation of Adjusted Net Income enhances our investors’ overall understanding of the financialperformance and cash flow of our business. You should not consider Adjusted Net Income as an alternative to netincome (loss) attributable to Medpace Holdings Inc., determined in accordance with U.S. GAAP, as an indicator ofoperating performance.
EBITDA, Adjusted EBITDA, Adjusted Net Income and Free Cash Flow have important limitations as analytical toolsand you should not consider them in isolation, or as a substitute for, analysis of our results as reported under U.S.GAAP. See the consolidated financial statements included elsewhere in this prospectus for our U.S. GAAP results.Additionally, for reconciliations of EBITDA, Adjusted EBITDA, Adjusted Net Income and Free Cash Flow to ourclosest reported U.S. GAAP measures and a further discussion of these metrics, see “Prospectus Summary—Summary Historical Consolidated Financial and Other Data” and “Selected Historical Consolidated Financial andOther Data.”
iv

PROSPECTUS SUMMARY
This summary highlights information contained elsewhere in this prospectus. This summary does not containall of the information you should consider before investing in our common stock. You should read this entireprospectus carefully, including the risks of investing in our common stock discussed under “Risk Factors,”“Management’s Discussion and Analysis of Financial Condition and Results of Operations” and ourconsolidated financial statements and the related notes thereto included elsewhere in this prospectus, beforemaking an investment decision.
As used in this prospectus, unless the context otherwise requires, references to “Medpace,” “the Company,”“our company,” “we,” “us,” and “our” refer to Medpace Holdings, Inc., its consolidated subsidiaries and itspredecessor entities.
Throughout this prospectus, we present financial information for two periods, Predecessor and Successor,which relate to the period preceding the consummation of the Transaction (as defined below) on April 1, 2014and the period succeeding the consummation of the Transaction, respectively. References to the “Successornine month period ended December 31, 2014” refer to the period from April 1, 2014 to December 31, 2014and references to the “Predecessor three month period ended March 31, 2014” refer to the period fromJanuary 1, 2014 to March 31, 2014.
Overview
We are one of the world’s leading clinical contract research organizations, or CROs, by revenue, solely focusedon providing scientifically-driven outsourced clinical development services to the biotechnology,pharmaceutical and medical device industries. Our mission is to accelerate the global development of safe andeffective medical therapeutics. We differentiate ourselves from our competitors by our disciplined operatingmodel centered on providing full-service Phase I-IV clinical development services and our therapeuticexpertise. We believe this combination results in timely and cost-effective delivery of clinical developmentservices for our customers. We believe that we are a partner of choice for small and mid-sizedbiopharmaceutical companies based on our ability to consistently utilize our full-service, disciplined operatingmodel to deliver timely and high-quality results for our customers. Accordingly, we believe we are wellpositioned to continue to expand our market share and sustain margins in the growing $23 billion overallPhase I-IV CRO market.
We were founded in 1992 by Dr. August J. Troendle, an industry pioneer, as a Phase II-IV-focused CRO with astrong, scientifically-driven and disciplined operating model, and we continue today as a founder-led enterprisewith Dr. Troendle retaining a significant ownership stake in Medpace. Throughout our 24-year history, we havegrown almost exclusively organically, with our core founding members having been integrally involved indeveloping and instilling our differentiated culture and operating philosophy across our company. We focus onconducting clinical trials across all major therapeutic areas, with particular strength in Cardiology, MetabolicDisease, Oncology, Endocrinology, Central Nervous System, or CNS, Anti-Viral and Anti-Infective, or AVAI, aswell as therapeutic expertise in Medical Devices. Our global platform includes approximately 2,300 employeesacross 35 countries, providing our customers with broad access to diverse markets and patient populations aswell as local regulatory expertise and market knowledge.
Our singular focus on executing our disciplined, full-service operating model is a core tenet of ourdifferentiated approach. Our operating model entails partnering with our customers from the beginning of theclinical trial process and holistically navigating all subsequent components of the process. This approachdiffers from other leading CROs that provide functional or partial outsourcing services as a core component oftheir business. We believe our full-service approach allows us to deliver timely and high-quality results for ourcustomers. By clearly communicating and aligning our expectations with those of our customers at thebeginning of an engagement, we develop a trusted relationship where our customers typically grant us greatercontrol over the clinical trial process. This results in greater accountability on our part and, we believe, more
1

consistent delivery of our services. We believe our partnering approach, coupled with our full-service,scientifically-driven model, ensures efficient and high-quality trial execution, limits changes in the scope oftrials and enables timely completion of trials.
We focus on providing clinical development solutions primarily to companies that recognize the benefits ofutilizing our full-service outsourcing model. We believe our model is particularly attractive to small and mid-sized biopharmaceutical companies, which seek specialized capabilities and infrastructure required forcomplex and global clinical trials, including therapeutic expertise, insightful protocol design, project feasibilityassessment and timely and high-quality trial execution. We expect that outsourced development expendituresfor small and mid-sized biopharmaceutical companies will continue to outpace outsourced developmentexpenditures for the broader biopharmaceutical market. We believe we can expand our market share with thiscustomer segment given our continued strategic focus and the attractiveness of our model to these companies.Furthermore, as the clinical development and regulatory processes grow increasingly more global and complex,we believe large pharmaceutical companies will increasingly recognize the benefits of our disciplined, full-service operating model. For the Successor year ended December 31, 2015, we generated 55.7%, 29.3% and15.0% of our net service revenue from small biopharmaceutical companies, mid-sized biopharmaceuticalcompanies and large pharmaceutical companies, respectively.
We believe that our model, focused on full-service delivery, and our attractive customer mix have resulted inrobust levels of historical revenue growth, Adjusted EBITDA margins and strong Free Cash Flow. For theSuccessor year ended December 31, 2015, we generated total net service revenue of $320.1 million andAdjusted EBITDA of $101.2 million, representing net service revenue and Adjusted EBITDA compound annualgrowth rates, or CAGRs, of 21.7% and 26.2%, respectively, since 2012. Our net (loss) income for theSuccessor year ended December 31, 2015, the Successor nine month period ended December 31, 2014, thePredecessor three month period ended March 31, 2014 and the Predecessor year ended December 31, 2013was $(8.7) million, $(14.3) million, $(1.2) million and $24.8 million, respectively, partially as a result of non-cash amortization expense associated with identified intangible assets acquired as part of the Transaction.Over the last 15 years, we have maintained average Adjusted EBITDA margins of approximately 34%, whilesignificantly scaling our business organically and expanding globally. Additionally, we have consistentlydemonstrated an ability to convert Adjusted EBITDA into Free Cash Flow. Our annual Free Cash Flowconversion, defined as Free Cash Flow divided by Adjusted EBITDA, has averaged 81.7% since 2012. Netcash provided by operating activities for the Successor year ended December 31, 2015, the Successor ninemonth period ended December 31, 2014, the Predecessor three month period ended March 31, 2014 and thePredecessor year ended December 31, 2013 was $84.1 million, $62.5 million, $12.8 million and $98.1million, respectively. For a reconciliation of Adjusted EBITDA, a non-GAAP measure, to net (loss) income, andfor a reconciliation of Free Cash Flow, also a non-GAAP measure, to net cash provided by operating activities,see “—Summary Historical Consolidated Financial and Other Data.” Additionally, as of June 30, 2016 andDecember 31, 2015, we had total long-term debt, net of $364.0 million and $377.9 million outstanding,respectively. We intend to use the net proceeds of this offering to repay a portion of this indebtedness. See“Use of Proceeds.”
Our Market
CRO Market Size
We estimate, based on industry sources, including analyst reports and management’s knowledge, that totalglobal biopharmaceutical clinical development expenditures were approximately $100 billion in 2014. Wefurther estimate, based on these industry sources, that the portion of these expenditures attributable toPhase I-IV clinical development services was $44 billion, of which we estimate $23 billion was outsourced. Inaddition, based on these industry sources, we estimate the CRO market will experience a CAGR ofapproximately 6% from 2014 through 2019, growing to approximately $31 billion in 2019, as a result ofincreasing biopharmaceutical clinical development expenditures combined with increased outsourcingpenetration.
2

CRO Market Trends
Increasing Development Expenditures. We estimate that biopharmaceutical development expenditures willgrow from approximately $100 billion in 2014 to approximately $114 billion in 2019, representing a CAGR ofapproximately 3%. We believe that the growth in development expenditures is primarily attributed to theheightened pace of biopharmaceutical innovation, pressure on companies to replenish pipelines with newtherapies, the favorable regulatory environment and the significant amount of capital raised by biotechnologyand pharmaceutical companies during the last several years. In line with the significant capital raised bybiotechnology and pharmaceutical companies, based upon financial data available from FactSet ResearchSystems Inc., a provider of financial information, as of September 30, 2015, the companies comprising theNASDAQ Biotechnology Index, or NBI, had approximately $109.3 billion in cash available to support ongoingclinical development. This figure represents a 24.7% increase above the cash balance of approximately $87.6billion held by the companies comprising the NBI as of December 31, 2014, and a 111.5% increase abovethe cash balance of approximately $51.7 billion held by companies comprising the NBI as of December 31,2010.
Increasing Outsourcing Penetration. Outsourcing penetration is the percentage of biopharmaceutical clinicaldevelopment costs that are outsourced to CROs. We estimate, based on industry sources, including analystreports and management’s knowledge, that approximately 52% of Phase I-IV clinical developmentexpenditures were outsourced in 2014. Driven by increased clinical trial complexity, the need for regulatoryand therapeutic expertise and global access to patient populations, we expect outsourcing penetration willreach approximately 62% in 2019.
Pressures Facing Biopharmaceutical Industry. The biopharmaceutical industry continues to experiencesignificant challenges, including regulatory and pricing pressures resulting from healthcare reform, intensifyinggeneric competition, pipeline failures and the need for continued innovation. In order to combat thesechallenges and maintain revenue growth and operating margins, biopharmaceutical companies increasinglyseek clinical expertise and seek to outsource clinical services to CROs to accelerate clinical development andmaximize commercialization success.
Increasing Clinical Trial Complexity. Clinical trial design and structure have become increasingly complexbased on regulatory agency sophistication, more complicated protocols and a growing focus bybiopharmaceutical companies on developing new cutting-edge drug therapies. This growing complexity bringsnew challenges in study feasibility, site selection, patient recruitment and retention.
Small and Mid-Sized Biopharmaceutical SegmentWe believe small and mid-sized biopharmaceutical companies are important to the continued growth of theCRO industry. These companies are primary centers of innovation, developing new, cutting-edge therapies forniche or previously untreatable diseases, which frequently require sophisticated clinical trials. Thesecompanies have limited ability to conduct global clinical trials independently, and as a result, they typicallyseek a strategic partner that can provide the therapeutic experience and infrastructure required to delivertimely completion of complex, global clinical trials. We estimate, based on industry sources, including analystreports and management’s knowledge, that outsourced development expenditures for these companies willgrow at a CAGR of 10% from 2014 to 2019, outpacing the estimated overall biopharmaceutical market CAGRof 6%. In 2014, we estimate, based on industry sources, including analyst reports and management’sknowledge, that small and mid-sized biopharmaceutical companies outsourced approximately 69% of theirdevelopment expenditures, representing an estimated addressable CRO market of approximately $7 billion,which we estimate, based on these same sources, will increase to approximately 76%, representing anestimated addressable CRO market of approximately $11 billion in 2019.
3

Our Competitive Strengths
We believe we are well positioned to capitalize on positive trends in the CRO industry based on our keycompetitive strengths set forth below:
Disciplined and Integrated Full-Service Model. Since our founding in 1992, we have focused on building andexecuting our disciplined, full-service operating model to provide clinical development services to thebiotechnology and pharmaceutical industries. At the center of our differentiated operating model is our full-service focused, end-to-end approach to delivering clinical development services. We partner with customersfrom the beginning of the clinical trial process and holistically navigate all subsequent components of theprocess. While many CROs engage in functional or partial outsourcing services as a significant component oftheir business model, we take a disciplined approach and do not typically provide such piecemeal services. Wehave developed and consistently utilize effective standard operating procedures, or SOPs, that we believe resultin high-quality and timely clinical development outcomes for our customers. Additionally, our operating modelutilizes our proprietary ClinTrak clinical trial management software, or ClinTrak, which is customized andstreamlined to our SOPs. We believe that a full-service approach delivers greater efficiency, better quality and,ultimately, higher value for our customers.
High-Science Approach with Deep Therapeutic Expertise. Our therapeutic expertise encompasses areas thatare among the largest, most complex and fastest growing in pharmaceutical development, including Oncology,Cardiology, Metabolic Disease, Endocrinology, CNS and AVAI, as well as Medical Devices. Our core therapeuticexpertise covers the therapeutic areas where a majority of all drugs are currently in development, as identifiedby Citeline Pharma R&D Annual Review 2016, an industry publication. Collectively, these areas constituted81.6% of our backlog as of June 30, 2016. We leverage the insights of our senior leaders who have specifictherapeutic expertise to employ a high-science approach to our projects. In clinical trial execution, ourtherapeutic leads are embedded into every aspect of the process from start to finish. Our scientific andmedical staff is fundamental to delivering high-quality trial execution and enabling timely completion ofcomplex processes.
Attractive and Diversified Customer Base. We have a strong track record of serving our core customer base ofsmall and mid-sized biopharmaceutical companies, which we believe represents an attractive growthopportunity. We believe outsourced development expenditures in our core customer base will outpace thegrowth of the broader biopharmaceutical market. While we estimate, based on industry sources, includinganalyst reports and management’s knowledge, that the overall biopharmaceutical market will grow itsoutsourced development expenditures for Phase I-IV clinical development and laboratory services at a 6%CAGR from 2014 to 2019, we expect the small and mid-sized biopharmaceutical outsourced developmentexpenditures will grow at a 10% CAGR during this period.
In addition, we have a highly diversified customer base comprising many of the largest global biopharmaceuticalcompanies, as well as high-growth small and mid-sized biopharmaceutical companies. For the Successor yearended December 31, 2015, we generated 55.7%, 29.3% and 15.0% of our net service revenue from smallbiopharmaceutical companies, mid-sized biopharmaceutical companies and large pharmaceutical companies,respectively. For the Successor six months ended June 30, 2016 and the Successor year ended December 31,2015, our largest customer accounted for 6.3% and 6.9% of our net service revenue, respectively, and our top10 customers represented 38.2% and 39.9% of our net service revenue, respectively.
Partner of Choice for Biopharmaceutical Customers. Based on our extensive operating history and therapeuticexperience, we believe that we have established a reputation as a partner of choice to our core customersegment of small and mid-sized biopharmaceutical companies. Acting as incubators of pharmaceuticaldevelopment, small and mid-sized biopharmaceutical companies are responsible for a number of innovativedrug candidates currently being developed to address unmet medical needs. These biopharmaceuticalcustomers, sometimes new to the clinical development process, seek to partner with us based on ourdifferentiated approach and expertise to execute trials in a timely and efficient manner. We believe we areviewed as a strategic and trusted partner by these customers given our full-service approach, disciplined
4

operating model and significant therapeutic expertise. As a result, our customers often grant us significantautonomy in executing clinical trials for their most valued assets.
Global Platform with Scalable Infrastructure. We believe that we are one of the leading CROs with the scaleand therapeutic expertise necessary to effectively conduct global clinical trials. We began our disciplinedinternational expansion in 2004 and have since increased the breadth and depth of our international footprintsignificantly, with approximately 45% of our clinical operations employees located outside of North America asof June 30, 2016. We now offer our services through a highly skilled staff of approximately 2,300 employeesacross 35 countries as of June 30, 2016.
Strong Financial Performance. We have a proven track record of strong organic growth and achieved significantrevenue and Adjusted EBITDA growth and robust Free Cash Flow over the past several years. For the Successoryear ended December 31, 2015, we achieved net service revenue of $320.1 million and Adjusted EBITDA of$101.2 million, which represent a CAGR of 21.7% and 26.2%, respectively, since 2012. Our net (loss)income for the Successor year ended December 31, 2015, the Successor nine month period endedDecember 31, 2014, the Predecessor three month period ended March 31, 2014 and the Predecessor yearended December 31, 2013 was $(8.7) million, $(14.3) million, $(1.2) million and $24.8 million,respectively, partially as a result of non-cash amortization expense associated with identified intangible assetsacquired as part of the Transaction. For the Successor year ended December 31, 2015, our Adjusted EBITDAmargin was 31.6%. Additionally, we have consistently demonstrated an ability to convert Adjusted EBITDAinto Free Cash Flow. Our annual Free Cash Flow conversion, defined as Free Cash Flow divided by AdjustedEBITDA, has averaged 81.7% since 2012. Net cash provided by operating activities for the Successor yearended December 31, 2015, the Successor nine month period ended December 31, 2014, the Predecessorthree month period ended March 31, 2014 and the Predecessor year ended December 31, 2013 was $84.1million, $62.5 million, $12.8 million and $98.1 million, respectively. For a reconciliation of AdjustedEBITDA, a non-GAAP measure, to net (loss) income, and for a reconciliation of Free Cash Flow, also a non-GAAP measure, to net cash provided by operating activities, see “—Summary Historical Consolidated Financialand Other Data.” Additionally, as of June 30, 2016 and December 31, 2015, we had total long-term debt, netof $364.0 million and $377.9 million outstanding, respectively. We intend to use the net proceeds of thisoffering to repay a portion of this indebtedness. See “Use of Proceeds.”
Highly Regarded, Experienced and Committed Management Team. We are led by a dedicated and experiencedsenior management team with significant industry experience and knowledge focused on clinical development.We were founded in 1992 by Dr. August J. Troendle, an industry pioneer, and we continue today as a founder-led enterprise with Dr. Troendle retaining a significant ownership stake in Medpace. Our management teamhas been responsible for developing our scientifically-driven, disciplined operating model, building our globalplatform and realizing our significant organic growth in revenue and earnings. Our senior management teamhas an average tenure with Medpace of 12 years, including four senior managers with over 20 years with us,and brings a healthy balance of significant experience with Medpace, regulators and other companies in theindustry, including public companies.
Our Growth Strategy
Key elements of our growth strategy include:
Continued Focus on Organic Growth. Our strong organic growth has been the result of consistently reinvestingour positive cash flow to support our therapeutic capabilities, service offerings and global expansion. As afounder-led enterprise, we intend to continue to emphasize preserving our unique culture and operatingphilosophy as we grow our scientific capabilities and clinical trial expertise by further investing in humancapital. In addition to leveraging our operating model, we intend to continue to selectively hire employees tostrengthen and expand our expertise in high-growth therapeutic areas, including Oncology, CNS and AVAI. Wemethodically look to hire employees early in their careers and thoroughly train them to excel in our disciplinedoperating model, while instilling within them our corporate culture and philosophy. We apply this same trainingand standardization globally in order to maintain consistency and minimize inefficiencies in our operations.
5

Continue to Sustain Industry-Leading Margins. Over the last 15 years, we have maintained average AdjustedEBITDA margins of approximately 34%. We intend to continue to maintain industry-leading margins (comparedto our public competitors) while growing organically. We believe the key to sustaining margins is through theexecution of our disciplined operating philosophy and full-service business model. Furthermore, we intend tocontinue to develop our centralized operations at our corporate headquarters in order to maintainstandardization and consistency across our global operations.
Leverage Our Experience and Reputation in the Attractive, High-Growth Clinical Development Market. Ourcustomers value the knowledge and therapeutic expertise we have developed from a long history of successfullyexecuting clinical trials. As the regulatory landscape adapts to greater clinical trial complexity, we believe thatbiopharmaceutical companies will increasingly engage CROs with the requisite global resources as well astherapeutic and regulatory expertise to assume full responsibility of the clinical trial process. Based on oursuccessful execution of clinical trials across many therapeutic areas in multiple countries, as well as our focuson closely partnering with our customers through all aspects of the clinical trial process, we believe we havedeveloped a strong reputation in the industry as a leading CRO. We believe that this reputation positions us tocontinue capturing additional share of the attractive, high-growth clinical development market as the industryincreasingly recognizes the benefits of our operating model.
Deepen Existing and Develop New Relationships with Our Core Customer Segment. We look to continue todeepen our long-standing relationships with existing customers through new engagements and expand ourrelationships with new small and mid-sized biopharmaceutical customers. As a strategic partner of choice, weclearly communicate and align our expectations with our customers at the beginning of an engagement todevelop a close working relationship that is built on trust. We believe this trust, supported by our high-qualityexecution and frequent dialogue with our customers’ key decision makers, positions us to be awardedadditional business in existing and new therapies, allowing us to grow alongside our customers and leading toan increasingly significant, and growing, contribution from repeat business. While our successes to date havebuilt a substantial customer base, we believe that there is opportunity for continued growth and penetration inour core customer segment. We place our therapeutic leads alongside our sales team to actively participate inthe procurement of new customers whose portfolios align with our therapeutic expertise, which we believefurther differentiates us from our competitors.
Pursue Selective and Complementary Bolt-On Acquisitions. We intend to augment our organic growth withtargeted acquisitions to expand our current capabilities and service offerings that are complementary to ourfull-service model. Our acquisition strategy is driven by our comprehensive commitment to serve customerneeds. While we are continuously assessing the market for attractive opportunities, we do so selectively with afocus on targeting opportunities to acquire and integrate complementary and strategic, non-transformativeacquisitions within the CRO sector in order to strengthen our competitive position and provide enhanced valueto our customers.
Position Ourselves to Increase Our Presence Among Large Pharmaceutical Companies as These CustomersAdopt and Appreciate the Full-Service Approach. Given the growing pressures large pharmaceutical companiesare facing, these companies seek solutions beyond simply outsourcing clinical development. These companiesare increasingly seeking strategic partnerships that provide more holistic clinical development services and alsothe expertise that CRO partners offer. We have witnessed a noticeable shift by large pharmaceutical companiesaway from lower-value, functional outsourcing service providers toward full-service CROs. Given ourdifferentiated operating model, we believe larger pharmaceutical companies will be increasingly appreciative ofour proven approach to clinical development and expertise, and we intend to actively market the strength anddepth of our services to these companies.
6

Implications of Being an Emerging Growth Company
As a company with less than $1.0 billion in revenues during our last fiscal year, we qualify as an “emerginggrowth company” as defined in the Jumpstart Our Business Startups Act of 2012, or the JOBS Act. Anemerging growth company may take advantage of specified reduced reporting and other regulatoryrequirements for up to five years that are otherwise applicable generally to public companies. These provisionsinclude, among other matters:
■ exemption from the auditor attestation requirement on the effectiveness of our system of internalcontrol over financial reporting;
■ exemption from the adoption of new or revised financial accounting standards until they would applyto private companies;
■ exemption from compliance with any new requirements adopted by the Public Company AccountingOversight Board requiring mandatory audit firm rotation or a supplement to the auditor’s report inwhich the auditor would be required to provide additional information about the audit and thefinancial statements of the issuer;
■ an exemption from the requirement to seek non-binding advisory votes on executive compensation andgolden parachute arrangements; and
■ reduced disclosure about executive compensation arrangements.
Section 107 of the JOBS Act provides that an emerging growth company can take advantage of the extendedtransition period provided in Section 7(a)(2)(B) of the Securities Act of 1933, as amended, or the SecuritiesAct, for complying with new and revised accounting standards. An emerging growth company can, therefore,delay the adoption of certain accounting standards until those standards would otherwise apply to privatecompanies. However, we are choosing to “opt out” of that extended transition period and, as a result, we planto comply with new and revised accounting standards on the relevant dates on which adoption of thosestandards is required for non-emerging growth companies. Section 107 of the JOBS Act provides that ourdecision to opt out of the extended transition period for complying with new and revised accounting standardsis irrevocable.
We will remain an emerging growth company for five years unless, prior to that time, we (i) have more than$1.0 billion in annual revenues, (ii) have a market value for our common stock held by non-affiliates of morethan $700 million as of the last day of our second fiscal quarter of the fiscal year when a determination ismade whether we are deemed to be a “large accelerated filer,” as defined in Rule 12b-2 promulgated underthe Securities Exchange Act of 1934, as amended, or the Exchange Act, or (iii) issue more than $1.0 billion ofnon-convertible debt over a three-year period.
We have elected to take advantage of some of the reduced disclosure obligations listed above in thisprospectus, and may elect to take advantage of other reduced reporting requirements in future filings. As aresult, the information that we provide to our shareholders may be different than you might receive from otherpublic reporting companies in which you hold equity interests. In addition, it is possible that some investorswill find our common stock less attractive as a result of our elections, which may cause a less active tradingmarket for our common stock and more volatility in our stock price.
Risks Associated with Our Business
Investing in our common stock involves a number of risks, including the following:
■ The potential loss, delay or non-renewal of our contracts, or the non-payment by our customers forservices that we have performed, could adversely affect our results.
■ Our backlog may not convert to net service revenue at our historical conversion rates.■ Our operating results have historically fluctuated between fiscal quarters and years and may continue
to fluctuate in the future, which may adversely affect the market price of our stock after this offering.■ Our operating margins could decrease due to increased pricing pressure or other pressures.
7

■ If we fail to perform our services in accordance with contractual requirements, government regulationsand ethical considerations, we could be subject to significant costs or liability and our reputationcould be adversely affected.
■ Outsourcing trends in the biopharmaceutical industry and changes in aggregate expenditures and R&Dbudgets could adversely affect our operating results and growth rate.
■ We face intense competition in many areas of our business and, if we do not compete effectively, ourbusiness may be harmed.
■ Our indebtedness could adversely affect our financial condition and prevent us from fulfilling our debtobligations and may otherwise restrict our activities.
■ Cinven (defined below) and Dr. August J. Troendle, our Chief Executive Officer and founder, willcollectively own a substantial majority of our outstanding common stock after this offering, and theywill have control over decisions that require the approval of shareholders, which could limit yourability to influence the outcome of matters submitted to shareholders for a vote. In addition, theirinterests may be different from or conflict with yours.
■ Upon the listing of our shares on the NASDAQ Global Select Market, or NASDAQ, we will be a“controlled company” within the meaning of the NASDAQ rules and, as a result, will qualify for, andintend to rely on, exemptions from certain corporate governance requirements. You will not have thesame protections afforded to shareholders of companies that are subject to such requirements.
These and other risks are more fully described in the section entitled “Risk Factors” below, which you shouldcarefully read and consider before making a decision to invest in our common stock. If any of these risksactually occur, our business, financial condition, results of operations, cash flows or reputation would likely bematerially adversely affected. In such case, the trading price of our common stock would likely decline, andyou could lose all or part of your investment.
The Transaction
In April 2014, investment funds managed by Cinven Capital Management (V) General Partner Limited, orCinven, a private equity firm, acquired 100% of the outstanding shares of Medpace IntermediateCo, Inc., orMedpace IntermediateCo, for an aggregate purchase price of $921.3 million. In connection with theacquisition, certain employees of the Company, through Medpace Investors, LLC, or MPI, agreed to contributeshares held in Medpace IntermediateCo in exchange for a percentage stake in Medpace Holdings, Inc. We referto these transactions, collectively, as the “Transaction.” Immediately following the Transaction, Cinven andMPI owned approximately 75% and 25%, respectively, of Medpace Holdings, Inc. For an overview of ourownership structure following this offering, see “—Our Structure.”
Prior to the Transaction, CCMP Capital, or CCMP, a private equity firm, held 80% of our equity interests andthe noncontrolling interests were held by certain current and former members of management, along withformer members of the board of directors of Medpace, Inc., our wholly owned subsidiary.
Our Private Equity Sponsor
The Cinven group is a leading private equity firm, founded in 1977, with offices in Guernsey, London,Frankfurt, Paris, Madrid, Milan, Luxembourg, Hong Kong and New York. The group focuses on investmentsacross six core sectors: Healthcare, Financial Services, Business Services, Consumer, Industrials andTechnology and Media and Telecommunications. Its funds acquire high-quality companies and work with themto help them grow and develop. The Cinven group is a responsible investor, seeking to build long-term valuethrough sustainable growth in the portfolio companies of its funds with consideration for their employees,suppliers, local communities, the environment and society. Since 1977, the Cinven group has completedtransactions valued at in excess of €85 billion.
Upon the completion of this offering, Cinven will own approximately 58.0% of the outstanding shares of ourcommon stock (or 56.5% if the underwriters exercise their option to purchase additional shares in full).
8

Accordingly, Cinven will be able to exert a significant degree of influence or actual control over ourmanagement and affairs. See “Risk Factors—Risks Relating to Our Common Stock and This Offering—Cinvenand our Chief Executive Officer and founder will collectively control a substantial majority of our outstandingcommon stock following this offering and their interests may be different from or conflict with those of ourother shareholders” and “Principal Shareholders.”
Our Structure
The diagram below reflects a simplified overview of our organizational structure following this offering(including the application of the net proceeds therefrom):
PublicShareholders
CinvenManagement and
Employees
MedpaceHoldings, Inc.
MedpaceAcquisition, Inc.
MedpaceIntermediateCo, Inc.
Medpace, Inc.
VariousSubsidiaries
Issuer of common stockoffered hereby
58.0% 17.7%24.3%
Borrower under theSenior Secured CreditFacilities(1)
(1) In conjunction with the Transaction, we entered into a new credit agreement, which provided for a $530.0 million term loan,or the Senior Secured Term Loan Facility, and a $60.0 million revolving credit facility, or the Senior Secured Revolving CreditFacility, and, together with the Senior Secured Term Loan Facility, the Senior Secured Credit Facilities. As of June 30, 2016,as described under “Use of Proceeds,” on an as adjusted basis after giving effect to this offering and the use of proceedstherefrom, we would have had approximately $225.7 million of outstanding indebtedness under our Senior Secured Term LoanFacility and no borrowings outstanding under our Senior Secured Revolving Credit Facility. For additional information about ourSenior Secured Credit Facilities, see “Management’s Discussion and Analysis of Financial Condition and Results ofOperations—Liquidity and Capital Resources—Indebtedness.”
9

Corporate Information
We are a Delaware corporation and were incorporated on February 18, 2014. Our principal executive officesare located at 5375 Medpace Way, Cincinnati, Ohio 45227, and our telephone number is (513) 579-9911.Our corporate website address is www.medpace.com. Our website and the information contained in, or that canbe accessed through, our website is not deemed to be incorporated by reference in, and is not considered partof, this prospectus. You should not rely on any such information in making your decision whether to purchaseour common stock.
10

THE OFFERING
Common stock offered by us . . . . . . . . . 7,000,000 shares.
Option to purchase additional shares ofcommon stock . . . . . . . . . . . . . . . . . . The underwriters have the option to purchase up to an additional
1,050,000 shares of common stock from us. The underwriters canexercise this option at any time within 30 days from the date of thisprospectus.
Common stock to be outstanding afterthis offering . . . . . . . . . . . . . . . . . . . . 39,642,113 shares (40,692,113 shares if the underwriters’ exercise
their option to purchase additional shares in full).
Use of proceeds . . . . . . . . . . . . . . . . . . We estimate that the net proceeds to us from our sale of7,000,000 shares of common stock in this offering will beapproximately $138.3 million, assuming an initial public offeringprice of $21.50 per share (the midpoint of the price range listed onthe cover page of this prospectus), and after deducting estimatedunderwriting discounts and commissions and estimated expensespayable by us in connection with this offering. We intend to use thenet proceeds of this offering to repay $138.3 million in aggregateprincipal amount of outstanding borrowings under our Senior SecuredTerm Loan Facility. In the event that the underwriters exercise theiroption to purchase additional shares, we intend to use the netproceeds from the sale of such shares to repay additional borrowingsoutstanding under our Senior Secured Term Loan Facility. See “Useof Proceeds.”
Dividend policy . . . . . . . . . . . . . . . . . . . We have no current plans to pay any cash dividends on our commonstock in the foreseeable future; however, we may change this policyin the future. See “Dividend Policy.”
Risk factors . . . . . . . . . . . . . . . . . . . . . . Investing in our common stock involves a high degree of risk. See“Risk Factors” beginning on page 20 of this prospectus for adiscussion of factors you should consider carefully before investing inour common stock.
Listing . . . . . . . . . . . . . . . . . . . . . . . . . . We have applied to list our common stock on NASDAQ under thesymbol “MEDP.”
Except as otherwise indicated in this prospectus, the number of shares of common stock to be outstandingafter this offering is based on 32,642,113 shares outstanding as of June 30, 2016 and excludes:
■ 1,779,637 shares of common stock issuable upon exercise of stock options outstanding as ofJune 30, 2016 at a weighted average exercise price of $15.48 per share; and
■ an additional 6,000,000 shares of common stock reserved for future issuance under our 2016Incentive Award Plan, or the Plan, including pursuant to equity awards to be granted in connectionwith this offering, as described in “Executive and Director Compensation—Narrative to SummaryCompensation Table—Offering Grants to Employees under the 2016 Incentive Award Plan.”
Unless otherwise indicated, all information in this prospectus:
■ assumes the initial public offering price of $21.50 per share (the midpoint of the price range listed onthe cover page of this prospectus);
■ assumes no exercise of the underwriters’ option to purchase additional shares of our common stock;
11

■ assumes the filing of our amended and restated certificate of incorporation and the adoption of ouramended and restated bylaws, which will be in effect prior to the consummation of this offering; and
■ with respect to the Successor periods presented, reflects a 1-for-1.35 reverse stock split of ourcommon stock, which we effectuated on July 25, 2016.
Our Chief Executive Officer and founder, Dr. August J. Troendle, has indicated an interest to purchase up to$20.0 million in shares of our common stock in this offering at the initial public offering price. However,because indications of interest are not binding agreements or commitments to purchase, Dr. Troendle maydetermine to increase or reduce the amount of his indication of interest, or otherwise elect not to purchase anyshares. It is also possible that the number of shares, if any, allocated to Dr. Troendle in the offering may besmaller than the amount of his indication of interest. Any allocation of shares in the offering to Dr. Troendlewill be made at our direction. The underwriters will receive the same underwriting discount on any sharespurchased by Dr. Troendle as they will on any other shares sold to the public in this offering.
12

SUMMARY HISTORICAL CONSOLIDATED FINANCIAL AND OTHER DATA
The following tables set forth our summary consolidated financial and other data for the periods ending on andas of the dates indicated. We derived the consolidated statements of operations data for the years endedDecember 31, 2013 (Predecessor) and December 31, 2015 (Successor) from our audited consolidatedfinancial statements and the related notes thereto included elsewhere in this prospectus. We derived theconsolidated statements of operations data for the Predecessor three month period ended March 31, 2014 andthe Successor nine month period ended December 31, 2014 from our audited consolidated financialstatements and the related notes thereto included elsewhere in this prospectus. We derived the condensedconsolidated statements of operations data for the Successor six months ended June 30, 2015 and June 30,2016 and the condensed consolidated balance sheet data as of June 30, 2016 from our unaudited condensedconsolidated financial statements included elsewhere in this prospectus. We have prepared the unauditedcondensed consolidated financial information set forth below on the same basis as our audited consolidatedfinancial statements and have included all adjustments, consisting of only normal recurring adjustments, thatwe consider necessary for a fair presentation of our financial position and operating results for such periods.
The accompanying consolidated statements of operations, cash flows and shareholders’ equity are presentedfor two periods, Predecessor and Successor, which relate to the period preceding the Transaction and theperiod succeeding the Transaction, respectively. The Company refers to the operations of Medpace Holdings,Inc. and subsidiaries for both the Predecessor period and Successor period.
The results for any interim period are not necessarily indicative of the results that may be expected for a fullyear. Additionally, our historical results are not necessarily indicative of future results. You should read theinformation set forth below together with “Selected Historical Consolidated Financial and Other Data,”“Management’s Discussion and Analysis of Financial Condition and Results of Operations,” “Capitalization”and our consolidated financial statements and the related notes thereto included elsewhere in this prospectus.
SUCCESSOR PREDECESSOR
(In thousands, except per share data)
SIXMONTHSENDED
JUNE 30,2016
SIXMONTHSENDED
JUNE 30,2015
YEAR ENDEDDECEMBER 31,
2015
NINE MONTHPERIOD FROM
APRIL 1,2014
THROUGHDECEMBER 31,
2014
THREE MONTHPERIOD FROMJANUARY 1,
2014THROUGHMARCH 31,
2014
YEAR ENDEDDECEMBER 31,
2013
Consolidated Statements of OperationsData:
Service revenue, net . . . . . . . . . . . . . . . $180,433 $152,782 $320,101 $219,791 $70,250 $244,270Reimbursed out-of-pocket revenue . . . . 25,107 18,105 38,958 28,708 7,679 28,620
Total revenue . . . . . . . . . . . . . . 205,540 170,887 359,059 248,499 77,929 272,890Operating expenses:
Direct costs, excluding depreciationand amortization . . . . . . . . . . . 96,215 77,725 163,707 117,550 38,759 119,779
Reimbursed out-of-pocketexpenses . . . . . . . . . . . . . . . . . 25,107 18,105 38,958 28,708 7,679 28,620
Selling, general andadministrative . . . . . . . . . . . . . . 28,333 23,448 56,998 29,465 10,203 35,109
Acquisition and integration . . . . . . . — — — 9,297 12,420 —Impairment of goodwill . . . . . . . . . . — — 9,313 — — —Depreciation . . . . . . . . . . . . . . . . . . 3,566 3,110 6,379 4,610 1,832 6,665Amortization . . . . . . . . . . . . . . . . . . 25,336 34,243 63,142 56,422 5,199 23,854
Total operating expenses . . . . . 178,557 156,631 338,497 246,052 76,092 214,027
13

SUCCESSOR PREDECESSOR
(In thousands, except per share data)
SIXMONTHSENDED
JUNE 30,2016
SIXMONTHSENDED
JUNE 30,2015
YEAR ENDEDDECEMBER 31,
2015
NINE MONTHPERIOD FROM
APRIL 1,2014
THROUGHDECEMBER 31,
2014
THREE MONTHPERIOD FROMJANUARY 1,
2014THROUGHMARCH 31,
2014
YEAR ENDEDDECEMBER 31,
2013
Income from operations . . . . . . . . . . . . . 26,983 14,256 20,562 2,447 1,837 58,863Other (expense) income, net:
Miscellaneous (expense) income,net . . . . . . . . . . . . . . . . . . . . . . . (941) (978) (1,133) (301) 1,213 (1,718)
Interest expense, net . . . . . . . . . . . . (11,894) (13,975) (27,259) (23,185) (3,272) (18,000)
Total other expense, net . . . . . . (12,835) (14,953) (28,392) (23,486) (2,059) (19,718)
Income (loss) before income taxes . . . . . 14,148 (697) (7,830) (21,039) (222) 39,145Income tax provision (benefit) . . . . . . . . 5,738 (733) 843 (6,703) 1,014 14,301
Net income (loss) . . . . . . . . . . . . . . . . . . $ 8,410 $ 36 $ (8,673) $ (14,336) $ (1,236) $ 24,844
Net income (loss) per share attributableto common shareholders:Basic . . . . . . . . . . . . . . . . . . . . . . . . $ 0.26 $ 0.00 $ (0.28) $ (0.46) $ (0.05) $ 0.99Diluted . . . . . . . . . . . . . . . . . . . . . . $ 0.26 $ 0.00 $ (0.28) $ (0.46) $ (0.05) $ 0.95
Weighted average common sharesoutstanding:Basic . . . . . . . . . . . . . . . . . . . . . . . . 32,631 31,527 31,346 30,869 25,047 25,204Diluted . . . . . . . . . . . . . . . . . . . . . . 32,631 31,591 31,346 30,869 25,047 26,150
Unaudited Pro Forma Data:Pro forma as adjusted net income (loss)
per common share (1):Basic . . . . . . . . . . . . . . . . . . . . . . . . $ 0.26 $ (0.12)Diluted . . . . . . . . . . . . . . . . . . . . . . $ 0.26 $ (0.12)
Pro forma as adjusted weighted averagenumber of common sharesoutstanding (1):Basic . . . . . . . . . . . . . . . . . . . . . . . . 39,631 38,346Diluted . . . . . . . . . . . . . . . . . . . . . . 39,631 38,346
Cash Flow Data:Net cash provided by operating
activities . . . . . . . . . . . . . . . . . . . . . $ 19,982 $ 26,271 $ 84,117 $ 62,539 $ 12,807 $ 98,142Net cash used in investing activities . . . (5,653) (2,658) (6,432) (907,640) (827) (4,472)Net cash (used in) provided by
financing activities . . . . . . . . . . . . . (15,678) (65,702) (116,489) 900,171 (17,968) (95,851)
14

SUCCESSOR PREDECESSOR
(In thousands)
SIXMONTHSENDED
JUNE 30,2016
SIXMONTHSENDED
JUNE 30,2015
YEAR ENDEDDECEMBER 31,
2015
NINE MONTHPERIOD FROM
APRIL 1,2014
THROUGHDECEMBER 31,
2014
THREE MONTHPERIOD FROMJANUARY 1,
2014THROUGHMARCH 31,
2014
YEAR ENDEDDECEMBER 31,
2013
Other Financial Data:EBITDA (2) . . . . . . . . . . . . . $ 54,944 $ 50,631 $ 88,950 $ 63,178 $ 10,081 $ 87,664Adjusted EBITDA (2) . . . . . 56,427 48,385 101,216 70,450 21,710 85,409Adjusted net income (2) . . . 26,271 21,147 40,445 26,685 9,715 41,407Free Cash Flow (2) . . . . . . . 13,545 23,030 76,360 57,030 11,552 93,581Backlog (at period
end) (3) . . . . . . . . . . . . . 465,738 400,627 429,659 394,023 386,047 359,341Net new business
awards (4) . . . . . . . . . . . 218,113 162,638 359,538 231,918 97,220 291,577
(In thousands)
AS OFJUNE 30,
2016
AS ADJUSTEDAS OF
JUNE 30,2016 (5)
Consolidated Balance Sheet Data:Cash and cash equivalents . . . . . . . . . . . . . . . . . . . . . . . . . . . . . . . . . . . . . . . . . . . . . $ 13,674 $ 13,674Restricted cash . . . . . . . . . . . . . . . . . . . . . . . . . . . . . . . . . . . . . . . . . . . . . . . . . . . . . 3,366 3,366Accounts receivable and unbilled, net . . . . . . . . . . . . . . . . . . . . . . . . . . . . . . . . . . . . 90,048 90,048Working capital . . . . . . . . . . . . . . . . . . . . . . . . . . . . . . . . . . . . . . . . . . . . . . . . . . . . . (22,260) (24,121)Total assets . . . . . . . . . . . . . . . . . . . . . . . . . . . . . . . . . . . . . . . . . . . . . . . . . . . . . . . . 994,863 993,002Total long-term debt, net . . . . . . . . . . . . . . . . . . . . . . . . . . . . . . . . . . . . . . . . . . . . . . 364,033 225,744Total liabilities . . . . . . . . . . . . . . . . . . . . . . . . . . . . . . . . . . . . . . . . . . . . . . . . . . . . . . 572,227 433,938Total shareholders’ equity . . . . . . . . . . . . . . . . . . . . . . . . . . . . . . . . . . . . . . . . . . . . . 422,636 559,064Total liabilities and shareholders’ equity . . . . . . . . . . . . . . . . . . . . . . . . . . . . . . . . . . 994,863 993,002
(1) We present certain information on a pro forma as adjusted basis to give pro forma effect to the sale by us of 7,000,000 sharesof our common stock in this offering (assuming no exercise of the underwriters’ option to purchase additional shares) at anassumed initial public offering price of $21.50 per share (the midpoint of the price range listed on the cover page of thisprospectus) after deducting estimated underwriting discounts and commissions and estimated expenses payable by us inconnection with this offering and the application of the net proceeds to be received by us from this offering to repay $138.3million in aggregate principal amount of outstanding borrowings under our Senior Secured Term Loan Facility as described in“Use of Proceeds.”
Pro forma as adjusted net income (loss) reflects (i) the decrease in interest expense, net resulting from the repayment of$138.3 million in aggregate principal amount of outstanding borrowings under our Senior Secured Term Loan Facility with thenet proceeds from this offering, as described in “Use of Proceeds,” and (ii) increases in income tax expense due to higherincome before income taxes resulting from a decrease in interest expense, net as a result of the repayment of $138.3 millionin aggregate principal amount of outstanding borrowings under our Senior Secured Term Loan Facility as described in (i) aboveas if each of these events had occurred on January 1, 2015. Pro forma as adjusted basic net income (loss) per common shareconsists of pro forma as adjusted net income (loss) divided by the pro forma as adjusted basic weighted average number ofcommon shares outstanding. Pro forma as adjusted diluted net income (loss) per common share consists of pro forma asadjusted net income (loss) divided by the pro forma as adjusted diluted weighted average number of common sharesoutstanding.
15

The table below provides a summary of net income (loss) used in the calculation of basic and diluted net income (loss) percommon share on a pro forma as adjusted basis for the periods presented (in thousands):
SIX MONTHSENDED
JUNE 30,2016
YEAR ENDEDDECEMBER 31,
2015
Net income (loss) . . . . . . . . . . . . . . . . . . . . . . . . . . . . . . . . . . . . . . . . . . . . . . . . . . $ 8,410 $(8,673)Reduction of interest expense . . . . . . . . . . . . . . . . . . . . . . . . . . . . . . . . . . . . . . . . 3,321 6,660Tax effect of the above adjustments . . . . . . . . . . . . . . . . . . . . . . . . . . . . . . . . . . . . (1,295) (2,597)
Pro forma as adjusted net income (loss) . . . . . . . . . . . . . . . . . . . . . . . . . . . . . . . . $10,436 $(4,610)
Pro forma as adjusted weighted average number of common shares outstanding used in the calculation of pro forma asadjusted basic and diluted net income (loss) per common share gives effect to the sale by us of 7,000,000 shares of ourcommon stock in this offering (assuming no exercise of the underwriters’ option to purchase additional shares) as if this eventhad occurred on January 1, 2015.
The table below provides a summary of the weighted average number of common shares outstanding used in the calculation ofbasic and diluted net income (loss) per common share on a pro forma as adjusted basis:
SIX MONTHSENDED
JUNE 30,2016
YEAR ENDEDDECEMBER 31,
2015
Weighted average common shares outstanding—basic . . . . . . . . . . . . . . . . . . . . . 32,631 31,346Common shares sold in this offering . . . . . . . . . . . . . . . . . . . . . . . . . . . . . . . . . . . 7,000 7,000
Pro forma as adjusted weighted average common share outstanding—basic . . . . . 39,631 38,346Incremental shares from the assumed exercise of outstanding stock options . . . . — —
Pro forma as adjusted weighted average common shares outstanding—diluted . . 39,631 38,346
(2) We prepare our financial statements in conformity with U.S. GAAP. To supplement this information, we also use the followingnon-GAAP financial measures in this prospectus: EBITDA, Adjusted EBITDA, Adjusted Net Income and Free Cash Flow.EBITDA, Adjusted EBITDA, Adjusted Net Income and Free Cash Flow are measures used by management to assess operatingperformance. EBITDA, Adjusted EBITDA, Adjusted Net Income and Free Cash Flow are not presented in accordance with U.S.GAAP, are not measures of financial condition or profitability and should not be considered as an alternative to net income(loss) determined in accordance with U.S. GAAP or net cash provided by operating activities determined in accordance withU.S. GAAP, as applicable, or any other performance measure derived in accordance with U.S. GAAP and should not beconstrued as an inference that our future results will be unaffected by unusual non-recurring items. Management usesEBITDA, Adjusted EBITDA, Adjusted Net Income and Free Cash Flow or comparable metrics:
■ as a measurement used in evaluating our operating performance on a consistent basis;
■ as a consideration to assess incentive compensation for our employees;
■ for planning purposes, including the preparation of our internal annual operating budget; and
■ to evaluate the performance and effectiveness of our operational strategies.
We believe that the inclusion of EBITDA and Adjusted EBITDA in this prospectus is useful to provide additional information toinvestors about certain material non-cash and non-recurring items. While we believe these financial measures are commonlyused by investors to evaluate our performance and that of our competitors, because not all companies use identicalcalculations, this presentation of EBITDA and Adjusted EBITDA may not be comparable to other similarly titled measures ofother companies and should not be considered as an alternative to performance measures derived in accordance with U.S.GAAP. EBITDA is calculated as net income (loss) attributable to Medpace Holdings, Inc. before income tax expense, interestexpense, net, depreciation and amortization with Adjusted EBITDA being further adjusted for unusual and other itemsreflected in the reconciliation table below. Our presentation of Adjusted EBITDA should not be construed as an inference thatour future results will be unaffected by usual or non-recurring items.
16

EBITDA and Adjusted EBITDA have important limitations as analytical tools and you should not consider them in isolation, oras a substitute for, analysis of our results as reported under U.S. GAAP. Some of these limitations are:
■ they do not reflect our interest expense, or the cash requirements necessary to service interest or principal payments, onour debt;
■ they do not reflect our cash expenditures, or future requirements for capital expenditures or contractual commitments;
■ they do not reflect changes in, or cash requirements for, our working capital needs;
■ although depreciation and amortization are non-cash charges, the assets being depreciated and amortized will often haveto be replaced in the future, and EBITDA and Adjusted EBITDA do not reflect the cash requirements for suchreplacements;
■ they do not reflect our income tax expense or the cash requirements to pay our taxes;
■ Adjusted EBITDA does not reflect the non-cash component of certain stock based awards related to fair valueadjustments and unusual non-recurring stock awards;
■ Adjusted EBITDA does not reflect the impact of earnings or charges resulting from matters we consider not to beindicative of our ongoing operations, as discussed in our presentation of Adjusted EBITDA and “Management’s Discussionand Analysis of Financial Condition and Results of Operations” in this prospectus; and
■ other companies in our industry may calculate Adjusted EBITDA differently than we do, limiting its usefulness ascomparative measures.
Because of these limitations, EBITDA and Adjusted EBITDA should not be considered as a measure of discretionary cashavailable to us to invest in the growth of our business. We compensate for these limitations by relying primarily on ourU.S. GAAP results and using EBITDA and Adjusted EBITDA only supplementally.
We utilize Free Cash Flow as a measure of profitability and an assessment of our ability to generate cash. Free Cash Flow is acommonly utilized metric that companies provide to investors, although the calculation of Free Cash Flow may not be comparable toother similarly titled metrics of other companies and should not be considered as an alternative to cash flow measures derived inaccordance with U.S. GAAP. We define Free Cash Flow as net cash provided by operating activities, less capital expenditures andthe principal portion of payments related to campus leases classified for accounting purposes as deemed landlord liabilities.
Adjusted Net Income measures our operating performance by adjusting net income (loss) attributable to Medpace Holdings, Inc. toinclude cash expenditures related to rental payments on leases classified for accounting purposes as deemed landlord liabilities, andexclude amortization expense, certain stock based compensation award non-cash expenses, certain litigation expenses, deferredfinancing fees and certain other non-recurring items. Management uses this measure to evaluate our core operating results as itexcludes certain items whose fluctuations from period-to-period do not necessarily correspond to changes in the core operations ofthe business, but includes certain items such as depreciation, interest expense and tax expense, which are otherwise excluded fromAdjusted EBITDA. We believe the presentation of Adjusted Net Income enhances our investors’ overall understanding of thefinancial performance and cash flow of our business. You should not consider Adjusted Net Income as an alternative to net income(loss) attributable to Medpace Holdings, Inc., determined in accordance with U.S. GAAP, as an indicator of operating performance.
17

See the consolidated financial statements included elsewhere in this prospectus for our U.S. GAAP results. Set forth below arethe reconciliations of EBITDA, Adjusted EBITDA, Adjusted Net Income and Free Cash Flow to our closest reported U.S. GAAPmeasures.
SUCCESSOR PREDECESSOR
(In thousands)
SIXMONTHSENDED
JUNE 30,2016
SIXMONTHSENDED
JUNE 30,2015
YEAR ENDEDDECEMBER 31,
2015
NINE MONTHPERIOD FROMAPRIL 1, 2014
THROUGHDECEMBER 31,
2014
THREEMONTHPERIODFROM
JANUARY 1,2014
THROUGHMARCH 31,
2014
YEAR ENDEDDECEMBER 31,
2013
EBITDA and Adjusted EBITDA:Net income (loss) as reported . . . . . . . . . $ 8,410 $ 36 $ (8,673) $(14,336) $ (1,236) $ 24,844Interest expense, net . . . . . . . . . . . . . . . . 11,894 13,975 27,259 23,185 3,272 18,000Income tax provision (benefit) . . . . . . . . . 5,738 (733) 843 (6,703) 1,014 14,301Depreciation . . . . . . . . . . . . . . . . . . . . . . 3,566 3,110 6,379 4,610 1,832 6,665Amortization . . . . . . . . . . . . . . . . . . . . . . 25,336 34,243 63,142 56,422 5,199 23,854
EBITDA . . . . . . . . . . . . . . . . . . . . . . . . . . 54,944 50,631 88,950 63,178 10,081 87,664
Stock compensation expense: liabilityawards mark-to-market and CEOaward (a) . . . . . . . . . . . . . . . . . . . . . . 2,576 (12) 9,780 — — —
Private equity transaction relatedcost (b) . . . . . . . . . . . . . . . . . . . . . . . . — — — 9,297 12,420 —
Corporate campus lease payments (c) . . . (1,860) (1,860) (3,720) (2,773) (918) (3,635)Litigation matters (d) . . . . . . . . . . . . . . . . — (374) (3,107) 748 127 1,380Impairment of goodwill . . . . . . . . . . . . . . — — 9,313 — — —Other transaction expenses (f) . . . . . . . . . 767 — — — — —
Adjusted EBITDA . . . . . . . . . . . . . . . . . . $ 56,427 $ 48,385 $101,216 $ 70,450 $21,710 $ 85,409
Adjusted Net Income:Net income (loss) as reported . . . . . . . . . $ 8,410 $ 36 $ (8,673) $(14,336) $ (1,236) $ 24,844Amortization . . . . . . . . . . . . . . . . . . . . . . 25,336 34,243 63,142 56,422 5,199 23,854Stock compensation expense: liability
awards mark-to-market and CEOaward (a) . . . . . . . . . . . . . . . . . . . . . . . 2,576 (12) 9,780 — — —
Private equity transaction relatedcost (b) . . . . . . . . . . . . . . . . . . . . . . . . — — — 9,297 12,420 —
Corporate campus lease payments—principal portion (c) . . . . . . . . . . . . . . (744) (576) (1,292) (1,284) (165) —
Litigation matters (d) . . . . . . . . . . . . . . . . — (374) (3,107) 748 127 1,380Impairment of goodwill . . . . . . . . . . . . . . — — 9,313 — — —Deferred financing fees (e) . . . . . . . . . . . . 1,345 1,328 2,687 2,064 371 1,918Other transaction expenses (f) . . . . . . . . . 767 — — — — —Income tax effect of adjustments
(39.0%) . . . . . . . . . . . . . . . . . . . . . . (11,419) (13,498) (31,405) (26,226) (7,001) (10,589)
Adjusted Net Income . . . . . . . . . . . . . . . . $ 26,271 $ 21,147 $ 40,445 $ 26,685 $ 9,715 $ 41,407
Free Cash Flow:Cash flow provided by operating
activities . . . . . . . . . . . . . . . . . . . . . . $ 19,982 $ 26,271 $ 84,117 $ 62,539 $12,807 $ 98,142Less: Capital expenditures . . . . . . . . (5,693) (2,665) (6,465) (4,225) (1,090) (4,561)Less: Corporate campus lease
payments—principalportion (c) . . . . . . . . . . . . . . . . . . (744) (576) (1,292) (1,284) (165) —
Free Cash Flow . . . . . . . . . . . . . . . . . . . . $ 13,545 $ 23,030 $ 76,360 $ 57,030 $11,552 $ 93,581
(a) Consists of period end mark-to-market fair value adjustments associated with liability classified awards and the impact ofa one-time stock based compensation award to our Chief Executive Officer and founder. Future stock based awardsactivity is expected to be classified as equity for accounting purposes and will not be subject to period ending fair valueadjustments.
(b) Represents attorney fees, advisory fees and other professional service fees incurred in connection with the Transaction.
18

(c) Represents cash rental payments on two corporate headquarter buildings that are accounted for as deemed assets andsubject to depreciation expense over the life of the lease. Payments made for these leases are accounted for with aprincipal portion and an interest portion, consistent with deemed landlord liability accounting. For purposes of Free CashFlow, the interest portion of these payments is included in net cash provided by operating activities in our statement ofcash flows. The principal portion is reflected as a financing activity in our statement of cash flows. These adjustments forpurposes of arriving at Adjusted EBITDA, Adjusted Net Income and Free Cash Flow have the effect of presenting theseleases consistently with all other office lease rentals that we have globally.
(d) Represents non-recurring costs and recovery related to a customer bad debt and non-recurring expenses related to thesettlement of an employment related matter.
(e) Represents amortization of the discount and issuance costs deferred on the consolidated balance sheet associated withthe issuance of the Senior Secured Credit Facility.
(f) Represents advisory costs and other fees related to this offering.(3) Backlog represents anticipated future net service revenue from net new business awards that have not commenced or are
currently in process but not complete. However, because the contracts included in our backlog are generally terminablewithout cause, we do not believe that our backlog as of any date is necessarily a meaningful predictor of future results.
(4) Net new business awards are new business awards net of award modifications and cancellations that had previously beenrecognized in backlog during the period. New business awards represent the value of anticipated future net service revenuethat has been awarded during the period that is recognized in backlog. This value is recognized upon the signing of a contractor receipt of a written pre-contract confirmation from a customer that confirms an agreement in principle on budget and scope.New business awards also include contract amendments, or changes in scope, where the customer has provided writtenauthorization for changes in budget and scope or has approved us to perform additional work as of the measurement date.Awards may not be recognized as backlog after consideration of a number of factors, including whether (i) the relevant netservice revenue is expected only after a pending regulatory hurdle, which might result in cancellation of the study, (ii) thecustomer funding needed for commencement of the study is not believed to have been secured or (iii) study timelines areuncertain or not well defined. In addition, study amounts that extend beyond a three-year timeline are not included in backlog.The number and amount of new business awards can vary significantly from period to period, and an award’s contractualduration can range from several months to several years based on customer and project specifications.
(5) On an as adjusted basis to give effect to our issuance and sale of 7,000,000 shares of our common stock in this offering atthe initial public offering price of $21.50 per share (the midpoint of the price range listed on the cover page of thisprospectus), after deducting estimated underwriting discounts and commissions and estimated expenses payable by us inconnection with this offering and the application of the net proceeds to be received by us from this offering as described under“Use of Proceeds.”
19

RISK FACTORS
Investing in our common stock involves a high degree of risk. You should consider carefully the risks anduncertainties described below together with the other information included in this prospectus, including ourconsolidated financial statements and related notes included elsewhere in this prospectus, before deciding topurchase our common stock. The occurrence of any of the following risks may materially and adversely affect ourbusiness, financial condition, results of operations and future prospects. In such an event, the market price of ourcommon stock could decline, and you could lose part or all of your investment.
Risks Relating to Our Business
The potential loss, delay or non-renewal of our contracts, or the non-payment by our customers for services that wehave performed, could adversely affect our results.We experience termination, cancellation and non-renewals of contracts by our customers in the ordinary course ofbusiness, and the number and dollar value of cancellations can vary significantly from year to year.
The time between when a clinical trial is awarded and when it goes to contract is typically several months, and priorto a new business award going to contract, our customers can cancel the award without notice. Moreover, once anaward goes to contract, most of our customers for clinical trial services can terminate our contracts without causeupon 30 days’ notice. For example, our average quarterly cancellation rates as a percentage of the beginning of theperiod backlog were 4.2% and 2.7% for the Successor six months ended June 30, 2016 and June 30, 2015,respectively, and 3.2% for the Successor year ended December 31, 2015, 3.3% for the Successor nine monthperiod ended December 2014, 2.5% for the Predecessor three month period ended March 2014 and 3.7% for thePredecessor year ended December 2013. Our customers may delay, terminate or reduce the scope of our contractsfor a variety of reasons beyond our control, including, but not limited to:
■ decisions to forego or terminate a particular clinical trial;■ lack of available financing, budgetary limits or changing priorities;■ actions by regulatory authorities;■ changes in law;■ production problems resulting in shortages of the drug being tested;■ failure of the drug being tested to satisfy safety requirements or efficacy criteria;■ unexpected or undesired clinical results;■ insufficient investigator recruitment or patient enrollment in a trial;■ decisions to downsize product development portfolios;■ dissatisfaction with our performance, including the quality of data provided and our ability to meet agreed
upon schedules;■ shift of business to another CRO or internal resources;■ product withdrawal following market launch; or■ shut down of our customers’ manufacturing facilities.
As a result, contract terminations, delays and modifications are a regular part of our business. In the event oftermination, our contracts often provide for payment to us of fees for services provided up to the point of terminationand for close-out activities for winding down the clinical trial, and reimbursement of all non-cancellable expenses.These payments may not be sufficient for us to maintain our profit margins, and termination or non-renewal mayresult in lower resource utilization rates, including with respect to personnel who we are not able to place on anothercustomer engagement. Historically, cancellations and delays have negatively impacted our operating results.
Clinical trials can be costly and for the Successor year ended December 31, 2015, 55.7% and 29.3% of our netservice revenue was derived from small biopharmaceutical companies and mid-sized biopharmaceutical companies,respectively, which may have limited access to capital. In addition, we provide services to our customers before theypay us for some of our services. There is a risk that we may initiate a clinical trial for a customer, and the customersubsequently becomes unwilling or unable to fund the completion of the trial. In such a situation, notwithstanding
20

the customer’s ability or willingness to pay for or otherwise facilitate the completion of the trial, we may be legally orethically bound to complete or wind down the trial at our own expense.
Because the contracts included in our backlog are generally terminable without cause, we do not believe that ourbacklog as of any date is necessarily a meaningful predictor of future results. In addition, we may not realize the fullbenefits of our backlog of contractually committed services if our customers cancel, delay or reduce theircommitments under our contracts with them. Thus, the loss or delay of a large contract or the loss or delay ofmultiple contracts could adversely affect our net service revenue and profitability. In addition, the terminability ofour contracts puts increased pressure on our quality control efforts, since not only can our contracts be terminatedby customers as a result of poor performance, but any such termination may also affect our ability to obtain futurecontracts from the customer involved and others.
Our backlog may not convert to net service revenue at our historical conversion rates.Backlog represents anticipated future net service revenue from net new business awards that have not commencedor are currently in process but not complete. Reported backlog will fluctuate based on new business awards, changesin scope to existing contracts, cancellations, revenue recognition on existing contracts and foreign exchangeadjustments from non-U.S. dollar denominated backlog. Our backlog as of June 30, 2016 and June 30, 2015 wasapproximately $465.7 and $400.6 million, respectively. Included within backlog as of June 30, 2016 isapproximately $170.1 million to $175.1 million that we expect to convert to net service revenue in 2016, with theremainder expected to convert to net service revenue in years after 2016. Once work begins on a project, net servicerevenue is recognized over the duration of the project. Projects may be terminated or delayed by the customer ordelayed by regulatory authorities for reasons beyond our control. To the extent projects are delayed, the timing of ournet service revenue could be adversely affected. Moreover, in the event that a customer cancels a contract, we oftenwould be entitled to receive payment for services provided up to the point of cancellation and for close-out activitiesfor winding down the clinical trial, and reimbursement of all non-cancellable expenses. Typically, however, we haveno contractual right to the full amount of the future net service revenue reflected in our backlog in the event of acontract cancellation or subsequent changes in scope that reduce the value of the contract. The duration of theprojects included in our backlog, and the related net service revenue recognition, generally range from a few monthsto several years. Our backlog may not be indicative of our future net service revenue, and we may not realize all ofthe anticipated future net service revenue reflected in our backlog. A number of factors may affect the realization ofour net service revenue from backlog, including:
■ the size, complexity and duration of the projects;■ the cancellation or delay of projects; and■ changes in the scope of work during the course of a project.
Fluctuations in our reported backlog levels also result from the fact that we may receive a small number of relativelylarge projects in any given reporting period that may be included in our backlog. Because of these large projects, ourbacklog in that reporting period may reach levels that may not be sustained in subsequent reporting periods.Additionally, although an increase in backlog will generally result in an increase in net service revenue over time, anincrease in backlog at a particular point in time does not necessarily correspond directly to an increase in net servicerevenue during any particular period, or at all. The extent to which contracts in backlog will result in net servicerevenue depends on many factors, including, but not limited to, delivery against project schedules, scope changes,contract terminations and the nature, duration and complexity of the contracts, and can vary significantly over time.
As we increasingly compete for and enter into large contracts that are more global in nature, there can be noassurance about the rate at which our backlog will convert into net service revenue. A decrease in this conversionrate would mean that the rate of net service revenue recognized on contracts may be slower than what we haveexperienced in the past, which could impact our net service revenue and results of operations on a quarterly andannual basis. The revenue recognition on larger, more global projects could be slower than on smaller, less globalprojects for a variety of reasons, including, but not limited to, an extended period of negotiation between the timethe project is awarded to us and the actual execution of the contract, as well as an increased timeframe for obtainingthe necessary regulatory approvals. Additionally, delayed projects will remain in backlog and will not generaterevenue at the rate originally expected. Thus, the relationship of backlog to realized revenues is indirect and mayvary significantly over time.
21

Additionally, there has been a recent slowdown in funding in the biotechnology industry. If small and mid-sizedbiopharmaceutical companies become less able to access capital in the future, we may see a decrease in backlogconversion to net service revenue and net new business awards due to project delays or cancellations. Thesecompanies have contributed materially to our historical net service revenue. If they cannot commit the same or agreater level of capital to our services going forward, our results of operations may suffer.
Our operating results have historically fluctuated between fiscal quarters and years and may continue to fluctuate inthe future, which may adversely affect the market price of our stock after this offering.Our operating results have fluctuated in previous quarters and years and may continue to vary significantly fromquarter to quarter and year to year and are influenced by a variety of factors, such as:
■ timing of contract amendments for changes in scope that could affect the value of a contract and potentiallyimpact the amount of net new business awards and net service revenue from quarter to quarter;
■ commencement, completion, execution, postponement or termination of large contracts;
■ contract terms for the billing and recognition of revenue milestones;
■ progress of ongoing contracts and retention of customers;
■ timing of and charges associated with completion of acquisitions and other events;
■ changes in the mix of services delivered, both in terms of geography and type of services;
■ customer disputes or other issues that may impact the revenue we are able to recognize or the collectabilityof our related accounts receivable; and
■ exchange rate fluctuations.
Our operating results for any particular quarter or year are not necessarily a meaningful indicator of future resultsand fluctuations in our quarterly or yearly operating results could negatively affect the market price and liquidity ofshares of our common stock.
Our operating margins could decrease due to increased pricing pressure or other pressures.Historically, we have been able to generate the operating margins that we do because of our disciplined, full-serviceoperating model. However, we operate in a highly competitive environment, and, if we experience increased levels ofcompetitive pricing pressure, our operating margins may decrease. In addition, we may adapt our operating model toachieve greater levels of growth or in response to investor demands. Such a change could result in lower operatingmargins.
If we fail to perform our services in accordance with contractual requirements, government regulations and ethicalconsiderations, we could be subject to significant costs or liability and our reputation could be adversely affected.We contract with biopharmaceutical companies to perform a wide range of services to assist them in bringing newdrugs to market. Our services include monitoring clinical trials, data and laboratory analysis, electronic data capture,patient recruitment and other related services. Such services are complex and subject to contractual requirements,government regulations, and ethical considerations. For example, we are subject to regulation by the FDA andcomparable foreign regulatory authorities relating to our activities in conducting pre-clinical studies and clinicaltrials. Before clinical trials begin in the United States, a drug is tested in pre-clinical trials that must comply withGood Laboratory Practice and other requirements. An applicant must file an Investigational New Drug Application, orIND, which must become effective before human clinical testing may begin. Further, an independent InstitutionalReview Board, or IRB, for each medical center proposing to participate in the clinical trial must review and approvethe protocol for the clinical trial. Once initiated, clinical trials must be conducted pursuant to and in accordancewith the applicable IND conditions, the requirements of the relevant IRBs, the Federal Food, Drug, and Cosmetic Actand its implementing regulations, including Good Clinical Practice, or GCP, and other requirements. We are alsosubject to regulation by the Drug Enforcement Administration, or DEA, which regulates the distribution,recordkeeping, handling, security, and disposal of controlled substances. If we fail to perform our services inaccordance with these requirements, regulatory authorities may take action against us or our customers. Suchactions may include injunctions or failure of such regulatory authority to grant marketing approval of our customers’products, imposition of clinical holds or delays, suspension or withdrawal of approvals, rejection of data collected inour clinical trials, license revocation, product seizures or recalls, operational restrictions, civil or criminal penalties orprosecutions, damages or fines. Customers may also bring claims against us for breach of our contractual
22

obligations, and patients in the clinical trials and patients taking drugs approved on the basis of those trials maybring personal injury claims against us. Any such action could have a material adverse effect on our business,financial condition, results of operations, cash flows or reputation.
Such consequences could arise if, among other things, the following occur:
Improper performance of our services. The performance of clinical development services is complex and time-consuming. For example, we may make mistakes in conducting a clinical trial that could negatively impact or obviatethe usefulness of results of the trial or cause the results of the trial to be reported improperly. If the trial results arecompromised, we could be subject to significant costs or liability, which could have an adverse impact on our abilityto perform our services and our reputation would be harmed. As examples:
■ non-compliance generally could result in the termination of ongoing clinical trials or the disqualification ofdata for submission to regulatory authorities;
■ non-compliance could compromise data from a particular trial, such as failure to verify that adequateinformed consent was obtained from patients, which could require us to repeat the trial under the terms ofour contract at no further cost to our customer, but at a potentially substantial cost to us; and
■ breach of a contractual term could result in liability for damages or termination of the contract.
The services we provide in connection with large clinical trials can cost tens of millions of dollars, and while weendeavor to contractually limit our exposure to such risks, improper performance of our services could have amaterial adverse effect on our financial condition, damage our reputation and result in the cancellation of currentcontracts by the affected customer or other current customers or failure to obtain future contracts from the affectedcustomer or other current or potential customers.
Investigation of customers. From time to time, one or more of our customers are investigated by regulatoryauthorities or enforcement agencies with respect to regulatory compliance of their clinical trials, programs or themarketing and sale of their drugs. In these situations, we have often provided services to our customers with respectto the clinical trials, programs or activities being investigated, and we are called upon to respond to requests forinformation by the authorities and agencies. There is a risk that either our customers or regulatory authorities couldclaim that we performed our services improperly or that we are responsible for clinical trial or program compliance. Ifour customers or regulatory authorities make such claims against us, we could be subject to significant costs indefending our activities and potential damages, fines or penalties. In addition, negative publicity regarding regulatorycompliance of our customers’ clinical trials, programs or products could have an adverse effect on our business andreputation.
Insufficient customer funding to complete a clinical trial. As noted above, clinical trials can cost tens of millions ofdollars. There is a risk that we may initiate a clinical trial for a customer, and then the customer becomes unwillingor unable to fund the completion of the trial. In such a situation, notwithstanding the customer’s ability orwillingness to pay for or otherwise facilitate the completion of the trial, we may be ethically bound to complete orwind down the trial at our own expense.
Interactive voice/web response service malfunction. We develop and maintain our own, and also use third-parties torun, interactive voice/web response systems. These systems automatically manage the randomization of patients in agiven clinical trial to different treatment arms and regulate the supply of investigational drugs. An error in thedesign, programming or validation of these systems could lead to inappropriate assignment or dosing of patientswhich could give rise to patient safety issues, invalidation of the trial or liability claims against us. Furthermore,negative publicity associated with such a malfunction could have an adverse effect on our business and reputation.Additionally, errors in randomization may require us to repeat the trial at no further cost to our customer, but at asubstantial cost to us.
In addition to the above U.S. laws and regulations, we must comply with the laws of all countries where we dobusiness, including laws governing clinical trials in the jurisdiction where the trials are performed. Failure to complywith applicable requirements could subject us to regulatory risk, liability and potential costs associated with redoingthe trials, which could damage our reputation and adversely affect our operating results.
23

We bear financial risk if we underprice our fixed-fee contracts or overrun cost estimates, and our financial resultscan also be adversely affected by failure to receive approval for change orders or delays in documenting changeorders.The majority of our Phase I–IV contracts are fixed-fee contracts. We bear the financial risk if we initially underpriceour contracts or otherwise overrun our cost estimates. In addition, contracts with our customers are subject tochange orders, which we commonly experience and which occur when the scope of work we perform needs to bemodified from that originally contemplated by our contract with the customer. Modifications can occur, for example,when there is a change in a key trial assumption or parameter, a significant change in timing or a change in staffingneeds. Furthermore, we may be unable to successfully negotiate changes in scope or change orders on a timely basisor at all, which could require us to incur cost outlays ahead of the receipt of any additional revenue. In addition,under U.S. GAAP, we cannot recognize additional revenue anticipated from change orders until appropriatedocumentation is received by us from the customer authorizing the change. However, if we incur additional expensein anticipation of receipt of that documentation, we must recognize the expense as incurred. Such underpricing,significant cost overruns or delay in documentation of change orders could have a material adverse effect on ourbusiness, results of operations, financial condition or cash flows.
If we are unable to successfully execute our growth strategies, our results of operations or financial condition couldbe adversely affected.Our key growth strategies include: continued organic growth, continued maintenance of industry-leading margins(compared to our public competitors), increasing capture of the high-growth clinical development market, deepeningexisting and developing new relationships with our core customer segment, pursuing selective and complementarybolt-on acquisitions and increasing our capture of the large pharmaceutical company market. Though we will striveto meet these goals, we may not have or adequately build the competencies necessary to achieve our objectives. Inaddition, we may not receive market acceptance for our services and we may face increased competition. If we areunable to successfully continue our organic growth, continue to maintain our margins, increase our capture of theclinical development market, deepen existing and develop new relationships with our core customer segment, pursuecomplementary and non-transformative acquisitions or attract additional large pharmaceutical company customers,our future business, reputation, results of operations and financial condition could be adversely affected. For moreinformation on our growth strategies, see “Business—Our Growth Strategy.”
If we lose the services of key personnel or are unable to recruit experienced personnel, our business could beadversely affected.Our success substantially depends on the collective performance, contributions and expertise of our seniormanagement team, including Dr. August J. Troendle, our Chief Executive Officer and founder, and other keypersonnel including qualified management, professional, scientific and technical operating staff. There is significantcompetition for qualified personnel in the biopharmaceutical services industry, particularly for those with highereducational degrees, such as a medical or nursing degree, a Doctor of Philosophy, or Ph.D., or an equivalent degree,and our industry generally tends to experience relatively high levels of employee turnover. If any of our keyemployees were to join a competitor or to form a competing company, some of our customers might choose to usethe services of that competitor or new company instead of our own. Furthermore, customers or other companiesseeking to develop in-house capabilities may hire some of our senior management or other key employees. Thedeparture of any key contributor, the payment of increased compensation to attract and retain qualified personnel orour inability to continue to identify, attract and retain qualified personnel or replace any departed personnel in atimely fashion may impact our ability to grow our business and compete effectively in our industry and maynegatively affect our business, financial condition, results of operations, cash flows or reputation.
24

Our business depends on the continued effectiveness and availability of our information systems, including theinformation systems we use to provide our services to our customers, such as ClinTrak, and failures of these systemsmay materially limit our operations.Due to the global nature of our business and our reliance on information systems to provide our services, we intend toincrease our use of web-enabled and other integrated information systems in delivering our services. We already provideaccess to such an information system, ClinTrak, to certain of our customers in connection with the services we provide tothem. As the breadth and complexity of our information systems continue to grow, we will increasingly be exposed to therisks inherent in the development, integration and ongoing operation of evolving information systems, including:
■ disruption, impairment or failure of data centers, telecommunications facilities or other key infrastructureplatforms;
■ security breaches of, cyberattacks on and other failures or malfunctions in our critical application systemsor their associated hardware; and
■ excessive costs, excessive delays or other deficiencies in systems development and deployment.
The materialization of any of these risks may impede the processing of data, the delivery of databases and servicesand the day-to-day management of our business and could result in the corruption, loss or unauthorized disclosure ofproprietary, confidential or other data. While we have disaster recovery plans in place, they might not adequatelyprotect us in the event of a system failure. Despite any precautions we take, damage from fire, floods, hurricanes,power loss, telecommunications failures, computer viruses, information system security breaches and similar eventsat our facilities or at those of our third party provider that backs up our data centers could result in interruptions inthe flow of data to our servers and from our servers to our customers. Corruption or loss of data may result in theneed to repeat a trial at no cost to the customer, but at significant cost to us, or result in the termination of acontract or damage to our reputation. Moreover, regulatory authorities may impose requirements on the use ofelectronic records and signatures for regulatory purposes. For example, FDA’s regulations at 21 CFR Part 11establish the criteria pursuant to which the FDA will consider electronic records and signatures to be trustworthy,reliable, and generally equivalent to paper records and handwritten signatures. Any failures to comply with thoseregulatory requirements could impact our customers’ ability to rely on the data contained in those electronic recordsin our systems or result in the FDA’s rejection of the data. Additionally, in order for our information systems tocontinue to be effective going forward, we periodically need to upgrade our technology systems and increase ourcapacity to keep pace with technological developments and our growth as a company. Significant delays in systemenhancements or inadequate performance of new or upgraded systems once completed could damage our reputationand harm our business. Our operations also may suffer if we are unable to effectively manage the implementation ofand adapt to new technology systems. Any such shortcoming may require us to make substantial further investmentsin our IT platform, which could adversely affect our financial results. Finally, long-term disruptions in theinfrastructure caused by events such as natural disasters, the outbreak of war, the escalation of hostilities and actsof terrorism, particularly involving cities in which we have offices, could adversely affect our business. As ourbusiness continues to expand globally, these types of risks may be further increased by instability in the geopoliticalclimate of certain regions, underdeveloped and less stable utilities and communications infrastructure and otherlocal and regional factors. Although we carry property and business interruption insurance, our coverage might not beadequate to compensate us for all losses that may occur.
Unauthorized disclosure of sensitive or confidential data, whether through system failure or breaches or employeenegligence, fraud or misappropriation, could damage our reputation and cause us to lose customers. Similarly,unauthorized access to or through our information systems or those we develop for our customers, whether by ouremployees or third parties, including a cyberattack by computer programmers and hackers who may develop anddeploy viruses, worms or other malicious software programs, could result in negative publicity, significantremediation costs, legal liability and damage to our reputation and could have a material adverse effect on ourresults of operations. In addition, our liability insurance might not be sufficient in type or amount to adequatelycover us against claims related to security breaches, cyberattacks and other related breaches.
25

Our business could be harmed if we are unable to manage our growth effectively.We believe that sustained growth places a strain on operational, human and financial resources. To manage ourgrowth, we must continue to improve our operating and administrative systems and to attract and retain qualifiedmanagement, professional, scientific and technical operating personnel. We believe that maintaining and enhancingboth our systems and personnel at reasonable cost are instrumental to our success. We cannot assure you that wewill be able to enhance our current technology or obtain new technology that will enable our systems to keep pacewith developments and the needs of our customers. The nature and pace of our growth introduces risks associatedwith quality control and customer dissatisfaction due to delays in performance or other problems. In addition, foreignoperations involve the additional risks of assimilating differences in foreign business practices, hiring and retainingqualified personnel and overcoming language barriers. Failure to manage growth effectively could have a materialadverse effect on our business.
Our customer or therapeutic area concentration may have a material adverse effect on our business, financialcondition, results of operations or cash flows.Although we did not have any customer that represented 10% or more of our net service revenue during theSuccessor six months ended June 30, 2016 or the Successor year ended December 31, 2015, we derive asignificant portion of our revenues from a limited number of large customers. For the Successor six months endedJune 30, 2016, we derived 38.2% and 6.3% of our net service revenue from our top 10 customers and our largestcustomer, respectively. For the Successor year ended December 31, 2015, we derived 39.9% and 6.9% of our netservice revenue from our top 10 customers and our largest customer, respectively. For more information about ourlargest customer, see “Certain Relationships and Related Person Transactions—Service Agreements.” In addition,approximately 44.6% and 7.8% of our backlog, as of June 30, 2016, was concentrated among our top 10customers and our largest customer by backlog concentration, respectively. Moreover, 4.0% of our backlog, as ofJune 30, 2016, was concentrated with our largest customer by net service revenue. If any large customer decreasesor terminates its relationship with us, our business, financial condition, results of operations or cash flows could bematerially adversely affected. Also, consolidation in our actual or potential customer base results in increasedcompetition for important market segments and fewer available customer accounts.
Additionally, conducting multiple clinical trials for different sponsors in a single therapeutic class, involving similardrugs, biologics or medical devices, may adversely affect our business if some or all of the trials are terminatedbecause of new scientific information or regulatory decisions that affect the products as a class. Moreover, even ifthese trials are not terminated, they may compete with each other, thereby limiting our potential revenue goingforward.
Our business is subject to international economic, political and other risks that could negatively affect our results ofoperations and financial condition.We have significant operations in foreign countries, including, but not limited to, countries in Europe, Latin America,Asia, the Middle East and Africa, that may require complex arrangements to deliver services on global contracts forour customers. As of June 30, 2016 and December 31, 2015, approximately 34% of our workforce was locatedoutside of North America, and for the Successor six months ended June 30, 2016 and the Successor year endedDecember 31, 2015, 9.2% and 8.4% of our revenue was denominated in currencies other than the U.S. dollar,respectively. As a result, we are subject to heightened risks inherent in conducting business internationally,including the following:
■ conducting a single trial across multiple countries is complex, and issues in one country, such as a failureto comply with local regulations or restrictions, may affect the progress of the trial in the other countries, forexample, by limiting the amount of data necessary for a trial to proceed, resulting in delays or potentialcancellation of contracts, which in turn may result in loss of revenue;
■ the United States or other countries could enact legislation or impose regulations or other restrictions,including unfavorable labor regulations or tax policies, which could have an adverse effect on our ability toconduct business in or expatriate profits from those countries;
■ tax rates in certain foreign countries may exceed those in the United States and foreign earnings may besubject to withholding requirements or the imposition of tariffs, exchange controls or other restrictions,including restrictions on repatriation;
26

■ certain foreign countries are expanding or may expand their regulatory framework with respect to patientinformed consent, protection and compensation in clinical trials, and privacy, which could delay or inhibitour ability to conduct trials in such jurisdictions or which could materially increase the risks associated withperforming trials in such jurisdictions;
■ certain foreign countries are expanding or may expand their banking regulations that govern internationalcurrency transactions, particularly cross-border transfers, which may inhibit our ability to transfer funds intoor within a jurisdiction, impeding our ability to pay our principal investigators, vendors and employees,thereby impacting our ability to conduct trials in such jurisdictions;
■ the regulatory or judicial authorities of foreign countries may not enforce legal rights and recognize businessprocedures in a manner to which we are accustomed or would reasonably expect;
■ we may have difficulty complying with a variety of laws and regulations in foreign countries, some of whichmay conflict with laws in the United States;
■ potential violations of existing or newly adopted local laws or anti-bribery laws, such as the United StatesForeign Corrupt Practices Act, or FCPA, and the UK Bribery Act of 2010, may cause a material adverseeffect on our business, financial condition, results of operations, cash flows or reputation;
■ changes in political and economic conditions, including inflation, may lead to changes in the businessenvironment in which we operate, as well as changes in foreign currency exchange rates;
■ foreign governments may enact currency exchange controls that may limit the ability to fund our operationsor significantly increase the cost of maintaining operations;
■ customers in foreign jurisdictions may have longer payment cycles, and it may be more difficult to collectreceivables in foreign jurisdictions; and
■ natural disasters, pandemics or international conflict, including terrorist acts, could interrupt our services,endanger our personnel or cause project delays or loss of trial materials or results.
These risks and uncertainties could negatively impact our ability to, among other things, perform large, globalprojects for our customers. Furthermore, our ability to deal with these issues could be affected by applicable U.S.laws and the need to protect our assets. In addition, we may be more susceptible to these risks as we enter andcontinue to target growth in emerging countries and regions, including Asia, Eastern Europe and Latin America,which may be subject to a relatively higher risk of political instability, economic volatility, crime, corruption andsocial and ethnic unrest, all of which are exacerbated in many cases by a lack of an independent and experiencedjudiciary and uncertainties in how local law is applied and enforced. The materialization of any such risks could havean adverse impact on our financial condition, results of operations, cash flows or reputation.
Due to the global nature of our business, we may be exposed to liabilities under the Foreign Corrupt Practices Actand various other anti-corruption laws, and any allegation or determination that we violated these laws could have amaterial adverse effect on our business.We are required to comply with the FCPA, UK Bribery Act of 2010 and other U.S. and foreign anti-corruption laws,which prohibit companies from engaging in bribery including corruptly or improperly offering, promising, or providingmoney or anything else of value to foreign officials and certain other recipients. In addition, the FCPA imposescertain books, records and accounting control obligations on public companies and other issuers. We operate in partsof the world in which corruption can be common and compliance with anti-bribery laws may conflict with localcustoms and practices. Our global operations face the risk of unauthorized payments or offers being made byemployees, consultants, sales agents and other business partners outside of our control or without our authorization.It is our policy to implement safeguards (including mandatory training) to prohibit these practices by our employeesand business partners with respect to our operations. However, irrespective of these safeguards, or as a result ofmonitoring compliance with such safeguards, it is possible that we or certain other parties may discover or receiveinformation at some point that certain employees, consultants, sales agents, or other business partners may haveengaged in corrupt conduct for which we might be held responsible. Violations of the FCPA or other foreign anti-corruption laws may result in restatements of, or irregularities in, our financial statements as well as severe criminalor civil sanctions, and we may be subject to other liabilities, which could negatively affect our business, operatingresults and financial condition. In some cases, companies that violate the FCPA may be debarred by the U.S.government and/or lose their U.S. export privileges. Changes in anti-corruption laws or enforcement priorities couldalso result in increased compliance requirements and related costs which could adversely affect our business,
27

financial condition and results of operations. In addition, the U.S. or other governments may seek to hold us liablefor successor liability FCPA violations or violations of other anti-corruption laws committed by companies in whichwe invest or that we acquired or will acquire.
In the past, we have had net losses and we may report net losses in the future, which could negatively impact ourability to achieve or sustain profitability.In the past, we have had net losses and we cannot assure you that we will achieve or sustain profitability on a quarterly orannual basis in the future. For the Successor six months ended June 30, 2016 and June 30, 2015, the Successor yearended December 31, 2015, the Successor nine month period ended December 31, 2014, the Predecessor three monthperiod ended March 31, 2014 and the Predecessor year ended December 31, 2013 our net income (loss) was $8.4million, less than $0.1 million, $(8.7) million, $(14.3) million, $(1.2) million and $24.8 million, respectively. If wecannot reach or maintain profitability, the value of our stock price may be impacted.
Our effective income tax rate may fluctuate, which may adversely affect our operations, earnings and earnings per share.Our effective income tax rate is influenced by our projected profitability in the various taxing jurisdictions in whichwe operate. The global nature of our business increases our tax risks. In addition, for various reasons, revenueauthorities in many of the jurisdictions in which we operate are known to have become more active in their taxcollection activities. Changes in the distribution of profits and losses among taxing jurisdictions may have asignificant impact on our effective income tax rate, which in turn could have an adverse effect on our net incomeand earnings per share. The application of tax laws in various taxing jurisdictions, including the United States, issubject to interpretation, and tax authorities in various jurisdictions may have diverging and sometimes conflictinginterpretations of the application of tax laws. Changes in tax laws or tax rulings, in the United States or other taxjurisdictions in which we operate, could materially impact our effective tax rate.
Factors that may affect our effective income tax rate include, but are not limited to:
■ the requirement to exclude from our quarterly worldwide effective income tax calculations losses injurisdictions where no income tax benefit can be recognized;
■ actual and projected full year pre-tax income, including differences between actual and anticipated incomebefore taxes in various jurisdictions;
■ changes in tax laws, or in the interpretation or application of tax laws, in various taxing jurisdictions;■ audits or other challenges by taxing authorities;■ the establishment of valuation allowances against a portion or all of certain deferred income tax assets if we
determined that it is more likely than not that future income tax benefits will not be realized; and■ changes in the relative mix and size of clinical trials and staffing levels in various tax jurisdictions.
These changes may cause fluctuations in our effective income tax rate that could adversely affect our results ofoperations and cause fluctuations in our earnings and earnings per share.
Governmental authorities may question our intercompany transfer pricing policies or change their laws in a mannerthat could increase our effective tax rate or otherwise harm our business.As a U.S. company doing business in international markets through subsidiaries, we are subject to foreign tax andintercompany pricing laws, including those relating to the flow of funds between the parent and subsidiaries. Taxauthorities in the United States and in foreign markets closely monitor our corporate structure and how we accountfor intercompany fund transfers. If tax authorities challenge our corporate structure, transfer pricing mechanisms orintercompany transfers, our operations may be negatively impacted and our effective tax rate may increase. Tax ratesvary from country to country and if regulators determine that our profits in one jurisdiction should be increased, wemight not be able to fully utilize all foreign tax credits that are generated, which would increase our effective taxrate. Additionally, the Organization for Economic Cooperation and Development, or OECD, has issued certainproposed guidelines regarding base erosion and profit sharing. Once these guidelines are formally adopted by theOECD, it is possible that separate taxing jurisdictions may also adopt some form of these guidelines. In such case,we may need to change our approach to intercompany transfer pricing in order to maintain compliance under thenew rules. Our effective tax rate may increase or decrease depending on the current location of global operations atthe time of the change. Finally, we might not always be in compliance with all applicable customs, exchange control,Value Added Tax and transfer pricing laws despite our efforts to be aware of and to comply with such laws. In suchcase, we may need to adjust our operating procedures and our business could be adversely affected.
28

If we are unable to recruit suitable investigators and enroll patients for our customers’ clinical trials, our clinicaldevelopment business may suffer.The recruitment of investigators and patients for clinical trials is essential to our business. Investigators are typicallylocated at hospitals, clinics or other sites and supervise the administration of the investigational drug, biologic ordevice to patients during the course of a clinical trial. Patients typically include people from the communities inwhich the clinical trials are conducted. Our clinical development business could be adversely affected if we areunable to attract suitable and willing investigators or patients for clinical trials on a consistent basis. For example, ifwe are unable to engage investigators to conduct clinical trials as planned or enroll sufficient patients in clinicaltrials, we may need to expend additional funds to obtain access to resources or else be compelled to delay or modifythe clinical trial plans, which may result in additional costs to us. These considerations might result in our beingunable to successfully achieve our projected development timelines, or potentially even lead to the termination ofongoing clinical trials or development of a product.
Our research and development services could subject us to potential liability that may adversely affect our results ofoperations and financial condition.Our business involves the testing of new drugs, biologics and medical devices on patients in clinical trials. Ourinvolvement in the clinical trial and development process creates a risk of liability for personal injury to or death ofpatients, particularly for those with life-threatening illnesses, resulting from adverse reactions to the productsadministered during testing or after regulatory approval. For example, we may be sued in the future by individualsalleging personal injury due to their participation in clinical trials and seeking damages from us under a variety oflegal theories. If we are required to pay damages or incur defense costs in connection with any personal injury claimthat is outside the scope of indemnification agreements we have with our customers, if any indemnificationagreement is not performed in accordance with its terms or if our liability exceeds the amount of any applicableindemnification limits or available insurance coverage, our business, financial condition, results of operations, cashflows or reputation could be materially and adversely affected. We might also not be able to obtain adequateinsurance or indemnification for these types of risks at reasonable rates in the future.
We also contract with institutions and physicians to serve as investigators in conducting clinical trials. Investigatorsare typically located at hospitals, clinics or other sites and supervise the administration of the investigationalproducts to patients during the course of a clinical trial. If the investigators or study staff commit errors or makeomissions during a clinical trial that result in harm to trial patients, or patients suffer harm with a delayed onsetafter a clinical trial is completed and the product has obtained regulatory approval, claims for personal injury orproducts liability damages may result. Additionally, if the investigators engage in fraudulent or negligent behavior,trial data may be compromised, which may require us to repeat the clinical trial or subject us to liability or regulatoryaction. We do not believe we are legally responsible for the medical care rendered by such third party investigators,and we would vigorously defend any claims brought against us. However, it is possible we could be found liable forclaims with respect to the actions of third party investigators and the institutions at which clinical trials may beconducted.
Some of our services involve direct interaction with clinical trial patients and operation of a Phase I clinical facility,which could create potential liability that may adversely affect our results of operations and financial condition.We operate a facility where Phase I clinical trials are conducted, which ordinarily involve testing an investigationaldrug, biologic or medical device on a limited number of individuals to evaluate its safety, determine a safe dosagerange and identify side effects. Failure to operate such a facility and clinical trials in accordance with FDA, DEA andother applicable regulations could result in disruptions to our operations. Additionally, we face risks associated withadverse events resulting from the administration of such drugs, biologics and medical devices and the professionalmalpractice of medical care providers. We also directly employ nurses and other trained employees who assist inimplementing the testing involved in our clinical trials, such as drawing blood from subjects. Any professionalmalpractice or negligence by such investigators, nurses or other employees could potentially result in liability to usin the event of personal injury to or death of a subject in clinical trials. This liability, particularly if it were to exceedthe limits of any indemnification agreements and insurance coverage we may have, may adversely affect ourfinancial condition, results of operations and reputation.
29

Our insurance may not cover all of our indemnification obligations and other liabilities associated with ouroperations.We maintain insurance designed to provide coverage for ordinary risks associated with our operations and ourordinary indemnification obligations, which we believe to be customary for our industry. The coverage provided bysuch insurance may not be adequate for all claims we may make or may be contested by our insurance carriers. Ifour insurance is not adequate or available to pay liabilities associated with our operations, or if we are unable topurchase adequate insurance at reasonable rates in the future, our business, financial condition, results ofoperations or cash flows may be materially adversely impacted.
Exchange rate fluctuations may have a material adverse effect on our business, financial condition, results ofoperations or cash flows.For the Successor six months ended June 30, 2016 and the Successor year ended December 31, 2015,approximately 9.2% and 8.4% of our revenue was denominated in currencies other than U.S. dollars, respectively,and 24.5% and 24.9% of our operational costs, including, but not limited to, salaries, wages and other employeebenefits were denominated in foreign currencies, respectively. Of these exposures, 91.4% and 94.9% of our revenuedenominated in foreign currencies, respectively, and 46.0% and 46.8% of our operational costs denominated inforeign currencies, respectively, were Euro denominated. Because a large portion of our net service revenue andexpenses are denominated in currencies other than the U.S. dollar and our financial statements are reported in U.S.dollars, changes in foreign currency exchange rates could significantly affect our financial condition, results ofoperations and cash flows.
The revenue and expenses of our foreign operations are generally denominated in local currencies and translated intoU.S. dollars for financial reporting purposes. Accordingly, exchange rate fluctuations will affect the translation offoreign results into U.S. dollars for purposes of reporting our consolidated results.
We are subject to foreign currency transaction risk for fluctuations in exchange rates during the period of timebetween the consummation and cash settlement of a transaction. We earn revenue from our service contracts over aperiod of several months and, in some cases, over several years. Accordingly, exchange rate fluctuations during suchperiods may affect our profitability with respect to such contracts.
Additionally, the majority of our global contracts are denominated in U.S. dollars or Euros, while the currency usedto fund our operating costs in foreign countries is denominated in various different currencies. Fluctuations in theexchange rates of the currencies we use to contract with our customers and the currencies in which we incur cost tocomplete those contracts can have a significant impact on our results of operations.
We may limit these risks through exchange rate fluctuation provisions stated in our service contracts. We have not,however, mitigated all of our foreign currency transaction risk, and we may experience fluctuations in financialresults from our operations outside the United States and foreign currency transaction risk associated with ourservice contracts.
Our relationships with existing or potential customers who are in competition with each other may adversely impactthe degree to which other customers or potential customers use our services, which may adversely affect our resultsof operations.The biopharmaceutical industry is highly competitive, with companies each seeking to persuade payors, providersand patients that their drug therapies are more cost-effective than competing therapies marketed or being developedby competing firms. In addition to the adverse competitive interests that biopharmaceutical companies have witheach other, these companies also have adverse interests with respect to drug selection, coverage and reimbursementwith other participants in the healthcare industry, including payors and providers. Biopharmaceutical companies alsocompete to be first to the market with new drug therapies. We regularly provide services to biopharmaceuticalcompanies who compete with each other, and we sometimes provide services to such customers regarding competingdrugs in development. Our existing or future relationships with our biopharmaceutical customers may deter otherbiopharmaceutical customers from using our services or, in certain instances, may result in our customers seeking toplace limits on our ability to serve their competitors and other industry participants. In addition, our furtherexpansion into the broader healthcare market may adversely impact our relationships with biopharmaceuticalcustomers, and such customers may elect not to use our services, reduce the scope of services that we provide to
30

them or seek to place restrictions on our ability to serve customers in the broader healthcare market with intereststhat are adverse to theirs. Any loss of customers or reductions in the level of revenues from a customer could have amaterial adverse effect on our business, financial condition, results of operations or cash flows.
If we are unable to successfully integrate potential future acquisitions, our business, financial condition, results ofoperations and cash flows could be adversely affected.We anticipate that a portion of our future growth may come from targeted acquisitions to expand our currentcapabilities and service offerings. The success of any acquisition will depend upon, among other things, our abilityto effectively integrate acquired personnel, operations, products and technologies into our business and to retain thekey personnel and customers of our acquired businesses. In addition, we may be unable to identify suitableacquisition opportunities or obtain any necessary financing on commercially acceptable terms. We may also spendtime and money investigating and negotiating with potential acquisition targets but not complete the transaction.Any acquisition could involve other risks, including, among others, the assumption of additional liabilities andexpenses, difficulties and expenses in connection with integrating the acquired companies and achieving theexpected benefits, issuances of potentially dilutive securities or interest-bearing debt, loss of key employees of theacquired companies, transaction expenses, diversion of management’s attention from other business concerns and,with respect to the acquisition of international companies, the inability to overcome differences in internationalbusiness practices, language and customs. Our failure to successfully integrate potential future acquisitions couldhave an adverse effect on our business, financial condition, results of operations and cash flows.
We have a significant amount of goodwill and intangible assets on our balance sheet, and our results of operationsmay be adversely affected if we fail to realize the full value of our goodwill and intangible assets.Our balance sheet reflects goodwill and intangibles assets of $661.0 million and $161.4 million, respectively, as ofJune 30, 2016. Collectively, goodwill and intangibles assets represented 82.7% of our total assets as of June 30,2016. Our goodwill was recorded in connection with the Transaction. In accordance with U.S. GAAP, goodwill andindefinite lived intangible assets are not amortized, but are subject to a periodic impairment evaluation. We assessthe realizability of our indefinite lived intangible assets and goodwill annually and conduct an interim evaluationwhenever events or changes in circumstances, such as operating losses or a significant decline in earningsassociated with the acquired business or asset, indicate that these assets may be impaired. In addition, we reviewlong-lived assets for impairment whenever events or changes in circumstances indicate that the carrying amount ofthe assets might not be recoverable. If indicators of impairment are present, we evaluate the carrying value inrelation to estimates of future discounted cash flows. Our ability to realize the value of the goodwill and intangibleassets will depend on the future cash flows of our businesses. The carrying amount of the goodwill could be impairedif there is a downturn in our business or our industry or other factors that affect the fair value of our business, inwhich case a charge to earnings would become necessary. If we are not able to realize the value of the goodwill andintangible assets, we may be required to incur material charges relating to the impairment of those assets. Forexample, in conjunction with the 2015 fourth quarter annual assessment of goodwill, we determined that goodwillrelated to our Clinics reporting unit was impaired and we recognized an impairment charge of $9.3 million, whichrepresented 100% of the goodwill that had been allocated to this reporting unit. Such impairment charges in thefuture could materially and adversely affect our business, financial condition, results of operations and cash flows.
Our ability to utilize our net operating loss carryforwards or certain other tax attributes may be limited.Under Sections 382 and 383 of the U.S. Internal Revenue Code of 1986, as amended, if a corporation undergoes an“ownership change” (generally defined as a greater than 50 percentage point change, by value, in the aggregate stockownership of certain shareholders over a three-year period), the corporation’s ability to use its pre-change netoperating loss carryforwards to offset its future taxable income and other pre-change tax attributes may be limited. Wehave experienced at least one ownership change in the past. We may experience additional ownership changes in thefuture (including in connection with this offering). In addition, future changes in our stock ownership (including futuresales by Cinven) could result in additional ownership changes. Any such ownership changes could limit our ability touse our net operating loss carryforwards to offset any future taxable income and other tax attributes. State and foreigntax laws may also impose limitations on our ability to utilize net operating loss carryforwards and other tax attributes.
Our operations involve the use and disposal of hazardous substances and waste which can give rise to liability thatcould adversely impact our financial condition.We conduct activities that have involved, and may continue to involve, the controlled use of hazardous materials andthe creation of hazardous substances, including medical waste and other highly regulated substances. As a result,
31

our operations pose the risk of accidental contamination or injury caused by the release of these materials and/or thecreation of hazardous substances, including medical waste and other highly regulated substances. In the event ofsuch an accident, we could be held liable for damages and cleanup costs which, to the extent not covered byexisting insurance or indemnification, could harm our business. In addition, other adverse effects could result fromsuch liability, including reputational damage resulting in the loss of additional business from certain customers.
The failure of third parties to provide us critical support services could materially adversely affect our business,financial condition, results of operations, cash flows or reputation.
We depend on third parties for support services vital to our business. Such support services include, but are notlimited to, laboratory services, third-party transportation and travel providers, technology providers, freight forwardersand customs brokers, drug depots and distribution centers, suppliers or contract manufacturers of drugs for patientsparticipating in clinical trials and providers of licensing agreements, maintenance contracts or other services. Inaddition, we also rely on third-party CROs and other contract clinical personnel for clinical services either in regionswhere we have limited resources, or in cases where demand cannot be met by our internal staff. The failure of any ofthese third parties to adequately provide us critical support services could have a material adverse effect on ourbusiness, financial condition, results of operations, cash flows or reputation.
We have only a limited ability to protect our intellectual property rights, and these rights are important to oursuccess.
Our success depends, in part, upon our ability to develop, use and protect our proprietary methodologies, analytics,systems, technologies and other intellectual property. Existing laws of the various countries in which we provideservices or solutions offer only limited protection of our intellectual property rights, and the protection in somecountries may be very limited. We rely upon a combination of trade secrets, confidentiality policies, nondisclosure,invention assignment and other contractual arrangements, and copyright, trademark and trade secret laws, to protectour intellectual property rights. These laws are subject to change at any time and certain agreements may not be fullyenforceable, which could further restrict our ability to protect our innovations. Our intellectual property rights may notprevent competitors from independently developing services similar to or duplicative of ours. Further, the steps wetake in this regard might not be adequate to prevent or deter infringement or other misappropriation of our intellectualproperty by competitors, former employees or other third parties, and we might not be able to detect unauthorized useof, or take appropriate and timely steps to enforce, our intellectual property rights. Enforcing our rights might alsorequire considerable time, money and oversight, and we may not be successful in enforcing our rights.
The results of the United Kingdom’s referendum on withdrawal from the European Union may have a negative effecton global economic conditions, financial markets and our business.
In June 2016, a majority of voters in the United Kingdom elected to withdraw from the European Union, or the EU,in a national referendum. The referendum was advisory, and the terms of any withdrawal are subject to a negotiationperiod that could last at least two years after the government of the United Kingdom formally initiates a withdrawalprocess. Nevertheless, the referendum has created significant uncertainty about the future relationship between theUnited Kingdom and the EU, including with respect to the laws and regulations that will apply as the UnitedKingdom determines which EU laws to replace or replicate in the event of a withdrawal. The referendum has alsogiven rise to calls for the governments of other EU member states to consider withdrawal. These developments, orthe perception that any of them could occur, have had and may continue to have a material adverse effect on globaleconomic conditions and the stability of global financial markets, and may significantly reduce global marketliquidity and restrict the ability of key market participants to operate in certain financial markets. Any of thesefactors could depress economic activity and restrict our access to capital, which could have a material adverse effecton our business, financial condition and results of operations and reduce the price of our common stock.
Potential future investments in our customers’ businesses or products could have a negative impact on our financialresults.
We have in the past and may in the future enter into arrangements with our customers or other drug, biologic ormedical device companies in which we take on payment risk by making strategic investments in our customers orother drug companies, providing flexible payment terms or fee financing to customers or other companies, orentering into other risk sharing arrangements on trial execution. Our financial results would be adversely affected ifthe amount realized from any such risk sharing arrangement was less than the value of our services under thecontract related to such arrangement.
32

Our operations might be affected by the occurrence of a natural disaster or other catastrophic event.We depend on our customers, investigators, laboratories and other facilities for the continued operation of ourbusiness. Although we have contingency plans in place for natural disasters or other catastrophic events, theseevents, including terrorist attacks, pandemic flu, hurricanes, floods and ice and snow storms, could neverthelessdisrupt our operations or those of our customers, investigators and collaboration partners, which could also affect us.Even though we carry business interruption insurance policies and typically have provisions in our contracts thatprotect us in certain events, we might suffer losses as a result of business interruptions that exceed the coverageavailable under our insurance policies or for which we do not have coverage. Any natural disaster or catastrophicevent affecting us or our customers, investigators or collaboration partners could have a significant negative impacton our operations and financial performance.
Risks Relating to Our Industry
Outsourcing trends in the biopharmaceutical industry and changes in aggregate expenditures and R&D budgetscould adversely affect our operating results and growth rate.Our revenues depend on the level of R&D expenditures, size of the drug development pipelines and outsourcingtrends of the biopharmaceutical industry, including the amount of such R&D expenditures that is outsourced andsubject to competitive bidding among CROs. Accordingly, economic factors and industry trends that affectbiopharmaceutical companies affect our business. For example, if biopharmaceutical companies become less able toaccess capital in the future, they may commit less capital to our services going forward. Also, biopharmaceuticalcompanies continue to seek long-term strategic collaborations with global CROs with favorable pricing terms. Manyof our competitors seek out these collaborations, while we generally do not. If our competitors can successfully enterinto these collaborations, it may reduce the share of the biopharmaceutical outsourcing business that we mightotherwise be positioned to capture.
In addition, if the biopharmaceutical industry reduces its outsourcing of clinical trials or such outsourcing fails togrow at projected or expected rates, or at all, our business, financial condition, results of operations and cash flowscould be materially and adversely affected. We may also be negatively impacted by consolidation and other factors inthe biopharmaceutical industry, which may slow decision making by our customers, result in the delay orcancellation of existing projects, cause reductions in overall R&D expenditures or lead to increased pricing pressures.Further, in the event that one of our customers combines with a company that is using the services of one of ourcompetitors, the combined company could decide to use the services of that competitor or another provider. All ofthese events could adversely affect our business, financial condition, cash flows or results of operations.
We face intense competition in many areas of our business and, if we do not compete effectively, our business maybe harmed.The CRO industry is highly competitive. We often compete for business with other CROs as well as internaldevelopment departments at some of our customers, some of which could be considered large CROs in their ownright. We also compete with universities and teaching hospitals. Some of these competitors have greater financialresources and a wider range of service offerings over a greater geographic area than we do. If we do not competesuccessfully, our business will suffer. The industry is highly fragmented, with numerous smaller specializedcompanies and a handful of full-service companies with global capabilities similar to ours. Increased competitionhas led to price and other forms of competition, such as acceptance of less favorable contract terms, which couldadversely affect our operating results. In recent years, our industry has experienced consolidation. This trend is likelyto produce more competition from the resulting larger companies. Further, certain of our key competitors are privateand, therefore, they do not contend with the cost pressures of being a public company. We compete with both largeCROs and mid-sized CROs, and have increasingly faced more competition from larger CROs. Our ability to continueto grow and perform effectively will directly impact our success against our competitors. In addition, there are fewbarriers to entry for smaller specialized companies considering entering the industry. Because of their size and focus,small CROs might compete effectively against larger companies such as us, especially in lower cost geographicareas, which could have a material adverse effect on our business.
33

We may be affected by healthcare reform and potential additional regulatory reforms, which may adversely impactthe biopharmaceutical industry or otherwise reduce the need for our services or negatively impact our profitability.Numerous government bodies are considering or have adopted various healthcare reforms and may undertake, or arein the process of undertaking, efforts to control growing healthcare costs through legislation, regulation and voluntaryagreements with healthcare providers and biopharmaceutical companies, including many of our customers. By wayof example, in March 2010, the Patient Protection and Affordable Care Act, as amended by the Health Care andEducation Reconciliation Act, or collectively, the Affordable Care Act, was signed into law, which, among otherthings, expanded, over time, health insurance coverage, imposed health industry cost containment measures,enhanced remedies against healthcare fraud and abuse, added new transparency requirements for healthcare andhealth insurance industries, imposed new taxes and fees on pharmaceutical and medical device manufacturers,added new requirements for certain applicable drug and device manufacturers to disclose payments to physicians,including principal investigators, and imposed additional health policy reforms, any of which may significantlyimpact the biopharmaceutical industry. We are uncertain as to the full effects of these reforms on our business andare unable to predict what legislative proposals, if any, will be adopted in the future. If regulatory cost containmentefforts limit the profitability of new drugs, our customers may reduce their R&D expenditures, which could reducethe business they outsource to us. Similarly, if regulatory requirements for product testing are relaxed or harmonizedacross jurisdictions, or simplified drug approval procedures are adopted, the demand for our services could decrease.
Government bodies may also adopt healthcare legislation or regulations that are more burdensome than existingregulations. For example, product safety concerns and recommendations by the Drug Safety Oversight Board couldchange the regulatory environment for drug products, and new or heightened regulatory requirements may increaseour expenses or limit our ability to offer some of our services. Additionally, new or heightened regulatoryrequirements may have a negative impact on the ability of our customers to conduct industry sponsored clinicaltrials, which could reduce the need for our services.
Recent consolidation in the biopharmaceutical industry could lead to a reduction in our revenues.The biopharmaceutical industry is currently undergoing a period of increased merger activity. Several largebiopharmaceutical companies have recently completed mergers and acquisitions that will consolidate theoutsourcing trends and R&D expenditures into fewer companies, and many larger and medium sizedbiopharmaceutical companies have been acquiring smaller biopharmaceutical companies. As a result of this andfuture consolidations, our customer diversity may decrease and our business may be adversely affected.
If we fail to comply with federal, state and foreign healthcare laws, including fraud and abuse laws, we could facesubstantial penalties and our business, results of operations, financial condition and prospects could be adverselyaffected.Even though we do not order healthcare services or bill directly to Medicare, Medicaid or other third party payors,certain federal and state healthcare laws and regulations pertaining to fraud and abuse are applicable to ourbusiness. We could be subject to healthcare fraud and abuse laws of both the federal government and the states inwhich we conduct our business. Because of the breadth of these laws and the narrowness of available statutory andregulatory exceptions, it is possible that some of our business activities could be subject to challenge under one ormore of such laws. If we or our operations are found to be in violation of any of the laws described above or any othergovernmental regulations that apply to us, we may be subject to penalties, including civil and criminal penalties,damages, fines, imprisonment and the curtailment or restructuring of our operations, any of which could materiallyadversely affect our ability to operate our business and our financial results.
Current and proposed laws and regulations regarding the protection of personal data could result in increased risks ofliability or increased cost to us or could limit our service offerings.The confidentiality, collection, use and disclosure of personal data, including clinical trial patient-specificinformation, are subject to governmental regulation generally in the country in which the personal data was collectedor used. For example, U.S. federal regulations under the Health Insurance Portability and Accountability Act of1996, as amended by the Health Information Technology for Economic and Clinical Health Act of 2009 and theirimplementing regulations, including the Privacy and Security Rules, or collectively, HIPAA, generally requireindividuals’ written authorization, in addition to any required informed consent, before protected health informationmay be used for research and such regulations specify standards for de-identifications and for limited data sets. Wemay also be subject to applicable state privacy and security laws and regulations in states in which we operate. Two
34

of our subsidiaries, Medpace Clinical Pharmacology, LLC and C-MARC, LLC, are covered entities under HIPAA.Further, because of amendments to the HIPAA Privacy and Security Rules that were promulgated on January 25,2013, known as the Omnibus Final Rule, service providers to covered entities under HIPAA, known as businessassociates, are now directly subject to HIPAA. There are some instances where we may be a HIPAA “businessassociate” of a “covered entity,” meaning that we may be directly liable for any breaches of protected healthinformation and other HIPAA violations. We are also liable contractually under any business associate agreements wehave signed with covered entities. If we are determined to be a business associate, we would be subject to HIPAA’senforcement scheme, which, as amended, can result in up to $1.5 million in annual civil penalties for each HIPAAviolation. A single breach incident can result in multiple violations of the HIPAA standards, meaning that penaltiescould be in excess of $1.5 million.
HIPAA also authorizes state attorneys general to file suit on behalf of their residents for violations. Courts are able toaward damages, costs and attorneys’ fees related to violations of HIPAA in such cases. While HIPAA does not createa private right of action allowing individuals to file suit against us in civil court for violations of HIPAA, its standardshave been used as the basis for duty of care cases in state civil suits such as those for negligence or recklessness inthe misuse or breach of protected health information. In addition, HIPAA mandates that the Secretary of the U.S.Department of Health and Human Services conduct periodic compliance audits of HIPAA covered entities and theirbusiness associates for compliance with the HIPAA privacy and security standards.
In the EU, personal data includes any information that relates to an identified or identifiable natural person withhealth information carrying additional obligations, including obtaining the explicit consent from the individual forcollection, use or disclosure of the information. In addition, we are subject to EU rules with respect to export of suchdata out of the EU. Such data export rules are constantly changing, for example, following a decision of theEuropean Court of Justice in October 2015, transferring personal data to U.S. companies like us that had certifiedas a member of the EU-U.S. Safe Harbor Scheme was declared invalid and the other methods to permit transfer arenow under review. In February 2016, the European Commission issued the proposed legal texts of the EU-U.S.Privacy Shield, which is intended to replace the U.S. Safe Harbor Scheme. These legal texts are currently underreview by the European legislative bodies and it is unclear when they will be approved and when data exports out ofthe EU will be allowed to take place under the new framework. The United States, the EU and its member states,and other countries where we have operations, such as Singapore and Russia, continue to issue new privacy and dataprotection rules and regulations that relate to personal data and health information. Failure to comply with certaincertification/registration and annual re-certification/registration provisions associated with these data protection andprivacy regulations and rules in various jurisdictions, or to resolve any serious privacy or security complaints, couldsubject us to regulatory sanctions, criminal prosecution or civil liability. Federal, state and foreign governments maypropose or have adopted additional legislation governing the collection, possession, use or dissemination of personaldata, such as personal health information, and personal financial data as well as security breach notification rulesfor loss or theft of such data. Additional legislation or regulation of this type might, among other things, require us toimplement new security measures and processes or bring within the legislation or regulation de-identified health orother personal data, each of which may require substantial expenditures or limit our ability to offer some of ourservices. Additionally, if we violate applicable laws, regulations or duties relating to the use, privacy or security ofpersonal data, we could be subject to civil liability or criminal prosecution, be forced to alter our business practicesand suffer reputational harm. The laws in the EU are under reform and from early 2018 onwards, we will be subjectto the requirements of the General Data Protection Regulation, or GDPR, because we are processing data in the EU.The GDPR increases the deadline for data breach notifications, imposes additional obligations when we processpersonal data on behalf of our customers, including in relation to security measures, and increases administrativeburdens on companies processing personal data. If we do not comply with our obligations under the GDPR we couldbe exposed to significant fines of up to 20 million EUR or up to 4% of the total worldwide annual turnover of thepreceding financial year, whichever is higher.
The biopharmaceutical industry has a history of patent and other intellectual property litigation, and we might beinvolved in costly intellectual property lawsuits.The biopharmaceutical industry has a history of intellectual property litigation, and these lawsuits will likely continuein the future. Accordingly, even without wrongdoing on our part, we may face patent infringement suits bycompanies that have patents for similar business processes or other suits alleging infringement of their intellectualproperty rights. Legal proceedings relating to intellectual property could be expensive, take significant time and
35

divert management’s attention from other business concerns, regardless of the outcome of the litigation. If we do notprevail in an infringement lawsuit brought against us, we might have to pay substantial damages, and we could berequired to stop the infringing activity or obtain a license to use technology on unfavorable terms. Further, ourcustomers could be similarly exposed to intellectual property suits and the resulting economic and operational straindefending such claims could negatively impact such customers’ ability to fund or continue ongoing clinical trials onwhich we are working.
Actions by regulatory authorities or customers to limit the scope of or withdraw an approved drug, biologic or medicaldevice from the market could result in a loss of revenue.Government regulators have the authority, after approving a drug, biologic or medical device, to limit its indicationfor use by requiring additional labeled warnings or to withdraw the product’s approval for its approved indicationbased on safety or other concerns. Similarly, customers may act to voluntarily limit the availability of approvedproducts or withdraw them from the market after we begin our work. If we are providing services to customers forproducts that are limited in availability or withdrawn, we may be required to narrow the scope of or terminate ourservices with respect to such products, which would prevent us from earning the full amount of net service revenueanticipated under the related service contracts.
If we do not keep pace with rapid technological changes, our services may become less competitive or obsolete.The biopharmaceutical industry generally, and drug development and clinical research more specifically, are subjectto rapid technological changes. Our current competitors or other businesses might develop technologies or servicesthat are more effective or commercially attractive than, or render obsolete, our current or future technologies andservices. If our competitors introduce superior technologies or services and if we cannot make enhancements toremain competitive, our competitive position would be harmed. If we are unable to compete successfully, we maylose customers or be unable to attract new customers, which could lead to a decrease in our revenue and have amaterial adverse effect on our financial condition.
Circumstances beyond our control could cause the CRO industry to suffer reputational or other harm that couldresult in an industry-wide reduction in demand for CRO services, which could harm our business.Demand for our services may be affected by perceptions of our customers regarding the CRO industry as a whole. Forexample, other CROs could engage in conduct that could render our customers less willing to do business with us orany CRO. Likewise, a widely reported injury to clinical trial participants could result in negative perceptions ofclinical trial activity, thereby adversely impacting our industry. One or more CROs could engage in or fail to detectmalfeasance, such as inadequately monitoring sites, producing inaccurate databases or analysis, falsifying patientrecords, and performing incomplete lab work, or take other actions that would reduce the confidence of ourcustomers in the CRO industry. As a result, the willingness of biopharmaceutical companies to outsource R&Dservices to CROs could diminish and our business could thus be harmed materially by events outside our control.
Risks Relating to Our IndebtednessOur indebtedness could adversely affect our financial condition and prevent us from fulfilling our debt obligationsand may otherwise restrict our activities.Our Senior Secured Credit Facilities consist of a $60.0 million Senior Secured Revolving Credit Facility maturing inApril 2019 and a $530.0 million Senior Secured Term Loan Facility maturing in April 2021. On an as adjustedbasis, after giving effect to this offering and the use of proceeds therefrom, as of June 30, 2016, we would have hadapproximately $225.7 million of outstanding indebtedness under our Senior Secured Term Loan Facility and noborrowings outstanding under our Senior Secured Revolving Credit Facility. In addition, we would have had up to$60.0 million of additional borrowing capacity available under our Senior Secured Revolving Credit Facility. Oursubstantial indebtedness could adversely affect our financial condition and thus make it more difficult for us tosatisfy our obligations with respect to our Senior Secured Credit Facilities. If our cash flow is not sufficient to serviceour debt and adequately fund our business, we may be required to seek further additional financing or refinancing ordispose of assets. We might not be able to influence any of these alternatives on satisfactory terms or at all. Oursubstantial indebtedness could also:
■ increase our vulnerability to adverse general economic, industry or competitive developments;■ require us to dedicate a more substantial portion of our cash flows from operations to payments on our
indebtedness, thereby reducing the availability of our cash flows to fund working capital, investments,acquisitions, capital expenditures, and other general corporate purposes;
36

■ limit our ability to make required payments under our existing contractual commitments, including ourexisting long-term indebtedness;
■ limit our ability to fund a change of control offer;■ require us to sell certain assets;■ restrict us from making strategic investments, including acquisitions or cause us to make non-strategic
divestitures;■ limit our flexibility in planning for, or reacting to, changes in market conditions, our business and the
industry in which we operate;■ place us at a competitive disadvantage compared to our competitors that have less debt;■ cause us to incur substantial fees from time to time in connection with debt amendments or refinancings;■ increase our exposure to rising interest rates because a portion of our borrowings is at variable interest rates; and■ limit our ability to borrow additional funds or to borrow on terms that are satisfactory to us.
For more information about our indebtedness, see “Management’s Discussion and Analysis of Financial Conditionand Results of Operations—Liquidity and Capital Resources—Indebtedness.”
Despite our current level of indebtedness, we may incur more debt and undertake additional obligations. Incurringsuch debt or undertaking such additional obligations could further exacerbate the risks to our financial condition.Although the credit agreement governing the Senior Secured Credit Facilities contains restrictions on our incurrenceof additional indebtedness, these restrictions are subject to a number of qualifications and exceptions and theindebtedness incurred in compliance with these restrictions could increase. To the extent new debt is added to ourcurrent debt levels, the risks to our financial condition would increase.
While the credit agreement governing the Senior Secured Credit Facilities also contains restrictions on our ability tomake loans and investments, these restrictions are subject to a number of qualifications and exceptions, and theinvestments incurred in compliance with these restrictions could be substantial.
Covenant restrictions under our Senior Secured Credit Facilities may limit our ability to operate our business.The agreement governing our Senior Secured Credit Facilities contains covenants that may restrict our ability to,among other things:
■ create, incur or assume any lien upon any of our property, assets or revenue;■ make or hold certain investments;■ incur or assume any indebtedness;■ merge, dissolve, liquidate or consolidate with or into another person;■ make certain dispositions of property or other assets (including sale leaseback transactions);■ declare or make certain restricted payments, including dividends;■ enter into certain transactions with affiliates;■ prepay subordinated debt;■ enter into burdensome agreements;■ engage in any material line of business substantially different from our currently conducted business; or■ change our fiscal year.
In addition, if we have drawn greater than 30% of the commitments under the Senior Secured Revolving CreditFacility as of the last date of any quarter, then we are required to report compliance with a financial covenant that istested at the end of such quarter. This financial covenant requires us to maintain a funded first lien net debt toconsolidated EBITDA leverage ratio of less than or equal to 8.00:1.00 for any fiscal quarter ending on or prior toMarch 31, 2016 and 7.50:1.00, thereafter. As of June 30, 2016, we maintained a net debt to consolidated EBITDAleverage ratio, as defined under the Senior Secured Credit Facilities, of 2.95:1.00. As of June 30, 2016, we were incompliance with all covenants under our Senior Secured Credit Agreement.
Although the covenants in our Senior Secured Credit Facilities are subject to various exceptions, we cannot assureyou that these covenants will not adversely affect our ability to finance future operations or capital needs or to
37

engage in other activities that may be in our best interest. In addition, in certain circumstances, our long-term debtrequires us to maintain a specified financial ratio and satisfy certain financial condition tests, which may requirethat we take action to reduce our debt or to act in a manner contrary to our business objectives. A breach of any ofthese covenants could result in a default under our Senior Secured Credit Facilities. If an event of default under ourSenior Secured Credit Facilities occurs, the lenders thereunder could elect to declare all amounts outstandingthereunder, together with accrued interest, to be immediately due and payable. In such case, we might not havesufficient funds to repay all the outstanding amounts. In addition, our Senior Secured Credit Facilities are securedby first priority security interests on substantially all of our assets, including the capital stock of certain of oursubsidiaries. If an event of default under our Senior Secured Credit Facilities occurs, the lenders thereunder couldexercise their rights under the related security documents. Any acceleration of amounts due under the SeniorSecured Credit Facilities or the substantial exercise by the lenders of their rights under the security documentswould likely have a material adverse effect on us.
We may not be able to generate sufficient cash to service all of our indebtedness, and may be forced to take otheractions to satisfy our obligations under our indebtedness that may not be successful.Our ability to satisfy our debt obligations will depend upon, among other things:
■ our future financial and operating performance, which will be affected by prevailing economic conditionsand financial, business, regulatory and other factors, many of which are beyond our control; and
■ the future availability of borrowings under our Senior Secured Credit Facilities, which depends on, amongother things, our complying with the covenants in those facilities.
We cannot assure you that our business will generate sufficient cash flow from operations, or that future borrowingswill be available to us under our Senior Secured Credit Facilities or otherwise, in an amount sufficient to fund ourliquidity needs.
If our cash flows and capital resources are insufficient to service our indebtedness, we may be forced to reduce ordelay capital expenditures, sell assets, seek additional capital or restructure or refinance our indebtedness. Thesealternative measures may not be successful and may not permit us to meet our scheduled debt service obligations.Our ability to restructure or refinance our debt will depend on the condition of the capital markets and our financialcondition at such time. Any refinancing of our debt could be at higher interest rates and may require us to complywith more onerous covenants, which could further restrict our business operations. In addition, the terms of existingor future debt agreements, may restrict us from adopting some of these alternatives. In the absence of suchoperating results and resources, we could face substantial liquidity problems and might be required to dispose ofmaterial assets or operations to meet our debt service and other obligations. We may not be able to consummatethose dispositions for fair market value or at all, and any proceeds that we could realize from any such dispositionsmay not be adequate to meet our debt service obligations then due.
Interest rate fluctuations may affect our results of operations and financial condition.Because a substantial portion of our debt is variable-rate debt, fluctuations in interest rates could have a materialeffect on our business. As a result, we may incur higher interest costs if interest rates increase. These higher interestcosts could have a material adverse impact on our financial condition and the levels of cash we maintain for workingcapital.
We are dependent upon our lenders for financing to execute our business strategy and meet our liquidity needs. Ifour lenders are unable to fund borrowings under their credit commitments or we are unable to borrow, it couldnegatively impact our business.During periods of volatile credit markets, there is risk that any lenders, even those with strong balance sheets andsound lending practices, could fail or refuse to honor their legal commitments and obligations under existing creditcommitments, including but not limited to, extending credit up to the maximum permitted by a credit facility. If ourlenders are unable to fund borrowings under their revolving credit commitments or we are unable to borrow (such ashaving insufficient capacity under our borrowing base), it could be difficult in such environments to obtain sufficientliquidity to meet our operational needs.
38

Risks Relating to Our Common Stock and This OfferingCinven and our Chief Executive Officer and founder will collectively control a substantial majority of our outstandingcommon stock following this offering and their interests may be different from or conflict with those of our othershareholders.Upon the completion of this offering, Cinven will own approximately 58.0% of the outstanding shares of our commonstock (or 56.5% if the underwriters exercise their option to purchase additional shares in full) and Dr. August J.Troendle, our Chief Executive Officer and founder, through his direct ownership of 351,851 shares of our commonstock and his beneficial ownership of 9,201,377 shares of our common stock held by MPI, will controlapproximately 24.1% of the outstanding shares of our common stock (or 23.5% if the underwriters exercise theiroption to purchase additional shares in full). Additionally, upon a distribution of our common stock held by MPI, ourChief Executive Officer would receive approximately 73% of such shares. Accordingly, both Cinven and Dr. Troendlewill be able to exert a significant degree of influence or actual control over our management and affairs and willcontrol all corporate actions requiring shareholder approval, irrespective of how our other shareholders may vote,including:
■ subject to the voting arrangements described in “Certain Relationships and Related Person Transactions,”the election and removal of directors and the size of our board of directors, or the Board;
■ any amendment of our articles of incorporation or bylaws; or■ the approval of mergers and other significant corporate transactions, including a sale of substantially all of
our assets.
Dr. Troendle has indicated an interest in purchasing shares of our common stock in this offering at the initial publicoffering price. If he were to purchase all of the shares he has indicated an interest in purchasing in this offering,assuming an initial public offering price of $21.50 per share, which is the midpoint of the price range set forth onthe cover page of this prospectus, he would purchase an aggregate of approximately 930,233 shares, and as a resultthe percentage of the outstanding shares of our common stock that he would control directly or through hisbeneficial ownership of shares of our common stock held by MPI would increase to approximately 26.4% (or 25.8%if the underwriters exercise their option to purchase additional shares in full).
Moreover, Cinven’s and Dr. Troendle’s share ownership may also adversely affect the trading price for our commonstock to the extent investors perceive disadvantages in owning shares of a company with controlling shareholders. Inaddition, we have historically paid an affiliate of Cinven an annual fee for certain advisory and consulting servicespursuant to an advisory services agreement, or the Advisory Services Agreement. See “Certain Relationships andRelated Person Transactions—Advisory Fees.” The Advisory Services Agreement will be terminated in connection withthe consummation of this offering. In addition, Cinven is in the business of making investments in companies andmay, from time to time, acquire interests in businesses that directly or indirectly compete with our business, as wellas businesses that are significant existing or potential customers. Cinven may acquire or seek to acquire assets thatwe seek to acquire and, as a result, those acquisition opportunities may not be available to us or may be moreexpensive for us to pursue, and as a result, the interests of Cinven may not coincide and may even conflict with theinterests of our other shareholders.
Upon the listing of our common stock on NASDAQ, we will be a “controlled company” within the meaning of the rulesand, as a result, will qualify for, and intend to rely on, exemptions from certain corporate governance requirements. Youwill not have the same protections afforded to shareholders of companies that are subject to such requirements.We understand that, substantially concurrently with the closing of this offering, Cinven and Dr. August J. Troendle,our Chief Executive Officer and founder, intend to enter into a voting agreement, or the Voting Agreement. Pursuantto the terms of the Voting Agreement, for so long as Cinven and Dr. Troendle collectively hold at least 40% of ouroutstanding voting shares, or the Voting Agreement is otherwise terminated in accordance with its terms, Cinven willagree to vote its shares of our common stock in favor of the election of Dr. Troendle to our Board (so long asDr. Troendle remains our Chief Executive Officer) upon his nomination by our Board and Dr. Troendle will agree tovote his shares of our common stock in favor of the election of the directors affiliated with Cinven upon theirnomination by our Board; provided, that in the event that Cinven holds less than (a) 40% but greater than or equalto 25% of our voting shares then outstanding, Dr. Troendle shall be required to vote for two directors affiliated withCinven, after giving effect to the directors then sitting on the Board, (b) 25% but greater than or equal to 10% of ourvoting shares then outstanding, Dr. Troendle shall be required to vote for one director affiliated with Cinven, after
39

giving effect to the directors then sitting on the Board and (c) 10% of our voting shares then outstanding, Dr.Troendle shall not be required to vote for any directors affiliated with Cinven.
Because of the Voting Agreement and the aggregate voting power of Cinven and Dr. Troendle, we are considered a“controlled company” within the meaning of the corporate governance standards of NASDAQ. Under these rules, acompany of which more than 50% of the voting power for the election of directors is held by an individual, group oranother company is a “controlled company” and may elect not to comply with certain corporate governancerequirements, including the requirements that, within one year of the date of the listing of our common stock:
■ we have a Board that is composed of a majority of “independent directors,” as defined under the rules ofsuch exchange;
■ we have a compensation committee that is composed entirely of independent directors with a writtencharter addressing the committee’s purpose and responsibilities; and
■ director nominations be made, or recommended to the full Board, by our independent directors or by anominating and corporate governance committee that is composed entirely of independent directors with awritten charter addressing the committee’s purpose and responsibilities.
After we cease to be a “controlled company,” we will be required to comply with the above-referenced requirementswithin one year.
Following this offering, we will not have a nominating and corporate governance committee. Accordingly, you will nothave the same protections afforded to shareholders of companies that are subject to all of the corporate governancerequirements of NASDAQ. Cinven and Dr. Troendle, however, are not subject to any contractual obligation to retaintheir controlling interest, except that they have agreed, subject to certain exceptions, not to sell or otherwise disposeof any shares of our common stock or other capital stock or other securities exercisable or convertible therefor for aperiod of at least 180 days after the date of this prospectus without the prior written consent of Jefferies LLC.Except for this brief period, there can be no assurance as to the period of time during which Cinven and Dr. Troendlewill maintain their ownership of our common stock following the offering. As a result, there can be no assurance asto the period of time during which we will be able to avail ourselves of the controlled company exemptions.
Our anti-takeover provisions could prevent or delay a change in control of our company, even if such change incontrol would be beneficial to our shareholders.
Provisions of our amended and restated certificate of incorporation and amended and restated bylaws, as they will bein effect upon completion of this offering, as well as provisions of Delaware law could discourage, delay or prevent amerger, acquisition or other change in control of our company, even if such change in control would be beneficial toour shareholders. These provisions include:
■ authorizing the issuance of “blank check” preferred stock that could be issued by our Board to increase thenumber of outstanding shares and thwart a takeover attempt;
■ establishing a classified Board so that not all members of our Board are elected at one time;■ the removal of directors only for cause;■ prohibiting the use of cumulative voting for the election of directors;■ limiting the ability of shareholders to call special meetings or amend our bylaws;■ requiring all shareholder actions to be taken at a meeting of our shareholders and not by written consent;
and■ establishing advance notice and duration of ownership requirements for nominations for election to the
Board or for proposing matters that can be acted upon by shareholders at shareholder meetings.
These provisions could also discourage proxy contests and make it more difficult for you and other shareholders toelect directors of your choosing and cause us to take other corporate actions you desire. In addition, because ourBoard is responsible for appointing the members of our management team, these provisions could in turn affect anyattempt by our shareholders to replace current members of our management team.
In addition, the Delaware General Corporation Law, or the DGCL, to which we are subject, prohibits us, except underspecified circumstances, from engaging in any mergers, significant sales of stock or assets or business combinations
40

with any shareholder or group of shareholders who owns at least 15% of our common stock for three years followingtheir becoming the owner of 15% of our common stock.
Cinven and our non-employee directors may acquire interests and positions that could present potential conflictswith our and our shareholders’ interests.Cinven and our non-employee directors make investments in companies and may, from time to time, acquire andhold interests in businesses that compete directly or indirectly with us. Cinven and our non-employee directors mayalso pursue, for their own accounts, acquisition opportunities that may be complementary to our business, and as aresult, those acquisition opportunities might not be available to us. Our organizational documents contain provisionsrenouncing any interest or expectancy held by Cinven or by our non-employee directors in corporate opportunities.Accordingly, the interests of Cinven and our non-employee directors may supersede ours, causing Cinven or itsaffiliates or our non-employee directors and their affiliates to compete against us or to pursue opportunities insteadof us, for which we have no recourse. Such actions on the part of Cinven or our non-employee directors and inactionon our part could have a material adverse effect on our business, financial condition, results of operations and cashflows.
Full-time investment professionals of Cinven occupy three seats on our Board. Because Cinven could invest inentities that directly or indirectly compete with us, when conflicts arise between the interests of Cinven and theinterests of our shareholders, these directors may not be disinterested.
We may issue shares of preferred stock in the future, which could make it difficult for another company to acquire usor could otherwise adversely affect holders of our common stock, which could depress the price of our commonstock.Our amended and restated certificate of incorporation will authorize us to issue one or more series of preferred stock.Our Board will have the authority to determine the preferences, limitations and relative rights of the shares ofpreferred stock and to fix the number of shares constituting any series and the designation of such series, withoutany further vote or action by our shareholders. Our preferred stock could be issued with voting, liquidation, dividendand other rights superior to the rights of our common stock. The potential issuance of preferred stock may delay orprevent a change in control of us, discourage bids for our common stock at a premium to the market price, andmaterially and adversely affect the market price and the voting and other rights of the holders of our common stock.
The provision of our amended and restated certificate of incorporation requiring exclusive venue in the Court ofChancery in the State of Delaware for certain types of lawsuits may have the effect of discouraging lawsuits againstour directors and officers.Our amended and restated certificate of incorporation will require, to the fullest extent permitted by law, that (i) anyderivative action or proceeding brought on our behalf, (ii) any action asserting a claim of breach of a fiduciary dutyowed by any of our directors, officers or other employees to us or our shareholders, (iii) any action asserting a claimagainst us arising pursuant to any provision of the DGCL or our amended and restated certificate of incorporation orthe bylaws or (iv) any action asserting a claim against us governed by the internal affairs doctrine will have to bebrought only in the Court of Chancery in the State of Delaware. Although we believe this provision benefits us byproviding increased consistency in the application of Delaware law in the types of lawsuits to which it applies, theprovision may have the effect of discouraging lawsuits against our directors and officers.
If you purchase shares of common stock sold in this offering, you will incur immediate and substantial dilution.Dilution is the difference between the offering price per share and the net tangible book value per share of ourcommon stock immediately after the offering. The price you pay for shares of our common stock sold in this offeringis substantially higher than our net tangible book value per share immediately after this offering. If you purchaseshares of common stock in this offering, you will incur immediate and substantial dilution in the amount of $(28.14)per share based upon an assumed initial public offering price of $21.50 per share (the midpoint of the price rangelisted on the cover page of this prospectus). In addition, you may also experience additional dilution, or potentialdilution, upon future equity issuances to investors or to our employees and directors under the Plan and any otherequity incentive plans we may adopt. As a result of this dilution, investors purchasing shares of common stock inthis offering may receive significantly less than the full purchase price that they paid for the stock purchased in thisoffering in the event of liquidation. See “Dilution.”
41

Failure to establish and maintain effective internal controls in accordance with Section 404 of the Sarbanes-OxleyAct could have a material adverse effect on our business and stock price.We are not currently required to comply with the rules of the U.S. Securities and Exchange Commission, or the SEC,implementing Section 404 of the Sarbanes-Oxley Act of 2002, or the Sarbanes-Oxley Act, and are therefore notrequired to make a formal assessment of the effectiveness of our internal control over financial reporting for thatpurpose. Upon becoming a public company, we will be required to comply with the SEC’s rules implementingSections 302 and 404 of the Sarbanes-Oxley Act, which will require management to certify financial and otherinformation in our quarterly and annual reports and provide an annual management report on the effectiveness ofcontrols over financial reporting. Though we will be required to disclose changes made in our internal controls andprocedures on a quarterly basis, we will not be required to make our first annual assessment of our internal control overfinancial reporting pursuant to Section 404 until the year following our first annual report required to be filed with theSEC. Additionally, as an emerging growth company, our independent registered public accounting firm will not berequired to formally attest to the effectiveness of our internal control over financial reporting pursuant to Section 404until the later of the year following our first annual report required to be filed with the SEC or the date we are no longeran emerging growth company. At such time, our independent registered public accounting firm may issue a report thatis adverse in the event it is not satisfied with the level at which our controls are documented, designed or operating.
To comply with the requirements of being a public company, we have undertaken various actions, and may need to takeadditional actions, such as implementing new internal controls and procedures and hiring additional accounting orinternal audit staff. Testing and maintaining internal control can divert our management’s attention from other mattersthat are important to the operation of our business. Additionally, when evaluating our internal control over financialreporting, we may identify material weaknesses that we may not be able to remediate in time to meet the applicabledeadline imposed upon us for compliance with the requirements of Section 404. If we are unable to comply with therequirements of Section 404 in a timely manner or assert that our internal control over financial reporting is effective,or if our independent registered public accounting firm is unable to express an opinion as to the effectiveness of ourinternal control over financial reporting once we are no longer an emerging growth company, investors may loseconfidence in the accuracy and completeness of our financial reports and the market price of our common stock couldbe negatively affected, and we could become subject to investigations by the stock exchange on which our securitiesare listed, the SEC or other regulatory authorities, which could require additional financial and management resources.
We will incur significant costs as a result of operating as a public company, and our management will devotesubstantial time to new compliance initiatives.As a privately-held company, we were not required to comply with certain corporate governance and financialreporting practices and policies required of a publicly traded company. As a publicly traded company, we will incursignificant legal, accounting and other expenses that we were not required to incur in the recent past, particularlyafter we are no longer an “emerging growth company” as defined under the JOBS Act. In addition, compliance withnew and changing laws, regulations and standards relating to corporate governance and public disclosure, includingthe Dodd-Frank Wall Street Reform and Customer Protection Act, or the Dodd-Frank Act, and the rules andregulations promulgated and to be promulgated thereunder, as well as under the Sarbanes-Oxley Act, and the rulesand regulations of the SEC, will increase our legal and financial compliance costs and make some activities moredifficult, time-consuming or costly. For example, the Exchange Act will require us, among other things, to fileannual, quarterly and current reports with respect to our business and operating results. We also expect that being apublic company and being subject to new rules and regulations will make it more expensive for us to obtain directorand officer liability insurance, and we may be required to accept reduced coverage or incur substantially higher coststo obtain coverage. As such, we expect to incur additional annual expenses of $3.0 million to $4.0 million related tooperating as a public company. These factors may therefore strain our resources, divert management’s attention, andaffect our ability to attract and retain qualified members of our Board and adversely affect our operating margins.
Furthermore, the need to establish the corporate infrastructure demanded of a public company may divertmanagement’s attention from implementing our growth strategy, which could prevent us from improving ourbusiness, results of operations and financial condition. We have made, and will continue to make, changes to ourinternal controls and procedures for financial reporting and accounting systems to meet our reporting obligations asa publicly traded company. However, the measures we take may not be sufficient to satisfy our obligations as apublicly traded company.
42

There is no existing market for our common stock, and we do not know if one will develop to provide you withliquidity.
Prior to this offering, there has not been a public market for our common stock. An active market for our commonstock might not develop following the consummation of this offering, or if it does develop, might not be maintained.If an active trading market does not develop, you may have difficulty selling any of our common stock that you buy.The initial public offering price for the shares of our common stock will be determined by negotiations between usand the representatives of the underwriters and might not be indicative of prices that will prevail in the open marketfollowing this offering. Consequently, you might not be able to sell shares of our common stock at prices equal to orgreater than the initial public offering price.
Our Chief Executive Officer and founder, Dr. August J. Troendle, has indicated an interest to purchase up to $20.0million in shares of our common stock in this offering at the initial public offering price. To the extent Dr. Troendleis allocated and purchases shares in this offering, such a purchase may reduce the available public float for ourshares because Dr. Troendle will be restricted from selling the shares by restrictions under applicable securities lawsand contractual agreements described in “Shares Eligible for Future Sale.” As a result, the liquidity of our commonstock could be significantly reduced from what it would have been if these shares had been purchased by investorsthat were not affiliated with us.
Our operating results and share price may be volatile, and the market price of our common stock after this offeringmay drop below the price you pay.
Our quarterly operating results have fluctuated, and are likely to fluctuate in the future as a publicly tradedcompany. In addition, securities markets worldwide have experienced, and are likely to continue to experience,significant price and volume fluctuations. This market volatility, as well as general economic, market or politicalconditions, could subject the market price of shares of our common stock to wide price fluctuations regardless of ouroperating performance. We and the underwriters will negotiate to determine the initial public offering price. You maynot be able to resell your shares at or above the initial public offering price, or at all. Our operating results and thetrading price of shares of our common stock may fluctuate in response to various factors, including:
■ market conditions in the broader stock market or in the healthcare sector;
■ developments affecting biopharmaceutical companies generally or biopharmaceutical research anddevelopment outsourcing;
■ actual or anticipated fluctuations in our quarterly financial and operating results;
■ introduction of new products or services by us or our competitors;
■ the public’s reaction to our press releases, our other public announcements and our filings with the SEC;
■ changes in, or failure to meet, earnings estimates or recommendations by research analysts who track ourcommon stock or the stock of other companies in our industries;
■ strategic actions by us, our customers or our competitors, such as acquisitions or restructurings;
■ changes in accounting standards, policies, guidance, interpretations or principles;
■ issuance of new or changed securities analysts’ reports or recommendations or termination of coverage ofour common stock by securities analysts;
■ sales, or anticipated sales, of large blocks of our stock;
■ the granting or exercise of employee stock options;
■ volume of trading in our common stock;
■ additions or departures of key personnel;
■ regulatory or political developments;
■ litigation and governmental investigations;
■ changing economic conditions;
■ defaults on our indebtedness;
■ exchange rate fluctuations; and
■ the other factors listed in this “Risk Factors” section.
43

These and other factors, many of which are beyond our control, may cause our operating results and the market priceand demand for shares of our common stock to fluctuate substantially. While we believe that operating results forany particular quarter are not necessarily a meaningful indication of future results, fluctuations in our quarterlyoperating results could limit or prevent investors from readily selling their shares and may otherwise negatively affectthe market price and liquidity of shares of our common stock. In addition, in the past, when the market price of astock has been volatile, holders of that stock have sometimes instituted securities class action litigation against thecompany that issued the stock. If any of our shareholders brought a lawsuit against us, we could incur substantialcosts defending the lawsuit. Such a lawsuit could also divert the time and attention of our management from ourbusiness, which could have a material adverse effect on our business, financial condition, results of operations andcash flows.
A significant portion of our total outstanding shares are restricted from immediate resale but may be sold into themarket in the near future. This could cause the market price of our common stock to drop significantly, even if ourbusiness is doing well.
Sales of a substantial number of shares of our common stock in the public market could occur at any time. After thisoffering, we will have 39,642,113 shares of outstanding common stock (or 40,692,113 if the underwriters exercisetheir option to purchase additional shares in full). In addition, under the Plan, we intend to grant to certain of ouremployees and non-employee directors in connection with this offering awards of stock options at an exercise priceequal to the initial public offering price of our common stock with respect to an aggregate of up to 685,310 shares ofcommon stock immediately following the completion of this offering. We have not yet determined the allocation ofsuch awards of stock options among the individuals, except for the executive officers and certain non-employeedirectors. See “Executive and Director Compensation—Narrative to Summary Compensation Table—Offering Grants toEmployees under the 2016 Incentive Award Plan” and “Executive and Director Compensation—DirectorCompensation.” The shares of common stock sold in this offering or issuable pursuant to the equity awards we grantwill be freely tradable without restriction under the Securities Act, except as described in the next paragraph withrespect to the lock-up arrangements and for any shares of our common stock that may be held or acquired by ourdirectors, executive officers and other affiliates, as that term is defined in the Securities Act, which will be restrictedsecurities under the Securities Act. Restricted securities may not be sold in the public market unless the sale isregistered under the Securities Act or an exemption from registration is available.
We and each of our directors, executive officers and holders of substantially all of our outstanding common stockhave agreed with the underwriters, subject to certain exceptions, not to sell or otherwise dispose of any shares of ourcommon stock or other capital stock or other securities exercisable or convertible therefor for a period of at least 180days after the date of this prospectus without the prior written consent of Jefferies LLC. See “Underwriting” and“Shares Eligible for Future Sale—Lock-Up Agreements.” All of the shares of our common stock outstanding as of thedate of this prospectus may be sold in the public market by existing shareholders following the expiration of theapplicable lock-up period, subject to applicable limitations imposed under federal securities laws.
We also intend to enter into a Registration Rights Agreement pursuant to which the shares of common stock held byCinven and Dr. August J. Troendle, our Chief Executive Officer and founder, will be eligible for resale, subject tocertain limitations set forth therein. See “Certain Relationships and Related Person Transactions—RegistrationRights Agreement.”
We intend to file one or more registration statements on Form S-8 under the Securities Act to register all shares ofcommon stock issued or issuable under the Plan. Any such Form S-8 registration statements will automaticallybecome effective upon filing. Accordingly, shares registered under such registration statements will be available forsale in the open market following the expiration of the applicable lock-up period. We expect that the initialregistration statement on Form S-8 will cover 6,000,000 shares of our common stock.
See “Shares Eligible for Future Sale” for a more detailed description of the restrictions on selling shares of ourcommon stock after this offering.
In the future, we may also issue additional securities if we need to raise capital or make acquisitions, which couldconstitute a material portion of our then-outstanding shares of common stock.
44

Because we have no current plans to pay regular cash dividends on our common stock following this offering, you may notreceive any return on investment unless you sell your common stock for a price greater than that which you paid for it.We do not anticipate paying any regular cash dividends on our common stock for the foreseeable future. Anydecision to declare and pay dividends in the future will be made at the discretion of our Board and will depend on,among other things, our results of operations, financial condition, cash requirements, contractual restrictions andother factors that our Board may deem relevant. In addition, our ability to pay dividends is, and may continue to be,limited by covenants of existing and any future outstanding indebtedness we or our subsidiaries incur, includingunder our existing Senior Secured Credit Facilities. Therefore, any return on investment in our common stock issolely dependent upon the appreciation of the price of our common stock on the open market, which may not occur.See “Dividend Policy” for more detail.
We are a holding company and rely on dividends and other payments, advances and transfers of funds from oursubsidiaries to meet our obligations and pay any dividends.We have no direct operations and no significant assets other than ownership of 100% of the capital stock of oursubsidiaries. Because we conduct our operations through our subsidiaries, we depend on those entities for dividendsand other payments to generate the funds necessary to meet our financial obligations, and to pay any dividends withrespect to our common stock. Legal and contractual restrictions in our Senior Secured Credit Facilities and otheragreements which may govern future indebtedness of our subsidiaries, as well as the financial condition and operatingrequirements of our subsidiaries, may limit our ability to obtain cash from our subsidiaries. The earnings from, orother available assets of, our subsidiaries might not be sufficient to pay dividends or make distributions or loans toenable us to pay any dividends on our common stock or other obligations. Any of the foregoing could materially andadversely affect our business, financial condition, results of operations and cash flows. See “Dividend Policy.”
If securities or industry analysts do not publish research or reports about our business, if they adversely change theirrecommendations regarding our common stock or if our results of operations do not meet their expectations, ourshare price and trading volume could decline.The trading market for shares of our common stock will be influenced by the research and reports that industry orsecurities analysts publish about us or our business. We do not have any control over these analysts. If one or moreof these analysts cease coverage of our company or fail to publish reports on us regularly, we could lose visibility inthe financial markets, which in turn could cause our share price or trading volume to decline. Moreover, if one ormore of the analysts who cover us downgrade our stock, or if our results of operations do not meet their expectations,our share price could decline.
We are an “emerging growth company” and as a result of the reduced disclosure and governance requirementsapplicable to emerging growth companies, our common stock may be less attractive to investors.The JOBS Act provides that, so long as a company qualifies as an “emerging growth company,” it will, among other things:
■ be exempt from the provisions of Section 404(b) of the Sarbanes-Oxley Act requiring that its independentregistered public accounting firm provide an attestation report on the effectiveness of its internal controlover financial reporting;
■ be exempt from the “say on pay” and “say on golden parachute” advisory vote requirements of the Dodd-Frank Act;
■ be exempt from certain disclosure requirements of the Dodd-Frank Act relating to compensation of itsexecutive officers and be permitted to omit the detailed compensation discussion and analysis from proxystatements and reports filed under the Exchange Act; and
■ be exempt from any rules that may be adopted by the Public Company Accounting Oversight Board requiringmandatory audit firm rotations or a supplement to the auditor’s report on the financial statements.
We currently intend to take advantage of each of the exemptions described above. We have irrevocably elected not totake advantage of the extension of time to comply with new or revised financial accounting standards available underSection 107(b) of the JOBS Act. We could be an emerging growth company for up to five years after this offering.We cannot predict if investors will find our common stock less attractive if we elect to rely on these exemptions, or iftaking advantage of these exemptions would result in less active trading or more volatility in the price of our commonstock. For additional information about the implications of qualifying as an emerging growth company, see“Prospectus Summary—Implications of Being an Emerging Growth Company.”
45
CAUTIONARY NOTE REGARDING FORWARD LOOKING STATEMENTS
This prospectus, including the sections entitled “Prospectus Summary,” “Risk Factors,” “Management’s Discussionand Analysis of Financial Condition and Results of Operations,” and “Business,” contains forward lookingstatements. All statements other than statements of historical facts contained in this prospectus, includingstatements regarding our future results of operations and financial position, business strategy and plans and ourobjectives for future operations, are forward looking statements. The words “believe,” “may,” “might,” “will,”“estimate,” “continue,” “anticipate,” “intend,” “seek,” “plan,” “should,” “expect” and similar expressions areintended to identify forward looking statements. Examples of forward looking statements include, but are not limitedto, statements we make regarding: (i) growth of (a) the CRO market, (b) biopharmaceutical companies’ developmentexpenditures and (c) the percentage of biopharmaceutical clinical development costs that are outsourced to CROs;(ii) the amount of the expected conversion of our backlog to net service revenue; (iii) high-growth therapeutic areasand (iv) the continuous enhancement of our clinical development services and our therapeutic expertise. Forwardlooking statements are based largely on our current expectations and projections about future events and financialtrends that we believe may affect our financial condition, results of operations, business strategy, short-term andlong-term business operations and objectives, and financial needs. These forward looking statements are subject toinherent uncertainties, risks and changes in circumstances that are difficult to predict. Moreover, we operate in avery competitive and rapidly changing environment. New risks emerge from time to time. It is not possible for ourmanagement to predict all risks, nor can we assess the impact of all factors on our business or the extent to whichany factor, or combination of factors, may cause actual results to differ materially from those contained in anyforward looking statements we may make. In light of these risks, uncertainties and assumptions, the forward lookingevents and circumstances discussed in this prospectus may not occur and actual results could differ materially andadversely from those anticipated or implied in the forward looking statements. We caution you therefore againstrelying on these forward looking statements.
Some of the key factors that could cause actual results to differ from our expectations include regional, national orglobal political, economic, business, competitive, market and regulatory conditions and the following:
■ the potential loss, delay or non-renewal of our contracts, or the non-payment by customers for services wehave performed;
■ the failure to convert backlog to revenue at our historical conversion rate;
■ fluctuation in our results between fiscal quarters and years;
■ decreased operating margins due to increased pricing pressure or other pressures;
■ failure to perform our services in accordance with contractual requirements, government regulations andethical considerations;
■ the impact of underpricing our contracts, overrunning our cost estimates or failing to receive approval for orexperiencing delays with documentation of change orders;
■ our failure to successfully execute our growth strategies;
■ the impact of a failure to retain key personnel or recruit experienced personnel;
■ the risks associated with our information systems infrastructure;
■ our failure to manage our growth effectively;
■ adverse results from customer or therapeutic area concentration;
■ the risks associated with doing business internationally;
■ the risks associated with the Foreign Corrupt Practices Act and other anti-corruption laws;
■ future net losses;
■ the impact of income tax rate fluctuations on operations, earnings and earnings per share;
■ the risks associated with our intercompany transfer pricing policies;
■ our failure to attract suitable investigators and patients for our clinical trials;
■ the liability risks associated with our R&D services;
■ the risks related to our Phase I clinical services;
46

■ inadequate insurance coverage for our operations and indemnification obligations;■ fluctuations in exchange rates;■ the risks related to our relationships with existing or potential customers who are in competition with each
other;■ our failure to successfully integrate potential future acquisitions;■ potential impairment of goodwill or other intangible assets;■ our limited ability to utilize our net operating loss carryforwards or other tax attributes;■ the risks associated with the use and disposal of hazardous substances and waste;■ the failure of third parties to provide us critical support services;■ our limited ability to protect our intellectual property rights;■ the impact of the United Kingdom’s referendum on withdrawal from the EU;■ the risks associated with potential future investments in our customers’ businesses or drugs;■ the impact of a natural disaster or other catastrophic event;■ negative outsourcing trends in the biopharmaceutical industry and a reduction in aggregate expenditures
and R&D budgets;■ our inability to compete effectively with other CROs;■ the impact of healthcare reform;■ the impact of recent consolidation in the biopharmaceutical industry;■ failure to comply with federal, state and foreign healthcare laws;■ the effect of current and proposed laws and regulations regarding the protection of personal data;■ our potential involvement in costly intellectual property lawsuits;■ actions by regulatory authorities or customers to limit the scope of or withdraw an approved drug, biologic or
medical device from the market;■ failure to keep pace with rapid technological changes;■ the impact of industry-wide reputational harm to CROs;■ our ability to fulfill our debt obligations;■ the risks associated with incurring additional debt or undertaking additional debt obligations;■ the effect of covenant restrictions under our debt agreements on our ability to operate our business;■ our inability to generate sufficient cash to service all of our indebtedness;■ fluctuations in interest rates;■ our dependence on our lenders, which may not be able to fund borrowings under their credit commitments,
and our inability to borrow; and■ the other factors set forth in “Risk Factors.”
See “Risk Factors” for a further description of these and other factors. The forward looking statements included inthis prospectus are made only as of the date hereof. You should not rely upon forward looking statements aspredictions of future events. Although we believe that the expectations reflected in the forward looking statementsare reasonable, we cannot guarantee that the future results, levels of activity, performance or events andcircumstances reflected in the forward looking statements will be achieved or occur. Moreover, neither we nor anyother person assumes responsibility for the accuracy and completeness of the forward looking statements. Weundertake no obligation to update publicly any forward looking statements for any reason after the date of thisprospectus to conform these statements to actual results or to changes in our expectations, except as may berequired by law.
You should read this prospectus with the understanding that our actual future results, levels of activity, performanceand events and circumstances may be materially different from what we expect.
47

USE OF PROCEEDS
We estimate that the net proceeds to us from our sale of shares of 7,000,000 our common stock in this offering willbe approximately $138.3 million, assuming an initial public offering price of $21.50 per share (the midpoint of theprice range listed on the cover page of this prospectus), and after deducting $12.2 million of estimated underwritingdiscounts and commissions and estimated expenses payable by us in connection with this offering. The underwritersmay also purchase up to a maximum of 1,050,000 additional shares of common stock from us pursuant to theiroption to purchase additional shares. We estimate that the net proceeds to us, if the underwriters exercise their rightto purchase the maximum of 1,050,000 additional shares of common stock from us, will be approximately$159.5 million, assuming an initial public offering price of $21.50 per share (the midpoint of the price range listedon the cover page of this prospectus), and after deducting underwriting estimated discounts and commissions andestimated expenses payable by us in connection with this offering.
We intend to use the net proceeds of this offering to repay $138.3 million in aggregate principal amount ofoutstanding borrowings under our Senior Secured Term Loan Facility.
The Senior Secured Term Loan Facility had $364.0 million outstanding (net of an unamortized discount of $1.8million and unamortized debt issuance costs of $9.2 million) as of June 30, 2016 with a maturity date of April 1,2021. Borrowings under the Senior Secured Term Loan Facility bear interest at a rate equal to, at our option, either(a) a Eurocurrency rate based on LIBOR for U.S. dollar deposits for loans denominated in dollars, EURIBOR for Eurodeposits for loans denominated in Euros and the offer rate for any other currencies for loans denominated in suchother currencies for the relevant interest period, plus 4.00% per annum if our total net leverage ratio is greater than4.75:1.00, or 3.75% if our total net leverage ratio is less than or equal to 4.75:1:00; provided that the relevantEurocurrency rate shall be deemed to be no less than 1.00% per annum; or (b) a base rate, which is defined as thehighest of (i) the Federal Funds Rate on such day plus 1⁄2 of 1.00%, (ii) the Prime Lending Rate on such day, (iii)the Adjusted Eurocurrency Rate for Loans denominated in U.S. dollars published on such day for an Interest Periodof one month plus 1.00% and (iv) 2.00%, plus 3.00% per annum if our total net leverage ratio is greater than4.75:1.00, or 2.75% if our total net leverage ratio is less than or equal to 4.75:1:00; provided that the base rateshall be deemed to be no less than 2.00% per annum. We may voluntarily prepay outstanding loans under theSenior Secured Term Loan Facility without premium or penalty. As of June 30, 2016, the interest applicable on theSenior Secured Term Loan Facility was the Eurocurrency minimum floor interest rate of 4.75%. See “Management’sDiscussion and Analysis of Financial Condition and Results of Operations—Liquidity and Capital Resources—Indebtedness.”
If the underwriters exercise their option to purchase additional shares from us in full, we estimate that we willreceive additional net proceeds of $21.2 million, which we intend to use to repay additional borrowings outstandingunder our Senior Secured Term Loan Facility.
Assuming no exercise of the underwriters’ option to purchase additional shares, a $1.00 increase (decrease) in theassumed initial public offering price of $21.50 per share (the midpoint of the price range listed on the cover page ofthis prospectus) would increase (decrease) the net proceeds to us from this offering by $6.6 million, assuming thenumber of shares offered by us, as set forth on the cover page of this prospectus, remains the same, and afterdeducting estimated underwriting discounts and commissions and estimated expenses payable by us in connectionwith this offering. We may also increase or decrease the number of shares we are offering. Each increase (decrease)of 1,000,000 shares in the number of shares of common stock offered by us would increase (decrease) the netproceeds to us from this offering by $20.2 million, assuming an initial public offering price of $21.50 per share (themidpoint of the price range listed on the cover page of this prospectus), and after deducting estimated underwritingdiscounts and commissions and estimated expenses payable by us in connection with this offering.
48

DIVIDEND POLICY
We have no current plans to pay any cash dividends on our common stock for the foreseeable future and insteadintend to retain earnings, if any, for future operations, expansion and debt repayment. However, in the future,subject to the factors described below and our future liquidity and capitalization, we may change this policy andchoose to pay dividends.
We are a holding company which does not conduct any business operations of our own. As a result, our ability to paycash dividends on our common stock is dependent upon cash dividends and distributions and other transfers fromour subsidiaries. The ability of our subsidiaries to pay dividends is currently restricted by the terms of our SeniorSecured Credit Facilities and may be further restricted by any future indebtedness we or they incur.
In addition, under Delaware law, our Board may declare dividends only to the extent of our surplus (which is definedas total assets at fair market value minus total liabilities, minus statutory capital) or, if there is no surplus, out of ournet profits for the then current and/or immediately preceding fiscal year.
Any future determination to declare dividends will be at the discretion of our Board and will take into account:
■ restrictions in our debt instruments, including our Senior Secured Credit Facilities;■ general economic business conditions;■ our net income, financial condition and results of operations;■ our capital requirements;■ our prospects;■ the ability of our operating subsidiaries to pay dividends and make distributions to us;■ legal restrictions; and■ such other factors as our Board may deem relevant.
See “Management’s Discussion and Analysis of Financial Condition and Results of Operations—Liquidity and CapitalResources—Indebtedness” for restrictions on our ability to pay dividends.
49

CAPITALIZATION
The following table sets forth our cash and cash equivalents and our capitalization, as of June 30, 2016:
■ on an actual basis; and■ on an as adjusted basis to give effect to our issuance and sale of 7,000,000 shares of our common stock in
this offering at the initial public offering price of $21.50 per share (the midpoint of the price range listedon the cover page of this prospectus), after deducting estimated underwriting discounts and commissionsand estimated expenses payable by us in connection with this offering and the application of the netproceeds to be received by us from this offering as described under “Use of Proceeds.”
You should read this information together with our audited consolidated financial statements and related notesincluded elsewhere in this prospectus and the information set forth under the headings ‘‘Use of Proceeds,’’‘‘Selected Historical Consolidated Financial and Other Data’’ and ‘‘Management’s Discussion and Analysis ofFinancial Condition and Results of Operations.’’
AS OF JUNE 30, 2016
(In thousands, except share amounts) ACTUAL AS ADJUSTED(3)
Cash and cash equivalents . . . . . . . . . . . . . . . . . . . . . . . . . . . . . . . . . . . . . . . . . . . . . . . . $ 13,674 $ 13,674
Debt:Senior Secured Term Loan Facility (1) . . . . . . . . . . . . . . . . . . . . . . . . . . . . . . . . . . . . . 364,033 225,744Senior Secured Revolving Credit Facility (2) . . . . . . . . . . . . . . . . . . . . . . . . . . . . . . . . . — —
Total long-term debt, net . . . . . . . . . . . . . . . . . . . . . . . . . . . . . . . . . . . . . . . . . . . . 364,033 225,744
Shareholders’ equity:Common stock, par value $0.01 per share; 60,000,000 shares authorized,
32,642,113 shares issued and outstanding, actual; 250,000,000 sharesauthorized and 39,642,113 shares issued and outstanding, as adjusted . . . . . . . 326 396
Additional paid-in-capital . . . . . . . . . . . . . . . . . . . . . . . . . . . . . . . . . . . . . . . . . . . . . . 439,460 575,818Accumulated deficit . . . . . . . . . . . . . . . . . . . . . . . . . . . . . . . . . . . . . . . . . . . . . . . . . . (14,599) (14,599)Accumulated other comprehensive loss . . . . . . . . . . . . . . . . . . . . . . . . . . . . . . . . . . . (2,551) (2,551)
Total shareholders’ equity . . . . . . . . . . . . . . . . . . . . . . . . . . . . . . . . . . . . . . . . . . . 422,636 559,064
Total capitalization . . . . . . . . . . . . . . . . . . . . . . . . . . . . . . . . . . . . . . . . . . . . . . . . . . . . . . $786,669 784,808
(1) This amount is presented net of an unamortized discount of $1.8 million and unamortized debt issuance costs of $9.2 million.(2) As of June 30, 2016, the Senior Secured Credit Facilities provided for a $60.0 million Senior Secured Revolving Credit Facility,
under which we had no borrowings outstanding and $60.0 million of available borrowings.(3) Assuming no exercise of the underwriters’ option to purchase additional shares, a $1.00 increase (decrease) in the assumed initial
public offering price of $21.50 per share (the midpoint of the price range listed on the cover page of this prospectus) would increase(decrease) the as adjusted amount of the Senior Secured Term Loan Facility, additional paid-in capital and total shareholders’ equityby $6.6 million, assuming the number of shares offered by us, as set forth on the cover page of this prospectus, remains the same.Each increase (decrease) of 1,000,000 shares in the number of shares of common stock offered by us would increase (decrease) theas adjusted amount of the Senior Secured Term Loan Facility, additional paid-in capital and total shareholders’ equity by $20.2million, assuming an initial public offering price of $21.50 per share (the midpoint of the price range listed on the cover page of thisprospectus).
50

DILUTION
If you invest in our common stock in this offering, your interest will be diluted to the extent of the differencebetween the initial public offering price per share of our common stock and the net tangible book value per share ofour common stock after this offering. Net tangible book value per share represents our total tangible assets less ourtotal liabilities, divided by the total number of shares of common stock deemed to be outstanding at that date. Ournet tangible book value (deficit) as of June 30, 2016 was $(399.8) million, or $(12.25) per share of our commonstock.
After giving effect to the sale of 7,000,000 shares of common stock in this offering at the assumed initial publicoffering price of $21.50 per share (the midpoint of the price range listed on the cover page of this prospectus) andthe application of the net proceeds from this offering, our as adjusted net tangible book value (deficit) as ofJune 30, 2016 would have been $(263.3) million, or $(6.64) per share of our common stock. This represents animmediate increase in net tangible book value (deficit) of $5.61 per share to our existing investors and animmediate dilution in net tangible book value (deficit) of $(28.14) per share to new investors.
The following table illustrates this dilution on a per share of common stock basis:
Assumed initial public offering price per share of common stock . . . . . . . . . . . . . . . . . . . . . . . . $ 21.50Net tangible book value (deficit) per share as of June 30, 2016 before this offering . . . . . . . $(12.25)Increase in net tangible book value (deficit) per share attributable to new investors . . . . . . . 5.61
As adjusted net tangible book value (deficit) per share after this offering . . . . . . . . . . . . . . . (6.64)
Dilution in net tangible book value (deficit) per share to new investors . . . . . . . . . . . . . . . . . . . . $(28.14)
A $1.00 increase (decrease) in the assumed initial public offering price of $21.50 per share (the midpoint of theprice range listed on the cover page of this prospectus) would increase (decrease) the as adjusted net tangible bookvalue (deficit) per share after this offering by approximately $0.17, and dilution in net tangible book value (deficit)per share to new investors by approximately $(0.17), assuming that the number of shares offered by us, as set forthon the cover page of this prospectus, remains the same and after deducting estimated underwriting discounts andcommissions and estimated expenses payable by us in connection with this offering.
If the underwriters exercise their option to purchase additional shares of our common stock in full in this offering,the as adjusted net tangible book value (deficit) after the offering would be $(5.95) per share, the increase in nettangible book value (deficit) per share to existing shareholders would be $6.30 and the dilution in net tangible bookvalue (deficit) per share to new investors would be $(27.45) per share, in each case assuming an initial publicoffering price of $21.50 per share (the midpoint of the price range listed on the cover page of this prospectus).
The following table summarizes as of June 30, 2016, on an as adjusted basis after giving effect to this offering, thetotal number of shares of common stock purchased from us, the total cash consideration paid to us, or to be paid,and the average price per share paid, or to be paid, by our existing investors and by new investors purchasing sharesin this offering, at the assumed initial public offering price of $21.50 per share (the midpoint of the price rangelisted on the cover page of this prospectus) before deducting the estimated underwriting discounts and commissionsand estimated expenses payable by us in connection with this offering:
SHARESPURCHASED
TOTALCONSIDERATION AVERAGE PRICE
PER SHARENUMBER PERCENT AMOUNT PERCENT
Existing shareholders . . . . . . . . . . . . . . . . . . . 32,642,113 82.3% $414,960,028 73.4% $12.71New investors . . . . . . . . . . . . . . . . . . . . . . . . . 7,000,000 17.7% $150,500,000 26.6% $21.50
Total . . . . . . . . . . . . . . . . . . . . . . . . . . . . . . . . 39,642,113 100% $565,460,028 100% $14.26
51

A $1.00 increase (decrease) in the assumed initial public offering price of $21.50 per share (the midpoint of theprice range listed on the cover page of this prospectus) would increase (decrease) the total consideration paid bynew investors and the total consideration paid by all shareholders by $7.0 million, assuming the number of sharesoffered by us remains the same and before deducting the estimated underwriting discounts and commissions andestimated expenses payable by us in connection with this offering.
If the underwriters were to fully exercise their option to purchase 1,050,000 additional shares of our common stock,the percentage of shares of our common stock held by existing investors would be 80.2%, and the percentage ofshares of our common stock held by new investors would be 19.8%.
The above discussion and tables are based on the number of shares outstanding as of June 30, 2016 and excludes:
■ 1,779,637 shares of common stock issuable upon exercise of stock options outstanding as of June 30,2016 at a weighted average exercise price of $15.48 per share; and
■ an additional 6,000,000 shares of common stock reserved for future issuance under the Plan, includingpursuant to equity awards to be granted in connection with this offering, as described in “Executive andDirector Compensation—Narrative to Summary Compensation Table—Offering Grants to Employees underthe 2016 Incentive Award Plan.”
In addition, we may choose to raise additional capital due to market conditions or strategic considerations even if webelieve we have sufficient funds for our current or future operating plans. To the extent that additional capital israised through the sale of equity or convertible debt securities, the issuance of such securities could result in furtherdilution to our shareholders. See “Risk Factors—Risks Relating to Our Common Stock and this Offering—If youpurchase shares of common stock sold in this offering, you will incur immediate and substantial dilution.”
Our Chief Executive Officer and founder, Dr. August J. Troendle, has indicated an interest to purchase up to$20.0 million in shares of our common stock in this offering at the initial public offering price. However, becauseindications of interest are not binding agreements or commitments to purchase, this existing shareholder maydetermine to increase or reduce the amount of his indication of interest, or otherwise elect not to purchase anyshares. It is also possible that the number of shares, if any, allocated to this shareholder in the offering may besmaller than the amount of his indication of interest. Any allocation of shares in the offering to this existingshareholder will be made at our direction.
52

SELECTED HISTORICAL CONSOLIDATED FINANCIAL AND OTHER DATA
The following tables set forth our selected consolidated historical financial and other data for the periods ending onand as of the dates indicated. We derived the consolidated statements of operations data for the years endedDecember 31, 2013 (Predecessor) and December 31, 2015 (Successor) and the consolidated balance sheet data asof December 31, 2014 and December 31, 2015 from our audited consolidated financial statements and the relatednotes thereto included elsewhere in this prospectus. We derived the consolidated statements of operations data for thePredecessor three month period ended March 31, 2014 and the Successor nine month period ended December 31,2014 from our audited consolidated financial statements and the related notes thereto included elsewhere in thisprospectus. We derived the condensed consolidated statements of operations data for the Successor six months endedJune 30, 2015 and June 30, 2016 and the condensed consolidated balance sheet data as of June 30, 2016 fromour unaudited condensed consolidated financial statements included elsewhere in this prospectus. We have preparedthe unaudited condensed consolidated financial information set forth below on the same basis as our auditedconsolidated financial statements and have included all adjustments, consisting of only normal recurring adjustments,that we consider necessary for a fair presentation of our financial position and operating results for such periods.
The accompanying consolidated statements of operations, cash flows and shareholders’ equity are presented for twoperiods, Predecessor and Successor, which relate to the period preceding the Transaction and the period succeedingthe Transaction, respectively. The Company refers to the operations of Medpace Holdings, Inc. and subsidiaries forboth the Predecessor period and Successor period.
The results for any interim period are not necessarily indicative of the results that may be expected for a full year.Additionally, our historical results are not necessarily indicative of future results. You should read the information setforth below together with “Management’s Discussion and Analysis of Financial Condition and Results of Operations,”“Capitalization” and our consolidated financial statements and the related notes thereto included elsewhere in thisprospectus.
SUCCESSOR PREDECESSOR
(In thousands, except per share data)
SIXMONTHSENDED
JUNE 30,2016
SIXMONTHSENDED
JUNE 30,2015
YEAR ENDEDDECEMBER 31,
2015
NINE MONTHPERIOD FROM
APRIL 1,2014
THROUGHDECEMBER 31,
2014
THREE MONTHPERIOD FROMJANUARY 1,
2014THROUGHMARCH 31,
2014
YEAR ENDEDDECEMBER 31,
2013Consolidated Statements of Operations Data:Service revenue, net . . . . . . . . . . . . . . . . . . . . $180,433 $152,782 $320,101 $219,791 $70,250 $244,270Reimbursed out-of-pocket revenue . . . . . . . . . 25,107 18,105 38,958 28,708 7,679 28,620
Total revenue . . . . . . . . . . . . . . . . . . . 205,540 170,887 359,059 248,499 77,929 272,890Operating expenses:
Direct costs, excluding depreciation andamortization . . . . . . . . . . . . . . . . . . . . 96,215 77,725 163,707 117,550 38,759 119,779
Reimbursed out-of-pocket expenses . . . . . 25,107 18,105 38,958 28,708 7,679 28,620Selling, general and administrative . . . . . . 28,333 23,448 56,998 29,465 10,203 35,109Acquisition and integration . . . . . . . . . . . . — — — 9,297 12,420 —Impairment of goodwill . . . . . . . . . . . . . . . — — 9,313 — — —Depreciation . . . . . . . . . . . . . . . . . . . . . . . 3,566 3,110 6,379 4,610 1,832 6,665Amortization . . . . . . . . . . . . . . . . . . . . . . . 25,336 34,243 63,142 56,422 5,199 23,854
Total operating expenses . . . . . . . . . . . 178,557 156,631 338,497 246,052 76,092 214,027
Income from operations . . . . . . . . . . . . . . . . . . 26,983 14,256 20,562 2,447 1,837 58,863Other (expense) income, net:
Miscellaneous (expense) income, net . . . . (941) (978) (1,133) (301) 1,213 (1,718)Interest expense, net . . . . . . . . . . . . . . . . . (11,894) (13,975) (27,259) (23,185) (3,272) (18,000)
Total other expense, net . . . . . . . . . . . (12,835) (14,953) (28,392) (23,486) (2,059) (19,718)
Income (loss) before income taxes . . . . . . . . . . 14,148 (697) (7,830) (21,039) (222) 39,145Income tax provision (benefit) . . . . . . . . . . . . . 5,738 (733) 843 (6,703) 1,014 14,301
Net income (loss) . . . . . . . . . . . . . . . . . . . . . . . $ 8,410 $ 36 $ (8,673) $ (14,336) $ (1,236) $ 24,844
53

SUCCESSOR PREDECESSOR
(In thousands, except per share data)
SIXMONTHSENDED
JUNE 30,2016
SIXMONTHSENDED
JUNE 30,2015
YEAR ENDEDDECEMBER 31,
2015
NINE MONTHPERIOD FROM
APRIL 1,2014
THROUGHDECEMBER 31,
2014
THREE MONTHPERIOD FROMJANUARY 1,
2014THROUGHMARCH 31,
2014
YEAR ENDEDDECEMBER 31,
2013Net income (loss) per share attributable to
common shareholders:Basic . . . . . . . . . . . . . . . . . . . . . . . . . . . . . . $ 0.26 $ 0.00 $ (0.28) $ (0.46) $ (0.05) $ 0.99Diluted . . . . . . . . . . . . . . . . . . . . . . . . . . . . $ 0.26 $ 0.00 $ (0.28) $ (0.46) $ (0.05) $ 0.95
Weighted average common shares outstanding:Basic . . . . . . . . . . . . . . . . . . . . . . . . . . . . . . 32,631 31,527 31,346 30,869 25,047 25,204Diluted . . . . . . . . . . . . . . . . . . . . . . . . . . . . 32,631 31,591 31,346 30,869 25,047 26,150
Cash Flow Data:Net cash provided by operating activities . . . . . $ 19,982 $ 26,271 $ 84,117 $ 62,539 $ 12,807 $ 98,142Net cash used in investing activities . . . . . . . . . (5,653) (2,658) (6,432) (907,640) (827) (4,472)Net cash (used in) provided by financing
activities . . . . . . . . . . . . . . . . . . . . . . . . . . . (15,678) (65,702) (116,489) 900,171 (17,968) (95,851)
SUCCESSOR PREDECESSOR
(In thousands)
SIXMONTHSENDED
JUNE 30,2016
SIXMONTHSENDED
JUNE 30,2015
YEAR ENDEDDECEMBER 31,
2015
NINEMONTHPERIODFROM
APRIL 1,2014
THROUGHDECEMBER31, 2014
THREE MONTHPERIOD FROMJANUARY 1,
2014THROUGHMARCH 31,
2014
YEAR ENDEDDECEMBER 31,
2013Other Financial Data:EBITDA (1) . . . . . . . . . . . . . . . . . . . . . . . . . . . . $ 54,944 $ 50,631 $ 88,950 $ 63,178 $ 10,081 $ 87,664Adjusted EBITDA (1) . . . . . . . . . . . . . . . . . . . . . 56,427 48,385 101,216 70,450 21,710 85,409Adjusted net income (1) . . . . . . . . . . . . . . . . . . 26,271 21,147 40,445 26,685 9,715 41,407Free Cash Flow (1) . . . . . . . . . . . . . . . . . . . . . . 13,545 23,030 76,360 57,030 11,552 93,581Backlog (at period end) (2) . . . . . . . . . . . . . . . . 465,738 400,627 429,659 394,023 386,047 359,341Net new business awards (3) . . . . . . . . . . . . . . . 218,113 162,638 359,538 231,918 97,220 291,577
(In thousands)
AS OFJUNE 30,
2016
AS OFDECEMBER31, 2015
AS OFDECEMBER 31,
2014Consolidated Balance Sheet DataCash and cash equivalents . . . . . . . . . . . . . . . . . . . . . . . . . . . . . . . . . . . . . . . . . . . . . . . . . . . . . $ 13,674 $ 14,880 $ 54,285Restricted cash . . . . . . . . . . . . . . . . . . . . . . . . . . . . . . . . . . . . . . . . . . . . . . . . . . . . . . . . . . . . . 3,366 2,857 1,104Accounts receivable and unbilled, net . . . . . . . . . . . . . . . . . . . . . . . . . . . . . . . . . . . . . . . . . . . . 90,048 65,088 65,248Working capital . . . . . . . . . . . . . . . . . . . . . . . . . . . . . . . . . . . . . . . . . . . . . . . . . . . . . . . . . . . . . (22,260) (39,296) (319)Total assets . . . . . . . . . . . . . . . . . . . . . . . . . . . . . . . . . . . . . . . . . . . . . . . . . . . . . . . . . . . . . . . . 994,863 984,041 1,096,912Total long-term debt, net . . . . . . . . . . . . . . . . . . . . . . . . . . . . . . . . . . . . . . . . . . . . . . . . . . . . . . 364,033 377,882 491,518Total liabilities . . . . . . . . . . . . . . . . . . . . . . . . . . . . . . . . . . . . . . . . . . . . . . . . . . . . . . . . . . . . . . 572,227 570,567 694,942Total shareholders’ equity . . . . . . . . . . . . . . . . . . . . . . . . . . . . . . . . . . . . . . . . . . . . . . . . . . . . . 422,636 413,474 401,970Total liabilities and shareholders’ equity . . . . . . . . . . . . . . . . . . . . . . . . . . . . . . . . . . . . . . . . . . 994,863 984,041 1,096,912
(1) We prepare our financial statements in conformity with U.S. GAAP. To supplement this information, we also use the following non-GAAP financial measures in this prospectus: EBITDA, Adjusted EBITDA, Adjusted Net Income and Free Cash Flow. EBITDA,Adjusted EBITDA, Adjusted Net Income and Free Cash Flow are measures used by management to assess operating performance.EBITDA, Adjusted EBITDA, Adjusted Net Income and Free Cash Flow are not presented in accordance with U.S. GAAP, are notmeasures of financial condition or profitability and should not be considered as an alternative to net income (loss) determined inaccordance with U.S. GAAP or net cash provided by operating activities determined in accordance with U.S. GAAP, as applicable, orany other performance measure derived in accordance with U.S. GAAP and should not be construed as an inference that our futureresults will be unaffected by unusual non-recurring items. Management uses EBITDA, Adjusted EBITDA, Adjusted Net Income andFree Cash Flow or comparable metrics:
■ as a measurement used in evaluating our operating performance on a consistent basis;
54

■ as a consideration to assess incentive compensation for our employees;
■ for planning purposes, including the preparation of our internal annual operating budget; and
■ to evaluate the performance and effectiveness of our operational strategies.
We believe that the inclusion of EBITDA and Adjusted EBITDA in this prospectus is useful to provide additional information toinvestors about certain material non-cash and non-recurring items. While we believe these financial measures are commonly used byinvestors to evaluate our performance and that of our competitors, because not all companies use identical calculations, thispresentation of EBITDA and Adjusted EBITDA may not be comparable to other similarly titled measures of other companies andshould not be considered as an alternative to performance measures derived in accordance with U.S. GAAP. EBITDA is calculated asnet income (loss) attributable to Medpace Holdings, Inc. before income tax expense, interest expense, net, depreciation andamortization with Adjusted EBITDA being further adjusted for unusual and other items reflected in the reconciliation table below. Ourpresentation of Adjusted EBITDA should not be construed as an inference that our future results will be unaffected by usual or non-recurring items.
EBITDA and Adjusted EBITDA have important limitations as analytical tools and you should not consider them in isolation, or as asubstitute for, analysis of our results as reported under U.S. GAAP. Some of these limitations are:
■ they do not reflect our interest expense, or the cash requirements necessary to service interest or principal payments, on ourdebt;
■ they do not reflect our cash expenditures, or future requirements for capital expenditures or contractual commitments;
■ they do not reflect changes in, or cash requirements for, our working capital needs;
■ although depreciation and amortization are non-cash charges, the assets being depreciated and amortized will often have to bereplaced in the future, and EBITDA and Adjusted EBITDA do not reflect the cash requirements for such replacements;
■ they do not reflect our income tax expense or the cash requirements to pay our taxes;
■ Adjusted EBITDA does not reflect the non-cash component of certain stock based awards related to fair value adjustments andunusual non-recurring stock awards;
■ Adjusted EBITDA does not reflect the impact of earnings or charges resulting from matters we consider not to be indicative ofour ongoing operations, as discussed in our presentation of Adjusted EBITDA and “Management’s Discussion and Analysis ofFinancial Condition and Results of Operations” in this prospectus; and
■ other companies in our industry may calculate Adjusted EBITDA differently than we do, limiting its usefulness as comparativemeasures.
Because of these limitations, EBITDA and Adjusted EBITDA should not be considered as a measure of discretionary cash available tous to invest in the growth of our business. We compensate for these limitations by relying primarily on our U.S. GAAP results andusing EBITDA and Adjusted EBITDA only supplementally.
We utilize Free Cash Flow as a measure of profitability and an assessment of our ability to generate cash. Free Cash Flow is acommonly utilized metric that companies provide to investors, although the calculation of Free Cash Flow may not be comparable toother similarly titled metrics of other companies and should not be considered as an alternative to cash flow measures derived inaccordance with U.S. GAAP. We define Free Cash Flow as net cash provided by operating activities, less capital expenditures and theprincipal portion of payments related to campus leases classified for accounting purposes as deemed landlord liabilities.
Adjusted Net Income measures our operating performance by adjusting net income (loss) attributable to Medpace Holdings, Inc. toinclude cash expenditures related to rental payments on leases classified for accounting purposes as deemed landlord liabilities, andexclude amortization expense, certain stock based compensation award non-cash expenses, certain litigation expenses, deferredfinancing fees and certain other non-recurring items. Management uses this measure to evaluate our core operating results as itexcludes certain items whose fluctuations from period-to-period do not necessarily correspond to changes in the core operations ofthe business, but includes certain items such as depreciation, interest expense and tax expense, which are otherwise excluded fromAdjusted EBITDA. We believe the presentation of Adjusted Net Income enhances our investors’ overall understanding of the financialperformance and cash flow of our business. You should not consider Adjusted Net Income as an alternative to net income (loss)attributable to Medpace Holdings, Inc., determined in accordance with U.S. GAAP, as an indicator of operating performance.
55

See the consolidated financial statements included elsewhere in this prospectus for our U.S. GAAP results. Set forth below are thereconciliations of EBITDA, Adjusted EBITDA, Adjusted Net Income and Free Cash Flow to our closest reported U.S. GAAP measures.
SUCCESSOR PREDECESSOR
(In thousands)
SIXMONTHSENDED
JUNE 30,2016
SIXMONTHSENDED
JUNE 30,2015
YEAR ENDEDDECEMBER 31,
2015
NINE MONTHPERIOD FROMAPRIL 1, 2014
THROUGHDECEMBER 31,
2014
THREEMONTHPERIODFROM
JANUARY 1,2014
THROUGHMARCH 31,
2014
YEAR ENDEDDECEMBER 31,
2013EBITDA and Adjusted EBITDA:Net income (loss) as reported . . . . . . . . . . . . . . . $ 8,410 $ 36 $ (8,673) $(14,336) $ (1,236) $ 24,844Interest expense, net . . . . . . . . . . . . . . . . . . . . . . 11,894 13,975 27,259 23,185 3,272 18,000Income tax provision (benefit) . . . . . . . . . . . . . . . 5,738 (733) 843 (6,703) 1,014 14,301Depreciation . . . . . . . . . . . . . . . . . . . . . . . . . . . . 3,566 3,110 6,379 4,610 1,832 6,665Amortization . . . . . . . . . . . . . . . . . . . . . . . . . . . . 25,336 34,243 63,142 56,422 5,199 23,854
EBITDA . . . . . . . . . . . . . . . . . . . . . . . . . . . . . . . . 54,944 50,631 88,950 63,178 10,081 87,664
Stock compensation expense: liability awardsmark-to-market and CEO award (a) . . . . . . . . 2,576 (12) 9,780 — — —
Private equity transaction related cost (b) . . . . . . — — — 9,297 12,420 —Corporate campus lease payments (c) . . . . . . . . . (1,860) (1,860) (3,720) (2,773) (918) (3,635)Litigation matters (d) . . . . . . . . . . . . . . . . . . . . . . — (374) (3,107) 748 127 1,380Impairment of goodwill . . . . . . . . . . . . . . . . . . . . — — 9,313 — — —Other transaction expenses (f) . . . . . . . . . . . . . . . 767 — — — — —
Adjusted EBITDA . . . . . . . . . . . . . . . . . . . . . . . . $ 56,427 $ 48,385 $101,216 $ 70,450 $21,710 $ 85,409
Adjusted Net Income:Net income (loss) as reported . . . . . . . . . . . . . . . $ 8,410 $ 36 $ (8,673) $(14,336) $ (1,236) $ 24,844Amortization . . . . . . . . . . . . . . . . . . . . . . . . . . . . 25,336 34,243 63,142 56,422 5,199 23,854Stock compensation expense: liability awards
mark-to-market and CEO award (a) . . . . . . . . 2,576 (12) 9,780 — — —Private equity transaction related cost (b) . . . . . . — — — 9,297 12,420 —Corporate campus lease payments—principal
portion (c) . . . . . . . . . . . . . . . . . . . . . . . . . . . (744) (576) (1,292) (1,284) (165) —Litigation matters (d) . . . . . . . . . . . . . . . . . . . . . . — (374) (3,107) 748 127 1,380Impairment of goodwill . . . . . . . . . . . . . . . . . . . . — — 9,313 — — —Deferred financing fees (e) . . . . . . . . . . . . . . . . . . 1,345 1,328 2,687 2,064 371 1,918Other transaction expenses (f) . . . . . . . . . . . . . . . 767 — — — — —Income tax effect of adjustments (39.0%) . . . . . (11,419) (13,498) (31,405) (26,226) (7,001) (10,589)
Adjusted Net Income . . . . . . . . . . . . . . . . . . . . . $ 26,271 $ 21,147 $ 40,445 $ 26,685 $ 9,715 $ 41,407
Free Cash Flow:Cash flow provided by operating activities . . . . . $ 19,982 $ 26,271 $ 84,117 $ 62,539 $12,807 $ 98,142
Less: Capital expenditures . . . . . . . . . . . . . . (5,693) (2,665) (6,465) (4,225) (1,090) (4,561)Less: Corporate campus lease
payments—principal portion (c) . . . . . . . . (744) (576) (1,292) (1,284) (165) —
Free Cash Flow . . . . . . . . . . . . . . . . . . . . . . . . . . $ 13,545 $ 23,030 $ 76,360 $ 57,030 $11,552 $ 93,581
(a) Consists of period end mark-to-market fair value adjustments associated with liability classified awards and the impact of a one-time stock based compensation award to our Chief Executive Officer and founder. Future stock based awards activity is expectedto be classified as equity for accounting purposes and will not be subject to period ending fair value adjustments.
(b) Represents attorney fees, advisory fees and other professional service fees incurred in connection with the Transaction.(c) Represents cash rental payments on two corporate headquarter buildings that are accounted for as deemed assets and subject to
depreciation expense over the life of the lease. Payments made for these leases are accounted for with a principal portion and aninterest portion, consistent with deemed landlord liability accounting. For purposes of Free Cash Flow, the interest portion ofthese payments is included in net cash provided by operating activities in our statement of cash flows. The principal portion isreflected as a financing activity in our statement of cash flows. These adjustments for purposes of arriving at Adjusted EBITDA,Adjusted Net Income and Free Cash Flow have the effect of presenting these leases consistently with all other office leaserentals that we have globally.
(d) Represents non-recurring costs and recovery related to a customer bad debt and non-recurring expenses related to thesettlement of an employment related matter.
(e) Represents amortization of the discount and issuance costs deferred on the consolidated balance sheet associated with theissuance of the Senior Secured Credit Facility.
56

(f) Represents advisory costs and other fees related to this offering.(2) Backlog represents anticipated future net service revenue from net new business awards that have not commenced or are currently in
process but not complete. However, because the contracts included in our backlog are generally terminable without cause, we do notbelieve that our backlog as of any date is necessarily a meaningful predictor of future results.
(3) Net new business awards are new business awards net of award modifications and cancellations that had previously been recognizedin backlog during the period. New business awards represent the value of anticipated future net service revenue that has beenawarded during the period that is recognized in backlog. This value is recognized upon the signing of a contract or receipt of a writtenpre-contract confirmation from a customer that confirms an agreement in principle on budget and scope. New business awards alsoinclude contract amendments, or changes in scope, where the customer has provided written authorization for changes in budget andscope or has approved us to perform additional work as of the measurement date. Awards may not be recognized as backlog afterconsideration of a number of factors, including whether (i) the relevant net service revenue is expected only after a pending regulatoryhurdle, which might result in cancellation of the study, (ii) the customer funding needed for commencement of the study is notbelieved to have been secured or (iii) study timelines are uncertain or not well defined. In addition, study amounts that extend beyonda three-year timeline are not included in backlog. The number and amount of new business awards can vary significantly from periodto period, and an award’s contractual duration can range from several months to several years based on customer and projectspecifications.
57

MANAGEMENT’S DISCUSSION AND ANALYSIS OF FINANCIAL CONDITIONAND RESULTS OF OPERATIONS
The following discussion and analysis of our financial condition and results of operations should be read togetherwith “Selected Historical Consolidated Financial and Other Data” and the consolidated financial statements and therelated notes included elsewhere in this prospectus. This discussion contains forward looking statements related tofuture events and our future financial performance that are based on current expectations and subject to risks anduncertainties. Our actual results may differ materially from those anticipated in these forward looking statements asa result of many factors, including those set forth under “Risk Factors,” “Cautionary Note Regarding ForwardLooking Statements” and elsewhere in this prospectus.
The following discussion and analysis presents operations and cash flows for two periods, Predecessor andSuccessor, which relate to the period preceding the Transaction (as defined below) and the period succeeding theTransaction, respectively. References to the “Successor nine month period ended December 31, 2014” refer to theperiod from April 1, 2014 to December 31, 2014 and references to the “Predecessor three month period endedMarch 31, 2014” refer to the period from January 1, 2014 to March 31, 2014. The Company refers to theoperations of Medpace Holdings., Inc. and subsidiaries for both the Predecessor period and Successor period.
Business OverviewWe are one of the world’s leading clinical contract research organizations, or CROs, by revenue, solely focused onproviding scientifically-driven outsourced clinical development services to the biotechnology, pharmaceutical andmedical device industries. Our mission is to accelerate the global development of safe and effective medicaltherapeutics. We differentiate ourselves from our competitors by our disciplined operating model centered onproviding full-service Phase I-IV clinical development services and our therapeutic expertise. We believe thiscombination results in timely and cost-effective delivery of clinical development services for our customers. Webelieve that we are a partner of choice for small and mid-sized biopharmaceutical companies based on our ability toconsistently utilize our full-service, disciplined operating model to deliver timely and high-quality results for ourcustomers. Accordingly, we believe we are well positioned to continue to expand our market share and sustainmargins in the growing $23 billion overall Phase I-IV CRO market.
We focus on conducting clinical trials across all major therapeutic areas, with particular strength in Cardiology,Metabolic Disease, Oncology, Endocrinology, Central Nervous System, or CNS, Anti-Viral and Anti-Infective, or AVAI,as well as therapeutic expertise in Medical Devices. Our global platform includes approximately 2,300 employeesacross 35 countries, providing our customers with broad access to diverse markets and patient populations and localregulatory expertise and market knowledge.
Our HistoryWe were founded in 1992 as a Phase II-IV-focused CRO with a strong, scientifically-driven and disciplined operatingmodel, and we continue today as a founder-led enterprise. Throughout our 24-year history, we have grown almostexclusively organically, with our core founding members having been integrally involved in developing and instillingour differentiated culture and operating philosophy across our company.
In April 2014, investment funds managed by Cinven Capital Management (V) General Partner Limited, or Cinven, aprivate equity firm, acquired 100% of the outstanding shares of Medpace IntermediateCo, Inc., or MedpaceIntermediateCo, for an aggregate purchase price of $921.3 million. In connection with the acquisition, certainemployees of the Company, through Medpace Investors, LLC, or MPI, agreed to contribute shares held in MedpaceIntermediateCo in exchange for a percentage stake in Medpace Holdings, Inc. We refer to these transactionscollectively, as the “Transaction.” Immediately following the Transaction, Cinven and MPI owned approximately 75%and 25%, respectively, of Medpace Holdings, Inc. For an overview of our ownership structure following this offering,see “Prospectus Summary—Our Structure.”
Prior to the Transaction, CCMP Capital, or CCMP, a private equity firm, held 80% of our equity interests and thenoncontrolling interests were held by certain current and former members of management, along with formermembers of the board of directors of Medpace, Inc., our wholly owned subsidiary.
58

The Transaction was accounted for as a business combination using the acquisition method of accounting. As of theTransaction date, our consolidated financial statements reflect the allocation of the $921.3 million purchase priceto the assets acquired, including identifiable intangible assets of $306.3 million, and liabilities assumed based onfair values at the date of the Transaction. The excess of the purchase price over the fair value of the assets acquiredand liabilities assumed amounted to $670.3 million, which was recorded as goodwill. Transaction related costs,including attorney fees, advisory fees and other professional service fees related to the Transaction, were $9.3million, including $3.3 million related to success based advisory fees, for the Successor nine month period endedDecember 31, 2014 and $12.4 million, including $10.1 million related to success based advisory fees, for thePredecessor three month period ended March 31, 2014.
Stock Split
On July 25, 2016, the Board approved, and made legally effective, a 1-for-1.35 reverse stock split of the Company’scommon stock. All share, stock option and per share information presented in the Successor consolidated financialstatements have been adjusted to reflect the reverse stock split on a retroactive basis for all periods presented. TheCompany will make a cash payment to shareholders for all fractional shares which would have otherwise beenrequired to be issued as a result of the reverse stock split. There was no change in number of authorized shares orthe par value of the Company’s common stock.
How We Generate Revenue
Our revenue consists of net service revenue and reimbursed-out-of-pocket revenue.
Net Service RevenueWe earn customer fees through the performance of services detailed in our customer contracts. Contract scope andpricing is typically based on either a fixed-fee or unit-of-service model and our contracts can range in duration from afew months to several years. These contracts are individually priced and negotiated based on the anticipated projectscope, including the complexity of the project and the performance risks inherent in the project. The majority of ourcontracts are structured with an upfront fee that is collected at the time of contract signing, and the balance of thefee is collected over the duration of the contract either through an arranged billing schedule or upon completion ofcertain performance targets or defined milestones. This payment structure is standard in the CRO industry.
Net service revenue, which is distinct from billing and cash receipt, is generally recognized based on the proportionalperformance methodology, which is determined by assessing the proportion of performance completed or delivered todate compared to total specific measures to be delivered or completed under the terms of the contract. Themeasures utilized to assess performance are specific to the service provided. Net service revenue for unit-of-servicecontracts is recognized as services are performed or delivered. Cancellation provisions in our contracts allow ourcustomers to terminate a contract either immediately or according to advance notice terms specified within theapplicable contract, which is typically 30 days. Contract cancellation may occur for various reasons, including, butnot limited to, adverse patient reactions, lack of efficacy or inadequate patient enrollment. Upon cancellation, weare entitled to fees for services rendered through the date of termination, including payment for subsequent servicesnecessary to conclude the study or close out the contract. These fees are typically subject to negotiation and arerealized as net service revenue when collection is reasonably assured. Changes in net service revenue from period toperiod are driven primarily by new business volume and task order execution activity, project cancellations, and themix of active studies during a given period that can vary based on therapeutic and or study life cycle stage.
Reimbursed Out-of-Pocket RevenueReimbursed out-of-pocket revenue consists primarily of expenses we incur in relation to projects that are reimbursedby our customers with no profit or mark-up. These expenses are defined in our contracts and generally include, butare not limited to, travel, meetings, printing and shipping and handling fees. Such reimbursements received areincluded in revenue with the expenditures reflected as a separate component of operating expense. Certain fees paidto investigators and other disbursements in which we act as an agent on behalf of the study sponsor are reflected inthe consolidated statements of operations with no resulting effect on our revenue or expenses.
Costs and Expenses
Our costs and expenses are comprised primarily of our direct costs, selling, general and administrative costs,depreciation and amortization and income taxes. In addition, as noted above, we also have reimbursed out-of-pocketexpenditures that are directly offset by our reimbursed out-of-pocket revenue.
59

Direct Costs, Excluding Depreciation and AmortizationDirect costs, excluding depreciation and amortization are primarily driven by labor and related employee benefits,but also include laboratory supplies and other expenses contributing to service delivery. The other costs of servicedelivery can include office rent, utilities, supplies and software license expenses, which are allocated between directcosts, excluding depreciation and amortization and selling, general and administrative expenses based on theestimated contribution among service delivery and support function efforts on a percentage basis. Direct costs,excluding depreciation and amortization exclude reimbursed out-of-pocket expenses. Direct costs, excludingdepreciation and amortization are expensed as incurred and are not deferred in anticipation of contracts beingawarded or finalization of changes in scope. Direct costs, excluding depreciation and amortization as a percentage ofnet service revenue can vary from period to period due to project labor efficiencies, changes in workforce,compensation/bonus programs and service mix.
Selling, General and AdministrativeSelling, general and administrative expenses are primarily driven by compensation and related employee benefits, aswell as rent, utilities, supplies, software licenses, professional fees (e.g., legal and accounting expenses), travel,marketing and other operating expenses.
DepreciationDepreciation is provided on our property and equipment on the straight-line method at rates adequate to allocate thecost of the applicable assets over their estimated useful lives, which is three to five years for computer hardware,software, phone and medical imaging equipment, five to seven years for furniture and fixtures and other equipment,and thirty to forty years for buildings. Leasehold improvements and deemed assets from landlord buildingconstruction are amortized on a straight-line basis over the shorter of the estimated useful life of the improvement orthe associated remaining lease term.
AmortizationAmortization relates to finite-lived intangible assets recognized as expense using the straight-line method or using anaccelerated method over their estimated useful lives, which range in term from 17 months to 15 years.
Income Tax Provision (Benefit)Income tax provision (benefit) consists of federal, state and local taxes on income in multiple jurisdictions. Ourincome tax is impacted by the pre-tax earnings in jurisdictions with varying tax rates and any related tax credits thatmay be available to us. Our current and future provision for income taxes will vary from statutory rates due to theimpact of valuation allowances in certain countries, income tax incentives, certain non-deductible expenses andother discrete items.
Key Performance Metrics
To evaluate the performance of our business, we utilize a variety of financial and performance metrics. These keymeasures include new business awards, cancellations and backlog.
New Business Awards, Cancellations and BacklogNew business awards represent the value of anticipated future net service revenue that has been awarded during theperiod that is recognized in backlog. This value is recognized upon the signing of a contract or receipt of a writtenpre-contract confirmation from a customer that confirms an agreement in principle on budget and scope. Newbusiness awards also include contract amendments, or changes in scope, where the customer has provided writtenauthorization for changes in budget and scope or has approved us to perform additional work as of the measurementdate. Awards may not be recognized as backlog after consideration of a number of factors, including whether (i) therelevant net service revenue is expected only after a pending regulatory hurdle, which might result in cancellation ofthe study, (ii) the customer funding needed for commencement of the study is not believed to have been secured or(iii) study timelines are uncertain or not well defined. In addition, study amounts that extend beyond a three-yeartimeline are not included in backlog. The number and amount of new business awards can vary significantly fromperiod to period, and an award’s contractual duration can range from several months to several years based oncustomer and project specifications.
Cancellations arise in the normal course of business and are reflected when we receive written confirmation from thecustomer to cease work on a contractual agreement. The majority of our customers can terminate our contracts
60

without cause upon 30 days’ notice. Similar to new business awards, the number and amount of cancellations canvary significantly period over period due to timing of customer correspondence and study-specific circumstances.Total cancellations in a period are offset against gross new business awards received in a period to determine netnew business awards in our backlog calculation. Our average quarterly cancellation rates as a percentage of thebeginning of the period backlog were 4.2% and 2.7% for the Successor six months ended June 30, 2016 andJune 30, 2015, respectively, and 3.2% for the Successor year ended December 31, 2015, 3.3% for the Successornine month period ended December 2014, 2.5% for the Predecessor three month period ended March 2014 and3.7% for the Predecessor year ended December 2013.
Net new business awards were $218.1 million and $162.6 million for the Successor six months ended June 30,2016 and June 30, 2015, respectively. Net new business awards were $359.5 million, $329.1 million (of which$231.9 million related to the Successor nine month period ended December 31, 2014 and $97.2 million related tothe Predecessor three month period ended March 31, 2014), and $291.6 million for the Successor year endedDecember 31, 2015, the combined Successor nine month period ended December 31, 2014 and Predecessor threemonth period ended March 31, 2014, and the Predecessor year ended December 31, 2013, respectively.
Backlog represents anticipated future net service revenue from net new business awards that have not commencedor are currently in process but not complete. Reported backlog will fluctuate based on new business awards, changesin the scope of existing contracts, cancellations, revenue recognition on existing contracts and foreign exchangeadjustments from non-U.S. dollar denominated backlog. As of June 30, 2016, our backlog increased by $65.1million, or 16.3%, to $465.7 million compared to $400.6 million as of June 30, 2015. Our backlog increased by$35.6 million, or 9.0%, to $429.7 million as of December 31, 2015, compared to $394.0 million as ofDecember 31, 2014. Our backlog increased by $34.7 million, or 9.7%, to $394.0 million as of December 31,2014, compared to $359.3 million as of December 31, 2013. Included within backlog as of June 30, 2016 wasapproximately $170.1 million to $175.1 million that we expect to convert to net service revenue in 2016, with theremainder expected to convert to net service revenue in years after 2016.
The effect of foreign currency adjustments on backlog was as follows: unfavorable foreign currency adjustments of$1.4 million for the Successor six months ended June 30, 2016, unfavorable foreign currency adjustments of $2.9million for the Successor six months ended June 30, 2015, unfavorable foreign currency adjustments of $3.6million for the Successor year ended December 31, 2015; unfavorable foreign currency adjustments of $3.4 millionfor the Successor nine month period ended December 2014; no net currency adjustments for the Predecessor threemonth period ended March 2014; and foreign currency adjustments of $0.2 million for the Predecessor year endedDecember 2013.
Backlog and net new business award metrics may not be reliable indicators of our future period revenue as they aresubject to a variety of factors that may cause material fluctuations from period to period. These factors include, butare not limited to, changes in the scope of projects, cancellations and duration and timing of services provided.
Exchange Rate Fluctuations
The majority of our contracts and operational transactions are U.S. dollar denominated. The Euro represents thelargest foreign currency denomination of our contractual and operational exposure. As a result, a portion of ourrevenue and expenses are subject to exchange rate fluctuations. We have translated the Euro into U.S. dollars usingthe following average exchange rates based on data obtained from www.xe.com:
SUCCESSOR PREDECESSOR
SIXMONTHSENDED
JUNE 30,2016
SIXMONTHSENDED
JUNE 30,2015
YEAR ENDEDDECEMBER 31,
2015
NINE MONTHPERIOD FROM
APRIL 1,2014 THROUGHDECEMBER 31,
2014
THREE MONTHPERIOD FROMJANUARY 1,
2014 THROUGHMARCH 31,
2014
YEAR ENDEDDECEMBER 31,
2013
U.S. dollars per Euro . . . . . . . . . . . 1.11 1.11 1.10 1.31 1.37 1.33
61

Results of Operations
Successor six months ended June 30, 2016 compared to the Successor six months ended June 30, 2015
SUCCESSOR
(In thousands, except percentages)
SIXMONTHSENDED
JUNE 30,2016
SIXMONTHSENDED
JUNE 30,2015 CHANGE
%CHANGE
Service revenue, net . . . . . . . . . . . . . . . . . . . . . . . . . . . . . . . . . . . . . $180,433 $152,782 $27,651 18.1%Reimbursed out-of-pocket revenue . . . . . . . . . . . . . . . . . . . . . . . . . . 25,107 18,105 7,002 38.7%
Total revenue . . . . . . . . . . . . . . . . . . . . . . . . . . . . . . . . . . . . . . . . 205,540 170,887 34,653 20.3%Direct costs, excluding depreciation and amortization . . . . . . . . . . . 96,215 77,725 18,490 23.8%Reimbursed out-of-pocket expenses . . . . . . . . . . . . . . . . . . . . . . . . . 25,107 18,105 7,002 38.7%Selling, general and administrative . . . . . . . . . . . . . . . . . . . . . . . . . . 28,333 23,448 4,885 20.8%Depreciation . . . . . . . . . . . . . . . . . . . . . . . . . . . . . . . . . . . . . . . . . . . 3,566 3,110 456 14.7%Amortization . . . . . . . . . . . . . . . . . . . . . . . . . . . . . . . . . . . . . . . . . . . 25,336 34,243 (8,907) (26.0%)
Total operating expenses . . . . . . . . . . . . . . . . . . . . . . . . . . . . . . . 178,557 156,631 21,926 14.0%
Income from operations . . . . . . . . . . . . . . . . . . . . . . . . . . . . . . . . . . 26,983 14,256 12,727 89.3%Miscellaneous (expense) income, net . . . . . . . . . . . . . . . . . . . . . . . . (941) (978) 37 (3.8%)Interest expense, net . . . . . . . . . . . . . . . . . . . . . . . . . . . . . . . . . . . . (11,894) (13,975) 2,081 (14.9%)
Income (loss) before income taxes . . . . . . . . . . . . . . . . . . . . . . . . . . 14,148 (697) 14,845 (2,129.8%)Income tax provision (benefit) . . . . . . . . . . . . . . . . . . . . . . . . . . . . . 5,738 (733) 6,471 (882.8%)
Net income (loss) . . . . . . . . . . . . . . . . . . . . . . . . . . . . . . . . . . . . . . . $ 8,410 $ 36 $ 8,374 23,261.1%
Net service revenue and Reimbursed out-of-pocket revenue
Net service revenue was $180.4 million for the six months ended June 30, 2016, compared to $152.8 million forthe six months ended June 30, 2015. Contributing to the $27.7 million growth in net service revenue was anincrease in Phase II-IV study activity as measured by both number of active projects and employee time reporting. Inaddition, there was a higher concentration of active studies in phases that are generally attributed to higher levels ofproject activity, including patient enrollment and monitoring phases. Contract execution timing was also a factor inthis increase, with a higher percentage of overall revenue driven from change in scope and task order executions inthe six months ended June 30, 2016, compared to the six months ended June 30, 2015. On average, we converted20.6% of our beginning of the period backlog to revenue in the six months ended June 30, 2016, compared to19.1% of our beginning of the period backlog to revenue in the six months ended June 30, 2015.
Reimbursed out-of-pocket revenue was $25.1 million for the six months ended June 30, 2016, compared to $18.1million for the six months ended June 30, 2015. Reimbursed out-of-pocket revenues fluctuate significantly from period toperiod based on the timing of program initiation or closeout, and these changes do not necessarily correlate to changes innet service revenue. The reimbursements were offset by an equal amount of reimbursed out-of-pocket expenses.
Direct costs, excluding depreciation and amortization and Reimbursed out-of-pocket expenses
Direct costs, excluding depreciation and amortization were $96.2 million for the six months ended June 30, 2016,compared to $77.7 million for the six months ended June 30, 2015. The $18.5 million increase was primarilyattributed to increases in employee related costs of $12.1 million and increases in contracted services of $2.3million related to growth in project volume.
Selling, general and administrative
Selling, general and administrative expenses were $28.3 million for the six months ended June 30, 2016, comparedto $23.4 million for the six months ended June 30, 2015. The $4.9 million increase was primarily attributed toincreases in employee related costs of $3.0 million related to additional headcount in business support functions.
62

Depreciation and AmortizationDepreciation and amortization expense was $28.9 million for the six months ended June 30, 2016, compared to$37.4 for the six months ended June 30, 2015. The $8.5 million decrease in depreciation and amortization wasprimarily related to definite lived intangible assets acquired as part of the Transaction with relatively short usefullives.
Miscellaneous (expense) income, netMiscellaneous (expense) income, net was ($0.9) million of expense for the six months ended June 30, 2016,compared to ($1.0) million of expense for the six months ended June 30, 2015. These changes were mainlyattributable to foreign exchange gains or losses that arise in connection with the revaluation of short-term inter-company balances between our domestic and international subsidiaries, and gains or losses from foreign currencytransactions, such as those resulting from the settlement of third-party accounts receivables and payablesdenominated in a currency other than the local currency of the entity making the payment.
Interest expense, netInterest expense, net was $11.9 million for the six months ended June 30, 2016, compared to $14.0 for the sixmonths ended June 30, 2015. The $2.1 million decrease in interest expense, net was related to the average loweroutstanding balance under our Senior Secured Term Loan Facility (as defined below).
Income tax provision (benefit)Income tax provision was $5.7 million for the six months ended June 30, 2016, compared to an income tax benefitof $0.7 million for the six months ended June 30, 2015. The overall effective tax rate for the six months ended June30, 2016 was 40.6% compared to 105.2% for the six months ended June 30, 2015. The change in effective taxrate was primarily due to the notable increase in projected pre-tax book income for the six months ended June 30,2016 coupled with relatively consistent year over year rate reconciliation drivers.
63

Successor year ended December 31, 2015 compared to the Successor nine month period from April 1, 2014through December 31, 2014 and Predecessor three month period from January 1, 2014 through March 31, 2014
SUCCESSOR PREDECESSOR
CHANGE%
CHANGE(In thousands, except percentages)
YEAR ENDEDDECEMBER 31,
2015
NINE MONTHPERIOD FROMAPRIL 1, 2014
THROUGHDECEMBER 31,
2014
THREEMONTH
PERIOD FROMJANUARY 1,
2014THROUGHMARCH 31,
2014
Service revenue, net . . . . . . . . . . . . . . . . . . . $320,101 $219,791 $70,250 $ 30,060 10.4%Reimbursed out-of-pocket revenue . . . . . . . . 38,958 28,708 7,679 2,571 7.1%
Total revenue . . . . . . . . . . . . . . . . . . . . . . 359,059 248,499 77,929 32,631 10.0%Direct costs, excluding depreciation and
amortization . . . . . . . . . . . . . . . . . . . . . . 163,707 117,550 38,759 7,398 4.7%Reimbursed out-of-pocket expenses . . . . . . . 38,958 28,708 7,679 2,571 7.1%Selling, general and administrative . . . . . . . 56,998 29,465 10,203 17,330 43.7%Acquisition and integration . . . . . . . . . . . . . . — 9,297 12,420 (21,717) -100.0%Impairment of goodwill . . . . . . . . . . . . . . . . . 9,313 — — 9,313 —Depreciation . . . . . . . . . . . . . . . . . . . . . . . . . 6,379 4,610 1,832 (63) -1.0%Amortization . . . . . . . . . . . . . . . . . . . . . . . . . 63,142 56,422 5,199 1,521 2.5%
Total operating expenses . . . . . . . . . . . . . 338,497 246,052 76,092 16,353 5.1%
Income from operations . . . . . . . . . . . . . . . . 20,562 2,447 1,837 16,278 380.0%Miscellaneous (expense) income, net . . . . . . (1,133) (301) 1,213 (2,045) -224.2%Interest expense, net . . . . . . . . . . . . . . . . . . (27,259) (23,185) (3,272) (802) 3.0%
(Loss) income before income taxes . . . . . . . . (7,830) (21,039) (222) 13,431 -63.2%Income tax provision (benefit) . . . . . . . . . . . 843 (6,703) 1,014 6,532 -114.8%
Net (loss) income . . . . . . . . . . . . . . . . . . . . . $ (8,673) $ (14,336) $ (1,236) $ 6,899 -44.3%
Net service revenue and Reimbursed out-of-pocket revenueNet service revenue was $320.1 million for the Successor year ended December 31, 2015, compared to$219.8 million for the Successor nine month period ended December 31, 2014, and $70.3 million for thePredecessor three month period ended March 31, 2014. Contributing to growth in net service revenue in theSuccessor year ended December 31, 2015 was a larger number of active projects. On average, we converted 19.7%of our beginning of the quarter backlog to revenue each quarter during the Successor year ended December 31,2015. In comparison, we converted an average of 18.7% and 19.6% of our beginning of quarter backlog to revenueeach quarter during the Successor nine month period ended December 31, 2014 and Predecessor three monthperiod ended March 31, 2014, respectively.
Reimbursed out-of-pocket revenue was $39.0 million for the Successor year ended December 31, 2015,$28.7 million for the Successor nine month period ended December 31, 2014 and $7.7 million for the Predecessorthree month period ended March 31, 2014. Reimbursed out-of-pocket revenues fluctuate significantly from periodto period based on the timing of program initiation or closeout, and these changes do not necessarily correlate tochanges in net service revenue. The reimbursements were offset by an equal amount of reimbursed out-of-pocketexpenses.
64

Direct costs, excluding depreciation and amortization and Reimbursed out-of-pocket expensesDirect costs, excluding depreciation and amortization were $163.7 million for the Successor year endedDecember 31, 2015, compared to $117.6 million for the Successor nine month period ended December 31, 2014and $38.8 million for the Predecessor three month period ended March 31, 2014. The increase for the Successoryear ended December 31, 2015 was primarily the result of an increase in revenue generating headcount fromDecember 31, 2014 to support our increased project activity and new business awards.
While direct costs, excluding depreciation and amortization, increased in the Successor year ended December 31,2015 compared to the Successor nine month period ended December 31, 2014 and Predecessor three monthperiod ended March 31, 2014, they decreased to 51.1% of net service revenue, from 53.5% of net service revenuein the Successor nine month period ended December 31, 2014 and 55.2% of net service revenue for thePredecessor three month period ended March 31, 2015. An increase in headcount drove salaries, wages and otheremployee related direct costs to $119.8 million, or 37.4%, of net service revenue, from $86.8 million, or 39.5% ofnet service revenue, in the Successor nine month period ended December 31, 2014, and $25.7 million, or 36.6%of net service revenue, in the Predecessor three month period ended March 31, 2014. In addition, stock basedcompensation expense recognized in direct costs, excluding depreciation and amortization, was $9.2 million, or2.9% of net service revenue, in the Successor year ended 2015, compared to $4.4 million, or 2.0% of net servicerevenue, in the Successor nine month period ended December 31, 2014 and $5.4 million, or 7.7% of net servicerevenue, in the Predecessor three month period ended March 31, 2014. Stock based compensation expense waselevated in the Predecessor three month period ended March 31, 2014 as a result of the acceleration of stock optionvesting that occurred in advance of the Transaction.
Selling, general and administrativeSelling, general and administrative expenses were $57.0 million for the Successor year ended December 31, 2015,compared to $29.5 million for the Successor nine month period ended December 31, 2014, and $10.2 million forthe Predecessor three month period ended March 31, 2014. The increase for the Successor year endedDecember 31, 2015 was primarily due to $13.1 million of stock based compensation expense related to theissuance of new stock based awards granted to select management personnel, recurring and accelerated amortizationof previously granted restricted share awards, and the impact of mark-to-market expense adjustments due to anincrease in the fair value of liability classified stock based awards. Stock based compensation expense was $1.0million and $1.9 million for the Successor nine month period ended December 31, 2014 and Predecessor threemonth period ended March 31, 2014, respectively.
Selling, general and administrative expenses increased to 17.8% of net service revenue for the Successor year endedDecember 31, 2015, compared to 13.4% of net service revenue for the Successor nine month period endedDecember 31, 2014, and 14.5% of net service revenue for the Predecessor three month period ended March 31,2014. The increase in selling, general and administrative expense as a percentage of net service revenue wasprimarily related to the aforementioned increase in stock based compensation expense to 4.1% of net servicerevenue for the Successor year ended December 31, 2015 from 0.5% of net service revenue for the Successor ninemonth period ended December 31, 2014 and 2.7% of net service revenue for the Predecessor three month periodended March 31, 2014. Further contributing to this increase as a percentage of net service revenue were highersalaries and wages. Salaries and wages as a percentage of net service revenue were 7.4% for the Successor yearended December 31, 2015, compared to 5.6% and 5.5% of net service revenue for the Successor nine monthperiod ended December 31, 2014 and the Predecessor three month period ended March 31, 2014, respectively.Salaries and wages grew at a higher percentage than net service revenue for the Successor year ended December 31,2015 as we continued to hire both sales force and administrative personnel in anticipation of futuregrowth. Offsetting the increase in selling, general and administrative expense as a percentage of net service revenuewere bad debt recoveries and gains on litigation matters of $2.7 million, or 0.9% of net service revenue, for theSuccessor year ended December 31, 2015, compared to bad debt expense and litigation losses of $2.2 million, or1.0% of net service revenue, for the Successor nine month period ended December 31, 2014.
65

Acquisition and integration expensesThere were no acquisition and integration expenses for the Successor year ended December 31, 2015. Acquisitionand integration expenses were $9.3 million for the Successor nine month period ended December 31, 2014 and$12.4 million for the Predecessor three month period ended March 31, 2014. These expenses included attorneyfees, advisory fees and other professional service fees related to the Transaction.
Impairment of goodwillDuring the Successor year ended December 31, 2015, we determined that the fair value of our Clinics reporting unitdid not exceed its carrying value resulting in a $9.3 million impairment of goodwill. This impairment was identifiedduring the annual impairment assessment in the fourth quarter of 2015 when we updated our forecasted discountedcash flows to reflect operating results that lagged prior forecasted results.
Depreciation and AmortizationDepreciation and amortization expense was $69.5 million for the Successor year ended December 31, 2015,compared to $61.0 million for the Successor nine month period ended December 31, 2014 and $7.0 million for thePredecessor three month period ended March 31, 2014. The increase in depreciation and amortization was primarilyrelated to the amortization expense associated with the Transaction in which $274.7 million in finite-lived intangibleassets that were identified and capitalized as part of the Transaction. Depreciation and amortization as a percentageof net service revenue, decreased to 21.7% in the Successor year ended 2015, compared to 27.8% for theSuccessor nine month period ended December 31, 2014. This decrease primarily related to the acceleratedamortization methodology of our backlog and customer relationship intangibles. Within the Successor nine monthperiod ended December 31, 2014 and the Predecessor three month period ended March 31, 2014, depreciationand amortization expense as a percentage of net service revenue increased to 27.8% from 10.0%, respectively. Thisincrease was the result of the capitalization and amortization of the finite-lived intangible assets identified as part ofthe Transaction.
Miscellaneous (expense) income, netMiscellaneous (expense) income, net was $1.1 million of expense for the Successor year ended December 31,2015, compared to $0.3 million of expense for the Successor nine month period ended December 31, 2014 and$1.2 million of income for the Predecessor three month period ended March 31, 2014. Changes are mainlyattributable to foreign exchange gains or losses that arise in connection with the revaluation of short-term inter-company balances between our domestic and international subsidiaries, and gains or losses from foreign currencytransactions, such as those resulting from the settlement of third-party accounts receivables and payablesdenominated in a currency other than the local currency of the entity making the payment.
Interest expense, netInterest expense, net was $27.3 million for the Successor year ended December 31, 2015, compared to $23.2million for the Successor nine month period ended December 31, 2014 and $3.3 million for the Predecessor threemonth period ended March 31, 2014. Interest expense, net was 8.5% of net service revenue for the Successor yearended December 31, 2015, compared to 10.5% of net service revenue for the Successor nine month period endedDecember 31, 2014 and 4.7% of net service revenue for the Predecessor three month period ended March 31,2014. The change in interest expense, net was primarily attributed to the average lower outstanding balance underour Senior Secured Term Loan Facility in the Successor year ended December 31, 2015, compared to the Successornine month period ended December 31, 2014, as $116.1 million of principal payments were applied to the SeniorSecured Term Loan Facility throughout the year. For the Successor nine month period ended December 31, 2014,compared to the Predecessor three month period ended March 31, 2014, the increase in interest expense, net wasrelated to entering into the Senior Secured Credit Facilities (as defined below) to finance a portion of theTransaction, which increased outstanding debt, net from $143.7 million (that was paid in full at the Transactiondate) to $530.0 million as of April 1, 2014.
Income tax provision (benefit)Income tax provision was $0.8 million for the Successor year ended December 31, 2015, compared to a benefit of$6.7 million for the Successor nine month period ended December 31, 2014 and a provision of $1.0 million for thePredecessor three month period ended March 31, 2014.
66

The effective tax rate for the Successor year ended December 31, 2015 was negative 10.8%, compared to 31.8%for the Successor nine month period ended December 31, 2014. This change in the effective tax rates was primarilythe result of higher non-deductible expenses in the Successor year ended December 31, 2015. The nondeductibleexpenses for the Successor year ended December 31, 2015 included goodwill impairment and stock basedcompensation expense resulting from the vesting of stock based awards for foreign employees and an increase ofdomestic and foreign uncertain tax positions in the Successor year ended December 31, 2015. In the Successornine month period ended December 31, 2014, the Company experienced significant nondeductible transactioncosts resulting from the Transaction. Although both periods experienced high levels of nondeductible expenses, thetotal nondeductible expenses related to the Successor year ended December 31, 2015 exceeded nondeductibleexpenses incurred in the Successor nine month period ended December 31, 2014.
The effective tax rate for the Successor nine month period ended December 31, 2014 was 31.8%, compared tonegative 456.1% for the Predecessor three month period ended March 31, 2014. The change in the effective taxrates between the Successor nine month period ended December 31, 2014 and the Predecessor three month periodended March 31, 2014 was primarily due to an increase in the valuation allowance on U.S. deferred tax assetsrelating to a capital loss that was recorded in the Predecessor three month period ended March 31, 2014 due to thesale of an investment. The valuation allowance was recorded in the Predecessor three month period endedMarch 31, 2014 because the Company did not anticipate generating capital gains that could be used to offset thecapital loss. Another contributing factor was non-deductible stock based compensation expense recorded for thePredecessor three month period ended March 31, 2014 resulting from the acceleration of vesting of stock basedawards for foreign employees that occurred prior to the Transaction.
Successor nine month period from April 1, 2014 through December 31, 2014 and Predecessor three month periodfrom January 1, 2014 through March 31, 2014 compared to the Predecessor year ended December 31, 2013
SUCCESSOR PREDECESSOR
CHANGE%
CHANGE(In thousands, except percentages)
NINE MONTHPERIOD
FROM APRIL 1,2014
THROUGHDECEMBER 31,
2014
THREEMONTH
PERIOD FROMJANUARY 1,
2014THROUGHMARCH 31,
2014
YEAR ENDEDDECEMBER 31,
2013
Service revenue, net . . . . . . . . . . . . . . . . . . . $219,791 $70,250 $244,270 $ 45,771 18.7%Reimbursed out-of-pocket revenue . . . . . . . . 28,708 7,679 28,620 7,767 27.1%
Total revenue . . . . . . . . . . . . . . . . . . . . . . 248,499 77,929 272,890 53,538 19.6%Direct costs, excluding depreciation and
amortization . . . . . . . . . . . . . . . . . . . . . . . 117,550 38,759 119,779 36,530 30.5%Reimbursed out-of-pocket expenses . . . . . . . 28,708 7,679 28,620 7,767 27.1%Selling, general and administrative . . . . . . . 29,465 10,203 35,109 4,559 13.0%Acquisition and integration . . . . . . . . . . . . . . 9,297 12,420 — 21,717 —Impairment of goodwill . . . . . . . . . . . . . . . . . — — — — —Depreciation . . . . . . . . . . . . . . . . . . . . . . . . . 4,610 1,832 6,665 (223) -3.3%Amortization . . . . . . . . . . . . . . . . . . . . . . . . . 56,422 5,199 23,854 37,767 158.3%
Total operating expenses . . . . . . . . . . . . . 246,052 76,092 214,027 108,117 50.5%
Income from operations . . . . . . . . . . . . . . . . 2,447 1,837 58,863 (54,579) -92.7%Miscellaneous (expense) income, net . . . . . . (301) 1,213 (1,718) 2,630 -153.1%Interest expense, net . . . . . . . . . . . . . . . . . . (23,185) (3,272) (18,000) (8,457) 47.0%
(Loss) income before income taxes . . . . . . . . (21,039) (222) 39,145 (60,406) -154.3%Income tax (benefit) provision . . . . . . . . . . . (6,703) 1,014 14,301 (19,990) -139.8%
Net (loss) income . . . . . . . . . . . . . . . . . . . . . $ (14,336) $ (1,236) $ 24,844 $ (40,146) -162.7%
67

Net service revenue and Reimbursed out-of-pocket revenueNet service revenue was $219.8 million for the Successor nine month period ended December 31, 2014 and $70.3million for the Predecessor three month period ended March 31, 2014, compared to $244.3 million for thePredecessor year ended December 31, 2013. Results in the Successor nine month period ended December 31,2014, compared to the Predecessor three month period ended March 31, 2014 benefitted from a larger number ofoverall active projects. Compared to the Predecessor year ended December 31, 2013, the Predecessor three monthperiod ended March 31, 2014 also benefitted from more active projects, combined with relatively low projectcancellations. Average quarterly backlog conversion was 18.7% for the Successor nine month period endedDecember 31, 2014 and 19.6% for the Predecessor three month period ended March 31, 2014, compared to18.7% for the Predecessor year ended December 31, 2013.
Reimbursed out-of-pocket revenue was $28.7 million for the Successor nine month period ended December 31,2014, $7.7 million for the Predecessor three month period ended March 31, 2014 and $28.6 million for thePredecessor year ended December 31, 2013. Reimbursed out-of-pocket revenues fluctuate significantly from periodto period based on the timing of program initiation or closeout and these changes do not necessarily correlate tochanges in net service revenue. The reimbursements were offset by an equal amount of reimbursed out-of-pocketexpenses.
Direct costs, excluding depreciation and amortization and Reimbursed out-of-pocket expensesDirect costs, excluding depreciation and amortization, were $117.6 million for the Successor nine month periodended December 31, 2014 and $38.8 million for the Predecessor three month period ended March 31, 2014,compared to $119.8 million for the Predecessor year ended December 31, 2013. The increase for the Successornine month period ended December 31, 2014 and the Predecessor three month period ended March 31, 2014 wasprimarily due to an increase in revenue generating headcount from the Predecessor year ended December 31, 2013to support higher project activity and new business awards. Additionally, stock based compensation increased to$4.4 million for the Successor nine month period ended December 31, 2014 and $5.4 million for the Predecessorthree month period ended March 31, 2014, compared to $0.6 million for the Predecessor year ended December 31,2013. The increase in stock based compensation was primarily driven by the acceleration of stock option vestingthat occurred in advance of the Transaction and new stock based awards issued subsequent to the Transaction.
As a percentage of net service revenue, direct costs, excluding depreciation and amortization, increased to 53.5% ofnet service revenue for the Successor nine month period ended December 31, 2014 and 55.2% for the Predecessorthree month period ended March 31, 2014, compared to 49.0% for the Predecessor year ended December 31,2013. The primary driver of the increase as a percentage of net service revenue was the aforementioned higher stockbased compensation. As a percentage of net service revenue stock based compensation was 2.0% and 7.7% for theSuccessor nine month period ended December 31, 2014 and Predecessor three month period ended March 31,2014, respectively, compared to 0.3% for the Predecessor year ended December 31, 2013.
Selling, general and administrativeSelling, general and administrative expenses were $29.5 million for the Successor nine month period endedDecember 31, 2014 and $10.2 million for the Predecessor three month period ended March 31, 2014, comparedto $35.1 for the Predecessor year ended December 31, 2013. The increase was primarily related to higher litigationcosts resulting from a certain customer bad debt and an employee matter, representing $1.8 million for theSuccessor nine month period ended December 31, 2014 and $0.0 million for the Predecessor three month periodended March 31, 2014, compared to $0.0 million for the Predecessor year ended December 31, 2013. Furtherincreasing selling, general and administrative expenses was higher employee stock based compensation expense of$1.0 million for the Successor nine month period ended December 31, 2014 for stock based awards issued afterthe Transaction and $1.9 million for the Predecessor three month period ended March 31, 2014 due to theaforementioned acceleration of stock option vesting that occurred immediately prior to the Transaction, compared to$1.4 million for the Predecessor year ended December 31, 2013.
Selling, general and administrative expenses as a percentage of net service revenue were 13.4% for the for theSuccessor nine month period ended December 31, 2014 and 14.5% for the Predecessor three month period endedMarch 31, 2014, compared to 14.4% for the Predecessor year ended December 31, 2013. Growth of net service
68

revenue over for the Successor nine month period ended December 31, 2014 and Predecessor three month periodended March 31, 2014 outpaced the corresponding period increases to selling, general and administrative salaryand wage growth, causing the decrease as a percent of net service revenue, compared to the Predecessor year endedDecember 31, 2013.
Acquisition and integration expensesAcquisition and integration expenses were $9.3 million for the Successor nine month period ended December 31,2014 and $12.4 million for the Predecessor three month period ended March 31, 2014 related to the Transaction.There were no acquisition and integration expenses for the Predecessor year ended December 31, 2013. Theexpenses in the Successor nine month period ended December 31, 2014 and Predecessor three month period endedMarch 31, 2014 include attorney fees, advisory fees and other professional service fees related to the Transaction.
Depreciation and AmortizationDepreciation and amortization expense was $61.0 million for the Successor nine month period ended December 31,2014 and $7.0 million for the Predecessor three month period ended March 31, 2014, compared to $30.5 millionfor the Predecessor year ended December 31, 2013. The increase in depreciation and amortization was primarilyrelated to the Transaction in which $274.7 million in finite-lived intangible assets were identified and capitalized aspart of the purchase accounting adjustments as of April 1, 2014. The gross carrying value of finite-lived intangibleassets prior to the transaction date was $181.7 million. The additional capitalized intangible assets causeddepreciation and amortization expense to be 27.8% of net service revenue for the Successor nine month periodended December 31, 2014 and 10.0% of net service revenue for the Predecessor three month period endedMarch 31, 2014, compared to 12.5% of net service revenue for the Predecessor year ended December 31, 2013.The increase in depreciation and amortization expense in the Successor period ended December 31, 2014 is furtherdriven by certain intangible assets, such as backlog and customer relationships that have an acceleratedamortization that aligns to the time period over which cash flows of each respective intangible asset is generated.
Miscellaneous (expense) income, netMiscellaneous (expense) income, net was $0.3 million of expense for the Successor nine month period and $1.2million of income for the Predecessor three month period ended March 31, 2014, compared to $1.7 million ofexpense in the Predecessor year ended December 31, 2013. Changes in miscellaneous (expense) income, net weremainly attributed to foreign exchange gains or losses that arise in connection with the revaluation of short-term inter-company balances between our domestic and international subsidiaries, and gains or losses from foreign currencytransactions, such as those resulting from the settlement of third-party accounts receivables and payablesdenominated in a currency other than the local currency of the entity making the payment.
Interest expense, netInterest expense, net was $23.2 million for the Successor nine month period ended December 31, 2014 and $3.3million for the Predecessor three month period ended March 31, 2014, compared to $18.0 million for thePredecessor year ended December 31, 2013. Interest expense, net was 10.5% of net service revenue for theSuccessor nine month period December 31, 2014 and 4.7% of net service revenue for the Predecessor three monthperiod ended March 31, 2014, compared to 7.4% of net service revenue for the Predecessor year endedDecember 31, 2013. The increase in interest expense, net in the Successor nine month period ended December 31,2014 was related to entering into the Senior Secured Credit Facilities to finance a portion of the Transaction, whichincreased outstanding debt, net from $143.7 million (that was paid in full at the Transaction date) in thePredecessor three month period ended March 31, 2014, to $530.0 million as of December 31, 2014.
Income tax provision (benefit)We had an income tax benefit of $6.7 million for the Successor nine month period ended December 31, 2014,compared to a provision of $1.0 million for the Predecessor three month period ended March 31, 2014, and aprovision of $14.3 million for the Predecessor year ended December 31, 2013.
The effective tax rate for the Successor nine month period ended December 31, 2014 was 31.8%, compared tonegative 456.1% for the Predecessor three month period ended March 31, 2014. The change in the effective taxrates between the Successor nine month period ended December 31, 2014 and the Predecessor three month periodended March 31, 2014 was primarily due to an increase in the valuation allowance on U.S. deferred tax assetsrelating to a capital loss that was recorded in the Predecessor three month period ended March 31, 2014 due to the
69

sale of an investment. The valuation allowance was recorded in the Predecessor three month period endedMarch 31, 2014 because the Company did not anticipate generating taxable gains that could be used to offset thecapital loss. Another contributing factor was non-deductible stock based compensation expense recorded for thePredecessor three month period ended March 31, 2014 resulting from the acceleration of vesting of stock basedawards for foreign employees that occurred prior to the Transaction.
The effective tax rate for the Predecessor three month period ended March 31, 2014 was negative 456.1%,compared to 36.5% for the Predecessor year ended December 31, 2013. The change in the effective tax ratesbetween the Predecessor three month period ended March 31, 2014 and the Predecessor year ended December 31,2013 was primarily due to an increase in our valuation allowance on U.S. deferred tax assets. The valuationallowance was recorded on a deferred tax asset resulting from a capital loss realized in March 2014 on the sale of aninvestment. The capital loss is limited to offset future taxable gains which the Company does not anticipate will begenerated, resulting in a full valuation allowance. The change in the effective tax rate was also related to non-deductible stock based compensation expense related to foreign earnings due to the acceleration of stock basedawards vesting in advance of the Transaction.
70

Quarterly Results of Operations
The tables below present selected unaudited quarterly condensed consolidated statements of operations for our last eightcompleted fiscal quarters. The information for each of these quarters has been prepared on the same basis as ouraudited consolidated financial statements appearing elsewhere in this prospectus and, in the opinion of management,includes all adjustments of a normal recurring nature necessary for a fair presentation of the results of operations forthese periods. The quarterly results of operations should be read in conjunction with our audited consolidated financialstatements and related notes appearing elsewhere in this prospectus. The results for any interim period are notnecessarily indicative of the results that may be expected for a full year. Additionally, our historical results are notnecessarily indicative of future results.
SUCCESSOR
(In thousands, except per sharedata)
THREEMONTHSENDED
JUNE 30,2016
THREEMONTHSENDED
MARCH 31,2016
THREEMONTHSENDED
DECEMBER 31,2015
THREEMONTHSENDED
SEPTEMBER 30,2015
THREEMONTHSENDED
JUNE 30,2015
THREEMONTHSENDED
MARCH 31,2015
THREEMONTHSENDED
DECEMBER 31,2014
THREEMONTHSENDED
SEPTEMBER 30,2014
Revenue:Service revenue, net . . . . . . . $ 92,633 $87,800 $85,681 $81,638 $76,752 $76,030 $74,476 $ 68,773Reimbursed out-of-pocket
revenue . . . . . . . . . . . . . . 13,321 11,786 10,360 10,493 11,102 7,003 9,278 10,064
Total revenue . . . . . . . . . 105,954 99,586 96,041 92,131 87,854 83,033 83,754 78,837Operating Expenses:
Direct costs, excludingdepreciation andamortization . . . . . . . . . . 49,234 46,981 44,219 41,763 38,600 39,125 39,264 40,780
Reimbursed out-of-pocketexpenses . . . . . . . . . . . . . 13,321 11,786 10,360 10,493 11,102 7,003 9,278 10,064
Selling, general andadministrative . . . . . . . . . 14,824 13,509 18,255 15,295 11,706 11,742 10,247 10,382
Acquisition andintegration . . . . . . . . . . . — — — — — — (160) 50
Impairment of goodwill . . . . . — — 9,313 — — — — —Depreciation . . . . . . . . . . . . . 1,793 1,773 1,658 1,611 1,537 1,573 1,753 1,395Amortization . . . . . . . . . . . . . 12,668 12,668 13,125 15,774 17,042 17,201 18,879 18,771
Total operatingexpenses . . . . . . . . . . 91,840 86,717 96,930 84,936 79,987 76,644 79,261 81,442
Income (loss) from operations . . . 14,114 12,869 (889) 7,195 7,867 6,389 4,493 (2,605)Other (Expense) Income, Net:
Miscellaneous (expense)income, net . . . . . . . . . . (6) (935) (205) 50 (2) (976) (240) (247)
Net interest (expense)income . . . . . . . . . . . . . . (5,921) (5,973) (6,547) (6,737) (6,902) (7,073) (7,184) (7,766)
Other (expense) income,net . . . . . . . . . . . . . . (5,927) (6,908) (6,752) (6,687) (6,904) (8,049) (7,424) (8,013)
Income (loss) before incometaxes . . . . . . . . . . . . . . . . . . . 8,187 5,961 (7,641) 508 963 (1,660) (2,931) (10,618)
Income tax provision (benefit) . . . 3,225 2,513 935 641 868 (1,601) (1,218) (3,277)
Net income (loss) . . . . . . . . . . . . $ 4,962 $ 3,448 $ (8,576) $ (133) $ 95 $ (59) $ (1,713) $ (7,341)
Per Share DataNet income (loss) per share
attributable to commonstockholders:Basic . . . . . . . . . . . . . . . . . . . $ 0.15 $ 0.11 $ (0.27) $ (0.00) $ 0.00 $ (0.00) $ (0.06) $ (0.24)Diluted . . . . . . . . . . . . . . . . . $ 0.15 $ 0.11 $ (0.27) $ (0.00) $ 0.00 $ (0.00) $ (0.06) $ (0.24)
Weighted average common sharesoutstanding:Basic . . . . . . . . . . . . . . . . . . . 32,636 32,625 31,604 31,430 31,722 30,969 30,950 30,941Diluted . . . . . . . . . . . . . . . . . 32,828 32,625 31,604 31,430 31,770 30,969 30,950 30,941
71

The following table presents the reconciliation of net income (loss) to EBITDA, Adjusted EBITDA, and Adjusted Net Income:
SUCCESSOR
(In thousands, except per share data)
THREEMONTHSENDED
JUNE 30,2016
THREEMONTHSENDED
MARCH 31,2016
THREEMONTHSENDED
DECEMBER 31,2015
THREEMONTHSENDED
SEPTEMBER 30,2015
THREEMONTHSENDED
JUNE 30,2015
THREEMONTHSENDED
MARCH 31,2015
THREEMONTHSENDED
DECEMBER 31,2014
THREEMONTHSENDED
SEPTEMBER 30,2014
EBITDA and Adjusted EBITDA:Net income (loss) as reported . . . . . . . . . . . $ 4,962 $ 3,448 $ (8,576) $ (133) $ 95 $ (59) $ (1,713) $ (7,341)Interest expense, net . . . . . . . . . . . . . . . . . . 5,921 5,973 6,547 6,737 6,902 7,073 7,184 7,766Income tax provision (benefit) . . . . . . . . . . . 3,225 2,513 935 641 868 (1,601) (1,218) (3,277)Depreciation . . . . . . . . . . . . . . . . . . . . . . . . 1,793 1,773 1,658 1,611 1,537 1,573 1,753 1,395Amortization . . . . . . . . . . . . . . . . . . . . . . . . 12,668 12,668 13,125 15,774 17,042 17,201 18,879 18,771
EBITDA . . . . . . . . . . . . . . . . . . . . . . . . . . . . $28,569 $26,375 $ 13,689 $24,630 $26,444 $24,187 $24,885 $17,314
Stock compensation expense: liabilityawards mark-to-market and CEOaward(a) . . . . . . . . . . . . . . . . . . . . . . . . . 2,576 — 4,681 5,111 (185) 173 — —
Private equity transaction related cost(b) . . . — — — — — — (160) 50Corporate campus lease payments(c) . . . . . . (930) (930) (930) (930) (930) (930) (930) (925)Litigation matters(d) . . . . . . . . . . . . . . . . . . . — — 28 (2,761) (391) 17 207 410Impairment of goodwill . . . . . . . . . . . . . . . . — — 9,313 — — — — —Other transaction expenses(f) . . . . . . . . . . . . 453 314 — — — — — —
Adjusted EBITDA . . . . . . . . . . . . . . . . . . . . . $30,668 $25,759 $ 26,781 $26,050 $24,938 $23,447 $24,002 $16,849
Adjusted Net Income:Net income (loss) as reported . . . . . . . . . . . $ 4,962 $ 3,448 $ (8,576) $ (133) $ 95 $ (59) $ (1,713) $ (7,341)Amortization . . . . . . . . . . . . . . . . . . . . . . . . 12,668 12,668 13,125 15,774 17,042 17,201 18,879 18,771Stock compensation expense: liability
awards mark-to-market and CEOaward(a) . . . . . . . . . . . . . . . . . . . . . . . . . 2,576 — 4,681 5,111 (185) 173 — —
Private equity transaction related cost(b) . . . — — — — — — (160) 50Corporate campus lease
payments—principal portion(c) . . . . . . . (375) (369) (362) (354) (347) (229) (930) (201)Litigation matters(d) . . . . . . . . . . . . . . . . . . . — — 28 (2,761) (391) 17 207 410Impairment of goodwill . . . . . . . . . . . . . . . . — — 9,313 — — — — —Deferred financing fees(e) . . . . . . . . . . . . . . . 673 672 679 680 673 655 681 710Other transaction expenses(f) . . . . . . . . . . . . 453 314 — — — — — —Income tax effect of adjustments
(39.0%) . . . . . . . . . . . . . . . . . . . . . . . . (6,238) (5,181) (10,711) (7,196) (6,549) (6,949) (7,284) (7,699)
Adjusted Net Income . . . . . . . . . . . . . . . . . . $14,719 $11,552 $ 8,177 $11,121 $10,338 $10,809 $ 9,680 $ 4,700
Diluted Adjusted Net Income per share . . . . $ 0.45 $ 0.35 $ 0.26 $ 0.35 $ 0.33 $ 0.35 $ 0.31 $ 0.15Diluted average common shares
outstanding . . . . . . . . . . . . . . . . . . . . . . 32,828 32,625 31,604 31,430 31,770 30,969 30,950 30,941
(a) Consists of period end mark-to-market fair value adjustments associated with liability classified awards and the impact of a one-time stockbased compensation award to our Chief Executive Officer and founder. Future stock based awards activity are expected to be classified asequity for accounting purposes and will not be subject to period ending fair value adjustments.
(b) Represents attorney fees, advisory fees and other professional service fees incurred in connection with the Transaction.(c) Represents cash rental payments on two corporate headquarter buildings that are accounted for as deemed assets and subject to depreciation
expense over the life of the lease. Payments made for these leases are accounted for with a principal portion and an interest portion,consistent with deemed landlord liability accounting. For purposes of Free Cash Flow, the interest portion of these payments is included in netcash provided by operating activities in our statement of cash flows. The principal portion is reflected as a financing activity in our statementof cash flows. These adjustments for purposes of arriving at Adjusted EBITDA, Adjusted Net Income and Free Cash Flow have the effect ofpresenting these leases consistently with all other office lease rentals that we have globally.
(d) Represents non-recurring costs and recovery related to a customer bad debt and non-recurring expenses related to the settlement of anemployment related matter.
(e) Represents amortization of the discount and issuance costs deferred on the consolidated balance sheet associated with the issuance of theSenior Secured Credit Facility.
(f) Represents advisory costs and other fees related to this offering.
72

Liquidity and Capital Resources
We assess our liquidity in terms of our ability to generate cash to fund our operating, investing and financingactivities. Our principal sources of liquidity are operating cash flows and funds available for borrowing under ourSenior Secured Revolving Credit Facility (as defined below). As of June 30, 2016, we had cash and cash equivalentsof $17.0 million, including approximately $3.4 million of restricted cash, primarily related to advanced paymentsreceived pursuant to certain sponsor contracts. Approximately $5.8 million of our cash and cash equivalents, none ofwhich was restricted, was held by our foreign subsidiaries as of June 30, 2016. Additionally, as of June 30, 2016,we had $60.0 million available for borrowing under our Senior Secured Revolving Credit Facility.
Our expected primary cash needs on both a short and long-term basis are for investment in operational growth,capital expenditures, payment of debt and other general corporate purposes. We have historically funded ouroperations and growth, including acquisitions, with cash flow from operations and borrowings under our creditfacilities. We expect to continue expanding our operations through organic growth and selective strategic bolt-onacquisitions and investments. We expect these activities will be funded from existing cash, cash flow from operationsand, if necessary, borrowings under our existing or future credit facilities. We have deemed that foreign earnings willbe indefinitely reinvested and therefore we have not provided taxes on these earnings. While we do not anticipate theneed to repatriate these foreign earnings for liquidity purposes given our cash flows from operations and availableborrowings under existing and future credit facilities, we would incur taxes on these earnings if the need forrepatriation due to liquidity purposes arises.
We believe that our sources of liquidity and capital will be sufficient to finance our investment in operational growth,capital expenditures, payment of debt, selective strategic bolt-on acquisitions, other investments, additionalexpenses we expect to incur as a public company and other general corporate needs for the next 12 months and on alonger-term basis. However, we cannot assure you that our business will generate sufficient cash flow fromoperations, or that future borrowings will be available to us under our Senior Secured Credit Facilities or otherwise,in an amount sufficient to fund our liquidity needs. If our cash flows and capital resources are insufficient to serviceour indebtedness, we may be forced to reduce or delay capital expenditures, sell assets, seek additional capital orrestructure or refinance our indebtedness. These alternative measures may not be successful and may not permit usto meet our scheduled debt service obligations. Our ability to restructure or refinance our debt will depend on thecondition of the capital markets and our financial condition at such time. Any refinancing of our debt could be athigher interest rates and may require us to comply with more onerous covenants, which could further restrict ourbusiness operations. In addition, the terms of existing or future debt agreements may restrict us from adopting someof these alternatives. In the absence of such operating results and resources, we could face substantial liquidityproblems and might be required to dispose of material assets or operations to meet our debt service and otherobligations. We may not be able to consummate those dispositions for fair market value or at all, and any proceedsthat we could realize from any such dispositions may not be adequate to meet our debt service obligations then due.See “Risk Factors—Risks Relating to our Indebtedness—We may not be able to generate sufficient cash to serviceall of our indebtedness, and may be forced to take other actions to satisfy our obligations under our indebtednessthat may not be successful.”
73

Discussion of Cash Flows
SUCCESSOR PREDECESSOR
Cash Flows (In thousands)
SIXMONTHSENDED
JUNE 30,2016
SIXMONTHSENDED
JUNE 30,2015
YEAR ENDEDDECEMBER 31,
2015
NINE MONTHPERIOD FROMAPRIL 1, 2014
THROUGHDECEMBER 31,
2014
THREEMONTHPERIODFROM
JANUARY 1,2014
THROUGHMARCH 31,
2014
YEAR ENDEDDECEMBER 31,
2013
Net cash provided by operatingactivities . . . . . . . . . . . . . . . . . . . . $ 19,982 $ 26,271 $ 84,117 $ 62,539 $ 12,807 $ 98,142
Net cash used in investingactivities . . . . . . . . . . . . . . . . . . . . (5,653) (2,658) (6,432) (907,640) (827) (4,472)
Net cash (used in) provided byfinancing activities . . . . . . . . . . . . (15,678) (65,702) (116,489) 900,171 (17,968) (95,851)
Effect of exchange rates on cash andcash equivalents . . . . . . . . . . . . . . 143 (95) (601) (785) (25) 159
Increase (decrease) in cash and cashequivalents . . . . . . . . . . . . . . . . . . (1,206) (42,184) (39,405) 54,285 (6,013) (2,022)
Cash Flows from Operating ActivitiesCash flows from operations are driven mainly by net income and net movement in accounts receivable and unbilled,net, advanced billings, pre-funded liabilities, accounts payable and accrued expenses. Accounts receivable andunbilled, net, advanced billings and pre-funded liabilities fluctuate on a regular basis as we perform our services, billour customers and ultimately collect on those receivables. We attempt to negotiate payment terms in order to providefor payments prior to or soon after the provision of services, but this timing of collection can vary significantly on aperiod by period comparative basis.
Net cash provided by operating activities was $20.0 million for the six months ended June 30, 2016 consisting ofnet income of $8.4 million. Adjustments to reconcile net income to net cash provided by operating activities were$33.8 million, primarily related to amortization of intangibles of $25.3 million, depreciation of $3.6 million andstock based compensation expense of $4.3 million. Changes in operating assets and liabilities used $22.3 million inoperating cash flows and were primarily driven by increased accounts receivable and unbilled, net of $24.8 million,increased prepaid expenses and other assets of $8.5 million primarily related to federal tax payments and decreasedaccounts payable of $2.1 million, offset by increased pre funded study costs of $2.4 million and advanced billingsof $15.0 million.
Net cash provided by operating activities was $26.3 million for the six months ended June 30, 2015 consisting ofnet income of less than $0.1 million. Adjustments to reconcile net income to net cash provided by operatingactivities were $37.3 million, primarily related to amortization of intangibles of $34.2 million, depreciation of $3.1million and stock based compensation expense of $4.9 million, offset by $6.5 million of benefit from deferred taxes.Changes in operating assets and liabilities used $11.0 million in operating cash flows and were primarily driven bylower accrued expenses of $2.8 million related to incentive compensation payments and $6.5 million from adecrease in advanced billings offset by a decrease in accounts receivable and unbilled, net of $6.7 million.
Net cash provided by operating activities was $84.1 million for the Successor year ended December 31, 2015,consisting of a net loss of $(8.7) million. Adjustments to reconcile net loss to net cash provided by operatingactivities were $90.9 million, primarily related to amortization of intangibles of $63.1 million, depreciation of $6.4million, impairment of goodwill of $9.3 million and stock based compensation expense of $22.3 million, offset by atax benefit of $12.7 million. Changes in operating assets and liabilities provided $1.9 million in operating cashflows and were driven primarily by an increase in pre-funded cash and a decrease in prepaid assets while beingoffset by a decrease in advanced billings and an increase in restricted cash.
74

Net cash provided by operating activities was $62.5 million for the Successor nine month period endedDecember 31, 2014, consisting of a net loss of $(14.3) million. Adjustments to reconcile net loss to net cashprovided by operating activities were $58.7 million, primarily related to amortization of intangibles of $56.4 million.Changes in operating assets and liabilities over the period provided $18.1 million in operating cash flows and weredriven primarily by an increase in accrued expenses related to employee incentive compensation of $11.0 millionand an increase in advanced billings of $6.0 million.
Net cash provided by operating activities was $12.8 million for the Predecessor three month period endedMarch 31, 2014, consisting of a net loss of $(1.2) million. Adjustments to reconcile net loss to net cash provided byoperating activities were $14.3 million, primarily related to stock based compensation expense of $7.3 million as aresult of accelerated vesting of stock awards during this period, along with amortization of $1.8 million anddepreciation of $5.2 million in the period. Changes in operating assets and liabilities over the period used $0.3million in operating cash flows and were driven primarily by increases in accounts receivable and prepaid expensebalances and decreases in accrued expenses as a result of incentive compensation payments in the period offset byan increase in accounts payable.
Net cash provided by operations was $98.1 million for the Predecessor year ended December 31, 2013, consistingof net income of $24.8 million. Adjustments to reconcile net income to net cash provided by operating activitieswere $44.4 million, primarily related amortization of intangibles of $23.9 million, depreciation of $6.7 million, losson the sale of an equity investment of $2.3 million and provision for taxes of $6.0 million. Changes in operatingassets and liabilities over the Predecessor year ended December 31, 2013 provided $28.9 million in operating cashflows and were driven primarily by increases in advanced billings of $10.7 million, increases of accrued expenses of$8.3 million and decreases to prepaid expense balances of $4.8 million.
Cash Flows from Investing ActivitiesNet cash used in investing activities was $5.7 million for the Successor six months ended June 30, 2016, primarilyconsisting of property and equipment expenditures.
Net cash used in investing activities was $2.7 million for the Successor six months ended June 30, 2015, primarilyconsisting of property and equipment expenditures.
Net cash used in investing activities was $6.4 million for the Successor year ended December 31, 2015 primarilyconsisting of capital expenditures relating to property and equipment purchases.
Net cash used in investing activities was $907.6 million in the Successor nine month period ended December 31,2014. The cash used in investing activities was primarily related to the Transaction, which we completed for$903.5 million net of cash received in the Successor nine month period ended December 31, 2014. Cash used inthe period for property and equipment purchases was $4.2 million.
Net cash used in investing activities was $0.8 million in the Predecessor three month period ended March 31, 2014consisting of property and equipment expenditures.
Net cash used in investing activities was $4.5 million in the Predecessor year ended December 31, 2013 consistingof property and equipment expenditures.
Cash Flows from Financing ActivitiesNet cash used in financing activities was $15.7 million for the Successor six months ended June 30, 2016,primarily consisting of a $15.0 million principal payment on our Senior Secured Term Loan Facility.
Net cash used in financing activities was $65.7 million for the Successor six month period ended June 30, 2015,primarily related to $65.0 million in principal payments on our Senior Secured Term Loan Facility.
Net cash used in financing activities was $116.5 million in the Successor year ended December 31, 2015, primarilyrelated to $116.1 million in principal payments on our Senior Secured Term Loan Facility.
Net cash provided in financing activities was $900.2 million for the Successor nine month period endedDecember 31, 2014. The cash provided was primarily related to $414.0 million from the issuance of common stockand $511.8 million, net of debt issuance costs, from the issuance of debt under our Senior Secured Term LoanFacility on April 1, 2014 as part of the Transaction. Debt payments under the Senior Secured Term Loan Facilityoffset total cash provided by $25.2 million in the period.
75

Net cash used in financing activities was $18.0 million in the Predecessor three month period ended March 31,2014, primarily related to $23.1 million utilized to repay our then outstanding credit facility as of March 31, 2014.This amount was offset by $5.3 million of excess tax benefit received from the acceleration of vesting related tooutstanding stock based compensation awards in conjunction with the Transaction.
Net cash used in financing activities was $95.9 million in the Predecessor year ended December 31, 2013,primarily related to the pay down of debt.
Indebtedness
In conjunction with the Transaction, on April 1, 2014, we entered into a new credit agreement, or the SeniorSecured Credit Agreement, which provided for a $530.0 million term loan, or the Senior Secured Term Loan Facility,and a $60.0 million revolving credit facility, or the Senior Secured Revolving Credit Facility, and, together with theSenior Secured Term Loan Facility, the Senior Secured Credit Facilities. The Senior Secured Term Loan Facilityexpires in April 2021 and the Senior Secured Revolving Credit Facility expires in April 2019. The Senior SecuredCredit Facilities proceeds were utilized to finance a portion of the Transaction, which upon consummation resultedin the extinguishment of our previously existing $335.0 million credit agreement that consisted of a $285.0 millionterm loan and a $50.0 million revolving credit agreement, of which $143.7 million was outstanding at the time ofextinguishment. The Senior Secured Credit Facilities are guaranteed by the Company and certain of its subsidiaries.
From April 1, 2014 to the date on which the first compliance certificate accompanying financials was deliveredunder the Senior Secured Credit Facilities, borrowings under the Senior Secured Credit Facilities bore interest at ouroption, equal to a Eurocurrency rate plus a margin of 4.00% and 3.75%, or a base rate plus a margin of 3.00% and2.75% for the Senior Secured Term Loan Facility and Senior Secured Revolving Credit Facility, respectively. TheEurocurrency rate is based on LIBOR for U.S. dollar deposits for loans denominated in dollars, EURIBOR for Eurosdeposits for loans denominated in Euros and the offer rate for any other currencies for loans denominated in suchother currencies and, in each case, is subject to a 1.00% floor. The base rate is defined as the highest of (a) theFederal Funds Rate on such day plus 1⁄2 of 1.00%, (b) the Prime Lending Rate on such day, (c) the AdjustedEurocurrency Rate for Loans denominated in U.S. dollars published on such day for an Interest Period of one monthplus 1.00% and (d) 2.00%. At our discretion, we may choose interest periods of one, two, three or six months, orthe Eurocurrency term, which determines the interest rate to be applied. Interest on the Eurocurrency rate loancontinues to be payable at the end of the selected Eurocurrency term and interest on the base rate tranche of theSenior Secured Term Loan Facility is payable quarterly in conjunction with any required principal payments.
Since the delivery of the first compliance certificate accompanying financials under the Senior Secured CreditFacilities, the borrowings under the Senior Secured Credit Facilities bear interest at a rate per annum equal to anapplicable spread, within two pricing tiers that are determined upon achievement towards a defined total net debt toconsolidated EBITDA leverage ratio, plus a Eurocurrency or base rate. The first pricing tier lowers the Eurocurrencyand base rate margin spreads to 3.75% and 2.75% and 3.50% and 2.50% for the Senior Secured Term LoanFacility and Senior Secured Revolving Credit Facility, respectively, while the second pricing tier retains the spreadsapplicable to the initial interest periods described in the previous paragraph. The Eurocurrency rate is subject to aminimum floor of 1.00% and the base rate is subject to a floor of 2.00%. As of June 30, 2016, we were subject toan interest rate of 4.75% for the Senior Secured Term Loan Facility, which represents the minimum 1.00%Eurocurrency floor plus the first tier pricing spread of 3.75%.
We also pay commitment fees on a quarterly basis at an annual rate of 0.50% of the unused borrowings under theSenior Secured Revolving Credit Facility, which is recorded as a component of interest expense, net in theconsolidated statements of operations. The commitment fee is subject to a pricing level reduction to 0.375% whenwe achieve a funded first lien debt to consolidated EBITDA (as defined under the Senior Secured Credit Facilities)ratio of equal to or less than 4.25:1.00 on any given date. As of June 30, 2016, we achieved the targetedrequirement.
The Senior Secured Term Loan Facility is subject to quarterly amortization equal to 0.25% of the initial aggregateprincipal amount, with the balance due at final maturity. The following amounts are required to be prepaid inaddition to quarterly installment payments and will be applied to repay the Senior Secured Term Loan Facility,subject to certain thresholds, carve-outs, exceptions and reinvestment rights: (a) 50% of our annual Excess Cash
76

Flow (as defined under the Senior Secured Credit Facilities) commencing with the fiscal year ended December 31,2015 (or 25% or 0% of our annual Excess Cash Flow thereafter if we achieve a funded first lien debt to consolidatedEBITDA ratio of equal to or less than 4.25:1.00 or 3.75:1.00, respectively); (b) 100% of the net cash proceeds ofinsurance proceeds of a condemnation award in respect of any equipment, fixed assets or real property subject tocertain reinvestment rights; (c) 100% of the net cash proceeds of any occurrence of indebtedness by us or certain ofour subsidiaries; and (d) 100% of the net cash proceeds of certain non-ordinary course asset sales or dispositions ofproperty by us or certain subsidiaries subject to certain reinvestment rights. In addition to the mandatory paymentsabove, we may voluntarily repay the outstanding Senior Secured Term Loan Facility without premium or penalty,subject to certain restrictions. As of June 30, 2016, we had made principal payments of $155.0 million, which was$144.4 million ahead of originally scheduled requirements. This amount has satisfied all required quarterly principalinstallment payments over the term of the Senior Secured Term Loan Facility.
The Senior Secured Credit Agreement details various covenants with which we are required to comply. Thesecovenants, as defined in the Senior Secured Credit Agreement, among other things, limit our ability and the ability ofour restricted subsidiaries to, with certain exceptions:
■ create, incur or assume any lien upon any of our property, assets or revenue;■ make or hold certain investments;■ incur or assume any indebtedness;■ merge, dissolve, liquidate or consolidate with or into another person;■ make certain dispositions of property or other assets (including sale leaseback transactions);■ declare or make certain restricted payments, including dividends;■ enter into certain transactions with affiliates;■ prepay subordinated debt;■ enter into burdensome agreements;■ engage in any material line of business substantially different from our currently conducted business; or■ change our fiscal year.
In addition, if we have drawn greater than 30% of the commitments under the Senior Secured Revolving CreditFacility as of the last date of any quarter, then we are required to report compliance with a financial covenant that istested at the end of such quarter. This financial covenant requires us to maintain a funded first lien net debt toconsolidated EBITDA leverage ratio of less than or equal to 8.00:1.00 for any fiscal quarter ending on or prior toMarch 31, 2016 and 7.50:1.00, thereafter. As of June 30, 2016, we maintained a net debt to consolidated EBITDAleverage ratio, as defined under the Senior Secured Credit Facilities, of 2.95:1.00. As of June 30, 2016, we were incompliance with all covenants under our Senior Secured Credit Agreement.
A breach of these covenants, or the occurrence of other Events of Default (as defined in the Senior Secured CreditAgreement) could result in an event of default, which would permit or require the principal outstanding under theSenior Secured Credit Facilities to become or to be declared due and payable. Occurrences other than the breach ofcovenants that are considered Events of Default include, but are not limited to, (a) non-payment of principal orinterest, (b) certain bankruptcy related events, (c) cross defaults with certain other indebtedness, (d) defaults onmonetary judgement orders, (e) certain ERISA events, (f) actual or asserted invalidity of any guarantee or securitydocument and (g) change in control. Our ability to satisfy these covenant requirements or prevent Events of Defaultin future periods will depend on occurrences or events that may be beyond our control, and therefore, there is noguarantee that we will be able to prevent these occurrences.
All of our obligations under the Senior Secured Credit Facilities are guaranteed by us and our material, wholly ownedsubsidiaries, with certain exceptions, including where providing such guarantees is not permitted by law, regulationor contract or would result in adverse tax consequences. All of our obligations under the Senior Secured CreditFacilities are secured, subject to certain permitted liens and other exceptions, by substantially all of the assets of theborrower and each guarantor, included, but not limited to, a perfected pledge of all of the capital stock issued by usand each guarantor and, subject to certain exceptions, perfected security interests in substantially all other tangibleand intangible assets of us and each guarantor.
77

As of June 30, 2016, we had total indebtedness of $364.0 million, substantially all of which was attributed tooutstanding borrowings on the Senior Secured Term Loan Facility. There were no outstanding borrowings under theSenior Secured Revolving Credit Facility as of June 30, 2016. In addition, as of June 30, 2016, we had less than$0.1 million in letters of credit outstanding related to certain operating lease obligations, which are secured by theSenior Secured Revolving Credit Facility.
Contractual Obligations and Commercial Commitments
We have various contractual obligations, which are recorded as liabilities in our consolidated financial statements.Other items, such as operating lease obligations, are not recognized as liabilities in our consolidated financialstatements but are required to be disclosed. The following table summarizes our future payments for all contractualobligations and commercial commitments for the years subsequent to the Successor year ended December 31,2015:
PAYMENTS DUE BY PERIOD
Contractual Obligations (In thousands) TOTALLESS THAN
1 YEAR 1-3 YEARS3-5
YEARSMORE THAN
5 YEARS
Long-term debt obligations . . . . . . . . . . . . . . . . . . . . . $390,000 $ — $ — $ — $390,000Interest on long-term debt . . . . . . . . . . . . . . . . . . . . . 100,045 19,206 38,023 38,076 4,740Capital lease obligations . . . . . . . . . . . . . . . . . . . . . . . 62 62 — — —Operating lease obligations . . . . . . . . . . . . . . . . . . . . . 30,291 6,160 9,660 6,840 7,631Deemed landlord liabilities . . . . . . . . . . . . . . . . . . . . . 47,378 3,757 7,723 7,925 27,973Management fees . . . . . . . . . . . . . . . . . . . . . . . . . . . . 250 250 — — —
Total . . . . . . . . . . . . . . . . . . . . . . . . . . . . . . . . . . . . . . $568,026 $29,435 $55,406 $52,841 $430,344
The interest payments on long-term debt in the above table are based on interest rates in effect as of December 31,2015.
The management fee represents fees paid to Cinven. This fee is paid annually in equal quarterly installments. Themanagement fee remains in effect through 2024, unless amended or terminated by mutual agreement. However,this agreement will terminate upon the consummation of this offering. Due to the uncertainty of the term, we haveonly included one year of management fees in the above table.
We have recorded a tax liability for unrecognized benefits for uncertain tax positions of $2.6 million, which has notbeen included in the above table due to the uncertainties in the timing of settlement of the income tax positions.
We are party to certain vendor contracts related to clinical services that if cancelled may require payment for servicesperformed and potentially additional services required to protect safety of subjects. The value of these potentialwind-down provisions is generally borne by our customers and is not practical to estimate.
Off-Balance Sheet Arrangements
Off balance sheet arrangements refer to any transaction, agreement or other contractual arrangement to which anentity not consolidated under our entity structure exists, where we have an obligation arising under a guaranteecontract, derivative instrument or variable interest or a retained or contingent interest in assets transferred to suchan entity or similar arrangement that serves as credit, liquidity or market risk support for such assets. We have no offbalance sheet arrangements currently.
Critical Accounting Policies and Estimates
The preparation of financial statements in accordance with generally accepted accounting principles in the UnitedStates of America, or U.S. GAAP, requires us to make a variety of decisions which affect reported amounts andrelated disclosures, including the selection of appropriate accounting principles and the assumptions on which to
78

base accounting estimates. In reaching such decisions, we apply judgment based on our understanding and analysisof the relevant circumstances, including our historical experience and other assumptions. Actual results could differfrom our estimates. We are committed to incorporating accounting principles, assumptions and estimates thatpromote the representational faithfulness, verifiability, neutrality and transparency of the accounting informationincluded in the financial statements.
Net Service Revenue RecognitionWe generally enter into contracts with customers to provide services ranging in duration from a few months to severalyears. The contract terms generally provide for payments based on a fixed-fee or unit-of-servicearrangement. Revenue on these arrangements is recognized when there is persuasive evidence of an arrangement,the service offering has been delivered to the customer, the arrangement consideration is determinable and thecollection of the fees is reasonably assured.
A majority of our contracts provide for services based on a fixed-fee arrangement, in which revenue is recognizedbased on the proportional performance methodology. Under this methodology, revenue recognition is determined byassessing the proportion of performance completed or delivered to date compared to total specific measures to bedelivered or completed under the terms of the arrangement. The measures utilized to assess performance arespecific to the service provided, and the Company generally compares the ratio of hours completed to the totalestimated hours necessary to complete the contract. A detailed project budget by hours is developed based on manyfactors, including, but not limited to, the scope of the work, the complexity of the study, the participating geographiclocations and the Company’s historical experience. We believe the reporting and estimation of hours is the bestavailable measure of progress on many of the services provided and best reflects the pattern in which obligations tocustomers are fulfilled. To assist with the estimation of hours expected to complete a project, regular contractreviews for each project are performed in which performance to date is compared to the most current estimate tocomplete assumptions. The reviews include an assessment of effort incurred to date compared to expectations basedon budget assumptions and other circumstances specific to the project. The total estimated hours necessary tocomplete a fixed-fee contract, based on these reviews, is updated and any revisions to the existing hours budgetresult in cumulative adjustments to the amount of revenue recognized in the period in which the revisions areidentified. Because of the uncertainties inherent in estimating the hours necessary to fulfill contractual obligations,it is possible that estimates may change in the near term, resulting in a material change in revenue reported.
Fixed-fee contracts provide for pricing modifications upon scope of work changes. We recognize revenue related towork performed in connection with scope changes when the underlying services are performed, a binding contractualcommitment has been executed with the customer and collectability is reasonably assured. If our customers do notagree to price renegotiation upon changes in our scope of work, we could be exposed to cost overruns and reducedcontract profitability. Costs are not deferred in anticipation of contracts being awarded or amendments beingfinalized, but are expensed as incurred.
For unit-of–service arrangements, we recognize revenue in the period in which the unit is delivered. Service unitelements largely consist of various project management, consulting and analytical testing services.
Many contractual arrangements combine multiple service elements. For these contracts, arrangement considerationis allocated to identified units of accounting based on the relative selling price of each unit of account. The bestevidence of selling price of a unit of accounting is vendor specific objective evidence, or VSOE, which is the pricecharged when the deliverable is sold separately. When VSOE is not available to determine selling price, managementuses relative third party evidence, if available. When neither VSOE nor third party evidence of selling price exists, weuse the best estimate of selling price considering all relevant information that is available without undue cost andeffort.
Most contracts are terminable by the customer, either immediately or according to advance notice terms specifiedwithin the contracts. These contracts require payment of fees to us for services rendered through the date oftermination and may require payment for subsequent services necessary to conclude the study or close out thecontract. Final settlement amounts are typically subject to negotiation with the customer. These amounts areincluded in net service revenue when realization is reasonably assured.
79

We occasionally enter into volume rebate arrangements with customers that provide for rebates if certain specifiedspending thresholds are met. These rebate obligations are recorded as a reduction of revenue when it appearsprobable that the customer will earn the rebates and the related amount is estimable.
We record revenue net of any tax assessments by governmental authorities that are imposed and concurrent withspecific revenue generating transactions.
Allowance for Doubtful AccountsWe grant credit terms to our customers prior to signing a service contract and monitor creditworthiness on anongoing basis. We assess ongoing collectability by customer through a variety of performance indicators includingage of billed receivable, billing type, knowledge of available funding and other information available through internalresearch. A large percentage of our customers are small biopharmaceutical companies that rely on funding frominvestors to finance their operations. This creates a heightened risk related to their creditworthiness. The Companymaintains an allowance for doubtful accounts for accounts receivable specifically identified that are at risk of notbeing collected.
Uncollectible accounts receivable are written off only after all reasonable collection efforts have been exhausted.Moreover, in many cases the Company requires advance payment from its customers for a portion of the studycontract price upon the signing of a service contract. These advance payments are deferred and recognized asrevenue as services are performed.
Long-Lived Assets, Goodwill and Indefinite Lived Intangible Assets
Tangible AssetsLong-lived assets, primarily property and equipment and finite-lived intangible assets, are reviewed for impairmentand the reasonableness of the estimated useful lives whenever events or changes in circumstances indicate that thecarrying amounts of the assets may not be recoverable or that a change in useful life may be appropriate.Recoverability for long-lived assets is determined by comparing the forecasted undiscounted cash flows of theoperation to which the assets relate to the carrying amount of the assets. If the undiscounted cash flows are lessthan the carrying amount of the assets, then the Company reduces the carrying value of the assets to estimated fairvalues, which are primarily based upon forecasted discounted cash flows. Fair value of long-lived assets isdetermined based on a combination of discounted cash flows and market multiples.
GoodwillGoodwill represents the excess of purchase price over the fair value of net assets acquired in business combinations.As a result of the Transaction, we recognized $670.3 million of goodwill that was allocated to and recorded at thereporting unit level. Our reporting units are Phase II-IV clinical research services, or Phase II-IV, Laboratories andClinics.
The carrying value of goodwill is reviewed at least annually for impairment, or as indicators of potential impairmentare identified, at the reporting unit level. We perform our annual goodwill impairment test during the fourth quartereach year, utilizing the quantitative two step model defined by accounting guidance which governs suchassessments. The first step involves the comparison of each of our reporting unit carrying values, inclusive ofassigned goodwill, to their respective estimated fair values. If a reporting unit carrying value exceeds estimated fairvalue, a second step requiring us to calculate the implied reporting unit goodwill fair value is performed. The impliedfair value of goodwill is determined by performing a hypothetical purchase price allocation of reporting unit fair valueto the reporting units identified assets and liabilities. The resulting implied goodwill fair value is compared tocarrying value to determine the extent of impairment, if any exists. Reporting unit fair value is estimated using acombination of the income approach, a discounted cash flow analysis, and the market approach, utilizing theguideline company method. The reporting unit’s discounted cash flow analysis requires significant managementjudgment with respect to net service revenue, direct costs, excluding depreciation and amortization, selling, generaland administrative expenses, capital expenditures and the selection and use of an appropriate discount rate. Theprojected revenue and expense assumptions and capital expenditures are based on our annual and long-termbusiness plans. Discount rates reflect market-based estimates of the risks associated with the projected cash flowsdirectly resulting from the use of those assets in operations.
80

In conjunction with the 2015 fourth quarter annual assessment of goodwill, we determined that goodwill related toour Clinics reporting unit was impaired and we recognized an impairment charge of $9.3 million, which represents100% of the goodwill that had been allocated to this reporting unit. This impairment was identified during theannual impairment assessment in the fourth quarter of 2015 when we updated our forecasted discounted cash flowsrelated to the reporting unit to reflect operating results that lagged prior forecasted results. For our Phase II-IV andLaboratories reporting units, the reporting units’ fair values significantly exceeded their respective carrying valuesincluding allocated goodwill.
This process is inherently subjective and dependent upon estimates and assumptions we make. In determining ourexpected future cash flows, we assume that we will continue to acquire and convert new business to contract,execute on these contracts with reasonable profit, collect customer receivables and thus generate positive cashflows. However, future declines in the operating results of these reporting units could indicate a need to reevaluatethe fair value of these components under accounting guidance governing goodwill and may ultimately result in futureimpairment. We continue to monitor for any potential indicators of impairment.
Intangible AssetsThe Company has an indefinite lived intangible asset related to its trade name valued at $31.6 million. The carryingvalue of the trade name asset is reviewed at least annually for impairment, or as indicators of potential impairmentare identified. The Company performs its annual impairment test in the fourth quarter each year in conjunction withits annual assessment of goodwill. The assessment consists of comparing the carrying value of the indefinite livedintangible asset to its estimated fair value, utilizing the relief from royalty method, an income approach valuation.The relief from royalty method requires management judgment with respect to projected net service revenue,profitability and growth and the selection and use of an appropriate discount rate. There was no indication ofimpairment related to the trade name asset based on the fourth quarter 2015 assessment.
Our assessment of impairment charges on any assets classified currently as having indefinite lives could change infuture periods if certain events were to occur, including, but not limited to, the following: a significant change inbusiness results, an increase in our discount rates due to a change in our weighted average cost of capital, adecrease in growth rates, economic deterioration that is more severe or longer in duration than anticipated or anothersignificant economic event.
Finite-lived intangible assets consist mainly of the value assigned to customer relationships, backlog and developedtechnologies. Finite-lived intangible assets are amortized straight-line or using an accelerated method over theirestimated useful lives, which range in term from 17 months to 15 years. Amortization expense recognized related tofinite lived intangible assets was $25.3 million for the Successor six months ended June 30, 2016, $34.2 millionfor the Successor six months ended June 30, 2015, $63.1 million for the Successor year ended 2015, $56.4million for Successor nine month period ended December 31, 2014, $5.2 million for the Predecessor three monthperiod ended March 31, 2014 and $23.9 million for the Predecessor year ended December 31, 2013.
Income TaxesWe are subject to income taxes in the United States and numerous foreign jurisdictions. Significant judgement isrequired in the forecasting of taxable income using historical and projected future operating results in determiningour provision for income taxes and the related assets and liabilities. The provision for income taxes includes incometaxes paid, currently payable and receivable, and deferred taxes.
We record deferred tax assets and liabilities based on temporary differences between the financial statement basesand tax bases of assets and liabilities. Deferred tax assets are recorded for tax benefit carryforwards using tax ratesanticipated to be in effect in the year in which temporary differences are expected to reverse. If it does not appearmore likely than not that the full value of a deferred tax asset will be realized, the Company records a valuationallowance against the deferred tax asset, with an offsetting charge to the Company’s income tax provision or benefit.
The recoverability of our deferred tax assets is estimated based on consideration of all available positive and negativeevidence, including, but not limited to, our ability to generate a sufficient level of future taxable income, reversals ofdeferred tax liabilities (other than those with an indefinite reversal period), tax planning strategies and recentfinancial performance. The assessment of recoverability is performed on a jurisdiction by jurisdiction basis. Based onthe analysis of the above factors, we determined that as of June 30, 2016 and December 31, 2015 a valuation
81
allowance in the amount of $1.0 million was required relating to certain foreign operating loss carryforwards, a U.S.capital loss carryforward and U.S. state and local tax credits and carryforwards. Differences in actual resultscompared to our estimates and changes in our assumptions could result in an adjustment to the valuation allowancein the future and would generally impact earnings or other comprehensive income depending on the nature of therespective deferred asset for which the valuation allowance exists.
We have recognized certain liabilities, including penalties and interest in the amount of $2.6 million for theSuccessor year ended December 31, 2015, within other long-term liabilities on the consolidated balance sheets.These relate to uncertain tax positions that are subject to various assumptions and judgement. Liabilities for theseuncertain tax positions are assessed on a position by position basis. The calculation of these liabilities involvesdealing with uncertainties in the application of complex tax regulations in both domestic and foreign jurisdictions.These positions may be subject to audit and review by tax authorities, and may result in future taxes, interest andpenalties if we are unsuccessful in defending our positions. If the calculation of liability related to uncertain taxpositions proves to be more or less than the ultimate assessment, a tax expense or benefit to expense, respectivelywould result.
As of June 30, 2016 and December 31, 2015, as a result of an updated analysis of future cash needs in the UnitedStates and opportunities for investment outside the United States, we assert that all foreign earnings will beindefinitely reinvested and therefore we have not provided taxes on these earnings. These undistributed earnings offoreign subsidiaries will support future growth in foreign markets and maintain current operating needs of foreignlocations. We will continue to monitor our assertion related to investment of foreign earnings.
Stock Based CompensationWe have stock based compensation plans in which we issue stock based awards to employees and directors in theform of vested common shares, stock options and restricted stock awards (RSAs and RSUs). Certain of our awardsare subject to equity classification, while others are subject to liability classification pursuant to the terms of theaward grants and based on accounting guidance which governs such transactions. Accounting guidance applicable toequity classified awards require all stock based compensation, including vested shares, grants of employee stockoptions and restricted stock to be recognized in the consolidated statements of operations based on their grant datefair values. Awards subject to liability classification are initially measured and recognized in the consolidatedstatements of operations at the grant date fair value, but are adjusted to fair value each period during the requisiteservice period, with changes in fair value recognized as compensation cost over the vesting period or in the period inwhich the change occurs for awards that have vested but have not yet settled.
The fair value of our common stock for vested common shares, restricted stock awards and underlying stock optiongrants is determined in accordance with guidelines outlined in the American Institute of Certified PublicAccountants Practice Aid, Valuation of Privately-Held-Company Equity Securities Issued as Compensation, or AICPAPractice Aid. In the absence of a public market, we considered all relevant facts and circumstances known at thetime of valuation, made certain assumptions based on future expectations and exercised significant judgment todetermine the fair value of our common stock. The factors considered in determining fair value include, but are notlimited to the following:
■ Valuations of our common stock performed by an unrelated third-party specialist on a bi-annual basis;■ Our results of operations and financial position and estimated trends and projections of our future operating
and financial performance;■ The market performance of publically traded companies in the clinical research industry;■ The likelihood of achieving a liquidity event, such as an initial public offering or sale of our company, given
prevailing market conditions;■ The common shares underlying the awards involved illiquid securities in a private company; and■ External market conditions affecting the pharmaceutical and biotechnology industries.
An unrelated third-party specialist performs a common share valuation, under the guidelines outlined in the AICPAPractice Aid, each year as of April 1 and October 1 (in conjunction with our annual assessment of goodwill). Thesevaluations are estimated using a combination of the income approach, a discounted cash flow analysis and themarket approach, utilizing the guideline company method. The discounted cash flow method involves cash flow
82

projections that are discounted at an appropriate rate while the guideline company method employs market multiplesderived from market prices of stocks of companies that are engaged in the same or similar lines of business and thatare actively traded on a free and open market and applies these selected multiples to our corresponding measures offinancial performance. The estimates utilized in these fair value methodologies are highly complex and subjective.Management considers whether any events or circumstances have occurred between the date of valuation and thedate of a grant or a period end fair value re-measurement that would indicate a significant change in the fair value ofcommon shares during that period. Following the consummation of an initial public offering, vested common shareawards, restricted stock awards and stock option awards fair value will be determined based on the quoted marketprice of our common stock.
Stock OptionsWe estimate the fair value of our stock options utilizing the Black-Scholes-Merton option pricing model, whichrequires the input of highly subjective assumptions including: the expected stock price volatility, the calculation ofthe expected holding period of the award, the risk free interest rate and expected dividends on the underlyingcommon stock. Due to the lack of a public market for the trading of our common stock and the lack of Companyspecific historical and implied volatility data, we have based our estimate of expected volatility on the historicalvolatility of a group of peer companies that are most representative of our company. The historical volatility iscalculated based on a period of time commensurate with the expected holding period assumption. The holdingperiod represents the period that our option awards are expected to be outstanding. We use the simplified method asprescribed by accounting guidance governing such awards, to calculate the expected term for options granted toemployees as we do not have sufficient historical evidence data to provide a reasonable basis upon which to estimatethe expected holding period. This simplified method utilizes the mid-point between the vesting date and the date ofthe contractual term. The risk free rate is based on extrapolated rates of U.S. Treasury bonds whose terms areconsistent with the expected holding period of the stock options. We have assumed a dividend yield of zero as wehave not historically paid any dividends on our common stock.
All our stock based option awards are subject to service based vesting conditions. Compensation expense related tostock option awards to employees is recognized on a straight line basis based on the grant date fair value over theassociated service period of the award, which is equal to the vesting term. We are also required to estimate forfeituresat the time of grant and revise those estimates in subsequent periods if actual forfeitures differ from our estimates.
Stock based option awards granted subsequent to the Transaction, which represent all outstanding and unexercisedoptions as of June 30, 2016 and December 31, 2015, are subject to a Contribution and Subscription Agreement thatprovides that upon exercise, the shares received must be exchanged for incentive units in MPI. The incentive units aretied directly to ownership in Medpace Holdings, Inc. and entitle the incentive unit holder to participate in the risksand rewards of owning our common shares through ownership in MPI. As the shares received in the settlement ofstock options exercised are settled in assets other than our common shares, accounting guidance governing stockbased compensation require the awards to be classified as liabilities. This classification requires that we measure andrecord the stock compensation awards to fair value each period utilizing the same methodology for measuring stockoptions fair value at the grant date as described above. This re-measurement of period end fair value often results in acumulative catch up recorded for the portion of the award already vested but unsettled with the unvested portion ofthe option fair value recognized on a straight line basis over the remaining service period of the award. Per the optionaward terms, the Contribution and Subscription Agreement is not required following an initial public offering. As such,this offering will trigger an award provision that will be accounted for as an award modification and will require anoption fair value re-measurement that could potentially result in additional non-cash expense or income as of theinitial public offering date. Stock option awards granted prior to the Transaction, all of which vested prior to or as ofthe Transaction date, qualified for equity classification and were not subject to fair value re-measurement on a periodby period basis.
83

The following table summarizes the key weighted average assumptions used in the Black-Scholes-Merton optionpricing model to calculate the fair value of options during the periods:
SUCCESSOR PREDECESSOR
SIX MONTHSENDED
JUNE 30,2016
YEAR ENDEDDECEMBER 31,
2015
NINE MONTHPERIOD
FROM APRIL 1,2014
THROUGHDECEMBER 31,
2014
THREEMONTHPERIODFROM
JANUARY 1,2014
THROUGHMARCH 31,
2014
YEAR ENDEDDECEMBER 31,
2013
Expected holding period—years 5.0 4.2 5.4 N/A 3.1Expected volatility . . . . . . . . . . . . . . . . 36.80% 36.40% 41.80% N/A 37.40%Risk-free interest rate . . . . . . . . . . . . . 1.73% 1.20% 1.70% N/A 0.30%Expected dividend yield . . . . . . . . . . . . 0.00% 0.00% 0.00% N/A 0.00%
The assumptions used in the Successor portion of the table above represent those used for the Successor six monthsended June 30, 2016, the Successor year ended December 31, 2015 and the period ended December 31, 2014fair value calculation of the stock options as required for liability-classified stock compensation accounting. Theassumptions used in the Predecessor portion of the table above reflect grant date inputs used to arrive at the grantdate fair values as the Predecessor awards are subject to equity-classified stock compensation accounting.
The weighted average grant date fair value of employee stock options granted was $4.29 for the Successor six monthsended June 30, 2016, $3.81 for the Successor year ended December 31, 2015, $4.33 for Successor nine monthperiod ended December 31, 2014, not applicable for the Predecessor three month period ended March 31, 2014 and$1.66 for the Predecessor year ended December 31, 2013.
Recently Adopted and Issued Accounting StandardsIn April 2015, the Financial Accounting Standards Board (“FASB”) issued Accounting Standards Update (“ASU”)2015-05, “Customer’s Accounting for Fees Paid in a Cloud Computing Arrangement,” which provides guidance for acustomer’s accounting for cloud computing costs. Under ASU 2015-05, if a software cloud computing arrangementcontains a software license, customers should account for the license element of the arrangement in a mannerconsistent with the acquisition of other software licenses. If the arrangement does not contain a software license,customers should account for the arrangement as a service contract. This standard may be applied prospectively toall arrangements entered into or materially modified after the effective date, or retrospectively. The Companyadopted ASU 2015-05 in the first quarter of 2016. There was no impact to the Company’s condensed consolidatedstatements of operations, comprehensive (loss) income, shareholders’ equity or cash flows.
In June 2016, the FASB issued ASU 2016-13, Financial Instruments-Credit Losses (Topic 326), Measurement ofCredit Losses on Financial Instruments. The new guidance adds Topic 326 to the FASB Accounting StandardsCodification and removes the thresholds that companies apply to measure credit losses on financial instrumentsmeasured at amortized cost, such as loans, receivables, and held-to-maturity debt securities. Under current U.S.GAAP, companies generally recognize credit losses when it is probable that the loss has been incurred. The revisedguidance will remove all recognition thresholds and will require companies to recognize an allowance for creditlosses for the difference between the amortized cost basis of a financial instrument and the amount of amortizedcost that the company expects to collect over the instrument’s contractual life. ASU 2016-13 will be applied on aprospective basis for fiscal years and interim periods beginning after December 15, 2019, with early adoptionpermitted for fiscal years beginning and interim periods beginning after December 15, 2018. The Company iscurrently evaluating the effect this standard will have on its condensed consolidated financial statements.
In May 2016, the FASB issued ASU 2016-12, Narrow-Scope Improvements and Practical Expedients. In March2016, the FASB issued ASU 2016-08, Revenue from Contracts with Customers (Topic 606): Principal versus Agent
84

Considerations (Reporting Revenue Gross versus Net). In April 2016, the FASB issued ASU 2016-10, Revenue fromContracts with Customers (Topic 606): Identifying Performance Obligations and Licensing. ASUs 2016-12, 2016-10 and 2016-08 all clarify the interpretation guidance in ASU No. 2014-09, “Revenue from Contracts withCustomers” specifically related to narrowing specific aspects of Topic 606 and adding illustrative examples to assistin the application of the guidance. The effective date and transition requirements in ASUs 2016-12, 2016-10 and2016-08 are the same as the effective date and transition requirements of ASU 2014-09. ASU 2015-14, Revenuefrom Contracts with Customers (Topic 606): Deferral of the Effective Date, defers the effective date of ASU 2014-09by one year. The Company will adopt the clarified guidance in ASUs 2016-12, 2016-10 and 2016-08 by January 1,2018, as required. The Company is currently evaluating the impact of this new standard on its condensedconsolidated financial statements.
In March 2016, the FASB issued ASU No. 2016-09, Improvements to Employee Share-Based Payment Accounting.The new guidance is intended to simplify certain aspects of accounting for share-based payments to employeesincluding the accounting for income taxes, forfeitures, and statutory tax withholding requirements, as well asclassification in the statement of cash flows. ASU 2016-09 is effective for fiscal years beginning after December 15,2016, and for interim periods within those fiscal years. Early adoption is permitted, but all guidance must beadopted in the same period. The Company is currently evaluating the effect this standard will have on itsconsolidated financial statements.
In February 2016, the FASB issued ASU 2016-02, Leases (Topic 842). The guidance in ASU 2016-02 supersedesthe lease recognition requirements in ASC Topic 840, Leases (FAS 13). ASU 2016-02 requires an entity torecognize assets and liabilities arising from a lease for both financing and operating leases, along with additionalqualitative and quantitative disclosures. ASU 2016-02 will be applied on a modified retrospective basis and to eachprior reporting period presented and is effective for fiscal years beginning after December 15, 2018, with earlyadoption permitted. The Company is currently evaluating the effect this standard will have on its consolidatedfinancial statements.
In April 2015, the FASB issued ASU No. 2015-03, “Simplifying the Presentation of Debt Issuance Costs.” ASUNo. 2015-03 requires debt issuance costs to be presented in the balance sheet as a direct deduction from theassociated debt liability. ASU No. 2015-03 was to be effective for annual reporting periods beginning afterDecember 15, 2015, and interim periods within those fiscal years. The Company early adopted ASU No. 2015-03during 2015 and as a result, $12.1 million in debt issuance costs previously reported in other assets werereclassified to long-term debt, net, less current portion, in the consolidated balance sheet as of December 31, 2014.There was no impact to the Company’s consolidated statements of operations, comprehensive (loss) income,shareholders’ equity or cash flows.
In April 2015, the FASB issued ASU No. 2015-05, “Customer’s Accounting for Fees Paid in a Cloud ComputingArrangement,” which provides guidance for a customer’s accounting for cloud computing costs. Under ASU 2015-05, if a software cloud computing arrangement contains a software license, customers should account for the licenseelement of the arrangement in a manner consistent with the acquisition of other software licenses. If thearrangement does not contain a software license, customers should account for the arrangement as a servicecontract. This standard may be applied either prospectively to all arrangements entered into or materially modifiedafter the effective date, or retrospectively. The Company adopted ASU 2015-05 in the first quarter of 2016. Therewas no impact to the Company’s consolidated statements of operations, comprehensive (loss) income, shareholders’equity or cash flows.
In November 2015, the FASB issued ASU No. 2015-17 ‘‘Balance Sheet Classification of Deferred Taxes.”ASU No. 2015-17 requires entities to present deferred tax assets and deferred tax liabilities as noncurrent in aclassified balance sheet. ASU No. 2015-17 simplifies the current guidance, which requires entities to separatelypresent deferred tax assets and deferred tax liabilities as current and noncurrent in a classified balance sheet.ASU No. 2015-17 was to be effective for annual reporting periods beginning after December 15, 2016, and interimperiods within those annual periods. The Company early adopted ASU No. 2015-17 during 2015 and as a result,$3.3 million of current deferred income tax assets were reclassified in the consolidated balance sheet as ofDecember 31, 2014. There was no impact to the Company’s consolidated statements of operations, comprehensive(loss) income, shareholders’ equity or cash flows.
85

In May 2014, the FASB issued ASU No. 2014-09 ‘‘Revenue from Contracts with Customers,’’ to clarify theprinciples of recognizing revenue and create common revenue recognition guidance between U.S. GAAP andInternational Financial Reporting Standards. In July 2015, the FASB issued ASU 2015-14, “Revenue fromContracts with Customers: Deferral of the Effective Date,” which delayed the effective date of ASU 2014-09 by oneyear and modified the standard to allow early adoption. For public entities, the standard is now effective for reportingperiods beginning after December 15, 2017. Earlier application is permitted only as of annual reporting periodsbeginning after December 15, 2016, including interim reporting periods within that reporting period. Entities cantransition to the standard either retrospectively or as a cumulative effect adjustment as of the date of adoption. Weare currently assessing the potential impact of ASU No. 2014-09 on the Company’s consolidated financialstatements.
In April 2014, the FASB issued amendments to ASC 205, “Presentation of Financial Statements—Going Concern,”through issuance of ASU 2014-15, “Disclosure of Uncertainties about an Entity’s Ability to Continue as a GoingConcern.” This ASU requires management to assess an entity’s ability to continue as a going concern by incorporatingand expanding upon certain principles that are currently in U.S. auditing standards. The new guidance is effective forfiscal years ending after December 15, 2016, and for annual periods and interim periods thereafter, with earlyadoption permitted. We do not anticipate that this ASU will have any impact on our consolidated financial statements.
Quantitative and Qualitative Disclosures About Market Risk
Market risk is the potential loss arising from adverse changes in market rates and prices, such as foreign currencyexchange rates, inflation, interest rates, and other relevant market rates or prices changes. We are exposed to marketrisk from changes in foreign currency exchange rates, interest rates, credit risk and risk of inflation and we regularlyevaluate our exposure to such changes.
Foreign Currency RiskWe have business operations globally and accordingly, we are exposed to foreign currency fluctuations that canaffect our financial results. For the Successor year ended December 31, 2015, approximately 8.4% of our revenuewas derived from contracts denominated in currencies other than the U.S. dollar, whereas 24.9% of our operationalcosts, including, but not limited to, salaries, wages and other employee benefits, were derived in foreign currencies.Of these exposures, 94.9% of revenue denominated in foreign currencies and 46.8% of operational costsdenominated in foreign currencies were Euro denominated. If the U.S. dollar were to appreciate against all othercurrencies by a hypothetical average of 10%, our pre-tax income for the Successor year ended December 31, 2015would have been positively impacted by approximately $3.2 million, while a hypothetical depreciation of 10%against all other currencies would result in a negative earnings impact of approximately $3.2 million.
We are also subject to foreign currency transaction risk for fluctuations in exchange rates during the period of timebetween contract commencement and cash settlement for services that we provide in relation to the contract. Thisexposure may affect our contract and operational profitability. To mitigate this exposure we provide for exchange ratefluctuation adjustments subject to certain thresholds within our foreign currency denominated contracts.
InflationOur contracts that provide for services to be performed in excess of a year generally include inflation adjustments forthe portion of the services to be performed beyond one year from the contract date. We do not have significantoperations in countries where the economy is considered highly inflationary, and do not believe in the near term thatinflation will have a material adverse impact on us. However, if actual rates are greater than our contractual inflationrates, inflation could have a material adverse effect on our operations or financial condition.
Interest RatesWe are primarily exposed to interest rate risk through our Senior Secured Credit Facilities. As of December 31, 2015and 2014, we had outstanding amounts related to the Senior Secured Credit Facilities of $377.9 million (net of anunamortized discount of $2.0 million and unamortized debt issuance costs of $10.1 million) and $491.5 million(net of an unamortized discount of $2.4 million and unamortized debt issuance costs of $12.1 million),respectively, subject to variable interest rates. The applicable LIBOR interest rate, our primary interest rate exposure,for the Senior Secured Credit Facilities is subject to a 1.00% floor. As the applicable LIBOR interest rates as ofDecember 31, 2015 and 2014 were less than the floor, the applicable interest rates would have had to rise by 57
86

basis points and 83 basis points, respectively, to impact interest expense. Each quarter point increase in theapplicable interest rate above the floor as of December 31, 2015 and 2014 would have changed our interestexpense by approximately $1.1 million and $1.0 million, for the Successor year ended December 31, 2015 and theSuccessor nine month period ended December 31, 2014, respectively.
Credit RiskFinancial instruments that subject the Company to credit risk primarily consist of cash and cash equivalents, andaccounts receivable and unbilled. The cash and cash equivalent balances are held and maintained with high-qualityfinancial institutions with reputable credit ratings and, consequently, we believe that such funds are subject tominimal credit risk.
We generally do not require collateral or other securities to support customer receivables. In the Successor yearended December 31, 2015, the Successor nine month period ended December 31, 2014, the Predecessor threemonth period ended March 31, 2014 and the Predecessor year ended December 31, 2013, credit losses have beenimmaterial and within our expectations. Moreover, in many cases we require advance payment from our customersfor a portion of the study contract price upon the signing of a service contract which helps to mitigate credit risk. Asof December 31, 2015 and 2014, there were no major customers accounting for more than 10% of our accountsreceivable and unbilled.
87

BUSINESS
Overview
We are one of the world’s leading clinical contract research organizations, or CROs, by revenue, solely focused onproviding scientifically-driven outsourced clinical development services to the biotechnology, pharmaceutical andmedical device industries. Our mission is to accelerate the global development of safe and effective medicaltherapeutics. We differentiate ourselves from our competitors by our disciplined operating model centered onproviding full-service Phase I-IV clinical development services and our therapeutic expertise. We believe thiscombination results in timely and cost-effective delivery of clinical development services for our customers. Webelieve that we are a partner of choice for small and mid-sized biopharmaceutical companies based on our ability toconsistently utilize our full-service, disciplined operating model to deliver timely and high-quality results for ourcustomers. Accordingly, we believe we are well positioned to continue to expand our market share and sustainmargins in the growing $23 billion overall Phase I-IV CRO market.
We were founded in 1992 by Dr. August J. Troendle, an industry pioneer, as a Phase II-IV-focused CRO with astrong, scientifically-driven and disciplined operating model, and we continue today as a founder-led enterprise withDr. Troendle retaining a significant ownership stake in Medpace. Throughout our 24-year history, we have grownalmost exclusively organically, with our core founding members having been integrally involved in developing andinstilling our differentiated culture and operating philosophy across our company. We focus on conducting clinicaltrials across all major therapeutic areas, with particular strength in Cardiology, Metabolic Disease, Oncology,Endocrinology, CNS and AVAI, as well as therapeutic expertise in Medical Devices. Our global platform includesapproximately 2,300 employees across 35 countries, providing our customers with broad access to diverse marketsand patient populations as well as local regulatory expertise and market knowledge.
Our singular focus on executing our disciplined, full-service operating model is a core tenet of our differentiatedapproach. Our operating model entails partnering with our customers from the beginning of the clinical trial processand holistically navigating all subsequent components of the process. This approach differs from other leading CROsthat provide functional or partial outsourcing services as a core component of their business. We believe our full-service approach allows us to deliver timely and high-quality results for our customers. By clearly communicatingand aligning our expectations with those of our customers at the beginning of an engagement, we develop a trustedrelationship where our customers typically grant us greater control over the clinical trial process. This results ingreater accountability on our part and, we believe, more consistent delivery of our services. We believe our partneringapproach, coupled with our full-service, scientifically-driven model, ensures efficient and high-quality trial execution,limits changes in the scope of trials and enables timely completion of trials.
We focus on providing clinical development solutions primarily to companies that recognize the benefits of utilizingour full-service outsourcing model. We believe our model is particularly attractive to small and mid-sizedbiopharmaceutical companies, which seek specialized capabilities and infrastructure required for complex andglobal clinical trials, including therapeutic expertise, insightful protocol design, project feasibility assessment andtimely and high-quality trial execution. We expect that outsourced development expenditures for small and mid-sizedbiopharmaceutical companies will continue to outpace outsourced development expenditures for the broaderbiopharmaceutical market. We believe we can expand our market share with this customer segment given ourcontinued strategic focus and the attractiveness of our model to these companies. Furthermore, as the clinicaldevelopment and regulatory processes grow increasingly more global and complex, we believe large pharmaceuticalcompanies will increasingly recognize the benefits of our disciplined, full-service operating model. For the Successoryear ended December 31, 2015, we generated 55.7%, 29.3% and 15.0% of our net service revenue from smallbiopharmaceutical companies, mid-sized biopharmaceutical companies and large pharmaceutical companies,respectively.
We believe that our model, focused on full-service delivery, and our attractive customer mix have resulted in robustlevels of historical revenue growth, Adjusted EBITDA margins and strong Free Cash Flow. For the Successor yearended December 31, 2015, we generated total net service revenue of $320.1 million and Adjusted EBITDA of$101.2 million, representing net service revenue and Adjusted EBITDA compound annual growth rates, or CAGRs, of21.7% and 26.2%, respectively, since 2012. Our net (loss) income for the Successor year ended December 31,
88

2015, the Successor nine month period ended December 31, 2014, the Predecessor three month period endedMarch 31, 2014 and the Predecessor year ended December 31, 2013 was $(8.7) million, $(14.3) million, $(1.2)million and $24.8 million, respectively, partially as a result of non-cash amortization expense associated withidentified intangible assets acquired as part of the Transaction. Over the last 15 years, we have maintained averageAdjusted EBITDA margins of approximately 34%, while significantly scaling our business organically and expandingglobally. Additionally, we have consistently demonstrated an ability to convert Adjusted EBITDA into Free Cash Flow.Our annual Free Cash Flow conversion, defined as Free Cash Flow divided by Adjusted EBITDA, has averaged 81.7%since 2012. Net cash provided by operating activities for the Successor year ended December 31, 2015, theSuccessor nine month period ended December 31, 2014, the Predecessor three month period ended March 31,2014 and the Predecessor year ended December 31, 2013 was $84.1 million, $62.5 million, $12.8 million and$98.1 million, respectively. For a reconciliation of Adjusted EBITDA, a non-GAAP measure, to net (loss) income, andfor a reconciliation of Free Cash Flow, also a non-GAAP measure, to net cash provided by operating activities, see“Selected Historical Consolidated Financial and Other Data.” Additionally, as of June 30, 2016 and December 31,2015, we had total long-term debt, net of $364.0 million and $377.9 million outstanding, respectively. We intendto use the net proceeds of this offering to repay a portion of this indebtedness. See “Use of Proceeds.”
Our Market
Clinical Development ProcessBefore a new drug can be commercialized, it often must undergo extensive pre-clinical and clinical testing andregulatory review to verify safety and efficacy. CROs provide a comprehensive range of product development servicesfor Phase I-IV clinical trials. These clinical trials are separated into distinct phases in order to thoroughly evaluatethe product. Pharmaceutical Research and Manufacturers of America, 2015 Biopharmaceutical Research IndustryProfile, a trade group publication, indicates that from drug discovery through approval by the United States Food andDrug Administration, or FDA, developing a new medicine takes at least 10 years and costs approximately $2.6billion.
The following graphic, based on data presented in the Pharmaceutical Research and Manufacturers of America,2013 Biopharmaceutical Research Industry Profile and 2015 Biopharmaceutical Research Industry Profile, industrytrade group publications, illustrates the various stages and typical timeline of the clinical development process:
Stages of Clinical Development
# ofDrug
Candidates# ofYears
5,000-10,000
3-6 years
250
5
6-7 years
0.5 - 2 years
Indefinite1
NDA / BLASubmitted
INDSubmitted
Drug Discovery
Preclinical TestingLaboratory and animal testing
Phase I20-80 healthy volunteers
Determine safety of compound
Phase II100-500 patient volunteers
Evaluation of efficacy, dosage and side effects
FDA Review /Approval
Phase IV /Additional
Post-Marketing Testing
Phase III1,000-5,000 patient volunteers
Gather statistical information about safety andefficacy
Pharmaceutical and biotechnology companies outsource product development services to CROs in order to efficientlyand cost-effectively manage the clinical development process and obtain regulatory approval and reach the market inas timely a manner as possible. Historically, outsourcing was driven primarily by the need for pharmaceutical and
89

biotechnology companies to reduce cost and maintain focus on core competencies, or to provide services orcapabilities that these companies did not have internally. In recent years, the role of a CRO has evolved and CROsare now increasingly an integral component of the product development process, providing their customers withregulatory and therapeutic expertise, complex clinical trial design, broader geographic coverage, access to diversepopulation pools and consistent and reliable data systems and procedures.
CRO Market SizeWe estimate, based on industry sources, including analyst reports and management’s knowledge, that total globalbiopharmaceutical clinical development expenditures were approximately $100 billion in 2014. We further estimate,based on these industry sources, that the portion of these expenditures attributable to Phase I-IV clinicaldevelopment services was $44 billion, of which we estimate $23 billion was outsourced. In addition, based on theseindustry sources, we estimate the CRO market will experience a CAGR of approximately 6% from 2014 through2019, growing to approximately $31 billion in 2019, as a result of increasing biopharmaceutical clinicaldevelopment expenditures combined with increased outsourcing penetration.
CRO Market Trends
Increasing Development Expenditures. We estimate that biopharmaceutical development expenditures will grow fromapproximately $100 billion in 2014 to approximately $114 billion in 2019, representing a CAGR of approximately3%. We believe that the growth in development expenditures is primarily attributed to the heightened pace ofbiopharmaceutical innovation, pressure on companies to replenish pipelines with new therapies, the favorableregulatory environment and the significant amount of capital raised by biotechnology and pharmaceutical companiesduring the last several years. There were 13,718 drugs in the development pipeline in January 2016, as identifiedby Citeline Pharma’s R&D Annual Review 2016, an industry publication, which was an increase of approximately41% compared to the 9,737 that were in development in 2010. In line with the significant capital raised bybiotechnology and pharmaceutical companies, based upon financial data available from FactSet Research SystemsInc., a provider of financial information, as of September 30, 2015, the companies comprising the NASDAQBiotechnology Index, or NBI, had approximately $109.3 billion in cash available to support ongoing clinicaldevelopment. This figure represents a 24.7% increase above the cash balance of approximately $87.6 billion heldby the companies comprising the NBI as of December 31, 2014, and a 111.5% increase above the cash balance ofapproximately $51.7 billion held by companies comprising the NBI as of December 31, 2010.
Increasing Outsourcing Penetration. Outsourcing penetration is the percentage of biopharmaceutical clinicaldevelopment costs that are outsourced to CROs. We estimate, based on industry sources, including analyst reportsand management’s knowledge, that approximately 52% of Phase I-IV clinical development expenditures wereoutsourced in 2014. Driven by increased clinical trial complexity, the need for regulatory and therapeutic expertiseand global access to patient populations, we expect outsourcing penetration will reach approximately 62% in 2019.
Pressures Facing Biopharmaceutical Industry. The biopharmaceutical industry continues to experience significantchallenges, including regulatory and pricing pressures resulting from healthcare reform, intensifying genericcompetition, pipeline failures and the need for continued innovation. In order to combat these challenges andmaintain revenue growth and operating margins, biopharmaceutical companies increasingly seek clinical expertiseand seek to outsource clinical services to CROs to accelerate clinical development and maximize commercializationsuccess.
Increasing Clinical Trial Complexity. Clinical trial design and structure have become increasingly complex based onregulatory agency sophistication, more complicated protocols and a growing focus by biopharmaceutical companieson developing new cutting-edge drug therapies. For example, based on the data available in the FDA’s Orphan DrugProduct designation database, the number of orphan drug designations granted has increased by nearly 90% overthe past three years from 190 in 2012 to 354 in 2015. This growing complexity brings new challenges in studyfeasibility, site selection, patient recruitment and retention due to the rarity of orphan diseases, which globally mayonly have hundreds or thousands of patients. Additionally, measures of clinical trial complexity significantlyincreased over the last decade, with the mean number of procedures per protocol increasing by 68% as indicated bythe Tufts Center for the Study of Drug Development, an independent non-profit research group. We believe full-service CROs with noted therapeutic leadership, full-service clinical operations, a proprietary technology platform,strategic regulatory guidance and integrated laboratories are well suited to successfully support these types ofstudies.
90

Small and Mid-Sized Biopharmaceutical SegmentWe believe small and mid-sized biopharmaceutical companies are important to the continued growth of the CROindustry. These companies are primary centers of innovation, developing new, cutting-edge therapies for niche orpreviously untreatable diseases, which frequently require sophisticated clinical trials. These companies have limitedability to conduct global clinical trials independently, and as a result, they typically seek a strategic partner that canprovide the therapeutic experience and infrastructure required to deliver timely completion of complex, globalclinical trials. We estimate, based on industry sources, including analyst reports and management’s knowledge, thatoutsourced development expenditures for these companies will grow at a CAGR of 10% from 2014 to 2019,outpacing the estimated overall biopharmaceutical market CAGR of 6%. In 2014, we estimate, based on industrysources, including analyst reports and management’s knowledge, that small and mid-sized biopharmaceuticalcompanies outsourced approximately 69% of their development expenditures, representing an estimated addressableCRO market of approximately $7 billion, which we estimate, based on these same sources, will increase toapproximately 76%, representing an estimated addressable CRO market of approximately $11 billion in 2019.
Biopharmaceutical companies have a variety of options for raising money to support the funding of their drugdevelopment, including raising private equity, raising public equity and partnering with large biopharmaceuticalcompanies to jointly develop drug candidates. Many of these companies are well-funded, having raisedapproximately $232 billion of capital in the aggregate, including funding from investments from corporate partners,in 2014 and 2015, representing a 110% increase over the approximately $110 billion raised in 2012 and 2013, asidentified by BioWorld, a biopharmaceutical news source. We believe the level of capital raised for small and mid-sized biopharmaceutical companies over the last few years is sufficient to fund significant clinical trial activity forthese companies going forward. We believe that companies that are progressing with good results through a clinicaltrial will be able to continue to fund those clinical trials with available cash and will have additional avenues to fundthese programs as necessary, including partnerships with large biopharmaceutical companies.
Our Competitive Strengths
We believe we are well positioned to capitalize on positive trends in the CRO industry based on our key competitivestrengths set forth below:
Disciplined and Integrated Full-Service Model. Since our founding in 1992, we have focused on building andexecuting our disciplined, full-service operating model to provide clinical development services to the biotechnologyand pharmaceutical industries. At the center of our differentiated operating model is our full-service focused, end-to-end approach to delivering clinical development services. We partner with customers from the beginning of theclinical trial process and holistically navigate all subsequent components of the process. While many CROs engage infunctional or partial outsourcing services as a significant component of their business model, we take a disciplinedapproach and do not typically provide such piecemeal services. We believe that a full-service approach deliversgreater efficiency, better quality and, ultimately, higher value for our customers.
In executing our operating model, we have demonstrated durable success across multiple therapeutic areas. Weembed therapeutic leads, each of whom holds a Doctor of Philosophy, or Ph.D., a Doctor of Medicine, or M.D., orother doctorate level degrees into every aspect of the project, and our customers rely on this expertise throughout theentire clinical process. By clearly communicating and aligning our expectations with those of our customers at thebeginning of an engagement, we tend to develop a close working relationship that is built on a level of trust thatresults in us being granted greater control over the clinical trial process. We have developed and consistently utilizeeffective standard operating procedures, or SOPs, that we believe result in high-quality and timely clinicaldevelopment outcomes for our customers. Our operating model utilizes our proprietary ClinTrak clinical trialmanagement software, or ClinTrak, which is customized and streamlined to our SOPs. We house our key decision-makers, our internally-developed technology and our corporate infrastructure in our corporate headquarters inCincinnati, Ohio. This centralization allows us to maintain highly integrated, standardized and flexible operations,while preserving our operating philosophy and extending our global reach, resulting in a disciplined business modeland attractive EBITDA margins.
High-Science Approach with Deep Therapeutic Expertise. Customers generally seek a CRO with extensive therapeuticexpertise in their focus areas. Our therapeutic expertise encompasses areas that are among the largest, most complexand fastest growing in pharmaceutical development, including Oncology, Cardiology, Metabolic Disease,
91

Endocrinology, CNS and AVAI, as well as Medical Devices. Our core therapeutic expertise covers the therapeutic areaswhere a majority of all drugs are currently in development, as identified by Citeline Pharma R&D Annual Review2016, an industry publication. Collectively, these areas constituted 81.6% of our backlog as of June 30, 2016.
We leverage the insights of our senior leaders who have specific therapeutic expertise to employ a high-scienceapproach to our projects. Because we believe that therapeutic expertise plays a significant role in CRO selection, wefocus heavily on hiring and training our therapeutic leads in order to maximize therapeutic insights to inform clinicaltrial design and execution. In clinical trial execution, our therapeutic leads are embedded into every aspect of theprocess from start to finish. Our scientific and medical staff is fundamental to delivering high-quality trial executionand enabling timely completion of complex processes.
Attractive and Diversified Customer Base. We have a strong track record of serving our core customer base of smalland mid-sized biopharmaceutical companies, which we believe represents an attractive growth opportunity. Webelieve outsourced development expenditures in our core customer base will outpace the growth of the broaderbiopharmaceutical market. While we estimate, based on industry sources, including analyst reports and management’sknowledge, that the overall biopharmaceutical market will grow its outsourced development expenditures for Phase I-IV clinical development and laboratory services at a 6% CAGR from 2014 to 2019, we expect the small and mid-sizedbiopharmaceutical outsourced development expenditures will grow at a 10% CAGR during this period. Small and mid-sized biopharmaceutical companies, many of which are now well capitalized, have firmly established themselves atthe forefront of medical innovation and the search for new therapies for previously untreatable diseases, which requireincreasingly complex clinical trials. CROs are integral to the clinical development process for these customers,providing regulatory and therapeutic expertise, complex clinical trial design, broader geographic coverage, access todiverse population pools and consistent and reliable data systems and procedures, since these customers often lackthe infrastructure and global breadth required for efficient and high-quality trial execution.
In addition, we have a highly diversified customer base comprising many of the largest global biopharmaceuticalcompanies, as well as high-growth small and mid-sized biopharmaceutical companies. For the Successor year endedDecember 31, 2015, we generated 55.7%, 29.3% and 15.0% of our net service revenue from smallbiopharmaceutical companies, mid-sized biopharmaceutical companies and large pharmaceutical companies,respectively. For the Successor six months ended June 30, 2016 and the Successor year ended December 31,2015, our largest customer accounted for 6.3% and 6.9% of our net service revenue, respectively, and our top 10customers represented 38.2% and 39.9% of our net service revenue, respectively.
Partner of Choice for Biopharmaceutical Customers. Based on our extensive operating history and therapeuticexperience, we believe that we have established a reputation as a partner of choice to our core customer segment ofsmall and mid-sized biopharmaceutical companies. Acting as incubators of pharmaceutical development, small andmid-sized biopharmaceutical companies are responsible for a number of innovative drug candidates currently beingdeveloped to address unmet medical needs. Many of these drug candidates are being developed for niche and severeindications with relatively small patient populations, which require increasingly complex clinical trials. Thesebiopharmaceutical customers, sometimes new to the clinical development process, seek to partner with us based onour differentiated approach and expertise to execute trials in a timely and efficient manner. The Avoca Group’s 2011Avoca Survey on Clinical Outsourcing Practices, a survey of over 100 biopharmaceutical companies, indicates that48% of pharmaceutical companies with annual revenue over $1.5 billion, 51% of biopharmaceutical companies withannual revenue between $100 million and $1.5 billion, and 64% of biopharmaceutical companies with annualrevenue under $100 million prefer medium-sized, full-service CROs, defined as the top 15 CROs by revenue excludingthe top 5 CROs by revenue, based on service and outsourcing experience. Of this same group, only 40% of largepharmaceutical companies, 24% of mid-sized biopharmaceutical companies and 7% of small biopharmaceuticalcompanies prefer large, full-service CROs, defined as the top 5 CROs by revenue. We do not believe that we are amongthe top 5 CROs by revenue based on publicly available information. We believe we are viewed as a strategic andtrusted partner by these customers given our full-service approach, disciplined operating model and significanttherapeutic expertise. As a result, our customers often grant us significant autonomy in executing clinical trials fortheir most valued assets.
Global Platform with Scalable Infrastructure. We believe that we are one of the leading CROs with the scale andtherapeutic expertise necessary to effectively conduct global clinical trials. We began our disciplined international
92

expansion in 2004 and have since increased the breadth and depth of our international footprint significantly, withapproximately 45% of our clinical operations employees located outside of North America as of June 30, 2016. Wenow offer our services through a highly skilled staff of approximately 2,300 employees across 35 countries as ofJune 30, 2016. As clinical trials become increasingly global, our platform provides our customers with broad accessto diverse markets and patient populations, as well as local regulatory expertise and market knowledge, which canreduce the time and cost of these trials, while also helping to optimize the commercialization potential for newtherapies.
Strong Financial Performance. We have a proven track record of strong organic growth and achieved significant revenueand Adjusted EBITDA growth and robust Free Cash Flow over the past several years. For the Successor year endedDecember 31, 2015, we achieved net service revenue of $320.1 million and Adjusted EBITDA of $101.2 million, whichrepresent a CAGR of 21.7% and 26.2%, respectively, since 2012. Our net (loss) income for the Successor year endedDecember 31, 2015, the Successor nine month period ended December 31, 2014, the Predecessor three month periodended March 31, 2014 and the Predecessor year ended December 31, 2013 was $(8.7) million, $(14.3) million, $(1.2)million and $24.8 million, respectively, partially as a result of non-cash amortization expense associated with identifiedintangible assets acquired as part of the Transaction. For the Successor year ended December 31, 2015, our AdjustedEBITDA margin was 31.6%. Our Adjusted EBITDA margins are driven by focusing on a full-service operating model anddisciplined approach. We typically avoid functional or partial outsourcing services, which we believe are less efficient andlead to a lower margin profile. Over the last 15 years, we have maintained average Adjusted EBITDA margins ofapproximately 34%, while significantly scaling our business and expanding globally. Additionally, we have consistentlydemonstrated an ability to convert Adjusted EBITDA into Free Cash Flow. Our annual Free Cash Flow conversion, definedas Free Cash Flow divided by Adjusted EBITDA, has averaged 81.7% since 2012. Net cash provided by operatingactivities for the Successor year ended December 31, 2015, the Successor nine month period ended December 31,2014, the Predecessor three month period ended March 31, 2014 and the Predecessor year ended December 31, 2013was $84.1 million, $62.5 million, $12.8 million and $98.1 million, respectively. For a reconciliation of AdjustedEBITDA, a non-GAAP measure, to net (loss) income, and for a reconciliation of Free Cash Flow, also a non-GAAP measure,to net cash provided by operating activities, see “Selected Historical Consolidated Financial and Other Data.” Additionally,as of June 30, 2016 and December 31, 2015, we had total long-term debt, net of $364.0 million and $377.9 millionoutstanding, respectively. We intend to use the net proceeds of this offering to repay a portion of this indebtedness. See“Use of Proceeds.” We believe our strong financial profile demonstrates the quality and efficiency of the operating modelwe have built to position ourselves for continued future growth.
Highly Regarded, Experienced and Committed Management Team. We are led by a dedicated and experienced seniormanagement team with significant industry experience and knowledge focused on clinical development. We werefounded in 1992 by Dr. August J. Troendle, an industry pioneer, and we continue today as a founder-led enterprisewith Dr. Troendle retaining a significant ownership stake in Medpace. Our management team has been responsiblefor developing our scientifically-driven, disciplined operating model, building our global platform and realizing oursignificant organic growth in revenue and earnings. Our senior management team has an average tenure withMedpace of 12 years, including four senior managers with over 20 years with us, and brings a healthy balance ofsignificant experience with Medpace, regulators and other companies in the industry, including public companies.
Our Growth Strategy
Key elements of our growth strategy include:
Continued Focus on Organic Growth. Our strong organic growth has been the result of consistently reinvesting ourpositive cash flow to support our therapeutic capabilities, service offerings and global expansion. As a founder-ledenterprise, we intend to continue to emphasize preserving our unique culture and operating philosophy as we growour scientific capabilities and clinical trial expertise by further investing in human capital. In addition to leveragingour operating model, we intend to continue to selectively hire employees to strengthen and expand our expertise inhigh-growth therapeutic areas, including Oncology, CNS and AVAI. We methodically look to hire employees early intheir careers and thoroughly train them to excel in our disciplined operating model, while instilling within them ourcorporate culture and philosophy. We apply this same training and standardization globally in order to maintainconsistency and minimize inefficiencies in our operations. From 2012 through 2015, we successfully organicallygrew our business from approximately 1,000 employees to over 2,000 and organically grew our net service revenuefrom $177.4 million to $320.1 million, representing a CAGR of 21.7%. We intend to continue to utilize ourdisciplined organic growth model and robust cash flows to drive future revenue growth.
93

Continue to Sustain Industry-Leading Margins. Over the last 15 years, we have maintained average Adjusted EBITDAmargins of approximately 34%. We intend to continue to maintain industry-leading margins (compared to our publiccompetitors) while growing organically. We believe the key to sustaining margins is through the execution of ourdisciplined operating philosophy and full-service business model. Furthermore, we intend to continue to develop ourcentralized operations at our corporate headquarters in order to maintain standardization and consistency across ourglobal operations. We have a proven track record of achieving strong margins while significantly scaling our businessand expanding globally.
Leverage our Experience and Reputation in the Attractive, High-Growth Clinical Development Market. Our customersvalue the knowledge and therapeutic expertise we have developed from a long history of successfully executingclinical trials. Given the rapid emergence of new therapies and resulting evolution of commercial priorities amongmany biopharmaceutical companies, we believe consistently maintaining the necessary infrastructure and humancapital required to retain clinical and therapeutic expertise internally is not the most cost-effective solution for thesecompanies. As the regulatory landscape adapts to greater clinical trial complexity, we believe that biopharmaceuticalcompanies will increasingly engage CROs with the requisite global resources as well as therapeutic and regulatoryexpertise to assume full responsibility of the clinical trial process. We estimate, based on industry sources, includinganalyst reports and management’s knowledge that Phase I-IV clinical development outsourcing penetration forbiopharmaceutical companies will increase from 52% in 2014 to 62% in 2019. Based on our successful executionof clinical trials across many therapeutic areas in multiple countries, as well as our focus on closely partnering withour customers through all aspects of the clinical trial process, we believe we have developed a strong reputation inthe industry as a leading CRO. We believe that this reputation positions us to continue capturing additional share ofthe attractive, high-growth clinical development market as the industry increasingly recognizes the benefits of ouroperating model.
Deepen Existing and Develop New Relationships with Our Core Customer Segment. We look to continue to deepenour long-standing relationships with existing customers through new engagements and expand our relationships withnew small and mid-sized biopharmaceutical customers. As a strategic partner of choice, we clearly communicate andalign our expectations with our customers at the beginning of an engagement to develop a close working relationshipthat is built on trust. We believe this trust, supported by our high-quality execution and frequent dialogue with ourcustomers’ key decision makers, positions us to be awarded additional business in existing and new therapies,allowing us to grow alongside our customers and leading to an increasingly significant, and growing, contributionfrom repeat business.
While our successes to date have built a substantial customer base, we believe that there is opportunity forcontinued growth and penetration in our core customer segment. We place our therapeutic leads alongside our salesteam to actively participate in the procurement of new customers whose portfolios align with our therapeuticexpertise, which we believe further differentiates us from our competitors. In 2015, we worked with approximately350 small and mid-sized biopharmaceutical companies. 85.0% of our net service revenue for the Successor yearended December 31, 2015 was generated from small and mid-sized biopharmaceutical companies. In addition, oursales team actively manages a database which currently includes over 4,400 companies that represent potentialcustomers. We regularly assess this database for opportunities that align with our growth strategies and developplans to target and engage these potential customers. Based on this, we estimate that we have capturedapproximately 4% of the approximately $7 billion small and mid-sized biopharmaceutical CRO market, leaving uswith significant opportunity for market share growth and new customer penetration expansion.
Pursue Selective and Complementary Bolt-On Acquisitions. We intend to augment our organic growth with targetedacquisitions to expand our current capabilities and service offerings that are complementary to our full-servicemodel. Our acquisition strategy is driven by our comprehensive commitment to serve customer needs. While we arecontinuously assessing the market for attractive opportunities, we do so selectively with a focus on targetingopportunities to acquire and integrate complementary and strategic, non-transformative acquisitions within the CROsector in order to strengthen our competitive position and provide enhanced value to our customers.
Position Ourselves to Increase Our Presence Among Large Pharmaceutical Companies as These Customers Adopt andAppreciate the Full-Service Approach. Given the growing pressures large pharmaceutical companies are facing,including complex clinical development and regulatory processes, these companies seek solutions beyond simply
94

outsourcing clinical development. These companies are increasingly seeking strategic partnerships that provide moreholistic clinical development services and also the expertise that CRO partners offer. We have witnessed a noticeableshift by large pharmaceutical companies away from lower-value, functional outsourcing service providers towardfull-service CROs. Given our differentiated operating model, we believe larger pharmaceutical companies will beincreasingly appreciative of our proven approach to clinical development and expertise, and we intend to activelymarket the strength and depth of our services to these companies.
Our Services
We provide a full suite of services supporting the entire clinical development process from Phase I to Phase IV. Weoffer these services across a wide range of therapeutic areas.
Our comprehensive suite of clinical development services includes, but is not limited to, the following:
Medical AffairsThe medical affairs group consists of therapeutic leads who provide strategic direction for study design and planning,train operational staff, work with primary investigators, provide medical monitoring and meet with regulatoryagencies. Our customers rely on our expertise throughout the entire clinical trial process with therapeutically-focusedphysicians fully engaged throughout the study. We believe this depth of therapeutic leadership and engagement oneach project results in a close working relationship with customers built on a level of trust that results in us beinggranted greater control over the clinical trial process.
Clinical Trial ManagementOur team of clinical trial managers are responsible for leading all aspects of study execution. The clinical trialmanager, or CTM, drives accountability across the functional team members and is responsible for successfuloperational execution. The CTM serves as the primary contact for the customer. Experience and therapeutic expertiseare main factors when assigning CTMs to projects.
ClinTrak is integrated with our SOPs, allowing the CTMs to access real-time study metrics. ClinTrak is constantlyevaluated and enhanced with our processes.
Study FeasibilityWe have a dedicated feasibility team consisting of clinical experts who are an integrated part of the project team.Our feasibility team is able to analyze a specific protocol, using many data sources to determine countries and sitesthat are most appropriate for the study.
Study Start-UpOur global Study Start-Up staff is well-versed in all aspects of clinical trial start up activities, including studydocumentation submission processes to independent Institutional Review Boards, or IRBs, ethics committees and toex-US competent authorities. Our study start-up team includes fully dedicated budget and legal associates to ensurefocused negotiations and execution of site contracts.
Clinical MonitoringOur clinical monitoring group consists of highly experienced clinical research associates, or CRAs, who are based in35 countries. With their experience and training, our CRAs are able to provide unparalleled site managementservices that includes both in-house and onsite monitoring. Their knowledge of local regulations and laws, inaddition to Good Clinical Practice, or GCP, and International Council on Harmonisation of Technical Requirementsfor Registration of Pharmaceuticals for Human Use, or ICH, guidelines ensure compliance and data quality. OurCRAs report into a global matrix structure to ensure consistent training, oversight and management. Each CRAreceives comprehensive, hands-on training in an individualized curriculum consisting of in-house and field-basedtraining, supplemented with clinical research department core rotations and ongoing study-specific training.
Global Regulatory AffairsOur Global Regulatory Affairs department has a strong track record of providing expert strategic, operational, andtactical regulatory guidance, as well as creating thorough, scientifically-grounded regulatory compliant documentationto regulatory agencies around the globe. Members of this team bring a long tenure of regulatory experience andscientific knowledge to each project. The group, led by former government officials and experienced drug development
95

subject matter experts, provides comprehensive international support at each stage of the drug and biologicsdevelopment processes. They have particular expertise within the areas of advanced therapeutics, accelerateddevelopment pathways, pediatrics, and rare diseases. The group also has a dedicated publishing function that has fullelectronic and paper publishing capabilities to support all types of international regulatory submissions.
Medical WritingMedical writers work closely with Medpace’s medical experts, biostatisticians, and other members of the study teamto develop study protocols, clinical and statistical study reports, and integrated submission documents according toregulatory guidelines. Members of Medpace’s medical writing group possess substantial scientific knowledge andexperience as well as strong communication skills. This skill set and collaborative approach coupled with a thoroughquality control document review process, allow Medpace to produce high-quality, submission-ready documents foreach contracted project.
BiometricsWe provide customers with high-quality data collected during clinical trials that is the foundation of a successfulclinical trial and forms the backbone of regulatory submissions, including New Drug Applications. We use globalGCP-compliant SOPs, combined with continuous quality control, to ensure that data is consistent, efficient, andcomprehensive.
Data Management: Our data management team develops detailed specifications for the collection, organization,validation, analysis and quality control of clinical trial data ensuring the most cost-effective, secure and regulatorycompliant process.
Biostatistics: Our experienced team of biostatisticians provides trial design consulting, statistical methodologyrecommendations, programming expertise and reporting accuracy necessary to deliver clinical trials efficiently andon time. We offer comprehensive data analysis plans, thoroughly tested and validated customized programs,interpretation of study results, integrated efficacy and safety analysis for regulatory submissions, adaptive design andstatistical support throughout the clinical trial.
PharmacovigilanceOur safety and pharmacovigilance group collects, evaluates, analyzes and reports safety information. We provideglobal adverse event management, physician reviewed safety narrative writing and custom safety surveillance.Monitored by licensed physicians who are trained to provide oversight and to analyze and evaluate the emergingsafety profile of the compound, we have designed our process to ensure safety and expedite approvals.
Core LaboratoryOur core laboratory services include both imaging services and cardiovascular core laboratory services. We partnerwith imaging experts from major academic and clinical institutions involved in research to provide image reading in asecure environment utilizing identical software and workstations integrated into ClinTrak allowing for promptturnaround and oversight. Our imaging experts have clinical trial experience utilizing imaging modalities such as CT,MRI, PET/CT, 3D volumetric analysis, ultrasound, DEXA, angiography, endoscopy and photography. Ourcardiovascular core laboratory provides state-of-the-art standardized electrocardiogram services and data analysis tosupport clinical trials.
Quality AssuranceOur quality assurance team works closely with study teams to ensure compliance with protocols, SOPs, andregulatory guidelines to ultimately protect research subject safety as well as the integrity and validity of study data.Our quality assurance team also provides services including regulatory training, internal system audits, SOPoversight, hosting of audits and regulatory inspections, as well as performs third party audits of critical vendors andinvestigative sites on behalf of our customers.
LaboratoriesCentral Laboratory. Through our Central Laboratory, we provide comprehensive, full-service capabilities globally infour locations, including Cincinnati, Ohio; Leuven, Belgium; Beijing, China; and Singapore. The Central Laboratoryhas longstanding core competency in specialized esoteric testing, including biomarkers for efficacy (approximately60% of central lab revenue for the Successor year ended December 31, 2015) in addition to standard assayofferings. Data consistency and harmonization are maintained utilizing global SOPs and reference ranges, identical
96

analytic platforms, methodologies, reagent systems, calibrator and quality control programs, within a strictframework compliant with GCP requirements and regulatory guidelines to ensure laboratory data reflect the impact ofthe investigational compound and not differences in testing practices.
Bioanalytical Laboratory. Through our Bioanalytical Laboratory we provide highly scientific and value-added testingof biological samples using proprietary methods. Working in a Good Laboratory Practice compliant setting followingFDA and European Medicines Agency, or EMA, guidelines, the Bioanalytical Laboratory delivers method transfer,development, validation, sample analysis and metabolite screening and identification of pre-clinical and clinicalbiological samples with expertise in developing proprietary, highly scientific, esoteric and sensitive tests. Areas ofspecific bioanalytical expertise include advanced mass spectrometry and immunoassay technologies for bioanalyticalanalysis and all bioanalytical aspects for small and large molecules. Our Bioanalytical Laboratory is located on ourclinical research campus in Cincinnati, Ohio.
The majority of our laboratory services are performed as a component of a full-service clinical developmentarrangement with our customers. We also offer our laboratory services on a stand-alone basis, although this hashistorically represented an immaterial amount of our net service revenue. Regardless of the nature of thearrangement, our laboratory services are delivered consistently to our customers as a component of their clinicaldevelopment activities.
ClinicsOur Clinics offering conducts studies in normal healthy volunteers, special populations, and patient populations overa spectrum of diseases including endocrine, cardiovascular and metabolic. Experience includes, but is not limitedto: first-in-human, bioavailability/bioequivalence, single and multiple ascending dose, drug to drug interaction, foodeffect and device studies. Our 60,000 square-foot, 84 bed facility is centrally located on our clinical researchcampus in Cincinnati, Ohio.
CustomersWe have a well-diversified, attractively-positioned customer base that includes small biopharmaceutical companies,mid-sized biopharmaceutical companies and large pharmaceutical companies. We have conducted trials for many ofthe world’s leading pharmaceutical, biotechnology and medical device companies.
For the Successor year ended December 31, 2015, we generated 55.7%, 29.3% and 15.0% of our net servicerevenue from small biopharmaceutical companies, mid-sized biopharmaceutical companies and largepharmaceutical companies, respectively. Additionally, we serve customers in a variety of locations throughout theworld, with approximately 55% of our clinical operations headcount based in North America, 39% in Europe, 4% inAsia/Pacific and 2% in South America and Africa as of June 30, 2016.
For the Successor six months ended June 30, 2016 and the Successor year ended December 31, 2015, our largestcustomer accounted for 6.3% and 6.9% of our net service revenue, respectively, and our top 10 customersrepresented 38.2% and 39.9% of our net service revenue, respectively. For more information about our largestcustomer see “Certain Relationships and Related Person Transactions—Service Agreements.”
Our net service revenue from our top 10 customers for the Successor year ended December 31, 2015 was diversifiedacross approximately 57 compounds in 49 indications across 146 active projects. Our top 10 customers haveworked with us for an average of 6.3 years as of December 31, 2015. Further, among the majority of our customers,net service revenue is diversified by multiple projects for a variety of compounds. For example, 54 of our customershave active projects in more than one therapeutic area, making up 56.8% of our total net service revenue for theSuccessor year ended December 31, 2015. We believe this ability to penetrate across multiple therapeutic areasdemonstrates our strong relationships with our customers and the attractiveness of our full-service, disciplinedoperating model.
We have in the past and may in the future enter into arrangements with our customers or other drug, biologic ormedical device companies in which we take on payment risk by making strategic investments in our customers orother drug companies, providing flexible payment terms or fee financing to customers or other companies, orentering into other risk sharing arrangements on trial execution. We expect that the use of such arrangements will bevery limited, and they are not a part of our core growth strategy.
97

New Business Awards, Cancellations and Backlog
New business awards represent the value of anticipated future net service revenue that has been awarded during theperiod that is recognized in backlog. This value is recognized upon the signing of a contract or receipt of a writtenpre-contract confirmation from a customer that confirms an agreement in principle on budget and scope. Newbusiness awards also include contract amendments, or changes in scope, where the customer has provided writtenauthorization for changes in budget and scope or has approved us to perform additional work as of the measurementdate. Awards may not be recognized as backlog after consideration of a number of factors, including whether (i) therelevant net service revenue is expected only after a pending regulatory hurdle, which might result in cancellation ofthe study, (ii) the customer funding needed for commencement of the study is not believed to have been secured or(iii) study timelines are uncertain or not well defined timeline. In addition, study amounts that extend beyond athree-year timeline are not included in backlog. The number and amount of new business awards can varysignificantly from period to period, and an award’s contractual duration can range from several months to severalyears based on customer and project specifications.
Cancellations arise in the normal course of business and are reflected when we receive written confirmation from thecustomer to cease work on a contractual agreement. The majority of our customers can terminate our contractswithout cause upon 30 days’ notice. Similar to new business awards, the number and amount of cancellations canvary significantly period over period due to timing of customer correspondence and study-specific circumstances.Total cancellations in a period are offset against gross new business awards received in a period to determine netnew business awards in our backlog calculation.
Net new business awards were $218.1 million and $162.6 million for the Successor six months ended June 30,2016 and June 30, 2015, respectively. Net new business awards were $359.5 million, $329.1 million (of which$231.9 million related to the Successor nine month period ended December 31, 2014 and $97.2 million related tothe Predecessor three month period ended March 31, 2014) and $291.6 million for the Successor year endedDecember 31, 2015, the combined Successor nine month period ended December 31, 2014 and Predecessor threemonth period ended March 31, 2014, and the Predecessor year ended December 31, 2013, respectively. Our netnew business awards for the Successor year ended December 31, 2015 grew at a CAGR of 18% since 2012.
Backlog represents anticipated future net service revenue from net new business awards that have not commencedor are currently in process but not complete. Reported backlog will fluctuate based on new business awards, changesin scope to existing contracts, cancellations, net service revenue recognition on existing contracts and foreignexchange adjustments from non-U.S. dollar denominated backlog. As of June 30, 2016, our backlog increased by$65.1 million, or 16.3%, to $465.7 million compared to $400.6 million as of June 30, 2015. Our backlog as ofDecember 31, 2015, December 31, 2014 and December 31, 2013 was approximately $429.7 million, $394.0million and $359.3 million, respectively. Included within backlog as of June 30, 2016 is approximately $170.1million to $175.1 million that we expect to convert to net service revenue in 2016, with the remainder expected toconvert to net service revenue in years after 2016. Our backlog as of December 31, 2015 grew at a CAGR of 11%since 2012.
Backlog and net new business award metrics may not be reliable indicators of our future period net service revenueas they are subject to a variety of factors that may cause material fluctuations from period to period. These factorsinclude, but are not limited to, changes in the scope of projects, cancellations and duration and timing of servicesprovided. No assurance can be given that we will be able to realize the net service revenue that is included inbacklog. See “Risk Factors—Risks Relating to Our Business—Our backlog may not convert to net service revenue atour historical conversion rates,” and “Management’s Discussion and Analysis of Financial Condition and Results ofOperations—New Business Awards, Cancellations and Backlog” for more information.
Sales and Marketing
We employ an integrated sales and marketing team to sell our services to biotechnology, pharmaceutical and medicaldevice companies.
We have an experienced and highly trained global team of professional business development representatives andbusiness development support staff focused on securing business from both new and existing customers, through a
98

consultative and strategic sales approach. We embed our medical and scientific experts from the beginning of thesales process when we first engage potential customers, and they remain embedded across the lifecycle of the saleand throughout the life of the project, program or partnership.
As part of its sales strategy, our business development team focuses on a customer segmentation model. Our teamtargets and engages customers in our addressable market, matches customer characteristics with therapeutic fit andmaintains a mindset of full-service outsourcing. Our structured and disciplined approach facilitates strong accountevaluation, which results in increased focus by the sales team, the development of effective and productiveterritories, the management of sales force effectiveness and the creation of a process whereby both marketing andsales operate under the same guiding principles.
We are able to consult collaboratively with our customers and help optimize timely completion of their clinical trialsand programs, in part, because we engage our therapeutic experts from the beginning of the sales process andinvolve our regulatory affairs experts and highly trained operations team throughout the clinical trial process. Oursales team is then able to take the study design, regulatory plan and execution plan discussed up front and carrythat through to the proposal and provide a final concept during one-on-one customer discussions and final CROevaluations.
Our marketing team supports the business development function in three key areas, generating brand awarenessthrough customized campaigns and web-site development, conference planning and lead generation through marketresearch and business intelligence analysis. The marketing team is set up in two mirrored teams, one team toaddress our therapeutic strategy and tactics, and the second team to monitor and address market environmentacross our lines of business. All of our sales and marketing data are housed within a third party customerrelationship management tool that provides us the analytics we need to make sales planning and sales managementdecisions.
Competition
We compete primarily against other full-service CROs as well as services provided by in-house R&D departments ofbiopharmaceutical companies, universities and teaching hospitals. Our major CRO competitors include Covance Inc.,ICON plc, INC Research Holdings, Inc., inVentiv Health, Inc., PAREXEL International Corporation, PharmaceuticalProduct Development, LLC, PRA Health Sciences, Inc., Quintiles Transnational Holdings Inc. and numerousspecialty and regional CROs.
We generally compete on the basis of a number of factors, including experience within specific therapeutic areas,quality of staff and services, reliability, range of provided services, ability to recruit principal investigators andpatients into studies expeditiously, ability to organize and manage large-scale, global clinical trials, global presencewith strategically located facilities, speed to completion, price and overall value. We believe we compete effectivelywith our competitors across these factors, particularly due to our full-service operating model, our deep therapeuticexpertise in areas that are among the largest, most complex and fastest growing in pharmaceutical development, ourglobal platform and our experienced and committed management team. However, some of our competitors havegreater financial resources and a wider range of service offerings over a greater geographic area than we do, whichcould put us at a competitive disadvantage with respect to these competitors.
The CRO industry remains fragmented, with several hundred smaller, narrowly focused service providers and a smallnumber of full-service companies with global capabilities. We believe there are significant barriers to othersbecoming a global provider offering a broad range of services and products including the cost and experiencenecessary to develop strong therapeutic areas, expertise to manage complex clinical programs, infrastructure tosupport large global programs, ability to deliver high-quality services and expertise required to prepare regulatorysubmissions in numerous jurisdictions.
Government RegulationDevelopment of Drugs, Biologics and Medical DevicesThe development of drugs, biologics and medical devices is highly regulated in the United States and othercountries. Our services are subject to varying regulatory requirements designed to ensure the quality and integrity ofthe pre-clinical and clinical trial process. In the United States, the FDA has primary authority to regulate these
99

activities, in addition to the approval process, and the subsequent manufacturing, safety, labeling, storage, recordkeeping and marketing for these products, which are the responsibility of our customers. Before a marketingapplication for a drug is ready for submission to regulatory authorities, the candidate drug must often undergorigorous testing in clinical trials. In the United States, these trials must be conducted in accordance with the FederalFood, Drug, and Cosmetic Act, its implementing regulations, and other federal and state requirements that requirethe drug to be tested and studied in certain ways prior to approval. The FDA has similar authority and requirementswith respect to the clinical testing of biological products and medical devices. Before a human clinical trial maybegin in the United States, the manufacturer or sponsor of the clinical product candidate must file an InvestigationalNew Drug Application, or IND, with the FDA, which contains, among things, the results of pre-clinical tests,manufacturer information and other analytical data. A separate submission to an existing IND must also be made foreach successive clinical trial conducted during product development. Each clinical trial must be conducted pursuantto, and in accordance with, an effective IND. Each human clinical trial we conduct is subject to the oversight of anIRB, which is an independent committee that has the regulatory authority to review, approve and monitor a clinicaltrial for which the IRB has responsibility. The FDA and IRB receive reports on the progress of each phase of clinicaltesting and may require the modification, suspension, or termination of clinical trials if, among other things, anunreasonable risk is presented to patients or if the design of the trial is insufficient to meet its stated objective. Inaddition, information about certain clinical trials must be made publicly available on the federal governmentwebsite, www.clinicaltrials.gov.
In the United States, GCP regulations govern the design, conduct, performance, monitoring, auditing, recording,analysis, and reporting of clinical trials. In order to comply with GCP and other requirements, we must, among otherthings:
■ comply with specific requirements governing the selection of qualified principal investigators and clinicalresearch sites;
■ obtain specific written commitments from principal investigators;■ obtain IRB review and approval and supervision of the clinical trials by an independent review board or
ethics committee;■ obtain a favorable opinion from regulatory agencies to commence a clinical trial;■ verify that appropriate patient informed consents are obtained before the patient participates in a clinical
trial;■ ensure that adverse drug reactions resulting from the administration of a drug or biologic during a clinical
trial are medically evaluated and reported in a timely manner;■ monitor the validity and accuracy of data;■ monitor drug or biologic accountability at clinical research sites; and■ verify that principal investigators and clinical trial staff maintain records and reports and permit appropriate
governmental authorities access to data for review.
Clinical trials conducted outside the United States are subject to the laws and regulations of the country where thetrials are conducted. These laws and regulations may or may not be similar to the laws and regulations administeredby the FDA and other laws and regulations regarding the protection of patient safety and privacy and the control ofclinical trial pharmaceuticals, medical devices or other clinical trial materials. Within the EU, these requirements areenforced by the EMA and requirements may vary slightly from one member state to another. In Canada, clinical trialsare regulated by the Health Products and Food Branch of Health Canada as well as provincial regulations. Similarrequirements also apply in other jurisdictions, including countries outside the EU and countries in Asia and LatinAmerica where we operate or where our customers may intend to apply for marketing authorization. Clinical trialsconducted outside the United States also may be subject to FDA regulation if the clinical trials are conductedpursuant to an IND or an Investigational Device Exemption for a product candidate that will seek FDA approval orclearance. In addition, clinical trial sponsors follow ICH E6 guidelines as a principle for good clinical practices.
The clinical trial customer and the parties conducting the clinical trials share in responsibilities to ensure that allapplicable legal and regulatory requirements are fulfilled. Many of the functions we regularly perform in the conductof clinical trials subject us directly to regulations (e.g., compliance with GCP), and in some circumstances, we willtake on legal and regulatory responsibility either through a transfer of obligations to us from our clinical trialcustomers or our acting as local legal representative for certain of our clinical trial customers. We may be subject to
100

regulatory action if we fail to comply with these requirements. Failure to comply with certain regulations may alsoresult in the termination of ongoing research and disqualification of data collected during the clinical trials. Forexample, violations of GCP could result, depending on the nature of the violation and the type of product involved, inthe issuance of a warning letter, suspension or termination of a clinical trial, refusal of the FDA to approve clinicaltrial or marketing applications or withdrawal of such applications, injunction, seizure of investigational products, civilpenalties, criminal prosecutions or debarment from assisting in the submission of new drug applications. See “RiskFactors—Risks Relating to Our Business—If we fail to perform our services in accordance with contractualrequirements, government regulations and ethical considerations, we could be subject to significant costs or liabilityand our reputation could be adversely affected.”
We monitor our clinical trials to test for compliance with applicable laws and regulations in the United States andthe foreign jurisdictions in which we operate. We have adopted SOPs that are designed to satisfy regulatoryrequirements and serve as a mechanism for controlling and enhancing the quality of our clinical trials. In the UnitedStates, our procedures were developed to ensure compliance with GCP and associated requirements.
Health Information PrivacyThe confidentiality of personal health information, including patient-specific information collected during clinicaltrials, is heavily regulated in the United States and other countries. The U.S. Department of Health and HumanServices has promulgated rules under the Health Insurance Portability and Accountability Act of 1996, as amendedby the Health Information Technology for Economic and Clinical Health Act of 2009 and their implementingregulations, including the Privacy and Security Rules, or collectively, HIPAA, that govern the use, handling anddisclosure of personally identifiable medical information. These regulations also establish procedures for the exerciseof an individual’s rights and the methods permissible for de-identification of health information. HIPAA applies to“covered entities,” which include certain types of health care providers, as well as service providers to covered entitieswhich access protected health information, known as “business associates.” Two of our subsidiaries, Medpace ClinicalPharmacology, LLC and C-MARC, LLC, are covered entities under HIPAA. Further, many investigators with whom weare involved in clinical trials are also directly subject to HIPAA as covered entities. There are instances where we maybe considered a business associate of a covered entity investigator, and we have signed business associate agreementswith some investigators. If we are determined to be a business associate, we would be directly liable for any breachesof protected health information and other HIPAA violations. We are also liable contractually under any businessassociate agreements we have signed with covered entities. In addition, we are also subject to privacy legislation inCanada under the federal Personal Information Protection and Electronic Documents Act, the Act Respecting theProtection of Personal Information in the Private Sector and the Personal Health Information Protection Act andprivacy legislation in the EU under the 95/46/EC Privacy Directive on the protection and free movement of personaldata, as replaced by the General Data Protection Regulation from early 2018 onwards. See “Risk Factors—RisksRelating to Our Industry—Current and proposed laws and regulations regarding the protection of personal data couldresult in increased risks of liability or increased cost to us or could limit our service offerings.”
Health Industry ArrangementsThe conduct of pre-clinical and clinical trials may be subject to laws and regulations that are intended to prevent themisuse of government health care program funding. In the United States, these laws include, among others, theFalse Claims Act, which prohibits submitting or causing the submission of false statements or improper claims forgovernment health care program payments; and the Anti-Kickback statute, which prohibits paying, offering to pay orreceiving payment with the intent to induce the referral of services or devices that are covered under a federal healthcare program. Violations of these laws and regulations may incur administrative, civil, and criminal penalties.
Employee Safety and Workplace ConditionsMost of our employees are office based and subject to health and safety regulations covering offices, with which wecomply. In addition to its comprehensive regulation of safety in the workplace, the U.S. Occupational Safety andHealth Administration has established extensive requirements relating to workplace safety for healthcare employerswhose workers might be exposed to blood-borne pathogens such as HIV and the hepatitis B virus, which apply to ourclinic and laboratories. Furthermore, certain employees might have to receive initial and periodic training to ensurecompliance with applicable hazardous materials regulations and health and safety guidelines. We are subject tosimilar regulations with respect to our laboratories in Belgium, Singapore and China.
101

Environmental Regulation and Liability
We are subject to various laws and regulations relating to the protection of the environment and human health andsafety in the countries in which we do business, including laws and regulations governing the management anddisposal of hazardous substances and wastes, the cleanup of contaminated sites and the maintenance of a safeworkplace. Our operations include the use, generation and disposal of hazardous materials and medical wastes. Wemay, in the future, incur liability under environmental statutes and regulations for contamination of sites we own oroperate (including contamination caused by prior owners or operators of such sites), the off-site disposal ofhazardous substances and for personal injuries or property damage arising from exposure to hazardous materialsfrom our operations. We believe that we have been and are in substantial compliance with all applicableenvironmental laws and regulations and that we currently have no liabilities under such environmental requirementsthat could reasonably be expected to materially harm our business, results of operations or financial condition.
Intellectual Property
We develop and use a number of proprietary methodologies, analytics, systems, technologies and other intellectualproperty in the conduct of our business. We rely upon a combination of confidentiality policies, nondisclosureagreements and other contractual arrangements to protect our trade secrets, and copyright and trademark laws toprotect other intellectual property rights. We have obtained or applied for trademarks and copyright protection in theUnited States and in a number of foreign countries. Our material trademarks include Medpace and ClinTrak.Although the duration of trademark registrations varies from country to country, trademarks generally may berenewed indefinitely so long as they are in use and/or their registrations are properly maintained, and so long as theyhave not been found to have become generic. Although we believe the ownership of trademarks is an importantfactor in our business and that our success does depend in part on the ownership thereof, we rely primarily on theinnovative skills, technical competence and marketing abilities of our employees. We do not have any materiallicenses, franchises or concessions.
Employees
As of June 30, 2016 we had approximately 2,300 employees worldwide, with approximately 66% in North America,29% in Europe, 4% in Asia/Pacific and 1% in South America and Africa. None of our employees are currentlycovered by a collective bargaining agreement specific to our company. We believe our overall relations with ouremployees are good. As of December 31, 2015, December 31, 2014 and December 31, 2013, we hadapproximately 2,000, 1,700 and 1,400 employees, respectively.
The success of our business depends upon our ability to attract and retain qualified professional, scientific andtechnical staff. The level of competition among employers in the United States and overseas for skilled personnel,particularly for those with Ph.D., M.D. or equivalent degrees or training, is high. We believe that our brandrecognition and our multinational presence are advantages in attracting qualified candidates. We also believe thatthe wide range of clinical trials in which we participate allows us to offer broad experience to clinical researchers. Inaddition, our disciplined and centralized approach to hiring and training has fostered, and we believe will continueto foster, strong employee loyalty and a low turnover rate.
Properties
As of June 30, 2016, we had 29 facilities located in 25 countries. Most of our facilities consist solely of officespace; however, we have five laboratories located across four facilities. We lease all of our facilities, with theexception of office space owned in Leuven, Belgium and Prague, Czech Republic. Our principal executive offices arelocated on a corporate campus in Cincinnati, Ohio consisting of three buildings totaling approximately 332,000square feet. The leases for the Cincinnati site expire in 2022, 2026 and 2027. None of our leases are individuallymaterial to our business model and all have either options to renew or are located in major markets with what webelieve are adequate opportunities to continue business operations on terms satisfactory to us.
Liability and Insurance
We may be liable to our customers for any failure to conduct their clinical trials properly according to the agreed-upon protocol and contract. If we fail to conduct a clinical trial properly in accordance with the agreed-uponprocedures, we may have to repeat a clinical trial or a particular portion of the services at our expense, reimburse thecustomer for the cost of the services and/or pay additional damages.
102

At our Phase I clinic, we study the effects of drugs on healthy volunteers. In addition, in our clinical business we, onbehalf of our customers, contract with physicians who render professional services, including the administration ofthe substance being tested to participants in clinical trials, many of whom are seriously ill and are at great risk offurther illness or death as a result of factors other than their participation in a trial. As a result, we could be heldliable for bodily injury, death, pain and suffering, loss of consortium or other personal injury claims and medicalexpenses arising from a clinical trial. In addition, we sometimes engage the services of vendors necessary for theconduct of a clinical trial, such as laboratories or medical diagnostic specialists. Because these vendors are engagedas subcontractors, we are responsible for their performance and may be held liable for damages if the subcontractorsfail to perform in the manner specified in their contract.
To reduce our potential liability, and as a requirement of the GCP regulations, informed consent is required fromeach volunteer and patient. In addition, our customers provide us with contractual indemnification for all of ourservice related contracts. These indemnities generally do not, however, protect us against certain of our own actionssuch as those involving negligence or misconduct. Our business, financial condition and operating results could beharmed if we were required to pay damages or incur defense costs in connection with a claim that is notindemnified, that is outside the scope of an indemnity or where the indemnity, although applicable, is not honoredin accordance with its terms.
We maintain errors, omissions and professional liability insurance in amounts we believe to be appropriate. Thisinsurance provides coverage for vicarious liability due to negligence of the investigators who contract with us, as wellas claims by our customers that a clinical trial was compromised due to an error or omission by us. If our insurancecoverage is not adequate, or if insurance coverage does not continue to be available on terms acceptable to us, ourbusiness, financial condition and operating results could be materially harmed.
Legal Proceedings
We are currently party to legal proceedings incidental to our business and may become subject to additional legalproceedings in the future. We believe that the ultimate outcome of the proceedings to which we are currently a party,individually and in the aggregate, will not have a material adverse effect on our consolidated financial statements.Litigation is subject to inherent uncertainties. See Note 9 to our audited financial statements included in thisprospectus for a discussion of legal proceedings.
103

MANAGEMENT
Executive Officers and Directors
The following table sets forth certain information concerning our executive officers and directors as of the date setforth on the cover page of this prospectus:
NAME AGE POSITION
Dr. August J. Troendle . . . . . . . . . 59 President, Chief Executive Officer and Chairman of the Board of DirectorsJesse J. Geiger . . . . . . . . . . . . . . . 42 Chief Financial Officer and Chief Operating Officer, Laboratory OperationsSusan E. Burwig . . . . . . . . . . . . . 53 Senior Vice President, OperationsStephen P. Ewald . . . . . . . . . . . . 47 General Counsel and Corporate SecretaryPenelope J. Bucknell . . . . . . . . . . 58 Vice President, Human ResourcesDr. Supraj R. Rajagopalan . . . . . . 38 DirectorAlexander F.S. Leslie . . . . . . . . . . 36 DirectorMatthew R. Norton . . . . . . . . . . . 31 DirectorRobert O. Kraft . . . . . . . . . . . . . . 46 DirectorBrian T. Carley . . . . . . . . . . . . . . . 62 Director
The following is a biographical summary of the experience of our executive officers and directors:
Executive OfficersDr. August J. Troendle—President, Chief Executive Officer and Chairman of the Board of DirectorsDr. August J. Troendle has been the President, Chief Executive Officer and Chairman of the Board of Directors ofMedpace since he founded the Company in July 1992. Before founding Medpace, Dr. Troendle served as AssistantDirector, Associate Director and Senior Associate Director from 1987 to 1992 at Sandoz (Novartis), where he wasresponsible for the clinical development of lipid altering agents. From 1986 to 1987, Dr. Troendle worked as aMedical Review Officer in the Division of Metabolic and Endocrine Drug Products at the FDA. Dr. Troendle also hasextensive experience serving as a director for a diverse group of public and private companies, including as a directorof Coherus BioSciences, Inc. since 2012, as a director of Xenon Pharmaceuticals Inc. from 2007 to 2008, as adirector of Symplmed Pharmaceuticals, LLC since 2013, as a director of LIB Therapeutics, LLC since 2015 and as adirector of CinRx Pharma, LLC since 2015. Dr. Troendle received his Medical Degree from the University ofMaryland, School of Medicine. We believe Dr. Troendle brings to our Board valuable perspective and experience asour Chief Executive Officer, and as a former member of a large pharmaceutical company and the FDA, as well asextensive knowledge of the CRO and biopharmaceutical industries, and his experience serving on public and privateboards, all of which qualify him to serve as the Chairman of our Board.
Jesse J. Geiger—Chief Financial Officer and Chief Operating Officer, Laboratory OperationsJesse J. Geiger joined Medpace in October 2007 as Corporate Controller, and he was appointed Chief FinancialOfficer in March 2011. Mr. Geiger became Chief Operating Officer, Laboratory Operations in November 2014. Priorto joining Medpace, Mr. Geiger worked for SENCORP from 2004 to 2007 as the Corporate Controller and Manager ofFinancial Planning and Analysis. Prior to SENCORP, Mr. Geiger served as the Director of Capital Markets forCincinnati Bell from 2002 to 2004. Mr. Geiger started his career in the audit practice at Arthur Andersen LLP.Mr. Geiger has served as a director for several private companies, including as a director of SymplmedPharmaceuticals, LLC since 2013, as a director of LIB Therapeutics, LLC since 2016 and as a director of CinRxPharma, LLC since 2016. Mr. Geiger received his Bachelor of Business Administration in Accounting from theUniversity of Cincinnati and is a Certified Public Accountant.
Susan E. Burwig—Senior Vice President, OperationsSusan E. Burwig joined Medpace in August 1993 and has served in various key leadership roles within the ClinicalOperations department. From February 2003 to May 2015, Ms. Burwig served as Senior Vice President, ClinicalOperations, overseeing clinical trial management, clinical monitoring, start-up, including feasibility, and newbusiness proposals. In June 2015, Ms. Burwig was appointed Senior Vice President, Operations. Prior to joiningMedpace, Ms. Burwig held several clinical roles, including leading heart failure clinical research studies at theUniversity of Cincinnati. Ms. Burwig received her Bachelor of Science in Nursing as well as an MA in SportsAdministration from Kent State University.
104

Stephen P. Ewald—General Counsel and Corporate SecretaryStephen P. Ewald joined Medpace as General Counsel and Corporate Secretary in June 2012. Prior to joiningMedpace, Mr. Ewald served as the Managing Director and Chief Legal Officer of Brevet Capital Management fromMay 2011 to June 2012. From May 2009 to May 2011, he was a Managing Director and Assistant General Counselfor Cantor Fitzgerald Securities/Cantor Fitzgerald & Co. Mr. Ewald was employed with Bank of America from 1999 to2009, serving in various roles within the legal department and the Global Markets Group, including ManagingDirector and Chief Operating Officer of the Principal Capital Group, a proprietary investing group within Bank ofAmerica Securities. Mr. Ewald has served as director for several private companies, including as a director ofSymplmed Pharmaceuticals, LLC since 2013, as a director of LIB Therapeutics, LLC since 2016 and as a director ofCinRx Pharma, LLC since 2016. Mr. Ewald received his Bachelor of Science in Political Sciences from theUniversity of Cincinnati and his Juris Doctorate from the University of Cincinnati College of Law.
Penelope J. Bucknell—Vice President, Human ResourcesPenelope J. Bucknell joined Medpace in February 2012 as Vice President, Human Resources. Ms. Bucknell has alsoled the Global Travel department since joining the Company, and the Facilities department since January 2015.Prior to joining Medpace, Ms. Bucknell was the Human Resources Director, Europe and Latin America forUnderwriters Laboratories from August 2008 to February 2012. Before that, from 1998 to 2008, she served asDirector and Executive Director, Human Resources, EMEA and Asia Pacific for Pharmaceutical ProductDevelopment. Ms. Bucknell received her Bachelor of Science in Social Sciences from Brunel University and aPostgraduate Diploma in Personnel Management from PCL (now the University of Westminster). She is a Member ofthe Chartered Institute of Personnel and Development.
Non-Employee Directors
Dr. Supraj R. Rajagopalan—DirectorDr. Supraj R. Rajagopalan has served as a member of our Board since February 2014. Dr. Rajagopalan joined Cinvenin 2004 and has been a partner since 2011. He currently leads Cinven’s Healthcare sector team, sits on the firm’sExecutive Committee and is a member of the UK and Ireland regional team. From 2003 to 2004, he worked for TheBoston Consulting Group, where he focused on projects in the financial services and healthcare sectors. Prior to this,he was a doctor in the UK National Health Service from 2001 to 2002. Dr. Rajagopalan has extensive experienceserving as a director for a diverse group of European private and public companies. Dr. Rajagopalan graduated fromCambridge University with undergraduate and postgraduate degrees in Medical Sciences. Dr. Rajagopalan waschosen as a director because of his significant financial, investment and operational experience from his backgroundin private equity finance, along with his past practice as a doctor.
Alexander F.S. Leslie—DirectorAlexander F.S. Leslie has served as a member of our Board since February 2014. Mr. Leslie joined Cinven in 2006,has been a partner since January 2016 and is a member of Cinven’s Healthcare sector team and its UK and Irelandregional team. Prior to this, he worked in the Investment Banking Division of Morgan Stanley in London from 2003to 2006. Mr. Leslie has extensive experience serving as a director for a diverse group of European private companies.Mr. Leslie has an MA in History from the University of Edinburgh. Mr. Leslie was chosen as a director because of hissignificant financial, investment and operational experience from his background in banking and private equityfinance.
Matthew R. Norton—DirectorMatthew R. Norton has served as a member of our Board since October 2015. Mr. Norton joined Cinven in 2010 andis a member of Cinven’s Healthcare sector team and its UK and Ireland regional team. Prior to joining Cinven,Mr. Norton worked in the Investment Banking Division of Citigroup in London from 2007 to 2010. There, he advisedon M&A and restructuring deals across a range of sectors, including consumer, real estate and healthcare.Mr. Norton graduated from Imperial College London with an MSc in Physics. Mr. Norton was chosen as a directorbecause of his significant financial, investment and operational experience from his background in banking andprivate equity finance.
105

Robert O. Kraft—DirectorRobert O. Kraft has served as a member of our Board since July 1, 2016. Mr. Kraft has served as the Executive VicePresident of CVS Health Corporation and the President of Omnicare, Inc., CVS’s long-term care business, sinceAugust 2015. From September 2012 to August 2015, Mr. Kraft served as Senior Vice President and Chief FinancialOfficer of Omnicare, Inc., and from November 2010 to September 2012, he served as Senior Vice President,Finance of Omnicare, Inc. Before joining Omnicare, Inc., Mr. Kraft was an audit partner at PricewaterhouseCoopersLLP, where he worked for 18 years. Mr. Kraft received his Bachelor’s Degree in Accounting from the University ofDayton. Mr. Kraft was chosen as a director because of his significant financial and accounting experience from hisbackground as an audit partner at PricewaterhouseCoopers LLP and his experience as an executive of a publiccompany.
Brian T. Carley—DirectorBrian T. Carley has served as a member of our Board since July 1, 2016. Mr. Carley is currently the Senior VicePresident and Chief Financial Officer of Clubessential, LLC, a privately held Software as a Service (SaaS) companyproviding member engagement software. He previously served as President and Chief Executive Officer of theCincinnati USA Regional Chamber from 2014 to 2015. From 2002 to 2014, Mr. Carley worked at Deloitte & ToucheLLP, where he served as regional and office audit division head and audit partner. Before joining Deloitte & ToucheLLP, Mr. Carley was employed by Arthur Andersen LLP from 1976 to 2002. There, he served as office managingpartner and audit partner. Mr. Carley also has extensive experience serving as a director for a diverse group ofcompanies, including as a director of Assurex Health, Inc. since 2015, and as a director and officer of numerouscivic and charitable organizations. Mr. Carley received his Bachelor of Science in Accountancy from the University ofIllinois, and he is a retired Certified Public Accountant. Mr. Carley was chosen as a director because of hissignificant financial, accounting and directorship experience from his background as an audit partner at Deloitte &Touche LLP and Arthur Andersen LLP and his experience serving on boards.
Board of Directors
Our business and affairs are managed under the direction of our Board. When considering whether directors have theexperience, qualifications, attributes or skills, taken as a whole, to enable our Board to satisfy its oversightresponsibilities effectively in light of our business and structure, the Board focuses primarily on each person’sbackground and experience as reflected in the information discussed in each of the directors’ individual biographiesset forth above. We believe that our directors provide an appropriate mix of experience and skills relevant to the sizeand nature of our business.
Our amended and restated certificate of incorporation will provide that our Board will initially consist of six directors,and that our Board will be divided into three classes, as nearly equal as possible, with one class being elected ateach annual meeting of shareholders. Each director will serve a three-year term, with termination staggeredaccording to class. Our directors will initially be divided among the three classes as follows:
■ the Class I directors will be Robert O. Kraft and Brian T. Carley and their terms will expire at the annualmeeting of shareholders to be held in 2017;
■ the Class II directors will be Alexander F.S. Leslie and Matthew R. Norton and their terms will expire at theannual meeting of shareholders to be held in 2018; and
■ the Class III directors will be Dr. Supraj R. Rajagopalan and Dr. August J. Troendle and their terms willexpire at the annual meeting of shareholders to be held in 2019.
The size of our Board may thereafter be fixed from time to time solely by resolution of at least a majority of thedirectors then in office. Any increase or decrease in the number of directors will be distributed among the threeclasses so that, as nearly as possible, each class will consist of one-third of the directors. This classification of ourBoard may have the effect of delaying or preventing changes in control of our company. See “Description of CapitalStock—Anti-Takeover Effects of Our Amended and Restated Certificate of Incorporation and Amended and RestatedBylaws and Certain Provisions of Delaware Law.”
106

Selection Arrangements
Because Cinven will continue to control a majority of the voting power of our common stock upon the closing of thisoffering, we expect that Cinven will control the election of our directors. In addition, we understand that,substantially concurrently with the closing of this offering, Cinven and Dr. August J. Troendle, our Chief ExecutiveOfficer and founder, intend to enter into the Voting Agreement. See “Certain Relationships and Related PersonTransactions—Voting Agreement,” for additional information.
Director Independence and Controlled Company Exemption
Because of the Voting Agreement and the aggregate voting power of Cinven and Dr. Troendle, we are considered a“controlled company” within the meaning of the corporate governance standards of NASDAQ. Accordingly, we willnot be required to have a majority of “independent directors” on our Board nor will we be required to have acompensation committee and a corporate governance and nominating committee composed entirely of “independentdirectors” as defined under the rules of NASDAQ. Further, our director nominees will not be required to be selectedor recommended to the Board by a majority of the “independent directors” as defined under the rules of NASDAQand compensation for our executives will not be determined by a majority of “independent directors” as definedunder the rules of NASDAQ. The “controlled company” exemption does not modify the independence requirementsfor the audit committee, and we intend to comply with the requirements of Sarbanes-Oxley and NASDAQ, whichrequire that our audit committee be composed of at least three members, one of whom will be independent upon thelisting of our common stock, a majority of whom will be independent within 90 days of listing and each of whom willbe independent within one year of listing.
After the consummation of this offering, we intend to avail ourselves of certain of these exemptions. In particular,immediately following this offering we will not have a nominating and corporate governance committee. Therefore,for as long as we remain a “controlled company” you will not have the same protections afforded to shareholders ofcompanies that are subject to all of these corporate governance requirements. If at any time we cease to be a“controlled company” under the rules of NASDAQ, our Board will take all action necessary to comply with theNASDAQ corporate governance rules, including establishing certain committees composed entirely of independentdirectors, subject to a permitted “phase-in” period.
Our Board has affirmatively determined that Brian T. Carley, Robert O. Kraft, Dr. Supraj R. Rajagopalan, AlexanderF.S. Leslie and Matthew R. Norton are independent directors under the applicable rules of NASDAQ.
Board Committees
Upon the consummation of this offering, and prior to the listing of our common stock on NASDAQ, we will establishan audit committee and a compensation committee. Each committee will operate under a charter that will beapproved by our Board. Each committee will have the composition and responsibilities described below. Membersserve on these committees until their resignations or until otherwise determined by our Board. The charter andcomposition of each committee will be effective upon the consummation of this offering. The charter of eachcommittee will be available on our website.
Audit CommitteeThe primary purposes of our audit committee will be to assist the Board’s oversight of:
■ the integrity of our corporate accounting and financial reporting processes and financial information;
■ our systems of internal control over financial reporting and disclosure controls and procedures;
■ our process related to risk management;
■ procedures for receipt, retention and treatment of complaints and the confidential anonymous submissionby our employees regarding accounting or auditing matters;
■ the qualifications, engagement, compensation, independence and performance of our independentregistered public accounting firm;
■ our independent registered public accounting firm’s annual audit of our financial statements and anyengagement to provide other services;
107

■ our legal and regulatory compliance;■ our related person transaction policy; and■ the application of our codes of business conduct and ethics as established by management and the Board.
Upon the consummation of this offering, and prior to the listing of our common stock, our audit committee will becomposed of Robert O. Kraft, Alexander F. S. Leslie and Brian T. Carley. Brian T. Carley will serve as chair of theaudit committee.
Brian T. Carley qualifies as an “audit committee financial expert” as such term has been defined by the SEC inItem 407(d)(5) of Regulation S-K. Our Board has affirmatively determined that Robert O. Kraft and Brian T. Carleymeet the definition of an “independent director” for the purposes of serving on the audit committee underapplicable NASDAQ rules and Rule 10A-3 under the Exchange Act. We intend to comply with these independencerequirements for all members of the audit committee within one year of the date of the listing of our common stock.The audit committee will be governed by a charter that complies with the rules of NASDAQ.
Compensation CommitteeThe primary purposes of our compensation committee will be to assist the Board in overseeing our managementcompensation policies and practices, including:
■ determining and approving the compensation of our Chief Executive Officer and our executive officers;■ assessing our performance management process and updates to our succession plan for our Chief Executive
Officer and other key executive positions;■ reviewing and approving incentive compensation policies and programs, and exercising discretion in the
administration of those policies and programs;■ reviewing and approving equity and non-equity compensation, welfare, benefit and pension programs, other
plans and policies related to compensation for our employees, directors and consultants and exercisingdiscretion in the administration of those programs; and
■ preparing the annual report of the compensation committee required by the rules of the SEC to be includedin our annual report.
Upon the consummation of this offering, and prior to the listing of our common stock, our compensation committeewill be composed of Dr. Supraj R. Rajagopalan, Alexander F.S. Leslie and Robert O. Kraft. Dr. Supraj R. Rajagopalanwill serve as chair of the compensation committee. Prior to the consummation of this offering, we did not have acompensation committee. The compensation committee will be governed by a charter that complies with the rules ofNASDAQ.
Risk Oversight
Our Board is responsible for overseeing our risk management process. Our Board focuses on our general riskmanagement strategy, the most significant risks facing us, and oversees the implementation of risk mitigationstrategies by management. Our Board is also apprised of particular risk management matters in connection with itsgeneral oversight and approval of corporate matters and significant transactions.
Risk Considerations in our Compensation Program
We conducted an assessment of our compensation policies and practices for our employees and concluded thatthese policies and practices are not reasonably likely to have a material adverse effect on our company.
Code of Business Conduct and Ethics
Prior to the completion of this offering, we will update our written code of ethical business conduct that applies toour directors, officers and employees, including our principal executive officer, principal financial officer, principalaccounting officer or controller, and persons performing similar functions. A copy of the code will be posted on ourcorporate website, which will be located at www.medpace.com. Any amendments to or waivers from our code ofethical business conduct will be disclosed on our Internet website promptly following the date of such amendment orwaiver. Our Internet website and the information contained therein or connected thereto shall not be deemed to beincorporated into this prospectus or the registration statement of which it forms a part.
108

Disclosure Committee and Charter
We do not currently have a disclosure committee and disclosure committee charter. We plan to establish a disclosurecommittee following this offering and it will operate under a charter. The purpose of the disclosure committee will beto provide assistance to the principal executive officer and the principal financial officer in fulfilling theirresponsibilities regarding the identification and disclosure of material information about us and the accuracy,completeness and timeliness of our financial reports.
Compensation Committee Interlocks and Insider Participation
No interlocking relationships exist between the members of our Board or our compensation committee and the boardof directors or compensation committee of any other company.
Leadership Structure of our Board of Directors
Our amended and restated bylaws provide our Board with flexibility to combine or separate the positions of Chairmanof the Board and Chief Executive Officer in accordance with its determination that utilizing one or the other structurewould be in the best interests of our company. Upon completion of this offering, Dr. Troendle will serve as Chairmanof the Board, President and Chief Executive Officer.
Indemnification of Directors and Officers
Our amended and restated certificate of incorporation provides that we will indemnify our directors and officers tothe fullest extent permitted by the DGCL.
Our amended and restated certificate of incorporation provides that our directors will not be liable for monetarydamages for breach of fiduciary duty, except for liability relating to any breach of the director’s duty of loyalty, actsor omissions not in good faith or which involve intentional misconduct or a knowing violation of law, violations underSection 174 of the DGCL or any transaction from which the director derived an improper personal benefit.
We intend to enter into new indemnification agreements with each of our directors and executive officers. Theseagreements, among other things, will require us to indemnify each director and executive officer to the fullest extentpermitted by Delaware law, including indemnification of expenses such as attorneys’ fees, judgments, fines andsettlement amounts incurred by the director or executive officer in any action or proceeding, including any action orproceeding by or in right of us, arising out of the person’s services as a director or executive officer, as applicable.
We have customary directors’ and officers’ indemnity insurance in place for our directors and executive officers.
109

EXECUTIVE AND DIRECTOR COMPENSATION
This section discusses the material components of the executive compensation program for our executive officerswho are named in the “2015 Summary Compensation Table” below. In 2015, our “named executive officers”, orNEOs, and their positions were as follows:
■ Dr. August J. Troendle, President and Chief Executive Officer;■ Mr. Jesse J. Geiger, Chief Financial Officer and Chief Operating Officer, Laboratory Operations;■ Ms. Susan E. Burwig, Senior Vice President, Operations; and■ Mr. Kurt A. Brykman, Former Chief Operating Officer, CRO Operations.
Mr. Brykman’s employment ended on July 14, 2015.
This discussion may contain forward-looking statements that are based on our current plans, considerations,expectations and determinations regarding future compensation programs. Actual compensation programs that weadopt following the completion of this offering may differ materially from the currently planned programssummarized in this discussion.
2015 Summary Compensation Table
The following table sets forth summary compensation information for our NEOs for the fiscal year endedDecember 31, 2015:
NAME AND PRINCIPAL POSITION SALARY ($)BONUS (2)
($)
STOCKAWARDS (3)
($)
OPTIONAWARDS (4)
($)
ALL OTHERCOMPENSATION (5)
($) TOTAL
August J. Troendle . . . . . . . . . . . . . . . $270,417 — $7,432,800 — $113,537 $7,816,754President and Chief ExecutiveOfficer
Jesse J. Geiger . . . . . . . . . . . . . . . . . . $300,000 $71,750 — — $ 9,000 $ 380,750Chief Financial Officer and ChiefOperating Officer, LaboratoryOperations
Susan E. Burwig . . . . . . . . . . . . . . . . . $350,432 $62,900 — — $ 20,600 $ 433,932Senior Vice President, Operations
Kurt A. Brykman . . . . . . . . . . . . . . . . $225,217 — $ 336,400 $239,000 $525,508 $1,326,125Former Chief Operating Officer,CRO Operations (1)
(1) Mr. Brykman’s employment ended on July 14, 2015. Mr. Brykman’s salary shown in the table is the salary he received fromJanuary 1, 2015 through his termination date.
(2) The amounts shown in the table represent 2015 earned annual bonus paid to Mr. Geiger and Ms. Burwig of $71,750 and $62,900,respectively.
(3) All stock awards granted to NEOs during 2015 are valued based on the aggregate grant date fair value of such stock awards,computed in accordance with FASB ASC Topic 718, “Compensation-Stock Compensation” (“ASC 718”), and do not representamounts paid to or realized by the NEO. We provide information regarding the assumptions used to calculate the value of all stockawards made to executive officers in 2015 in Note 8 to our audited consolidated financial statements included elsewhere in thisprospectus. As described below under “Narrative to Summary Compensation Table,” all stock awards, except Dr. Troendle’s July 31,2015 grant of 351,851 vested shares, were, immediately upon grant (net of any shares surrendered in respect of tax withholdingobligations), contributed by the NEO to MPI in exchange for incentive units of MPI. Upon Mr. Brykman’s termination of employment,his vested restricted shares (which had been exchanged for incentive units of MPI) were repurchased and his unvested restrictedshares (which had been exchanged for incentive units of MPI) were forfeited.
(4) All stock option awards granted to any NEOs have been valued based on the fair value of the option awards computed in accordancewith ASC 718, and do not represent amounts realized by the NEO. We provide information regarding the assumptions used tocalculate the value of all option awards made to executive officers in 2015 in Note 8 to our audited consolidated financial statementsincluded elsewhere in this prospectus. Upon Mr. Brykman’s termination of employment, he forfeited all his stock options, as they hadnot yet vested.
(5) This column shows the following amounts for Mr. Brykman: $37,359 in relocation reimbursement assistance, a $212,641 relocationbalance payment, a lump sum severance payment of $268,715, $1,793 in assistance towards benefit continuation under COBRA
110

and $5,000 in fees for service as a member of our Board following his employment end date. The amount shown in this column forMr. Geiger consists exclusively of fully vested 401(k) matching contributions paid to his account by the Company.
The amounts shown in this column for Dr. Troendle and Ms. Burwig consist of fully vested 401(k) matching contributions of $10,600each paid to their respective accounts by the Company and incremental costs of $102,937 and $10,000, respectively, attributableto personal usage of Company provided aircraft paid for by the Company on their behalf. For multi-leg hybrid flights in which at leastone leg consists of personal use, the incremental cost of personal use is calculated based on the difference between the actual costof the personal and business legs of the flight and the hypothetical cost that would have been incurred if only the business legs of theflight occurred, using costs provided by the chartered jet service provider. Pursuant to Company policy, for personal use of Companyprovided aircraft in which both Dr. Troendle and Ms. Burwig are present, incremental cost is allocated to Dr. Troendle for purposes ofthe Summary Compensation Table unless the incremental cost specifically relates to Ms. Burwig. See “—Narrative to SummaryCompensation Table—Aircraft Usage.”
Narrative to Summary Compensation TableBase SalariesThe NEOs receive base salaries to compensate them for services rendered to our company. The base salary payableto each NEO is intended to provide a fixed component of compensation reflecting the executive’s skill set,experience, role and responsibilities.
Dr. Troendle was party to an employment agreement entered into in 2011, and has entered into an amended andrestated agreement in connection with this offering. Both employment agreements provide for a base salary of$410,000 per annum. After entering into his prior employment agreement and prior to 2015, Dr. Troendlerequested and received a lower base salary equal to $120,000 per annum. Effective on March 1, 2015 andconsistent with our merit cycle, Dr. Troendle’s base salary was adjusted from $120,000 to $227,500 per annum. Asecond adjustment was confirmed and made effective on September 1, 2015, which adjusted Dr. Troendle’s basesalary from $227,500 to $410,000 per annum to bring his base salary in line with his employment agreement.
Effective March 1, 2015 and consistent with our merit cycle, Ms. Burwig’s base salary was adjusted from $317,099to $357,099 per annum.
During 2016, in addition to our normal merit cycle, we intend to perform a comprehensive market review of thecompensation of the senior executives of the Company, including the NEOs (other than Mr. Brykman).
Discretionary Annual BonusesIn 2015, each of our NEOs was eligible for an annual discretionary cash bonus determined by Dr. Troendle. Ourdiscretionary bonuses have been intended to reward past performance as well as to provide incentives for futureperformance.
Dr. Troendle did not award himself an annual bonus in 2015. For 2015, each other NEO had a target annual bonusof 35% of his or her annual base salary. Dr. Troendle based his determination of such bonus amounts on asubjective evaluation of individual and Company performance for 2015. Mr. Brykman did not receive an annualbonus for 2015 because his employment ended prior to the end of the year.
The actual bonuses paid for 2015 are shown in the Summary Compensation Table in the column entitled “Bonus.”
Equity Compensation
We have granted equity awards to certain of our employees, including the NEOs, pursuant to the Medpace (formerlyknown as Scioto Holdings, Inc.) 2014 Equity Incentive Plan. The 2014 Equity Incentive Plan provides for the grantof stock options, restricted shares, fully vested shares and restricted stock units. Stock options have historically beengranted at a premium exercise price exceeding fair market value on the date of grant. As a condition to exercisingstock options and acceptance of certain restricted shares, employees must execute a Contribution and SubscriptionAgreement that provides for the exchange of the shares issued for incentive units in MPI upon the occurrence ofcertain events. The incentive units are tied directly to common stock ownership of Medpace and entitle the incentiveunit holder to participate in the risks and rewards of owning Medpace stock (including any vesting risk) throughownership in MPI. Pursuant to the terms of the 2014 Equity Incentive Plan, the requirement to exchange sharesreceived under the 2014 Equity Incentive Plan for incentive units in MPI will cease to be applicable uponconsummation of this offering.
Dr. Troendle was awarded two equity grants on July 31, 2015. One grant was for 351,851 fully vested shares ofcommon stock outside of the 2014 Equity Incentive Plan. The other grant was for 251,851 restricted shares under
111

the 2014 Equity Incentive Plan, 50% of which were scheduled to vest on December 31, 2015 and the remaining50% of which were scheduled to vest on December 31, 2016. The grant of 251,851 restricted shares wasimmediately exchanged for incentive units of MPI, as required by the 2014 Equity Incentive Plan.
Mr. Geiger and Ms. Burwig were granted shares in 2014 (which were immediately exchanged for incentive units ofMPI), of which 40% were immediately vested shares and the remaining 60% were restricted shares originallyscheduled to vest in equal annual installments on each of the first three anniversaries of the date of grant.
On December 31, 2015, the Company accelerated the vesting of all outstanding, restricted shares awarded pursuantto the 2014 Equity Incentive Plan, including Dr. Troendle’s, Mr. Geiger’s and Ms. Burwig’s restricted shares (whichwere previously exchanged for incentive units in MPI).
Mr. Brykman was granted 29,629 shares of the Company’s common stock on March 23, 2015 (which wereimmediately exchanged for incentive units of MPI), of which 40% were immediately vested shares and the remaining60% were restricted shares originally scheduled to vest in equal annual installments on each of the first threeanniversaries from the date of grant. Upon Mr. Brykman’s termination of employment in July 2015, his 11,852vested shares (which had been exchanged for incentive units of MPI) were repurchased by MPI for cash in anamount equal to 80% of their fair market value ($102,400). Mr. Brykman’s 17,777 restricted shares (which wereimmediately exchanged for incentive units of MPI), were unvested and therefore forfeited upon Mr. Brykman’stermination of employment.
On March 23, 2015, Mr. Brykman was granted stock options with respect to 74,074 shares of our common stockunder the 2014 Equity Incentive Plan, subject to vesting in substantially equal installments over a four-year period.All such options were unvested as of his termination of employment and, accordingly, he forfeited them inconnection with his termination of employment.
We have adopted, and our shareholders have approved, the 2016 Incentive Award Plan, or the Plan, in order tofacilitate the grant of cash and equity incentives to directors, employees (including our NEOs) and consultants of ourcompany and certain of its affiliates and to enable our company and certain of its affiliates to obtain and retainservices of these individuals, which is essential to our long-term success. For additional information about the Plan,please see the section titled “Equity Incentive Plans” below.
Offering Grants to Employees under the 2016 Incentive Award Plan
In connection with this offering, under the Plan, we intend to grant to certain of our employees and non-employeedirectors awards of stock options at an exercise price equal to the initial public offering price of our common stockwith respect to an aggregate of up to 685,310 shares of common stock immediately following the completion of thisoffering.
On July 28, 2016, our Board approved awards of stock options pursuant to the Plan in connection with this offering,as described above, to our NEOs (in the amounts shown in the table below) to be granted on the effective date ofthis Registration Statement. The terms of the stock options provide for (i) an exercise price equal to the initial publicoffering price of our common stock, (ii) full vesting upon the fourth anniversary of the date of grant, subject to theNEO’s continued employment, and (iii) expiration upon the seventh anniversary of the date of grant.
NAME STOCK OPTIONS (#)
August J. Troendle . . . . . . . . . . . . . . . . . . . . . . . . . . . . . . . . . . . . . . . . . . . . . . . . . . . . . . . . . . . . . 50,000Jesse J. Geiger . . . . . . . . . . . . . . . . . . . . . . . . . . . . . . . . . . . . . . . . . . . . . . . . . . . . . . . . . . . . . . . . 18,510Susan E. Burwig . . . . . . . . . . . . . . . . . . . . . . . . . . . . . . . . . . . . . . . . . . . . . . . . . . . . . . . . . . . . . . . 7,400
Other Elements of Compensation
Retirement PlansWe currently maintain a 401(k) retirement savings plan for our U.S. employees, including our NEOs, who satisfycertain eligibility requirements. Our NEOs are eligible to participate in the 401(k) plan on the same terms as otherfull-time U.S. employees. The U.S. Internal Revenue Code of 1986, as amended, or the Code, allows eligibleemployees to defer a portion of their compensation, within prescribed limits, on a pre-tax basis through contributionsto the 401(k) plan. Currently, we match contributions made by participants in the 401(k) plan up to a specifiedpercentage of the employee contributions, beginning in the calendar year following the first anniversary ofemployment. Matching contributions cliff-vest on the employee’s third anniversary with the Company. We believe
112

that providing a vehicle for tax-deferred retirement savings though our 401(k) plan and making matchingcontributions that vest over a defined period add to the overall desirability of our executive compensation packageand further incentivize our employees, including our NEOs, in accordance with our compensation policies. We do notcurrently maintain any defined benefit pension plans or deferred compensation plans.
Employee Benefits and PerquisitesAll of our full-time U.S. employees, including our NEOs, are eligible to participate in our health and welfare plans,including:
■ medical, dental and vision benefits;■ short-term and long-term disability insurance; and■ life insurance.
We also provided Mr. Brykman with a relocation package in order to facilitate his relocation to the Cincinnati areaupon joining the Company.
We believe the benefits and perquisites described above are necessary and appropriate to provide a competitivecompensation package to our NEOs.
Aircraft UsageThe Company utilizes Reynolds Jet Management, a chartered jet service provider, to arrange for use of a personalaircraft owned by ATSB Aviation, which is owned by Dr. Troendle and Ms. Burwig, to allow executive officers tosafely and efficiently travel for business purposes. Company provided aircraft allow executive officers to be moreproductive than if commercial flights were utilized, as the aircraft provides a conducive business environmentwithout the scheduling constraints imposed by commercial airline services.
Depending on availability, family members of executive officers are permitted to accompany the executive officers onthe aircraft when it is already going to a specific destination for a business purpose. Because the aircraft is charteredbased on flight hours regardless of the passenger load, the aggregate incremental cost to the Company for anyadditional personal use by passengers is de minimis.
In addition, executive officers periodically use Company provided aircraft for multi-leg hybrid flights in which at leastone leg consists of personal use. The aggregate incremental cost to the Company of such personal usage in 2015 isshown in the Summary Compensation Table above. Any personal passenger(s) on board would result in imputedincome to the executive officers using the IRS Standard Industry Fare Level calculation. The Company does notprovide gross-ups with respect to any income taxes incurred by the executive officers in connection with the personaluse of aircraft.
Severance BenefitsWe do not maintain a formal severance policy, and any severance we provide to our NEOs is individually negotiated.In exchange for a release of claims, we provided Mr. Brykman with cash severance and reimbursement of COBRAbenefits in connection with his termination of employment in July 2015 in the amounts shown in the SummaryCompensation Table in the column entitled “All Other Compensation.”
No Tax Gross-UpsWe do not make gross-up payments to cover our NEOs’ personal income taxes that may pertain to any of thecompensation or perquisites paid or provided by our company.
113

Outstanding Equity Awards at Fiscal Year-EndThe following table summarizes the number of shares of common stock underlying outstanding equity incentive planawards for each NEO as of December 31, 2015.(1)
NAMEGRANTDATE
NUMBER OFSECURITIESUNDERLYINGUNEXERCISED
OPTIONS(#)
EXERCISABLE
NUMBER OFSECURITIESUNDERLYINGUNEXERCISED
OPTIONS(#)
UNEXERCISABLE
OPTIONEXERCISEPRICE ($)
OPTIONEXPIRATION
DATE
August J. Troendle . . . . . . . . . . . . . . . . . . . . . . — — — — —Jesse J. Geiger (2) . . . . . . . . . . . . . . . . . . . . . . . 7/7/2014 6,481 41,666 $14.40 7/7/2021Susan E. Burwig (2) . . . . . . . . . . . . . . . . . . . . . . 7/7/2014 9,259 27,777 $14.40 7/7/2021Kurt A. Brykman . . . . . . . . . . . . . . . . . . . . . . . . — — — — —
(1) This table does not reflect any fully vested restricted shares (which had been exchanged for incentive units of MPI) held by the NEOsas of December 31, 2015.
(2) Mr. Geiger and Ms. Burwig were each granted stock options that vest in equal annual installments over a four-year period (i.e., 25%vest on each grant date anniversary). On September 22, 2015, Mr. Geiger elected to exercise 7,407 of the 13,888 options thatvested on July 7, 2015, leaving him with 6,481 vested but not exercised options.
Employment AgreementIn 2015, Dr. August J. Troendle was party to an employment agreement with the Company, effective as of June 17,2011, which provided for a three-year initial term followed by successive one-year terms, but it could have beenterminated by either party at any time upon 30 days’ advance written notice.
Dr. Troendle’s employment agreement provided for Dr. Troendle’s position as our Chief Executive Officer. Under theagreement, Dr. Troendle’s annual base salary was $410,000. The agreement also provided that Dr. Troendle wouldbe eligible to receive an annual cash bonus, provided that he remained employed by us at the time we paid annualbonuses generally, based upon achievement of performance objectives and individual goals established by ourBoard. The agreement also provided for Dr. Troendle’s participation in all employee benefit plans and programsmade available by the Company to our executives and the reimbursement of all reasonable business expensesincurred by Dr. Troendle.
Dr. Troendle’s employment agreement did not provide for any severance benefits upon termination other than thepayment of accrued and unpaid base salary, any reimbursement due for incurred business expenses and any benefitsdue under our 401(k) plan in accordance with the terms of that plan. Upon termination, the treatment of any stock-based awards was governed by the terms of the applicable plan and grant agreement.
The Company and Dr. Troendle entered into an amended and restated employment agreement in connection withthis offering, which agreement has a three-year term beginning July 25, 2016 followed by successive one-yearterms. The material terms of the amended and restated employment agreement are substantially the same as thoseof the existing employment agreement, as described above. The amended and restated employment agreement alsoprovides that the Company will cause Dr. Troendle to be appointed to the Board as of the effective date and willnominate him for re-election during the term.
None of our other executive officers is party to an employment agreement.
Director CompensationNone of our directors received compensation as a director for the fiscal year ended December 31, 2015, except forMr. Brykman, who received $5,000 in fees for service as a director as indicated in the Summary CompensationTable.
In connection with this offering, under the Plan, we intend to grant to certain of our employees and non-employeedirectors awards of stock options at an exercise price equal to the initial public offering price of our common stockwith respect to an aggregate of up to 685,310 shares of common stock immediately following the completion of thisoffering.
114

On July 28, 2016, our Board approved awards of stock options pursuant to the Plan in connection with this offering,as described above, to certain of our non-employee directors (in the amounts shown in the table below) to be grantedon the effective date of this Registration Statement. The terms of the stock options provide for (i) an exercise priceequal to the initial public offering price of our common stock, (ii) 1⁄3 of the stock option to vest on October 31,2016 and the remaining 2⁄3 of the stock option to vest in eight equal installments on the first day of each calendarmonth following October 31, 2016, in each case subject to the non-employee director’s continued service on theBoard, and (iii) expiration upon the seventh anniversary of the date of grant.
NAME STOCK OPTIONS (#)
Robert O. Kraft . . . . . . . . . . . . . . . . . . . . . . . . . . . . . . . . . . . . . . . . . . . . . . . . . . . . . . . . . . . . . . . . 9,630Brian T. Carley . . . . . . . . . . . . . . . . . . . . . . . . . . . . . . . . . . . . . . . . . . . . . . . . . . . . . . . . . . . . . . . . 7,400
We have adopted a compensation policy that, effective upon the closing of this offering, will be applicable to all ofour non-employee directors. Pursuant to this policy, each eligible non-employee director will receive an annual cashretainer of $40,000. Each compensation committee member will receive an additional annual cash retainer of$7,500. Each audit committee member other than the committee chairperson will receive an additional annual cashretainer of $7,500 and the committee chairperson will receive an additional annual cash retainer of $20,000. Eachannual retainer will be paid quarterly in arrears. In the case of the non-employee directors affiliated with Cinven,such retainers will be paid directly to Cinven and not to the directors individually. The Board may, in its discretion,permit a non-employee director to elect to receive any portion of the annual retainer in the form of fully vested andunrestricted shares of common stock in lieu of cash.
Also, pursuant to the director compensation policy, on the date of any annual meeting of our shareholders, we intendto grant each non-employee director other than those affiliated with Cinven an award of an option to purchase thenumbers of shares of common stock (at a per-share exercise price equal to the closing price per share of thecommon stock on the date of such annual meeting (or on the last preceding trading day)) that have a grant date fairvalue of $90,000. The terms of each such award will be set forth in a written award agreement between eachdirector and us, which will generally provide for vesting after one year of continued service as a director. Any directorelected or appointed mid-year will receive a pro-rated portion of the annual award adjusted to reflect his or herperiod of service. Restricted stock units may be granted in lieu of an option for the initial award.
All cash and equity awards granted under the non-employee director compensation policy will be granted under, andsubject to the limits of, the Plan.
Equity Incentive Plans
2014 Equity Incentive PlanWe maintain the 2014 Equity Incentive Plan, as described above. On and after the closing of this offering andfollowing the effectiveness of the Plan (as described below), no further grants will be made under the 2014 EquityIncentive Plan.
2016 Incentive Award PlanWe have adopted, and our shareholders have approved, the Plan, under which we may grant cash and equityincentive awards to eligible service providers in order to attract, motivate and retain the talent for which we compete.The material terms of the Plan are summarized below.
Eligibility and Administration. Our employees, consultants and directors, and employees, consultants and directorsof our subsidiaries are eligible to receive awards under the Plan. The Plan is administered by our Board with respectto awards to non-employee directors and by our compensation committee with respect to other participants, each ofwhich may delegate its duties and responsibilities to committees of our directors and/or officers (referred tocollectively as the plan administrator below), subject to certain limitations that may be imposed underSection 162(m) of the Code, Section 16 of the Exchange Act and/or stock exchange rules, as applicable. The planadministrator has the authority to make all determinations and interpretations under, prescribe all forms for use with,and adopt rules for the administration of, the Plan, subject to its express terms and conditions. The planadministrator also sets the terms and conditions of all awards under the Plan, including any vesting and vestingacceleration conditions.
115

Limitation on Awards and Shares Available. An aggregate of 6,000,000 shares of our common stock (including the685,310 shares of common stock issuable pursuant to the awards of stock options intended to be granted inconnection with this offering at an exercise price equal to the initial public offering price of our common stock) areavailable for issuance under awards granted pursuant to the Plan, which shares may be authorized but unissuedshares, or shares purchased in the open market. If an award under the Plan is forfeited, expires, is converted toshares of another entity in connection with a change in capitalization or is settled for cash, any shares subject tosuch award may, to the extent of such forfeiture, expiration or cash settlement, be used again for new grants underthe Plan. However, the following shares may not be used again for grant under the Plan: (1) shares tendered orwithheld to satisfy grant or exercise price or tax withholding obligations associated with an award; (2) shares subjectto a stock appreciation right, or SAR, that are not issued in connection with the stock settlement of the SAR on itsexercise; and (3) shares purchased on the open market with the cash proceeds from the exercise of options.
Awards granted under the Plan upon the assumption of, or in substitution for, awards authorized or outstandingunder a qualifying equity plan maintained by an entity with which we enter into a merger or similar corporatetransaction will not reduce the shares available for grant under the Plan. The maximum number of shares of ourcommon stock that may be subject to one or more awards granted to any participant pursuant to the Plan during anycalendar year is 1,500,000 and the maximum amount that may be paid under a cash award pursuant to the Plan toany one participant during any calendar year period is $5,000,000; provided that these limitations will not applyuntil Section 162(m) applies to certain awards under the Plan (as described below). Further, the sum of the grantdate fair value of equity-based awards and the amount of any cash compensation granted to a non-employee directorduring any calendar year shall be $400,000.
Awards. The Plan provides for the grant of stock options, including incentive stock options, or ISOs, and nonqualifiedstock options, or NSOs, stock appreciation rights, or SARS, restricted stock, restricted stock units, or RSUs, otherstock or cash based awards and dividend equivalents. Certain awards under the Plan may constitute or provide for adeferral of compensation, subject to Section 409A of the Code, which may impose additional requirements on theterms and conditions of such awards. All awards under the Plan will be set forth in award agreements, which willdetail all terms and conditions of the awards, including any applicable vesting and payment terms and post-termination exercise limitations. Awards other than cash awards generally will be settled in shares of our commonstock, but the plan administrator may provide for cash settlement of any award. A brief description of each awardtype follows.
■ Stock Options. Stock options provide for the purchase of shares of our common stock in the future at anexercise price set on the grant date. ISOs, by contrast to NSOs, may provide tax deferral beyond exerciseand favorable capital gains tax treatment to their holders if certain holding period and other requirements ofthe Code are satisfied. The exercise price of a stock option may not be less than 100% of the fair marketvalue of the underlying share on the date of grant (or 110% in the case of ISOs granted to certainsignificant stockholders), except with respect to certain substitute options granted in connection with acorporate transaction. The term of a stock option may not be longer than ten years (or five years in the caseof ISOs granted to certain significant stockholders). Vesting conditions determined by the plan administratormay apply to stock options and may include continued service, performance and/or other conditions.
■ SARs. SARs entitle their holder, upon exercise, to receive from us an amount equal to the appreciation ofthe shares subject to the award between the grant date and the exercise date. The exercise price of a SARmay not be less than 100% of the fair market value of the underlying share on the date of grant (exceptwith respect to certain substitute SARs granted in connection with a corporate transaction) and the term ofa SAR may not be longer than ten years. Vesting conditions determined by the plan administrator may applyto SARs and may include continued service, performance and/or other conditions.
■ Restricted Stock and RSUs. Restricted stock is an award of nontransferable shares of our common stockthat remain forfeitable unless and until specified conditions are met, and which may be subject to apurchase price. RSUs are contractual promises to deliver shares of our common stock in the future, whichmay also remain forfeitable unless and until specified conditions are met. Delivery of the shares underlyingRSUs may be deferred under the terms of the award or at the election of the participant, if the planadministrator permits such a deferral. Conditions applicable to restricted stock and RSUs may be based oncontinuing service, the attainment of performance goals and/or such other conditions as the planadministrator may determine.
116

■ Other Stock or Cash Based Awards. Other stock or cash awards are cash payments, cash bonus awards,stock payments, stock bonus awards or incentive awards paid in cash, shares of our common stock or acombination of both, and may include deferred stock, deferred stock units, performance awards, retainers,committee fees and meeting based fees.
■ Dividend Equivalents. Dividend equivalents represent the right to receive the equivalent value of dividendspaid on shares of our common stock and may be granted alone or in tandem with awards other than stockoptions or SARs. Dividend equivalents are credited as of dividend record dates during the period betweenthe date an award is granted and the date such award vests, is exercised, is distributed or expires, asdetermined by the plan administrator. Dividend equivalents may not be paid on awards granted under thePlan unless and until such awards have vested.
The plan administrator will determine whether any awards are intended to constitute “qualified performance-basedcompensation,” or QPBC, within the meaning of Section 162(m) of the Code, in which case (unless the award is astock option or SAR) the applicable performance criteria will be selected from the list below in accordance with therequirements of Section 162(m) of the Code.
Section 162(m) of the Code imposes a $1 million cap on the compensation deduction that a public company maytake in respect of compensation paid to our “covered employees” (which should include our Chief Executive Officerand our next three most highly compensated employees other than our Chief Financial Officer), but excludes fromthe calculation of amounts subject to this limitation any amounts that constitute QPBC. Under current tax law, wedo not expect Section 162(m) of the Code to apply to certain awards under the Plan until the earliest to occur of(1) our annual stockholders’ meeting at which members of our Board are to be elected that occurs after the close ofthe third calendar year following the calendar year in which occurred the first registration of our equity securitiesunder Section 12 of the Exchange Act; (2) a material modification of the Plan; (3) an exhaustion of the share supplyunder the Plan; or (4) the expiration of the Plan. However, QPBC performance criteria may be used with respect toawards that are not intended to constitute QPBC. In addition, the Company may issue awards that are not intendedto constitute QPBC even if such awards might be non-deductible as a result of Section 162(m) of the Code.
In order to constitute QPBC under Section 162(m) of the Code, in addition to certain other requirements, therelevant amounts must be payable only upon the attainment of pre-established, objective performance goals set byour compensation committee and linked to stockholder-approved performance criteria. For purposes of the Plan, oneor more of the following performance criteria will be used in setting performance goals applicable to QPBC, and maybe used in setting performance goals applicable to other awards: (i) net earnings or losses (either before or after oneor more of the following: (A) interest, (B) taxes, (C) depreciation, (D) amortization and (E) non-cash equity-basedcompensation expense); (ii) gross or net sales or revenue or sales or revenue growth; (iii) net income (either before orafter taxes); (iv) adjusted net income; (v) operating earnings or profit (either before or after taxes); (vi) cash flow(including, but not limited to, operating cash flow and free cash flow); (vii) return on assets; (viii) return on capital(or invested capital) and cost of capital; (ix) return on stockholders’ equity; (x) total stockholder return; (xi) return onsales; (xii) gross or net profit or operating margin; (xiii) costs, reductions in costs and cost control measures; (xiv)expenses; (xv) working capital; (xvi) earnings or loss per share; (xvii) adjusted earnings or loss per share; (xviii) priceper share or dividends per share (or appreciation in and/or maintenance of such price or dividends); (xix) regulatoryachievements or compliance; (xx) implementation or completion of critical projects; (xxi) market share; (xxii)economic value; (xxiii) productivity; (xxiv) operating efficiency; (xxv) economic value-added; (xxvi) cash flow return oncapital; (xxvii) return on net assets; (xxviii) funds from operations; (xxix) funds available for distributions; (xxx)market penetration and geographic business expansion; (xxxi) customer satisfaction/growth; (xxxii) recruitment andretention of personnel; (xxxiii) human resources management; (xxxiv) supervision of litigation and other legal matters;(xxxv) strategic partnerships and transactions; (xxxvi) financial ratios (including those measuring liquidity, activity,profitability or leverage); (xxxvii) financing and other capital raising transactions; (xxxviii) year-end cash; and (xxxix)acquisition activity and marketing initiatives, any of which may be measured either in absolute terms or as comparedto any incremental increase or decrease or as compared to results of a peer group or to market performanceindicators or indices.The Plan also permits the plan administrator to provide for objectively determinableadjustments to the applicable performance criteria in setting performance goals for QPBC awards.
Certain Transactions. The plan administrator has broad discretion to take action under the Plan, as well as makeadjustments to the terms and conditions of existing and future awards, to prevent the dilution or enlargement of
117

intended benefits and facilitate necessary or desirable changes in the event of certain transactions and eventsaffecting our common stock, such as stock dividends, stock splits, mergers, acquisitions, consolidations and othercorporate transactions. In addition, in the event of certain non-reciprocal transactions with our stockholders knownas “equity restructurings,” the plan administrator will make equitable adjustments to the Plan and outstandingawards. In the event of a change in control of our company (as defined in the Plan), to the extent that the survivingentity declines to continue, convert, assume or replace outstanding awards, then all such awards will become fullyvested and exercisable in connection with the transaction. Upon or in anticipation of a change of control, the planadministrator may cause any outstanding awards to terminate at a specified time in the future and give theparticipant the right to exercise such awards during a period of time determined by the plan administrator in its solediscretion. Individual award agreements may provide for additional accelerated vesting and payment provisions.
Foreign Participants, Claw-Back Provisions, Transferability, and Participant Payments. The plan administrator maymodify award terms, establish subplans and/or adjust other terms and conditions of awards, subject to the sharelimits described above, in order to facilitate grants of awards subject to the laws and/or stock exchange rules ofcountries outside of the United States. All awards will be subject to the provisions of any claw-back policyimplemented by our company to the extent set forth in such claw-back policy and/or in the applicable awardagreement. With limited exceptions for estate planning, domestic relations orders, certain beneficiary designationsand the laws of descent and distribution, awards under the Plan are generally non-transferable prior to vesting, andare exercisable only by the participant. With regard to tax withholding, exercise price and purchase price obligationsarising in connection with awards under the Plan, the plan administrator may, in its discretion, accept cash orcheck, shares of our common stock that meet specified conditions, a “market sell order” or such other considerationas it deems suitable.
Plan Amendment and Termination. Our Board may amend or terminate the Plan at any time; however, except inconnection with certain changes in our capital structure, stockholder approval will be required for any amendmentthat increases the number of shares available under the Plan, “reprices” any stock option or SAR, or cancels anystock option or SAR in exchange for cash or another award when the option or SAR price per share exceeds the fairmarket value of the underlying shares. No award may be granted pursuant to the Plan after the tenth anniversary ofthe date on which our Board adopted the Plan.
Executive Bonus Plan
Executive Bonus Plan. We have adopted, and our stockholders have approved, a Senior Executive Incentive BonusPlan, or the Executive Bonus Plan. The Executive Bonus Plan is designed to provide an incentive for superior work andto motivate covered key executives toward even greater achievement and business results, to tie their goals andinterests to those of us and our stockholders and to enable us to attract and retain highly qualified executives. Theprincipal anticipated features of the Executive Bonus Plan are summarized below.
The Executive Bonus Plan is an incentive bonus plan under which certain key executives, including our NEOs, willbe eligible to receive bonus payments with respect to a specified period (for example, our fiscal year). Bonuses willgenerally be payable under the Executive Bonus Plan upon the attainment of pre-established performance goals.Notwithstanding the foregoing, we may pay bonuses (including, without limitation, discretionary bonuses) toparticipants under the Executive Bonus Plan based upon such other terms and conditions as the compensationcommittee may in its discretion determine.
The performance goals under the Executive Bonus Plan will relate to one or more financial, operational or other metricswith respect to individual or company performance with respect to us or any of our subsidiaries, including, but notlimited to, the following possible performance goals: (i) net earnings or losses (either before or after one or more of thefollowing: (A) interest, (B) taxes, (C) depreciation, (D) amortization and (E) non-cash equity-based compensationexpense); (ii) gross or net sales or revenue or sales or revenue growth; (iii) net income (either before or after taxes); (iv)adjusted net income; (v) operating earnings or profit (either before or after taxes); (vi) cash flow (including, but notlimited to, operating cash flow and free cash flow); (vii) return on assets; (viii) return on capital (or invested capital) andcost of capital; (ix) return on stockholders’ equity; (x) total stockholder return; (xi) return on sales; (xii) gross or net profitor operating margin; (xiii) costs, reductions in costs and cost control measures; (xiv) expenses; (xv) working capital; (xvi)earnings or loss per share; (xvii) adjusted earnings or loss per share; (xviii) price per share or dividends per share (or
118

appreciation in and/or maintenance of such price or dividends); (xix) regulatory achievements or compliance; (xx)implementation or completion of critical projects; (xxi) market share; (xxii) economic value; (xxiii) productivity; (xxiv)operating efficiency; (xxv) economic value-added; (xxvi) cash flow return on capital; (xxvii) return on net assets; (xxviii)funds from operations; (xxix) funds available for distributions; (xxx) market penetration and geographic businessexpansion; (xxxi) customer satisfaction/growth; (xxxii) recruitment and retention of personnel; (xxxiii) human resourcesmanagement; (xxxiv) supervision of litigation and other legal matters; (xxxv) strategic partnerships and transactions;(xxxvi) financial ratios (including those measuring liquidity, activity, profitability or leverage); (xxxvii) financing and othercapital raising transactions; (xxxviii) year-end cash; and (xxxix) acquisition activity and marketing initiatives, any of whichmay be measured either in absolute terms or as compared to any incremental increase or decrease or as compared toresults of a peer group or to market performance indicators or indices.
The Executive Bonus Plan will be administered by the compensation committee. The compensation committee willselect the participants in the Executive Bonus Plan and any performance goals to be utilized with respect to theparticipants, establish the bonus formulas for each participant’s annual bonus, and certify whether any applicableperformance goals have been met with respect to a given performance period. The Executive Bonus Plan providesthat we may amend or terminate the Executive Bonus Plan at any time in our sole discretion. Any amendments tothe Executive Bonus Plan will require stockholder approval only to the extent required by applicable law, rule orregulation. The Executive Bonus Plan will expire on the earlier of:
■ the material modification of the Executive Bonus Plan; and■ the first stockholders meeting at which members of our Board are elected during 2020.
Equity Compensation Plan Information
The number of shares underlying outstanding stock options, the weighted-average exercise price of such outstandingoptions and the number of additional shares remaining available for future issuance under our equity plans, as ofDecember 31, 2015, are as follows:
PLAN
NUMBER OFSECURITIES TO
BE ISSUEDUPON EXERCISE
OF OUTSTANDINGOPTIONS,
WARRANTS ANDRIGHTS(A)
WEIGHTED-AVERAGEEXERCISEPRICE OF
OUTSTANDINGOPTIONS,
WARRANTSAND
RIGHTS(B)
NUMBER OFSECURITIESREMAINING
AVAILABLE FORFUTURE
ISSUANCEUNDER EQUITYCOMPENSATION
PLANS(EXCLUDINGSECURITIES
REFLECTED INCOLUMN(A))(C) (1)
Equity compensation plans approved by security holders2014 Equity Incentive Plan . . . . . . . . . . . . . . . . . . . . . . . . 1,794,709 $15.42 424,902
Equity compensation plans not approved by security holders . . . — — —Total . . . . . . . . . . . . . . . . . . . . . . . . . . . . . . . . . . . . . . . . . . . . . . . 1,794,709 $15.42 424,902
(1) Includes securities that may be issued as stock options, restricted shares and restricted stock units.
119

CERTAIN RELATIONSHIPS AND RELATED PERSON TRANSACTIONS
Set forth below is a description of certain relationships and related person transactions between us or oursubsidiaries, and our directors, executive officers and holders of more than 5% of our voting securities sinceJanuary 1, 2013. We believe that all of the following transactions were entered into with terms as favorable as couldhave been obtained from unaffiliated third parties.
The TransactionIn April 2014, an affiliate of Cinven acquired 100% of the outstanding shares of Medpace IntermediateCo for anaggregate purchase price of $921.3 million. In connection with the acquisition, certain employees of the Company,through MPI, agreed to contribute shares held in Medpace IntermediateCo in exchange for a percentage stake inMedpace Holdings, Inc. Immediately following the Transaction, Cinven and MPI owned approximately 75% and25%, respectively, of Medpace Holdings, Inc. Upon the completion of this offering, Cinven will own approximately58.0% of the outstanding shares of our common stock (or 56.5% if the underwriters exercise their option topurchase additional shares in full).
In addition, in connection with the Transaction and pursuant to the Agreement and Plan of Merger datedFebruary 22, 2014, we agreed to indemnify former directors, officers, employees and certain other affiliates of ourpredecessor company with respect to all acts or omissions by them in their capacities as such.
Advisory FeesAfter the consummation of the Transaction, we entered into the Advisory Services Agreement with an affiliate ofCinven. Under the Advisory Services Agreement, we owe $0.3 million annually to such affiliate of Cinven inexchange for advisory and consulting services. For the Successor six months ended June 30, 2016 and June 30,2015, the Successor year ended December 31, 2015 and the Successor nine month period ended December 31,2014 we incurred Advisory Service Agreement management fees of $0.2 million, $0.2 million, $0.3 million and$0.2 million, and $0.1 million, $0.1 million, $0.1 million and $0.1 million in related travel expenses, respectively.As of June 30, 2016, December 31, 2015 and December 31, 2014, we had outstanding accounts payable toCinven of $0.1 million, $0.1 million and $0.1 million, respectively. We paid $21.7 million in expenses related tothe Transaction on behalf of or to Cinven and CCMP.
We were obligated to pay management fees to a subsidiary of CCMP and incurred $0.1 million and $0.3 million insuch fees for the Predecessor three month period ended March 31, 2014 and the Predecessor year endedDecember 31, 2013, respectively.
The Advisory Services Agreement will terminate in connection with the consummation of this offering.
Consulting FeesIn 2014, we paid $1.7 million in consulting fees to Fairmount Partners LP in connection with the Transaction. Amanaging director of this firm, Cornelius McCarthy, was a member of our Board at the time the fee was incurred.
Voting AgreementWe understand that, substantially concurrently with the closing of this offering, Cinven and Dr. August J. Troendle,our Chief Executive Officer and founder, intend to enter into the Voting Agreement. Pursuant to the terms of theVoting Agreement, for so long as Cinven and Dr. Troendle collectively hold at least 40% of our outstanding votingshares, or the Voting Agreement is otherwise terminated in accordance with its terms, Cinven will agree to vote itsshares of our common stock in favor of the election of Dr. Troendle to our Board (so long as Dr. Troendle remains ourChief Executive Officer) upon his nomination by our Board and Dr. Troendle will agree to vote his shares of ourcommon stock in favor of the election of the directors affiliated with Cinven upon their nomination by our Board;provided, that in the event that Cinven holds less than (a) 40% but greater than or equal to 25% of our voting sharesthen outstanding, Dr. Troendle shall be required to vote for two directors affiliated with Cinven, after giving effect tothe directors then sitting on the Board, (b) 25% but greater than or equal to 10% of our voting shares thenoutstanding, Dr. Troendle shall be required to vote for one director affiliated with Cinven, after giving effect to thedirectors then sitting on the Board and (c) 10% of our voting shares then outstanding, Dr. Troendle shall not berequired to vote for any directors affiliated with Cinven.
120

Registration Rights Agreement
We intend to enter into a Registration Rights Agreement with Cinven and Dr. Troendle in connection with thisoffering. The Registration Rights Agreement will provide Cinven and Dr. Troendle certain registration rights whereby,at any time following our initial public offering and the expiration of any related lock-up period, Cinven andDr. Troendle can require us to register under the Securities Act shares of our common stock held by them. When webecome and for so long as we are eligible to use Form S-3 under the Securities Act, Cinven and Dr. Troendle willhave shelf registration rights requiring us to file a shelf registration statement and to maintain the effectiveness ofsuch registration statement so as to allow sales thereunder from time to time. Cinven and Dr. Troendle are alsoentitled to participate on a pro rata basis in any registration of our common stock under the Securities Act that wemay undertake. The registration rights agreement also provides that we will pay certain expenses relating to suchregistrations and indemnify Cinven and Dr. Troendle and members of management participating in any offeringagainst certain liabilities which may arise under the Securities Act.
Board Compensation
Our directors who are employed by us or our subsidiaries do not receive any compensation and will not receivecompensation following this offering, except as limited to expense reimbursement. Our other directors will receivecompensation for their service as members of our Board. See “Executive and Director Compensation—DirectorCompensation.”
Employment Agreements
We currently have an employment agreement with our Chief Executive Officer and founder, Dr. August J. Troendle.See “Executive and Director Compensation—Employment Agreement.”
Indemnification Agreements
We intend to enter into new indemnification agreements with each of our directors and executive officers. Theseagreements, among other things, will require us to indemnify each director and executive officer to the fullest extentpermitted by Delaware law, including indemnification of expenses such as attorneys’ fees, judgments, fines andsettlement amounts incurred by the director or executive officer in any action or proceeding, including any action orproceeding by or in right of us, arising out of the person’s services as a director or executive officer, as applicable.
Service Agreements
Symplmed Pharmaceuticals, LLC, or SymplmedIn 2013, we entered into a master services agreement, or the Symplmed MSA, with Symplmed, a privatepharmaceutical development company that is majority owned by MPI. The Symplmed MSA provided that we wouldperform Symplmed’s clinical trials. In 2014, we entered into an amended master services agreement, or theAmended Symplmed MSA, with Symplmed. The Amended Symplmed MSA provides for a revised financingarrangement, which allows Symplmed to defer payments owed to us. In return, we can charge a premium for ourservices as consideration for the deferred payment concessions.
At its inception in 2013, Symplmed was majority owned by our Chief Executive Officer, who was elected toSymplmed’s board of directors that year along with our Chief Financial Officer and our General Counsel. In 2014and 2015, our Chief Executive Officer and other executives made equity investments in Symplmed, which are nowheld through MPI.
For the Successor six months ended June 30, 2016 and June 30, 2015, the Successor year ended December 31,2015, the Successor nine month period ended December 31, 2014, the Predecessor three month period endedMarch 31, 2014 and the Predecessor year ended December 31, 2013, we recognized related person transactions of$0.4 million, $0.5 million, $1.2 million, $1.2 million, less than $0.1 million and less than $0.1 million as netservice revenue, respectively. As of June 30, 2016 and December 31, 2015, we had Symplmed related accountsreceivable of $0.4 million and $0.3 million, respectively.
Symplmed leases office space from us at our corporate headquarters in Cincinnati.
121

Coherus BioSciences, Inc., or Coherus, and MX II Associates, LLC, or MXIIIn 2011, MXII, an entity of which our Chief Executive Officer is the managing member, made an equityinvestment in Coherus, a biosimilar therapeutics developer. In early 2012, we made a $2.5 million equityinvestment in Coherus. Concurrent with its initial investment, MXII secured the exclusive rights for us to performPhase I–III clinical trial work for certain of Coherus’ bio-similar drug compounds through a master servicesagreement, or the Coherus MSA. In return, we entered into a commission agreement with MXII, which provided thatwe would pay a 10% sales commission to MXII for cash received from Coherus. The commission agreement betweenus and MXII was terminated in 2015. The Coherus MSA remains in place.
We paid $0.3 million in sales commissions to MXII in 2012 related to a $2.5 million advance payment received fromCoherus. We also paid commissions of $1.1 million, $1.1 million, $0.6 million and $0.3 million for the Successorsix months ended June 30, 2015, the Successor year ended December 31, 2015, the Successor nine month periodended December 31, 2014 and the Predecessor three month period ended March 31, 2014, respectively. For theSuccessor six months ended June 30, 2016 and June 30, 2015, the Successor year ended December 31, 2015, theSuccessor nine month period December 31, 2014, the Predecessor three month period ended March 31, 2014 andthe Predecessor year ended December 31, 2013, we recognized net service revenue from Coherus of $11.4 million,$10.9 million, $22.1 million, $10.6 million, $2.0 million, and $3.3 million, respectively. In addition, we recognizedreimbursed out-of-pocket revenue and reimbursed out-of-pocket expenses of $2.9 million, $4.2 million, $6.9 million,$2.0 million, $0.1 million and $0.1 million for the Successor six months ended June 30, 2016 and June 30, 2015,the Successor year ended December 31, 2015, the Successor nine month period ended December 31, 2014, thePredecessor three month period ended March 31, 2014 and the Predecessor year ended December 31, 2013,respectively. As of June 30, 2016, December 31, 2015 and December 31, 2014, we had recorded accountsreceivable from Coherus of $2.6 million, $2.0 million and $0.7 million, respectively. We also reported advancedbillings of $9.5 million, $8.4 million and $5.3 million and pre-funded study costs of $4.1 million, $3.5 million and$2.6 million from Coherus as of June 30, 2016, December 31, 2015 and 2014, respectively. Coherus was ourlargest customer for Successor six months ended June 30, 2016 and the Successor year ended December 31, 2015,accounting for 6.3% and 6.9% of our net service revenue, respectively.
As of December 31, 2013, we recorded an impairment loss of $2.3 million on our equity investment in Coherus incontemplation of the ultimate liquidation of this investment prior to the Transaction. In March 2014, the investmentwas sold to MPI for $0.3 million.
Dr. Troendle directly and indirectly beneficially owns 5.4% of the outstanding common stock of Coherus accordingto public filings of Coherus. Such shares consist of 29,994 shares held directly by Dr. Troendle, 1,642,492 sharesheld by MXII, an entity for which Dr. Troendle serves as managing member, and 268,428 shares held by MPI, anentity for which Dr. Troendle serves as the manager. Dr. Troendle disclaims beneficial ownership of the shares heldby MXII and MPI, except to the extent of his pecuniary interest therein. Additionally, MXII also holds $4.0 million inaggregate principal amount of Coherus’ 8.2% senior convertible notes due 2022.
Xenon Pharmaceuticals, Inc., or XenonOur Chief Executive Officer has an equity investment in Xenon, a clinical-stage biopharmaceutical company.Dr. Troendle was also a member of Xenon’s board of directors from 2007 to 2008. In June 2006, we entered into amaster services agreement with Xenon. In July 2015, we entered into an amended master services agreement withXenon to provide certain clinical development services to Xenon. For the Successor six months ended June 30, 2016and June 30, 2015, and the Successor year ended December 31, 2015, we recognized net service revenue of$0.4 million, $0.1 million and $0.7 million related to Xenon, respectively. As of June 30, 2016 and December 31,2015, we had $1.9 million and $1.8 million and $0.2 million and $0.2 million of advanced billings and pre-fundedstudy costs, respectively, related to Xenon.
Medpace Investors, LLC
MPI is a noncontrolling shareholder of the Company that is owned by employees of the Company. Our ChiefExecutive Officer is the sole manager and holder of a majority of the units of MPI and our other executive officersand certain other employees are unit holders of MPI. Upon a distribution of our common stock held by MPI, ourChief Executive Officer would receive approximately 73% of such shares. We act as a paying agent for MPI withtaxing authorities principally in instances when employee tax payments or remittance of withholdings related to
122

equity compensation are required. For the Successor six months ended June 30, 2016 and June 30, 2015, theSuccessor year ended December 31, 2015 and the Successor nine month period ended December 31, 2014, wepaid $0.8 million, $0.9 million, $0.9 million and $1.4 million to various taxing authorities on behalf of MPI,respectively. No payments were made by the Company to various taxing authorities on behalf of MPI in thePredecessor three month period ended March 31, 2014 or the Predecessor year ended December 31, 2013.
Leased Real Estate
In October 2010, we entered into an operating lease with 100 Medpace Way, LLC, or 100 MW, which is whollyowned by our Chief Executive Officer. The lease has an initial term of 12 years with a renewal option for one 10-yearterm at prevailing market rates. We pay rent, taxes, insurance and maintenance expenses that arise from use of theproperty. The annual base rent in effect as of December 31, 2015 was $2.1 million. The lease allows foradjustments to the rental rate annually for increases in the consumer price index. For the Successor six monthsended June 30, 2016 and June 30, 2015, the Successor year ended December 31, 2015, the Successor ninemonth period ended December 31, 2014, the Predecessor three month period ended March 31, 2014 and thePredecessor year ended December 31, 2013, lease expense for 100 MW of $1.1 million, $1.1 million, $2.1 million,$1.6 million, $0.5 million and $2.1 million, respectively, were recorded. Additionally, we prepaid $0.2 million inlease payments to 100 MW, which was recorded as a component of prepaid expenses and other current assets as ofDecember 31, 2014.
We entered into two leases of office space, commencing in July 2012 and September 2012, with 200 MedpaceWay, LLC, or 200 MW, and 300 Medpace Way, LLC, or 300 MW, respectively. 200 MW and 300 MW are whollyowned by our Chief Executive Officer and certain of his immediate family members. Each lease has an initial term of15 years with a renewal option for one 10-year term at prevailing market rates. The annual base rent in effect as ofDecember 31, 2015 for the 200 MW lease and the 300 MW lease was $2.6 million and $1.1 million, respectively.The obligation was initially recorded by us at its net present value using the notional rates implicit in the leaseagreements. We revalued the liability by calculating the net present value using our incremental borrowing rate atthe time of the Transaction. For the Successor six months ended June 30, 2016 and June 30, 2015, the Successoryear ended December 31, 2015, the Successor nine month period ended December 31, 2014, the Predecessorthree month period ended March 31, 2014 and the year ended December 31, 2013, we recorded lease payments of$1.9 million, $1.6 million, $3.4 million, $3.1 million, $0.9 million and $2.7 million, respectively.
From time to time in the past we have entered into, and in the future we may enter into, lease arrangements withentities directly or indirectly controlled by our executive officers, including our Chief Executive Officer and founder.
Travel Services
We incur expenses for travel services for company executives provided by a private aviation charter company, orATSB Aviation, which is owned by our Chief Executive Officer and our Senior Vice President of Operations. We maycontract directly with ATSB Aviation for the use of its aircraft or indirectly through a third party aircraft managementand jet charter company, or Reynolds Jet Management. The travel services provided are primarily for businesspurposes, with any personal travel paid for as part of the executives’ compensation arrangements. Reynolds JetManagement also makes the ATSB Aviation aircraft available to other third parties. Medpace incurred travelexpenses of $0.5 million, $0.5 million, $0.9 million, $0.5 million and $0.1 million for the Successor six monthsended June 30, 2016 and June 30, 2015, the Successor year ended December 31, 2015, the Successor ninemonth period ended December 31, 2014 and the Predecessor three month period ended March 31, 2014,respectively, related to these travel services. For more information, see “Executive and Director Compensation—Narrative to Summary Compensation Table—Aircraft Usage.”
Common Stock Purchases
In 2013, our Chief Executive Officer entered into a stock purchase agreement with the Company that permitted himto purchase 120,000 shares of our common stock at the then-current market value for those shares. In exchange,our Chief Executive Officer agreed to forfeit his ownership of 80,000 unvested stock options that were originallyscheduled to vest at various dates through 2016. Proceeds of $1.2 million from this stock purchase were reflectedas stock issued and proceeds from sale of common stock for the Predecessor year ended December 31, 2013.
123

Assets and Obligations Related to Former Owners
As part of the stock purchase agreement dated June 17, 2011, or the Predecessor Purchase Agreement, for thepurchase of Medpace, Inc. by CCMP, the sellers (a group led by our current Chief Executive Officer, referred to asthe “Former Owners”) and the buyers (led by CCMP) agreed to certain tax indemnifications regarding contingenciesthat could arise after the June 17, 2011 acquisition, and tax payments or refunds that were finalized after June 17,2011, but which related to periods prior to that date. In February 2015, a settlement was reached with a localtaxing authority regarding the refund of income tax payments made by the Company prior to June 17, 2011. As ofJune 30, 2016, December 31, 2015 and December 31, 2014, Medpace had $0.2 million, $0.4 million and $0.6million in prepaid expenses and other current assets and other assets related to the tax refund due from the localtaxing authority, and $0.2 million, $0.4 million and $0.6 million in other current liabilities and other long-termliabilities, representing an obligation to the Former Owners. We had $0.0 million, $0.1 million and $0.1 million inprepaid expenses and other current assets, and $0.0 million, $0.1 million and $0.3 million in other currentliabilities as of June 30, 2016, December 31, 2015 and December 31, 2014, respectively, associated with refundsfrom various other taxing authorities that were generated prior to June 17, 2011.
Other
Our Chief Executive Officer and founder, Dr. August J. Troendle and our Senior Vice President of Operations, SusanE. Burwig, each of whom is an executive officer, cohabitate. For information regarding each of their compensationarrangements, see “Executive and Director Compensation.”
We provided our former Chief Operating Officer, Kurt A. Brykman, with a cash severance and reimbursement ofCOBRA benefits of approximately $0.3 million in connection with his termination of employment in July 2015. Foradditional information, see “Executive and Director Compensation.”
Our Chief Executive Officer and founder, Dr. August J. Troendle, has indicated an interest to purchase up to $20.0million in shares of our common stock in this offering at the initial public offering price. Assuming an initial publicoffering price of $21.50 per share, which is the midpoint of the price range set forth on the cover page of thisprospectus, Dr. Troendle would purchase an aggregate of up to approximately 930,233 of the 7,000,000 shares inthis offering based on this indication of interest. However, because indications of interest are not bindingagreements or commitments to purchase, Dr. Troendle may determine to increase or reduce the amount of hisindication of interest, or otherwise elect not to purchase any shares. It is also possible that the number of shares, ifany, allocated to Dr. Troendle in the offering may be smaller than the amount of his indication of interest.
Policies for Approval of Related Person Transactions
In connection with this offering, we will adopt a written policy relating to the approval of related person transactions.Our audit committee will review and approve or ratify all relationships and related person transactions between usand (i) our directors, executive officers or their immediate family members, (ii) any 5% record or beneficial owner ofour common stock, or (iii) any immediate family member of any person specified in (i) and (ii) above. The auditcommittee will review all such related person transactions and, where the audit committee determines that suchtransactions are in our best interests, approve such transactions in advance of such related person transaction beinggiven effect. As set forth in the related person transaction policy, in the course of its review and approval orratification of a related person transaction, the audit committee will, in its judgment, consider in light of the relevantfacts and circumstances whether the related person transaction is, or is not inconsistent with, our best interests,whether the transaction is on terms comparable to those that could be obtained in an arm’s length transaction withan unrelated person, the extent of the related person’s interest in the transaction and various factors enumerated inthe policy.
Any member of the audit committee who is a related person with respect to a related person transaction under reviewor is otherwise not disinterested will not be permitted to participate in the discussions or approval or ratification ofthe related person transaction. Our policy also includes certain exemptions for related person transactions that neednot be reported and provides the audit committee with the discretion to pre-approve certain related persontransactions.
124

PRINCIPAL SHAREHOLDERS
The following table sets forth the beneficial ownership of our common stock as of July 29, 2016 and immediatelyafter the completion of this offering by (1) each person, or group of affiliated persons, known by us to be thebeneficial owner of 5% or more of our outstanding common stock, (2) each of our directors, (3) each of our executiveofficers and (4) all of our directors and executive officers as a group.
To our knowledge, each person named in the table has sole voting and investment power with respect to all of thesecurities shown as beneficially owned by such person, except as otherwise set forth in the notes to the table. Thenumber of securities shown represents the number of securities the person “beneficially owns,” as determined bythe rules of the SEC. The SEC has defined “beneficial” ownership of a security to mean the possession, directly orindirectly, of voting power and/or investment power. A security holder is also deemed to be, as of any date, thebeneficial owner of all securities that such security holder has the right to acquire within 60 days after that datethrough (1) the exercise of any option, warrant or right, (2) the conversion of a security, (3) the power to revoke atrust, discretionary account or similar arrangement, or (4) the automatic termination of a trust, discretionary accountor similar arrangement.
The percentages reflect beneficial ownership immediately prior to and immediately after the completion of thisoffering as determined in accordance with Rule 13d-3 under the Exchange Act and are based on 32,650,854 sharesof our common stock outstanding as of July 29, 2016 and assumes there are 39,650,854 shares of our commonstock outstanding as of the date immediately following the completion of this offering, assuming no exercise by theunderwriters of their option to purchase additional shares of our common stock, and there are 40,700,854 shares ofour common stock outstanding as of the date immediately following the completion of this offering, assuming fullexercise by the underwriters of their option to purchase additional shares of our common stock. Except as notedbelow, the address for all beneficial owners in the table below is c/o Medpace Holdings, Inc. at 5375 Medpace Way,Cincinnati, Ohio 45227.
Our Chief Executive Officer and founder, Dr. August J. Troendle, has indicated an interest in purchasing shares ofour common stock in this offering at the initial public offering price. The following table does not reflect any suchpotential purchases. If any shares are purchased by Dr. Troendle, the number of shares of common stock beneficiallyowned after this offering and the percentage of common stock beneficially owned after this offering may differ fromthat set forth in the table below.
SHARES BENEFICIALLYOWNED PRIOR TO OFFERING
SHARES BENEFICIALLY OWNEDAFTER OFFERING (ASSUMINGNO EXERCISE OF THE OPTIONTO PURCHASE ADDITIONAL
SHARES)
SHARES BENEFICIALLY OWNEDAFTER OFFERING (ASSUMING
FULL EXERCISE OF THEOPTION TO PURCHASEADDITIONAL SHARES)
NAME OF BENEFICIAL OWNER NUMBER PERCENTAGE NUMBER PERCENTAGE NUMBER PERCENTAGE
5% ShareholdersInvestment funds affiliated with
Cinven CapitalManagement (1) . . . . . . . . . . . . 22,999,997 70.4% 22,999,997 58.0% 22,999,997 56.5%
Medpace Investors, LLC (2) . . . . . . 9,210,118 28.2% 9,210,118 23.2% 9,210,118 22.6%
Named Executive OfficersDr. August J. Troendle (3) . . . . . . . . 9,561,969 29.3% 9,561,969 24.1% 9,561,969 23.5%Jesse J. Geiger (4) . . . . . . . . . . . . . 20,370 * 20,370 * 20,370 *Susan E. Burwig (5) . . . . . . . . . . . . 18,518 * 18,518 * 18,518 *
Non-Employee DirectorsDr. Supraj R. Rajagopalan . . . . . . . — — — — — —Alexander F.S. Leslie . . . . . . . . . . . — — — — — —Matthew R. Norton . . . . . . . . . . . . — — — — — —Robert O. Kraft . . . . . . . . . . . . . . . — — — — — —Brian T. Carley . . . . . . . . . . . . . . . — — — — — —
All executive officers and directorsas a group (10 persons) (6) . . . . 9,617,520 29.5% 9,617,520 24.3% 9,617,520 23.6%
125

* Represents beneficial ownership of less than 1% of our outstanding common stock.(1) Includes 3,641,240 shares held by Fifth Cinven Fund (No. 1) Limited Partnership (“LP1”), 3,229,699 shares held by Fifth Cinven
Fund (No. 2) Limited Partnership (“LP2”), 3,889,854 shares held by Fifth Cinven Fund (No. 3) Limited Partnership (“LP3”),3,379,103 shares held by Fifth Cinven Fund (No. 4) Limited Partnership (“LP4”), 1,403,731 shares held by Fifth Cinven Fund (No.5) Limited Partnership (“LP5”), 3,284,802 shares held by Fifth Cinven Fund (No. 6) Limited Partnership (“LP6” and, together withLP1, LP2, LP3, LP4 and LP5, the “Limited Partnerships”), 3,758,169 shares held by Fifth Cinven Fund FCP-SIF (“FCP”) and413,399 shares held by Fifth Cinven Fund Co-Investment Partnership (“CIP”). Each of the Limited Partnerships is managed andcontrolled by Cinven Capital Management (V) Limited Partnership Incorporated (“GPLP”), their Managing General Partner. CinvenCapital Management (V) General Partner Limited (“Cinven MGP” and together with GPLP, CIP, FCP and the Limited Partnerships, the“Cinven Entities) is the Managing General Partner of GPLP. FCP is managed and controlled by Cinven Manco S.A.R.L. (“Manco”).Cinven MGP also exercises investment discretion and control over the shares held by each of FCP and CIP, which are subject tocontractual commitments that each invest and divest side-by-side with the Limited Partnerships. Voting and investmentdeterminations with respect to the shares held by the Cinven Entities are made by the majority vote of the board of directors of CinvenMGP, comprised of Brian Linden, Hayley Tanguy, John Boothman, Robin Hall, Rupert Dorey and William Scott. Each such directordisclaims beneficial ownership of such shares.
The principal business address for each of Cinven MGP, GPLP and the Limited Partnerships is East Wing, Trafalgar Court, LesBanques, St. Peter Port, Guernsey, GY1 3PP. The principal business address of CIP is Warwick Court, Paternoster Square, London,EC4M 7AG. The principal business address of each of Manco and FCP is 7, rue Lou Hemmer, L-1748, Luxembourg.
(2) Dr. August J. Troendle, as the sole manager of MPI, has sole voting and investment power with respect to these shares.(3) Consists of 351,851 shares of common stock directly held by the August J. Troendle Revocable Trust and 9,210,118 shares of
common stock directly held by MPI. Dr. Troendle is the sole trustee, sole beneficiary and settlor of the August J. Troendle RevocableTrust and has sole voting and investment power over the shares held by such trust. Dr. Troendle, as the sole manager of MPI, has solevoting and dispositive power with respect to the shares held by MPI.
(4) Includes 20,370 shares of common stock which may be acquired upon the exercise of stock options which have vested or will vestwithin 60 days of the filing of this prospectus.
(5) Includes 18,518 shares of common stock which may be acquired upon the exercise of stock options which have vested or will vestwithin 60 days of the filing of this prospectus.
(6) Includes 55,551 shares of common stock which may be acquired upon the exercise of stock options which have vested or will vestwithin 60 days of the filing of this prospectus.
126

DESCRIPTION OF CAPITAL STOCK
General
The following is a description of the material terms of, and is qualified in its entirety by, our amended and restatedcertificate of incorporation and amended and restated bylaws, each of which will be in effect prior to theconsummation of this offering, copies of which are filed as exhibits to the registration statement of which thisprospectus is a part.
Authorized Capital
As of the consummation of this offering, our authorized capital stock will consist of:
■ 250,000,000 shares of common stock, par value $0.01 per share, of which 39,642,113 shares will beissued and outstanding, and;
■ 5,000,000 shares of preferred stock, par value $0.01 per share, of which no shares are issued andoutstanding.
Unless our Board determines otherwise, we will issue all shares of our capital stock in uncertificated form.
Common Stock
Voting RightsHolders of our common stock are entitled to one vote for each share held of record on all matters to whichshareholders are entitled to vote generally, including the election or removal of directors. The holders of our commonstock do not have cumulative voting rights in the election of directors. Accordingly, a holder or group of holders of amajority of the shares of our common stock are able to elect all of the directors.
Dividends
Subject to preferences that may be applicable to any then outstanding preferred stock, holders of our common stockare entitled to receive dividends, if any, as may be declared from time to time by our Board out of legally availablefunds.
LiquidationUpon our liquidation, dissolution or winding up and after payment in full of all amounts required to be paid tocreditors and to the holders of preferred stock having liquidation preferences, if any, the holders of our commonstock will be entitled to receive pro rata our remaining assets available for distribution.
Rights and PreferencesHolders of our common stock do not have preemptive, subscription, redemption or conversion rights. The commonstock will not be subject to further calls or assessment by us. There will be no redemption or sinking fund provisionsapplicable to the common stock. All shares of our common stock that will be outstanding at the time of theconsummation of the offering will be fully paid and non-assessable. The rights, powers, preferences and privileges ofholders of our common stock will be subject to and may be adversely affected by the rights of the holders of anyshares of our preferred stock we may authorize and issue in the future.
Preferred Stock
Our amended and restated certificate of incorporation provides that our Board has the authority, without action bythe shareholders, to designate and issue up to 5,000,000 shares of preferred stock in one or more classes or seriesand to fix the powers, rights, preferences, and privileges of each class or series of preferred stock, including dividendrights, conversion rights, voting rights, terms of redemption, liquidation preferences and the number of sharesconstituting any class or series, which may be greater than the rights of the holders of the common stock. There willbe no shares of preferred stock outstanding immediately after this offering.
The purpose of authorizing our Board to issue preferred stock and determine its rights and preferences is toeliminate delays associated with a shareholder vote on specific issuances. The issuance of preferred stock, while
127

providing flexibility in connection with possible acquisitions, future financings and other corporate purposes, couldhave the effect of making it more difficult for a third party to acquire, or could discourage a third party from seekingto acquire, a majority of our outstanding voting stock. Additionally, the issuance of preferred stock may adverselyaffect the holders of our common stock by restricting dividends on our common stock, diluting the voting power ofour common stock or subordinating the liquidation rights of our common stock. As a result of these or other factors,the issuance of preferred stock could have an adverse impact on the market price of our common stock.
Exclusive Venue
Our amended and restated certificate of incorporation, as it will be in effect upon the closing of this offering, willrequire, to the fullest extent permitted by law, that (i) any derivative action or proceeding brought on our behalf,(ii) any action asserting a claim of breach of a fiduciary duty owed by any of our directors, officers or otheremployees to us or our shareholders, (iii) any action asserting a claim against us arising pursuant to any provision ofthe DGCL or our amended and restated certificate of incorporation or our amended and restated bylaws or (iv) anyaction asserting a claim against us governed by the internal affairs doctrine will have to be brought only in the Courtof Chancery in the State of Delaware. Although we believe this provision benefits us by providing increasedconsistency in the application of Delaware law in the types of lawsuits to which it applies, the provision may have theeffect of discouraging lawsuits against our directors and officers. Any person or entity purchasing or otherwiseacquiring any interest in shares of our capital stock shall be deemed to have notice of and consented to the forumprovisions in our amended and restated certificate of incorporation. However, the enforceability of similar forumprovisions in other companies’ certificates of incorporation has been challenged in legal proceedings, and it ispossible that a court could find these types of provisions to be unenforceable.
Anti-Takeover Effects of Our Amended and Restated Certificate of Incorporation and Amended and Restated Bylawsand Certain Provisions of Delaware Law
Our amended and restated certificate of incorporation, amended and restated bylaws and the DGCL, which aresummarized in the following paragraphs, contain provisions that are intended to enhance the likelihood of continuityand stability in the composition of our Board. These provisions are intended to avoid costly takeover battles, reduceour vulnerability to a hostile change of control and enhance the ability of our Board to maximize shareholder value inconnection with any unsolicited offer to acquire us. However, these provisions may have an anti-takeover effect andmay delay, deter or prevent a merger or acquisition of our company by means of a tender offer, a proxy contest orother takeover attempt that a shareholder might consider in its best interest, including those attempts that mightresult in a premium over the prevailing market price for the shares of common stock held by shareholders.
Authorized but Unissued Capital Stock
The authorized but unissued shares of common stock and preferred stock are available for future issuance withoutshareholder approval, subject to any limitations imposed by the listing standards of NASDAQ. These additionalshares may be used for a variety of corporate finance transactions, acquisitions and employee benefit plans. Theexistence of authorized but unissued and unreserved common stock and preferred stock could make more difficult ordiscourage an attempt to obtain control of us by means of a proxy contest, tender offer, merger or otherwise.
Classified BoardOur amended and restated certificate of incorporation provides that our Board will be divided into three classes ofdirectors, with the classes to be as nearly equal in number as possible, and with the directors serving three-yearterms. As a result, approximately one-third of our Board is elected each year. In addition, our amended and restatedcertificate of incorporation will provide that directors may only be removed from our Board for cause by theaffirmative vote of at least a majority of our common stock. See “Management—Board of Directors.” Theclassification of directors will have the effect of making it more difficult for shareholders to change the compositionof our Board. Our amended and restated certificate of incorporation and amended and restated bylaws provide that,subject to any rights of holders of preferred stock to elect additional directors under specified circumstances, thenumber of directors are fixed from time to time exclusively pursuant to a resolution adopted by the Board.
128

Business Combinations
We are subject to Section 203 of the DGCL. Subject to certain exceptions, Section 203 prevents a publicly heldDelaware corporation from engaging in a “business combination” with any “interested stockholder” for three yearsfollowing the date that the person became an interested stockholder, unless the interested stockholder attained suchstatus with the approval of our board of directors or unless the business combination is approved in a prescribedmanner. A “business combination” includes, among other things, a merger or consolidation involving us and the“interested stockholder” and the sale of more than 10% of our assets. In general, an “interested stockholder” is anyentity or person beneficially owning 15% or more of our outstanding voting stock and any entity or person affiliatedwith or controlling or controlled by such entity or person.
No Cumulative Voting
Under Delaware law, the right to vote cumulatively does not exist unless the certificate of incorporation specificallyauthorizes cumulative voting. Our amended and restated certificate of incorporation does not authorize cumulativevoting. Accordingly, a holder or group of holders of a majority of the shares of our common stock are able to elect allof the directors.
Requirements for Advance Notification of Shareholder Meetings, Director Nominations and Shareholder Proposals
Our amended and restated certificate of incorporation will provide that shareholders at an annual meeting may onlyconsider proposals or nominations specified in the notice of meeting or brought before the meeting by or at thedirection of our Board or by a qualified shareholder of record on the record date for the meeting, who is entitled tovote at the meeting and who has delivered timely written notice in proper form to our secretary of the shareholder’sintention to bring such business before the meeting. Our amended and restated certificate of incorporation willprovide that, subject to applicable law, special meetings of the shareholders may be called only by a resolutionadopted by the affirmative vote of the majority of the directors then in office. Our bylaws will prohibit the conduct ofany business at a special meeting other than as specified in the notice for such meeting. In addition, anyshareholder who wishes to bring business before an annual meeting or nominate directors must comply with theadvance notice and duration of ownership requirements set forth in our bylaws and provide us with certaininformation. These provisions may have the effect of deferring, delaying or discouraging hostile takeovers or changesin control of us or our management.
Our amended and restated bylaws establish advance notice procedures with respect to shareholder proposals and thenomination of candidates for election as directors, other than nominations made by or at the direction of the Boardor a committee of the Board. In order for any matter to be “properly brought” before a meeting, a shareholder willhave to comply with advance notice requirements and provide us with certain information. Our amended andrestated bylaws allow the chairman of the meeting at a meeting of the shareholders to adopt rules and regulations forthe conduct of meetings which may have the effect of precluding the conduct of certain business at a meeting if therules and regulations are not followed. These provisions may also defer, delay or discourage a potential acquirer fromconducting a solicitation of proxies to elect the acquirer’s own slate of directors or otherwise attempting to influenceor obtain control of our company.
Shareholder Action by Written Consent
Pursuant to Section 228 of the DGCL, any action required to be taken at any annual or special meeting of theshareholders may be taken without a meeting, without prior notice and without a vote if a consent or consents inwriting, setting forth the action so taken, is signed by the holders of outstanding stock having not less than theminimum number of votes that would be necessary to authorize or take such action at a meeting at which all sharesof our stock entitled to vote thereon were present and voted, unless our amended and restated certificate ofincorporation provides otherwise. Our amended and restated certificate of incorporation will provide that shareholderaction by written consent will be permitted only if the action to be effected by such written consent and the taking ofsuch action by such written consent have been previously approved by the board of directors.
Amendment of Amended and Restated Certificate of Incorporation or Amended and Restated Bylaws
The DGCL provides generally that the affirmative vote of a majority of the shares entitled to vote on any matter isrequired to amend a corporation’s certificate of incorporation or bylaws, unless a corporation’s certificate ofincorporation or bylaws, as the case may be, requires a greater percentage. Upon consummation of this offering, our
129

amended and restated bylaws may be amended or repealed by a majority vote of our Board or by the affirmative voteof the holders of at least 66-2/3% of the votes which all our shareholders would be entitled to cast in any annualelection of directors. In addition, the affirmative vote of the holders of at least 66-2/3% of the votes which all ourshareholders would be entitled to cast in any election of directors will be required to amend or repeal or to adopt anyprovisions inconsistent with any of the provisions of our certificate described above.
The foregoing provisions of our amended and restated certificate of incorporation and amended and restated bylawscould discourage potential acquisition proposals and could delay or prevent a change in control. These provisions areintended to enhance the likelihood of continuity and stability in the composition of our Board and in the policiesformulated by our Board and to discourage certain types of transactions that may involve an actual or threatenedchange of control. These provisions are designed to reduce our vulnerability to an unsolicited acquisition proposal.The provisions also are intended to discourage certain tactics that may be used in proxy fights. However, suchprovisions could have the effect of discouraging others from making tender offers for shares of our common stockand, as a consequence, they also may inhibit fluctuations in the market price of our common stock that could resultfrom actual or rumored takeover attempts. Such provisions also may have the effect of preventing changes in ourmanagement or delaying or preventing a transaction that might benefit you or other minority shareholders.
Dissenters’ Rights of Appraisal and Payment
Under the DGCL, with certain exceptions, our shareholders have appraisal rights in connection with a merger orconsolidation of us. Pursuant to the DGCL, shareholders who properly request and perfect appraisal rights inconnection with such merger or consolidation will have the right to receive payment of the fair value of their sharesas determined by the Delaware Court of Chancery.
Shareholders’ Derivative Actions
Under the DGCL, any of our shareholders may bring an action in our name to procure a judgment in our favor, alsoknown as a derivative action, provided that the shareholder bringing the action is a holder of shares of our commonstock at the time of the transaction to which the action relates or such shareholder’s stock thereafter devolved byoperation of law and such suit is brought in the Court of Chancery in the State of Delaware. See “—Exclusive Venue”above.
Conflicts of Interest
Delaware law permits corporations to adopt provisions renouncing any interest or expectancy in certain opportunitiesthat are presented to the corporation or its officers, directors or shareholders. Our amended and restated certificateof incorporation, to the maximum extent permitted from time to time by Delaware law, renounces any interest orexpectancy that we have in, or right to be offered an opportunity to participate in, specified business opportunitiesthat are from time to time presented to our officers, directors or shareholders or their respective affiliates, other thanthose officers, directors, shareholders or affiliates who are our or our subsidiaries’ employees. Our amended andrestated certificate of incorporation provides that, to the fullest extent permitted by law, each of Cinven or any of itsaffiliates or any director who is not employed by us (including any non-employee director who serves as one of ourofficers in both his director and officer capacities) or his or her affiliates has no duty to refrain from (i) engaging in acorporate opportunity in the same or similar lines of business in which we or our affiliates now engage or propose toengage or (ii) otherwise competing with us or our affiliates. In addition, to the fullest extent permitted by law, in theevent that Cinven or any non-employee director acquires knowledge of a potential transaction or other businessopportunity which may be a corporate opportunity for itself or himself or its or his affiliates or for us or our affiliates,such person will have no duty to communicate or offer such transaction or business opportunity to us or any of ouraffiliates and they may take any such opportunity for themselves or offer it to another person or entity. Our amendedand restated certificate of incorporation does not renounce our interest in any business opportunity that is expresslyoffered to a non-employee director solely in his or her capacity as a director or officer of the Company. To the fullestextent permitted by law, no business opportunity will be deemed to be a potential corporate opportunity for us unlesswe would be permitted to undertake the opportunity under our amended and restated certificate of incorporation, wehave sufficient financial resources to undertake the opportunity and the opportunity would be in line with ourbusiness.
130

Limitations on Liability and Indemnification of Officers and Directors
Our amended and restated certificate of incorporation and amended and restated bylaws will provide indemnificationfor our directors and officers to the fullest extent permitted by the DGCL. Prior to the completion of this offering, weintend to enter into indemnification agreements with each of our directors that may, in some cases, be broader thanthe specific indemnification provisions contained under Delaware law. In addition, as permitted by Delaware law, ouramended and restated certificate of incorporation includes provisions that eliminate the personal liability of ourdirectors for monetary damages resulting from breaches of certain fiduciary duties as a director. The effect of thisprovision is to restrict our rights and the rights of our shareholders in derivative suits to recover monetary damagesagainst a director for breach of fiduciary duties as a director, except that a director will be personally liable for:
■ any breach of his duty of loyalty to us or our shareholders;■ acts or omissions not in good faith or which involve intentional misconduct or a knowing violation of law;■ any transaction from which the director derived an improper personal benefit; or■ improper distributions to shareholders.
These provisions may be held not to be enforceable for violations of the federal securities laws of the United States.
Voting Agreement
We understand that, substantially concurrently with the closing of this offering, Cinven and Dr. August J. Troendle,our Chief Executive Officer and founder, intend to enter into the Voting Agreement. Pursuant to the terms of theVoting Agreement, for so long as Cinven and Dr. Troendle collectively hold at least 40% of our outstanding votingshares, or the Voting Agreement is otherwise terminated in accordance with its terms, Cinven will agree to vote itsshares of our common stock in favor of the election of Dr. Troendle to our Board (so long as Dr. Troendle remains ourChief Executive Officer) upon his nomination by our Board and Dr. Troendle will agree to vote his shares of ourcommon stock in favor of the election of the directors affiliated with Cinven upon their nomination by our Board;provided, that in the event that Cinven holds less than (a) 40% but greater than or equal to 25% of our voting sharesthen outstanding, Dr. Troendle shall be required to vote for two directors affiliated with Cinven, after giving effect tothe directors then sitting on the Board, (b) 25% but greater than or equal to 10% of our voting shares thenoutstanding, Dr. Troendle shall be required to vote for one director affiliated with Cinven, after giving effect to thedirectors then sitting on the Board and (c) 10% of our voting shares then outstanding, Dr. Troendle shall not berequired to vote for any directors affiliated with Cinven. See “Certain Relationships and Related PersonTransactions—Voting Agreement.”
Registration Rights Agreement
In connection with this offering, we will enter into the Registration Rights Agreement with Cinven and Dr. August J.Troendle, our Chief Executive Officer and founder, pursuant to which such holders will have specified rights torequire us to register all or any portion of their shares under the Securities Act. See “Certain Relationships andRelated Person Transactions—Registration Rights Agreement.”
Transfer Agent and Registrar
The transfer agent and registrar for our common stock will be American Stock Transfer & Trust Company, LLC.
Listing
We have applied to list our common stock on NASDAQ under the symbol “MEDP.”
131

SHARES ELIGIBLE FOR FUTURE SALE
Immediately prior to this offering, there was no public market for our common stock. Future sales of substantialamounts of common stock in the public market, or the perception that such sales may occur, could adversely affectthe market price of our common stock. Although we have applied to have our common stock listed on NASDAQ, wecannot assure you that there will be an active public market for our common stock.
Upon the closing of this offering, we will have outstanding an aggregate of 39,642,113 shares of common stock,assuming the issuance of 7,000,000 shares of common stock offered by us in this offering. Of these shares, allshares sold in this offering will be freely tradable without restriction or further registration under the Securities Act,except for any shares purchased by our “affiliates,” as that term is defined in Rule 144 under the Securities Act,whose sales would be subject to the Rule 144 resale restrictions described below, other than the holding periodrequirement.
The remaining 32,642,113 shares of common stock will be “restricted securities,” as that term is defined in Rule144 under the Securities Act. These restricted securities are eligible for public sale only if they are registered underthe Securities Act or if they qualify for an exemption from registration under Rules 144 or 701 under the SecuritiesAct, which are summarized below.
In addition, of the 1,779,637 shares of our common stock that will be subject to stock options outstandingimmediately after this offering, options to purchase 596,134 shares of common stock will be vested immediatelyafter this offering and, upon exercise, these shares will be eligible for sale subject to the lock–up agreementsdescribed below and the holding requirements of Rules 144 and 701 under the Securities Act.
In addition, under the Plan, we intend to grant to certain of our employees and non-employee directors in connectionwith this offering awards of stock options at an exercise price equal to the initial public offering price of our commonstock with respect to an aggregate of up to 685,310 shares of common stock immediately following the completionof the offering. We have not yet determined the allocation of such awards of stock options among the individuals,except for the executive officers and certain non-employee directors. The shares issuable with respect to theseawards not held by our affiliates will be freely tradable without restriction under the Securities Act, however, theywill be subject to the 180-day lock-up arrangements described under “—Lock-Up Agreements.” See “Executive andDirector Compensation—Narrative to Summary Compensation Table—Offering Grants to Employees under the 2016Incentive Award Plan” and “Executive and Director Compensation—Director Compensation.”
Lock-Up Agreements
We, our officers, directors and holders of substantially all of our outstanding capital stock have agreed, subject tospecified exceptions, not to directly or indirectly:
■ sell, offer, contract or grant any option to sell (including any short sale), pledge, transfer, establish an open“put equivalent position” within the meaning of Rule 16a-l(h) under the Exchange Act;
■ otherwise dispose of any shares of common stock, options or warrants to acquire shares of common stock, orsecurities exchangeable or exercisable for or convertible into shares of common stock currently or hereafterowned either of record or beneficially; or
■ publicly announce an intention to do any of the foregoing for a period of 180 days after the date of thisprospectus without the prior written consent of Jefferies LLC.
This restriction terminates after the close of trading of the common stock on and including the 180th day after thedate of this prospectus.
Jefferies LLC may, in its sole discretion and at any time or from time to time before the termination of the 180-dayperiod release all or any portion of the securities subject to lock-up agreements. There are no existing agreementsbetween the underwriters and any of our shareholders who will execute a lock-up agreement, providing consent tothe sale of shares prior to the expiration of the lock-up period.
Upon the expiration of the applicable lock-up periods, substantially all of the shares subject to such lock-uprestrictions will become eligible for sale, subject to the limitations discussed above.
132

Rule 144Affiliate Resales of Restricted SecuritiesIn general, beginning 90 days after the effective date of the registration statement of which this prospectus is a part,a person who is an affiliate of ours, or who was an affiliate at any time during the 90 days before a sale, who hasbeneficially owned shares of our common stock for at least six months would be entitled to sell in “broker’stransactions” or certain “riskless principal transactions” or to market makers, a number of shares within any three-month period that does not exceed the greater of:
■ 1% of the number of shares of our common stock then outstanding, which will equal approximately396,421 shares immediately after this offering; or
■ the average weekly trading volume in our common stock on NASDAQ during the four calendar weekspreceding the filing of a notice on Form 144 with respect to such sale.
Affiliate resales under Rule 144 are also subject to the availability of current public information about us. Inaddition, if the number of shares being sold under Rule 144 by an affiliate during any three-month period exceeds5,000 shares or has an aggregate sale price in excess of $50,000, the seller must file a notice on Form 144 withthe SEC and NASDAQ concurrently with either the placing of a sale order with the broker or the execution directlywith a market maker.
Non-Affiliate Resales of Restricted SecuritiesIn general, beginning 90 days after the effective date of the registration statement of which this prospectus is a part,a person who is not an affiliate of ours at the time of sale, and has not been an affiliate at any time during the threemonths preceding a sale, and who has beneficially owned shares of our common stock for at least six months butless than a year, is entitled to sell such shares subject only to the availability of current public information about us.If such person has held shares of our common stock for at least one year, such person can resell under Rule144(b)(1) without regard to any Rule 144 restrictions, including the 90-day public company requirement and thecurrent public information requirement.
Non-affiliate resales are not subject to the manner of sale, volume limitation or notice filing provisions of Rule 144.
Rule 701In general, under Rule 701, any of an issuer’s employees, directors, officers, consultants or advisors who purchasesshares from the issuer in connection with a compensatory stock or option plan or other written agreement before theeffective date of a registration statement under the Securities Act is entitled to sell such shares 90 days after sucheffective date in reliance on Rule 144. An affiliate of the issuer can resell shares in reliance on Rule 144 withouthaving to comply with the holding period requirement, and non-affiliates of the issuer can resell shares in reliance onRule 144 without having to comply with the current public information and holding period requirements.
The SEC has indicated that Rule 701 will apply to typical stock options granted by an issuer before it becomessubject to the reporting requirements of the Exchange Act, along with the shares acquired upon exercise of suchoptions, including exercises after an issuer becomes subject to the reporting requirements of the Exchange Act.
Equity PlansWe intend to file one or more registration statements on Form S-8 under the Securities Act to register all shares ofcommon stock subject to outstanding stock options and common stock issued or issuable under the Plan. We expectto file the registration statement covering shares offered pursuant to the Plan shortly after the date of this prospectus,permitting the resale of such shares by nonaffiliates in the public market without restriction under the Securities Actand the sale by affiliates in the public market subject to compliance with the resale provisions of Rule 144.
Registration RightsUpon the closing of this offering, the holders of 30,068,853 shares of common stock or their transferees will beentitled to various rights with respect to the registration of these shares under the Securities Act. Registration ofthese shares under the Securities Act would result in these shares becoming fully tradable without restriction underthe Securities Act immediately upon the effectiveness of the registration. See “Certain Relationships and RelatedPerson Transactions—Registration Rights Agreement” for additional information. Shares covered by a registrationstatement will be eligible for sale in the public market upon the expiration or release from the terms of the lock-upagreement.
133

MATERIAL U.S. FEDERAL INCOME TAX CONSEQUENCESTO NON-U.S. HOLDERS
The following discussion is a summary of the material U.S. federal income tax consequences to Non-U.S. Holders(as defined below) of the purchase, ownership and disposition of our common stock issued pursuant to this offering,but does not purport to be a complete analysis of all potential tax effects. The effects of other U.S. federal tax laws,such as estate and gift tax laws, and any applicable state, local or non-U.S. tax laws are not discussed. Thisdiscussion is based on the U.S. Internal Revenue Code of 1986, as amended, or the Code, Treasury Regulationspromulgated thereunder, judicial decisions, and published rulings and administrative pronouncements of the U.S.Internal Revenue Service, or the IRS, in each case in effect as of the date hereof. These authorities may change orbe subject to differing interpretations. Any such change or differing interpretation may be applied retroactively in amanner that could adversely affect a Non-U.S. Holder of our common stock. We have not sought and will not seekany rulings from the IRS regarding the matters discussed below. There can be no assurance the IRS or a court willnot take a contrary position to that discussed below regarding the tax consequences of the purchase, ownership anddisposition of our common stock.
This discussion is limited to Non-U.S. Holders that hold our common stock as a “capital asset” within the meaningof Section 1221 of the Code (generally, property held for investment). This discussion does not address all U.S.federal income tax consequences relevant to a Non-U.S. Holder’s particular circumstances, including the impact ofthe Medicare contribution tax on net investment income. In addition, it does not address consequences relevant toNon-U.S. Holders subject to special rules, including, without limitation:
■ U.S. expatriates and former citizens or long-term residents of the United States;■ persons subject to the alternative minimum tax;■ persons holding our common stock as part of a hedge, straddle or other risk reduction strategy or as part of
a conversion transaction or other integrated investment;■ banks, insurance companies, and other financial institutions;■ brokers, dealers or traders in securities;■ “controlled foreign corporations,” “passive foreign investment companies,” and corporations that
accumulate earnings to avoid U.S. federal income tax;■ partnerships or other entities or arrangements treated as partnerships for U.S. federal income tax purposes
(and investors therein);■ tax-exempt organizations or governmental organizations;■ persons deemed to sell our common stock under the constructive sale provisions of the Code;■ persons who hold or receive our common stock pursuant to the exercise of any employee stock option or
otherwise as compensation; and■ tax-qualified retirement plans.
If an entity treated as a partnership for U.S. federal income tax purposes holds our common stock, the tax treatmentof a partner in the partnership will depend on the status of the partner, the activities of the partnership and certaindeterminations made at the partner level. Accordingly, partnerships holding our common stock and the partners insuch partnerships should consult their tax advisors regarding the U.S. federal income tax consequences to them.
THIS DISCUSSION IS FOR INFORMATIONAL PURPOSES ONLY AND IS NOT TAX ADVICE. INVESTORS SHOULDCONSULT THEIR TAX ADVISORS WITH RESPECT TO THE APPLICATION OF THE U.S. FEDERAL INCOME TAXLAWS TO THEIR PARTICULAR SITUATIONS AS WELL AS ANY TAX CONSEQUENCES OF THE PURCHASE,OWNERSHIP AND DISPOSITION OF OUR COMMON STOCK ARISING UNDER THE U.S. FEDERAL ESTATE ORGIFT TAX LAWS OR UNDER THE LAWS OF ANY STATE, LOCAL OR NON-U.S. TAXING JURISDICTION OR UNDERANY APPLICABLE INCOME TAX TREATY.
134

Definition of a Non-U.S. Holder
For purposes of this discussion, a “Non-U.S. Holder” is any beneficial owner of our common stock that is neither a“U.S. person” nor an entity or arrangement treated as a partnership for U.S. federal income tax purposes. A U.S.person is any person that, for U.S. federal income tax purposes, is or is treated as any of the following:
■ an individual who is a citizen or resident of the United States;
■ a corporation created or organized under the laws of the United States, any state thereof, or the District ofColumbia;
■ an estate, the income of which is subject to U.S. federal income tax regardless of its source; or
■ a trust that (1) is subject to the primary supervision of a U.S. court and the control of one or more “UnitedStates persons” (within the meaning of Section 7701(a)(30) of the Code), or (2) has a valid election ineffect to be treated as a United States person for U.S. federal income tax purposes.
Distributions
As described in the section entitled “Dividend Policy,” we do not anticipate declaring or paying dividends to holders ofour common stock in the foreseeable future. However, if we do make distributions of cash or property on our commonstock, such distributions will constitute dividends for U.S. federal income tax purposes to the extent paid from ourcurrent or accumulated earnings and profits, as determined under U.S. federal income tax principles. Amounts nottreated as dividends for U.S. federal income tax purposes will constitute a return of capital and first be applied againstand reduce a Non-U.S. Holder’s adjusted tax basis in its common stock, but not below zero. Any excess will be treated ascapital gain and will be treated as described below under “—Sale or Other Taxable Disposition.”
Subject to the discussion below on effectively connected income, dividends paid to a Non-U.S. Holder of our commonstock will be subject to U.S. federal withholding tax at a rate of 30% of the gross amount of the dividends (or such lowerrate specified by an applicable income tax treaty, provided the Non-U.S. Holder furnishes a valid IRS Form W-8BEN orW-8BEN-E (or other applicable documentation) certifying qualification for the lower treaty rate). A Non-U.S. Holder thatdoes not timely furnish the required documentation, but that qualifies for a reduced treaty rate, may obtain a refund ofany excess amounts withheld by timely filing an appropriate claim for refund with the IRS. Non-U.S. Holders shouldconsult their tax advisors regarding their entitlement to benefits under any applicable income tax treaty.
If dividends paid to a Non-U.S. Holder are effectively connected with the Non-U.S. Holder’s conduct of a trade orbusiness within the United States (and, if required by an applicable income tax treaty, the Non-U.S. Holdermaintains a permanent establishment in the United States to which such dividends are attributable), the Non-U.S.Holder will be exempt from the U.S. federal withholding tax described above. To claim the exemption, the Non-U.S.Holder must furnish to the applicable withholding agent a valid IRS Form W-8ECI, certifying that the dividends areeffectively connected with the Non-U.S. Holder’s conduct of a trade or business within the United States.
Any such effectively connected dividends will be subject to U.S. federal income tax on a net income basis at theregular graduated rates applicable to U.S. persons. A Non-U.S. Holder that is a corporation also may be subject to abranch profits tax at a rate of 30% (or such lower rate specified by an applicable income tax treaty) on sucheffectively connected dividends, as adjusted for certain items. Non-U.S. Holders should consult their tax advisorsregarding any applicable tax treaties that may provide for different rules.
Sale or Other Taxable Disposition
Subject to the discussion below regarding FATCA, a Non-U.S. Holder will not be subject to U.S. federal income taxon any gain realized upon the sale or other taxable disposition of our common stock unless:
■ the gain is effectively connected with the Non-U.S. Holder’s conduct of a trade or business within theUnited States (and, if required by an applicable income tax treaty, the Non-U.S. Holder maintains apermanent establishment in the United States to which such gain is attributable);
■ the Non-U.S. Holder is a nonresident alien individual present in the United States for 183 days or moreduring the taxable year of the disposition and certain other requirements are met; or
135

■ our common stock constitutes a U.S. real property interest, or USRPI, by reason of our status as a U.S. realproperty holding corporation, or USRPHC, for U.S. federal income tax purposes.
Gain described in the first bullet point above generally will be subject to U.S. federal income tax on a net incomebasis at the regular graduated rates applicable to U.S. persons. A Non-U.S. Holder that is a corporation also may besubject to a branch profits tax at a rate of 30% (or such lower rate specified by an applicable income tax treaty) onsuch effectively connected gain, as adjusted for certain items.
Gain described in the second bullet point above will be subject to U.S. federal income tax at a rate of 30% (or suchlower rate specified by an applicable income tax treaty), which may be offset by U.S. source capital losses of theNon-U.S. Holder (even though the individual is not considered a resident of the United States), provided the Non-U.S. Holder has timely filed U.S. federal income tax returns with respect to such losses.
With respect to the third bullet point above, we believe we currently are not, and do not anticipate becoming, aUSRPHC. Because the determination of whether we are a USRPHC depends, however, on the fair market value ofour USRPIs relative to the fair market value of our non-U.S. real property interests and our other business assets,there can be no assurance we currently are not a USRPHC or will not become one in the future. Even if we are orwere to become a USRPHC, gain arising from the sale or other taxable disposition by a Non-U.S. Holder of ourcommon stock will not be subject to U.S. federal income tax if our common stock is “regularly traded,” as definedby applicable Treasury Regulations, on an established securities market, and such Non-U.S. Holder owned, actuallyand/or constructively, 5% or less of our common stock throughout the shorter of the five-year period ending on thedate of the sale or other taxable disposition or the Non-U.S. Holder’s holding period.
Non-U.S. Holders should consult their tax advisors regarding potentially applicable income tax treaties that mayprovide for different rules.
Information Reporting and Backup Withholding
Payments of dividends on our common stock will not be subject to backup withholding, provided the applicablewithholding agent does not have actual knowledge or reason to know the holder is a United States person and theholder either certifies its non-U.S. status, such as by furnishing a valid IRS Form W-8BEN, W-8BEN-E or W-8ECI, orotherwise establishes an exemption. However, information returns are required to be filed with the IRS in connectionwith any dividends on our common stock paid to the Non-U.S. Holder, regardless of whether any tax was actuallywithheld. In addition, proceeds of the sale or other taxable disposition of our common stock within the United Statesor conducted through certain U.S.-related brokers generally will not be subject to backup withholding or informationreporting, if the applicable withholding agent receives the certification described above and does not have actualknowledge or reason to know that such holder is a United States person, or the holder otherwise establishes anexemption. Proceeds of a disposition of our common stock conducted through a non-U.S. office of a non-U.S. brokergenerally will not be subject to backup withholding or information reporting.
Copies of information returns that are filed with the IRS may also be made available under the provisions of anapplicable treaty or agreement to the tax authorities of the country in which the Non-U.S. Holder resides or isestablished.
Backup withholding is not an additional tax. Any amounts withheld under the backup withholding rules may beallowed as a refund or a credit against a Non-U.S. Holder’s U.S. federal income tax liability, provided the requiredinformation is timely furnished to the IRS.
Additional Withholding Tax on Payments Made to Foreign Accounts
Withholding taxes may be imposed under Sections 1471 to 1474 of the Code (such Sections commonly referred toas the Foreign Account Tax Compliance Act, or “FATCA”) on certain types of payments made to non-U.S. financialinstitutions and certain other non-U.S. entities. Specifically, a 30% withholding tax may be imposed on dividendson, or gross proceeds from the sale or other disposition of, our common stock paid to a “foreign financial institution”or a “non-financial foreign entity” (each as defined in the Code), unless (1) the foreign financial institutionundertakes certain diligence and reporting obligations, (2) the non-financial foreign entity either certifies it does not
136

have any “substantial United States owners” (as defined in the Code) or furnishes identifying information regardingeach substantial United States owner, or (3) the foreign financial institution or non-financial foreign entity otherwisequalifies for an exemption from these rules. If the payee is a foreign financial institution and is subject to thediligence and reporting requirements in (1) above, it must enter into an agreement with the U.S. Department of theTreasury requiring, among other things, that it undertake to identify accounts held by certain “specified UnitedStates persons” or “United States-owned foreign entities” (each as defined in the Code), annually report certaininformation about such accounts, and withhold 30% on certain payments to non-compliant foreign financialinstitutions and certain other account holders. Foreign financial institutions located in jurisdictions that have anintergovernmental agreement with the United States governing FATCA may be subject to different rules.
Under the applicable Treasury Regulations and administrative guidance, withholding under FATCA generally appliesto payments of dividends on our common stock, and will apply to payments of gross proceeds from the sale or otherdisposition of such stock on or after January 1, 2019.
Prospective investors should consult their tax advisors regarding the potential application of withholding tax underFATCA to their investment in our common stock.
137

UNDERWRITING
Subject to the terms and conditions set forth in the underwriting agreement, dated , 2016, among us andJefferies LLC and Credit Suisse Securities (USA) LLC, as the representatives of the underwriters named below, wehave agreed to sell to the underwriters, and each of the underwriters has agreed, severally and not jointly, topurchase from us, the respective number of shares of common stock shown opposite its name below:
UNDERWRITERSNUMBER OF
SHARES
Jefferies LLC . . . . . . . . . . . . . . . . . . . . . . . . . . . . . . . . . . . . . . . . . . . . . . . . . . . . . . . . . . . . . . . . . . . . . . .Credit Suisse Securities (USA) LLC . . . . . . . . . . . . . . . . . . . . . . . . . . . . . . . . . . . . . . . . . . . . . . . . . . . . . .UBS Securities LLC . . . . . . . . . . . . . . . . . . . . . . . . . . . . . . . . . . . . . . . . . . . . . . . . . . . . . . . . . . . . . . . . . .Wells Fargo Securities, LLC . . . . . . . . . . . . . . . . . . . . . . . . . . . . . . . . . . . . . . . . . . . . . . . . . . . . . . . . . . . .Robert W. Baird & Co. Incorporated . . . . . . . . . . . . . . . . . . . . . . . . . . . . . . . . . . . . . . . . . . . . . . . . . . . . .William Blair & Company, L.L.C. . . . . . . . . . . . . . . . . . . . . . . . . . . . . . . . . . . . . . . . . . . . . . . . . . . . . . . . .
Total . . . . . . . . . . . . . . . . . . . . . . . . . . . . . . . . . . . . . . . . . . . . . . . . . . . . . . . . . . . . . . . . . . . . . . . . . . .
The underwriting agreement provides that the obligations of the several underwriters are subject to certain conditionsprecedent such as the receipt by the underwriters of officers’ certificates and legal opinions and approval of certainlegal matters by their counsel. The underwriting agreement provides that the underwriters will purchase all of theshares of common stock if any of them are purchased. If an underwriter defaults, the underwriting agreementprovides that the purchase commitments of the nondefaulting underwriters may be increased or the underwritingagreement may be terminated. We have agreed to indemnify the underwriters and certain of their controlling personsagainst certain liabilities, including liabilities under the Securities Act, and to contribute to payments that theunderwriters may be required to make in respect of those liabilities.
The shares of common stock will constitute a new class of securities with no established trading market. Theunderwriters have advised us that, following the completion of this offering, they currently intend to make a marketin the common stock as permitted by applicable laws and regulations. However, the underwriters are not obligated todo so, and the underwriters may discontinue any market-making activities at any time without notice in their solediscretion. Accordingly, no assurance can be given as to the liquidity of the trading market for the common stock,that you will be able to sell any of the common stock held by you at a particular time or that the prices that youreceive when you sell will be favorable.
The underwriters are offering the shares of common stock subject to their acceptance of the shares of common stockfrom us and subject to prior sale. The underwriters reserve the right to withdraw, cancel or modify offers to thepublic and to reject orders in whole or in part. In addition, the underwriters have advised us that they do not intendto confirm sales to any account over which they exercise discretionary authority.
Commission and Expenses
The underwriters have advised us that they propose to offer the shares of common stock to the public at the initialpublic offering price set forth on the cover page of this prospectus and to certain dealers, which may include theunderwriters, at that price less a concession not in excess of $ per share of common stock. The underwritersmay allow, and certain dealers may reallow, a discount from the concession not in excess of $ per share ofcommon stock to certain brokers and dealers. After the offering, the initial public offering price, concession andreallowance to dealers may be reduced by the representatives. No such reduction will change the amount ofproceeds to be received by us as set forth on the cover page of this prospectus.
138

The following table shows the public offering price, the underwriting discounts and commissions that we are to paythe underwriters and the proceeds, before expenses, to us in connection with this offering. Such amounts are shownassuming both no exercise and full exercise of the underwriters’ option to purchase additional shares.
PER SHARE TOTAL
WITHOUTOPTION TOPURCHASEADDITIONAL
SHARES
WITHOPTION TOPURCHASEADDITIONAL
SHARES
WITHOUTOPTION TOPURCHASEADDITIONAL
SHARES
WITHOPTION TOPURCHASEADDITIONAL
SHARES
Public offering price . . . . . . . . . . . . . . . . . . . . . . . . . . . . . . . . $ $ $ $Underwriting discounts and commissions paid by us . . . . . . . $ $ $ $Proceeds to us, before expenses . . . . . . . . . . . . . . . . . . . . . . . $ $ $ $
We estimate expenses payable by us in connection with this offering, other than the underwriting discounts andcommissions referred to above, will be approximately $2.8 million. We have also agreed to reimburse theunderwriters for certain expenses, including up to an aggregate of $30,000 in connection with the clearance of thisoffering with the Financial Industry Regulatory Authority, as set forth in the underwriting agreement.
Determination of Offering Price
Prior to this offering, there has not been a public market for our common stock. Consequently, the initial publicoffering price for our common stock will be determined by negotiations between us and the representatives. Amongthe factors to be considered in these negotiations will be prevailing market conditions, our financial information,market valuations of other companies that we and the underwriters believe to be comparable to us, estimates of ourbusiness potential, the present state of our development and other factors deemed relevant.
We offer no assurances that the initial public offering price will correspond to the price at which the common stockwill trade in the public market subsequent to the offering or that an active trading market for the common stock willdevelop and continue after the offering.
Listing
We have applied to have our common stock listed on NASDAQ under the trading symbol “MEDP.”
Stamp Taxes
If you purchase shares of common stock offered in this prospectus, you may be required to pay stamp taxes andother charges under the laws and practices of the country of purchase, in addition to the offering price listed on thecover page of this prospectus.
Option to Purchase Additional Shares
We have granted to the underwriters an option, exercisable for 30 days from the date of this prospectus, to purchase,from time to time, in whole or in part, up to an aggregate of shares from us at the public offering price set forth on thecover page of this prospectus, less underwriting discounts and commissions. If the underwriters exercise this option,each underwriter will be obligated, subject to specified conditions, to purchase a number of additional sharesproportionate to that underwriter’s initial purchase commitment as indicated in the table above. This option may beexercised only if the underwriters sell more shares than the total number set forth on the cover page of this prospectus.
No Sales of Similar Securities
We, our officers, directors and holders of all or substantially all our outstanding capital stock and other securitieshave agreed, subject to specified exceptions, not to directly or indirectly:
■ sell, offer, contract or grant any option to sell (including any short sale), pledge, transfer, establish an open“put equivalent position” within the meaning of Rule 16a-l(h) under the Exchange Act;
139

■ otherwise dispose of any shares of common stock, options or warrants to acquire shares of common stock, orsecurities exchangeable or exercisable for or convertible into shares of common stock currently or hereafterowned either of record or beneficially; or
■ publicly announce an intention to do any of the foregoing for a period of 180 days after the date of thisprospectus without the prior written consent of Jefferies LLC.
This restriction terminates after the close of trading of the common stock on and including the 180th day after thedate of this prospectus.
Jefferies LLC may, in its sole discretion and at any time or from time to time before the termination of the 180-dayperiod release all or any portion of the securities subject to lock-up agreements. There are no existing agreementsbetween the underwriters and any of our shareholders who will execute a lock-up agreement, providing consent tothe sale of shares prior to the expiration of the lock-up period.
Stabilization
The underwriters have advised us that they, pursuant to Regulation M under the Exchange Act, certain personsparticipating in the offering may engage in short sale transactions, stabilizing transactions, syndicate coveringtransactions or the imposition of penalty bids in connection with this offering. These activities may have the effect ofstabilizing or maintaining the market price of the common stock at a level above that which might otherwise prevail inthe open market. Establishing short sales positions may involve either “covered” short sales or “naked” short sales.
“Covered” short sales are sales made in an amount not greater than the underwriters’ option to purchase additionalshares of our common stock in this offering. The underwriters may close out any covered short position by eitherexercising their option to purchase additional shares of our common stock or purchasing shares of our common stockin the open market. In determining the source of shares to close out the covered short position, the underwriters willconsider, among other things, the price of shares available for purchase in the open market as compared to the priceat which they may purchase shares through the option to purchase additional shares.
“Naked” short sales are sales in excess of the option to purchase additional shares of our common stock. Theunderwriters must close out any naked short position by purchasing shares in the open market. A naked shortposition is more likely to be created if the underwriters are concerned that there may be downward pressure on theprice of the shares of our common stock in the open market after pricing that could adversely affect investors whopurchase in this offering.
A stabilizing bid is a bid for the purchase of shares of common stock on behalf of the underwriters for the purpose offixing or maintaining the price of the common stock. A syndicate covering transaction is the bid for or the purchaseof shares of common stock on behalf of the underwriters to reduce a short position incurred by the underwriters inconnection with the offering. Similar to other purchase transactions, the underwriter’s purchases to cover thesyndicate short sales may have the effect of raising or maintaining the market price of our common stock orpreventing or retarding a decline in the market price of our common stock. As a result, the price of our commonstock may be higher than the price that might otherwise exist in the open market. A penalty bid is an arrangementpermitting the underwriters to reclaim the selling concession otherwise accruing to a syndicate member inconnection with the offering if the common stock originally sold by such syndicate member are purchased in asyndicate covering transaction and therefore have not been effectively placed by such syndicate member.
Neither we, nor any of the underwriters make any representation or prediction as to the direction or magnitude of anyeffect that the transactions described above may have on the price of our common stock. The underwriters are notobligated to engage in these activities and, if commenced, any of the activities may be discontinued at any time.
The underwriters may also engage in passive market making transactions in our common stock on NASDAQ inaccordance with Rule 103 of Regulation M during a period before the commencement of offers or sales of shares ofour common stock in this offering and extending through the completion of distribution. A passive market makermust display its bid at a price not in excess of the highest independent bid of that security. However, if allindependent bids are lowered below the passive market maker’s bid, that bid must then be lowered when specifiedpurchase limits are exceeded.
140

Electronic Distribution
A prospectus in electronic format may be made available by e-mail or on the web sites or through online servicesmaintained by one or more of the underwriters or their affiliates. In those cases, prospective investors may viewoffering terms online and may be allowed to place orders online. The underwriters may agree with us to allocate aspecific number of shares of common stock for sale to online brokerage account holders. Any such allocation foronline distributions will be made by the underwriters on the same basis as other allocations. Other than theprospectus in electronic format, the information on the underwriters’ web sites and any information contained in anyother web site maintained by any of the underwriters is not part of this prospectus, has not been approved and/orendorsed by us or the underwriters and should not be relied upon by investors.
Other Activities and Relationships
The underwriter and certain of its affiliates are full-service financial institutions engaged in various activities, whichmay include securities trading, commercial and investment banking, financial advisory, investment management,investment research, principal investment, hedging, financing and brokerage activities. The underwriter and certainof its affiliates have, from time to time, performed, and may in the future perform, various commercial andinvestment banking and financial advisory services for us and our affiliates, for which they received or will receivecustomary fees and expenses.
In particular, an affiliate of Jefferies LLC serves as the administrative agent, swingline lender and co-documentationagent of our Senior Secured Credit Facilities and certain affiliates of Jefferies LLC, Credit Suisse Securities (USA)LLC, UBS Securities LLC and Wells Fargo Securities, LLC serve as joint lead arrangers, joint bookrunners andsyndication agents of our Senior Secured Credit Facilities and certain affiliates of Jefferies LLC, Credit SuisseSecurities (USA) LLC and Wells Fargo Securities, LLC serve as lenders under our Senior Secured Credit Facilities. Asdescribed in “Use of Proceeds” we intend to use the net proceeds of this offering to repay $138.3 million inaggregate principal amount of outstanding borrowings under our Senior Secured Term Loan Facility. Because of theiraffiliates’ lending relationships Jefferies LLC and Wells Fargo Securities, LLC will receive some of the net proceedsof this offering.
In the ordinary course of their various business activities, the underwriter and certain of its affiliates may make orhold a broad array of investments and actively trade debt and equity securities (or related derivative securities) andfinancial instruments (including bank loans) for their own account and for the accounts of their customers, and suchinvestment and securities activities may involve securities and/or instruments issued by us and our affiliates. If theunderwriters or their respective affiliates have a lending relationship with us, they routinely hedge their creditexposure to us consistent with their customary risk management policies. The underwriters and their respectiveaffiliates may hedge such exposure by entering into transactions which consist of either the purchase of creditdefault swaps or the creation of short positions in our securities or the securities of our affiliates, includingpotentially the common stock offered hereby. Any such short positions could adversely affect future trading prices ofthe common stock offered hereby. The underwriters and certain of their respective affiliates may also communicateindependent investment recommendations, market color or trading ideas and/or publish or express independentresearch views in respect of such securities or instruments and may at any time hold, or recommend to customersthat they acquire, long and/or short positions in such securities and instruments.
Selling Restrictions
This prospectus does not constitute an offer to sell to, or a solicitation of an offer to buy from, anyone in any countryor jurisdiction (i) in which such an offer or solicitation is not authorized, (ii) in which any person making such offeror solicitation is not qualified to do so or (iii) in which any such offer or solicitation would otherwise be unlawful. Noaction has been taken that would, or is intended to, permit a public offer of the shares of common stock orpossession or distribution of this prospectus or any other offering or publicity material relating to the shares ofcommon stock in any country or jurisdiction (other than the United States) where any such action for that purpose isrequired. Accordingly, each underwriter has undertaken that it will not, directly or indirectly, offer or sell any sharesof common stock or have in its possession, distribute or publish any prospectus, form of application, advertisementor other document or information in any country or jurisdiction except under circumstances that will, to the best of
141

its knowledge and belief, result in compliance with any applicable laws and regulations and all offers and sales ofthe shares of common stock by it will be made on the same terms.
European Economic AreaIn relation to each member state of the European Economic Area which has implemented the Prospectus Directive(each, a “Relevant Member State”), an offer to the public of any common shares which are the subject of theoffering contemplated by this prospectus may not be made in that Relevant Member State except that an offer to thepublic in that Relevant Member State of any common shares may be made at any time under the followingexemptions under the Prospectus Directive, if they have been implemented in that Relevant Member State:
■ to any legal entity which is a “qualified investor” as defined in the Prospectus Directive;■ to fewer than 100 or, if the Relevant Member State has implemented the relevant provision of the 2010 PD
Amending Directive, 150, natural or legal persons (other than qualified investors as defined in theProspectus Directive), as permitted under the Prospectus Directive, subject to obtaining the prior consent ofthe underwriters or the underwriters nominated by us for any such offer; or
■ in any other circumstances falling within Article 3(2) of the Prospectus Directive,
provided that no such offer of common shares shall require us or any of the underwriters to publish a prospectuspursuant to Article 3 of the Prospectus Directive or supplement a prospectus pursuant to Article 16 of theProspectus Directive. For the purposes of this provision, the expression an “offer common shares to the public” inrelation to the common shares in any Relevant Member State means the communication in any form and by anymeans of sufficient information on the terms of the offer and the common shares to be offered so as to enable aninvestor to decide to purchase or subscribe to the common shares, as the same may be varied in that RelevantMember State by any measure implementing the Prospectus Directive in that Relevant Member State and theexpression “Prospectus Directive” means Directive 2003/71/EC (and amendments thereto, including the 2010 PDAmending Directive, to the extent implemented in the Relevant Member State), and includes any relevantimplementing measure in the Relevant Member State and the expression “2010 PD Amending Directive” meansDirective 2010/73/EU.
United KingdomThis prospectus is only being distributed to, and is only directed at, persons in the United Kingdom that arequalified investors within the meaning of Article 2(1)(e) of the Prospectus Directive that are also (i) investmentprofessionals falling within Article 19(5) of the Financial Services and Markets Act 2000 (Financial Promotion)Order 2005, as amended, or the Order, and/or (ii) high net worth entities falling within Article 49(2)(a) to (d) of theOrder and other persons to whom it may lawfully be communicated (each such person being referred to as a“relevant person”). This prospectus and its contents are confidential and should not be distributed, published orreproduced (in whole or in part) or disclosed by recipients to any other persons in the United Kingdom. Any person inthe United Kingdom that is not a relevant person should not act or rely on this document or any of its contents.
AustraliaThis prospectus is not a disclosure document for the purposes of Australia’s Corporations Act 2001 (Cth) ofAustralia, or the Corporations Act, has not been lodged with the Australian Securities & Investments Commission andis only directed to the categories of exempt persons set out below. Accordingly, if you receive this prospectus inAustralia:
You confirm and warrant that you are either:
■ a “sophisticated investor” under section 708(8)(a) or (b) of the Corporations Act;■ a “sophisticated investor” under section 708(8)(c) or (d) of the Corporations Act and that you have provided
an accountant’s certificate to the Company which complies with the requirements of section 708(8)(c)(i) or(ii) of the Corporations Act and related regulations before the offer has been made;
■ a person associated with the Company under Section 708(12) of the Corporations Act; or
■ a “professional investor” within the meaning of section 708(11)(a) or (b) of the Corporations Act.
To the extent that you are unable to confirm or warrant that you are an exempt sophisticated investor, associatedperson or professional investor under the Corporations Act any offer made to you under this prospectus is void andincapable of acceptance.
142

You warrant and agree that you will not offer any of the securities issued to you pursuant to this prospectus for resalein Australia within 12 months of those securities being issued unless any such resale offer is exempt from therequirement to issue a disclosure document under section 708 of the Corporations Act.
Hong KongNo securities have been offered or sold, and no securities may be offered or sold, in Hong Kong, by means of anydocument, other than to persons whose ordinary business is to buy or sell shares or debentures, whether as principalor agent; or to “professional investors” as defined in the Securities and Futures Ordinance (Cap. 571) of Hong Kong,or SFO, and any rules made under that Ordinance; or in other circumstances which do not result in the documentbeing a “prospectus” as defined in the Companies Ordinance (Cap. 32) of Hong Kong, or CO, or which do notconstitute an offer or invitation to the public for the purpose of the CO or the SFO. No document, invitation oradvertisement relating to the securities has been issued or may be issued or may be in the possession of any personfor the purpose of issue (in each case whether in Hong Kong or elsewhere), which is directed at, or the contents ofwhich are likely to be accessed or read by, the public of Hong Kong (except if permitted under the securities laws ofHong Kong) other than with respect to securities which are or are intended to be disposed of only to persons outsideHong Kong or only to “professional investors” as defined in the SFO and any rules made under that Ordinance.
This prospectus has not been registered with the Registrar of Companies in Hong Kong. Accordingly, this prospectusmay not be issued, circulated or distributed in Hong Kong, and the securities may not be offered for subscription tomembers of the public in Hong Kong. Each person acquiring the securities will be required, and is deemed by theacquisition of the securities, to confirm that he is aware of the restriction on offers of the securities described in thisprospectus and the relevant offering documents and that he is not acquiring, and has not been offered any securitiesin circumstances that contravene any such restrictions.
JapanThe offering has not been and will not be registered under the Financial Instruments and Exchange Law of Japan(Law No. 25 of 1948 of Japan, as amended), or FIEL, and the underwriters will not offer or sell any securities,directly or indirectly, in Japan or to, or for the benefit of, any resident of Japan (which term as used herein meansany person resident in Japan, including any corporation or other entity organized under the laws of Japan), or toothers for re-offering or resale, directly or indirectly, in Japan or to, or for the benefit of, any resident of Japan,except pursuant to an exemption from the registration requirements of, and otherwise in compliance with, the FIELand any other applicable laws, regulations and ministerial guidelines of Japan.
SingaporeThis prospectus has not been and will not be lodged or registered as a prospectus with the Monetary Authority ofSingapore. Accordingly, this prospectus and any other document or material in connection with the offer or sale, orinvitation for subscription or purchase, of the common stock may not be circulated or distributed, nor may the commonstock be offered or sold, or be made the subject of an invitation for subscription or purchase, whether directly orindirectly, to persons in Singapore other than (i) to an institutional investor under Section 274 of the Securities andFutures Act, Chapter 289 of Singapore, or the SFA, (ii) to a relevant person pursuant to Section 275(1), or any personpursuant to Section 275(1A), and in accordance with the conditions specified in Section 275, of the SFA, or(iii) otherwise pursuant to, and in accordance with the conditions of, any other applicable provision of the SFA.
Where the common stock is subscribed or purchased under Section 275 of the SFA by a relevant person which is:
■ a corporation (which is not an accredited investor (as defined in Section 4A of the SFA)) the sole businessof which is to hold investments and the entire share capital of which is owned by one or more individuals,each of whom is an accredited investor; or
■ a trust (where the trustee is not an accredited investor) whose sole purpose is to hold investments and eachbeneficiary of the trust is an individual who is an accredited investor,
securities (as defined in Section 239(1) of the SFA) of that corporation or the beneficiaries’ rights and interest(howsoever described) in that trust shall not be transferred within six months after that corporation or that trust hasacquired the common stock pursuant to an offer made under Section 275 of the SFA except:
■ to an institutional investor or to a relevant person defined in Section 275(2) of the SFA, or to any personarising from an offer referred to in Section 275(1A) or Section 276(4)(i)(B) of the SFA;
143

■ where no consideration is or will be given for the transfer;■ where the transfer is by operation of law;■ as specified in Section 276(7) of the SFA; or■ as specified in Regulation 32 of the Securities and Futures (Offers of Investments) (Shares and Debentures)
Regulations 2005 of Singapore.
SwitzerlandThe securities may not be publicly offered in Switzerland and will not be listed on the SIX Swiss Exchange, or SIX, oron any other stock exchange or regulated trading facility in Switzerland. This prospectus has been prepared withoutregard to the disclosure standards for issuance prospectuses under art. 652a or art. 1156 of the Swiss Code ofObligations or the disclosure standards for listing prospectuses under art. 27 ff. of the SIX Listing Rules or thelisting rules of any other stock exchange or regulated trading facility in Switzerland. Neither this prospectus nor anyother offering or marketing material relating to the securities or the offering may be publicly distributed or otherwisemade publicly available in Switzerland.
Neither this prospectus nor any other offering or marketing material relating to the offering, the Company or thesecurities have been or will be filed with or approved by any Swiss regulatory authority. In particular, this prospectuswill not be filed with, and the offer of securities will not be supervised by, the Swiss Financial Market SupervisoryAuthority FINMA, and the offer of securities has not been and will not be authorized under the Swiss Federal Act onCollective Investment Schemes, or CISA. The investor protection afforded to acquirers of interests in collectiveinvestment schemes under the CISA does not extend to acquirers of securities.
CanadaThe securities may be sold only to purchasers purchasing, or deemed to be purchasing, as principal that areaccredited investors, as defined in National Instrument 45-106 Prospectus Exemptions or subsection 73.3(1) of theSecurities Act (Ontario), and are permitted clients, as defined in National Instrument 31-103 RegistrationRequirements, Exemptions and Ongoing Registrant Obligations. Any resale of the securities must be made inaccordance with an exemption from, or in a transaction not subject to, the prospectus requirements of applicablesecurities laws.
Securities legislation in certain provinces or territories of Canada may provide a purchaser with remedies forrescission or damages if this prospectus (including any amendment thereto) contains a misrepresentation, providedthat the remedies for rescission or damages are exercised by the purchaser within the time limit prescribed by thesecurities legislation of the purchaser’s province or territory. The purchaser should refer to any applicable provisionsof the securities legislation of the purchaser’s province or territory for particulars of these rights or consult with alegal advisor.
Pursuant to section 3A.3 (or, in the case of securities issued or guaranteed by the government of a non-Canadianjurisdiction, section 3A.4) of National Instrument 33-105 Underwriting Conflicts (“NI 33-105”), the underwritersare not required to comply with the disclosure requirements of NI 33-105 regarding underwriter conflicts of interestin connection with this offering.
144
LEGAL MATTERS
Certain legal matters in connection with this offering, including the validity of the shares of our common stockoffered hereby, will be passed upon for us by Latham & Watkins LLP, New York, New York. The underwriters arebeing represented by Gibson, Dunn & Crutcher LLP, New York, New York.
EXPERTS
The consolidated financial statements of Medpace Holdings, Inc. and subsidiaries as of December 31, 2015 and2014 (Successor) and for the year ended December 31, 2015 (Successor), and the periods from April 1, 2014through December 31, 2014 (Successor), January 1, 2014 through March 31, 2014 (Predecessor), and the yearended December 31, 2013 (Predecessor) included in this prospectus have been audited by Deloitte & Touche LLP,an independent registered public accounting firm, as stated in their report appearing herein. Such financialstatements have been so included in reliance upon the report of such firm given upon their authority as experts inaccounting and auditing.
WHERE YOU CAN FIND MORE INFORMATION
We have filed with the SEC a registration statement on Form S-1 under the Securities Act with respect to the sharesof common stock offered hereby. This prospectus does not contain all of the information set forth in the registrationstatement and the exhibits and schedules thereto. For further information with respect to us and the shares ofcommon stock offered hereby, you should refer to the registration statement and to the exhibits and schedules filedtherewith. Statements contained in this prospectus regarding the contents of any contract or any other documentthat is filed as an exhibit to the registration statement are not necessarily complete, and each such statement isqualified in all respects by reference to the full text of such contract or other document filed as an exhibit to theregistration statement. When we complete this offering, we will be required to file annual, quarterly and currentreports, proxy statements and other information with the SEC. Our SEC filings, including our registration statementand the exhibits and schedules thereto, may be inspected without charge at the public reference room maintained bythe SEC located at 100 F Street, N.E., Room 1580, Washington, D.C. 20549. Copies of all or any portion of theregistration statements and the filings may be obtained from such offices upon payment of prescribed fees. Thepublic may obtain information on the operation of the public reference room by calling the SEC at 1-800-SEC-0330or (202) 551-8090. The SEC maintains a website at www.sec.gov that contains reports, proxy and informationstatements and other information regarding registrants that file electronically with the SEC.
You may also obtain a copy of any of our filings, at no cost, by writing or telephoning us at:
Medpace Holdings, Inc.5375 Medpace Way
Cincinnati, Ohio 45227(513) 579-9911
145

[THIS PAGE INTENTIONALLY LEFT BLANK]

INDEX TO CONSOLIDATED FINANCIAL STATEMENTS
Audited Consolidated Financial Statements
PAGE
Report of Independent Registered Public Accounting Firm . . . . . . . . . . . . . . . . . . . . . . . . . . . . . . . . . . . . . . . . F-2Consolidated Balance Sheets as of December 31, 2015 and 2014 . . . . . . . . . . . . . . . . . . . . . . . . . . . . . . . . . . F-3Consolidated Statements of Operations for the fiscal year ended December 31, 2015, for the Periods April 1,
2014 through December 31, 2014 and January 1, 2014 through March 31, 2014 and for the fiscal yearended December 31, 2013 . . . . . . . . . . . . . . . . . . . . . . . . . . . . . . . . . . . . . . . . . . . . . . . . . . . . . . . . . . . . . . F-4
Consolidated Statements of Comprehensive (Loss) Income for the fiscal year ended December 31, 2015, forthe Periods April 1, 2014 through December 31, 2014 and January 1, 2014 through March 31, 2014and for the fiscal year ended December 31, 2013 . . . . . . . . . . . . . . . . . . . . . . . . . . . . . . . . . . . . . . . . . . . . F-5
Consolidated Statements of Shareholders’ Equity for the fiscal year ended December 31, 2015, for thePeriods April 1, 2014 through December 31, 2014 and January 1, 2014 through March 31, 2014 andfor the fiscal year ended December 31, 2013 . . . . . . . . . . . . . . . . . . . . . . . . . . . . . . . . . . . . . . . . . . . . . . . . F-6
Consolidated Statements of Cash Flows for the fiscal year ended December 31, 2015, for the Periods April 1,2014 through December 31, 2014 and January 1, 2014 through March 31, 2014 and for the fiscal yearended December 31, 2013 . . . . . . . . . . . . . . . . . . . . . . . . . . . . . . . . . . . . . . . . . . . . . . . . . . . . . . . . . . . . . . F-7
Notes to Consolidated Financial Statements . . . . . . . . . . . . . . . . . . . . . . . . . . . . . . . . . . . . . . . . . . . . . . . . . . . . F-8
Unaudited Condensed Consolidated Financial Statements
PAGE
Condensed Consolidated Balance Sheets as of June 30, 2016 and December 31, 2015 . . . . . . . . . . . . . . . . . F-41Condensed Consolidated Statements of Operations for the six months ended June 30, 2016 and 2015 . . . . . F-42Condensed Consolidated Statements of Comprehensive Income (Loss) for the six months ended June 30,
2016 and 2015 . . . . . . . . . . . . . . . . . . . . . . . . . . . . . . . . . . . . . . . . . . . . . . . . . . . . . . . . . . . . . . . . . . . . . . . F-43Condensed Consolidated Statement of Shareholders’ Equity for the six months ended June 30, 2016 . . . . . . F-44Condensed Consolidated Statements of Cash Flows for the six months ended June 30, 2016 and 2015 . . . . . F-45Notes to Unaudited Condensed Consolidated Financial Statements . . . . . . . . . . . . . . . . . . . . . . . . . . . . . . . . . . F-46
F-1

REPORT OF INDEPENDENT REGISTERED PUBLIC ACCOUNTING FIRM
To the Shareholders and Board of Directors ofMedpace Holdings, Inc. and subsidiaries:
We have audited the accompanying consolidated balance sheets of Medpace Holdings, Inc. and its subsidiaries (the“Company”) as of December 31, 2015 and 2014 (Successor), and the related consolidated statements ofoperations, comprehensive (loss) income, shareholders’ equity, and cash flows for the year ended December 31,2015 (Successor), and the periods from April 1, 2014 through December 31, 2014 (Successor), January 1, 2014through March 31, 2014 (Predecessor), and the year ended December 31, 2013 (Predecessor). These consolidatedfinancial statements are the responsibility of the Company’s management. Our responsibility is to express an opinionon these financial statements based on our audits.
We conducted our audits in accordance with the standards of the Public Company Accounting Oversight Board(United States). Those standards require that we plan and perform the audit to obtain reasonable assurance aboutwhether the financial statements are free of material misstatement. The Company is not required to have, nor werewe engaged to perform, an audit of its internal control over financial reporting. Our audits included consideration ofinternal control over financial reporting as a basis for designing audit procedures that are appropriate in thecircumstances, but not for the purpose of expressing an opinion on the effectiveness of the Company’s internalcontrol over financial reporting. Accordingly, we express no such opinion. An audit also includes examining, on a testbasis, evidence supporting the amounts and disclosures in the financial statements, assessing the accountingprinciples used and significant estimates made by management, as well as evaluating the overall financial statementpresentation. We believe that our audits provide a reasonable basis for our opinion.
In our opinion, such consolidated financial statements present fairly, in all material respects, the financial positionof Medpace Holdings, Inc. and subsidiaries at as of December 31, 2015 and 2014 (Successor), and the results oftheir operations and their cash flows for the year ended December 31, 2015 (Successor), and the periods from April1, 2014 through December 31, 2014 (Successor), January 1, 2014 through March 31, 2014 (Predecessor), andthe year ended December 31, 2013 (Predecessor), in conformity with accounting principles generally accepted inthe United States of America.
/s/ Deloitte & Touche LLP
Cincinnati, OhioMarch 1, 2016 (July 26, 2016 as to the effects of the reverse stock split described in Notes 3 and 17)
F-2

MEDPACE HOLDINGS, INC. AND SUBSIDIARIES
CONSOLIDATED BALANCE SHEETS(Amounts in thousands except share amounts)
SUCCESSOR
DECEMBER 31,2015
DECEMBER 31,2014
ASSETSCurrent assets:
Cash and cash equivalents . . . . . . . . . . . . . . . . . . . . . . . . . . . . . . . . . . . . . . . . . . . $ 14,880 $ 54,285Restricted cash . . . . . . . . . . . . . . . . . . . . . . . . . . . . . . . . . . . . . . . . . . . . . . . . . . . . 2,857 1,104Accounts receivable:
Billed, net (includes $2.3 million and $0.7 million with related parties atDecember 31, 2015 and 2014, respectively) . . . . . . . . . . . . . . . . . . . . . . . 46,352 52,468
Unbilled Services (includes $0.6 million and $0.2 million with related partiesat December 31, 2015 and 2014, respectively) . . . . . . . . . . . . . . . . . . . . . 18,736 12,780
Prepaid expenses and other current assets . . . . . . . . . . . . . . . . . . . . . . . . . . . . . . . 11,896 12,684
Total current assets . . . . . . . . . . . . . . . . . . . . . . . . . . . . . . . . . . . . . . . . . . . 94,721 133,321Property and equipment, net . . . . . . . . . . . . . . . . . . . . . . . . . . . . . . . . . . . . . . . . . 37,512 38,084Goodwill . . . . . . . . . . . . . . . . . . . . . . . . . . . . . . . . . . . . . . . . . . . . . . . . . . . . . . . . . 660,981 670,294Intangible assets, net . . . . . . . . . . . . . . . . . . . . . . . . . . . . . . . . . . . . . . . . . . . . . . . 186,743 249,885Deferred income taxes . . . . . . . . . . . . . . . . . . . . . . . . . . . . . . . . . . . . . . . . . . . . . . 157 138Other assets . . . . . . . . . . . . . . . . . . . . . . . . . . . . . . . . . . . . . . . . . . . . . . . . . . . . . . 3,927 5,190
Total assets . . . . . . . . . . . . . . . . . . . . . . . . . . . . . . . . . . . . . . . . . . . . . . . . . $984,041 $1,096,912
LIABILITIES AND SHAREHOLDERS’ EQUITYCurrent liabilities:
Accounts payable . . . . . . . . . . . . . . . . . . . . . . . . . . . . . . . . . . . . . . . . . . . . . . . . . . $ 8,728 $ 6,252Accrued expenses . . . . . . . . . . . . . . . . . . . . . . . . . . . . . . . . . . . . . . . . . . . . . . . . . . 20,111 20,307Pre-funded study costs (includes $3.7 million and $2.4 million with related
parties at December 31, 2015 and 2014, respectively) . . . . . . . . . . . . . . . . . . 46,599 36,686Advanced billings (includes $10.2 million and $5.3 million with related parties
at December 31, 2015 and 2014, respectively) . . . . . . . . . . . . . . . . . . . . . . . . 51,051 58,139Other current liabilities . . . . . . . . . . . . . . . . . . . . . . . . . . . . . . . . . . . . . . . . . . . . . . 7,528 12,256
Total current liabilities . . . . . . . . . . . . . . . . . . . . . . . . . . . . . . . . . . . . . . . . . 134,017 133,640Long-term debt, net, less current portion . . . . . . . . . . . . . . . . . . . . . . . . . . . . . . . . 377,882 491,518Deemed landlord liability, less current portion . . . . . . . . . . . . . . . . . . . . . . . . . . . . 30,273 31,852Deferred income tax liability . . . . . . . . . . . . . . . . . . . . . . . . . . . . . . . . . . . . . . . . . . 21,104 33,768Other long-term liabilities . . . . . . . . . . . . . . . . . . . . . . . . . . . . . . . . . . . . . . . . . . . . 7,291 4,164
Total liabilities . . . . . . . . . . . . . . . . . . . . . . . . . . . . . . . . . . . . . . . . . . . . . . . 570,567 694,942Commitments and contingencies (see Note 9)Shareholders’ equity:
Successor common stock—$0.01 par value; 60,000,000 shares authorized;32,624,461 and 31,286,989 shares issued and outstanding atDecember 31, 2015 and 2014, respectively . . . . . . . . . . . . . . . . . . . . . . . . . . 326 313
Additional paid-in capital . . . . . . . . . . . . . . . . . . . . . . . . . . . . . . . . . . . . . . . . . . . . 438,716 417,553Accumulated deficit . . . . . . . . . . . . . . . . . . . . . . . . . . . . . . . . . . . . . . . . . . . . . . . . (23,009) (14,336)Accumulated other comprehensive loss . . . . . . . . . . . . . . . . . . . . . . . . . . . . . . . . . (2,559) (1,560)
Total shareholders’ equity . . . . . . . . . . . . . . . . . . . . . . . . . . . . . . . . . . . . . . 413,474 401,970
Total liabilities and shareholders’ equity . . . . . . . . . . . . . . . . . . . . . . . . . . . $984,041 $1,096,912
See notes to consolidated financial statements.
F-3

MEDPACE HOLDINGS, INC. AND SUBSIDIARIES
CONSOLIDATED STATEMENTS OF OPERATIONS(Amounts in thousands except share and per share amounts)
SUCCESSOR PREDECESSOR
YEAR ENDEDDECEMBER 31,
2015
PERIOD FROMAPRIL 1, 2014
THROUGHDECEMBER 31,
2014
PERIOD FROMJANUARY 1, 2014
THROUGHMARCH 31,
2014
YEAR ENDEDDECEMBER 31,
2013
Service revenue, net (includes $24.0 million, $11.8million, $2.0 million and $3.3 million withrelated parties for the Successor year endedDecember 31, 2015 and Period endedDecember 31, 2014, and the Predecessor Periodended March 31, 2014 and year endedDecember 31, 2013, respectively) . . . . . . . . . . . . $ 320,101 $ 219,791 $ 70,250 $ 244,270
Reimbursed out-of-pocket revenue (includes $6.9million, $2.0 million, $0.1 million and $0.1million with related parties for the Successor yearended December 31, 2015 and Period endedDecember 31, 2014, and the Predecessor Periodended March 31, 2014 and year endedDecember 31, 2013, respectively) . . . . . . . . . . . . 38,958 28,708 7,679 28,620
Total revenue . . . . . . . . . . . . . . . . . . . . . . . . . 359,059 248,499 77,929 272,890Operating Expenses:
Direct costs, excluding depreciation andamortization . . . . . . . . . . . . . . . . . . . . . . . . . . 163,707 117,550 38,759 119,779
Reimbursed out-of-pocket expenses (includes$6.9 million, $2.0 million, $0.1 million and$0.1 million with related parties for theSuccessor year ended December 31, 2015and Period ended December 31, 2014, andthe Predecessor Period ended March 31,2014 and year ended December 31, 2013,respectively) . . . . . . . . . . . . . . . . . . . . . . . . . . 38,958 28,708 7,679 28,620
Selling, general and administrative . . . . . . . . . . . 56,998 29,465 10,203 35,109Acquisition and integration . . . . . . . . . . . . . . . . . — 9,297 12,420 —Impairment of goodwill . . . . . . . . . . . . . . . . . . . . . 9,313 — — —Depreciation . . . . . . . . . . . . . . . . . . . . . . . . . . . . . 6,379 4,610 1,832 6,665Amortization . . . . . . . . . . . . . . . . . . . . . . . . . . . . . 63,142 56,422 5,199 23,854
Total operating expenses . . . . . . . . . . . . . . . . 338,497 246,052 76,092 214,027
Income from operations . . . . . . . . . . . . . . . . . . . . . . . 20,562 2,447 1,837 58,863Other (expense) income, net:
Miscellaneous (expense) income, net . . . . . . . . . . (1,133) (301) 1,213 (1,718)Interest expense, net . . . . . . . . . . . . . . . . . . . . . . (27,259) (23,185) (3,272) (18,000)
Total other expense, net . . . . . . . . . . . . . . . . . (28,392) (23,486) (2,059) (19,718)
(Loss) income before income taxes . . . . . . . . . . . . . . (7,830) (21,039) (222) 39,145Income tax provision (benefit) . . . . . . . . . . . . . . . . . . 843 (6,703) 1,014 14,301
Net (loss) income . . . . . . . . . . . . . . . . . . . . . . . . . . . . $ (8,673) $ (14,336) $ (1,236) $ 24,844
Net (loss) income per share attributable to commonshareholders:Basic . . . . . . . . . . . . . . . . . . . . . . . . . . . . . . . . . . $ (0.28) $ (0.46) $ (0.05) $ 0.99Diluted . . . . . . . . . . . . . . . . . . . . . . . . . . . . . . . . . $ (0.28) $ (0.46) $ (0.05) $ 0.95
Weighted average common shares outstanding:Basic . . . . . . . . . . . . . . . . . . . . . . . . . . . . . . . . . . 31,346,019 30,869,244 25,047,188 25,204,079Diluted . . . . . . . . . . . . . . . . . . . . . . . . . . . . . . . . .
31,346,019 30,869,244 25,047,188 26,150,149
See notes to consolidated financial statements.
F-4

MEDPACE HOLDINGS, INC. AND SUBSIDIARIES
CONSOLIDATED STATEMENTS OF COMPREHENSIVE (LOSS) INCOME(Amounts in thousands)
SUCCESSOR PREDECESSOR
YEAR ENDEDDECEMBER 31,
2015
PERIOD FROMAPRIL 1, 2014
THROUGHDECEMBER 31,
2014
PERIOD FROMJANUARY 1, 2014
THROUGHMARCH 31,
2014
YEAR ENDEDDECEMBER 31,
2013
Net (loss) income . . . . . . . . . . . . . . . . . . . . . . . $(8,673) $(14,336) $(1,236) $24,844Other comprehensive loss:
Foreign currency translation adjustments,net of taxes . . . . . . . . . . . . . . . . . . . . . . . (999) (1,560) (11) (32)
Comprehensive (loss) income . . . . . . . . . . . . . . $(9,672) $(15,896) $(1,247) $24,812
See notes to consolidated financial statements.
F-5

MEDPACE HOLDINGS, INC. AND SUBSIDIARIES
CONSOLIDATED STATEMENTS OF SHAREHOLDERS’ EQUITY(Amounts in thousands)
COMMONSTOCK
ADDITIONALPAID-INCAPITAL
(ACCUMULATEDDEFICIT)
RETAINEDEARNINGS
ACCUMULATEDOTHER
COMPREHENSIVEINCOME (LOSS) TOTAL
BALANCE—January 1, 2013—Predecessor . . . . . $ 25 $ 250,843 $(28,721) $(1,331) $ 220,816Net income . . . . . . . . . . . . . . . . . . . . . . . . . . . 24,844 24,844Foreign currency translation . . . . . . . . . . . . . . (32) (32)Stock issued . . . . . . . . . . . . . . . . . . . . . . . . . . 1,177 1,177Stock options exercised . . . . . . . . . . . . . . . . . . 452 452Stock-based compensation expense . . . . . . . . 1,958 1,958Excess tax benefit from stock-based
compensation . . . . . . . . . . . . . . . . . . . . . . . 16 16
BALANCE—December 31, 2013—Predecessor . . $ 25 $ 254,446 $ (3,877) $(1,363) $ 249,231Net loss . . . . . . . . . . . . . . . . . . . . . . . . . . . . . . (1,236) (1,236)Foreign currency translation . . . . . . . . . . . . . . (11) (11)Stock options exercised . . . . . . . . . . . . . . . . . . 2 15,219 15,221Stock-based compensation expense . . . . . . . . 7,340 7,340Excess tax benefit from stock-based
compensation . . . . . . . . . . . . . . . . . . . . . . . 5,270 5,270
BALANCE—March 31, 2014—Predecessor . . . . . $ 27 $ 282,275 $ (5,113) $(1,374) $ 275,815Close Predecessor shareholders’ equity at the
acquisition date . . . . . . . . . . . . . . . . . . . . . (27) (282,275) 5,113 1,374 (275,815)Stock issued . . . . . . . . . . . . . . . . . . . . . . . . . . 307 413,693 414,000
BALANCE—April 1, 2014—Successor . . . . . . . . . $307 $ 413,693 $ — $ — $ 414,000Net loss . . . . . . . . . . . . . . . . . . . . . . . . . . . . . . (14,336) (14,336)Foreign currency translation . . . . . . . . . . . . . . (1,560) (1,560)Stock-based compensation expense . . . . . . . . 6 3,051 3,057Excess tax benefit from stock-based
compensation . . . . . . . . . . . . . . . . . . . . . . . 809 809
BALANCE—December 31, 2014—Successor . . . $313 $ 417,553 $(14,336) $(1,560) $ 401,970Net loss . . . . . . . . . . . . . . . . . . . . . . . . . . . . . . (8,673) (8,673)Stock issued . . . . . . . . . . . . . . . . . . . . . . . . . . 1 607 608Foreign currency translation . . . . . . . . . . . . . . (999) (999)Stock-based compensation expense . . . . . . . . 12 21,115 21,127Stock options exercised . . . . . . . . . . . . . . . . . . 250 250Tax benefit deficiency from stock-based
compensation . . . . . . . . . . . . . . . . . . . . . . . (809) (809)
BALANCE—December 31, 2015—Successor . . . $326 $ 438,716 $(23,009) $(2,559) $ 413,474
See notes to consolidated financial statements.
F-6

MEDPACE HOLDINGS, INC. AND SUBSIDIARIES
CONSOLIDATED STATEMENTS OF CASH FLOWS(Amounts in thousands)
SUCCESSOR PREDECESSOR
YEAR ENDEDDECEMBER 31,
2015
PERIOD FROMAPRIL 1, 2014
THROUGHDECEMBER 31,
2014
PERIOD FROMJANUARY 1, 2014
THROUGHMARCH 31,
2014
YEAR ENDEDDECEMBER 31,
2013
CASH FLOWS FROM OPERATING ACTIVITIES:Net (loss) income . . . . . . . . . . . . . . . . . . . . . . . . . . . . . . . . . . . . $ (8,673) $ (14,336) $ (1,236) $ 24,844Adjustments to reconcile net (loss) income to net cash provided
by operating activities:Depreciation . . . . . . . . . . . . . . . . . . . . . . . . . . . . . . . . . . . . . . 6,379 4,610 1,832 6,665Amortization . . . . . . . . . . . . . . . . . . . . . . . . . . . . . . . . . . . . . . 63,142 56,422 5,199 23,854Stock-based compensation expense . . . . . . . . . . . . . . . . . . . . . 22,324 5,423 7,340 1,958Amortization of debt issuance costs and discount . . . . . . . . . . 2,687 2,064 371 1,918Loss on extinguishment of debt . . . . . . . . . . . . . . . . . . . . . . . . — — — 1,523Deferred income tax (benefit) provision . . . . . . . . . . . . . . . . . . (12,690) (9,557) 300 5,982Impairment of goodwill . . . . . . . . . . . . . . . . . . . . . . . . . . . . . . 9,313 — — —Loss on the sale of cost method investment . . . . . . . . . . . . . . — — — 2,250Other . . . . . . . . . . . . . . . . . . . . . . . . . . . . . . . . . . . . . . . . . . . . (242) (225) (721) 209
Changes in assets and liabilities:Restricted cash . . . . . . . . . . . . . . . . . . . . . . . . . . . . . . . . . . . . (1,753) 544 (400) 438Accounts receivable, net and unbilled services . . . . . . . . . . . . 337 (1,103) (10,543) 1,604Prepaid expenses and other current assets . . . . . . . . . . . . . . . (181) (846) (4,617) 4,760Accounts payable . . . . . . . . . . . . . . . . . . . . . . . . . . . . . . . . . . . 2,481 558 13,708 628Accrued expenses . . . . . . . . . . . . . . . . . . . . . . . . . . . . . . . . . . 320 10,987 (4,957) 8,335Pre-funded study costs . . . . . . . . . . . . . . . . . . . . . . . . . . . . . . 9,981 299 1,561 1,691Advanced billings . . . . . . . . . . . . . . . . . . . . . . . . . . . . . . . . . . . (7,002) 5,995 6,330 10,651Other assets and liabilities, net . . . . . . . . . . . . . . . . . . . . . . . . (2,306) 1,704 (1,360) 832
Net cash provided by operating activities 84,117 62,539 12,807 98,142
CASH FLOWS FROM INVESTING ACTIVITIES:Property and equipment expenditures . . . . . . . . . . . . . . . . . . . . . (6,465) (4,225) (1,090) (4,561)Acquisition of Predecessor, net of cash received . . . . . . . . . . . . . — (903,453) — —Other . . . . . . . . . . . . . . . . . . . . . . . . . . . . . . . . . . . . . . . . . . . . . . 33 38 263 89
Net cash used in investing activities . . . . . . . . . . . . . . . . . . (6,432) (907,640) (827) (4,472)
CASH FLOWS FROM FINANCING ACTIVITIES:Proceeds from sale of common stock . . . . . . . . . . . . . . . . . . . . . 608 414,000 — 1,177Proceeds from stock option exercises . . . . . . . . . . . . . . . . . . . . . 250 — — 452Excess tax benefit from stock-based compensation . . . . . . . . . . . — 809 5,270 16Proceeds from issuance of debt, net of original issue
discount . . . . . . . . . . . . . . . . . . . . . . . . . . . . . . . . . . . . . . . . . . — 527,350 — —Payment of debt . . . . . . . . . . . . . . . . . . . . . . . . . . . . . . . . . . . . . (116,055) (25,217) (23,073) (96,431)Proceeds from revolving loan . . . . . . . . . . . . . . . . . . . . . . . . . . . . — 1,575 — —Payment of revolving loan . . . . . . . . . . . . . . . . . . . . . . . . . . . . . . — (1,575) — —Debt issuance costs . . . . . . . . . . . . . . . . . . . . . . . . . . . . . . . . . . . — (15,487) — (1,065)Payment of deemed landlord liability . . . . . . . . . . . . . . . . . . . . . (1,292) (1,284) (165) —
Net cash (used in) provided by financing activities . . . . . . . (116,489) 900,171 (17,968) (95,851)
EFFECTS OF EXCHANGE RATES ON CASH AND CASHEQUIVALENTS . . . . . . . . . . . . . . . . . . . . . . . . . . . . . . . . . . . . . . (601) (785) (25) 159
(DECREASE) INCREASE IN CASH AND CASH EQUIVALENTS . . . (39,405) 54,285 (6,013) (2,022)CASH AND CASH EQUIVALENTS—Beginning of period . . . . . . . . . 54,285 — 23,858 25,880
CASH AND CASH EQUIVALENTS—End of period . . . . . . . . . . . . . $ 14,880 $ 54,285 $ 17,845 $ 23,858
SUPPLEMENTAL DISCLOSURE OF CASH FLOWINFORMATION—Cash paid during the period for income taxes . . . . . . . . . . . . . . . $ 10,552 $ 4,513 $ 125 $ 5,784
Cash paid during the period for interest . . . . . . . . . . . . . . . . . . . $ 24,435 $ 21,060 $ 2,961 $ 16,223
Acquisition of property and equipment—non-cash . . . . . . . . . . . $ 176 $ 153 $ 312 $ 376
See notes to consolidated financial statements.
F-7

MEDPACE HOLDINGS, INC. AND SUBSIDIARIES
NOTES TO CONSOLIDATED FINANCIAL STATEMENTS
As of December 31, 2015 and 2014, and for the Year Ended December 31, 2015, the Periods April 1, 2014through December 31, 2014 and January 1, 2014 through March 31, 2014, and the Year Ended December 31,2013.
1. DESCRIPTION OF BUSINESS
Medpace Holdings, Inc. together with its subsidiaries, (the “Company” or “Medpace”), a Delaware Corporation, is aglobal provider of clinical research-based drug and medical device development services. The Company partners withpharmaceutical, biotechnology, and medical device companies in the development and execution of clinical trials.The Company’s drug development services focus on full service Phase I-IV clinical development services and includedevelopment plan design, central laboratory, project management, regulatory affairs, clinical monitoring, datamanagement and analysis, pharmacovigilance new drug application submissions, and post-marketing clinicalsupport. The Company also provides coordinated central laboratory services, bio-analytical laboratory services,clinical human pharmacology, imaging services, and electrocardiography reading support for clinical trials.
The Company’s operations are principally based in North America, Europe, and Asia.
2. CHANGE IN CONTROL
In February 2014, investment funds managed by Cinven Capital Management (V) General Partner Limited(“Cinven”), a private equity firm, incorporated Scioto Holdings, Inc. in the first of multiple steps that would result ina change of control for the Company. Pursuant to the terms and conditions of the Agreement and Plan of Merger (the“Merger Agreement”) dated February 22, 2014, Scioto Holdings, Inc. (the “Successor”), through its wholly ownedsubsidiary Scioto Acquisition, Inc. (the “Purchaser”) and the Purchaser’s wholly owned subsidiary Scioto MergerSub, Inc. (the “Merger Sub”), purchased 100% of the outstanding shares of Medpace Holdings, Inc.(“Predecessor”) for an aggregate purchase price of $921.3 million on April 1, 2014 (the “Transaction”). Per theterms of a Contribution and Subscription Agreement, Medpace Investors, LLC (“Medpace Investors” or “MPI”),owned by certain employees of the Company, agreed to contribute shares held in the Predecessor in exchange for apercentage stake in the Successor. The Transaction was financed through the sale of the Successor’s equity anddebt financing under a new credit facility entered into by Merger Sub as the initial borrower. Upon Transactionconsummation, Merger Sub ceased to exist and Medpace Holdings, Inc. became the borrower under the creditfacility. The proceeds from the transaction were used to purchase Predecessor’s equity interests, extinguish debtwhich had immediately come due as a result of the change in control, and pay Predecessor’s acquisition-relatedselling expenses. The Predecessor’s acquisition-related selling expenses of $12.4 million, including $10.1 millionrelated to success based advisory fees, are reflected in the Acquisition and integration expense line in theconsolidated statement of operations for the Predecessor January 1 through March 31, 2014 period. TheSuccessor’s acquisition-related buying expenses of $9.3 million, including $3.3 million related to success basedadvisory fees, are reflected in the Acquisition and integration expense line in the consolidated statement ofoperations for the Successor April 1, 2014 through December 31, 2014 period.
Prior to the Transaction, CCMP Capital (“CCMP”), a private equity firm, held 80% of the Predecessor’s equityinterests and the noncontrolling interests were held by certain current and former members of management, alongwith former members of the Board of Directors of Medpace, Inc., a wholly owned subsidiary of Medpace Holdings,Inc.
F-8

The sources and uses of the purchase price consideration were as follows (in thousands):
Sources of cash consideration:Sale of Successor common Stock . . . . . . . . . . . . . . . . . . . . . . . . . . . . . . . . . . . . . . . . . . . . . . . . . . . . . $414,000Long-term debt issuance . . . . . . . . . . . . . . . . . . . . . . . . . . . . . . . . . . . . . . . . . . . . . . . . . . . . . . . . . . . . 530,000Revolving loan . . . . . . . . . . . . . . . . . . . . . . . . . . . . . . . . . . . . . . . . . . . . . . . . . . . . . . . . . . . . . . . . . . . . 1,575Original issue discount . . . . . . . . . . . . . . . . . . . . . . . . . . . . . . . . . . . . . . . . . . . . . . . . . . . . . . . . . . . . . (2,650)Loan origination fees . . . . . . . . . . . . . . . . . . . . . . . . . . . . . . . . . . . . . . . . . . . . . . . . . . . . . . . . . . . . . . . (15,487)
Debt proceeds, net . . . . . . . . . . . . . . . . . . . . . . . . . . . . . . . . . . . . . . . . . . . . . . . . . . . . . . . . . . . . . . . . 513,438
Total sources of consideration paid . . . . . . . . . . . . . . . . . . . . . . . . . . . . . . . . . . . . . . . . . . . . . . . . . . . . $927,438
Uses of cash consideration:Purchase of Predecessor common stock . . . . . . . . . . . . . . . . . . . . . . . . . . . . . . . . . . . . . . . . . . . . . . . . $780,829Proceeds from stock option exercise . . . . . . . . . . . . . . . . . . . . . . . . . . . . . . . . . . . . . . . . . . . . . . . . . . . (15,221)Payment of Predecessor debt . . . . . . . . . . . . . . . . . . . . . . . . . . . . . . . . . . . . . . . . . . . . . . . . . . . . . . . . 143,728Payment of Predecessor’s selling expenses . . . . . . . . . . . . . . . . . . . . . . . . . . . . . . . . . . . . . . . . . . . . . . 11,962
Total uses of consideration paid . . . . . . . . . . . . . . . . . . . . . . . . . . . . . . . . . . . . . . . . . . . . . . . . . . . . . . $921,298
The excess cash generated from the transaction of $6.1 million is not considered purchase price consideration asthe funds were used to pay a portion of the Successor’s acquisition related expenses. The Successor’s acquisitionrelated expenses are reflected in the Acquisition and integration expense line in the consolidated statements ofoperations for the period ended December 31, 2014.
In May 2014, Scioto Holdings, Inc. was renamed Medpace Holdings, Inc. (“Successor”). Furthermore, thePredecessor Medpace Holdings, Inc. was merged with another wholly owned subsidiary and renamed MedpaceIntermediateCo, Inc. For the avoidance of doubt and for purposes of these consolidated financial statements,Successor refers to the consolidated Medpace Holdings reporting entity after the Transaction and Predecessor refersto the consolidated Medpace Holdings reporting entity prior to the Transaction.
Immediately following the Transaction, Cinven and Medpace Investors owned approximately 75% and 25%,respectively, of the Successor entity.
F-9

The following table reconciles the fair value of the assets acquired and liabilities assumed to the total purchase price(in thousands):
Assets acquired:Cash and cash equivalents . . . . . . . . . . . . . . . . . . . . . . . . . . . . . . . . . . . . . . . . . . . . . . . . . . . . . . . . . $ 17,845Restricted cash . . . . . . . . . . . . . . . . . . . . . . . . . . . . . . . . . . . . . . . . . . . . . . . . . . . . . . . . . . . . . . . . . 1,648Accounts receivable . . . . . . . . . . . . . . . . . . . . . . . . . . . . . . . . . . . . . . . . . . . . . . . . . . . . . . . . . . . . . . 39,311Unbilled services . . . . . . . . . . . . . . . . . . . . . . . . . . . . . . . . . . . . . . . . . . . . . . . . . . . . . . . . . . . . . . . . 13,065Reimbursable pass-through expenses . . . . . . . . . . . . . . . . . . . . . . . . . . . . . . . . . . . . . . . . . . . . . . . . 12,184Prepaid expenses and other current assets . . . . . . . . . . . . . . . . . . . . . . . . . . . . . . . . . . . . . . . . . . . . 12,205Property and equipment . . . . . . . . . . . . . . . . . . . . . . . . . . . . . . . . . . . . . . . . . . . . . . . . . . . . . . . . . . . 39,661Goodwill . . . . . . . . . . . . . . . . . . . . . . . . . . . . . . . . . . . . . . . . . . . . . . . . . . . . . . . . . . . . . . . . . . . . . . . 670,294Intangible assets . . . . . . . . . . . . . . . . . . . . . . . . . . . . . . . . . . . . . . . . . . . . . . . . . . . . . . . . . . . . . . . . 306,307Deferred income taxes . . . . . . . . . . . . . . . . . . . . . . . . . . . . . . . . . . . . . . . . . . . . . . . . . . . . . . . . . . . . 26,246Other assets . . . . . . . . . . . . . . . . . . . . . . . . . . . . . . . . . . . . . . . . . . . . . . . . . . . . . . . . . . . . . . . . . . . . 3,237
Total assets acquired . . . . . . . . . . . . . . . . . . . . . . . . . . . . . . . . . . . . . . . . . . . . . . . . . . . . . . . . . . 1,142,003Liabilities assumed:
Accounts payable and accrued expenses . . . . . . . . . . . . . . . . . . . . . . . . . . . . . . . . . . . . . . . . . . . . . . 16,608Pre-funded study costs . . . . . . . . . . . . . . . . . . . . . . . . . . . . . . . . . . . . . . . . . . . . . . . . . . . . . . . . . . . 36,483Advanced billings . . . . . . . . . . . . . . . . . . . . . . . . . . . . . . . . . . . . . . . . . . . . . . . . . . . . . . . . . . . . . . . . 52,475Deemed landlord liability . . . . . . . . . . . . . . . . . . . . . . . . . . . . . . . . . . . . . . . . . . . . . . . . . . . . . . . . . . 34,251Debt . . . . . . . . . . . . . . . . . . . . . . . . . . . . . . . . . . . . . . . . . . . . . . . . . . . . . . . . . . . . . . . . . . . . . . . . . . 1,551Deferred income taxes . . . . . . . . . . . . . . . . . . . . . . . . . . . . . . . . . . . . . . . . . . . . . . . . . . . . . . . . . . . . 69,448Other liabilities . . . . . . . . . . . . . . . . . . . . . . . . . . . . . . . . . . . . . . . . . . . . . . . . . . . . . . . . . . . . . . . . . 9,889
Total liabilities assumed . . . . . . . . . . . . . . . . . . . . . . . . . . . . . . . . . . . . . . . . . . . . . . . . . . . . . . . . 220,705
Net assets acquired . . . . . . . . . . . . . . . . . . . . . . . . . . . . . . . . . . . . . . . . . . . . . . . . . . . . . . . . . . . $ 921,298
The Company accounts for acquisitions using the acquisition method of accounting. The Successor consolidatedfinancial statements reflect the final allocation of the aggregate purchase price of $921.3 million to the assetsacquired and liabilities assumed based on fair values at the date of the Transaction. The fair values assigned toidentifiable intangible assets acquired were determined primarily by using an income approach which was based onassumptions and estimates made by management. Significant assumptions utilized in the income approach werebased on company-specific information and projections, which are not observable in the market and are thusconsidered Level 3 measurements by authoritative guidance. The excess of the purchase price over the fair value ofthe assets acquired and liabilities assumed has been recorded as goodwill and represents the estimated futureeconomic benefits arising from other assets acquired that could not be individually identified and separatelyrecognized such as assembled workforce and growth opportunities.
The Merger Agreement includes certain indemnifications between the sellers (led by CCMP) and the buyers (led byCinven) with regards to Predecessor contingencies that arise after the Transaction and through April 1, 2015, as wellas tax payments or refunds that are finalized after April 1, 2014 but which relate to periods prior to the Transaction.The Successor had $0.3 and $0.9 million in Prepaid expenses and other current assets and $0.5 and $0.8 millionin Other assets on the consolidated balance sheets at December 31, 2015 and 2014, respectively, associated withrefunds due from various taxing authorities that were generated in a Predecessor period. The Successor had $1.4and $5.2 million in Other current liabilities and $0.5 and $0.9 million in Other long-term liabilities on theconsolidated balance sheets at December 31, 2015 and 2014, associated with the anticipated settlement of theseitems, net of consulting fees and related tax, and other tax refunds received by the Successor Company prior toDecember 31, 2015 and 2014, respectively.
Immediately prior to the Transaction, the Predecessor Company’s Board of Directors approved a plan to acceleratethe vesting on unvested stock options and restricted share awards.
F-10

3. SUMMARY OF SIGNIFICANT ACCOUNTING POLICIES
Principles of Consolidation and PresentationThe accompanying consolidated financial statements have been prepared in accordance with generally acceptedaccounting principles in the United States of America (“US GAAP”) and include the accounts and operations of theCompany and its subsidiaries. All intercompany accounts and transactions have been eliminated in consolidation.
The Company’s consolidated balance sheets as of December 31, 2015 and 2014 and its related statements ofoperations, comprehensive (loss) income, shareholders’ equity, and cash flows presented subsequent to theTransaction for the year ended December 31, 2015 and the period from April 1 through December 31, 2014 arereferenced herein as the successor financial statements (the “Successor” or “Successor Financial Statements”). Theperiod April 1 through December 31, 2014 is referenced herein as the “Successor Period ended December 31,2014.” The Company’s consolidated statements of operations, comprehensive (loss) income, shareholders’ equityand cash flows for the period from January 1 through March 31, 2014 and the year ended December 31, 2013 arereferenced herein as the predecessor financial statements (the “Predecessor” or “Predecessor FinancialStatements”). The January 1 through March 31, 2014 period is referenced herein as the “Predecessor Period endedMarch 31, 2014.”
ReclassificationsThe Company reclassified certain expenses from Miscellaneous (expense) income, net to Selling, general andadministrative in the consolidated statements of operations to more appropriately reflect the nature of the expenseitems in the Successor Period ended December 31, 2014, the Predecessor period ended March 31, 2014 and thePredecessor year ended December 31, 2013, respectively. These changes have no impact on previously reportedtotal revenue, net (loss) income, total comprehensive (loss) income, total assets, total liabilities, and shareholders’equity.
Use of EstimatesThe preparation of financial statements in conformity with US GAAP requires management to make estimates andassumptions that affect the amounts reported in the consolidated financial statements and accompanying notes.Actual results could differ from these estimates.
Significant items that are subject to management estimates and assumptions include service revenue, net,allowances for doubtful accounts, acquisition purchase price allocations, long-lived asset impairment and usefullives, exit liabilities, the valuation of share-based compensation, uncertain income tax positions and contingencies.
Stock SplitOn July 25, 2016, the Board of Directors of the Company approved, and made legally effective, a 1-for-1.35 reversestock split of the Company’s common stock. All share, stock option and per share information presented in theSuccessor consolidated financial statements have been adjusted to reflect the reverse stock split on a retroactivebasis for all periods presented. The Company will make a cash payment to shareholders for all fractional shareswhich would have otherwise been required to be issued as a result of the reverse stock split. There was no change innumber of authorized shares or the par value of the Company’s common stock.
Reportable SegmentsThe Company emphasizes its full service outsourcing model, providing services focused on the development,management and execution of clinical trials. As part of this full service approach, the Company utilizes centralizedsystems, customer interface technology, support functions and processes that cross service offerings and alignresources to deliver efficient clinical trial services. Given the full service approach, the chief executive officer, who isthe chief operating decision maker (“CODM”) assesses the allocation of resources based on key metrics includingrevenue, backlog, and net awards by service offering and consolidated profitability and consolidated cash flows.Based on the Company’s full service model, internal management and reporting structure, and key metrics used bythe CODM to make resource allocation decisions, management has determined that the Company’s operationsconsist of a single operating segment. Therefore, results of operations are presented as a single reportable segment.
Foreign CurrenciesAssets and liabilities recorded in foreign currencies on foreign subsidiary financial statements are translated at theexchange rate on the balance sheet date, while equity accounts are translated at historical exchange rates. Revenue
F-11

and expenses are recorded at average rates of exchange during the year. Translation adjustments are recorded toAccumulated other comprehensive loss in the consolidated statements of shareholders’ equity and consolidatedstatements of comprehensive (loss) income.
Separately, net realized gains and losses on foreign currency transactions are included in Miscellaneous (expense)income, net, on the consolidated statements of operations. Foreign currency transactions resulted in net losses of$1.3 million, $1.2 million, $0.1 million and $0.3 million during the Successor year ended December 31, 2015, theSuccessor Period ended December 31, 2014, the Predecessor Period ended March 31, 2014 and the Predecessoryear ended December 31, 2013, respectively.
Revenue RecognitionThe Company generally enters into contracts with customers to provide services ranging in duration from a fewmonths to several years. The contract terms generally provide for payments based on a fixed fee or unit-of-servicearrangement. Revenue on these arrangements is recognized when there is persuasive evidence of an arrangement,the service offering has been delivered to the customer, the arrangement consideration is determinable and thecollection of the fees is reasonably assured.
The Company recognizes revenue for services provided on fixed fee arrangements based on the proportionalperformance methodology, which is determined by assessing the proportion of performance completed or delivered todate compared to total specific measures to be delivered or completed under the terms of the arrangement. Themeasures utilized to assess performance are specific to the service provided, and the Company generally comparesthe ratio of hours completed to the total estimated hours necessary to complete the contract. A detailed projectbudget by hours is developed based on many factors, including but not limited to the scope of the work, thecomplexity of the study, the participating geographic locations, and the Company’s historical experience.Management believes the reporting and estimation of hours is the best available measure of progress on many of theservices provided and best reflects the pattern in which obligations to customers are fulfilled. To assist with theestimation of hours expected to complete a project, regular contract reviews for each project are performed in whichperformance to date is compared to the most current estimate to complete assumptions. The reviews include anassessment of effort incurred to date compared to expectations based on budget assumptions and othercircumstances specific to the project. The total estimated hours necessary to complete a fixed-fee contract, based onthese reviews, are updated and any revisions to the existing hours budget result in cumulative adjustments to theamount of revenue recognized in the period in which the revisions are identified.
Fixed-fee contracts provide for pricing modifications upon scope of work changes. The Company recognizes revenuerelated to work performed in connection with scope changes when the underlying services are performed, a bindingcontractual commitment has been executed with the customer and collectability is reasonably assured. Costs are notdeferred in anticipation of contracts being awarded or amendments being finalized, but are expensed as incurred.
For unit-of-service arrangements, the Company recognizes revenue in the period in which the unit is delivered.Service unit elements largely consist of various project management, consulting and analytical testing services.
Many contractual arrangements combine multiple service elements. For these contracts, arrangement considerationis allocated to identified units of account based on the relative selling price of each unit of account. The bestevidence of selling price of a unit of account is vendor specific objective evidence (“VSOE”), which is the pricecharged when the deliverable is sold separately. When VSOE is not available to determine selling price, managementuses relative third party evidence, if available. When neither VSOE nor third party evidence of selling price exists,management uses its best estimate of selling price considering all relevant information that is available.
Most contracts are terminable by the customer, either immediately or according to advance notice terms specifiedwithin the contracts. These contracts require payment of fees to the Company for services rendered through the dateof termination and may require payment for subsequent services necessary to conclude the study or close out thecontract. Final settlement amounts are typically subject to negotiation with the customer. These amounts areincluded in Service revenue, net when realization is reasonably assured.
The Company occasionally enters into volume rebate arrangements with customers that provide for rebates if certainspecified spending thresholds are met. These rebate obligations are recorded as a reduction of revenue when it
F-12

appears probable that the customer will earn the rebates and the related amount is estimable. Service revenue ispresented net of rebates of $0.1 million, $0.4 million, $0.1 million and $0.7 million in the consolidated statementsof operations during the Successor year ended December 31, 2015, the Successor Period ended December 31,2014, the Predecessor Period ended March 31, 2014 and the Predecessor year ended December 31, 2013.
The Company records revenue net of any tax assessments by governmental authorities that are imposed andconcurrent with specific revenue generating transactions.
Concentration of Credit RiskFinancial instruments that subject the Company to credit risk primarily consist of cash and cash equivalents andaccounts receivable. The cash and cash equivalent balances are held and maintained with financial institutions withreputable credit ratings and, consequently, the Company believes that such funds are subject to minimal credit risk.
The Company generally does not require collateral or other securities to support customer receivables. In theSuccessor year ended December 31, 2015, the Successor Period ended December 31, 2014, the PredecessorPeriod ended March 31, 2014 and the Predecessor year ended December 31, 2013, credit losses have beenimmaterial and within management’s expectations. At December 31, 2015 and 2014, there were no customersaccounting for more than 10% of the Company’s accounts receivable.
Costs and ExpensesDirect costs, excluding depreciation and amortization, include direct labor and related employee benefits, laboratorysupplies, and other expenses contributing to service delivery. Direct costs, excluding depreciation and amortization,are expensed as incurred and are not deferred in anticipation of contracts being awarded or finalization of changes inscope. Selling, general and administrative includes administrative payroll and related employee benefits, sales andmarketing expenses, administrative travel, and other expenses not directly related to service delivery. Rent, utilities,supplies, and software license expenses are allocated between Direct costs, excluding depreciation and amortization,and Selling, general and administrative based on the estimated contribution among service delivery and supportfunction efforts on a percentage basis. Depreciation and amortization is reported separately in the accompanyingconsolidated statements of operations. Costs of sales and marketing activities not subject to recovery pursuant tocustomer contracts, such as feasibility assessments and negotiation of contracts, are expensed as incurred andrecorded as a component of Selling, general and administrative in the accompanying consolidated statements ofoperations.
Advertising expenses are recorded as a component of Selling, general and administrative in the accompanyingconsolidated statements of operations. Total advertising expenses of $0.4 million, $0.2 million, $0.1 million, and$0.3 million were incurred during the Successor year ended December 31, 2015, the Successor Period endedDecember 31, 2014, the Predecessor Period ended March 31, 2014, and the Predecessor year endedDecember 31, 2013, respectively.
Reimbursed Out-of-Pocket ExpensesThe Company incurs on behalf of its clients various out-of-pocket expenditures including, but not limited to, travel,meetings, printing, and shipping and handling fees, which are reflected as a separate component of operatingexpenses and recorded in Reimbursed out-of-pocket expenses in the accompanying consolidated statements ofoperations. Reimbursements received are reflected in Reimbursed out-of-pocket revenue without mark-up or profit inthe consolidated statements of operations.
Fees paid to investigators and other disbursements in which the Company acts as an agent on behalf of the clientare recorded net in the consolidated statements of operations with no impact on the Company’s revenue or expenses.Funds received in advance of study expenditures are recorded as Pre-funded study cost liabilities on theconsolidated balance sheets. Any pre-funded amounts remaining at the conclusion of a study are returned to theclient. Pre-funded study cost disbursements of $114.4 million, $92.5 million, $30.9 million, and $104.6 millionwere made during the Successor year ended December 31, 2015, the Successor Period ended December 31, 2014,the Predecessor Period ended March 31, 2014, and the Predecessor year ended December 31, 2013, respectively.
Income TaxesThe Company’s consolidated U.S. federal income tax return is comprised of its U.S. subsidiaries and a small numberof its foreign subsidiaries. All foreign subsidiaries of the Company file tax returns in their local jurisdictions.
F-13

The Company provides for income taxes on all transactions that have been recognized in the consolidated financialstatements in accordance with accounting guidance governing income tax accounting. Accordingly, the impact ofchanges in income tax laws on deferred tax assets and deferred tax liabilities are recognized in net earnings in theperiod during which such changes are enacted.
The Company records deferred tax assets and liabilities based on temporary differences between the financialstatement bases and tax bases of assets and liabilities. Deferred tax assets are recorded for tax benefit carryforwardsusing tax rates anticipated to be in effect in the year in which the temporary differences are expected to reverse. If itdoes not appear more likely than not that the full value of a deferred tax asset will be realized, the Company recordsa valuation allowance against the deferred tax asset, with an offsetting charge to the Company’s income tax provisionor benefit. The value of the Company’s deferred tax assets is estimated based on, among other things, theCompany’s ability to generate a sufficient level of future taxable income. In estimating future taxable income, theCompany has considered both positive and negative evidence, such as historical and forecasted results of operations,and has considered the implementation of prudent and feasible tax planning strategies.
A provision has not been made for U.S. or additional foreign taxes on the undistributed portion of earnings of foreignsubsidiaries as those earnings of $10.4 million as of December 31, 2015, have been permanently reinvested.
The Company follows accounting guidance related to accounting for uncertainty in income taxes which requiressignificant judgment in determining what constitutes an individual tax position as well as assessing the possibleoutcome of each tax position. Changes in judgments as to recognition or measurement of tax positions can materiallyaffect the estimate of the effective tax rate, and, consequently, the Company’s consolidated financial results. TheCompany considers many factors when evaluating and estimating tax positions and tax benefits, which may requireperiodic adjustments and which may not accurately anticipate actual outcomes. In addition, the calculation of taxliabilities involves dealing with uncertainties in the application of complex tax regulations in a multitude ofjurisdictions. The Company determines its liability for uncertain tax positions globally. If the payment of theseamounts ultimately proves to be unnecessary, the reversal of liabilities would result in tax benefits being recognizedin the period when it is determined the liabilities are no longer necessary. If the calculation of the liability related touncertain tax positions proves to be more or less than the ultimate assessment, a tax expense or tax benefit wouldresult. Interest and penalties associated with uncertain tax positions are recognized as components of the Company’sIncome tax provision (benefit).
Research and Development CreditsResearch and development credits are available to the Company under tax laws in certain jurisdictions, based onqualifying research and development spend as defined under those tax laws. Certain tax jurisdictions providerefundable credits that are not wholly dependent on the Company’s income tax status or income tax position. Inthese circumstances the benefit of the credits is recorded as a reduction of operating expense. When they are whollydependent upon the Company’s income tax position, research and development credits are recognized as a reductionof income tax expense.
Stock-Based CompensationThe Company has stock-based employee compensation plans for which it incurs compensation expense.
Successor Equity AwardsThe Successor, coinciding with the Transaction, created an equity incentive plan for employees (the “SuccessorPlan”), providing for the future issuance of vested shares, stock options, restricted stock awards (“RSAs”) andrestricted stock units (“RSUs”) in Medpace Holdings, Inc.’s common stock (the “Successor Awards”). The SuccessorAwards are subject to either equity or liability-classification pursuant to the terms of the participant’s awardagreement and the Successor Plan based on accounting guidance which governs such transactions.
Stock-based compensation expense is calculated using the fair value method on the grant date. The Successorexpenses stock-based compensation using a graded vesting schedule. For liability-classified awards, the Companyrecords fair value adjustments up to and including the settlement date. Changes in the fair value of the stockcompensation liability that occur during the requisite service period are recognized as compensation cost over thevesting period. Changes in the fair value of the stock compensation liability that occur after the end of the requisiteservice period but before settlement, are compensation cost of the period in which the change occurs.
F-14

Stock-based compensation expense is allocated between Direct costs, excluding depreciation and amortization, andSelling, general and administrative in the consolidated statements of operations based on the underlyingclassification and scope of work for the employees receiving the Successor Awards. The stock-based compensationexpense represents awards ultimately expected to vest and, as such, has been reduced for estimated forfeitures.
Predecessor Equity AwardsThe Predecessor awards, consisting of stock options and restricted share awards, are equity-classified instrumentsbased on the terms of the Predecessor’s equity incentive plans and on accounting guidance which governs suchtransactions.
The Predecessor determined the fair value of stock options and restricted shares on the grant date and recognizedthe associated compensation expense, net of assumed forfeitures, according to a graded vesting schedule as therequisite services were rendered. Restricted shares and stock options vested ratably over three and four years,respectively, from the date of grant.
Net Income (Loss) Per ShareBasic and diluted earnings or loss per share (“EPS”) are computed using the two-class method, which is an earningsallocation that determines EPS for each class of common stock and participating securities according to dividendsdeclared and participation rights in undistributed earnings. The Successor Company’s RSAs are consideredparticipating securities because they are legally issued at the date of grant and holders are entitled to receive non-forfeitable dividends during the vesting term. Basic EPS is computed by dividing the Company’s net income or lossavailable to common shareholders by the weighted average number of common shares outstanding and, ifappropriate, participating securities outstanding during the period. Participating securities are included in the basicEPS denominator during periods when there is consolidated net income but excluded from the denominator duringperiods of a consolidated net loss as the shares have no contractual obligation to share in the Company’s losses. Thecomputation of diluted EPS includes additional common shares, such as unvested RSUs and stock options withexercise prices less than the average market price of the Company’s common stock during the period (“in-the-moneyoptions”), which would be considered outstanding under the treasury stock method. The treasury stock methodassumes that additional shares would have to be issued in cases where the exercise price of stock options is lessthan the value of the common stock being acquired because the cash proceeds received from the stock option holderwould not be sufficient to acquire that same number of shares. The Company does not compute diluted EPS in caseswhere the inclusion of such additional shares would be anti-dilutive in effect.
F-15

The following table provides a reconciliation of the denominators for the EPS calculations as well as additional sharedata that was excluded from the denominators when the additional shares had an anti-dilutive effect caused by theconsolidated net loss during the Successor year ended December 31, 2015, the Successor Period endedDecember 31, 2014 and the Predecessor Period ended March 31, 2014 (in thousands):
SUCCESSOR PREDECESSOR
YEAR ENDEDDECEMBER 31,
2015
PERIOD ENDEDDECEMBER 31,
2014
PERIOD ENDEDMARCH 31,
2014
YEAR ENDEDDECEMBER 31,
2013
Basic, weighted average shares:Common Shares . . . . . . . . . . . . . . . . . . . . . . . . 31,346 30,869 25,047 24,987RSAs . . . . . . . . . . . . . . . . . . . . . . . . . . . . . . . . — — — 217
Weighted average shares—basic . . . . . . . . . . . 31,346 30,869 25,047 25,204
Diluted, weighted average shares:RSUs, unvested . . . . . . . . . . . . . . . . . . . . . . . . — — — 55In-the-money options . . . . . . . . . . . . . . . . . . . . — — — 891
Weighted average shares—diluted . . . . . . . . . . 31,346 30,869 25,047 26,150
Exclusions from EPS denominator:Exclusions from basic, weighted average
shares:RSAs (no obligation to share in losses) . . . 574 250 237 —
Additional exclusions from diluted, weightedaverage shares:RSUs, unvested . . . . . . . . . . . . . . . . . . . . . 86 52 — —
Total anti-dilutive shares . . . . . . . . . . . . . . . . . 86 52 — —
Total shares excluded from diluted EPSdenominator . . . . . . . . . . . . . . . . . . . . . . . . 660 302 237 —
For the Successor year ended December 31, 2015 and Successor Period ended December 31, 2014, thecomputation of diluted EPS also excludes the effect of 1,794,709 and 1,091,048 stock options, respectively, dueto the Company’s net loss positions as well as the respective period’s average fair value of the Company’s commonstock exceeded the exercise prices. During the Predecessor Period ended March 31, 2014, there are no additionaldilutive shares as all stock options and restricted shares were vested, exercised, or terminated, as applicable, atperiod end.
Fair Value MeasurementsThe Company follows accounting guidance related to fair value measurements that defines fair value, establishes aframework for measuring fair value, and establishes a hierarchy for inputs used in measuring fair value. Thishierarchy maximizes the use of “observable” inputs and minimizes the use of unobservable inputs by requiring thatthe most observable inputs be used when available. The hierarchy specifies three levels based on the inputs, asfollows:
Level 1: Valuations based on quoted prices in active markets for identical assets or liabilities.
Level 2: Valuations based on directly observable inputs or unobservable inputs corroborated by market data.
Level 3: Valuations based on unobservable inputs supported by little or no market activity representingmanagement’s determination of assumptions of how market participants would price the assets or liabilities.
The fair value of financial instruments such as cash and cash equivalents, billed accounts receivable, net, unbilledservices, accounts payable, accrued expenses, and advanced billings approximate their carrying amounts due to theirshort term maturities.
F-16

The Company does not have any recurring fair value measurements as of December 31, 2015. There were notransfers between Level 1, Level 2, or Level 3 during the Successor year ended December 31, 2015, the SuccessorPeriod ended December 31, 2014, the Predecessor Period ended March 31, 2014, or the Predecessor year ended2013.
Non-Recurring Fair Value MeasurementsCertain assets are measured on the accompanying consolidated balance sheets at cost and are not remeasured to fairvalue on a recurring basis. Total assets carried on the balance sheet and not remeasured to fair value on a recurringbasis, identified as Level 3 measurements, as of December 31, 2015 are $693 million, comprised of $661 millionof goodwill and $32 million of identified indefinite-lived intangible assets. During 2015, the Company recognizedapproximately $9.3 million of impairment related to goodwill.
Cash and Cash Equivalents, including Restricted CashCash and cash equivalents, including restricted cash, are invested in demand deposits, all of which have an originalmaturity of three months or less. Restricted cash consists of customer funds received in advance and subject tospecific restrictions, as well as amounts placed in escrow for contingent payments resulting from acquisitions orother contractual arrangements. The Company includes changes in restricted cash balances as part of operatingactivities in the consolidated statements of cash flows.
In addition, Prepaid expenses and other current assets and Other assets in the consolidated balance sheets include$0.7 million and $0.8 million of cash held as collateral in support of a property mortgage in Leuven, Belgium atDecember 31, 2015 and 2014, respectively. The property mortgage was fully repaid during 2015 and the Companyreceived a full refund during the first quarter of 2016.
Accounts Receivable and Unbilled ServicesAccounts receivable represent amounts due from the Company’s customers who are concentrated primarily in thepharmaceutical, biotechnology, and medical device industries. Unbilled services represent service revenuerecognized to date that is currently not billable to the customer pursuant to contractual terms. In general, amountsbecome billable upon the achievement of negotiated contractual events or in accordance with predeterminedpayment schedules. Amounts classified to Unbilled services are those billable to customers within one year from therespective balance sheet date.
The Company grants credit terms to its customers prior to signing a service contract and monitors thecreditworthiness of its customers on an ongoing basis. The Company maintains an allowance for doubtful accountsbased on specific identification of accounts receivable that are at risk of not being collected. Uncollectible accountsreceivable are written off only after all reasonable collection efforts have been exhausted. Moreover, in some casesthe Company requires advance payment from its customers for a portion of the study contract price upon the signingof a service contract. These advance payments are deferred and recognized as revenue as services are performed.
InventoryInventory, which consists primarily of laboratory supplies, is valued at the lower of cost or market. Inventory is statedat purchased cost using the first-in, first out (FIFO) cost method. The inventory balance is included in Prepaidexpenses and other current assets in the consolidated balance sheets.
Property and EquipmentProperty and equipment is recorded at cost. Depreciation is provided on the straight-line method at rates adequateto allocate the cost of the applicable assets over their estimated useful lives, which is three to five years forcomputer hardware, software, phone, and medical imaging equipment, five to seven years for furniture and fixturesand other equipment, and thirty to forty years for buildings. The Company capitalizes costs of computer softwaredeveloped for internal use and amortizes these costs on a straight-line basis over the estimated useful life, not toexceed three years. Leasehold improvements and deemed assets from landlord building construction are capitalizedand amortized on a straight-line basis over the shorter of the estimated useful life of the improvement or theassociated remaining lease term. Repairs and maintenance are expensed as incurred.
LeasesThe Company leases facilities and equipment to be used in its operations, some of which require capitalization inaccordance with US GAAP. Upon the execution of new leases, the Company determines the appropriate
F-17

classification of the lease as operating or capital and reflects the impact of this classification in its consolidatedfinancial statements.
Goodwill and Intangible AssetsGoodwillGoodwill represents the excess of purchase price over the fair value of net assets acquired in business combinations.The carrying value of goodwill is reviewed at least annually for impairment, or as indicators of potential impairmentare identified, at the reporting unit level. The reporting units are Phase II-IV clinical research services, Laboratories,and Clinics as of December 31, 2015.
The Company performs its annual impairment tests during the fourth quarter each year, utilizing the quantitative twostep model defined by accounting guidance which governs such assessments. The first step involves the Companycomparing each of its reporting unit carrying values, inclusive of assigned goodwill, to their respective estimated fairvalues. Fair value is estimated using a combination of the income approach, a discounted cash flow analysis, andthe market approach, utilizing the guideline company method.
If the calculation in the first step results in any of the reporting units’ carrying values exceeding their respectiveestimated fair values, a second step is performed. The second step requires the Company to allocate the fair value ofthe reporting unit derived in the first step to the fair value of the reporting unit’s net assets. Any fair value in excessof amounts allocated to such net assets represent the implied fair value of goodwill for that reporting unit. Anyexcess of reporting unit carrying value of goodwill over the implied fair value of goodwill results in an impairment.The annual impairment test of goodwill performed in the fourth quarter of 2015 resulted in an impairment charge of$9.3 million related to the Company’s Clinics reporting unit.
Intangible AssetsThe Company has an indefinite lived intangible asset related to its trade name. The carrying value of the trade nameasset is reviewed at least annually for impairment, or as indicators of potential impairment are identified. TheCompany performs its annual impairment test in the fourth quarter each year in conjunction with its annualassessment of goodwill. The assessment consists of comparing the carrying value of the indefinite lived intangibleasset to its estimated fair value, utilizing the relief from royalty method, an income approach valuation. There was noindication of impairment related to the trade name asset based on the fourth quarter 2015 assessment.
Finite-lived intangible assets consist mainly of the value assigned to customer relationships, backlog and developedtechnologies. Finite-lived intangible assets are amortized straight-line or using an accelerated method over theirestimated useful lives, which range in term from seventeen months to fifteen years.
Impairment of Long-Lived AssetsLong-lived assets, primarily property and equipment and finite-lived intangible assets, are reviewed for impairmentand the reasonableness of the estimated useful lives whenever events or changes in circumstances indicate that thecarrying amounts of the assets may not be recoverable or that a change in useful life may be appropriate.Recoverability for long-lived assets is determined by comparing the forecasted undiscounted cash flows of theoperation to which the assets relate to the carrying amount of the assets. If the undiscounted cash flows are lessthan the carrying amount of the assets, then the Company reduces the carrying value of the assets to estimated fairvalues, which are primarily based upon forecasted discounted cash flows. Fair value of long-lived assets isdetermined based on a combination of discounted cash flows and market multiples.
Advanced BillingsAdvanced billings represents cash received from customers or billed amounts per an agreed upon payment schedulewhere cash has not been received in advance of services being performed or revenue being recognized.
Deemed Landlord LiabilitiesDeemed landlord liabilities are recorded at their net present value when the Company enters into qualifying leasesand are reduced as the Company makes periodic lease payments on the properties.
Other Current Liabilities and Other Long-Term LiabilitiesDeferred rent represents the cumulative additional portion of rent expense recognized on a straight line basis inconjunction with the Company’s current leases at the balance sheet date. The Company defers incentives received
F-18

from landlords for the purpose of making leasehold improvements. These liabilities are amortized as a component ofrent expense over the term of the respective lease.
Exit liabilities, if any exist, are recorded at their net present value to the extent the Company no longer receives anybenefit from the related property and when the Company has ceased all use of the property.
Asset retirement obligations, to the extent they exist, are recorded at their net present value and accreted to theCompany’s estimate of liability at the time the obligation would be required to be satisfied.
Recently Adopted Accounting StandardsIn April 2015, the Financial Accounting Standards Board (“FASB”) issued an Accounting Standards Update(“ASU”), ASU No. 2015-03, “Simplifying the Presentation of Debt Issuance Costs.” ASU No. 2015-03 requiresdebt issuance costs to be presented in the balance sheet as a direct deduction from the associated debt liability.ASU No. 2015-03 was to be effective for annual reporting periods beginning after December 15, 2015, and interimperiods within those fiscal years. The Company early adopted ASU No. 2015-03 during 2015 and as a result,$12.1 million in debt issuance costs previously reported in Other Assets were reclassified to Long-term Debt, net,less current portion, in the consolidated balance sheet at December 31, 2014. There was no impact to theCompany’s consolidated statements of operations, comprehensive (loss) income, shareholders’ equity or cash flows.
In November 2015, the FASB issued ASU No. 2015-17 “Balance Sheet Classification of Deferred Taxes.” ASUNo. 2015-17 requires entities to present deferred tax assets and deferred tax liabilities as noncurrent in a classifiedbalance sheet. ASU No. 2015-17 simplifies the current guidance, which requires entities to separately presentdeferred tax assets and deferred tax liabilities as current and noncurrent in a classified balance sheet. ASUNo. 2015-17 was to be effective for annual reporting periods beginning after December 15, 2016, and interimperiods within those annual periods. The Company early adopted ASU No. 2015-17 during 2015 and as a result,$3.3 million of Current deferred income tax assets were reclassified in the consolidated balance sheet atDecember 31, 2014. There was no impact to the Company’s consolidated statements of operations, comprehensive(loss) income, shareholders’ equity or cash flows.
Recently Issued Accounting StandardsIn May 2014, the FASB issued ASU No. 2014-09 ‘‘Revenue from Contracts with Customers,’’ to clarify theprinciples of recognizing revenue and create common revenue recognition guidance between GAAP and InternationalFinancial Reporting Standards. In July 2015, the FASB issued ASU 2015-14, “Revenue from Contracts withCustomers: Deferral of the Effective Date,” which delayed the effective date of ASU 2014-09 by one year andmodified the standard to allow early adoption. For public entities, the standard is now effective for reporting periodsbeginning after December 15, 2017. Earlier application is permitted only as of annual reporting periods beginningafter December 15, 2016, including interim reporting periods within that reporting period. Entities can transition tothe standard either retrospectively or as a cumulative-effect adjustment as of the date of adoption. The Company iscurrently assessing the potential impact of ASU No. 2014-09 on the Company’s consolidated financial statements.
In April 2014, the FASB issued amendments to ASC 205, “Presentation of Financial Statements—Going Concern,”through issuance of ASU 2014-15, “Disclosure of Uncertainties about an Entity’s Ability to Continue as a GoingConcern.” This ASU requires management to assess an entity’s ability to continue as a going concern byincorporating and expanding upon certain principles that are currently in U.S. auditing standards. The new guidanceis effective for fiscal years ending after December 15, 2016, and for annual periods and interim periods thereafter,with early adoption permitted. The Company does not anticipate that this ASU will have any impact on theconsolidated financial statements.
In April 2015, the FASB issued ASU No. 2015-05, “Customer’s Accounting for Fees Paid in a Cloud ComputingArrangement,” which provides guidance for a customer’s accounting for cloud computing costs. Under ASU 2015-05, if a software cloud computing arrangement contains a software license, customers should account for the licenseelement of the arrangement in a manner consistent with the acquisition of other software licenses. If thearrangement does not contain a software license, customers should account for the arrangement as a servicecontract. This standard may be applied either prospectively to all arrangements entered into or materially modifiedafter the effective date, or retrospectively. ASU 2015-05 is effective for fiscal years, and interim periods within
F-19

those fiscal years, beginning after December 15, 2015, and early adoption is permitted. The Company is currentlyevaluating the impact of the adoption of this standard on its consolidated financial statements.
4. ACCOUNTS RECEIVABLE BILLED, NET
Accounts receivable billed, net of allowance for doubtful accounts, consisted of the following at December 31 (inthousands):
SUCCESSOR
2015 2014
Accounts receivable, billed . . . . . . . . . . . . . . . . . . . . . . . . . . . . . . . . . . . . . . . . . . . . . . . . . . . . . $40,721 $52,733Reimbursable out-of-pocket expenses . . . . . . . . . . . . . . . . . . . . . . . . . . . . . . . . . . . . . . . . . . . . 7,355 5,590Less allowance for doubtful accounts . . . . . . . . . . . . . . . . . . . . . . . . . . . . . . . . . . . . . . . . . . . . . (1,724) (5,855)
Accounts receivable billed, net . . . . . . . . . . . . . . . . . . . . . . . . . . . . . . . . . . . . . . . . . . . . . . . $46,352 $52,468
A rollforward of allowance for doubtful account activity is as follows:
SUCCESSOR PREDECESSOR
YEAR ENDEDDECEMBER 31,
2015
PERIOD ENDEDDECEMBER 31,
2014
PERIOD ENDEDMARCH 31,
2014
Allowance for doubtful accounts—beginning balance . . . . . . . . . . $(5,855) $(5,595) $(5,573)Current year provision . . . . . . . . . . . . . . . . . . . . . . . . . . . . . . . . . . . (642) (624) (49)Write-offs and recoveries . . . . . . . . . . . . . . . . . . . . . . . . . . . . . . . . 4,773 364 27
Allowance for doubtful accounts—ending balance . . . . . . . . . . . . . $(1,724) $(5,855) $(5,595)
5. PROPERTY AND EQUIPMENT, NET
Property and equipment, net consisted of the following at December 31 (in thousands):
SUCCESSOR
2015 2014
Land . . . . . . . . . . . . . . . . . . . . . . . . . . . . . . . . . . . . . . . . . . . . . . . . . . . . . . . . . . . . . . . . . . . . . $ 940 $ 1,036Equipment . . . . . . . . . . . . . . . . . . . . . . . . . . . . . . . . . . . . . . . . . . . . . . . . . . . . . . . . . . . . . . . . . 8,218 6,773Furniture, fixtures, and leasehold improvements . . . . . . . . . . . . . . . . . . . . . . . . . . . . . . . . . . . . 8,563 6,515Computer hardware, software, and phone equipment . . . . . . . . . . . . . . . . . . . . . . . . . . . . . . . . 4,569 2,090Buildings . . . . . . . . . . . . . . . . . . . . . . . . . . . . . . . . . . . . . . . . . . . . . . . . . . . . . . . . . . . . . . . . . . 2,839 3,147Deemed assets from landlord building construction . . . . . . . . . . . . . . . . . . . . . . . . . . . . . . . . . 22,752 22,752Construction-in-progress . . . . . . . . . . . . . . . . . . . . . . . . . . . . . . . . . . . . . . . . . . . . . . . . . . . . . . 304 292
Property and equipment at cost . . . . . . . . . . . . . . . . . . . . . . . . . . . . . . . . . . . . . . . . . . . . . . 48,185 42,605Less: Accumulated depreciation . . . . . . . . . . . . . . . . . . . . . . . . . . . . . . . . . . . . . . . . . . . . . . . . (10,673) (4,521)
Property and equipment, net . . . . . . . . . . . . . . . . . . . . . . . . . . . . . . . . . . . . . . . . . . . . . . . . $ 37,512 $38,084
Depreciation expense, which includes amortization from capital leases, was $6.4 million for the year ended 2015,$4.6 million for Successor Period ended December 31, 2014, $1.8 million for the Predecessor Period endedMarch 31, 2014, and $6.7 million for the Predecessor year ended December 31, 2013.
In 2011, Medpace, Inc. entered into two multi-year lease agreements governing the future occupancy of additionaloffice space in Cincinnati, Ohio. The Company assumed occupancy of both spaces during 2012 and began making
F-20
lease payments at that time. The leases expire in 2027 and the Company has one 10-year option to extend the termof the leases.
In accordance with the accounting guidance related to leases, the Company was deemed in substance to be theowner of the property during the construction phase. The accounting guidance requires that a lessee be consideredthe owner of a real estate project during the construction period if a related party of the lessee is an owner of the realestate. Given that a related party of Medpace made an equity investment in the lessor, Medpace was considered theowner of the property for accounting purposes during the buildings’ construction. Accordingly, the Companyreflected the building and related liabilities as Deemed assets from landlord building construction (“DeemedAssets”) and Deemed landlord liabilities, respectively in the consolidated balance sheets. The Deemed Assets arebeing fully depreciated, on a straight line basis, over the 15-year term of the lease.
6. GOODWILL AND INTANGIBLE ASSETS
GoodwillThe changes in the carrying amount of goodwill are as follows (in thousands):
Balance as of December 31, 2013—Predecessor . . . . . . . . . . . . . . . . . . . . . . . . . . . . . . . . . . . . . . . . . . . $ 322,692
Balance as of March 31, 2014—Predecessor . . . . . . . . . . . . . . . . . . . . . . . . . . . . . . . . . . . . . . . . . . . . . . 322,692Elimination of Predecessor Goodwill . . . . . . . . . . . . . . . . . . . . . . . . . . . . . . . . . . . . . . . . . . . . . . . . . . (322,692)
Goodwill from Transaction . . . . . . . . . . . . . . . . . . . . . . . . . . . . . . . . . . . . . . . . . . . . . . . . . . . . . . . . . . . . . 670,294
Balance as of December 31, 2014—Successor . . . . . . . . . . . . . . . . . . . . . . . . . . . . . . . . . . . . . . . . . . . . 670,294
Impairment of Goodwill . . . . . . . . . . . . . . . . . . . . . . . . . . . . . . . . . . . . . . . . . . . . . . . . . . . . . . . . . . . . (9,313)
Balance as of December 31, 2015—Successor . . . . . . . . . . . . . . . . . . . . . . . . . . . . . . . . . . . . . . . . . . . . $ 660,981
The annual impairment test performed in the fourth quarter of 2015 resulted in an impairment charge of $9.3million related to the Company’s Clinics reporting unit. The current year goodwill impairment charge represents thetotal accumulated goodwill impairment losses as of December 31, 2015.
In 2014, the Company eliminated its Predecessor goodwill and recorded $670.3 million of Successor goodwill basedon the purchase price allocation resulting from the Transaction.
Accumulated impairment charges for the Predecessor as of December 31, 2013 were $0.3 million.
F-21

Intangible Assets, NetThe Company’s intangible assets consisted of the following (in thousands):
GROSSCARRYINGAMOUNT
ACCUMULATEDAMORTIZATION NET
Balances as of December 31, 2015—Successor:Backlog . . . . . . . . . . . . . . . . . . . . . . . . . . . . . . . . . . . . . . . . . . . . . . . . . . $ 72,630 $ 72,630 $ —Customer relationships . . . . . . . . . . . . . . . . . . . . . . . . . . . . . . . . . . . . . . 145,051 26,991 118,060Developed technologies . . . . . . . . . . . . . . . . . . . . . . . . . . . . . . . . . . . . . . 54,475 19,066 35,409Trade name (indefinite-lived) . . . . . . . . . . . . . . . . . . . . . . . . . . . . . . . . . 31,646 — 31,646Other . . . . . . . . . . . . . . . . . . . . . . . . . . . . . . . . . . . . . . . . . . . . . . . . . . . . 2,505 877 1,628
$306,307 $119,564 $186,743
Balances as of December 31, 2014—Successor:Backlog . . . . . . . . . . . . . . . . . . . . . . . . . . . . . . . . . . . . . . . . . . . . . . . . . . $ 72,630 $ 39,777 $ 32,853Customer relationships . . . . . . . . . . . . . . . . . . . . . . . . . . . . . . . . . . . . . . 145,051 8,099 136,952Developed technologies . . . . . . . . . . . . . . . . . . . . . . . . . . . . . . . . . . . . . . 54,475 8,171 46,304Trade name (indefinite-lived) . . . . . . . . . . . . . . . . . . . . . . . . . . . . . . . . . 31,646 — 31,646Other . . . . . . . . . . . . . . . . . . . . . . . . . . . . . . . . . . . . . . . . . . . . . . . . . . . . 2,505 375 2,130
$306,307 $ 56,422 $249,885
As of December 31, 2015, estimated amortization expense of the Company’s intangible assets for each of the nextfive years and thereafter is as follows (in thousands):
2016 . . . . . . . . . . . . . . . . . . . . . . . . . . . . . . . . . . . . . . . . . . . . . . . . . . . . . . . . . . . . . . . . . . . . . . . . . . . . . $ 50,6722017 . . . . . . . . . . . . . . . . . . . . . . . . . . . . . . . . . . . . . . . . . . . . . . . . . . . . . . . . . . . . . . . . . . . . . . . . . . . . . 37,7902018 . . . . . . . . . . . . . . . . . . . . . . . . . . . . . . . . . . . . . . . . . . . . . . . . . . . . . . . . . . . . . . . . . . . . . . . . . . . . . 29,3712019 . . . . . . . . . . . . . . . . . . . . . . . . . . . . . . . . . . . . . . . . . . . . . . . . . . . . . . . . . . . . . . . . . . . . . . . . . . . . . 14,6392020 . . . . . . . . . . . . . . . . . . . . . . . . . . . . . . . . . . . . . . . . . . . . . . . . . . . . . . . . . . . . . . . . . . . . . . . . . . . . . 7,797Thereafter . . . . . . . . . . . . . . . . . . . . . . . . . . . . . . . . . . . . . . . . . . . . . . . . . . . . . . . . . . . . . . . . . . . . . . . . . . 14,828
Total future amortization expense . . . . . . . . . . . . . . . . . . . . . . . . . . . . . . . . . . . . . . . . . . . . . . . . . . . . . . . . $155,097
7. ACCRUED EXPENSES
Accrued expenses consisted of the following at December 31 (in thousands):
SUCCESSOR
2015 2014
Employee compensation and benefits . . . . . . . . . . . . . . . . . . . . . . . . . . . . . . . . . . . . . . . . . . . . $17,195 $18,216Other . . . . . . . . . . . . . . . . . . . . . . . . . . . . . . . . . . . . . . . . . . . . . . . . . . . . . . . . . . . . . . . . . . . . . . 2,916 2,091
Total accrued expenses . . . . . . . . . . . . . . . . . . . . . . . . . . . . . . . . . . . . . . . . . . . . . . . . . . . . . $20,111 $20,307
F-22

8. DEBT
Debt consisted of the following at December 31 (in thousands):
SUCCESSOR
2015 2014
Term loan . . . . . . . . . . . . . . . . . . . . . . . . . . . . . . . . . . . . . . . . . . . . . . . . . . . . . . . . . . . . . . . . $390,000 $505,000Mortgage notes payable . . . . . . . . . . . . . . . . . . . . . . . . . . . . . . . . . . . . . . . . . . . . . . . . . . . . . — 1,051Capital lease . . . . . . . . . . . . . . . . . . . . . . . . . . . . . . . . . . . . . . . . . . . . . . . . . . . . . . . . . . . . . . 59 138
390,059 506,189Less unamortized discount . . . . . . . . . . . . . . . . . . . . . . . . . . . . . . . . . . . . . . . . . . . . . . . . . . . (1,984) (2,360)Less unamortized debt issuance costs . . . . . . . . . . . . . . . . . . . . . . . . . . . . . . . . . . . . . . . . . . (10,134) (12,056)Less current portion of long-term debt . . . . . . . . . . . . . . . . . . . . . . . . . . . . . . . . . . . . . . . . . . (59) (255)
Long-term debt, net, less current portion . . . . . . . . . . . . . . . . . . . . . . . . . . . . . . . . . . . . . $377,882 $491,518
Principal payments on debt are due as follows (in thousands):
2016 . . . . . . . . . . . . . . . . . . . . . . . . . . . . . . . . . . . . . . . . . . . . . . . . . . . . . . . . . . . . . . . . . . . . . . . . . . . . . $ 592017 . . . . . . . . . . . . . . . . . . . . . . . . . . . . . . . . . . . . . . . . . . . . . . . . . . . . . . . . . . . . . . . . . . . . . . . . . . . . . —2018 . . . . . . . . . . . . . . . . . . . . . . . . . . . . . . . . . . . . . . . . . . . . . . . . . . . . . . . . . . . . . . . . . . . . . . . . . . . . . —2019 . . . . . . . . . . . . . . . . . . . . . . . . . . . . . . . . . . . . . . . . . . . . . . . . . . . . . . . . . . . . . . . . . . . . . . . . . . . . . —2020 . . . . . . . . . . . . . . . . . . . . . . . . . . . . . . . . . . . . . . . . . . . . . . . . . . . . . . . . . . . . . . . . . . . . . . . . . . . . . —Thereafter . . . . . . . . . . . . . . . . . . . . . . . . . . . . . . . . . . . . . . . . . . . . . . . . . . . . . . . . . . . . . . . . . . . . . . . . . . 390,000
Total . . . . . . . . . . . . . . . . . . . . . . . . . . . . . . . . . . . . . . . . . . . . . . . . . . . . . . . . . . . . . . . . . . . . . . . . . . . $390,059
Successor Company Credit FacilitiesOn April 1, 2014, in connection with the Transaction, the Successor entered into a $530.0 million credit agreement(the “Credit Agreement”), consisting of a $530.0 million term loan issued at 99.50% and a $60.0 million revolvingcredit facility (“Revolver”) issued at 99.00%. The term loan portion of the Credit Agreement has a seven year termand the Revolver has a five year term.
The Credit Agreement provides for the Company’s option, interest at the Eurocurrency rate or Base rate for term loanand Revolver borrowings. Base rate is the higher of several published customary market rates, including FederalFunds rate or Prime at time of borrowing. The Company, at its discretion, may choose interest periods of 1, 2, 3 or 6months, which determines the interest rate to be applied. Interest on Eurocurrency loans continues to be payable atthe end of the selected Eurocurrency term and interest on Base rate loans are payable quarterly in conjunction withany required principal payments.
The Credit Agreement initially provided for Eurocurrency loans at interest rates of 4.00% and 3.75% and interestrates of 3.00% and 2.75% with respect to Base rate for term loans and Revolver borrowings, respectively. Uponexpiration of initial interest periods, term loan and Revolver borrowings under the Credit Agreement bear interest at arate per annum equal to an applicable spread, with pricing levels providing for an interest rate reduction of 25 basispoints upon achievement of a defined financial net debt leverage ratio, plus a Eurocurrency or Base rate. Thedefined net debt leverage ratio required for the reduced interest level was achieved in the second quarter of 2015and has subsequently maintained. Term loan Eurocurrency rates are subject to a minimum floor of 1.00% or a Baserate which is subject to a floor of 2.00%. However, Revolver borrowings are not subject to minimum floor rates. Theapplicable spread for the term loan is 3.75% or 4.00% for the Eurocurrency rate and 2.75% or 3.00% with respectto the Base rate. The applicable spread for the Revolver is 3.50% or 3.75% for the Eurocurrency rate and 2.50% or2.75% with respect to the Base rate.
F-23

Medpace pays commitment fees on a quarterly basis at an annual rate of 0.50% of the unused borrowings under theRevolver, which is recorded as a component of Interest expense, net in the consolidated statements of operations.The commitment fee is subject to a pricing level reduction to 0.375% upon achievement of a defined financial netdebt leverage. As of December 31, 2015, the Company had met the requirements for the pricing level reduction.
The original issue discount of $2.7 million related to the issuance of the term loan was recorded as a reduction ofthe underlying debt issuances and is being amortized over the life of the debt using the effective-interest method.Per the terms of the Credit Agreement, principal is scheduled to be paid quarterly on the last business day of March,June, September and December of each year, beginning September 2014. However, the Company is no longersubject to the quarterly term loan amortization as a result of voluntary prepayments in term loan principal during2015 and 2014.
Origination fees of $15.5 million were originally capitalized related to the issuance of the Credit Agreement and arebeing amortized over the life of the debt using the effective-interest method. The unamortized portion of these feesrelated to the term loan were $10.1 million and $12.1 million at December 31, 2015 and 2014, respectively, andare recorded within Long-term debt, net, less current portion. The unamortized portion of the origination feesattributable to the Revolver were $1.3 million and $1.7 million at December 31, 2015 and 2014, respectively, andwere recorded as a component of Other assets in the consolidated balance sheets.
The Credit Agreement is guaranteed by the Company and its subsidiaries and is subject to customary covenantsrelating to financial ratios and restrictions on certain types of transactions including restricting the Company’s abilityto incur additional indebtedness, acquire and dispose of assets, make investments, pay dividends, or engage inmergers and acquisitions. The Successor was in compliance with all financial covenants as of December 31, 2015and 2014.
As of December 31, 2015 the Company did not have any outstanding letters of credit under the Credit Agreementresulting in $60.0 million in undrawn capacity available under the Revolver. As of December 31, 2014, theCompany had $2.2 million in outstanding letters of credit under the Credit Agreement resulting in $57.8 million inundrawn capacity available under the Revolver. The gross term loan balance as of December 31, 2015 and 2014was $390.0 million and $505.0 million, respectively, and is currently at the Eurocurrency minimum floor interestrate of 4.75%.
The estimated fair value of the Successor’s term loan at December 31, 2015 and 2014, based on Level 1 quotedmarket prices, approximates $386.3 million and $500.9 million compared to the carrying value of $388.0 millionand $502.6 million.
Predecessor Company Credit FacilitiesOn June 17, 2011, the Predecessor Company entered into a $335.0 million credit agreement (the “PredecessorCredit Agreement”), consisting of a $285.0 million term loan issued at 98.50% and a $50.0 million revolving creditfacility (“Predecessor Revolver”). The Predecessor Credit Agreement, which was terminated in 2014 in connectionwith the Transaction, was guaranteed by the Company and its subsidiaries and was subject to covenants relating tofinancial ratios and restrictions on certain types of transactions. The Predecessor was in compliance with allfinancial covenants as of December 31, 2013.
The Predecessor Credit Agreement initially provided borrowings at interest rates based on a EuroDollar rate plus amargin of 5.00%, or a base rate plus a margin of 4.00%. Prior to the amendment discussed below, the EuroDollarrate was subject to a minimum floor of 1.50% and the base rate was subject to a minimum floor of 2.50%. Intereston the EuroDollar margin tranche of the loan was payable at the end of the selected EuroDollar term, which wastypically a 30-day term or a 60-day term. Interest on the base rate tranche of the loan was payable quarterly inconjunction with any required principal payments. The Predecessor paid commitment fees on a quarterly basis at anannual rate of 0.50% of the unused amount of borrowings, which was recorded as a component of Interest expense,net in the consolidated statements of operations. The term loan portion of the Predecessor Credit Agreement had asix year term and the Predecessor Revolver had a five year term.
The original issue discount of $4.3 million from the issuance of the term loan was recorded as a reduction of theunderlying debt balance and was being amortized over the life of the debt using a method which approximated the
F-24

effective-interest method. Per the terms of the Predecessor Credit Agreement, principal was scheduled to be paidquarterly on the last business day of March, June, September and December of each year. However, as a result ofvoluntary prepayments in term loan principal during 2013, the Predecessor was not subject to the quarterly termloan amortization from that point forward.
A total of $5.9 million in loan origination fees were initially capitalized in conjunction with the issuance of thePredecessor Credit Agreement and those fees, net of the adjustment discussed below, were amortized over the life ofthe debt using a method which approximated the effective-interest method.
The gross term loan balance was $166.7 million at December 31, 2013 and was subject to interest at theEuroDollar minimum floor rate of 5.25%.
Amendment of the Predecessor Company Credit FacilitiesOn April 11, 2013, the Predecessor amended its credit facilities, primarily to modify the borrowing rate. ThePredecessor Credit Agreement, as amended, provided for borrowings at interest rates that were based on a EuroDollarrate plus a margin of 4.25%, or a base rate plus a margin of 3.25%. The EuroDollar rate was subject to a minimumfloor of 1.25% and the base rate was subject to a minimum floor of 2.25%.
In connection with amendment of the Predecessor Credit Agreement, three of the Predecessor’s previous lendersexited the credit facility. Pursuant to the accounting guidance governing such transactions, the Predecessor recordeda $1.5 million loss on the extinguishment of debt for the pro-rata share of unamortized debt issuance costs andoriginal issue discount associated with those lenders. The loss on extinguishment was recorded in Miscellaneous(expense) income, net on the consolidated statement of operations for the year ended December 31, 2013. Theoriginal unamortized costs associated with the remaining lenders, in addition to the $1.1 million in new loanorigination fees incurred in connection with the refinancing, were being amortized over the remaining term of thedebt using a method which approximated the effective-interest method.
The outstanding term loan balance of $143.7 million as of March 31, 2014 was paid in full in connection with theTransaction and the Predecessor Credit Agreement was terminated.
Mortgage Notes PayableMedpace entered into a mortgage contract with a European bank in 2006 related to the purchase of a laboratoryfacility in Leuven, Belgium. The Euro-denominated mortgage bears a fixed annual interest rate of 4.90%, requiresmonthly payments of principal and interest, and has a final maturity of December 2021. The mortgage is secured bybuilding and land and also requires that Medpace maintain a cash balance held as collateral with the bank. During2015, the mortgage was fully repaid and the Company received a full refund of cash collateral during the firstquarter of 2016.
F-25

9. COMMITMENTS, CONTINGENCIES, AND GUARANTEES
Lease ObligationsThe Company has payment obligations under non-cancellable operating and capital leases, primarily for office spaceand furniture and fixtures to support its global operations. These leases often contain customary scheduled rentincreases or escalation clauses and renewal options. Rent expense is recorded on a straight line basis. As ofDecember 31, 2015, minimum future lease payments required under these leases are as follows for the years endingDecember 31 (in thousands):
RELATED PARTYCAPITAL LEASE
RELATED PARTYOPERATING LEASE
NON-RELATEDPARTIES OPERATING
LEASES
TOTALOPERATING
LEASES
2016 . . . . . . . . . . . . . . . . . . . . . . . . . . . . . . . . $62 $ 2,112 $ 4,048 $ 6,1602017 . . . . . . . . . . . . . . . . . . . . . . . . . . . . . . . . — 2,112 2,786 4,8982018 . . . . . . . . . . . . . . . . . . . . . . . . . . . . . . . . — 2,112 2,650 4,7622019 . . . . . . . . . . . . . . . . . . . . . . . . . . . . . . . . — 2,112 1,482 3,5942020 . . . . . . . . . . . . . . . . . . . . . . . . . . . . . . . . — 2,112 1,134 3,246Thereafter . . . . . . . . . . . . . . . . . . . . . . . . . . . . — 3,872 3,759 7,631
Total minimum lease payments . . . . . . . . . . . . $62 $14,432 $15,859 $30,291
Less amounts representing interest . . . . . . . . . 3
Present value of net minimum lease payments(including $59 classified to other currentliabilities) . . . . . . . . . . . . . . . . . . . . . . . . . . $59
The related party capital lease relates to assets utilized in the Company’s medical device operations. The relatedparty operating lease is for one of the Company’s three buildings within its corporate headquarters. The non-relatedparty operating leases are for the Company’s remaining leases throughout the world consisting primarily of officespace, fixtures and vehicles.
Rental expense under operating leases totaled $5.8 million, $4.3 million, $1.4 million and $7.4 million for theSuccessor year ended December 31, 2015, the Successor Period ended December 31, 2014, the PredecessorPeriod ended March 31, 2014 and for the Predecessor year ended December 31, 2013, respectively, and isallocated between Direct costs, excluding depreciation and amortization, and Selling, general and administrative inthe consolidated statements of operations.
Deemed Landlord LiabilitiesAs of December 31, 2015, minimum annual payments required in conjunction with the Deemed landlord liabilitiesare as follows (in thousands):
RELATED PARTYMINIMUM
LEASEPAYMENTS
LESS:INTEREST
PRINCIPALAMOUNTS DUE
2016 . . . . . . . . . . . . . . . . . . . . . . . . . . . . . . . . . . . . . . . . . . . . . . . . . . . . $ 3,757 $ 2,207 $ 1,5502017 . . . . . . . . . . . . . . . . . . . . . . . . . . . . . . . . . . . . . . . . . . . . . . . . . . . . 3,837 2,091 1,7462018 . . . . . . . . . . . . . . . . . . . . . . . . . . . . . . . . . . . . . . . . . . . . . . . . . . . . 3,886 1,961 1,9252019 . . . . . . . . . . . . . . . . . . . . . . . . . . . . . . . . . . . . . . . . . . . . . . . . . . . . 3,937 1,819 2,1182020 . . . . . . . . . . . . . . . . . . . . . . . . . . . . . . . . . . . . . . . . . . . . . . . . . . . . 3,988 1,662 2,326Thereafter . . . . . . . . . . . . . . . . . . . . . . . . . . . . . . . . . . . . . . . . . . . . . . . . . 27,973 5,815 22,158
Total . . . . . . . . . . . . . . . . . . . . . . . . . . . . . . . . . . . . . . . . . . . . . . . . . . . . . $47,378 $15,555 $31,823
F-26

Purchase CommitmentsIn May 2013, Medpace committed to the aggregate purchase of $2.0 million of software services from a vendorduring the period from June 1, 2013 through May 31, 2016. In return for the commitment, Medpace receivespreferential fixed rate pricing and a 5% discount on all purchases made pursuant to this agreement during its three-year term. As of December 31, 2014, the Company had met the aggregate purchase commitment.
Legal ProceedingsMedpace periodically becomes involved in various claims and lawsuits that are incidental to its business.Management believes, after consultation with counsel, that no matters currently pending would, in the event of anadverse outcome, have a material impact on the Company’s consolidated balance sheets, statements of operations,or cash flows.
In March 2012, the Company filed a legal claim against one of its customers, citing as a basis for its claim thecustomer’s non-payment of more than $6.5 million in outstanding invoices. In response, the customer filed acounterclaim against the Company for compensatory damages, asserting that the Company had willfully and wronglywithheld clinical study data alleged to be owned by the customer. The Company objected to these allegations andbelieved it had meritorious defenses against these claims and also believed that it would ultimately prevail in thismatter. During 2015, a Settlement and Mutual Release Agreement (the “Agreement”) was entered into whereas theCompany agreed to settle all outstanding claims for payment of $2.0 million from the customer and both partieswaived the right to file any future suits. The customer paid the $2.0 million settlement during 2015 and theCompany recorded a bad debt recovery of $2.0 million in Selling, general and administrative in the consolidatedstatements of operations.
10. SHAREHOLDERS’ EQUITY
Successor CompanySuccessor AwardsThe Successor Plan for employees and directors provides for the issuance of vested shares, stock options, RSAs andRSUs in Medpace Holdings, Inc.’s common stock. The Successor Plan has reserved 3,790,262 shares for issuanceof restricted awards or stock options, of which approximately 425,000 awards were available for future grants as ofDecember 31, 2015. The Successor Plan expires in 2024, except for awards then outstanding and is administeredby the Board of Directors.
The Awards are granted to key employees as additional compensation for services rendered and as a means ofretention over the vesting period, typically three to four years. RSAs awarded under the plan are subject to automaticforfeiture upon departure until vested and entitle the shareholder to all rights of common stock ownership exceptthat they may not be sold, transferred, pledged or otherwise disposed of during the restriction period, except asnoted in the following paragraph. The Successor Plan also allows for the issuance of non-qualified stock options toemployees, officers, and directors under this plan (collectively, “the Participants”). Under the Successor Plan,options may be granted with an exercise price equal to or greater than the fair value of common stock at the grantdate as determined by the Board of Directors. The stock options, if unexercised, expire seven years from the date ofgrant.
As a condition to exercising stock options and acceptance of certain restricted shares, employees must execute aContribution and Subscription Agreement (the “Subscription Agreement”) that provides for the exchange of theshares issued for incentive units (the “Incentive Units”) in Medpace Investors upon the occurrence of certain events.The Incentive Units are tied directly to common stock ownership in Medpace Holdings, Inc. and entitle the IncentiveUnit holder to participate in the risks and rewards of owning the Successor Company’s stock through ownership inMedpace Investors. The Successor Awards containing this condition are liability-classified instruments as they areinevitably settled in the equity of a non-consolidated related party. Restricted share awards excluding therequirement to execute a Contribution and Subscription Agreement and settlement in common shares of MedpaceHoldings, Inc. are equity-classified instruments.
At the grant date for RSAs that are liability-classified, restricted shares are legally issued and exchanged for MPIIncentive Units on behalf of the employee. If the RSAs are not yet vested and an employee leaves the SuccessorCompany’s employment, the restricted shares of Medpace Holdings, Inc. revert back to the Successor Company and
F-27

are available for re-issuance under the Successor Plan. Upon the vesting of RSAs and RSUs and upon the exercise ofstock options, the stock-based compensation liability is settled by exchanging the Successor Company’s stock forMPI Incentive Units. If an employee leaves the Successor Company’s employment after they vest in the Awards andthe exchange for Incentive Units has been made, Medpace Investors may exercise a call option to repurchase anemployee’s Incentive Units at a price determined by the manager and majority unit holder of Medpace Investors,who is also the chief executive officer of Medpace. If Medpace Investors exercises the call right, it may do so up tothe later of twelve months following the employee’s departure date or six months following the determination that theformer employee is directly or indirectly engaged in competitive business activities.
Pursuant to the Successor Company’s Shareholder Agreement (the “Successor Shareholder Agreement”), in theevent Medpace Investors dissolves or distributes any common stock of Medpace Holdings, Inc. to the MedpaceInvestors’ members prior to a public offering, the Successor Company has a call right to repurchase the commonstock at a price equal to the fair market value of the stock as determined by the Board of Directors, provided that inno case shall any shares held by the chief executive officer or his affiliates be subject to the call rights.
Restricted Awards ModificationOn December 17, 2015, the Board of Directors approved a resolution to accelerate the vesting period for all issued,outstanding and unvested RSAs and RSUs to vest on December 31, 2015, so long as the recipient of each restrictedshare or unit is in good standing, has not provided notice of resignation and continues to be employed by theCompany as of December 31, 2015. In total, 688,599 unvested restricted awards held by 158 current employeeswere modified resulting in settlement of 688,599 shares.
According to the authoritative guidance for stock-based compensation, under these circumstances a company shouldrecognize additional stock-based compensation expense in the amount of the incremental fair value of the modifiedaward. Because the restricted awards that were modified are liability-classified, the awards are at fair value at thetime of the modification and no incremental cost was recognized. While there is no incremental cost related to fairvalue of the awards, $5.7 million of stock-based compensation expense was recorded in 2015 related to previouslyunrecognized stock-based compensation cost for awards expected to vest in 2016, 2017 and 2018.
Predecessor CompanyPredecessor AwardsIn 2011, the Predecessor Company adopted a stock option plan (the “2011 Stock Option Plan”) and was authorizedto issue non-qualified stock options to employees, officers, and directors under this plan (collectively “theParticipants”). Under the 2011 Stock Option Plan, options may be granted with an exercise price equal to or greaterthan the fair value of common stock at the date of the grant as determined by the Board of Directors. In April 2012,the Board of Directors amended the 2011 Stock Option Plan to increase the maximum number of shares availablefor issuance as options to the Participants. Options granted under the plans may be exercised at certain timessubsequent to certain events, as set forth in the grant. The stock options, if unexercised, expire ten years from thedate of grant.
In December 2012, the Predecessor Company’s Board of Directors established a restricted stock plan (the “2012Restricted Stock Plan”) and approved the issuance of RSAs and RSUs (collectively, the “Restricted Shares”) up toan authorized amount of 350,000 total Restricted Shares. These shares are subject to certain restrictions, and areissued to key employees of the Company as a means of retention. RSAs awarded under the plan entitle theshareholder to all rights of common stock ownership except that they may not be sold, transferred, pledged,exchanged or otherwise disposed of during the restriction period.
The terms of the 2011 Stock Option Plan and the 2012 Restricted Stock Plan (collectively, the “Predecessor EquityPlans”) permitted, but did not require, the acceleration of vesting for awards upon a change in control. OnMarch 24, 2014, the Predecessor’s Board of Directors approved the acceleration of vesting for outstandingRestricted Share awards and stock options, the effect of which took place immediately prior to the April 1, 2014Transaction. The Predecessor’s Board of Directors, at the same time, also approved the cancellation of any remainingunvested equity awards and terminated the Predecessor Equity Plans. The acceleration of vesting was determined tobe a modification of the Predecessor Equity Plans and, pursuant to accounting guidance governing suchtransactions, the Predecessor Company recorded incremental stock-based compensation expense of $7.1 million.The modification of the Predecessor Equity Plans resulted in accelerated vesting for 172,492 Restricted Shares and
F-28

992,412 stock options. This change impacted 266 employees. In connection with the Transaction, all Participantsexercised their options, resulting in exercise proceeds aggregating $15.2 million.
Treasury SharesThe Predecessor Company’s Shareholder Agreement (the “Predecessor Shareholder Agreement”) permitted theCompany to directly purchase the shares of employee shareholders that separated from the Company. ThePredecessor Company did not exercise its option to repurchase shares from separated employees during anyPredecessor period covered by the Predecessor’s Financial Statements.
Successor and Predecessor Equity AwardsValuation AssumptionsThe Company determines the fair value of stock options using the Black-Scholes-Merten option pricing model (the“BSM Model”). The BSM Model is primarily affected by the fair value of the Successor’s common stock (seerestricted share valuation discussion below), the expected holding period for the option, expected stock pricevolatility over the term of the awards, the risk-free interest rate, and expected dividends.
The following table sets forth the key weighted-average assumptions used in the BSM Model to calculate the fairvalue of options:
SUCCESSOR PREDECESSOR
YEAR ENDEDDECEMBER 31,
2015
PERIOD ENDEDDECEMBER 31,
2014
PERIOD ENDEDMARCH 31,
2014
YEAR ENDEDDECEMBER 31,
2013
Expected holding period—years . . . . . . . . . . . . . . 4.2 5.4 N/A 3.1Expected volatility . . . . . . . . . . . . . . . . . . . . . . . . . 36.4% 41.8% N/A 37.4%Risk-free interest rate . . . . . . . . . . . . . . . . . . . . . . 1.2% 1.7% N/A 0.3%Expected dividend yield . . . . . . . . . . . . . . . . . . . . 0.0% 0.0% N/A 0.0%
The Successor’s assumptions in the table above represent those used during the Successor year endedDecember 31, 2015 and the Successor Period ended December 31, 2014, for the fair value calculations of thestock options as required for liability-classified stock compensation accounting. The assumptions used by thePredecessor reflect grant date inputs used to arrive at the grant date fair values as the Predecessor awards aresubject to equity-classified stock compensation accounting.
The expected holding period represents the period of time the grants are expected to be outstanding. The Companyuses the simplified method, as prescribed by accounting guidance governing such awards, to calculate the expectedholding period for options granted to employees as we do not have sufficient historical evidence data to provide areasonable basis upon which to estimate the expected holding period. For options valued by the Successor for the yearended December 31, 2015 and the Successor Period ended December 31, 2014, the expected holding period is basedon an average between the midpoint of the vesting date and the expiration date of the options and the estimated timeexpected until a change in control. For options issued during the Predecessor year ended December 31, 2013, theexpected holding period was based on a probability-weighted assessment of an anticipated liquidity event.
The Company estimates expected volatility primarily by using the historical volatility of a publicly traded peer groupthat operates in the clinical research and development industry. The Company does not have adequate data tocalculate its own volatility and believes the Company’s expected volatility will approximate the historical experienceof the peer group. The risk-free interest rate is based on the yield on U.S. Treasury obligations with remainingdurations equal to the expected holding period of the options. The expected dividend yield is assumed to be zerobased on recent and anticipated dividend activity.
The Company determines the fair value of restricted shares by obtaining an independent valuation of the fair value ofthe Company’s equity, applying a discount for lack of marketability, and then calculating the implied share price.The fair value of the Company is estimated primarily using an income approach which is based on assumptions andestimates made by management and, secondarily, using other market-related factors in current industry trends aswell as observed transaction values. In determining the estimated future cash flows used in the income approach,
F-29

the Company developed and applied certain estimates and judgments, including current and projected future levelsof income based on management’s plans, business trends, prospects and market and economic conditions, includingmarket-participant considerations. Significant assumptions utilized in the income approach were based on companyspecific information and projections, which are not observable in the market and are thus considered Level 3measurements by authoritative guidance (see discussion of fair value measurements). The discount for lack ofmarketability (the “Marketability Discount”) was applied to reflect what a market participant would consider inrelation to the post-vesting restrictions imposed regarding the inability to sell, transfer, or pledge the shares duringthe restriction period. The Marketability Discount was estimated by using the BSM Model to calculate the cost of atheoretical put option to hedge the fluctuation in value of the investment between the valuation date and ananticipated liquidity date.
The following table summarizes the grant date fair values of stock options and restricted shares issued during theperiod as well as the allocation of stock-based compensation expense to Direct costs, excluding depreciation andamortization, and Selling, general and administrative reported in the consolidated statements of operations:
SUCCESSOR PREDECESSOR
YEAR ENDEDDECEMBER 31,
2015
PERIOD ENDEDDECEMBER 31,
2014
PERIOD ENDEDMARCH 31,
2014
YEAR ENDEDDECEMBER 31,
2013
Weighted average, grant date fair valueStock options . . . . . . . . . . . . . . . . . . . . . . . . . . $ 3.81 $ 4.33 N/A $ 1.66
Restricted shares (RSAs and RSUs) . . . . . . . . $ 12.53 $10.80 N/A $ 8.50
Stock-based compensation expense allocated to:Direct costs, excluding depreciation and
amortization . . . . . . . . . . . . . . . . . . . . . . . . $ 9,243 $4,399 $5,422 $ 601Selling, general and administrative . . . . . . . . . 13,081 1,024 1,918 1,357
Total stock-based compensation expense . . . . . . . $22,324 $5,423 $7,340 $1,958
Award Activity
The following table sets forth the Successor’s and Predecessor’s stock option activity:
SUCCESSOR PREDECESSOR
YEAR ENDEDDECEMBER 31, 2015
PERIOD ENDEDDECEMBER 31, 2014
PERIOD ENDEDMARCH 31, 2014
YEAR ENDEDDECEMBER 31, 2013
OPTIONS
WEIGHTEDAVERAGEEXERCISE
PRICE SHARES
WEIGHTEDAVERAGEEXERCISE
PRICE SHARES
WEIGHTEDAVERAGEEXERCISE
PRICE SHARES
WEIGHTEDAVERAGEEXERCISE
PRICE
Outstanding—Beginning ofperiod 1,091,048 $14.40 — $ — 1,438,800 $11.03 1,267,900 $10.00Granted . . . . . . . . . . . . . . 889,849 $16.67 1,131,895 $14.40 — $ — 378,300 $14.00Exercised . . . . . . . . . . . . . (17,404) $ — — $ — (1,388,000) $10.97 (45,200) $10.00Forfeited . . . . . . . . . . . . . (168,784) $15.53 (40,847) $14.40 (32,200) $12.53 (162,200) $10.18Expired . . . . . . . . . . . . . . — $ — — $ — (18,600) $11.27 — $ —
Outstanding—end ofperiod . . . . . . . . . . . . . . . 1,794,709 $15.42 1,091,048 $14.40 — $ — 1,438,800 $11.03
Exercisable—end ofperiod . . . . . . . . . . . . . . . 242,777 $14.40 — $ — — $ — 395,588 $10.00
F-30

The following table sets forth the Successor and Predecessor’s Restricted Share activity:
SUCCESSOR PREDECESSOR
YEAR ENDEDDECEMBER 31,
2015
PERIOD ENDEDDECEMBER 31,
2014
PERIOD ENDEDMARCH 31,
2014
YEAR ENDEDDECEMBER 31,
2013
SHARES SHARES SHARES SHARES
Outstanding and unvested—beginning ofperiod . . . . . . . . . . . . . . . . . . . . . . . . . . . . . . . 407,171 — 176,643 216,898Granted . . . . . . . . . . . . . . . . . . . . . . . . . . . . . . 1,253,924 707,721 — 59,990Vested . . . . . . . . . . . . . . . . . . . . . . . . . . . . . . . (1,530,547) (283,042) (172,492) (90,998)Forfeited . . . . . . . . . . . . . . . . . . . . . . . . . . . . . (39,851) (17,508) (4,151) (9,247)
Outstanding and unvested—end of period . . . . . . 90,697 407,171 — 176,643
Cumulative vested shares—end of period . . . . . . . 1,813,589 283,042 263,490 90,998
During the Successor year ended December 31, 2015 and the Successor Period ended December 31, 2014,583,021 and 283,042 Restricted Shares were granted and immediately vested upon issuance (the “VestedShares”), respectively. The stock-based compensation liability related to 231,229 and 283,042 Vested Sharesgranted during the Successor year ended December 31, 2015 and the Successor Period ended December 31, 2014,respectively, were settled by exchanging the awards for Medpace Investors’ Incentive Units. The stock-based liabilityrelated to the residual 351,851 Vested Shares granted during the Successor year ended December 31, 2015 weresettled by exchanging the awards for the Company’s common stock.
The following table summarizes information about stock options expected to vest, stock options exercisable, andunvested restricted share awards expected to vest at December 31, 2015:
ISSUED IN SUCCESSOR YEAR ENDED
WEIGHTEDAVERAGEEXERCISE
PRICESTOCK
OPTIONSRESTRICTED
SHARES
WEIGHTEDAVERAGE
REMAININGLIFE (YEARS)
December 31, 2015Number of stock options expected to vest . . . . . . . . . . . . . . . . $15.58 1,472,818 — 6.0Number of Restricted Shares expected to vest . . . . . . . . . . . . . — 85,847
Total expected to vest—December 31, 2015 . . . . . . . . . . . . . . . . 1,472,818 85,847
Total stock options exercisable—December 31, 2015 . . . . . . . . . $14.40 242,777 5.5
Unrecognized compensation cost—December 31, 2015(in thousands) . . . . . . . . . . . . . . . . . . . . . . . . . . . . . . . . . . . . . . $ 3,653 $ 1,254
Weighted average years over which unrecognized compensationcost will be recognized . . . . . . . . . . . . . . . . . . . . . . . . . . . . . . . 1.7 3.0
F-31

The following table sets forth the aggregate intrinsic value of stock options exercised, the fair values of awardsvested, and share based liabilities settled during the respective periods (in thousands):
SUCCESSOR PREDECESSOR
YEAR ENDEDDECEMBER 31,
2015
PERIOD ENDEDDECEMBER 31,
2014
PERIOD ENDEDMARCH 31,
2014
YEAR ENDEDDECEMBER 31,
2013
Total intrinsic value of stock options exercised . . . $ (36) $ — $25,378 $ 181Total grant-date fair value of stock options
vested . . . . . . . . . . . . . . . . . . . . . . . . . . . . . . . $ 1,168 $ — $ 3,446 $1,034Total grant-date fair value of restricted shares
vested . . . . . . . . . . . . . . . . . . . . . . . . . . . . . . . $18,284 $3,057 $ 1,466 $ 773Total settlement date fair value of restricted
shares vested . . . . . . . . . . . . . . . . . . . . . . . . . . $21,134 $3,057 N/A N/ATotal share-based liabilities settled . . . . . . . . . . . $16,858 $3,057 N/A N/A
The stock-based compensation liability of $3.6 million at December 31, 2015 is related to outstanding stockoptions. The stock-based compensation liability of $2.4 million at December 31, 2014 is related to outstandingstock options and unvested Restricted Awards. Further, $1.7 million and $1.3 million is included in Other currentliabilities and $1.9 million and $1.1 million is included in Other long-term liabilities in the consolidated balancesheets at December 31, 2015 and 2014, respectively.
The actual tax benefits recognized related to stock-based compensation totaled $4.6 million, $3.3 million,$8.2 million, and $0.1 million for the Successor year ended December 31, 2015, the Successor Period endedDecember 31, 2014, the Predecessor Period ended March 31, 2014, and the Predecessor year endedDecember 31, 2013, respectively.
11. EMPLOYEE BENEFIT PLANS
The Company provides a 401(k) plan that covers substantially all U.S. employees. Participants can elect tocontribute up to 50% of their eligible earnings on a pre-tax basis, subject to Internal Revenue Service annuallimitations.
The U.S.-based plan offers a year-end employer matching contribution, requiring the participant to be an employeeat year-end to qualify for the match. Participants with one year or more of service are eligible for the matchingcontribution. Participants fully vest in the employer contributions after three years of service. The employercontribution represents a percentage of a participant’s eligible compensation. The Company’s 401(k) Plan costs were$1.7 million, $1.1 million, $0.3 million, and $1.2 million during the Successor year ended December 31, 2015,the Successor Period ended December 31, 2014, the Predecessor Period ended March 31, 2014, and thePredecessor year ended December 31, 2013 respectively, and were allocated between Direct costs, excludingdepreciation and amortization, and Selling, general and administrative in the consolidated statements of operations.
The Company has various defined contribution arrangements for eligible employees of non-U.S. entities. Thesedefined contribution arrangements provide employees with retirement savings and life insurance benefits. TheCompany incurred expenses related to these arrangements of $0.7 million, $0.5 million, $0.2 million, and $0.5million in the Successor year ended December 31, 2015, the Successor Period ended December 31, 2014, thePredecessor Period ended March 31, 2014, and the Predecessor year ended December 31, 2013, respectively, andwere allocated between Direct costs, excluding depreciation and amortization, and Selling, general andadministrative in the consolidated statements of operations.
The Company is also required to pay certain minimum statutory post-employment benefits. The Company recognizesa liability and the associated expense for these benefits when it is probable that employees are entitled to thebenefit.
F-32

12. INCOME TAXES
The Company files income tax returns for U.S. federal and various U.S. states, as well as various foreignjurisdictions. The liabilities for unrecognized tax benefits are carried in Other long-term liabilities on theconsolidated balance sheets because the payment of cash is not anticipated within one year of the balance sheetdate.
The components of (loss) income before income taxes consisted of the following (in thousands):
SUCCESSOR PREDECESSOR
YEAR ENDEDDECEMBER 31,
2015
PERIOD ENDEDDECEMBER 31,
2014
PERIOD ENDEDMARCH 31,
2014
YEAR ENDEDDECEMBER 31,
2013
Domestic . . . . . . . . . . . . . . . . . . . . . . . . . . . . . . . . $(12,294) $(23,893) $(1,069) $37,046Foreign jurisdictions . . . . . . . . . . . . . . . . . . . . . . . 4,464 2,854 847 2,099
(Loss) income before income taxes . . . . . . . . . $ (7,830) $(21,039) $ (222) $39,145
Income tax provision (benefit) consisted of the following (in thousands):
CURRENT DEFERRED TOTAL
Successor Year ended December 31, 2015:U.S. Federal . . . . . . . . . . . . . . . . . . . . . . . . . . . . . . . . . . . . . . . . . . . . . . . . . . . . $11,067 $(11,995) $ (928)U.S. state and local . . . . . . . . . . . . . . . . . . . . . . . . . . . . . . . . . . . . . . . . . . . . . . 1,119 (761) 358Foreign jurisdictions . . . . . . . . . . . . . . . . . . . . . . . . . . . . . . . . . . . . . . . . . . . . . . 1,372 41 1,413
$13,558 $(12,715) $ 843
Successor Period ended December 31, 2014:U.S. Federal . . . . . . . . . . . . . . . . . . . . . . . . . . . . . . . . . . . . . . . . . . . . . . . . . . . . $ 1,817 $ (8,941) $ (7,124)U.S. state and local . . . . . . . . . . . . . . . . . . . . . . . . . . . . . . . . . . . . . . . . . . . . . . 245 (606) (361)Foreign jurisdictions . . . . . . . . . . . . . . . . . . . . . . . . . . . . . . . . . . . . . . . . . . . . . . 853 (71) 782
$ 2,915 $ (9,618) $ (6,703)
Predecessor Period ended March 31, 2014:U.S. Federal . . . . . . . . . . . . . . . . . . . . . . . . . . . . . . . . . . . . . . . . . . . . . . . . . . . . $ 342 $ 659 $ 1,001U.S. state and local . . . . . . . . . . . . . . . . . . . . . . . . . . . . . . . . . . . . . . . . . . . . . . 52 (38) 14Foreign jurisdictions . . . . . . . . . . . . . . . . . . . . . . . . . . . . . . . . . . . . . . . . . . . . . . 320 (321) (1)
$ 714 $ 300 $ 1,014
Predecessor Year ended December 31, 2013:U.S. Federal . . . . . . . . . . . . . . . . . . . . . . . . . . . . . . . . . . . . . . . . . . . . . . . . . . . . $ 6,165 $ 6,352 $12,517U.S. state and local . . . . . . . . . . . . . . . . . . . . . . . . . . . . . . . . . . . . . . . . . . . . . . 1,011 784 1,795Foreign jurisdictions . . . . . . . . . . . . . . . . . . . . . . . . . . . . . . . . . . . . . . . . . . . . . . 860 (871) (11)
$ 8,036 $ 6,265 $14,301
F-33

The difference between the statutory rate for federal income tax and the effective income tax rate was as follows (inthousands):
SUCCESSOR PREDECESSOR
YEAR ENDEDDECEMBER 31,
2015
PERIOD ENDEDDECEMBER 31,
2014
PERIOD ENDEDMARCH 31,
2014
YEAR ENDEDDECEMBER 31,
2013
Income tax expense calculated atthe federal statutory rate . . . . . . . $(2,740) 35.0% $(7,363) 35.0% $ (78) 35.0% $13,701 35.0%
Effect of:State and local taxes, net of
federal benefit . . . . . . . . . . . . 487 (6.2) 219 (1.0) 208 (93.8) 1,189 3.0Tax on foreign earnings, net of
tax credits and deductions . . (330) 4.2 (261) 1.2 (440) 197.8 (746) (1.9)Change in valuation allowance . . — — — — 789 (354.3) — —Permanent items:
Goodwill impairment . . . . . . . 2,106 (26.9) — — — — — —Stock-based awards . . . . . . . . 778 (9.9) 332 (1.6) 278 (125.2) — —Other . . . . . . . . . . . . . . . . . . . 185 (2.4) 730 (3.5) 296 (133.1) (22) (0.1)
State tax credits . . . . . . . . . . . . . (931) 11.9 (573) 2.7 (208) 93.6 (554) (1.4)Change in liability for uncertain
tax positions . . . . . . . . . . . . . . 1,250 (16.0) 249 (1.2) 169 (76.1) 985 2.5Other . . . . . . . . . . . . . . . . . . . . . . 38 (0.5) (36) 0.2 — — (252) (0.6)
$ 843 (10.8%) $(6,703) 31.8% $1,014 (456.1%) 14,301 36.5%
The undistributed earnings of foreign subsidiaries at December 31, 2015 and 2014 were approximately$10.4 million and $8.2 million, respectively, and have been permanently reinvested. It is not practicable todetermine the amount of the additional taxes that would result if these earnings were repatriated.
Components of the Company’s net deferred tax liability included in the consolidated balance sheets consisted of thefollowing (in thousands):
SUCCESSOR
2015 2014
Deferred tax assets:Accrued liabilities . . . . . . . . . . . . . . . . . . . . . . . . . . . . . . . . . . . . . . . . . . . . . . . . . . . . . . . . $ 15,746 $ 16,802Depreciation and amortization . . . . . . . . . . . . . . . . . . . . . . . . . . . . . . . . . . . . . . . . . . . . . . 1,995 2,241Foreign operating loss carryforward . . . . . . . . . . . . . . . . . . . . . . . . . . . . . . . . . . . . . . . . . . . 250 274Foreign tax credit carryforward . . . . . . . . . . . . . . . . . . . . . . . . . . . . . . . . . . . . . . . . . . . . . . 4 5U.S. state and local tax credits and carryforward . . . . . . . . . . . . . . . . . . . . . . . . . . . . . . . . 153 421Other . . . . . . . . . . . . . . . . . . . . . . . . . . . . . . . . . . . . . . . . . . . . . . . . . . . . . . . . . . . . . . . . . . 1,128 1,396Valuation allowance . . . . . . . . . . . . . . . . . . . . . . . . . . . . . . . . . . . . . . . . . . . . . . . . . . . . . . (1,021) (1,086)
Total deferred tax assets . . . . . . . . . . . . . . . . . . . . . . . . . . . . . . . . . . . . . . . . . . . . . . . . 18,255 20,053
Deferred tax liabilities:Depreciation and amortization . . . . . . . . . . . . . . . . . . . . . . . . . . . . . . . . . . . . . . . . . . . . . . (38,970) (52,791)Prepaid expenses . . . . . . . . . . . . . . . . . . . . . . . . . . . . . . . . . . . . . . . . . . . . . . . . . . . . . . . . (161) (153)Other . . . . . . . . . . . . . . . . . . . . . . . . . . . . . . . . . . . . . . . . . . . . . . . . . . . . . . . . . . . . . . . . . . (71) (739)
Total deferred tax liabilities . . . . . . . . . . . . . . . . . . . . . . . . . . . . . . . . . . . . . . . . . . . . . . (39,202) (53,683)
Net deferred tax liability . . . . . . . . . . . . . . . . . . . . . . . . . . . . . . . . . . . . . . . . . . . . . . . . $(20,947) $(33,630)
F-34

The deferred tax asset attributable to U.S. state and local tax credits and carryforwards above includes $0.1 millionfor U.S. state and local operating loss carryforwards that expire at various times from 2015 to 2029.
The Company has foreign operating loss carryforwards for which a deferred tax asset of $0.3 million has beenestablished. The Company has a valuation allowance of $0.2 million against this deferred tax asset based upon itsassessment that it is more likely than not that this amount will not be realized. The ultimate realization of this taxbenefit is dependent upon the generation of sufficient operating income in the respective tax jurisdictions.Approximately 92% of the foreign net operating loss carryforwards can be utilized over an indefinite period whereasthe remainder will expire in 2020 if not utilized.
In December 2013, the Company recorded an impairment loss of $2.3 million and an associated deferred tax assetof $0.8 million on its cost method investment in a related party. In March 2014, the investment was sold and thecompany incurred a capital loss. This loss is limited to offset future capital gains which the Company does notanticipate will be generated, thus a valuation allowance of $0.8 million has been recorded as it is more likely thannot that realization cannot be assured.
Annual activity related to the Company’s valuation allowance is as follows (in thousands):
SUCCESSOR PREDECESSOR
YEAR ENDEDDECEMBER 31,
2015
PERIOD ENDEDDECEMBER 31,
2014
PERIOD ENDEDMARCH 31,
2014
YEAR ENDEDDECEMBER 31,
2013
Beginning Balance . . . . . . . . . . . . . . . . . . . . . . . . $1,086 $1,103 $ 305 $ 510Additions charged to expense . . . . . . . . . . . . . . . . — — 798 —Reductions from utilization, reassessments and
expirations . . . . . . . . . . . . . . . . . . . . . . . . . . . . (65) (17) — (205)
Ending Balance . . . . . . . . . . . . . . . . . . . . . . . . . . . $1,021 $1,086 $1,103 $ 305
A reconciliation of the beginning and ending balances of the total amounts of gross unrecognized tax benefits is asfollows (in thousands):
SUCCESSOR PREDECESSOR
YEAR ENDEDDECEMBER 31,
2015
PERIOD ENDEDDECEMBER 31,
2014
PERIOD ENDEDMARCH 31,
2014
YEAR ENDEDDECEMBER 31,
2013
Beginning Balance . . . . . . . . . . . . . . . . . . . . . . . . $1,353 $1,092 $ 938 $162Increases in tax positions for prior years . . . . . . . . — 31 134 —Decreases in tax positions for prior years . . . . . . . (14) (8) — —Increases in tax positions for current year . . . . . . 1,265 238 20 776
Ending Balance . . . . . . . . . . . . . . . . . . . . . . . . . . . $2,604 $1,353 $1,092 $938
Interest and penalties associated with uncertain tax positions are recognized as components of Income tax provision(benefit) in the consolidated statements of operations. There was no material change to tax-related interest andpenalties during the Successor year ended December 31, 2015, the Successor Period ended December 31, 2014,the Predecessor Period ended March 31, 2014 and the Predecessor year ended December 31, 2013. As ofDecember 31, 2015 and 2014, respectively, the Company has a liability for interest and penalties of $0.6 millionand $0.3 million that is associated with related tax liabilities of $1.8 million and $0.8 million for uncertain taxpositions.
The Company operates in various foreign, state and local jurisdictions. The number of tax years for which the statuteof limitations remains open for foreign, state and local jurisdictions varies by jurisdiction and is approximately fouryears (2012 through 2015). For federal tax purposes, the Company’s open tax years are 2012, 2013, 2014 and2015.
F-35

13. MISCELLANEOUS (EXPENSE) INCOME, NET
Miscellaneous (expense) income, net consisted of the following (in thousands):
SUCCESSOR PREDECESSOR
YEAR ENDEDDECEMBER 31,
2015
PERIOD ENDEDDECEMBER 31,
2014
PERIOD ENDEDMARCH 31,
2014
YEAR ENDEDDECEMBER 31,
2013
Net loss on foreign-currency transactions . . . . . . . $(1,307) $(1,156) $ (114) $ (338)Impairment loss on equity investment . . . . . . . . . — — — (2,250)Loss on extinguishment of debt . . . . . . . . . . . . . . — — — (1,523)Other income . . . . . . . . . . . . . . . . . . . . . . . . . . . . 174 855 1,327 2,393
Miscellaneous (expense) income, net . . . . . . . $(1,133) $ (301) $1,213 $(1,718)
14. RELATED PARTY TRANSACTIONS
Employee LoansThe Company periodically extends short term loans or advances to employees, typically upon commencement ofemployment. Total receivables as a result of these employee advances of $0.2 million and $0.3 million existed atDecember 31, 2015 and December 31, 2014, respectively and are included in the Prepaid expenses and othercurrent assets line item of the consolidated balance sheets.
Management FeesDuring the Successor year ended December 31, 2015 and the Successor Period ended December 31, 2014, theSuccessor Company incurred management fees to Cinven of $0.3 million and $0.2 million and $0.1 million and$0.1 million in related travel expenses, respectively. As of the Successor year ended December 31, 2015 and theSuccessor Period ended December 31, 2014, respectively, the Company had outstanding accounts payable toCinven of $0.1 million and $0.1 million. The Successor and Predecessor paid Transaction-related expenses onbehalf of or to Cinven and CCMP.
The Predecessor Company was obligated to pay management fees to a subsidiary of CCMP and incurred $0.1 millionand $0.3 million in such fees during the Predecessor Period ended March 31, 2014 and the Predecessor year endedDecember 31, 2013, respectively.
Consulting FeesIn 2014, the Successor Company paid $1.7 million in consulting fees to an investment banking firm in connectionwith the Transaction. A managing member of this firm was previously a Medpace board member.
Related Party Capital LeaseThe Company assumed a capital lease with a former employee associated with the Company’s medical deviceoperations. The capital lease liability is $0.1 million and $0.1 million as of December 31, 2015 and 2014,respectively. The Company made lease payments that were inclusive of interest expense totaling $0.1 million, $0.1million and $0.1 million during the Successor year ended December 31, 2015, the Successor Period endedDecember 31, 2014 and the Predecessor year ended December 31, 2013, respectively.
Service AgreementsSymplmed Pharmaceuticals, LLC (“Symplmed”)During 2013, the chief executive officer of Medpace acquired a majority ownership interest in Symplmed, a newpharmaceutical development company, and was elected to the board of directors along with two other executives.Also in 2013, Medpace entered into a Master Services Agreement (“MSA”) with Symplmed to perform clinical trials.
In 2013, the Predecessor Company evaluated its relationship with Symplmed and concluded that Symplmed was nota variable interest entity. As the Company has no direct ownership interest or relationship other than the MSA, therewere no other factors that required consolidation of Symplmed’s financial results.
F-36

During 2014 and 2015, the chief executive officer and other executives of Medpace made equity investments inSymplmed. Also in 2014, Symplmed entered into an Amended Master Services Agreement (the “Amended MSA”)with Medpace. The Amended MSA provides for a revised financing arrangement which allows for Symplmed to deferpayments of the services provided by the Company while incurring premium service charges as consideration for thedeferred payment concessions.
The equity contributions made by the Medpace executives prompted the Successor Company to reassess whetherSymplmed is a variable interest entity. Based on the evaluation performed, Symplmed is not a variable interest entityand no other direct ownership interests exist that would require consolidation of Symplmed’s financial results.
During the Successor year ended December 31, 2015 and the Successor Period ended December 31, 2014 theCompany recognized related party transactions of $1.2 million and $1.2 million as service revenue in theconsolidated statements of operations, respectively. As of December 31, 2015 the Company had accounts receivablefrom Symplmed of $0.3 million recorded in the consolidated balance sheet.
Coherus BioSciences, Inc. (“Coherus”) and MX II Associates, LLC (“MXII”)During 2011 a related party of the Company in which the Company’s chief executive officer is the managingmember, MXII, made an investment in Coherus. In early 2012 the Company made a $2.5 million investment inCoherus. Concurrent with the initial investment, MXII secured the exclusive rights for Medpace to perform Phase Ithrough Phase III clinical trial work for certain Coherus’ “bio-similar” drug compounds executed through a MSA. Inreturn, Medpace agreed to pay a 10% sales commission to MXII on cash received from Coherus. The commissionagreement between the Company and MXII was terminated during 2015 but did not impact the MSA between theCompany and Coherus. Accordingly, Medpace paid a $0.3 million sales commission during 2012 pursuant to a$2.5 million advance payment received from Coherus for the aforementioned clinical trial work. In addition,Medpace paid commissions of $1.1 million, $0.6 million and $0.3 million during the Successor year endedDecember 31, 2015, the Successor Period ended December 31, 2014 and the Predecessor Period ended March 31,2014, respectively, and were recorded in Selling, general and administrative in the consolidated statements ofoperations. During the Successor year ended December 31, 2015, the Successor Period ended December 31, 2014,the Predecessor Period ended March 31, 2014 and the Predecessor year ended December 31, 2013, the Companyrecognized service revenue of $22.1 million, $10.6 million, $2.0 million, and $3.3 million from Coherus in theCompany’s consolidated statements of operations, respectively. In addition, the company recognized Reimbursedout-of-pocket revenue and Reimbursed out-of-pocket expenses with Coherus in the consolidated statements ofoperations of $6.9 million, $2.0 million, $0.1 million and $0.1 million during the Successor year endedDecember 31, 2015, the Successor Period ended December 31, 2014, the Predecessor Period ended March 31,2014 and the Predecessor year ended December 31, 2013, respectively. As of December 31, 2015 andDecember 31, 2014 the Company had accounts receivable from Coherus of $2.0 million and $0.7 million recordedin the consolidated balance sheets, respectively. In addition, the Company had Advanced billings of $8.4 millionand $5.3 million and Pre-funded study costs of $3.5 million and $2.4 million with Coherus recorded in theconsolidated balance sheets at December 31, 2015 and 2014, respectively.
As of December 31, 2013, the Predecessor Company recorded an impairment loss of $2.3 million on its costmethod investment in Coherus in contemplation of the ultimate liquidation of this investment prior to theTransaction. The impairment loss is reflected as a component of Miscellaneous (expense) income, net in theconsolidated statements of operations. In March 2014, the investment was sold to Medpace Investors for$0.3 million and was reflected in the other income component of Miscellaneous (expense) income, net in theconsolidated statements of operations for the Predecessor Period ended March 31, 2014.
Xenon Pharmaceuticals, Inc. (“Xenon”)Certain executives and employees of the Company, including the chief executive officer, have equity investments inXenon, a clinical-stage biopharmaceutical company. In addition, a Medpace employee was a director of Xenon untilMay 2015. During July 2015 the Company and Xenon entered into an amended MSA agreement for the Company toprovide certain clinical development services. During the Successor year ended December 31, 2015 the Companyrecognized service revenue of $0.7 million in the Company’s consolidated statements of operations. As ofDecember 31, 2015, the Company had $1.8 million and $0.2 million of Advanced billings and Pre-funded studycosts, respectively, in the consolidated balance sheets.
F-37

Medpace Investors, LLCMedpace Investors is a noncontrolling shareholder and related party of Medpace Holdings, Inc. Medpace Investors isowned and managed by employees of the Company. The chief executive officer of Medpace is also the manager andmajority unit holder of Medpace Investors. The Successor Company acts as a paying agent for Medpace Investorswith taxing authorities principally in instances when employee tax payments or remittance of withholdings related toequity compensation are required. During the Successor year ended December 31, 2015 and the Successor Periodended December 31, 2014, the Successor Company paid $0.9 million and $1.4 million to various taxing authoritieson behalf of Medpace Investors.
Leased Real EstateHeadquarters LeaseThe Predecessor Company entered into an operating lease with 100 Medpace Way, LLC (“100 MW”), which iswholly owned by the chief executive officer of the Company, for an initial term of twelve years with a renewal optionfor one 10-year term at prevailing market rates. The Company pays rent, taxes, insurance, and maintenanceexpenses that arise from the use of the property. Annual base rent in effect at December 31, 2015 under the leaseagreement is $2.1 million. The lease allows for adjustments to the rental rate annually for increases in the consumerprice index.
For the Successor year ended December 31, 2015, the Successor Period ended December 31, 2014, thePredecessor Period ended March 31, 2014 and the Predecessor year ended December 31, 2013, lease expense for100 MW of $2.1 million, $1.6 million, $0.5 million and $2.1 million, respectively, was allocated between Directcosts, excluding depreciation and amortization, and Selling, general and administrative in the consolidatedstatements of operations. Additionally, the Successor Company prepaid $0.2 million in lease payments to 100 MWwhich is recorded as a component of Prepaid expenses and other current assets on the consolidated balance sheet atDecember 31, 2014.
Deemed Assets and Deemed Landlord LiabilitiesThe Predecessor Company entered into two multi-year leases of office space commencing in July 2012 andSeptember 2012 with 200 Medpace Way, LLC (“200 MW”) and 300 Medpace Way, LLC (“300 MW”), respectively.Both 200 MW and 300 MW are wholly owned by the Company’s chief executive officer and certain of his immediatefamily. The Company recognizes Deemed landlord liabilities according to their term in the consolidated balancesheets. The obligation was initially recorded by the Predecessor Company at its net present value using the notionalrates implicit in the lease agreements. The Successor Company revalued the liability by calculating the net presentvalue using the Company’s incremental borrowing rate at the time of the Transaction. Accretion expense is beingrecorded over the term of the lease as a component of Interest expense, net in the Company’s consolidatedstatements of operations. During the Successor year ended December 31, 2015, the Successor Period endedDecember 31, 2014, the Predecessor Period ended March 31, 2014 and the Predecessor year ended December 31,2013, the Company paid $3.4 million, $3.1 million, $0.9 million and $2.7 million, respectively, in rents, which areaccounted for as principal and interest payments on the Deemed landlord liability in accordance with the accountingguidance governing such transactions.
Travel ServicesATSB AviationThe Company incurs expenses for travel services for company executives provided by a private aviation chartercompany which is owned by the chief executive officer and another executive of the Company (“Private AviationCharter”). The Company may contract directly with the private aviation charter for the use of its aircraft or indirectlythrough a third party aircraft management and jet charter company (the “Aircraft Management Company”). Thetravel services provided are primarily for business purposes, with any personal travel paid for as part of theexecutives’ compensation arrangements. The Aircraft Management Company also makes the Private Aviation Charteraircraft available to other third parties. The Company incurred travel expenses of $0.9 million, $0.5 million and$0.1 million during the Successor year ended December 31, 2015, the Successor Period ended December 31,2014 and the Predecessor Period ended March 31, 2014, respectively, related to these travel services, and arerecorded in Selling, general and administrative in the Company’s consolidated statements of operations.
F-38
Common Stock PurchasesDuring 2015, an employee of the Company entered into a stock purchase agreement (“SPA”) with the Company thatpermitted the purchase of 37,037 shares of the Company’s common stock at the then-current value for those shares.There was no stock-based compensation expense recognized in relation to the SPA due to no required services to berendered in exchange for shares. The proceeds from this SPA are reflected as Proceeds from sale of common stock inthe consolidated statement of cash flows for the Successor year ended 2015.
During 2013, the chief executive officer of the Company entered into a SPA with the Company that permitted him topurchase 120,000 shares of the Company’s common stock at the then-current market value for those shares. Inexchange, the chief executive officer agreed to forfeit his ownership of 80,000 unvested stock options that wereoriginally scheduled to vest at various dates through 2016. The proceeds from this stock purchase are reflected asStock issued and Proceeds from sale of common stock, respectively, in the Predecessor Company’s consolidatedstatement of shareholders’ equity and consolidated statement of cash flows for the Predecessor year endedDecember 31, 2013.
Assets and Obligations Related to Former OwnersPursuant to the Medpace, Inc. Stock Purchase Agreement dated June 17, 2011 (the “Predecessor PurchaseAgreement”), certain tax indemnifications between the sellers (a group led by the former majority shareholder who isthe current chief executive officer, the “Former Owners”) and the buyers (led by CCMP) were entered into regardingcontingencies that could arise after the June 17, 2011 transaction, as well as tax payments or refunds that werefinalized after June 17, 2011 but which relate to periods prior to the Predecessor Purchase Agreement date. InFebruary 2015, a settlement was reached with a local taxing authority regarding the refund of income tax paymentsmade by the Company prior to June 17, 2011. On the consolidated balance sheets at December 31, 2015 and2014, the Successor has $0.4 million and $0.6 million in Prepaid expenses and other current assets and Otherassets related to the tax refund due from the local taxing authority and $0.4 million and $0.6 million in Othercurrent liabilities and Other long-term liabilities representing the obligation to the Former Owners. The Successorhas $0.1 million and $0.1 million in Prepaid expenses and other current assets and $0.1 million and $0.3 millionin Other current liabilities on the consolidated balance sheets at December 31, 2015 and 2014, associated withrefunds from various other taxing authorities that were generated prior to June 17, 2011.
15. ACQUISITION AND INTEGRATION EXPENSES
The Successor Company and the Predecessor Company incurred $9.3 million and $12.4 million of one-timeAcquisition and integration expenses related to the Transaction during the Successor Period ended December 31,2014 and the Predecessor Period ended March 31, 2014, respectively, primarily for investment banking, legal,accounting, consulting and other advisory fees.
16. ENTITY WIDE DISCLOSURES
Operations By Geographic LocationThe Company conducts operations in North America, Europe, Africa, Asia-Pacific and Latin America through wholly-owned subsidiaries and representative sales offices. The Company attributes service revenue to geographicallocations based upon the location of the contracting entity. Service revenue attributable to the U.S. representapproximately 98% of total consolidated service revenue, net. No other country or region represents more than 5% ofservice revenue, net.
F-39

The following table summarizes property and equipment, net by geographic region and is further broken down toshow countries which account for 10% or more of total as of December 31, (in thousands):
SUCCESSOR
2015 2014
Property and equipment, net:United States . . . . . . . . . . . . . . . . . . . . . . . . . . . . . . . . . . . . . . . . . . . . . . . . . . . . . . . . . . . . . . . $28,152 $29,928Europe:
Belgium . . . . . . . . . . . . . . . . . . . . . . . . . . . . . . . . . . . . . . . . . . . . . . . . . . . . . . . . . . . . . . . . . 3,896 3,947Other . . . . . . . . . . . . . . . . . . . . . . . . . . . . . . . . . . . . . . . . . . . . . . . . . . . . . . . . . . . . . . . . . . . 3,968 2,719
Total Europe . . . . . . . . . . . . . . . . . . . . . . . . . . . . . . . . . . . . . . . . . . . . . . . . . . . . . . . . . . . 7,864 6,666Other . . . . . . . . . . . . . . . . . . . . . . . . . . . . . . . . . . . . . . . . . . . . . . . . . . . . . . . . . . . . . . . . . . . . . . 1,496 1,490
Total property and equipment, net . . . . . . . . . . . . . . . . . . . . . . . . . . . . . . . . . . . . . . . . . . . . . . . $37,512 $38,084
Products & Services
Clinical research services and laboratory services represented approximately 87% and 13%, 85% and 15%, 85%and 15%, and 86% and 14% of consolidated service revenue, net for the Successor year ended December 31, 2015and period ended December 31, 2014 and the Predecessor Period ended March 31, 2014 and year endedDecember 31, 2013, respectively.
17. SUBSEQUENT EVENTS
The Company has evaluated subsequent events through March 1, 2016, the date the consolidated financialstatements were available to be issued, and July 25, 2016, the date on which the retrospectively revised Successorconsolidated financial statements were issued (as to the reverse stock split described in Note 3), and determinedthat the following event required recognition or disclosure in the financial statements:
As disclosed in Note 3, on July 25, 2016, the Board of Directors of the Company approved, and made legallyeffective, a 1-for-1.35 reverse stock split of the Company’s common stock. All share, stock option and per shareinformation presented in the Successor consolidated financial statements have been adjusted to reflect the reversestock split on a retroactive basis for all periods presented. The Company will make a cash payment to shareholdersfor all fractional shares which would have otherwise been required to be issued as a result of the reverse stock split.There was no change in number of authorized shares or the par value of the Company’s common stock.
F-40

MEDPACE HOLDINGS, INC. AND SUBSIDIARIES
CONDENSED CONSOLIDATED BALANCE SHEETS (UNAUDITED)(Amounts in thousands, except share amounts)
AS OF
JUNE 30,2016
DECEMBER 31,2015
ASSETSCurrent assets:
Cash and cash equivalents . . . . . . . . . . . . . . . . . . . . . . . . . . . . . . . . . . . . . . . . . . . . . $ 13,674 $ 14,880Restricted cash . . . . . . . . . . . . . . . . . . . . . . . . . . . . . . . . . . . . . . . . . . . . . . . . . . . . . . 3,366 2,857Accounts receivable and unbilled, net (includes $3.8 million and $2.9 million with
related parties at June 30, 2016 and December 31, 2015, respectively) . . . . . . . 90,048 65,088Prepaid expenses and other current assets . . . . . . . . . . . . . . . . . . . . . . . . . . . . . . . . . 20,402 11,896
Total current assets . . . . . . . . . . . . . . . . . . . . . . . . . . . . . . . . . . . . . . . . . . . . . . 127,490 94,721Property and equipment, net . . . . . . . . . . . . . . . . . . . . . . . . . . . . . . . . . . . . . . . . . . . . . . 40,168 37,512Goodwill . . . . . . . . . . . . . . . . . . . . . . . . . . . . . . . . . . . . . . . . . . . . . . . . . . . . . . . . . . . . . . 660,981 660,981Intangible assets, net . . . . . . . . . . . . . . . . . . . . . . . . . . . . . . . . . . . . . . . . . . . . . . . . . . . . 161,407 186,743Deferred income taxes . . . . . . . . . . . . . . . . . . . . . . . . . . . . . . . . . . . . . . . . . . . . . . . . . . . . 126 157Other assets . . . . . . . . . . . . . . . . . . . . . . . . . . . . . . . . . . . . . . . . . . . . . . . . . . . . . . . . . . . 4,691 3,927
Total assets . . . . . . . . . . . . . . . . . . . . . . . . . . . . . . . . . . . . . . . . . . . . . . . . . . . . $994,863 $984,041
LIABILITIES AND SHAREHOLDERS’ EQUITYCurrent liabilities:
Accounts payable . . . . . . . . . . . . . . . . . . . . . . . . . . . . . . . . . . . . . . . . . . . . . . . . . . . . . $ 7,227 $ 8,728Accrued expenses . . . . . . . . . . . . . . . . . . . . . . . . . . . . . . . . . . . . . . . . . . . . . . . . . . . . 18,683 20,111Pre-funded study costs (includes $4.3 million and $3.7 million with related parties
at June 30, 2016 and December 31, 2015, respectively) . . . . . . . . . . . . . . . . . . . 48,971 46,599Advanced billings (includes $11.5 million and $10.2 million with related parties at
June 30, 2016 and December 31, 2015, respectively) . . . . . . . . . . . . . . . . . . . . . 66,084 51,051Other current liabilities . . . . . . . . . . . . . . . . . . . . . . . . . . . . . . . . . . . . . . . . . . . . . . . . 8,785 7,528
Total current liabilities . . . . . . . . . . . . . . . . . . . . . . . . . . . . . . . . . . . . . . . . . . . 149,750 134,017Long-term debt, net, less current portion . . . . . . . . . . . . . . . . . . . . . . . . . . . . . . . . . . 364,033 377,882Deemed landlord liability, less current portion . . . . . . . . . . . . . . . . . . . . . . . . . . . . . . 29,425 30,273Deferred income tax liability . . . . . . . . . . . . . . . . . . . . . . . . . . . . . . . . . . . . . . . . . . . . 20,587 21,104Other long-term liabilities . . . . . . . . . . . . . . . . . . . . . . . . . . . . . . . . . . . . . . . . . . . . . . 8,432 7,291
Total liabilities . . . . . . . . . . . . . . . . . . . . . . . . . . . . . . . . . . . . . . . . . . . . . . . . . 572,227 570,567Commitments and contingencies (see Note 10)Shareholders’ equity:
Common stock—$0.01 par-value; 60,000,000 shares authorized; 32,642,113 and32,624,461 shares issued and outstanding at June 30, 2016 and December 31,2015, respectively . . . . . . . . . . . . . . . . . . . . . . . . . . . . . . . . . . . . . . . . . . . . . . . . . 326 326
Additional paid-in capital . . . . . . . . . . . . . . . . . . . . . . . . . . . . . . . . . . . . . . . . . . . . . . 439,460 438,716Accumulated deficit . . . . . . . . . . . . . . . . . . . . . . . . . . . . . . . . . . . . . . . . . . . . . . . . . . . (14,599) (23,009)Accumulated other comprehensive loss . . . . . . . . . . . . . . . . . . . . . . . . . . . . . . . . . . . . (2,551) (2,559)
Total shareholders’ equity . . . . . . . . . . . . . . . . . . . . . . . . . . . . . . . . . . . . . . . . . 422,636 413,474
Total liabilities and shareholders’ equity . . . . . . . . . . . . . . . . . . . . . . . . . . . . . . $994,863 $984,041
See notes to condensed consolidated financial statements.
F-41

MEDPACE HOLDINGS, INC. AND SUBSIDIARIES
CONDENSED CONSOLIDATED STATEMENTS OF OPERATIONS (UNAUDITED)(Amounts in thousands, except per share amounts)
SIX MONTHS ENDEDJUNE 30,
2016 2015
Revenue:Service revenue, net (includes $12.4 million and $11.5 million with related parties for
the six months ended June 30, 2016 and 2015, respectively) . . . . . . . . . . . . . . . . . $180,433 $152,782Reimbursed out-of-pocket revenue (includes $2.9 million and $4.2 million with related
parties for the six months ended June 30, 2016 and 2015, respectively) . . . . . . . . . 25,107 18,105
Total revenue . . . . . . . . . . . . . . . . . . . . . . . . . . . . . . . . . . . . . . . . . . . . . . . . . . . . . 205,540 170,887Operating Expenses:
Direct costs, excluding depreciation and amortization . . . . . . . . . . . . . . . . . . . . . . . . . . . 96,215 77,725Reimbursed out-of-pocket expenses (includes $2.9 million and $4.2 million with
related parties for the six months ended June 30, 2016 and 2015, respectively) . . . 25,107 18,105Selling, general and administrative . . . . . . . . . . . . . . . . . . . . . . . . . . . . . . . . . . . . . . . . . . 28,333 23,448Depreciation . . . . . . . . . . . . . . . . . . . . . . . . . . . . . . . . . . . . . . . . . . . . . . . . . . . . . . . . . . . 3,566 3,110Amortization . . . . . . . . . . . . . . . . . . . . . . . . . . . . . . . . . . . . . . . . . . . . . . . . . . . . . . . . . . . 25,336 34,243
Total operating expenses . . . . . . . . . . . . . . . . . . . . . . . . . . . . . . . . . . . . . . . . . . . . 178,557 156,631
Income from operations . . . . . . . . . . . . . . . . . . . . . . . . . . . . . . . . . . . . . . . . . . . . . . . . . . . . . 26,983 14,256Other Expense, Net:
Miscellaneous expense, net . . . . . . . . . . . . . . . . . . . . . . . . . . . . . . . . . . . . . . . . . . . . . . . (941) (978)Interest expense, net . . . . . . . . . . . . . . . . . . . . . . . . . . . . . . . . . . . . . . . . . . . . . . . . . . . . . (11,894) (13,975)
Total other expense, net . . . . . . . . . . . . . . . . . . . . . . . . . . . . . . . . . . . . . . . . . . . . . (12,835) (14,953)
Income (loss) before income taxes . . . . . . . . . . . . . . . . . . . . . . . . . . . . . . . . . . . . . . . . . . . . . 14,148 (697)Income tax provision (benefit) . . . . . . . . . . . . . . . . . . . . . . . . . . . . . . . . . . . . . . . . . . . . . . . . 5,738 (733)
Net income . . . . . . . . . . . . . . . . . . . . . . . . . . . . . . . . . . . . . . . . . . . . . . . . . . . . . . . . . . . . . . . $ 8,410 $ 36
Net income per share attributable to common shareholders:Basic . . . . . . . . . . . . . . . . . . . . . . . . . . . . . . . . . . . . . . . . . . . . . . . . . . . . . . . . . . . . . . . . . $ 0.26 $ —Diluted . . . . . . . . . . . . . . . . . . . . . . . . . . . . . . . . . . . . . . . . . . . . . . . . . . . . . . . . . . . . . . . $ 0.26 $ —
Weighted average common shares outstanding:Basic . . . . . . . . . . . . . . . . . . . . . . . . . . . . . . . . . . . . . . . . . . . . . . . . . . . . . . . . . . . . . . . . . 32,631 31,527Diluted . . . . . . . . . . . . . . . . . . . . . . . . . . . . . . . . . . . . . . . . . . . . . . . . . . . . . . . . . . . . . . . 32,631 31,591
See notes to condensed consolidated financial statements.
F-42

MEDPACE HOLDINGS, INC. AND SUBSIDIARIES
CONDENSED CONSOLIDATED STATEMENTS OF COMPREHENSIVE INCOME (LOSS) (UNAUDITED)(Amounts in thousands)
SIX MONTHS ENDEDJUNE 30,
2016 2015
Net income . . . . . . . . . . . . . . . . . . . . . . . . . . . . . . . . . . . . . . . . . . . . . . . . . . . . . . . . . . . . . . . . . . . $8,410 $ 36Other comprehensive income (loss)
Foreign currency translation adjustments, net of taxes . . . . . . . . . . . . . . . . . . . . . . . . . . . . . . . 8 (395)
Comprehensive income (loss) . . . . . . . . . . . . . . . . . . . . . . . . . . . . . . . . . . . . . . . . . . . . . . . . . . . . . $8,418 $(359)
See notes to condensed consolidated financial statements.
F-43

MEDPACE HOLDINGS, INC. AND SUBSIDIARIES
CONDENSED CONSOLIDATED STATEMENT OF SHAREHOLDERS’ EQUITY (UNAUDITED)(Amounts in thousands)
COMMONSTOCK
ADDITIONALPAID-INCAPITAL
(ACCUMULATEDDEFICIT)
RETAINEDEARNINGS
ACCUMULATEDOTHER
COMPREHENSIVEINCOME (LOSS) TOTAL
BALANCE—December 31, 2015 . . . . . . . . . $326 $438,716 $(23,009) $(2,559) $413,474Net income . . . . . . . . . . . . . . . . . . . . . . . 8,410 8,410Foreign currency translation . . . . . . . . . . 8 8Stock-based compensation expense . . . . 557 557Stock options exercised . . . . . . . . . . . . . . 187 187
BALANCE—June 30, 2016 . . . . . . . . . . . . . $326 $439,460 $(14,599) $(2,551) $422,636
See notes to condensed consolidated financial statements.
F-44

MEDPACE HOLDINGS, INC. AND SUBSIDIARIES
CONDENSED CONSOLIDATED STATEMENTS OF CASH FLOWS (UNAUDITED)(Amounts in thousands)
SIX MONTHS ENDEDJUNE 30,
2016 2015
CASH FLOWS FROM OPERATING ACTIVITIES:Net income . . . . . . . . . . . . . . . . . . . . . . . . . . . . . . . . . . . . . . . . . . . . . . . . . . . . . . . . . . . . . . . . $ 8,410 $ 36
Adjustments to reconcile net income to net cash provided by operating activities:Depreciation . . . . . . . . . . . . . . . . . . . . . . . . . . . . . . . . . . . . . . . . . . . . . . . . . . . . . . . . . 3,566 3,110Amortization . . . . . . . . . . . . . . . . . . . . . . . . . . . . . . . . . . . . . . . . . . . . . . . . . . . . . . . . . 25,336 34,243Stock-based compensation expense . . . . . . . . . . . . . . . . . . . . . . . . . . . . . . . . . . . . . . . 4,275 4,905Amortization of debt issuance costs and discount . . . . . . . . . . . . . . . . . . . . . . . . . . . . . 1,345 1,328Deferred income tax benefit . . . . . . . . . . . . . . . . . . . . . . . . . . . . . . . . . . . . . . . . . . . . . (483) (6,504)Other . . . . . . . . . . . . . . . . . . . . . . . . . . . . . . . . . . . . . . . . . . . . . . . . . . . . . . . . . . . . . . . (207) 195
Changes in assets and liabilities:Restricted cash . . . . . . . . . . . . . . . . . . . . . . . . . . . . . . . . . . . . . . . . . . . . . . . . . . . . . . . (509) (595)Accounts receivable and unbilled, net . . . . . . . . . . . . . . . . . . . . . . . . . . . . . . . . . . . . . . (24,825) 6,740Prepaid expenses and other current assets . . . . . . . . . . . . . . . . . . . . . . . . . . . . . . . . . . (8,551) (1,579)Accounts payable . . . . . . . . . . . . . . . . . . . . . . . . . . . . . . . . . . . . . . . . . . . . . . . . . . . . . . (2,112) (720)Accrued expenses . . . . . . . . . . . . . . . . . . . . . . . . . . . . . . . . . . . . . . . . . . . . . . . . . . . . . (1,461) (2,849)Pre-funded study costs . . . . . . . . . . . . . . . . . . . . . . . . . . . . . . . . . . . . . . . . . . . . . . . . . 2,372 (1,252)Advanced billings . . . . . . . . . . . . . . . . . . . . . . . . . . . . . . . . . . . . . . . . . . . . . . . . . . . . . 15,017 (6,532)Other assets and liabilities, net . . . . . . . . . . . . . . . . . . . . . . . . . . . . . . . . . . . . . . . . . . . (2,191) (4,255)
Net cash provided by operating activities . . . . . . . . . . . . . . . . . . . . . . . . . . . . . . . . . 19,982 26,271
CASH FLOWS FROM INVESTING ACTIVITIES:Property and equipment expenditures . . . . . . . . . . . . . . . . . . . . . . . . . . . . . . . . . . . . . . . . (5,693) (2,665)Other . . . . . . . . . . . . . . . . . . . . . . . . . . . . . . . . . . . . . . . . . . . . . . . . . . . . . . . . . . . . . . . . . . 40 7
Net cash used in investing activities . . . . . . . . . . . . . . . . . . . . . . . . . . . . . . . . . . . . (5,653) (2,658)
CASH FLOWS FROM FINANCING ACTIVITIES:Proceeds from stock option exercises . . . . . . . . . . . . . . . . . . . . . . . . . . . . . . . . . . . . . . . . . 102 —Payment of debt . . . . . . . . . . . . . . . . . . . . . . . . . . . . . . . . . . . . . . . . . . . . . . . . . . . . . . . . . (15,036) (65,126)Payment of deemed landlord liability . . . . . . . . . . . . . . . . . . . . . . . . . . . . . . . . . . . . . . . . . (744) (576)
Net cash used in financing activities . . . . . . . . . . . . . . . . . . . . . . . . . . . . . . . . . . . . (15,678) (65,702)
EFFECTS OF EXCHANGE RATES ON CASH AND CASH EQUIVALENTS . . . . . . . . . . . . . . . . . 143 (95)DECREASE IN CASH AND CASH EQUIVALENTS . . . . . . . . . . . . . . . . . . . . . . . . . . . . . . . . . . (1,206) (42,184)CASH AND CASH EQUIVALENTS—Beginning of period . . . . . . . . . . . . . . . . . . . . . . . . . . . . . 14,880 54,285
CASH AND CASH EQUIVALENTS—End of period . . . . . . . . . . . . . . . . . . . . . . . . . . . . . . . . . . $ 13,674 $ 12,101
See notes to condensed consolidated financial statements.
F-45

MEDPACE HOLDINGS, INC. AND SUBSIDIARIES
NOTES TO CONDENSED CONSOLIDATED FINANCIAL STATEMENTS (Unaudited)JUNE 30, 2016
1. BASIS OF PRESENTATIONDescription of BusinessMedpace Holdings, Inc. together with its subsidiaries (“Medpace” or the “Company”) is a global provider of clinicalresearch-based drug and medical device development services. The Company partners with pharmaceutical,biotechnology, and medical device companies in the development and execution of clinical trials. The Company’sdrug development services focus on full service Phase I-IV clinical development services and include developmentplan design, coordinated central laboratory, project management, regulatory affairs, clinical monitoring, datamanagement and analysis, pharmacovigilance new drug application submissions, and post-marketing clinicalsupport. The Company also provides bio-analytical laboratory services, clinical human pharmacology, imagingservices, and electrocardiography reading support for clinical trials.
The Company’s operations are principally based in North America, Europe, and Asia.
Unaudited Interim Financial InformationThe interim condensed consolidated financial statements include the accounts of the Company, are prepared inconformity with U.S. generally accepted accounting principles (“GAAP”), and are unaudited. In the opinion of theCompany’s management, all adjustments of a normal recurring nature necessary for a fair presentation have beenreflected. Certain financial information that is normally included in annual financial statements prepared inaccordance with GAAP, but that is not required for interim reporting purposes, has been omitted. The accompanyinginterim condensed consolidated financial statements and related notes should be read in conjunction with theCompany’s consolidated financial statements and related notes included in the Company’s audited financialstatements for the year ended December 31, 2015.
The preparation of the interim condensed consolidated financial statements in conformity with GAAP requiresmanagement to make estimates and assumptions that affect the reported amounts of assets and liabilities anddisclosure of contingent assets and liabilities at the date of the interim condensed consolidated financial statementsand the reported amounts of revenues and expenses during the reporting period. Actual results and outcomes coulddiffer from management’s estimates and assumptions.
Stock SplitOn July 25, 2016, the Board of Directors of the Company approved, and made legally effective, a 1-for-1.35 reversestock split of the Company’s common stock. All share, stock option and per share information presented in thecondensed consolidated financial statements have been adjusted to reflect the reverse stock split on a retroactivebasis for all periods presented. The Company will make a cash payment to shareholders for all fractional shareswhich would have otherwise been required to be issued as a result of the reverse stock split. There was no change innumber of authorized shares or the par value of the Company’s common stock.
Recently Adopted Accounting StandardsIn April 2015, the Financial Accounting Standards Board (“FASB”) issued Accounting Standards Update (“ASU”)2015-05, “Customer’s Accounting for Fees Paid in a Cloud Computing Arrangement,” which provides guidance for acustomer’s accounting for cloud computing costs. Under ASU 2015-05, if a software cloud computing arrangementcontains a software license, customers should account for the license element of the arrangement in a mannerconsistent with the acquisition of other software licenses. If the arrangement does not contain a software license,customers should account for the arrangement as a service contract. This standard may be applied prospectively toall arrangements entered into or materially modified after the effective date, or retrospectively. The Companyadopted ASU 2015-05 in the first quarter of 2016. There was no impact to the Company’s condensed consolidatedstatements of operations, comprehensive (loss) income, shareholders’ equity or cash flows.
Recently Issued Accounting StandardsIn June 2016, the FASB issued ASU 2016-13, Financial Instruments-Credit Losses (Topic 326), Measurement ofCredit Losses on Financial Instruments. The new guidance adds Topic 326 to the Codification and removes thethresholds that companies apply to measure credit losses on financial instruments measured at amortized cost, such
F-46

as loans, receivables, and held-to-maturity debt securities. Under current U.S. GAAP, companies generally recognizecredit losses when it is probable that the loss has been incurred. The revised guidance will remove all recognitionthresholds and will require companies to recognize an allowance for credit losses for the difference between theamortized cost basis of a financial instrument and the amount of amortized cost that the company expects to collectover the instrument’s contractual life. ASU 2016-13 will be applied on a prospective basis for fiscal years andinterim periods beginning after December 15, 2019, with early adoption permitted for fiscal years beginning andinterim periods beginning after December 15, 2018. The Company is currently evaluating the effect this standardwill have on its condensed consolidated financial statements.
In May 2016, the FASB issued ASU 2016-12, Narrow-Scope Improvements and Practical Expedients. In March2016, the FASB issued ASU 2016-08, Revenue from Contracts with Customers (Topic 606): Principal versus AgentConsiderations (Reporting Revenue Gross versus Net). In April 2016, the FASB issued ASU 2016-10, Revenue fromContracts with Customers (Topic 606): Identifying Performance Obligations and Licensing. ASUs’ 2016-12, 2016-10 and 2016-08 all clarify the interpretation guidance in ASU No. 2014-09, “Revenue from Contracts withCustomers” specifically related to narrowing specific aspects of Topic 606 and adding illustrative examples to assistin the application of the guidance. The effective date and transition requirements in ASUs’ 2016-12, 2016-10, and2016-08 are the same as the effective date and transition requirements of ASU 2014-09. ASU 2015-14, Revenuefrom Contracts with Customers (Topic 606): Deferral of the Effective Date, which defers the effective date of ASU2014-09 by one year. The Company will adopt the clarified guidance in ASUs’ 2016-12, 2016-10, 2016-08 byJanuary 1, 2018, as required. The Company is currently evaluating the impact of this new standard on its condensedconsolidated financial statements.
In March 2016, the FASB issued ASU No. 2016-09, Improvements to Employee Share-Based Payment Accounting.The new guidance is intended to simplify certain aspects of accounting for share-based payments to employeesincluding the accounting for income taxes, forfeitures, and statutory tax withholding requirements, as well asclassification in the statement of cash flows. ASU 2016-09 is effective for fiscal years beginning after December 15,2016, and for interim periods within those fiscal years. Early adoption is permitted, but all guidance must beadopted in the same period. The Company is currently evaluating the effect this standard will have on its condensedconsolidated financial statements.
In February 2016, the FASB issued ASU 2016-02, Leases (Topic 842). The guidance in ASU 2016-02 supersedesthe lease recognition requirements in ASC Topic 840, Leases (FAS 13). ASU 2016-02 requires an entity torecognize assets and liabilities arising from a lease for both financing and operating leases, along with additionalqualitative and quantitative disclosures. ASU 2016-02 will be applied on a modified retrospective basis and to eachprior reporting period presented and is effective for fiscal years beginning after December 15, 2018, with earlyadoption permitted. The Company is currently evaluating the effect this standard will have on its condensedconsolidated financial statements.
2. NET INCOME (LOSS) PER SHARE
Basic and diluted earnings per share (“EPS”) are computed using the two-class method, which is an earningsallocation that determines EPS for each class of common stock and participating securities according to dividendsdeclared and participation rights in undistributed earnings. Basic net income (loss) per share is calculated bydividing net income (loss) by the weighted average number of common shares outstanding, including outstandingparticipating securities. Diluted net income (loss) per share is similar to basic net income (loss) per share, butadjusts for the potential issuance of common shares. The Company’s restricted stock awards (“RSAs”) contain non-forfeitable rights or dividend equivalents and participate in periods of net income but are not contractually obligatedto share in the Company’s losses. As a result, RSAs are included in the number of shares in our basic and dilutedEPS in periods of net income but are excluded in the number of shares in our basic and diluted EPS in periods ofnet loss.
F-47

The following table reconciles the basic to diluted weighted average shares outstanding (in thousands):
SIX MONTHS ENDEDJUNE 30,
2016 2015
Basic weighted average common shares outstanding . . . . . . . . . . . . . . . . . . . . . . . . . . . . . . . . . . . 32,631 31,527Effect of dilutive securities . . . . . . . . . . . . . . . . . . . . . . . . . . . . . . . . . . . . . . . . . . . . . . . . . . . . . . . — 64
Diluted weighted average common shares outstanding . . . . . . . . . . . . . . . . . . . . . . . . . . . . . . . . . . 32,631 31,591
Anti-dilutive shares . . . . . . . . . . . . . . . . . . . . . . . . . . . . . . . . . . . . . . . . . . . . . . . . . . . . . . . . . . . . . 26 599
The anti-dilutive shares disclosed above were calculated using the treasury stock method. During the six monthsended June 30, 2016 and June 30, 2015, the Company had stock options that were excluded due to the exerciseprice exceeding the average fair value of the Company’s common stock during the period.
3. FAIR VALUE MEASUREMENTSThe Company follows accounting guidance related to fair value measurements that defines fair value, establishes aframework for measuring fair value, and establishes a hierarchy for inputs used in measuring fair value. This hierarchymaximizes the use of “observable” inputs and minimizes the use of unobservable inputs by requiring that the mostobservable inputs be used when available. The hierarchy specifies three levels based on the inputs, as follows:
Level 1: Valuations based on quoted prices in active markets for identical assets or liabilities.
Level 2: Valuations based on directly observable inputs or unobservable inputs corroborated by market data.
Level 3: Valuations based on unobservable inputs supported by little or no market activity representingmanagement’s determination of assumptions of how market participants would price the assets or liabilities.
The fair value of financial instruments such as cash and cash equivalents, accounts receivable and unbilled, net,accounts payable, accrued expenses and advanced billings approximate their carrying amounts due to their shortterm maturities.
The Company does not have any recurring fair value measurements as of June 30, 2016. There were no transfersbetween Level 1, Level 2 or Level 3 during the three or six months ended June 30, 2016 or June 30, 2015.
Non-recurring Fair Value MeasurementsCertain assets are measured on the accompanying interim condensed consolidated balance sheets at cost and arenot remeasured to fair value on a recurring basis. These assets, which include indefinite-lived intangible assets andgoodwill, are tested for impairment annually during the fourth quarter or when a triggering event occurs. Total assetscarried on the balance sheet that are not remeasured to fair value on a recurring basis, identified as Level 3measurements, as of June 30, 2016 are $692.6 million, comprised of $661.0 million of goodwill and $31.6 millionof identified indefinite-lived intangible assets.
4. ACCOUNTS RECEIVABLE AND UNBILLED, NETAccounts receivable and unbilled, net includes service revenue and reimbursed out-of-pocket revenue. Accountsreceivable and unbilled, net consisted of the following (in thousands):
AS OF
JUNE 30,2016
DECEMBER 31,2015
Accounts receivable . . . . . . . . . . . . . . . . . . . . . . . . . . . . . . . . . . . . . . . . . . . . . . . . . . . . . . $67,701 $40,721Unbilled . . . . . . . . . . . . . . . . . . . . . . . . . . . . . . . . . . . . . . . . . . . . . . . . . . . . . . . . . . . . . . . 24,763 26,091Less allowance for doubtful accounts . . . . . . . . . . . . . . . . . . . . . . . . . . . . . . . . . . . . . . . . . (2,416) (1,724)
Total accounts receivable and unbilled, net . . . . . . . . . . . . . . . . . . . . . . . . . . . . . . . . . $90,048 $65,088
F-48

5. INTANGIBLE ASSETS, NET
Intangible assets, net consisted of the following (in thousands):
AS OF
JUNE 30,2016
DECEMBER 31,2015
Intangible assets:Finite-lived intangible assets:
Carrying amount:Backlog . . . . . . . . . . . . . . . . . . . . . . . . . . . . . . . . . . . . . . . . . . . . . . . . . . . . . . $ 72,630 $ 72,630Customer relationships . . . . . . . . . . . . . . . . . . . . . . . . . . . . . . . . . . . . . . . . . . 145,051 145,051Developed technologies . . . . . . . . . . . . . . . . . . . . . . . . . . . . . . . . . . . . . . . . . . 54,475 54,475Other . . . . . . . . . . . . . . . . . . . . . . . . . . . . . . . . . . . . . . . . . . . . . . . . . . . . . . . . 2,505 2,505
Total finite-lived intangible assets . . . . . . . . . . . . . . . . . . . . . . . . . . . . . . . . . . 274,661 274,661
Accumulated amortization:Backlog . . . . . . . . . . . . . . . . . . . . . . . . . . . . . . . . . . . . . . . . . . . . . . . . . . . . . . (72,630) (72,630)Customer relationships . . . . . . . . . . . . . . . . . . . . . . . . . . . . . . . . . . . . . . . . . . (46,629) (26,991)Developed technologies . . . . . . . . . . . . . . . . . . . . . . . . . . . . . . . . . . . . . . . . . . (24,514) (19,066)Other . . . . . . . . . . . . . . . . . . . . . . . . . . . . . . . . . . . . . . . . . . . . . . . . . . . . . . . . (1,127) (877)
Total accumulated amortization . . . . . . . . . . . . . . . . . . . . . . . . . . . . . . . . . . . . (144,900) (119,564)
Total finite-lived intangible assets, net . . . . . . . . . . . . . . . . . . . . . . . . . . . . . . . . . 129,761 155,097
Trade name (indefinite-lived) . . . . . . . . . . . . . . . . . . . . . . . . . . . . . . . . . . . . . . . . 31,646 31,646
Total intangible assets, net . . . . . . . . . . . . . . . . . . . . . . . . . . . . . . . . . . . . . . . . . . . . . . . $ 161,407 $ 186,743
As of June 30, 2016, estimated amortization expense of the Company’s intangible assets for each of the next fiveyears and thereafter is as follows (in thousands):
AMORTIZATION
Remainder of 2016 . . . . . . . . . . . . . . . . . . . . . . . . . . . . . . . . . . . . . . . . . . . . . . . . . . . . . . . . . . . . . . . . $ 25,3362017 . . . . . . . . . . . . . . . . . . . . . . . . . . . . . . . . . . . . . . . . . . . . . . . . . . . . . . . . . . . . . . . . . . . . . . . . . . . 37,7902018 . . . . . . . . . . . . . . . . . . . . . . . . . . . . . . . . . . . . . . . . . . . . . . . . . . . . . . . . . . . . . . . . . . . . . . . . . . . 29,3712019 . . . . . . . . . . . . . . . . . . . . . . . . . . . . . . . . . . . . . . . . . . . . . . . . . . . . . . . . . . . . . . . . . . . . . . . . . . . 14,6392020 . . . . . . . . . . . . . . . . . . . . . . . . . . . . . . . . . . . . . . . . . . . . . . . . . . . . . . . . . . . . . . . . . . . . . . . . . . . 7,797Later years . . . . . . . . . . . . . . . . . . . . . . . . . . . . . . . . . . . . . . . . . . . . . . . . . . . . . . . . . . . . . . . . . . . . . . . 14,828
$129,761
6. ACCRUED EXPENSES
Accrued expenses consisted of the following (in thousands):
AS OF
JUNE 30,2016
DECEMBER 31,2015
Employee compensation and benefits . . . . . . . . . . . . . . . . . . . . . . . . . . . . . . . . . . . . . . . . . $14,474 $17,195Other . . . . . . . . . . . . . . . . . . . . . . . . . . . . . . . . . . . . . . . . . . . . . . . . . . . . . . . . . . . . . . . . . . 4,209 2,916
Total accrued expenses . . . . . . . . . . . . . . . . . . . . . . . . . . . . . . . . . . . . . . . . . . . . . . . . . $18,683 $20,111
F-49
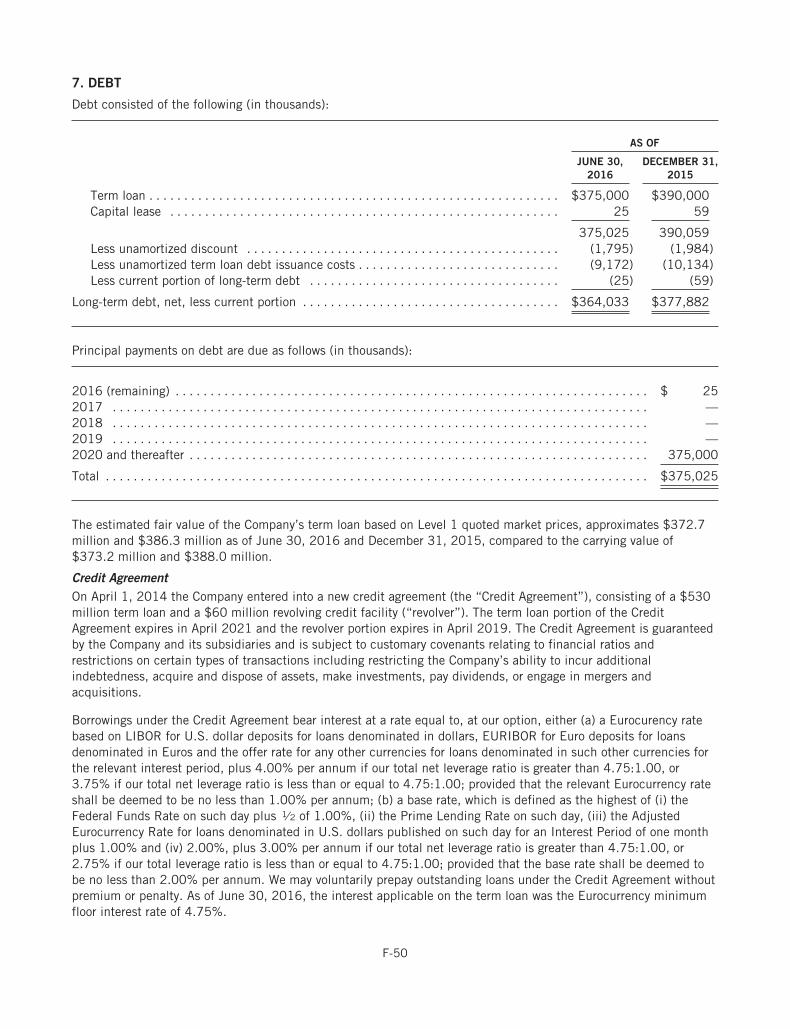
7. DEBT
Debt consisted of the following (in thousands):
AS OF
JUNE 30,2016
DECEMBER 31,2015
Term loan . . . . . . . . . . . . . . . . . . . . . . . . . . . . . . . . . . . . . . . . . . . . . . . . . . . . . . . . . . . $375,000 $390,000Capital lease . . . . . . . . . . . . . . . . . . . . . . . . . . . . . . . . . . . . . . . . . . . . . . . . . . . . . . . . 25 59
375,025 390,059Less unamortized discount . . . . . . . . . . . . . . . . . . . . . . . . . . . . . . . . . . . . . . . . . . . . . (1,795) (1,984)Less unamortized term loan debt issuance costs . . . . . . . . . . . . . . . . . . . . . . . . . . . . . (9,172) (10,134)Less current portion of long-term debt . . . . . . . . . . . . . . . . . . . . . . . . . . . . . . . . . . . . (25) (59)
Long-term debt, net, less current portion . . . . . . . . . . . . . . . . . . . . . . . . . . . . . . . . . . . . . $364,033 $377,882
Principal payments on debt are due as follows (in thousands):
2016 (remaining) . . . . . . . . . . . . . . . . . . . . . . . . . . . . . . . . . . . . . . . . . . . . . . . . . . . . . . . . . . . . . . . . . . . . $ 252017 . . . . . . . . . . . . . . . . . . . . . . . . . . . . . . . . . . . . . . . . . . . . . . . . . . . . . . . . . . . . . . . . . . . . . . . . . . . . . —2018 . . . . . . . . . . . . . . . . . . . . . . . . . . . . . . . . . . . . . . . . . . . . . . . . . . . . . . . . . . . . . . . . . . . . . . . . . . . . . —2019 . . . . . . . . . . . . . . . . . . . . . . . . . . . . . . . . . . . . . . . . . . . . . . . . . . . . . . . . . . . . . . . . . . . . . . . . . . . . . —2020 and thereafter . . . . . . . . . . . . . . . . . . . . . . . . . . . . . . . . . . . . . . . . . . . . . . . . . . . . . . . . . . . . . . . . . . 375,000
Total . . . . . . . . . . . . . . . . . . . . . . . . . . . . . . . . . . . . . . . . . . . . . . . . . . . . . . . . . . . . . . . . . . . . . . . . . . . . . . $375,025
The estimated fair value of the Company’s term loan based on Level 1 quoted market prices, approximates $372.7million and $386.3 million as of June 30, 2016 and December 31, 2015, compared to the carrying value of$373.2 million and $388.0 million.
Credit AgreementOn April 1, 2014 the Company entered into a new credit agreement (the “Credit Agreement”), consisting of a $530million term loan and a $60 million revolving credit facility (“revolver”). The term loan portion of the CreditAgreement expires in April 2021 and the revolver portion expires in April 2019. The Credit Agreement is guaranteedby the Company and its subsidiaries and is subject to customary covenants relating to financial ratios andrestrictions on certain types of transactions including restricting the Company’s ability to incur additionalindebtedness, acquire and dispose of assets, make investments, pay dividends, or engage in mergers andacquisitions.
Borrowings under the Credit Agreement bear interest at a rate equal to, at our option, either (a) a Eurocurency ratebased on LIBOR for U.S. dollar deposits for loans denominated in dollars, EURIBOR for Euro deposits for loansdenominated in Euros and the offer rate for any other currencies for loans denominated in such other currencies forthe relevant interest period, plus 4.00% per annum if our total net leverage ratio is greater than 4.75:1.00, or3.75% if our total net leverage ratio is less than or equal to 4.75:1.00; provided that the relevant Eurocurrency rateshall be deemed to be no less than 1.00% per annum; (b) a base rate, which is defined as the highest of (i) theFederal Funds Rate on such day plus 1⁄2 of 1.00%, (ii) the Prime Lending Rate on such day, (iii) the AdjustedEurocurrency Rate for loans denominated in U.S. dollars published on such day for an Interest Period of one monthplus 1.00% and (iv) 2.00%, plus 3.00% per annum if our total net leverage ratio is greater than 4.75:1.00, or2.75% if our total leverage ratio is less than or equal to 4.75:1.00; provided that the base rate shall be deemed tobe no less than 2.00% per annum. We may voluntarily prepay outstanding loans under the Credit Agreement withoutpremium or penalty. As of June 30, 2016, the interest applicable on the term loan was the Eurocurrency minimumfloor interest rate of 4.75%.
F-50

In addition, the Company is required to pay to the lenders a commitment fee of 0.5% quarterly for unusedcommitments on the revolver, subject to a step-down to 0.375% based upon achievement of a certain leverage ratioas defined within the Credit Agreement. At June 30, 2016 the Company had no outstanding borrowings under therevolver resulting in $60.0 million in undrawn capacity available under the Revolver. In addition, the Company didnot have any outstanding letters of credit, which are secured by the revolving credit facilities at June 30, 2016.
Also within the Credit Agreement, if we have drawn greater than 30% of the commitments under the CreditAgreement as of the last date of any quarter, then we are required to report compliance with a financial covenantthat is tested at the end of each quarter. This financial covenant requires us to maintain a net debt to consolidatedEBITDA leverage ratio (as defined under the Credit Agreement) of less than or equal to 8.00:1.00 for any fiscalquarter ending on or prior to March 31, 2016 and 7.50:1.00, thereafter. As of June 30, 2016, we were incompliance with all covenants under our Credit Agreement.
8. STOCK-BASED COMPENSATION
The Company has a long-term incentive plan (the “Plan”) that provides for long-term equity incentive compensationfor key employees, officers and directors. A variety of discretionary awards (collectively, the “Awards”) for employeesand non-employee directors are authorized under the Plan, including vested shares, stock options, restricted shareawards (“RSAs”), and restricted stock units (“RSUs”). No further grants will be made under the Plan after theconsummation of this offering.
The Company granted 34,812 stock options vesting equally over four years and 11,111 restricted awards whichimmediately vested upon issuance, during the six months ended June 30, 2016.
Stock-based compensation expense recognized in the condensed consolidated statements of operations related tothe Awards are summarized below (in thousands):
SIX MONTHS ENDEDJUNE 30,
2016 2015
Direct costs . . . . . . . . . . . . . . . . . . . . . . . . . . . . . . . . . . . . . . . . . . . . . . . . . . . . . . . . . . . . . . . . . . . $2,474 $3,181Selling, general and administrative . . . . . . . . . . . . . . . . . . . . . . . . . . . . . . . . . . . . . . . . . . . . . . . . . 1,801 1,724
Total stock-based compensation expense . . . . . . . . . . . . . . . . . . . . . . . . . . . . . . . . . . . . . . . . . . . . $4,275 $4,905
The majority of the Awards are classified as liability instruments due to a condition upon accepting the awards.Participants must execute a Contribution and Subscription Agreement that provides for the exchange of the sharesissued for incentive units in the equity of a non-consolidated related party. The stock-based compensation liabilitywas $7.2 million, of which $4.1 million is included in Other Current Liabilities and $3.1 million is included in OtherLong-Term Liabilities in the condensed consolidated balance sheet at June 30, 2016. The stock-basedcompensation liability was $3.6 million, of which $1.7 million is included in Other Current Liabilities and $1.9million is included in Other Long-Term Liabilities in the condensed consolidated balance sheet at December 31,2015.
9. INCOME TAXES
The Company’s effective income tax rate was 40.6% and 105.2% for the six months ended June 30, 2016 andJune 30, 2015, respectively. The Company’s effective income tax rate for the six months ended June 30, 2016varied from the U.S. statutory rate of 35.0% primarily due to the impact of domestic and foreign uncertain taxpositions.
F-51

10. COMMITMENTS AND CONTINGENCIES
Legal ProceedingsThe Company is involved in legal proceedings from time to time in the ordinary course of its business, includingemployment claims and claims related to other business transactions. The Company cannot predict with certaintythe outcome of such proceedings, but it believes that adequate reserves have been recorded and losses alreadyrecognized with respect to such actions were immaterial as of June 30, 2016 and December 31, 2015. There is areasonable possibility that a loss exceeding amounts already recognized may be incurred related to these actions;however, the Company believes that such potential losses were immaterial as of June 30, 2016.
Purchase CommitmentIn May 2013, the Company committed to the aggregate purchase of $2.0 million of software services from a vendorduring the period from June 1, 2013 through May 31, 2016. In return for the commitment, the Company receivespreferential fixed rate pricing and a 5% discount on all purchases made pursuant to this agreement during its three-year term. During 2014, the Company met the aggregate purchase commitment.
11. RELATED PARTY TRANSACTIONS
Employee LoansThe Company periodically extends short term loans or advances to employees, typically upon commencement ofemployment. Total receivables as a result of these employee advances of $0.2 million existed at June 30, 2016 andDecember 31, 2015, respectively, and are included in the Prepaid expenses and other current assets and Otherassets line item of the condensed consolidated balance sheets, respectively, depending on the contractualrepayment date.
Management FeesDuring the six months ended June 30, 2016, the Company incurred management fees to Cinven Limited of $0.2million and related travel expenses of $0.1 million. During the six months ended June 30, 2015, the Companyincurred management fees to Cinven Limited of $0.2 million and related travel expenses of $0.1 million. As ofJune 30, 2016 and December 31, 2015, the Company had outstanding accounts payable to Cinven Limited of $0.1million and $0.1 million, respectively.
Service AgreementsMedpace Investors, LLC, a noncontrolling shareholder owned and managed by employees of the Company, has amajority ownership interest in Symplmed Pharmaceuticals, LLC (“Symplmed”), a private pharmaceuticaldevelopment company. In addition, the Chief Executive Officer and other executives of the Company are boardmembers of Symplmed. The Company entered into a Master Services Agreement (“MSA”) with Symplmed to performclinical trials. The MSA also provides for a financing arrangement which allows for Symplmed to defer payments ofthe services provided by the Company while incurring premium service charges as consideration for the deferredpayment concessions. The Company has evaluated its relationship with Symplmed and concluded that Symplmed isnot a variable interest entity because the Company has no direct ownership interest or relationship other than theMSA. During the six months ended June 30, 2016 and 2015, the Company recognized service revenue fromSymplmed of $0.4 million and $0.5 million, respectively, in the Company’s condensed consolidated statements ofoperations.
The chief executive officer of the Company is a member of Coherus BioSciences, Inc.’s (“Coherus”) board ofdirectors, making Coherus a related party. The Company has secured an agreement to perform Phase I through PhaseIII clinical trial work for certain Coherus “bio-similar” drug compounds. The agreement provides for a minimum feecommitment for clinical trial services and is cancelable without cause by either party upon 30 days priornotification. During the six months ended June 30, 2016 and 2015, the Company recognized service revenue fromCoherus of $11.4 million and $10.9 million, respectively, in the Company’s condensed consolidated statements ofoperations. As of June 30, 2016 and December 31, 2015, respectively, the Company had accounts receivable fromCoherus of $2.6 million and $2.0 million recorded in the condensed consolidated balance sheets, respectively. As ofJune 30, 2016 and December 31, 2015, respectively, the Company had from Coherus, $9.5 million and $8.4million of Advanced billings and $4.1 million and $3.5 million of Pre-funded study costs, in the condensedconsolidated balance sheets.
F-52

Certain executives and employees of the Company, including the chief executive officer, have equity investments inXenon, a clinical-stage biopharmaceutical company. In addition, a Medpace employee was a director of Xenon untilMay 2015. During July 2015 the Company and Xenon entered into an amended MSA agreement for the Company toprovide certain clinical development services. The Company recognized service revenue from Xenon of $0.4 millionand $0.1 million during the six months ended June 30, 2016 and 2015, respectively, in the Company’s condensedconsolidated statements of operations. As of June 30, 2016 and December 31, 2015, respectively, the Companyhad from Xenon, $1.9 million and $1.8 million of Advanced billings and $0.2 million and $0.2 million of Pre-funded study costs, in the condensed consolidated balance sheets.
Leased Real EstateHeadquarters LeaseThe Company has entered into operating leases for its corporate headquarters and a storage space facility with arelated party which is wholly owned by the chief executive officer of the Company. The Company has evaluated itsrelationship with the related party and concluded that the related party is not a variable interest entity because theCompany has no direct ownership interest or relationship other than the leases. The lease for headquarters is for aninitial term of twelve years through November 2022 with a renewal option for one 10-year term at prevailing marketrates. The lease for storage space is through June 2016. The Company pays rent, taxes, insurance, and maintenanceexpenses that arise from the use of the properties. Annual base rent for the corporate headquarters allows foradjustments to the rental rate annually for increases in the consumer price index. Lease expense recognized for thesix months ended June 30, 2016 and 2015 was $1.1 million and $1.1 million, respectively. The lease expense wasallocated between Direct costs, excluding depreciation, amortization, and Selling, general and administrative in thecondensed consolidated statements of operations.
Deemed Assets and Deemed Landlord LiabilitiesThe Company entered into two multi-year lease agreements with related parties governing the occupancy of space oftwo buildings in Cincinnati, Ohio. The related parties are wholly owned by the Company’s chief executive officer andcertain of his immediate family. In accordance with the accounting guidance related to leases, the Company wasdeemed in substance to be the owner of the property during the construction phase and at completion. Accordingly,the Company reflected the buildings and related liabilities as deemed assets from landlord building construction inProperty and equipment, net and Deemed landlord liabilities, respectively, on the condensed consolidated balancesheets. The Company assumed occupancy in 2012 and the leases expire in 2027 with the Company having one 10-year option to extend the lease term. The deemed assets are being fully depreciated, on a straight line basis, over the15-year term of the lease. Deemed landlord liabilities are recorded at their net present value when the Companyenters into qualifying leases and are reduced as the Company makes periodic lease payments on the properties.Accretion expense is being recorded over the term of the lease as a component of Interest expense, net in theCompany’s condensed consolidated statements of operations. The Company paid $1.9 million and $1.6 millionduring the six months ended June 30, 2016 and 2015, respectively. The current and long-term portions of theDeemed landlord liability at June 30, 2016 were $1.7 million and $29.4 million, respectively. The current and long-term portions of the Deemed landlord liability at December 31, 2015 were $1.6 million and $30.3 million,respectively. The Company has recognized deemed assets, net of $18.9 million and $19.8 million at June 30, 2016and December 31, 2015, respectively, in the condensed consolidated balance sheets.
Travel ServicesThe Company incurs expenses for travel services for company executives provided by a private aviation chartercompany which is owned by the chief executive officer and another executive of the Company (“private aviationcharter”). The Company may contract directly with the private aviation charter for the use of its aircraft or indirectlythrough a third party aircraft management and jet charter company (the “Aircraft Management Company”). Thetravel services provided are primarily for business purposes, with certain personal travel paid for as part of theexecutives’ compensation arrangements. The Aircraft Management Company also makes the private aviation charteraircraft available to third parties. The Company incurred travel expenses of $0.5 million and $0.5 million during thesix months ended June 30, 2016 and 2015, respectively. These travel expenses are recorded in Selling, general andadministrative in the Company’s condensed consolidated statements of operations.
F-53

12. SUBSEQUENT EVENTS
The Company has evaluated subsequent events through July 25, 2016, the date on which the condensedconsolidated financial statements were available to be issued.
As disclosed in Note 1, on July 25, 2016, the Board of Directors of the Company approved, and made legallyeffective, a 1-for-1.35 reverse stock split of the Company’s common stock. All share, stock option and per shareinformation presented in the condensed consolidated financial statements have been adjusted to reflect the reversestock split on a retroactive basis for all periods presented. The Company will make a cash payment to shareholdersfor all fractional shares which would have otherwise been required to be issued as a result of the reverse stock split.There was no change in number of authorized shares or the par value of the Company’s common stock.
F-54


7,000,000 Shares
Medpace Holdings, Inc.
Common Stock
PRELIMINARY PROSPECTUS
Joint Book-Running Managers
JefferiesCredit Suisse
UBS Investment BankWells Fargo Securities
Co-Managers
BairdWilliam Blair
, 2016
Through and including , 2016 (the 25th day after the date of this prospectus), all dealers effectingtransactions in these securities, whether or not participating in this offering, may be required to deliver a prospectus.This is in addition to a dealer’s obligation to deliver a prospectus when acting as an underwriter and with respect toan unsold allotment or subscription.