
Medium-Term Outlook for Bunker Fuel Markets Outlook for Bunker Fuel Markets Rotterdam, May 2016 ©...
22
© OECD/IEA 2015 © OECD/IEA 2015 Medium-Term Outlook for Bunker Fuel Markets Rotterdam, May 2016
Transcript of Medium-Term Outlook for Bunker Fuel Markets Outlook for Bunker Fuel Markets Rotterdam, May 2016 ©...

© OECD/IEA 2015 © OECD/IEA 2015
Medium-Term Outlook for Bunker Fuel Markets
Rotterdam, May 2016

© OECD/IEA 2015
What is the IEA?
The IEA was established in 1974 and is the energy forum for 29 advanced economies
IEA member countries are committed to taking joint measures to meet oil supply emergencies
They also have agreed to share energy information, to co-ordinate energy policy and to co-operate in the development of rational energy programmes that:
Enhance energy Security
Encourage economic Growth
Protect the environment
Engage worldwide
© OECD/IEA 2015
The Oil Market Report

© OECD/IEA 2015
Overview
Global bunker demand overview
ECAs: what happened in 2015?
Towards a global sulphur cap in 2020
What are the implications on the global product supply chain?
Current / future IEA work

© OECD/IEA 2015
Key assumptions
Global sulphur cap will be introduced in 2020
Little uptake of scrubbers pre-2020 Influenced by narrow fuel oil MGO spreads
Could result in a last minute logjam
Many owners happy to pass on increased costs to customers
Crude prices to increase moderately by 2021
Uncertainty over enforcement
Limited uptake of LNG

© OECD/IEA 2015
Global oil balances to gradually tighten
Balance supports a moderately increasing crude oil price over the forecast
-2.5
-2.0
-1.5
-1.0
-0.5
0.0
0.5
1.0
1.5
2.0
2.5
82
84
86
88
90
92
94
96
98
100
102
2004 2005 2006 2007 2008 2009 2010 2011 2012 2013 2014 2015 2016 2017 2018 2019 2020 2021
mb/d
mb/d
Implied Stock
Ch.&Misc to
Bal (RHS)
Oil Demand
Oil Supply
Global oil balance

© OECD/IEA 2015
Efficiency gains and the encroachment of LNG to curb future bunker demand
0.00
0.50
1.00
1.50
2.00
2.50
3.00
3.50
4.00
4.50
1990 1992 1994 1996 1998 2000 2002 2004 2006 2008 2010 2012 2014 2016 2018 2020
mb/d
Oil-based marine fuel consumption in international navigation
LNG to account for an additional 0.3 mb/d of bunker demand by 2021

© OECD/IEA 2015
Marine use to remain a relatively minor component of total demand
0.00
20.00
40.00
60.00
80.00
100.00
120.00
2012 2013 2014 2015 2016 2017 2018 2019 2020 2021
mb/d
Other
Road
Transport
Marine Use
Global oil demand

© OECD/IEA 2015
2015: Refiners and shippers adapt to tighter ECA bunker specifications
OECD fuel oil demand sank by 0.1 mb/d in 2015 as bunker fuel specs were tightened in ECAs
OECD total residual fuel oil and gasoil demand
0.00
2.00
4.00
6.00
8.00
10.00
12.00
14.00
16.00
1990 1992 1994 1996 1998 2000 2002 2004 2006 2008 2010 2012 2014
mb/d
Residual Fuel Oil
Gasoil

© OECD/IEA 2015
Bunker demand set to undergo rapid transformation in 2020
0.00
0.50
1.00
1.50
2.00
2.50
3.00
3.50
4.00
4.50
2000 2002 2004 2006 2008 2010 2012 2014 2016 2018 2020
mb/d
Gasoil
Residual Fuel Oil
Oil-based marine fuel consumption in international navigation by type

© OECD/IEA 2015
LNG faces formidable challenges
Expansion of infrastructure
Lack of clear international legislation
Price uncertainty
© OECD/IEA 2015
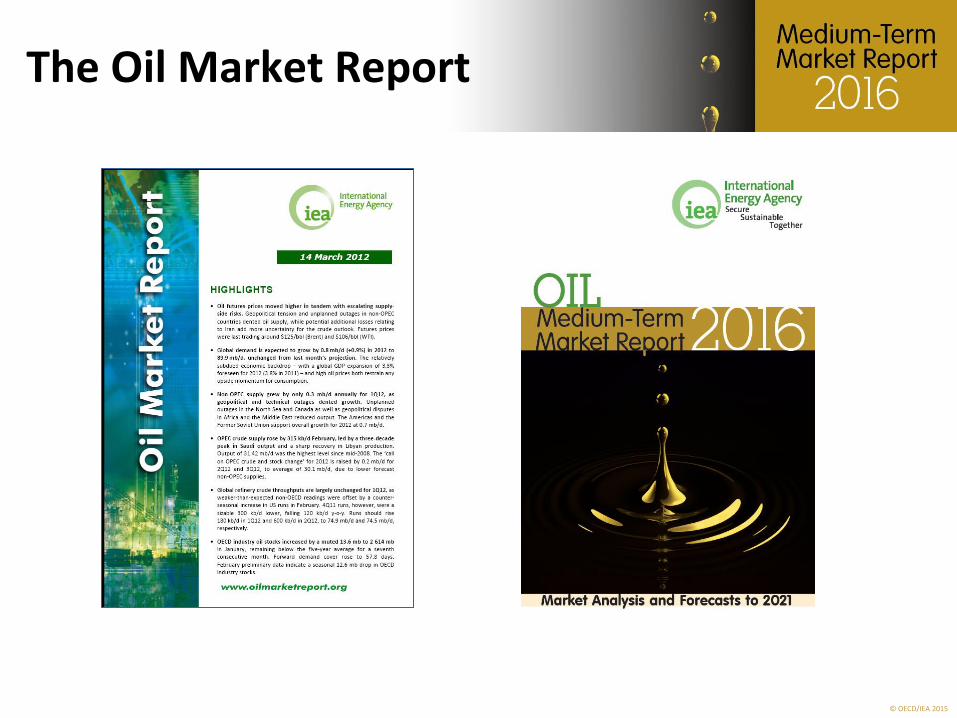
Economics of LNG eroded by low oil prices
-5
0
5
10
15
20
Jan-2013 Jul-2013 Jan-2014 Jul-2014 Jan-2015 Jul-2015 Jan-2016
$/M
Btu
Fuel oil
Gasoil
Differential between natural gas delivered at UK National Balancing Point and Rotterdam gasoil and fuel oil barge prices
© OECD/IEA 2015
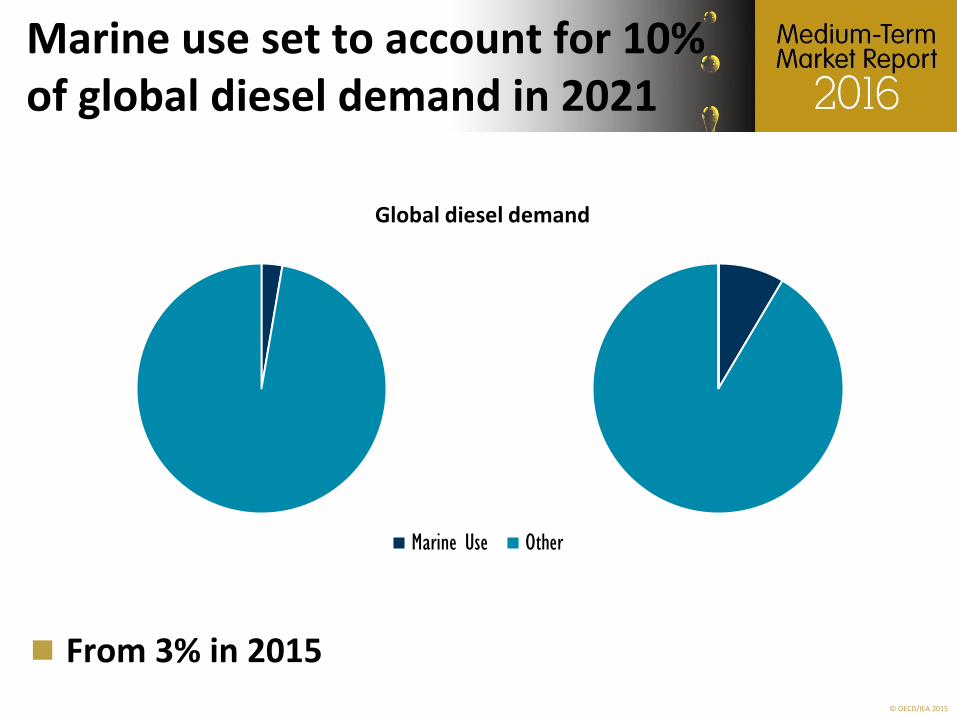
Marine use set to account for 10% of global diesel demand in 2021
From 3% in 2015
Marine Use Other
Global diesel demand
© OECD/IEA 2015
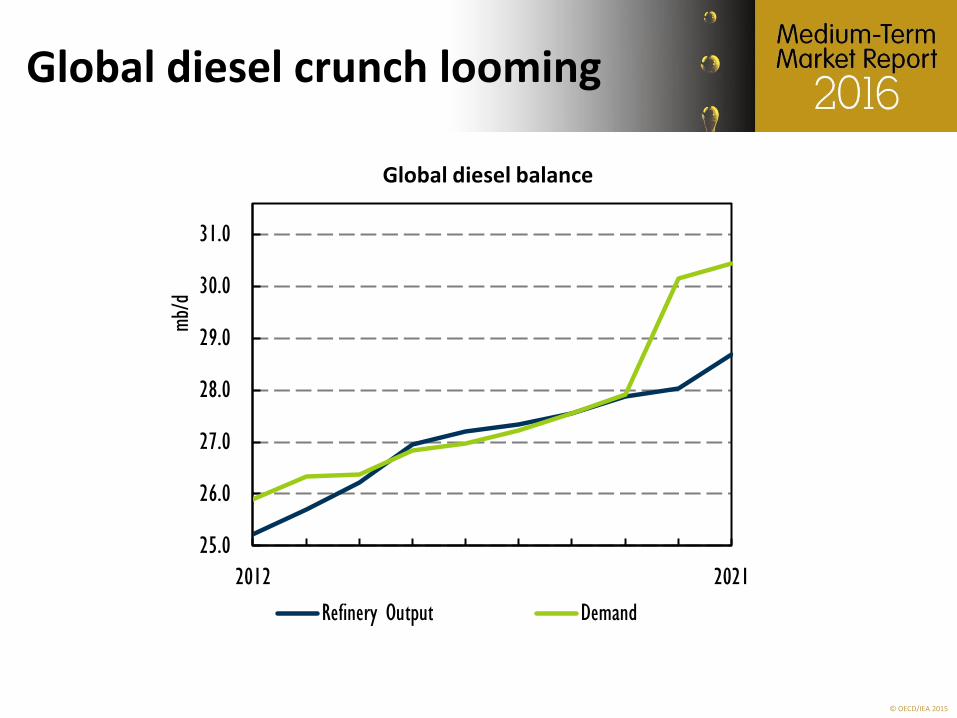
Global diesel crunch looming
25.0
26.0
27.0
28.0
29.0
30.0
31.0
2012 2021
mb/d
Refinery Output Demand
Global diesel balance

© OECD/IEA 2015
Asia to become a net middle distillate importer
Regional middle distillate supply balances in 2015 and 2021

© OECD/IEA 2015
Fuel oil running out of uses
4.0
5.0
6.0
7.0
8.0
9.0
10.0
2012 2021
mb/d
Refinery Output Demand
Global residual fuel oil balance

© OECD/IEA 2015
Marine use to account for 25% of global fuel oil demand in 2021
Marine Use Other
Global residual fuel oil demand
From 45% in 2015

© OECD/IEA 2015
Impending global fuel oil surplus despite Russia cutting output
Regional fuel oil supply balances in 2015 and 2021

© OECD/IEA 2015
How can changing marine fuel requirements be met?
Higher uptake of scrubbers
Investment from refiners Secondary upgrading capacity (visbreakers, crackers, cokers)
Would see fuel oil move to become more of a feedstock than a product

© OECD/IEA 2015
Conclusion
Uncertainty is preventing businesses from taking efficient decisions
Biggest question is where sulphur will be stripped out? Point of production
Point of end-use

© OECD/IEA 2015
World Energy Outlook-2016 Special Report on Energy and Air Pollution
The role of energy in air quality today – a global assessment by sector, region and pollutant
Pollutants & their impacts – an Outlook to 2040 on the basis of existing and planned energy and environmental policies
The relevance and impact of a global cap on maritime sulphur
Short- and long-term solutions by region
The costs of solving air pollution
A quantification of the benefits
A deep dive into cities – governance, technologies and policies
From analysis to recommendations – an IEA view on how best to address energy-related air pollution
Released 27 June