Medium-Term Coal Market Report · 4 MEDIUM‐TERM COAL MARKET REPORT 2011 ACKNOWLEDGEMENTS The...
122
Market Trends and Projections to 2016 2011 Medium-Term Market Report COAL
Transcript of Medium-Term Coal Market Report · 4 MEDIUM‐TERM COAL MARKET REPORT 2011 ACKNOWLEDGEMENTS The...
Market Trends and Projections to 2016
2011Medium-Term Market Report
COAL


2011Medium-Term Market Report
COAL
Market Trends and Projections to 2016
INTERNATIONAL ENERGY AGENCY
The International Energy Agency (IEA), an autonomous agency, was established in November 1974. Its primary mandate was – and is – two-fold: to promote energy security amongst its member countries through collective response to physical disruptions in oil supply, and provide authoritative
research and analysis on ways to ensure reliable, affordable and clean energy for its 28 member countries and beyond. The IEA carries out a comprehensive programme of energy co-operation among its member countries, each of which is obliged to hold oil stocks equivalent to 90 days of its net imports. The Agency’s aims include the following objectives:
n Secure member countries’ access to reliable and ample supplies of all forms of energy; in particular, through maintaining effective emergency response capabilities in case of oil supply disruptions.
n Promote sustainable energy policies that spur economic growth and environmental protection in a global context – particularly in terms of reducing greenhouse-gas emissions that contribute to climate change.
n Improve transparency of international markets through collection and analysis of energy data.
n Support global collaboration on energy technology to secure future energy supplies and mitigate their environmental impact, including through improved energy
efficiency and development and deployment of low-carbon technologies.
n Find solutions to global energy challenges through engagement and dialogue with non-member countries, industry, international
organisations and other stakeholders.IEA member countries:
Australia Austria
Belgium Canada
Czech RepublicDenmark
FinlandFrance
GermanyGreece
HungaryIreland
ItalyJapan
Korea (Republic of)LuxembourgNetherlandsNew Zealand NorwayPolandPortugalSlovak RepublicSpainSwedenSwitzerlandTurkeyUnited Kingdom
United States
The European Commission also participates in
the work of the IEA.
Please note that this publication is subject to specific restrictions that limit its use and distribution.
The terms and conditions are available online at www.iea.org/about/copyright.asp
© OECD/IEA, 2011International Energy Agency
9 rue de la Fédération 75739 Paris Cedex 15, France
www.iea.org

MEDIUM‐TERM COAL MARKET REPORT 2011 3
FOREWORD For the first time, the IEA presents a publication aimed at analysing recent trends and developing medium‐term projections for coal markets around the world. Amid current debates on climate change and the deployment of renewables, public opinion has tended to see coal as an outdated source of energy. However, coal remains a crucial part of the energy mix, both in OECD countries, and increasingly in emerging economies around the world. Indeed, coal was the fastest growing source of energy this past decade, accounting for nearly half of the world’s primary energy demand. In recent years, global coal markets have been extremely active. Since commodity prices plummeted in 2008 amidst the aftermath of the global economic crisis and ensuing recession, coal prices have continued to steadily rise, and so, too, has coal price volatility. Increasingly, derivatives and financial products are being used in coal trading. Dynamics between European and Asian basins are changing, while the gap between thermal and metallurgical coal prices has widened dramatically. Reflecting these trends, the global coal market has become more interconnected and more dynamic. This report presents a comprehensive analysis on recent trends and provides a five‐year outlook of the world’s coal supply, demand and trade. Efforts have been made to factor in the strong uncertainties concerning economic growth. Coal dominates all other fuels in the Chinese energy mix and, globally, China's high share of coal production and consumption surpasses that of other countries for other fuels. To illustrate the country’s global influence, this report presents a low Chinese production scenario (LPS) and a high Chinese production scenario (HPS), where, through a simple sensitivity case, the reader may visualise the impact minor changes in China’s domestic market could potentially produce across the whole coal trade. While coal reserves are widely distributed among countries across the five continents, six countries account for the majority of the world’s exports. One of the main objectives of this report is to provide an in‐depth analysis on the development of the global coal chain among main exporting countries. Although healthy investments in mining developments and transport infrastructure are in the pipeline, factors such as project cancellation, weather‐related events or unforeseen disruptions have the ability to tighten the market in upcoming years. This book is the first of a new series of medium‐term market reports on oil, gas, coal and renewables, which the IEA will publish on an annual basis. Our aim is to provide greater transparency and deeper insights into recent and ongoing market developments and to look forward over the next five years. These reports will contribute to a better understanding of the workings of energy markets and enable both policy makers and industry to make well‐informed decisions that lead to a secure and stable energy future. This report is published under my authority as Executive Director of the IEA.
Maria van der Hoeven
© O
ECD
/IEA
, 201
1

4 MEDIUM‐TERM COAL MARKET REPORT 2011
ACKNOWLEDGEMENTS The Medium‐Term Coal Market report has been prepared by the Gas, Coal and Power division of the International Energy Agency (IEA), headed by Laszlo Varro. The main authors are Johannes Trüby, Moritz Paulus and Carlos Fernández Alvarez, who is responsible for this publication. We are grateful for the data provided by the IEA Energy Statistics Division, which are the cornerstone of this report. Valuable inputs were provided by Keith Burnard, Pawel Olejarnik, Anne‐Sophie Corbeau, Dennis Volk and Ian Cronshaw. The IEA Communication and Information Office provided editorial guidance. Rebecca Gaghen, and her team, Muriel Custodio, Cheryl Haines, Andrew Johnston, Angela Gosmann and Bertrand Sadin made this publication possible. Geoffrey Morrison, from the IEA Clean Coal Centre, authored the boxes on Underground Coal Gasification and Coal to Liquids. Brian Ricketts, from Euracoal, also provided very useful suggestions. Our gratitude also goes to the Institute of Energy Economics at the University of Cologne (EWI) for sharing its breadth of coal expertise and coal market models. The IEA would especially like to thank the Coal Industry Advisory Board (CIAB) for sponsoring Moritz Paulus and Johannes Trüby on this report. Thanks must also go to the many CIAB associates who provided the IEA with invaluable data, information and advice. Veronika Kohler from the National Mining Association (NMA) in Washington D.C., Ian Hall from Anglo American, Samantha McCulloch from the Australian Coal Association, Supriatna Suhala from the Indonesian Coal Mining Association, Iwasaki Takenori from J‐Power, Oleg Pertsovskiy from SUEK, J. Gordon Stephens from Joy Global Inc., Maggi Rademacher from E.On Kraftwerke GmbH and Hans‐Wilhelm Schiffer from RWE AG, as well as Brian Heath, the CIAB Executive Co‐ordinator.
© O
ECD
/IEA
, 201
1

MEDIUM‐TERM COAL MARKET REPORT 2011 5
TABLE OF CONTENTS
FOREWORD ..................................................................................................................................... 3
ACKNOWLEDGEMENTS .................................................................................................................... 4
EXECUTIVE SUMMARY .................................................................................................................... 9
RECENT MARKET TRENDS .............................................................................................................. 13
Summary ............................................................................................................................................... 13
Demand ................................................................................................................................................. 13 OECD demand trends ....................................................................................................................... 15 Non‐OECD demand trends ............................................................................................................... 19
Supply .................................................................................................................................................... 22 OECD supply trends .......................................................................................................................... 22 Non‐OECD supply trends .................................................................................................................. 24
References ............................................................................................................................................. 25
MEDIUM‐TERM PROJECTIONS OF DEMAND AND SUPPLY .............................................................. 26
Summary ............................................................................................................................................... 26
Introduction ........................................................................................................................................... 26
Assumptions and methodology ............................................................................................................. 27
Projection of global coal demand ......................................................................................................... 28 OECD coal demand in power generation ......................................................................................... 29 OECD coal demand in non‐power sectors ....................................................................................... 30 Non‐OECD coal demand in power generation ................................................................................. 31 Non‐OECD coal demand in non‐power sectors ............................................................................... 34 Regional focus: China ....................................................................................................................... 36
Projection of global coal supply ............................................................................................................ 38 OECD coal supply .............................................................................................................................. 39 Non‐OECD coal supply ...................................................................................................................... 39
RECENT DEVELOPMENTS IN INTERNATIONAL TRADE ..................................................................... 42
Summary ............................................................................................................................................... 42
Seaborne hard coal market 2009‐2010 ................................................................................................. 42 Price developments .......................................................................................................................... 44 Cost developments........................................................................................................................... 52
Regional analysis ................................................................................................................................... 56 Exporters .......................................................................................................................................... 56 Importers .......................................................................................................................................... 63
References ............................................................................................................................................. 69
MEDIUM‐TERM PROJECTIONS OF SEABORNE TRADE ..................................................................... 71
Summary ............................................................................................................................................... 71
Assumptions and methodology ............................................................................................................. 71
Scenario design ..................................................................................................................................... 72
© O
ECD
/IEA
, 201
1

6 MEDIUM‐TERM COAL MARKET REPORT 2011
Projections of seaborne hard coal trade ............................................................................................... 73
Projections of seaborne thermal coal trade .......................................................................................... 74 LPS .................................................................................................................................................... 75 HPS ................................................................................................................................................... 77
Projections of seaborne metallurgical coal trade ................................................................................. 80 LPS .................................................................................................................................................... 80 HPS ................................................................................................................................................... 83
References ............................................................................................................................................. 86
UTILISATION OF EXPORT CAPACITY AND INVESTMENTS ................................................................ 87
Summary ............................................................................................................................................... 87
Utilisation of export capacity in 2009‐2010 .......................................................................................... 87 Utilisation of export mine capacity .................................................................................................. 88 Utilisation of domestic transport infrastructure .............................................................................. 89 Utilisation of port capacity ............................................................................................................... 90
Export capacity investments 2011‐2016 ............................................................................................... 91 Port and domestic transport capacity investments ......................................................................... 91 Export mine capacity investments ................................................................................................... 94
References ........................................................................................................................................... 100
MEDIUM‐TERM PROJECTIONS OF EXPORT CAPACITY UTILISATION .............................................. 101
Summary ............................................................................................................................................. 101
Assumptions and methodology ........................................................................................................... 101
Projected utilisation of export capacity .............................................................................................. 102
Regional analysis ................................................................................................................................. 103 Australia ......................................................................................................................................... 103 South Africa .................................................................................................................................... 105 Colombia ........................................................................................................................................ 107 Russia ............................................................................................................................................. 108 Indonesia ........................................................................................................................................ 109 United States .................................................................................................................................. 110
TABLES ........................................................................................................................................ 111
LIST OF BOXES Box 1 Coal for beginners ...................................................................................................................... 14 Box 2 Coal‐to‐liquids: making an oil rig out of a coal mine .................................................................. 32 Box 3 Carbon dioxide and emission reduction policies ........................................................................ 37 Box 4 Underground coal gasification ................................................................................................... 40 Box 5 Has coal trade become a casino visit? ........................................................................................ 44 Box 6 Will Fukushima boost coal demand? ......................................................................................... 64 Box 7 Big brother is watching you – government interventions in coal trade ..................................... 85 Box 8 Digging deep into the Galilee Basin ............................................................................................ 97 Box 9 The impact of 2010/2011 floods in Queensland ...................................................................... 104
© O
ECD
/IEA
, 201
1

MEDIUM‐TERM COAL MARKET REPORT 2011 7
LIST OF FIGURES Figure 1 Coal‐based electricity generation in selected OECD countries, 2008‐2010 ........................ 17 Figure 2 Monthly crude steel production in OECD countries in thousand metric tonnes, 2008–2010 ........................................................................................................................... 19 Figure 3 Evolution of global coal consumption (hard and brown coal) ............................................ 20 Figure 4 Monthly Chinese thermal power generation and monthly Chinese coal burn ................... 21 Figure 5 Monthly crude steel production in selected non‐OECD countries in thousand metric tonnes, 2008‐2010 ............................................................................... 22 Figure 6 Projection of total global coal demand until 2016 .............................................................. 28 Figure 7 Projection of coal demand in power generation for OECD economies .............................. 30 Figure 8 Projection of coal demand in non‐power sectors for OECD economies ............................. 31 Figure 9 Projection of coal demand in power generation for non‐OECD economies ....................... 32 Figure 10 Projection of coal demand in non‐power sectors for non‐OECD economies ..................... 34 Figure 11 Steel use per capita and GDP per capita for selected countries ......................................... 35 Figure 12 Regional distribution of CO2 emissions and emission source ............................................. 38 Figure 13 Total global coal supply in Mtce, 2009‐2016 ...................................................................... 39 Figure 14 Non‐OECD coal supply in Mtce, 2009‐2016 ........................................................................ 40 Figure 15 Evolution of seaborne hard coal trade since 2000 .............................................................. 43 Figure 16 Long‐term historical development of steam and coking coal prices .................................. 45 Figure 17 Evolution of major steam coal price indices ....................................................................... 46 Figure 18 Evolution of monthly Chinese hard coal imports ................................................................ 47 Figure 19 South African steam coal exports to major north‐western European countries and cost advantage of South African steam coal to north‐western European ports (FOB price in Richards Bay + Freight RB to Rotterdam – CIF price in NWE) ........................ 48 Figure 20 Evolution of coking coal price benchmark contracts and price indices .............................. 49 Figure 21 Breakdown of coal supply chain components for major coal mining regions (CIF north‐western Europe) ................................................................................................. 50 Figure 22 Outlook for bulk carrier freight capacity ............................................................................. 51 Figure 23 Indicative supply cash‐cost curves for seaborne traded steam coal (FOB) for 2005, 2008 and 2010 ..................................................................................................... 53 Figure 24 Indicative supply cash‐cost curves for seaborne traded metallurgical coals for 2005, 2008 and 2010 ..................................................................................................... 54 Figure 25 Differences in net trade between LPS and HPS ................................................................... 74 Figure 26 Seaborne steam coal imports in the LPS ............................................................................. 76 Figure 27 Seaborne steam coal exports in the LPS ............................................................................. 77 Figure 28 Seaborne steam coal imports in the HPS ............................................................................ 78 Figure 29 Seaborne steam coal exports in the HPS ............................................................................ 79 Figure 30 Seaborne metallurgical coal imports in the LPS .................................................................. 81 Figure 31 Seaborne metallurgical coal exports in the LPS .................................................................. 82 Figure 32 Seaborne metallurgical coal imports in the HPS .................................................................. 84 Figure 33 Seaborne metallurgical coal exports in the HPS ................................................................. 84 Figure 34 Port capacity, mining capacity, exports and utilisation (2010) ........................................... 89 Figure 35 Projected cumulative additions to coal terminal capacities ............................................... 92 Figure 36 Cumulative probable expansions of hard coal export mining capacity .............................. 95 Figure 37 Cumulative potential expansions of hard coal export mining capacity .............................. 96
© O
ECD
/IEA
, 201
1
8 MEDIUM‐TERM COAL MARKET REPORT 2011
Figure 38 Outlook for global export capacity utilisation for seaborne hard coal trade until 2016........................................................................................................................... 103 Figure 39 Outlook for Australian export capacity utilisation for seaborne hard coal until 2016 ..... 104 Figure 40 Outlook for South African export capacity utilisation for seaborne hard coal until 2016........................................................................................................................... 106 Figure 41 Outlook for Colombian export capacity utilisation for seaborne hard coal until 2016 ... 108 Figure 42 Outlook for Russian export capacity utilisation for seaborne hard coal until 2016 .......... 108
LIST OF TABLES Table 1 Major hard coal and brown coal consumers among OECD countries ................................ 16 Table 2 Major hard coal and brown coal producers among OECD countries .................................. 23 Table 3 Projection of coal demand until 2016 ................................................................................. 29 Table 4 Coal demand projections for China ..................................................................................... 37 Table 5 Breakdown of important input factors for coal mining in Australia ................................... 56 Table 6 Coal demand, 2009‐2016, in Mtce .................................................................................... 111 Table 7 Coal production, 2009‐2016, LPS, in Mtce ........................................................................ 111 Table 8 Coal production, 2009‐2016, HPS, in Mtce ....................................................................... 112 Table 9 Hard coal net imports, 2009‐2016, LPS, in Mtce ............................................................... 112 Table 10 Hard coal net imports, 2009‐2016, HPS, in Mtce .............................................................. 113 Table 11 Seaborne steam coal imports, LPS, 2009‐2016, in Mtce ................................................... 113 Table 12 Seaborne steam coal imports, HPS, 2009‐2016, in Mtce .................................................. 113 Table 13 Seaborne steam coal exports, LPS, 2009‐2016, in Mtce ................................................... 114 Table 14 Seaborne steam coal exports, HPS, 2009‐2016, in Mtce .................................................. 114 Table 15 Seaborne metallurgical coal imports, LPS, 2009‐2016, in Mtce ........................................ 114 Table 16 Seaborne metallurgical coal imports, HPS, 2009‐2016, in Mtce ....................................... 115 Table 17 Seaborne metallurgical coal exports, LPS, 2009‐2016, in Mtce ........................................ 115 Table 18 Seaborne metallurgical coal exports, HPS, 2009‐2016, in Mtce ....................................... 115 Table 19 Indicative net calorific values of internationally traded steam coal in kcal/kg ................. 116
© O
ECD
/IEA
, 201
1

MEDIUM‐TERM COAL MARKET REPORT 2011 9
EXECUTIVE SUMMARY The global outlook for coal is marked by extreme uncertainty. On the demand side, recovery from the 2009 global economic recession has been tentative in many countries, casting doubt on future growth rates. While on the supply side, given China’s significant share in global coal production and consumption, a minor imbalance in the domestic Chinese market would impact the rest of the world. Power generation represents the largest absolute use of coal. As electricity demand is closely correlated with economic growth, so, too, is coal demand with GDP growth. The global economic recession in 2009 affected industrial production and electricity generation all over the world, which led to a stagnation in global coal consumption for the first time in the past decade. Nevertheless, the concentration of coal demand in developing countries and its importance in fast growing emerging markets was palpable: while global oil and gas consumption fell measurably in 2009, the consumption of coal only stagnated. In the midst of recovery, uncertainties around economic evolution during the outlook period (2011‐2016) are tremendous. Hence, the following coal demand projections bear similar uncertainty levels. China’s share in global coal production is almost four times that of Saudi Arabia’s production of oil. Its share in global coal consumption is more than twice that of the demand for oil in the United States. Overall, the Chinese domestic coal market is more than three times the entire international coal trade. Therefore, any imbalance between Chinese production and demand has the ability to have a large impact on global coal trade. This outlook illustrates the impact of Chinese coal production uncertainty on international coal trade by analysing two scenarios, a high Chinese production scenario (HPS) and a low Chinese production scenario (LPS). The growth of average daily coal demand during the last decade was over 700 000 tonnes. As this growth has been stronger in some regions than others, the coal market landscape has changed. Coal is the second most important primary energy source behind oil. Throughout the past decade hard coal consumption increased by more than 70% from 3 700 million tonnes (Mt) in 2000 to an estimated 6.3 billion tonnes in 2010. This boost in coal demand corresponds to rising coal usage, which currently amounts to approximately 720 000 tonnes every day. Yet, growth in coal demand varies from country to country: while coal consumption has stagnated among OECD countries in recent years, the surge in global coal consumption is driven primarily by developing economies, such as China and India. This rapid growth in coal use has affected international coal trade substantially. Even though suppliers, such as Australia and Indonesia, ramped‐up production quickly, a strong increase in demand caused an unprecedented spike in the price of coal in 2007 and 2008. Although prices plummeted in early 2009, due to the global economic recession, since then they have steadily continued to rise. This development was paralleled by supply cost increases due to higher prices for mining inputs and labour, as well as soaring freight rates. Yet, coal price increases have over‐compensated for the cost escalation, leaving the coal industry with additional profits. Metallurgical coal markets have been even tighter than steam coal markets in recent years. This has caused coking coal prices to decouple from steam coal prices.
© O
ECD
/IEA
, 201
1

10 MEDIUM‐TERM COAL MARKET REPORT 2011
Coal demand will continue growing in the outlook period, but the pace of growth slows. China, in absolute terms and India, in relative terms, will lead the growth. While global coal demand is projected to increase from 5 225 Mtce in 2010 to 6 184 Mtce in 2016 (2.8%), Chinese coal demand alone is projected to increase from 2 517 Mtce in 2010 to 3 123 Mtce in 2016 (3.7% p.a.). Indian coal consumption is projected to increase from 434 Mtce to 610 Mtce by the end of the outlook period (5.9% p.a.), which equates to an absolute increase of 40.55%. Coal demand growth is projected to be sluggish in the OECD. For nearly a century, the United States was the world’s largest consumer of coal. However, coal demand in the United States peaked in 2007, due mainly to competition from other energy sources, such as natural gas, and increased environmental regulation. As such, coal demand in the United States is not expected to reach the pre‐recession level in the outlook period. OECD countries in Europe and Asia, however, offset the decline in consumption in the United States, which lead to a total annual coal demand growth of 0.2%. China: the dominant driver of global coal markets. Chinese domestic coal extraction has increased at astonishing rates over the past decade: Chinese coal mining now produces more primary energy supply than Middle Eastern oil. Nevertheless, China started to import rising coal volumes from the international markets in 2005. This was due to a progressive tightening of the Chinese coal market when domestic production was unable to keep up with soaring demand. Today, China accounts for approximately one‐half of global coal consumption. Thus, through sheer size, even a small mismatch between domestic supply and demand could have powerful worldwide effects on coal prices, trade flows and utilisation rates of coal supply chains. In the coming years, the Chinese coal industry will face several major challenges in meeting its growing demand for coal. First, new mines will need to be developed and production increased in existing collieries (coal mines, including all buildings and equipment). Second, congested domestic transport infrastructure will require expansion and improvements to ship additional coal from production centres to demand hubs. Some new mines are located very far from major industrial cities, which will inevitably lead to transportation challenges. Third, productivity and efficiency gains must be achieved to keep coal affordable for consumers. Finally, as China aims to reduce the environmental impact of its coal consumption, significant investments will be needed for upgrading power plants. Chinese authorities are currently in the process of restructuring and consolidating the coal mining industry and have ambitious plans to ramp‐up nuclear and renewable electricity production. The development of coal production, and hence the future level of Chinese imports, is dependent on how fast this reorganisation takes place and when investments are made. Due to these unknowns, we present two possible scenarios, noted below. A 5% production difference between the scenarios could lead to two very different outcomes for the global coal trade. One scenario assumes that Chinese coal production and infrastructure expansion cannot keep up with domestic coal demand. This scenario referred to as the low Chinese production scenario (LPS), assumes a continued strong demand for imported hard coal. The other scenario, referred to as the high Chinese production scenario (HPS), assumes that Chinese coal production increases at higher rates during the outlook period. As a consequence, Chinese import demand is lower in this scenario.
© O
ECD
/IEA
, 201
1
MEDIUM‐TERM COAL MARKET REPORT 2011 11
In the LPS, Chinese hard coal production grows from 2 399 Mtce in 2010 to 2 913 Mtce in 2016. This production level causes Chinese hard coal imports to almost double from 92 Mtce in 2010 to 180 Mtce in 2016. In the HPS, Chinese production grows to 3 054 Mtce in 2016. This production level causes Chinese hard coal imports to drop by 58% from 92 Mtce in 2010 to 39 Mtce in 2016. The difference in Chinese seaborne imports, which reaches its maximum of 141 Mtce in 2016, has various implications for seaborne hard coal trade. High imports (LPS) tighten the seaborne hard coal market and call for suppliers world‐wide. Compared to the HPS, which results in lower imports, the utilisation of export mining and infrastructure capacity is higher on a global scale. Given a tight market situation with high Chinese imports, several suppliers provide higher volumes than they would with lower Chinese imports. Coal in the United States will balance the market if needed, but at higher prices. These additional volumes stem from collieries that incur higher mining and/or transport costs, as well as from mines that produce lower coal qualities. The United States is a key swing supplier in both, metallurgical and steam coal trade, and plays a crucial role in balancing the market when low‐cost supply is scarce. Depending on market conditions, the United States is capable of ramping‐up exports quickly and nearly doubling their exports from 58 Mtce in 2010 to 110 Mtce (in 2012) in the LPS. On the other hand, US coal exports are increasingly crowded out by low‐cost suppliers in the HPS. The United States were already a major coal exporter during the 1990s and have the necessary infrastructure in place. With relatively low natural gas prices coal‐burn is currently low in the US power sector giving coal producers the opportunity to export additional volumes. While traditional exporters keep their place in the coal market, some new players, such as Mongolia and Mozambique emerge as important producers. The bulk of global coal exports come from the traditional base suppliers including Indonesia, Australia, Russia, South Africa and Colombia. However, Mongolia and Mozambique are two promising new players who are becoming more relevant with regard to the highly concentrated metallurgical coal trade. Mongolia will treble its exports from 10.3 Mtce in 2010 to 30 Mtce in 2016, and exclusively serves China with low cost coal through the “backdoor” via overland trade. Mozambique started exporting coal in 2011 and is projected to reach 21 Mtce by 2016. These entrants are low cost alternatives and gain market share at the expense of high cost producers, such as the United States or Canada, especially in the HPS. In the HPS, India becomes the largest coal importer. In the LPS, importing countries will pay higher coal prices. With more costly supply utilised in the LPS, marginal costs of supply (FOB) are projected to be approximately USD 10/t higher for steam coal and about USD 15/t higher for metallurgical coal, compared to the HPS. The lower supply costs in the HPS attract Indian buyers, making India the largest steam coal importer by 2016. In this scenario, Indian imports escalate from 81 Mtce in 2010 to 204 Mtce in 2016 compared to 174 Mtce in the LPS. Additional Indian imports absorb some decline in Chinese imports and reduce export‐capacity slack in this scenario. Therefore, the lower Chinese imports in the HPS are partly offset by higher Indian imports and supply costs are, hence,
© O
ECD
/IEA
, 201
1
12 MEDIUM‐TERM COAL MARKET REPORT 2011
partially stabilised. This mainly affects steam coal trade (seaborne steam coal market volume differs by 71 Mtce in 2016) whereas in metallurgical coal trade, the lower Chinese imports fully feedback to seaborne trade market volume (metallurgical trade market volume differs by 37 Mtce in 2016). Investments in the pipeline are solid, both in mining and infrastructure capacity. From a supply security perspective, global hard coal supply capacity is sufficient to meet demand over the medium‐term, however, bringing excess capacity to international markets usually implies a substantial increase in supply costs due to higher transport distances, lower coal qualities or more costly mining. The relatively high prices throughout the past five years have triggered investments in the coal industry, thus project pipelines are healthy, with substantial additions to mining and infrastructure capacity being scheduled to become operational over the medium‐term. Global export mining capacity is projected to increase from nearly 1 180 Mtpa in 2010 to almost 1 600 Mtpa in 2016 if all projects are developed on time (including mines that also serve the domestic markets). Out of the additional 420 Mtpa of mining capacity, almost 140 Mtpa are in an advanced state and are thus considered as probable additions in this outlook. The remaining 280 Mtpa are less advanced and are considered as potential additions. Export terminal capacity is projected to increase from 1 288 Mtpa to 1 528 Mtpa over the outlook period. Nevertheless, poorly co‐ordinated investments, project cancellation and weather‐related disruptions may result in nervous markets in the medium‐term forecast. Newly developed deposits are often located farther away from existing infrastructure and thus require substantial complementary investments into port and railway capacities. Projects in mature mining regions often experience deterioration of product qualities or mining conditions. These factors put fundamental upward pressure on future supply costs. Although scheduled projects are theoretically sufficient to accommodate trade market growth, even in the LPS, the reality may be different. Current projects are in various stages of advance, and depending on market conditions some might be cancelled and others delayed. A major problem in coal supply chain investment is the involvement of various stakeholders with differing objectives. In the past, this has caused situations where supporting or complementing investments, e.g. into railway lines or port capacities were not synchronised and coordinated with mining investments, resulting in temporary overcapacities or bottlenecks along the supply chain. Therefore in the LPS, temporary bottlenecks and high capacity utilisation rates may nevertheless be a likely feature in the medium‐term, if key projects in low‐cost countries, (e.g. Australia, Colombia or South Africa) are delayed or cancelled.
© O
ECD
/IEA
, 201
1

MEDIUM‐TERM COAL MARKET REPORT 2011 13
RECENT MARKET TRENDS Summary
• Global hard coal demand grew by more than 70% from 3 700 million tonnes (Mt) in 2000 to an estimated 6 317 Mt in 2010. Unlike oil and gas, global coal consumption did not experience a decline in 2009, even though the world economy went through a sharp recession.
• Coal demand growth is not evenly distributed geographically. China and, to a
lesser extent, India together accounted for 90% of coal demand growth. While coal consumption among OECD countries dropped by almost 170 Mt in 2009 and has not yet reached pre‐recession levels, coal consumption among non‐OECD countries increased by 186 Mt during 2009 and by another 658 Mt during 2010.
• Total coal‐based electricity generation within the OECD stood at 3 735 TWh in
2010 up from 3 620 TWh in 2009 (+3.2%). Coal‐based power generation has not yet fully recovered from the recession and is still below 2008 levels of 3 794 TWh. Coal’s share of total OECD electricity generation was 35% in 2009.
• Total coal‐based power generation among non‐OECD countries stood at
4 498 TWh in 2009 up from 4 381 TWh in 2008 (+2.7%). In 2009 coal‐based power generation made up 47% of total non‐OECD power generation.
• Total hard coal production further increased in 2010 and is estimated to have
reached 6 186 Mt, a 6.8% increase over 2009 levels. Hard coal production among OECD countries recovered slightly from the recession and reached 1 467 Mt in 2010 up from 1 436 Mt in 2009 (+2.2%). While OECD hard coal production had a share of global output of nearly 40% in 2000, this share dropped to less than a quarter in 2010.
• China is the largest hard coal producer in the world and output is estimated to
have reached 3 162 Mt in 2010, up from 2 895 Mt in 2009. Although China has become a large net importer, domestic coal production increased by 161 Mt during 2009 and by 267 Mt during 2010, showing a strong capacity to ramp up domestic production.
Demand
Total hard coal consumption has increased by more than 70% from 3 700 million tonnes (Mt) in 2000 to an estimated 6 317 Mt in 2010. This implies a compound annual growth rate of 5.5% per year over the last decade, the highest growth rate of all fossil fuels. On a year‐on‐year basis, hard coal consumption stagnated in 2009 as a result of the global economic recession – triggered by the financial crisis – which affected industrial production and electricity generation in countries all over the world. Steam coal consumption decreased slightly, but relatively strong metallurgical coal demand from steel mills compensated the decline. However, if increasing
© O
ECD
/IEA
, 201
1
14 MEDIUM‐TERM COAL MARKET REPORT 2011
demand from China and other mainly Asian emerging and developing countries had not stabilised the coal market during 2009, global hard coal consumption would have declined, in line with other fossil fuel consumption. Despite the recession, China’s coal consumption alone increased by more than 200 Mt during 2009 and Indian coal consumption increased by more than 50 Mt. Many regions, especially OECD countries in the Americas and Europe, lowered their hard coal consumption substantially, mainly due to reduced economic activity and inter‐fuel competition of coal with gas in the power sector. In 2010, coal consumption in OECD countries recovered somewhat and reached a total of 1 646 Mt, up from 1 547 Mt in 2009. Most of the growth in coal consumption among OECD countries in 2010 came from the Asia Pacific region. Yet, total consumption levels among OECD countries in the same year remained below the 1 715 Mt experienced in 2008. In contrast to hard coal, total global demand for brown coal decreased slightly by 2.5% during the recession and reached 954 Mt in 2009. Brown coal consumption declined both in OECD and non‐OECD countries due to reduced coal‐based electricity generation. In 2010 brown coal consumption declined by another 3.5% and is estimated to have totalled 921 Mt. However, the decline in non‐OECD brown coal consumption could be a statistical flaw, as some countries (especially China) do not report split data on brown coal consumption.
Box 1 Coal for beginners
Coal: coals are solid, combustible, fossil sediments. They come from buried vegetation transformed by the action of high pressure and temperature over millions of years.
Coal rank: the degree of transformation from the original plant source. It is loosely related to coal’s age and it is determined from random reflectance of the vitrinite, one of its organic components.
Coal classifications: refers to a whole range of ages, compositions and properties, there are many different classifications used around the world. The main parameter used for classifying coal is coal rank. Other parameters used to classify coal are its calorific value, carbon content, ash content, volatile matter content and moisture.
Types of coal: in decreasing order of transformation, from high to low rank, there is anthracite, bituminous coal, sub‐bituminous coal, lignite and peat. This report adheres to the criterion published in the IEA Coal Information series where coals are more simply distinguished as being either hard coals or brown coals.
Hard coal: refers to high rank coal (anthracite, bituminous coal and some sub‐bituminous coal) with a gross calorific value of more than 23.9 GJ/t on ash‐free, moist basis. Hard coal is commonly classified to include steam coal and coking coal. Black coal is also a commonly used term for hard coal.
Steam coal: refers to a hard coal used to produce heat/electricity, which comprises the majority of hard coal consumption. Steam coal is also referred to as thermal coal.
Coking coal: refers to a high quality coal used to produce the coke utilised in blast furnaces and is necessary in the production of pig iron. The terms metallurgical coal and coking coal are often used interchangeably.
Semi‐soft coal: refers to a high quality steam coal mixed with coking coal to produce coke for blast furnaces.
Pulverised coal injection (PCI) coal: a high quality steam coal injected into a blast furnace to reduce coke consumption.
© O
ECD
/IEA
, 201
1
MEDIUM‐TERM COAL MARKET REPORT 2011 15
Box 1 Coal for beginners (continued)
Metallurgical coal: refers to the coking coal and other coals used in iron and steel production, such as semi‐soft coal and pulverised coal Injection (PCI). As mentioned above, metallurgical coal is also often referred to as coking coal.
Brown coal: refers to coal with a gross calorific value less than 23.9 GJ/t on ash‐free, moist basis, and includes some sub‐bituminous, plus lignite and peat. Due to its low calorific value, and thus, high transport cost per energy content, brown coal is often consumed near mines and only hard coal is usually internationally traded.
Tonne of coal equivalent (tce): a unit of energy widely used in the international coal industry. A tonne of coal equivalent (tce) is defined as 7 million kilocalories. Therefore, the relation between tce and physical tonnes is in accordance with the net calorific value of coal. 1 tonne of coal with a net calorific value of 7000 kilocalories/kilogram (kcal/kg) represents 1tce.
Coal mining: refers to a technique used in the removal of coal. As coal deposits occur in the Earth’s crust at various seam configurations and depths, the condition of the deposit determines the mining method. Generally, deep deposits are mined by underground mining and shallow deposits are mined by opencast mining. The strip ratio largely determines whether an opencast mine is profitable or not.
Strip ratio: refers to the overburden, or waste material, to be removed per unit of coal extracted. Therefore, high strip ratios make opencast mining unprofitable.
Opencast mining: a mining method whereby the overburden is first drilled, then blasted and finally removed. Once access has been gained, coal is removed in a similar way. For removal, truck and power/electric shovel, or sometimes conveyor belts, may be used as well as some exceedingly large mining machinery, such as draglines or bucket wheels. In general, open mining is less labour intensive than underground mining, but with higher consumable costs, e.g. tyres, diesel, explosives. It also implies greater environmental impact than underground mining.
Underground mining: a mining method in which coal seam access is gained through shafts, galleries or tunnels. Although there are many different ways to mine a coal deposit underground, coal is usually stripped by automatic shearers or continuous miners using either short/long walls or room and pillars exploitations. In general, underground mining is labour intensive and requires high capital investments.
Coal washing/upgrading: a process consisting of partial removal of undesirable constituents from raw coal, i.e. ash/moisture, which therefore produces higher quality coal.
Coal quality: consists of a large variety of properties exhibited by coals makes quality issues very complex. Some flexibility in properties is acceptable for steam coals. However, there may well be some price penalty applied to coals with a lower energy content. And a high ash or sulphur content may also warrant some discount. On the contrary, metallurgical coal has a price premium, with different premium levels for low volatile, high volatile, semi‐soft or PCI coals. Acceptable flexibility for coking coals is smaller than for steam coals.
OECD demand trends
Total hard coal consumption among OECD countries stood at 1 646 million tonnes (Mt) in 2010 and thus represented about a quarter of hard coal consumption worldwide, with nearly 90% of consumption coming from steam coal. Over the past decade steam coal consumption among OECD countries increased by approximately 0.5%, whereas metallurgical coal consumption decreased by approximately 1.1% per year.
© O
ECD
/IEA
, 201
1

16 MEDIUM‐TERM COAL MARKET REPORT 2011
Table 1 Major hard coal and brown coal consumers among OECD countries
Hard coal Brown coal
in Mt 2009 2010* 2009 2010*
Australia 67.0 64.4 68.3 67.2
Austria 3.3 3.3 0.1 0.1
Belgium 4.7 2.8 0.2 0.1
Canada 9.8 9.3 38.2 37.8
Chile 6.8 7.8 0 0
Czech Republic 6.8 7.8 44.2 43.3
Denmark 6.8 6.5 0 0
Finland 5.4 6.9 0 0
France 16.4 17.3 0.1 0.1
Germany 52.0 58.6 169.9 169.3
Greece 0.3 0.6 65.2 54.8
Hungary 1.3 1.8 9.3 9.2
Ireland 1.9 1.8 0 0
Israel 12.3 11.8 0.4 0.5
Italy 19.4 20.9 0.6 0.6
Japan 164.0 186.6 0 0
Korea 106.9 118.4 0 0
Mexico 16.4 18.3 0 0
Netherlands 11.9 11.9 0 0
New Zealand 2.7 2.9 0.3 0.3
Poland 75.7 85.3 57.1 56.6
Portugal 4.7 2.7 0 0
Slovak Republic 4.3 3.5 3.3 3
Spain 18.3 14.9 1.4 2.1
Turkey 22.0 29.7 76.7 69
United Kingdom 48.8 51.3 0 0
United States 853.4 895.5 65.1 63.6
* Estimate.
The United States is the largest hard coal consumer among OECD countries, before Japan, Korea and Poland. In 2009, steam coal consumption in the United States fell by 11% year‐on‐year and has not yet fully recovered. Between 2005 and 2008, US steam coal consumption remained flat, slightly above 930 Mt. Although US steam coal consumption recovered slightly after its decline in 2009, consumption of 873 Mt in 2010 is still considerably below the quantities observed prior to the recession. This is mainly due to the relatively low price of natural gas in the US market, which gave gas‐fired power plants a substantial cost advantage over coal‐fired plants in some regions of the country and consequently lead to a fuel switch in electricity generation. Metallurgical coal consumption in the United States plummeted by nearly 30% during 2009, but recovered quickly and was only slightly below pre‐recession levels in 2010. Coal burn in major Asia Pacific economies, such as Japan
© O
ECD
/IEA
, 201
1
MEDIUM‐TERM COAL MARKET REPORT 2011 17
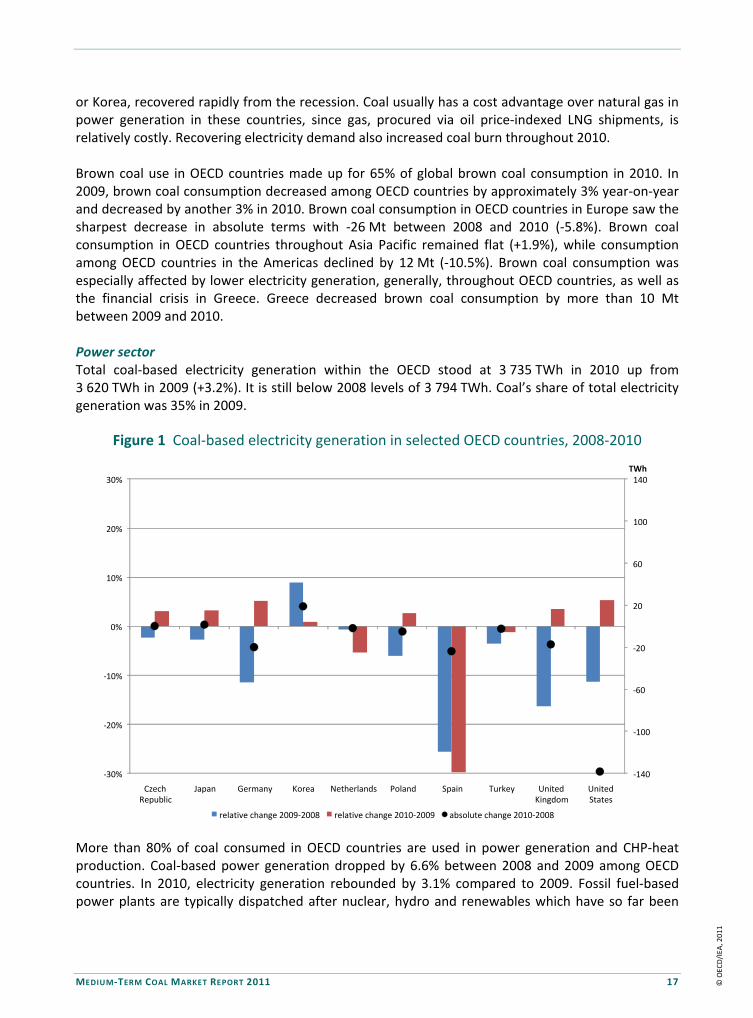
or Korea, recovered rapidly from the recession. Coal usually has a cost advantage over natural gas in power generation in these countries, since gas, procured via oil price‐indexed LNG shipments, is relatively costly. Recovering electricity demand also increased coal burn throughout 2010. Brown coal use in OECD countries made up for 65% of global brown coal consumption in 2010. In 2009, brown coal consumption decreased among OECD countries by approximately 3% year‐on‐year and decreased by another 3% in 2010. Brown coal consumption in OECD countries in Europe saw the sharpest decrease in absolute terms with ‐26 Mt between 2008 and 2010 (‐5.8%). Brown coal consumption in OECD countries throughout Asia Pacific remained flat (+1.9%), while consumption among OECD countries in the Americas declined by 12 Mt (‐10.5%). Brown coal consumption was especially affected by lower electricity generation, generally, throughout OECD countries, as well as the financial crisis in Greece. Greece decreased brown coal consumption by more than 10 Mt between 2009 and 2010. Power sector Total coal‐based electricity generation within the OECD stood at 3 735 TWh in 2010 up from 3 620 TWh in 2009 (+3.2%). It is still below 2008 levels of 3 794 TWh. Coal’s share of total electricity generation was 35% in 2009.
Figure 1 Coal‐based electricity generation in selected OECD countries, 2008‐2010
More than 80% of coal consumed in OECD countries are used in power generation and CHP‐heat production. Coal‐based power generation dropped by 6.6% between 2008 and 2009 among OECD countries. In 2010, electricity generation rebounded by 3.1% compared to 2009. Fossil fuel‐based power plants are typically dispatched after nuclear, hydro and renewables which have so far been
‐140
‐100
‐60
‐20
20
60
100
140
‐30%
‐20%
‐10%
0%
10%
20%
30%
Czech Republic
Japan Germany Korea Netherlands Poland Spain Turkey United Kingdom
United States
TWh
relative change 2009‐2008 relative change 2010‐2009 absolute change 2010‐2008
© O
ECD
/IEA
, 201
1
18 MEDIUM‐TERM COAL MARKET REPORT 2011
‘must‐run’ capacities. Even though coal regained some market share in electricity generation in 2009, due to the rapid decrease of coal prices, since that time, coal‐based electricity generation has decreased in the majority of OECD countries.
In the United States, the second largest consumer, coal has had to compete with declining electricity demand, due to lower economic activity, and with increasing inter‐fuel competition with natural gas. Very low Henry Hub gas prices throughout most of 2009 pushed out coal‐based electricity generation in several regions. United States coal‐based power generation dropped from 2 000.4 TWh to 1 782.6 TWh (10.4%) in 2009. Henry Hub prices partly recovered in 2010 and rose by 6%. On the other side, coal prices from the Uinta and Powder River Basins remained predominantly flat; almost 7 GW of new coal‐fired power plant capacity was commissioned in 2010. This led to a rebound of coal demand for electricity generation in the United States of 5.4%.
Coal‐based electricity generation in several European countries has declined significantly since 2008. Spain and the United Kingdom, as well as Germany and the Netherlands, experienced sharp decreases in coal‐based electricity generation in 2009, which have so far not completely recovered in 2010. Besides lower demand levels and partly increased gas‐fired generation, the increasing share of renewables is squeezing profit margins of coal‐based power generation. Generally, three effects of renewables on coal‐fired electricity generation may prevail in power systems. First, load that remains to be served by conventional power plants after renewables feed‐in (residual load) is lower with a high share of renewables. Second, this effect usually implies a short‐run decrease in electricity prices as the lower load levels can be met by power stations with lower generation costs in a given merit‐order. Consequently, profit margins of conventional plants are decreasing. Third, the residual load duration curve may become steeper due to the intermittent feed‐in character of wind and solar energy (e.g. in Germany). This effect favours power plants that have good technical flexibility and low capital costs, such as gas turbines and hampers coal‐fired base load, and mid‐merit generation capacities. These phenomena could have an increasing impact on coal‐based power generation in the future for countries with increasing shares of intermittent renewables feed‐in.
Coal‐based power generation increased in Japan and Korea between 2008 and 2010. Coal usually has a cost advantage over natural gas in power generation in these countries since gas, procured via oil price‐indexed LNG shipments, is relatively costly. With accelerating electricity demand this has also increased coal burn in the power sector during 2010. Non‐power sectors The share of non‐power sectors’ coal consumption in total coal consumption is approximately 20% among OECD countries. The majority of this coal is used in industrial transformation processes (such as blast furnaces and coke ovens) and in the industry itself (for cement production or steam generation). In 2009, coal input for iron and steel stood at 113 Mtce, whilst the rest of the industry consumed 48 Mtce. Non‐metallic minerals industries (cement production) used approximately 24 Mtce in 2009, and remain the second largest industrial coal consumers. The chemical industry consumed close to 15 Mtce, and paper and pulp industries close to 10 Mtce. Residential coal consumption stood at 23 Mtce. The financial crisis caused a significant drop in industrial output in OECD countries in 2009. Consequently, coal consumption plummeted by about 18% between 2008 and 2009 in the industry and in industrial coal transformation (e.g. coke production). However, during 2010, economic activity recovered slightly and industrial output increased among OECD countries.
© O
ECD
/IEA
, 201
1
MEDIUM‐TERM COAL MARKET REPORT 2011 19
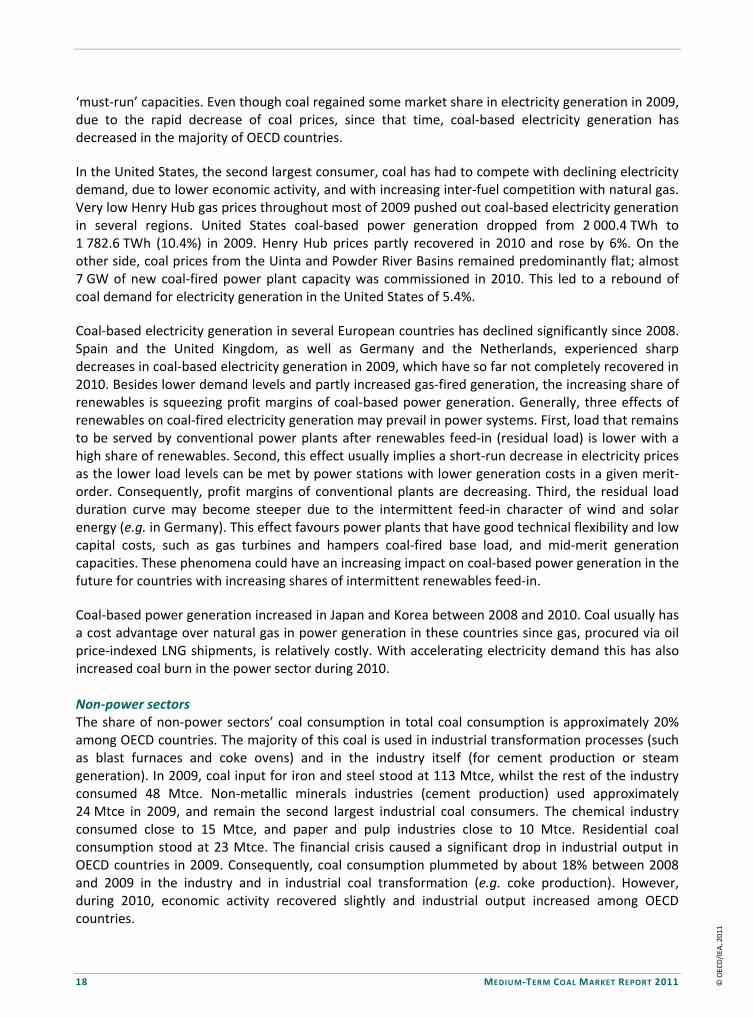
Figure 2 Monthly crude steel production in OECD countries in thousand metric tonnes, 2008–2010
Source: World Steel Association.
Non-OECD demand trends
Although coal consumption stagnated among OECD countries, global coal consumption increased by about 70% over the last decade. Most of this incremental consumption came from China where coal fuels the tremendous economic growth. Other non‐OECD economies, especially India, have also contributed to the strong increase in global coal use, although at a much lower rate. From 2008 to 2009, hard coal consumption among non‐OECD countries grew by 4.7% and reached 4 112 Mt. In 2010, hard coal consumption grew by more than 13% to 4 670 Mt. Metallurgical coal use grew from 601 Mt in 2009 to 696 Mt in 2010 (+16%) and thus slightly faster than steam coal use, which grew from 3 512 Mt in 2009 to 3 975 Mt in 2010 (+13%) in non‐OECD economies. China is the largest coal consumer in the world and accounts for about 70% of coal consumption among non‐OECD countries and for more than one‐half of global hard coal consumption. Within three months China consumes an amount of hard coal roughly equivalent to the global seaborne coal trade in one year. Chinese hard coal consumption was estimated at 3 319 Mt in 2010, up from 2 884 Mt in 2009. Despite the fact that domestic coal production continues to rise, the demand for imported coal has grown rapidly in recent years. India is the third largest coal consumer behind China and the United States and the second largest among the non‐OECD country group. India accounts for nearly 15% of non‐OECD coal consumption. Indian hard coal consumption reached 626 Mt in 2010 up from 589 Mt in 2009 (+6.3%). Despite the global recession, Indian coal consumption increased by 9.5% in 2009. Brown coal consumption among non‐OECD countries stood at 321 Mt in 2010, down from 335 Mt in 2009. In 2009, brown coal production decreased among non‐OECD countries by 1.5%. Usually brown coals are used for electricity generation in close proximity to the mines. Therefore brown coal consumption and production generally match closely.
0
5 000
10 000
15 000
20 000
25 000
Jan‐08
Mar‐08
May‐08
Jul‐08
Sep‐08
Nov‐08
Jan‐09
Mar‐09
May‐09
Jul‐09
Sep‐09
Nov‐09
Jan‐10
Mar‐10
May‐10
Jul‐10
Sep‐10
Nov‐10
OECD Europe OECD Americas OECD Pacific
© O
ECD
/IEA
, 201
1
20 MEDIUM‐TERM COAL MARKET REPORT 2011
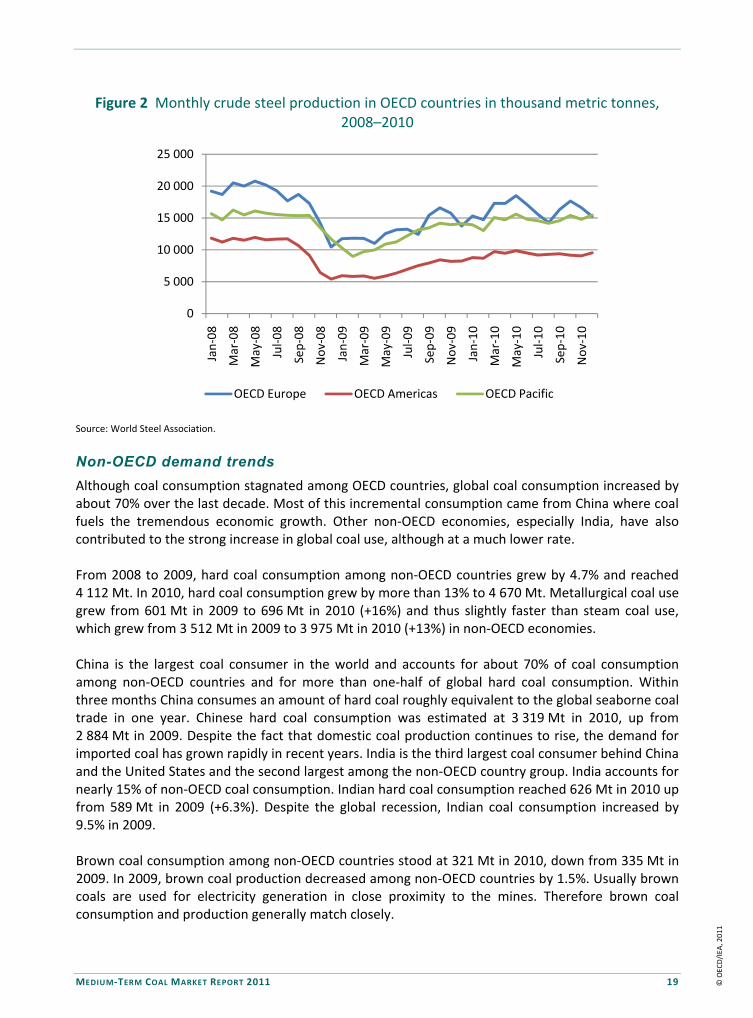
Figure 3 Evolution of global coal consumption (hard and brown coal)
* Estimate.
Power sector Total coal‐based power generation among non‐OECD countries stood at 4 498 TWh in 2009, up from 4 381 TWh in 2008 (+2.7%). In 2009, coal‐based power generation made up for 47% of total power generation among non‐OECD countries. China is the main electricity producer among non‐OECD countries. Coal is the backbone of the Chinese power system and nearly 80% of the electricity produced in China stems from coal‐fired plants. Chinese coal‐based electricity generation amounted to 2 941 TWh in 2009, up from 2 756 TWh (+6.7%) in 2008 and is estimated to have reached more than 3 200 TWh in 2010. Different from most countries, where 65% to 75% of coal consumption is typically used towards electricity and heat generation, China consumes only slightly more than one‐half of its coal in the power and heat sector. Nevertheless, the electricity sector is a major driver for Chinese coal burn. Annual economic growth in China continued on impressive levels of more than 8% throughout the recession, supported by a large‐scale infrastructure investment programme. Infrastructure investments also positively affected coal demand in electricity, steel and cement production. India produced 617 TWh of electricity from coal in 2009, 48 TWh more than in 2008 (+8.4%). Coal’s share in the Indian power generation mix amounts to 74%. India has increasingly sourced its coal supply from international markets and has become the fourth largest coal importer in the world. Due to domestic supply constraints and quality issues, Indian import demand is likely to grow rapidly over the medium‐term and the government has sanctioned exports to meet domestic demand. In 2009 Chinese Taipei generated 124 TWh of electricity from coal‐fired plants, roughly the same as in 2008. About 52% of the total electricity generated in this country is from coal. As domestic coal
0
500
1 000
1 500
2 000
2 500
3 000
3 500
2000 2001 2002 2003 2004 2005 2006 2007 2008 2009 2010*
Mt
OECD China Other non‐OECD
© O
ECD
/IEA
, 201
1

MEDIUM‐TERM COAL MARKET REPORT 2011 21
mining has ceased, Chinese Taipei is fully import‐dependent nowadays. Similar to Japan and South Korea, Chinese Taipei pays a price premium on its gas imports due to oil price indexed LNG contracts. This gives coal a substantial cost‐advantage in base and mid‐merit generation.
Figure 4 Monthly Chinese thermal power generation and monthly Chinese coal burn
Source: FGE, 2011.
Russian coal‐based power generation was significantly affected by the recession and decreased by 33 TWh totalling 164 TWh in 2009. With natural gas accounting for 47% of the power generation in Russia, coal plays a relatively minor role in the Russian electricity sector with a share of only 17%. Non‐power sectors Trends in coal use in non‐power sectors are diverse in among non‐OECD countries. Together, China and India account by far for most of the non‐power coal consumption among non‐OECD countries. Non‐power coal consumption has a share of approximately 45% in China and approximately 27% in India. Similar to OECD countries, the majority of coals in the non‐power sector are used to produce coke (for iron and steelmaking) and steam for industrial purposes. The global economic recession had different impacts among non‐OECD countries. Steel is a major input for various industries and steel output development is thus a good indicator of the level of economic activity. The steel industries recovered quickly from the global recession in China and India and reached pre‐crisis levels of output in the first half of 2009. Recovery from the crisis was more difficult for steel industries of Former Soviet Union (FSU) countries, particularly in Russia and the Ukraine. These countries had not returned to the peak output levels of 2008 by the end of 2010. Steel output fed back directly to coal consumption in the iron and steel industry. Although the recession has dampened industrial production and thus industrial coal use to some extent, both India and China recovered quickly. Behind the iron and steel industry, the second largest
0
50
100
150
200
250
300
350
400
100
150
200
250
300
350
MtTWh
Thermal electricity generation (left axis) Total coal burn (right axis)
© O
ECD
/IEA
, 201
1

22 MEDIUM‐TERM COAL MARKET REPORT 2011
industrial coal consumer is the non‐metallic minerals industry (e.g. cement production). This sector has a share of about 30% in Chinese industrial coal consumption; the respective share in India is below 20%. Further, major industrial coal consumers include the chemical industry, the paper industry and various others. Moreover, China has still a relatively high share of coal use (about 5% of total coal use) in buildings. Most of this is residential coal consumption where coal is used for space and water heating as well as cooking.
Figure 5 Monthly crude steel production in selected non‐OECD countries in thousand metric tonnes, 2008‐2010
Source: World Steel Association.
Supply
Total hard coal production further increased and is estimated to have reached 6 186 Mt (steam coal: 5 295 Mt) in 2010, a 6.8% increase over 2009 levels. World hard coal production in 2009 was 5 790 Mt (steam coal: 5 008 Mt), an increase of 102 Mt, or 1.8%, from 2008. Over the last decade, hard coal production increased by 5.6% per year. Approximately 85% of hard coals produced are steam coals, with the remainder being metallurgical coals. Coal production among OECD countries stagnated over the last decade while coal production among non‐OECD countries grew by nearly 8% per year. World brown coal production remained relatively flat over the last three years and stood at 1 043 Mt in 2010. Around 60% of the brown coal production is carried out among OECD countries. However, this proportion is decreasing since brown coal production is stagnant among OECD countries, while brown coal production among non‐OECD countries is on the rise. OECD supply trends
Hard coal production in OECD countries decreased from 1 533 Mt in 2008 to 1 436 Mt in 2009 (6.3%); it has recovered slightly from the recession and reached 1 467 Mt in 2010 (+2.2%). While hard coal production among OECD countries contributed to a share of global output of nearly 40% in 2000. This share has dropped to less than one‐quarter in 2010 due to low production growth rates.
2 000
4 000
6 000
8 000
10 000
12 000
14 000
0
10 000
20 000
30 000
40 000
50 000
60 000
China (left axis) FSU (right axis)
India (right axis) Others (right axis)
© O
ECD
/IEA
, 201
1

MEDIUM‐TERM COAL MARKET REPORT 2011 23
Hard coal production in the United States, by far the largest producer among OECD countries in the Americas, rebounded by 10 Mt and reached 932 Mt in 2010, but remains below pre‐crisis levels. This followed a marked drop in production due to the recession; US hard coal production fell by 85 Mt in 2009. This drop is nearly equivalent to total Polish hard coal production. The reduced output is a result of lower electricity generation of the largely coal‐based power sector as well as declining hard coal exports. Especially the Appalachian region and the Illinois basin were affected by the drop in output. Since these two regions interact with the seaborne market, dwindling international coal prices and increasing inter‐fuel substitution in power generation squeezed the margins of coal producers there. Hard coal output among OECD countries in Europe further decreased during 2010 and stood at 129 Mt down from 132 Mt in 2009. OECD European hard coal production decreased by nearly 10% in 2009; mostly driven by lower production in Poland and Germany. Production levels in many European countries have been decreasing for years. Germany, for example, has a phase‐out schedule and mines are downsizing their workforce. Polish production levels have been decreasing in recent years mainly due to underinvestment into mining capacities as well as the continuing restructuring process and privatisation plans in the Polish coal industry. Hard coal production among OECD countries in Asia Pacific increased throughout the recession and reached 360 Mt in 2010. Australia is by far the largest producer and exporter of hard coal among OECD countries in the Pacific region and managed to increase hard coal output by 10 Mt, despite the recession, to a total of 335 Mt in 2009 and by another 18 Mt in 2010. This growth in production is entirely export driven by strong demand from Asian buyers. Yet, Australian exports have suffered from infrastructure constraints over recent years.
Table 2 Major hard coal and brown coal producers among OECD countries
Hard coal Brown coal
in Mt 2009 2010* 2009 2010*
Australia 334.6 353 68.3 67.2
Canada 28.0 33.7 35.0 34.2
Czech Republic 11 11.4 45.4 43.9
Germany 13.8 12.9 169.9 169.4
Hungary 0 0 9 9.1
Korea 2.5 2.1 0 0
Mexico 10.5 10 0 0
New Zealand 4.3 5 0.3 0.3
Norway 2.6 1.9 0 0
Poland 78.6 76.7 57.1 56.5
Slovak Republic 0 0 2.6 2.4
Spain 7 6 2.5 2.4
Turkey 2.9 2.8 76.6 69
United Kingdom 17.9 18.2 0 0
United States 921.8 932.3 65.8 64.8
* Estimate.
© O
ECD
/IEA
, 201
1

24 MEDIUM‐TERM COAL MARKET REPORT 2011
Total brown coal production among OECD countries decreased from 631 Mt in 2008 to 599 Mt in 2010, primarily due to lower demand in power generation. OECD brown coal production has a share of 57% of global brown coal production. Among OECD countries, Europe is the largest brown coal producer followed by the Americas. With output estimated at 431 Mt, OECD countries in Europe currently have a share of more than 40% of global production. Germany, the largest brown coal producer in the world mined 169 Mt in 2010. In 2010, OECD countries in the Americas produced 99 Mt (primarily driven by the United States) and OECD countries in Asia Pacific produced 68 Mt (almost entirely by Australia) of brown coal. Non-OECD supply trends
In 2010, hard coal output in non‐OECD countries was estimated to have reached a total of 4 719 Mt up from 4 354 Mt in 2009, i.e. 8.4 %. Growth in 2009 was more limited, with only 4.8% or 198 Mt. China was an important driver for incremental hard coal production. India and China, the two largest producers among non‐OECD countries, produce primarily for their respective domestic markets. Other key producers, such as Indonesia, South Africa, Russia and Colombia are major exporters and are reviewed in the section, Recent Developments in International Trade. China
China is the largest hard coal producer in the world and output is estimated to have reached 3 162 Mt in 2010 up from 2 895 Mt in 2009. Despite the recession, Chinese coal production increased by 161 Mt or 7.5% during 2009, fuelling electricity generation, as well as steel production. Throughout the global recession, economic growth in China continued at high levels of more than 8% and was supported by a large‐scale infrastructure investment programme underpinned by the Chinese government. Furthermore, the Chinese government is pursuing its plan to systematically reduce the number of small township coal mines. National reform efforts to enhance work safety and efficiency of the entire industry have led to the closing or merging of small and inefficient coal mines, thus improving economies of scale. According to official statements, 1 693 small‐scale collieries with a total capacity of 155 Mtpa were closed down. In Shanxi alone, the number of coal mines decreased from 2 598 to 1 053 by the end of 2010. As a result, the number of small‐scale mines with an annual production of less than 300 000 tonnes was reduced to below 10 000 (VDKI, 2011). Due to the strong increase in coal production, the partly insufficient coal transport system, based on railway and trucks, is close to reaching its limits. The restructuring process has further increased this problem since it resulted in a concentration of production in remote northern and north‐western regions. Transportation of coal or coal‐based electricity has therefore become a serious challenge for a stable and affordable Chinese energy supply, and will almost certainly become even more challenging. As coal mining centres slowly migrate to the north‐western parts of China, especially Shaanxi, Inner Mongolia or even Xinjiang, transport costs and transport bottlenecks are also becoming a burden for supply costs of coal. Inland transport costs can be as high as USD 30/t for shipments between the central coal fields and the coastal demand hubs at present. The share of railway transport has rapidly dropped in recent years but it is still the dominant mode of transport accounting for 44% of total production in 2009 (NBS, 2010). Coastal shipping from the north to the south is becoming increasingly important and smaller volumes are also moved by road and barge. The challenge of coal transport has also promoted the increasing import of coal volumes to the Chinese coastal demand centres.
© O
ECD
/IEA
, 201
1
MEDIUM‐TERM COAL MARKET REPORT 2011 25
India
In 2010, coal production growth slowed (+1.9%) and total production reached 538 Mt. Indian hard coal production increased by 7.6% in 2009 and output totalled 528 Mt for that year. With consumption growing at a much higher rate (+6.3%) between 2009 and 2010, imports had to increase further, to meet demand.
The increasing mismatch between domestic production and demand is caused by a number of factors: first, the predominant domestic producer, Coal India, has not yet commissioned additional mining capacity to serve the surging electricity and industrial demand in the country. This is due to the company’s weak performance, as well as environmental and land use issues. Furthermore, some of the mining areas are densely populated and the expansion of surface mines (almost 90% of the production stems from open pit mines) requires resettlements. Negotiations to allocate mining rights between state and central government can delay project developments considerably.
Second, Indian steam coal is relatively low in quality, mainly due to a low calorific value and high ash content (up to 60%). This means that Indian steam coal often requires significant coal washing and processing to make it suitable for power generation. Production of domestic metallurgical coal, which is also relatively low in quality, is lower than 10 % of total Indian production due to limited resources. It is unlikely that Indian metallurgical coal production will increase significantly in the future.
Finally, as in China, a mismatch between the location of coal fields and demand hubs requires coal to be hauled over long distances. Although coal is widely used in every state in India, production is highly concentrated with 80% of both reserves and resources located in the just four states: Chattisgarh, Jharkand, Orissa and West Bengal. The average transport distance for coal was 623 km in 2008. Coal and other freight transport is cross‐subsidising passenger transportation in India. Actual freight costs are approximately one‐third below transportation prices. Rail transportation costs over a distance of 1 500 km from the coal mines in the East to the electricity demand centres, such as Delhi, Mumbai or Chennai, are typically INR 1 300 per tonne of coal (USD 30/t).
Brown coal production
The largest brown coal producer among non‐OECD countries is Russia. Russian brown coal production was severely affected by the global economic recession and fell by 16.3% totalling 69 Mt in 2009. In 2010, Russian brown coal consumption rebounded somewhat and reached 76 Mt. Brown coal is also widely produced in Eastern Europe and output remained relatively flat in this region over the past years despite the recession. In 2010, major producers were Serbia (37 Mt), Romania (31 Mt) and Bulgaria (29 Mt). Significant brown coal producers in Asia are India (33 Mt), Thailand (18 Mt) and Mongolia (9 Mt).
References
NBS [National Bureau of Statistics] (2010), “China Statistical Yearbook 2010”, National Bureau of Statistics of China, Beijing. VDKI [Verein der Kohlenimporteure e.V] (2011), “Annual Report 2011 – German Hard Coal Importer’s Association”, Hamburg, www.verein‐kohlenimporteure.de/download/ VDKi_ANNUAL%20REPORT%202011_WEB%20Final.pdf?navid=15.
© O
ECD
/IEA
, 201
1

26 MEDIUM‐TERM COAL MARKET REPORT 2011
MEDIUM-TERM PROJECTIONS OF DEMAND AND SUPPLY Summary
• Main use of coal is electricity generation, which is closely linked to economic growth. Any variation in economic growth will impact coal consumption. Aside from governmental policies, which affect coal demand and the implementation of different generation technologies, economic growth is a driver of coal demand. Therefore, the great uncertainty on the economic growth outlook makes coal demand outlook difficult to assess.
• Global coal demand is projected to continue to grow, reaching 6 184 Mtce in
2016 from 5 225 Mtce in 2010 (+18%). The pace of coal demand growth however is projected to decelerate to an annual growth of 2.8% between 2010 and 2016 compared to 5.3% p.a. in the period 2005 to 2010.
• Among OECD countries, coal consumption growth is sluggish at 0.2% per year.
While coal consumption is projected to decline in the United States by ‐0.3% per year. this decrease will be offset by positive growth rates in Europe (+0.5%) and OECD Asia Pacific (+0.7%).
• Coal consumption among non‐OECD countries is projected to increase from 3 664 Mtce in 2010 to 4 608 Mtce in 2016 (+26%) at 3.9% per year. Chinese coal consumption is projected to grow by more than 600 Mtce (+3.7% p.a.) over the outlook period and thus shows the highest absolute growth. Yet, in relative terms, consumption growth is higher in India and other Asian economies.
Total coal production among OECD countries increases only slightly over the outlook period from 1 428 Mtce in 2010 to 1 489 Mtce in 2016 (+0.7% p.a.). The majority of growth comes from OECD countries in Asia Pacific and is driven by increasing Australian exports. Coal supply among non‐OECD countries increases from 3 831 Mtce in 2010 to 4 695 Mtce in 2016 (+3.4% p.a.).1
Introduction
Understanding future coal demand patterns is crucial for a number of reasons. First, the dramatic demand increase in China in recent years has transformed the market. China went from being a major coal exporter to a large coal importer in 2009. In 2010, China has consolidated as the second largest coal importer. This has caused fundamentally higher trade market prices for coal. Projections of future Chinese coal demand are key to understanding possible future coal trade patterns. The same holds true for coal demand in other Asian countries, such as India or Indonesia. Second, the shale gas revolution in the United States, which has resulted in a so‐called gas glut and has greatly increased cost‐competitiveness of gas compared with coal in certain regions, will have a profound impact on North American coal demand. Third, stricter environmental requirements, greenhouse gas
1 All figures in this paragraph refer to the LPS.
© O
ECD
/IEA
, 201
1

MEDIUM‐TERM COAL MARKET REPORT 2011 27
(GHG) emission reduction efforts, as well as the rise of renewable energy feed‐in have significantly dampened the prospects of coal among OECD countries in North America and Europe. In these countries, coal is competing against gas in the power sector. As power plant fleets, especially since the financial crisis, still have plenty of spare capacity, there exists significant fuel switch potential between gas and coal. Depending on fuel and emission price levels, either coal or gas is the favoured fuel for power generation at the margin.
Assumptions and methodology
Coal demand can basically be broken down into demand in the power sector and demand in the non‐power sector. Coal demand in the power sector consists of the coal burn in coal‐fired power stations and is a function of overall electricity demand, non‐fossil fuel generation, and the interaction of alternative fuel (and emission) prices. Coal demand in the non‐power sector comprises industrial uses such as metallurgical coal used in steel production, as well as coal used in other industries, such as the cement industry, paper production or chemical industries. Further, this category contains coal consumption in Combined Heat and Power (CHP) plants, pure heating plants, as well as residential heating. Non‐power coal demand depends mainly on economic activity, industrial production and, to certain extent, on fuel price levels. However, substitution and demand response with regard to prices is quite limited in these sectors. Coal demand projections were derived using several regression models with regional coal demand as a dependent variable and economic growth, population growth, emission prices, as well as fuel prices as independent variables. The regression parameters were determined using a panel dataset on regional coal consumption and the independent variables. Assumptions on economic activity are based on the International Monetary Fund’s (IMF) outlook from May 2011, which projects a firm global economic growth rate of 4.3% to 4.6% between 2011 and 2016. According to the IMF projection, economic growth among OECD countries in Europe will remain sluggish in 2011 (2.0%) and will only slightly increase over the next years to 2.2% in 2016. OECD countries in the Pacific region are forecast to grow at a similar speed as OECD countries in Europe. OECD countries in the Americas, meanwhile, are forecast to grow by 3% in 2011 but growth declines to 2.7% in 2016. The major driver of global economic growth in the IMF projection will be developing Asia, with growth rates ranging from 8.1% in 2011 to 8.3% in 2016. Projections on growth rates are especially prone to future changes and revisions which may result in different evolution of global demand and regional demand patterns as described in this outlook. For this outlook, assumptions on future fuel prices represent projections and explicitly are not meant to be most‐likely forecasts or predictions. Average crude oil import prices are projected to decrease from USD 106.7/bbl in 2011 to USD 89.5/bbl in 2016, in accordance with Brent futures curves. European coal import prices are projected to rise from USD 127/t in 2011 to USD 138/t in 2016. US coal prices delivered to power plants differ significantly by region: Western US coal prices are assumed to remain low and fairly stable from 2011 to 2016. Eastern US coal prices are assumed to remain substantially higher than Western coal prices due to higher mining costs and some interdependencies to international markets. Asian coal import prices are assumed to increase from USD 131/t in 2011 to USD 142/t in 2016. Gas prices in general remain fairly stable over the outlook period. Henry Hub prices are projected to increase from USD 4.4/MBtu in 2011 to USD 5.4/MBtu in 2016. Continental European gas prices reflect the inclusion of a spot element in some contract
© O
ECD
/IEA
, 201
1
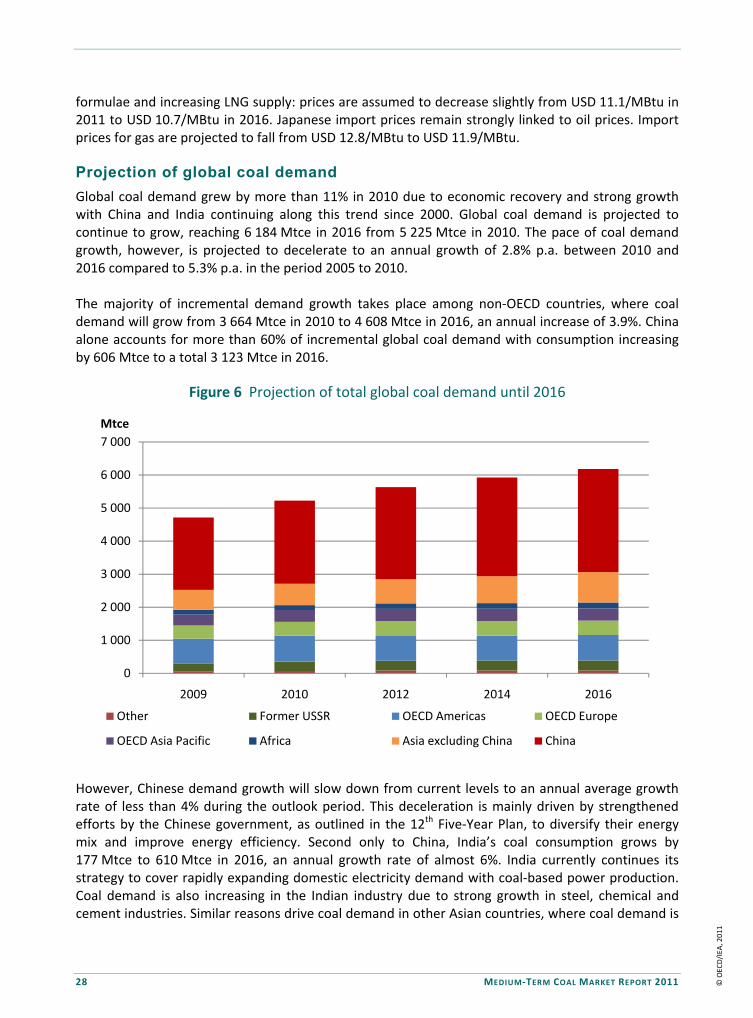
28 MEDIUM‐TERM COAL MARKET REPORT 2011
formulae and increasing LNG supply: prices are assumed to decrease slightly from USD 11.1/MBtu in 2011 to USD 10.7/MBtu in 2016. Japanese import prices remain strongly linked to oil prices. Import prices for gas are projected to fall from USD 12.8/MBtu to USD 11.9/MBtu. Projection of global coal demand
Global coal demand grew by more than 11% in 2010 due to economic recovery and strong growth with China and India continuing along this trend since 2000. Global coal demand is projected to continue to grow, reaching 6 184 Mtce in 2016 from 5 225 Mtce in 2010. The pace of coal demand growth, however, is projected to decelerate to an annual growth of 2.8% p.a. between 2010 and 2016 compared to 5.3% p.a. in the period 2005 to 2010. The majority of incremental demand growth takes place among non‐OECD countries, where coal demand will grow from 3 664 Mtce in 2010 to 4 608 Mtce in 2016, an annual increase of 3.9%. China alone accounts for more than 60% of incremental global coal demand with consumption increasing by 606 Mtce to a total 3 123 Mtce in 2016.
Figure 6 Projection of total global coal demand until 2016
However, Chinese demand growth will slow down from current levels to an annual average growth rate of less than 4% during the outlook period. This deceleration is mainly driven by strengthened efforts by the Chinese government, as outlined in the 12th Five‐Year Plan, to diversify their energy mix and improve energy efficiency. Second only to China, India’s coal consumption grows by 177 Mtce to 610 Mtce in 2016, an annual growth rate of almost 6%. India currently continues its strategy to cover rapidly expanding domestic electricity demand with coal‐based power production. Coal demand is also increasing in the Indian industry due to strong growth in steel, chemical and cement industries. Similar reasons drive coal demand in other Asian countries, where coal demand is
0
1 000
2 000
3 000
4 000
5 000
6 000
7 000
2009 2010 2012 2014 2016
Mtce
Other Former USSR OECD Americas OECD Europe
OECD Asia Pacific Africa Asia excluding China China
© O
ECD
/IEA
, 201
1

MEDIUM‐TERM COAL MARKET REPORT 2011 29
projected to grow by more than 6% per year. Indonesia’s demand is growing especially fast, as the government is currently pursuing a fast‐track programme to install an additional 10 GW of coal‐fired capacity to meet soaring electricity demand. Demand among OECD countries remains almost stable as demand grows from 1 562 Mtce in 2010 to 1 576 Mtce in 2016. While coal consumption recovered slightly between 2009 and 2010, it will not reach pre‐crisis consumption levels (1 670 Mtce in 2007) within the outlook period. Fiercer inter‐fuel competition, increasing share of renewables, as well as moderate economic growth rates lead to lower coal consumption in North America until 2016. European coal demand is increasing slightly, linked to moderate economic growth. Coal consumption is slightly growing among OECD countries in the Pacific, where South Korea is increasing its coal‐fired power generation.
Table 3 Projection of coal demand until 2016
Mtce 2009 2010* 2012 2014 2016 CAGR
OECD 1 473 1 562 1 570 1 565 1 576 0.2%
Americas 745 787 751 752 775 -0.3%
Europe 400 419 449 441 432 0.5%
Pacific 328 355 371 372 370 0.7%
Non-OECD 3 241 3 664 4 063 4 362 4 608 3.9%
China 2 187 2 517 2 787 2 988 3 123 3.7%
India 406 434 491 543 610 5.9%
Africa 151 152 166 170 179 2.8%
Former USSR 237 282 294 302 299 1.0%
Other Asia 152 209 241 273 308 6.7%
* Estimate.
OECD coal demand in power generation
Coal‐fired power generation faces several challenges among OECD countries in the coming years. First, gas‐coal competition is becoming fiercer. This is especially true for North America, where the advent of large‐scale shale gas production leads to an increasing competitiveness of gas prices relative to coal prices in some regions. Also, the higher carbon intensity of coal compared to gas leads to a comparative disadvantage for coal in regions which have implemented CO2 emission regulation schemes (e.g. Europe). Second, coal as a source of energy is facing growing public opposition. Plans for new coal‐fired power plants are frequently confronted by severe opposition from environmental groups or local communities that fear a further lock‐in into carbon‐intensive coal generation or negative impacts on the health of local communities or the environment.2 Even plants already under construction are not immune from these pressures. In general, this prolongs planning and construction phases, increases costs and creates additional investor uncertainties. Hence, new coal plants become less attractive as an investment option. These challenges are reflected in the projection of coal consumption in the power sector among OECD countries. Coal burn slightly increases between 2009 and 2016 by around 50 Mtce or 0.5% per
2 E.g. RWE’s Eemshaven (Netherlands), Vattenfall’s Hamburg-Moorburg (Germany) or E.ON’s Datteln 4 (Germany) hard coal-fired power plants to name but a few.
© O
ECD
/IEA
, 201
1

30 MEDIUM‐TERM COAL MARKET REPORT 2011
year. However, this increase is mostly related to a rebound in energy consumption after the financial crisis. Coal‐based power consumption does not reach pre‐crisis levels during the outlook period. Demand in North America and Europe remains almost stable between 2010 and 2016 due to higher penetration of renewable energy, gas‐fired generation and sluggish demand growth. OECD countries in the Pacific region have the highest demand growth rate among all OECD countries. In this region, demand is projected to increase by 0.7% per year. In 2013, The European Union Emission Trade System will move from allowances to auctions. Whilst this will reduce investments in coal plants in the long term, the impact will not be significant in our outlook period.
Figure 7 Projection of coal demand in power generation for OECD economies
OECD coal demand in non-power sectors
Industrial coal demand among OECD countries experienced a sharp rebound in 2010. Estimated growth in 2010 was around 43 Mtce, or 15%, compared to the previous year.3 This growth is unevenly distributed between regions: while North American demand has stagnated, European and Pacific demand has continued to soar. Most of this growth can be attributed to the accelerating industrial demand and steel production as industrial activity recovers from the impact of the global economic recession. Recovery of OECD countries’ non‐power demand continues over the outlook period. However, demand increases only by 0.3% per year between 2010 and 2016. North American demand remains practically stable until 2016, reflecting sluggish growth in industrial activity, as well as an increasing market share of natural gas. European demand grows by 1.5% per year to 147 Mtce in 2016. Most of this growth is attributed to Germany, where industrial activity is assumed to remain firm and therefore coal demand growth rates will remain around 3% until 2016. While UK non‐power 3 Figures for 2010 are based on preliminary data and may be subject to change.
0
20
40
60
80
1 000
1 200
1 400
2009 2010 2012 2014 2016
Mtce
OECD Americas OECD Europe OECD Asia Pacific
© O
ECD
/IEA
, 201
1

MEDIUM‐TERM COAL MARKET REPORT 2011 31
consumption remains stable over the outlook period, demand in Poland and the rest of Europe will grow slightly by 1.2% and 1.5%, respectively. In the Pacific region, non‐power coal demand in Australia and New Zealand will grow by around 2% per year as industrial activity recovers. However, the overall picture for the Asia‐Pacific region is somewhat clouded by Japanese industrial demand, which is projected to be affected also in the medium‐term through the impact of the earthquake and tsunami disaster in March 2011. Japanese non‐power demand is projected to decrease by 13 Mtce in 2011, a decline which will, however, be partially offset in 2012.
Figure 8 Projection of coal demand in non‐power sectors for OECD economies
Non-OECD coal demand in power generation
Despite the financial crisis, coal demand in power generation has been growing at a staggering speed among non‐OECD countries in recent years and continued to do so in 2010. Coal burn in power plants increased by 13% year on year, mostly due to consumption in China. Coal is currently the fuel of choice for non‐OECD Asian power generation due to its regional abundance and cost competitiveness. It is projected that this trend continues in the medium term. Non‐OECD Asian coal‐burn in power generation grows from 1 726 Mtce in 2010 to 2 393 Mtce in 2016, an annual increase of almost 6%. However, growth patterns change: in absolute terms, incremental coal‐burn in China is the largest with consumption growing by 473 Mtce to 1 793 Mtce in 2016. This reflects the almost 90 GW of coal‐fired capacity under construction and the additional 230 GW which are planned and may potentially come online by the end of the outlook period.4 Nevertheless, annual growth in Chinese coal‐burn in power generation drops to around 5% between 2010 and 2016, far lower than the 9% annual growth seen between 2005 and 2010. This slower demand growth is driven by lower assumed GDP growth rates, decreasing overall energy intensity and diversification in the electricity generation mix, as outlined in the 12th Five‐Year Plan. The diversification of the power generation mix foresees strong promotion of nuclear energy, gas and renewables. 4 These numbers do not account for the decommissioning of old coal-fired generation capacity.
0
50
100
150
200
250
300
350
400
2009 2010 2012 2014 2016
Mtce
OECD Americas OECD Europe OECD Asia Pacif ic
© O
ECD
/IEA
, 201
1

32 MEDIUM‐TERM COAL MARKET REPORT 2011
India is projected to accelerate its coal‐burn to an annual growth rate of almost 6%, going from 311 Mtce in 2010 to 434 Mtce in 2016. This development reflects India’s national energy strategy which firmly places coal as the cornerstone of domestic power generation, mostly as it is the only abundant fossil energy resource in India. Currently, there are almost 100 GW of new coal‐fired power capacity under construction. Even though several older coal plants in India are planned to be decommissioned by 2016, coal‐burn in power generation is projected to increase by more than 120 Mtce.
Figure 9 Projection of coal demand in power generation for non‐OECD economies
* Estimate.
Box 2 Coal-to-liquids: making an oil rig out of a coal mine
The process
Liquid fuels can be produced from coal by two routes. In indirect coal liquefaction, coal is gasified and the gas converted to liquids in the presence of a catalyst. Direct liquefaction essentially involves part of the coal being dissolved in solvents to produce synthetic liquid fuels.
History
Coal‐to‐Liquids (CtL) has had a chequered history. Oil prices are volatile, ranging in recent years between less than USD 10/bbl to more than USD 140/bbl. At times of high oil prices, attention turns to the possibility of producing oil products from coal. However, because of the large investment required, as soon as oil prices drop interest in CtL declines. For CtL to be financially viable not only does the cost of oil have to be high, but water and low‐cost coal resources must be readily available. CtL may therefore only be suitable in countries such as Australia, China, United States, Russia and South Africa. CtL was deployed in Germany during the Second World War when the country had limited access to oil supplies and in South Africa during the 1970s and 80s when there were international sanctions on oil supplies to the apartheid regime.
0
500
1 000
1 500
2 000
2 500
3 000
2009 2010* 2012 2014 2016
Mtce
Other non‐OECD Rest of Asia India China
© O
ECD
/IEA
, 201
1

MEDIUM‐TERM COAL MARKET REPORT 2011 33
Box 2 Coal-to-liquids: making an oil rig out of a coal mine (continued)
Current status
CtL continues to be produced at Sasol's Secunda plant (South Africa) where output is 160 000 bbl/day of synthetic fuel via the indirect liquefaction route, although gas may replace the use of coal in the future. China has initiated very significant industrial development and demonstration programmes covering coal to oil, gas and chemicals. A major direct coal liquefaction demonstration plant (1 Mtpa) and three
industrial‐scale pilot projects (each 160 000 t/y) have been built (1 t oil is equivalent to 7 bbl.). Other international developments are at a much smaller scale.
Main issues
There are several important constraints to large‐scale development. For example, the United States consumes about 13 Mbbl/d of transport fuels. It is estimated that to replace just 10% of this would require more than USD 70 billion in capital investment. It would also require about 250 Mtpa of additional coal production representing a 25% increase. In China, too, there may be resource constraints. Large‐scale adoption of CtL could increase coal use in China by 300 Mt by 2020, a 10% increase on today's production. CtL could be a viable option in countries, where mining costs are low in remote areas but coal transport distances are large since mine‐mouth coal liquefaction could economise the high‐cost energy transport to the consumption centres.
CtL is a carbon‐intensive process and will involve a substantial increase in greenhouse gas (GHG) emissions compared with possible oil‐based alternatives. This effect is not so strong if we consider a ‘well to wheel’ approach. Moreover, as the CO2 will be in a concentrated form, unlike in oil refineries, it may be suitable for carbon capture and storage (CCS). Each tonne of synthetic oil needs approximately 4 t of coal and up to 10 t of water.
The future
It is unlikely that CtL processes will be used in the long term unless there is substantial government support and the CO2 produced can be effectively captured and stored. The environmental benefits arising from the production of cleaner fuels are significant, but governments are unlikely to require their use. CtL is likely to remain a niche activity over the outlook period.
Source: IEA Clean Coal Centre.
The same demand drivers hold true for the rest of non‐OECD countries across Asia. Coal‐burn is growing due to rapidly increasing electricity demand, even though some countries, such as Malaysia or Thailand, plan to increase their gas‐powered generation. Coal consumption in power generation is projected to increase by 72 Mtce between 2010 and 2016, equating to an average annual increase of 10%. Indonesian coal burn is growing especially fast: due to the fast‐track programme to commission an additional 10 GW of coal‐fired generation capacity, coal‐burn in the power sector is projected to increase by almost 17% per year until 2016. Coal consumption in the power sector among other non‐OECD countries will increase from 150 Mtce in 2010 to 200 Mtce in 2016. Main consumers in this group include South Africa, non‐OECD countries in Europe and the states of the former Soviet Union (FSU).
© O
ECD
/IEA
, 201
1
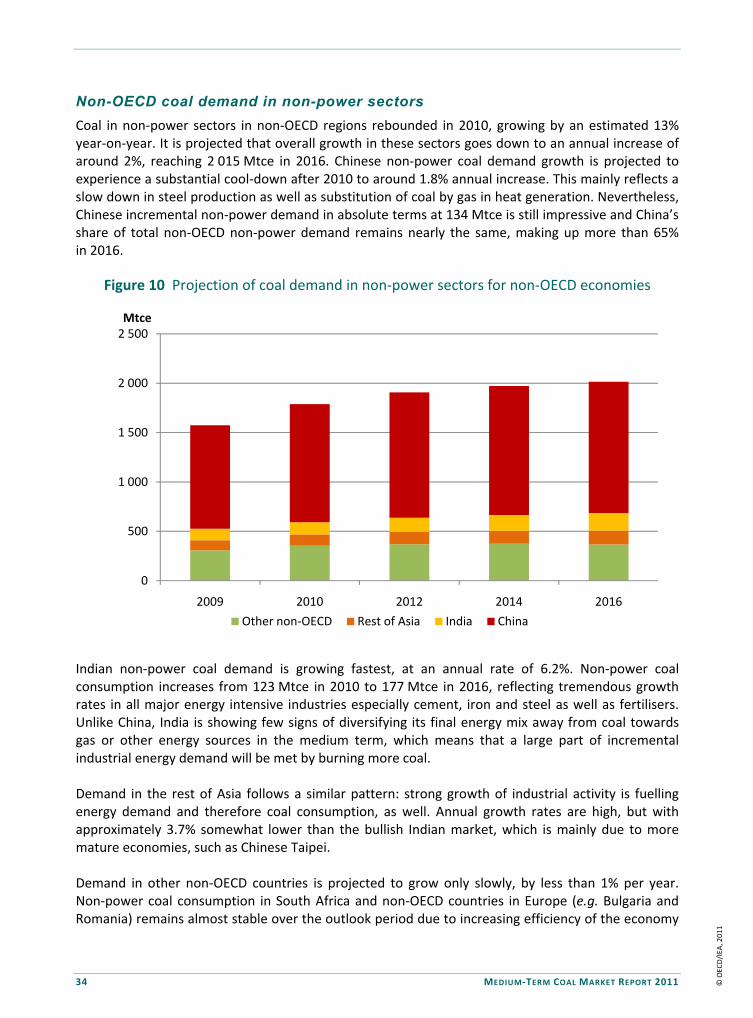
34 MEDIUM‐TERM COAL MARKET REPORT 2011
Non-OECD coal demand in non-power sectors
Coal in non‐power sectors in non‐OECD regions rebounded in 2010, growing by an estimated 13% year‐on‐year. It is projected that overall growth in these sectors goes down to an annual increase of around 2%, reaching 2 015 Mtce in 2016. Chinese non‐power coal demand growth is projected to experience a substantial cool‐down after 2010 to around 1.8% annual increase. This mainly reflects a slow down in steel production as well as substitution of coal by gas in heat generation. Nevertheless, Chinese incremental non‐power demand in absolute terms at 134 Mtce is still impressive and China’s share of total non‐OECD non‐power demand remains nearly the same, making up more than 65% in 2016.
Figure 10 Projection of coal demand in non‐power sectors for non‐OECD economies
Indian non‐power coal demand is growing fastest, at an annual rate of 6.2%. Non‐power coal consumption increases from 123 Mtce in 2010 to 177 Mtce in 2016, reflecting tremendous growth rates in all major energy intensive industries especially cement, iron and steel as well as fertilisers. Unlike China, India is showing few signs of diversifying its final energy mix away from coal towards gas or other energy sources in the medium term, which means that a large part of incremental industrial energy demand will be met by burning more coal. Demand in the rest of Asia follows a similar pattern: strong growth of industrial activity is fuelling energy demand and therefore coal consumption, as well. Annual growth rates are high, but with approximately 3.7% somewhat lower than the bullish Indian market, which is mainly due to more mature economies, such as Chinese Taipei. Demand in other non‐OECD countries is projected to grow only slowly, by less than 1% per year. Non‐power coal consumption in South Africa and non‐OECD countries in Europe (e.g. Bulgaria and Romania) remains almost stable over the outlook period due to increasing efficiency of the economy
0
500
1 000
1 500
2 000
2 500
2009 2010 2012 2014 2016
Mtce
Other non‐OECD Rest of Asia India China
© O
ECD
/IEA
, 201
1
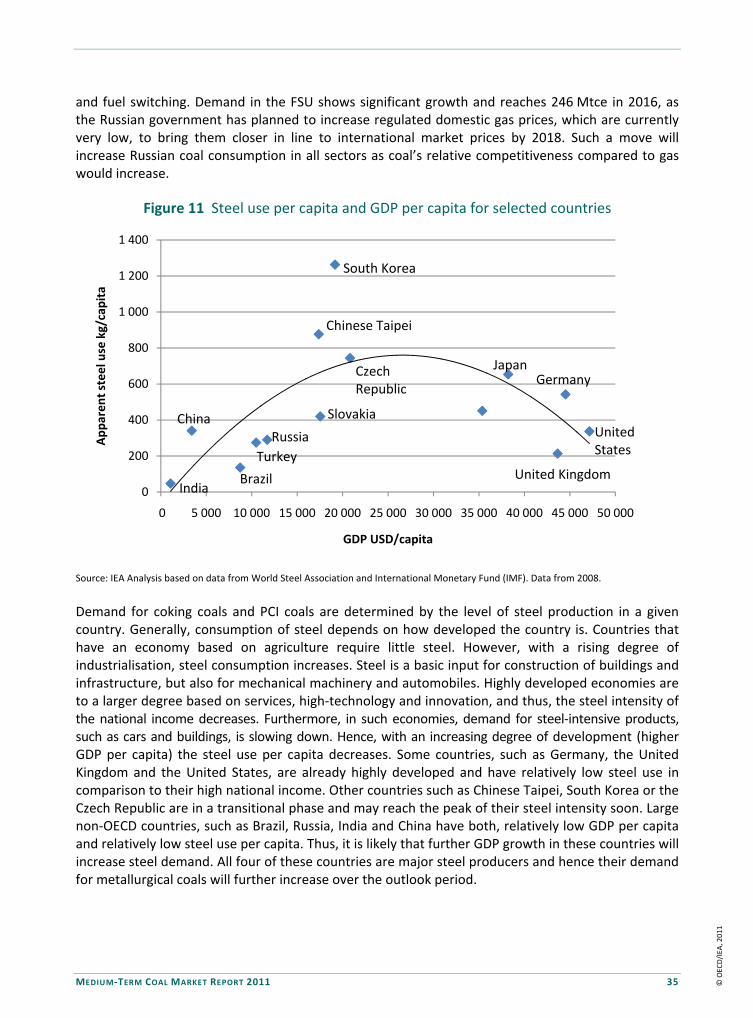
MEDIUM‐TERM COAL MARKET REPORT 2011 35
and fuel switching. Demand in the FSU shows significant growth and reaches 246 Mtce in 2016, as the Russian government has planned to increase regulated domestic gas prices, which are currently very low, to bring them closer in line to international market prices by 2018. Such a move will increase Russian coal consumption in all sectors as coal’s relative competitiveness compared to gas would increase.
Figure 11 Steel use per capita and GDP per capita for selected countries
Source: IEA Analysis based on data from World Steel Association and International Monetary Fund (IMF). Data from 2008.
Demand for coking coals and PCI coals are determined by the level of steel production in a given country. Generally, consumption of steel depends on how developed the country is. Countries that have an economy based on agriculture require little steel. However, with a rising degree of industrialisation, steel consumption increases. Steel is a basic input for construction of buildings and infrastructure, but also for mechanical machinery and automobiles. Highly developed economies are to a larger degree based on services, high‐technology and innovation, and thus, the steel intensity of the national income decreases. Furthermore, in such economies, demand for steel‐intensive products, such as cars and buildings, is slowing down. Hence, with an increasing degree of development (higher GDP per capita) the steel use per capita decreases. Some countries, such as Germany, the United Kingdom and the United States, are already highly developed and have relatively low steel use in comparison to their high national income. Other countries such as Chinese Taipei, South Korea or the Czech Republic are in a transitional phase and may reach the peak of their steel intensity soon. Large non‐OECD countries, such as Brazil, Russia, India and China have both, relatively low GDP per capita and relatively low steel use per capita. Thus, it is likely that further GDP growth in these countries will increase steel demand. All four of these countries are major steel producers and hence their demand for metallurgical coals will further increase over the outlook period.
0
200
400
600
800
1 000
1 200
1 400
0 5 000 10 000 15 000 20 000 25 000 30 000 35 000 40 000 45 000 50 000
Apparent steel use kg/capita
GDP USD/capita
South Korea
Brazil
China
India
Turkey
Russia
JapanGermany
United States
United Kingdom
Chinese Taipei
CzechRepublic
Slovakia
© O
ECD
/IEA
, 201
1

36 MEDIUM‐TERM COAL MARKET REPORT 2011
Regional focus: China
China is the largest coal consumer in the world by far. Today, it accounts for nearly one‐half of global coal consumption. Chinese coal consumption has grown at a tremendous pace over the last ten years, fuelled by surging use in power generation and heavy industry. Between 2005 and 2010 alone, total Chinese coal demand jumped by 50%. In volume terms, that increase was equivalent to more than total US coal demand today. Government policies have a major influence on coal demand in China. The 12th Five‐Year Plan for 2011 to 2015 aims to reduce the overall energy intensity of the Chinese economy by 16% and to increase non‐fossil fuel consumption from approximately 8% to 11% by 2015. These goals are supported through a planned massive ramp‐up of other energy sources. The use of natural gas is planned to increase from 110 bcm in 2010 to 260 bcm in 2015, reaching 8% of primary energy consumption. Renewable energy sources are projected to reach 2.6% by 2015. As a result, the share of coal in primary energy consumption, according to the 12th Five‐Year Plan, will drop from 70% to 63%, or around 2 650 Mtce in 2015. Whilst it is doubtful whether government objectives are too ambitious or not, it is sure that will have some effect on coal demand growth slowdown. The recent surge in demand for coal in power generation is mainly due to soaring electricity demand. China’s electricity generation reached an estimated 4 200 TWh in 2010 – up by 12% in 2009 and 200% in 2000 – and has continued to grow strongly in 2011, with output estimated to reach 4 600 TWh. China will almost certainly become the world’s largest power producer in 2011, and may have already overtaken the United States in 2010 (US electricity output was 4 170 TWh according to preliminary data). Capacity expansion since 2005 has been impressive: the size of the power plant fleet increased from 520 GW in 2005 to around 910 GW in 2010, with coal‐fired plants contributing toward the majortiy of the increase. This expansion was needed to meet booming demand for electricity; demand growth since 1998 has averaged well over 10% per year, accelerating since 2005. Indeed, demand has grown so quickly that power shortages have become a common feature of the Chinese power sector and seem likely to continue into the near future, especially in hotter months when demand peaks and hydro generation is low. Part of the reason for the shortages is that electricity prices remain under tight governmental control to limit inflation. However, coal prices have been largely deregulated and have increased significantly since 2005. This has led to power companies incurring losses, discouraging investment in new plants and provoking shortages. The industrial sector has been the main driver of electricity demand and currently makes up two‐thirds of total electricity use. Industrial electricity demand grew very quickly until 2007, slowed down slightly in 2008 and then resumed its strong growth in 2009; on average, it grew by around 13% per year between 2000 and 2009. Urbanisation and a nationwide programme of electrification have boosted residential power use, which grew by 13% per year over the same period, although annual per‐capita use, standing at 2.7 MWh, remains very low compared to the OECD (8.1 MWh). Demand in all sectors will continue to grow, though policy could temper the pace of growth, particularly in the industrial sector. The bulk of industrial coal use is in the steel‐making, fertiliser, cement and paper industries. Coal demand in Chinese industry – the main non‐power sector – grew at an annual rate of 9% between 2000 and 2009. The recent rapid expansion of coal use in non‐power sectors is set to slow over the outlook period. This slow down results from a combination of factors: progressively slower growth in
© O
ECD
/IEA
, 201
1
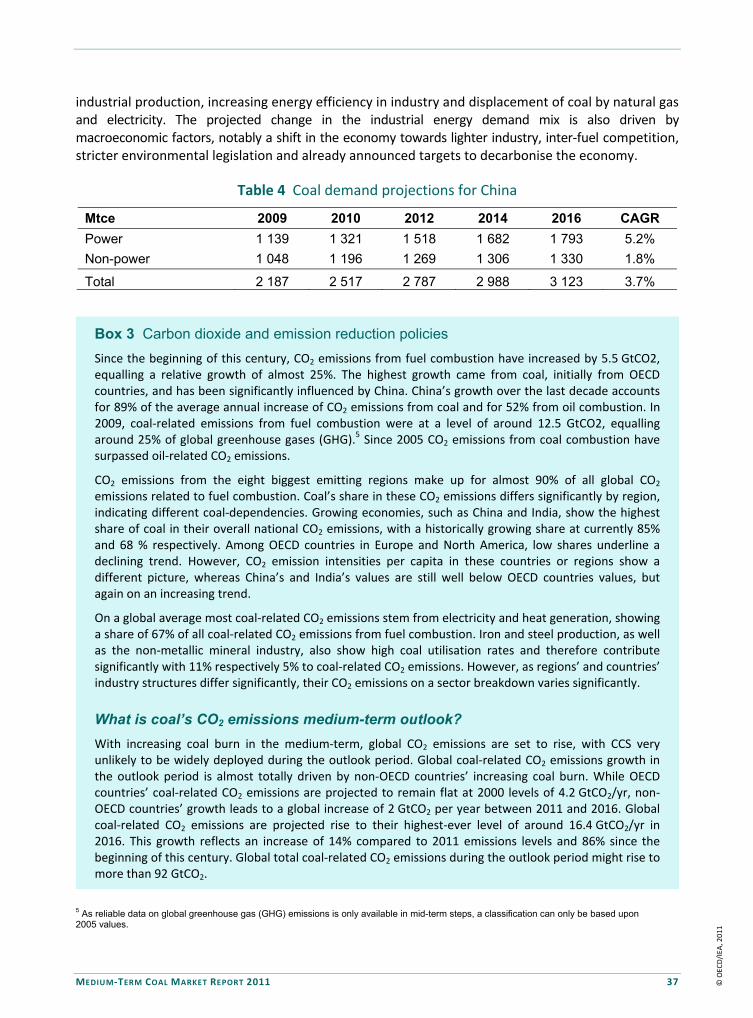
MEDIUM‐TERM COAL MARKET REPORT 2011 37
industrial production, increasing energy efficiency in industry and displacement of coal by natural gas and electricity. The projected change in the industrial energy demand mix is also driven by macroeconomic factors, notably a shift in the economy towards lighter industry, inter‐fuel competition, stricter environmental legislation and already announced targets to decarbonise the economy.
Table 4 Coal demand projections for China
Mtce 2009 2010 2012 2014 2016 CAGR
Power 1 139 1 321 1 518 1 682 1 793 5.2%
Non-power 1 048 1 196 1 269 1 306 1 330 1.8%
Total 2 187 2 517 2 787 2 988 3 123 3.7%
Box 3 Carbon dioxide and emission reduction policies
Since the beginning of this century, CO2 emissions from fuel combustion have increased by 5.5 GtCO2, equalling a relative growth of almost 25%. The highest growth came from coal, initially from OECD countries, and has been significantly influenced by China. China’s growth over the last decade accounts for 89% of the average annual increase of CO2 emissions from coal and for 52% from oil combustion. In 2009, coal‐related emissions from fuel combustion were at a level of around 12.5 GtCO2, equalling around 25% of global greenhouse gases (GHG).5 Since 2005 CO2 emissions from coal combustion have surpassed oil‐related CO2 emissions.
CO2 emissions from the eight biggest emitting regions make up for almost 90% of all global CO2 emissions related to fuel combustion. Coal’s share in these CO2 emissions differs significantly by region, indicating different coal‐dependencies. Growing economies, such as China and India, show the highest share of coal in their overall national CO2 emissions, with a historically growing share at currently 85% and 68 % respectively. Among OECD countries in Europe and North America, low shares underline a declining trend. However, CO2 emission intensities per capita in these countries or regions show a different picture, whereas China’s and India’s values are still well below OECD countries values, but again on an increasing trend.
On a global average most coal‐related CO2 emissions stem from electricity and heat generation, showing a share of 67% of all coal‐related CO2 emissions from fuel combustion. Iron and steel production, as well as the non‐metallic mineral industry, also show high coal utilisation rates and therefore contribute significantly with 11% respectively 5% to coal‐related CO2 emissions. However, as regions’ and countries’ industry structures differ significantly, their CO2 emissions on a sector breakdown varies significantly.
What is coal’s CO2 emissions medium-term outlook?
With increasing coal burn in the medium‐term, global CO2 emissions are set to rise, with CCS very unlikely to be widely deployed during the outlook period. Global coal‐related CO2 emissions growth in the outlook period is almost totally driven by non‐OECD countries’ increasing coal burn. While OECD countries’ coal‐related CO2 emissions are projected to remain flat at 2000 levels of 4.2 GtCO2/yr, non‐OECD countries’ growth leads to a global increase of 2 GtCO2 per year between 2011 and 2016. Global coal‐related CO2 emissions are projected rise to their highest‐ever level of around 16.4 GtCO2/yr in 2016. This growth reflects an increase of 14% compared to 2011 emissions levels and 86% since the beginning of this century. Global total coal‐related CO2 emissions during the outlook period might rise to more than 92 GtCO2.
5 As reliable data on global greenhouse gas (GHG) emissions is only available in mid-term steps, a classification can only be based upon 2005 values.
© O
ECD
/IEA
, 201
1

38 MEDIUM‐TERM COAL MARKET REPORT 2011
Box 3 Carbon dioxide and emission reduction policies (continued)
Figure 12 Regional distribution of CO2 emissions and emission source
Which policies are available to reduce GHG emissions towards a more sustainable pathway?
Future developments of GHG emissions clearly depend on the way and the speed of the international community and national governments’ policies to mitigate GHG emissions. Instruments for GHG emission reduction, especially if targeted at CO2 emissions, are likely to affect fossil fuel production and/or utilisation. Depending on the international level of coordination and the covered industry, the effects to the industry will vary, affecting the demand and/or supply for the underlying fossil fuel source which could be substituted, reduced, increased, or regionally shifted. There are several instruments to reduce greenhouse gas emissions. In most cases the implementation of additional policies and market regulations is required, as under normal market conditions emission reductions come at an added cost for producers or customers. Some of these instruments are environmental tariffs, carbon taxes, emissions trading regimes or emissions performance standards.
Projection of global coal supply
Global coal supply increased between 2009 and 2010 due to the continued recovery from the economic crisis. Global supply is projected to increase from 5 258 Mtce in 2010 to 6 184 Mtce in 2016; this implies an average growth rate of 2.7% per annum.6 However, supply growth differs among regions. Projected coal supply grows sluggishly among OECD countries (0.7% per year), while coal supply grows considerably faster in non‐OECD countries (3.4% per year). Member countries had a share of 27% (energy adjusted) in global coal supply in 2010. Due to the stronger supply growth in non‐OECD countries, this share is down to 24% by the end of the outlook period.
6 For the sake of clarity, all coal supply figures given in this section refer to the “low Chinese production scenario” (LPS) only (see Medium-Term Projections of Seaborne Trade for details). Since total demand is equal in the two scenarios total supply is also equal. However, the regional supply pattern differs between the two scenarios. Data for the “high Chinese production scenario” (HPS) can be found in the section Tables.
© O
ECD
/IEA
, 201
1
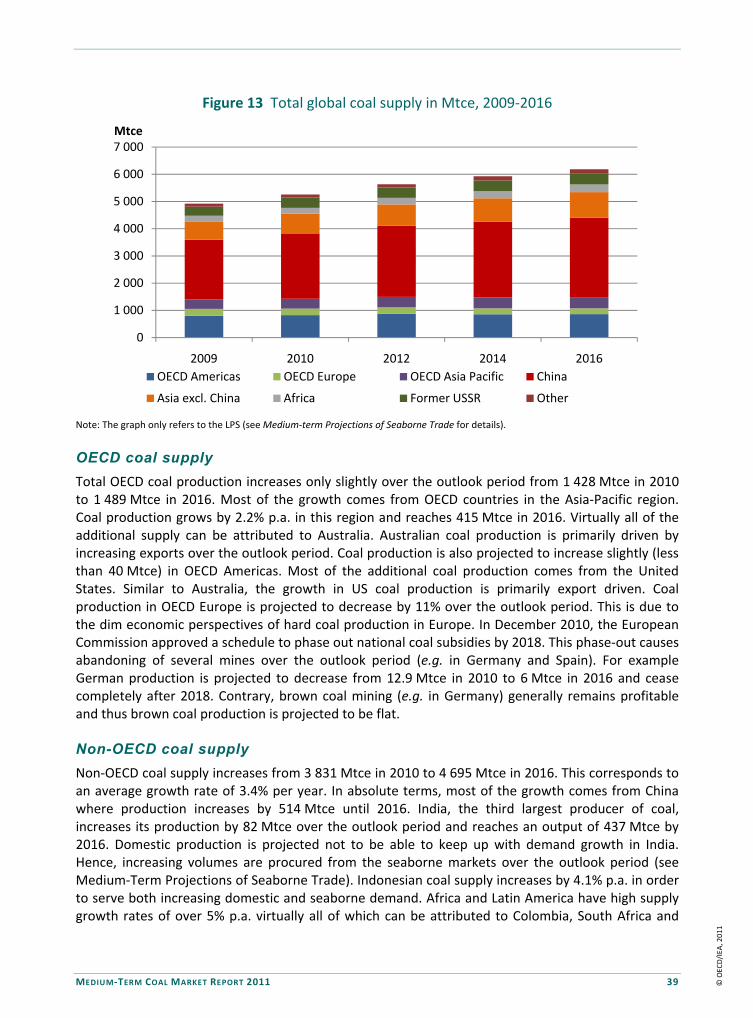
MEDIUM‐TERM COAL MARKET REPORT 2011 39
Figure 13 Total global coal supply in Mtce, 2009‐2016
Note: The graph only refers to the LPS (see Medium‐term Projections of Seaborne Trade for details).
OECD coal supply
Total OECD coal production increases only slightly over the outlook period from 1 428 Mtce in 2010 to 1 489 Mtce in 2016. Most of the growth comes from OECD countries in the Asia‐Pacific region. Coal production grows by 2.2% p.a. in this region and reaches 415 Mtce in 2016. Virtually all of the additional supply can be attributed to Australia. Australian coal production is primarily driven by increasing exports over the outlook period. Coal production is also projected to increase slightly (less than 40 Mtce) in OECD Americas. Most of the additional coal production comes from the United States. Similar to Australia, the growth in US coal production is primarily export driven. Coal production in OECD Europe is projected to decrease by 11% over the outlook period. This is due to the dim economic perspectives of hard coal production in Europe. In December 2010, the European Commission approved a schedule to phase out national coal subsidies by 2018. This phase‐out causes abandoning of several mines over the outlook period (e.g. in Germany and Spain). For example German production is projected to decrease from 12.9 Mtce in 2010 to 6 Mtce in 2016 and cease completely after 2018. Contrary, brown coal mining (e.g. in Germany) generally remains profitable and thus brown coal production is projected to be flat. Non-OECD coal supply
Non‐OECD coal supply increases from 3 831 Mtce in 2010 to 4 695 Mtce in 2016. This corresponds to an average growth rate of 3.4% per year. In absolute terms, most of the growth comes from China where production increases by 514 Mtce until 2016. India, the third largest producer of coal, increases its production by 82 Mtce over the outlook period and reaches an output of 437 Mtce by 2016. Domestic production is projected not to be able to keep up with demand growth in India. Hence, increasing volumes are procured from the seaborne markets over the outlook period (see Medium‐Term Projections of Seaborne Trade). Indonesian coal supply increases by 4.1% p.a. in order to serve both increasing domestic and seaborne demand. Africa and Latin America have high supply growth rates of over 5% p.a. virtually all of which can be attributed to Colombia, South Africa and
0
1 000
2 000
3 000
4 000
5 000
6 000
7 000
2009 2010 2012 2014 2016
Mtce
OECD Americas OECD Europe OECD Asia Pacific China
Asia excl. China Africa Former USSR Other
© O
ECD
/IEA
, 201
1

40 MEDIUM‐TERM COAL MARKET REPORT 2011
Mozambique. In relative terms, the highest growth rate has the “other Asia” region with 7.4% per annum. Much of this growth comes from Mongolia, a relatively new player on the global coal market which is projected to ramp up its production quickly over the medium term. Production in the Soviet FSU is projected to increase moderately by approximately 1.6% per year. This growth is driven by both increasing domestic demand and exports.
Figure 14 Non‐OECD coal supply in Mtce, 2009‐2016
Note: The graph only refers to the LPS (see Medium‐term Projections of Seaborne Trade for details).
Box 4 Underground coal gasification
The process
Underground coal gasification (UCG) involves reacting (partial burning) coal in‐situ, using a mixture of air or oxygen, and possibly steam, to produce a synthetic gas, which is collected at the surface. There is no single UCG technology. One is based on former Soviet technology using vertical wells, and a combination of hydrofracturing and reverse combustion to establish the necessary linkages. Another is a parallel technology which uses vertical wells, but with the linkages established using in‐seam boreholes. A third technology is based on a “controlled retraction injection point” (CRIP), a moveable injection point which controls the underground reaction.
History
Underground coal gasification was first developed in the Soviet Union where UCG techniques were tested and developed at industrial scale over a period of more than 50 years. A major test programme was undertaken by the United States Department of Energy between 1973 and 1989. Australia, the United Kingdom, Spain and, more recently, South Africa and China have also explored the use of UCG.
Current status
Advances in directional drilling, better methods of ignition control and a better appreciation of environmental protection needs have moved this technology to successful pilot‐scale operations in several countries. The largest pilot‐scale plant is at Majuba in South Africa. Operational for four years, 35 kt of coal have been gasified producing 132 million m3 of gas with a heating value of 4.2 MJ/m3.
0
1 000
2 000
3 000
4 000
5 000
2009 2010 2012 2014 2016
Mtce
China India Indonesia AfricaFormer USSR Other Asia Latin America Other
© O
ECD
/IEA
, 201
1
MEDIUM‐TERM COAL MARKET REPORT 2011 41
Box 4 Underground coal gasification (continued)
The average gasification efficiency is 72% and the gas production rate is 11 500 m3/h. Average water consumption is 0.58 l/kg of coal. Linc Energy also runs a plant in Uzbekistan. The Yerostigaz facility produces 1 million m3/d of synthetic gas (syngas) for nearby power station operations. There are pilot‐scale operations in Australia by Carbon Energy at Bloodwood Creek and Linc Energy at Chinchilla. Other UCG projects are in China at the Gonggou mine, Wulanchabu city, Inner Mongolia and in Canada (Alberta) at Swan Hills at a depth of 1 400 metres. Other countries exploring or in the process of building pilot scale plants include Hungary, Pakistan, New Zealand and the United States.
Main issues
Overall the negative impacts of UCG are perceived as low, given that the main product is a syngas, with any by‐products either left in the ground, or removed by conventional processes and potentially re‐injected back into the coal seam. The main issues that need to be resolved are:
• imperfect understanding of the technology amongst regulatory bodies;
• concerns about polluting aquifers and surface subsidence; such concerns have led to suspension of a project by Cougar Energy in Australia which has been suspended;
• further advances in reaction control and product treatment needed; and
• promotions by different industry groups who, historically, regard their experience as proprietary and do not share knowledge.
The future
The next five years will be crucial for UCG. If pilot projects are successful, it is likely that there will be scale‐up to demonstration scale.
Source: IEA Clean Coal Centre.
© O
ECD
/IEA
, 201
1
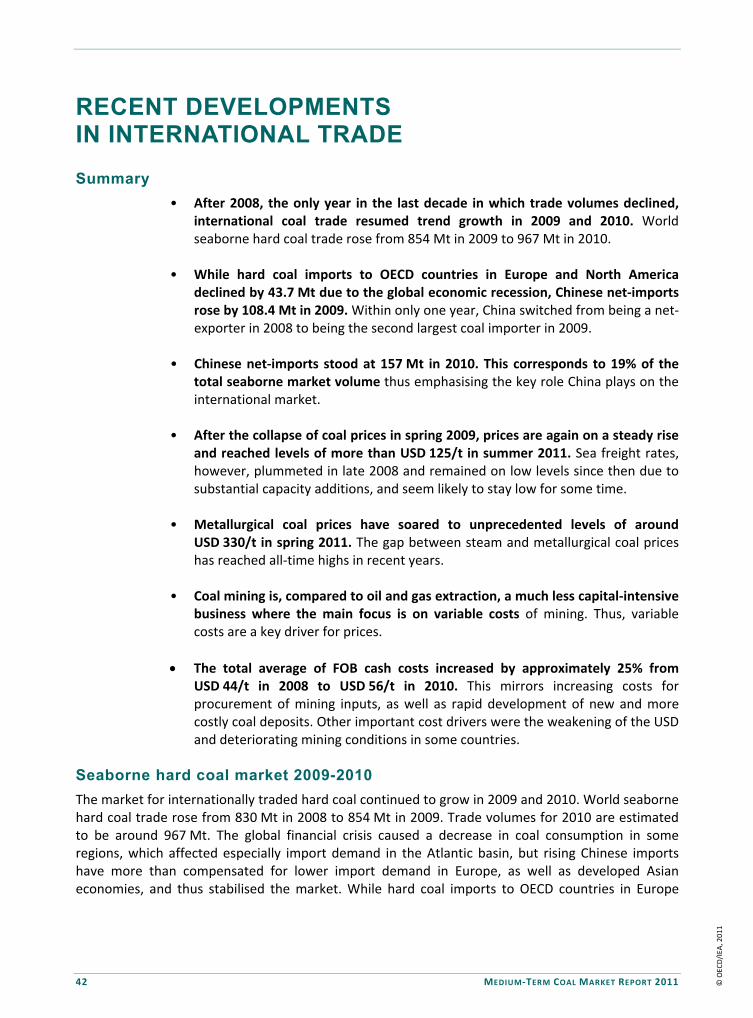
42 MEDIUM‐TERM COAL MARKET REPORT 2011
RECENT DEVELOPMENTS IN INTERNATIONAL TRADE Summary
• After 2008, the only year in the last decade in which trade volumes declined, international coal trade resumed trend growth in 2009 and 2010. World seaborne hard coal trade rose from 854 Mt in 2009 to 967 Mt in 2010.
• While hard coal imports to OECD countries in Europe and North America
declined by 43.7 Mt due to the global economic recession, Chinese net‐imports rose by 108.4 Mt in 2009. Within only one year, China switched from being a net‐exporter in 2008 to being the second largest coal importer in 2009.
• Chinese net‐imports stood at 157 Mt in 2010. This corresponds to 19% of the total seaborne market volume thus emphasising the key role China plays on the international market.
• After the collapse of coal prices in spring 2009, prices are again on a steady rise and reached levels of more than USD 125/t in summer 2011. Sea freight rates, however, plummeted in late 2008 and remained on low levels since then due to substantial capacity additions, and seem likely to stay low for some time.
• Metallurgical coal prices have soared to unprecedented levels of around
USD 330/t in spring 2011. The gap between steam and metallurgical coal prices has reached all‐time highs in recent years.
• Coal mining is, compared to oil and gas extraction, a much less capital‐intensive business where the main focus is on variable costs of mining. Thus, variable costs are a key driver for prices.
The total average of FOB cash costs increased by approximately 25% from USD 44/t in 2008 to USD 56/t in 2010. This mirrors increasing costs for procurement of mining inputs, as well as rapid development of new and more costly coal deposits. Other important cost drivers were the weakening of the USD and deteriorating mining conditions in some countries.
Seaborne hard coal market 2009-2010
The market for internationally traded hard coal continued to grow in 2009 and 2010. World seaborne hard coal trade rose from 830 Mt in 2008 to 854 Mt in 2009. Trade volumes for 2010 are estimated to be around 967 Mt. The global financial crisis caused a decrease in coal consumption in some regions, which affected especially import demand in the Atlantic basin, but rising Chinese imports have more than compensated for lower import demand in Europe, as well as developed Asian economies, and thus stabilised the market. While hard coal imports to OECD countries in Europe
© O
ECD
/IEA
, 201
1
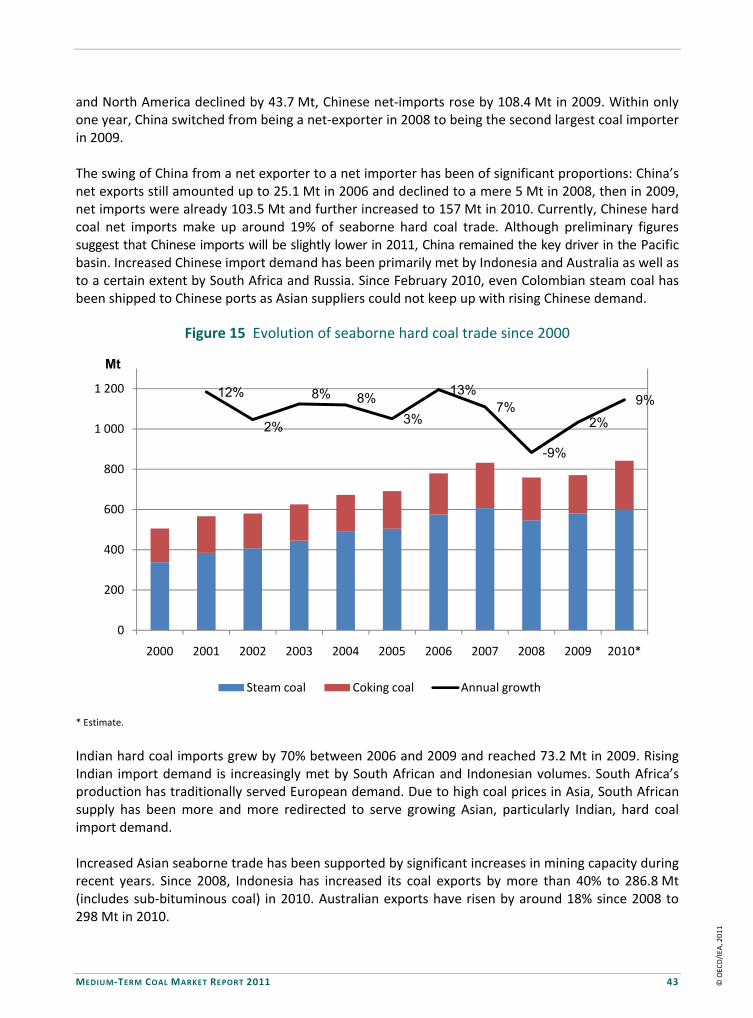
MEDIUM‐TERM COAL MARKET REPORT 2011 43
and North America declined by 43.7 Mt, Chinese net‐imports rose by 108.4 Mt in 2009. Within only one year, China switched from being a net‐exporter in 2008 to being the second largest coal importer in 2009. The swing of China from a net exporter to a net importer has been of significant proportions: China’s net exports still amounted up to 25.1 Mt in 2006 and declined to a mere 5 Mt in 2008, then in 2009, net imports were already 103.5 Mt and further increased to 157 Mt in 2010. Currently, Chinese hard coal net imports make up around 19% of seaborne hard coal trade. Although preliminary figures suggest that Chinese imports will be slightly lower in 2011, China remained the key driver in the Pacific basin. Increased Chinese import demand has been primarily met by Indonesia and Australia as well as to a certain extent by South Africa and Russia. Since February 2010, even Colombian steam coal has been shipped to Chinese ports as Asian suppliers could not keep up with rising Chinese demand.
Figure 15 Evolution of seaborne hard coal trade since 2000
* Estimate.
Indian hard coal imports grew by 70% between 2006 and 2009 and reached 73.2 Mt in 2009. Rising Indian import demand is increasingly met by South African and Indonesian volumes. South Africa’s production has traditionally served European demand. Due to high coal prices in Asia, South African supply has been more and more redirected to serve growing Asian, particularly Indian, hard coal import demand. Increased Asian seaborne trade has been supported by significant increases in mining capacity during recent years. Since 2008, Indonesia has increased its coal exports by more than 40% to 286.8 Mt (includes sub‐bituminous coal) in 2010. Australian exports have risen by around 18% since 2008 to 298 Mt in 2010.
12%
2%
8% 8%
3%
13%7%
-9%
2%
9%
0
200
400
600
800
1 000
1 200
2000 2001 2002 2003 2004 2005 2006 2007 2008 2009 2010*
Mt
Steam coal Coking coal Annual growth
© O
ECD
/IEA
, 201
1
44 MEDIUM‐TERM COAL MARKET REPORT 2011
Price developments
Coal is not a homogenous product and as a result, several different coal markets co‐exist. These coal markets can be segmented by costs, quality, use (steam or metallurgical), time (spot, forward or long‐term contracts), geographic location or access to export infrastructure. Besides the seaborne markets for thermal and metallurgical coal, several regional markets in various countries exist. The degree of interaction between the different markets varies. Consequently several different prices for coal exist.
Box 5 Has coal trade become a casino visit?
In recent years, coal prices have fluctuated considerably. For example, in 2008, European imported steam coal peaked at USD 210/t in July, up from levels of USD 80/t less than one year before. A few months later, the coal price plummeted to USD 62/t. From late 2008 to present, prices have been on a steady rise and currently stand at more than USD 120/t. In addition, short‐term volatility seems to have increased.
While the coal market may be deemed as mature, it is not comparable to the maturity of the oil market. The reasons for this may be essentially that the oil market is much older and larger, as most oil is internationally traded, whereas most coal is not. The quality of coal, logistical infrastructure for its handling and transport and weather‐related events, play a more important role in coal supply than they do for oil. Nevertheless, the integration of coal markets has advanced and the trading of financial products related to coal (mostly based on API 2)7 has dramatically developed in the past several years. Hence, as in the case of oil, it is worth considering whether and to what extent financial markets drive coal price volatility.
While the degree to which financial markets influence short‐term price volatility is not completely clear, the price in the medium term is essentially determined by market fundamentals. Moreover, volatility is driven by inelasticity of supply and demand: the more elasticity of supply and demand, the more any variation is translated to quantity fluctuations rather than to price fluctuations. Macroeconomic factors driving the economy and energy demand drive price dynamics. The period which demonstrated the highest price volatility, during the financial crisis of 2008, reinforces this analysis.
Moving specifically to coal, strong demand increases have tightened the market in recent years. In this situation, any demand/supply shock may trigger price volatility. Since coal export capacities are very much concentrated in a few key countries (Australia, Indonesia, Russia, South Africa and Colombia), any short‐term infrastructure bottleneck or weather‐related outage in these markets is very likely to spike volatility. The 2010/2011 flooding in Queensland is a good example.
In conclusion, as volatility is difficult to eradicate, market participants need to learn how to manage it by hedging and using other risk management techniques. Irrespective of that, any measure improving demand or supply elasticity will help to reduce volatility. Spare mining and infrastructure capacity in the exporting countries would be pivotal to soften the volatility. As electricity generation is a key component of coal demand, the lack of short term demand elasticity in the power system contributes to coal price volatility. So, power demand response to prices should help in this regard as well. In the same way, interfuel competition between coal and gas in the power market should increase coal demand elasticity and, thus, reduce fuel price volatility.
A good example for the interaction between regional and international markets is the US steam coal market: the prices of internationally traded coal have oscillated considerably in recent years surging
7 API 2 is the benchmark price reference for coal trading in Europe. It represents CIF (including cost, insurance and freight) price for coals arriving at Amsterdam-Rotterdam-Antwerpen averaged at 6000 kcal/kg NAR.
© O
ECD
/IEA
, 201
1

MEDIUM‐TERM COAL MARKET REPORT 2011 45
to record heights in 2008, plummeting with the economic crisis in 2009 and again rising since then. Coal prices in the Appalachian region of the United States fluctuate strongly with international prices since the Appalachian suppliers are exposed to competition with potential exporters from abroad. Spot prices for steam coal e.g. in Central Appalachia increased to USD 154/t in the summer of 2008 and collapsed to USD 48/t in spring 2009. In summer 2011, spot prices in this region were just below USD 90/t and obviously followed the price trend on the seaborne market closely over the past years. The Illinois basin has some interactions with the seaborne market and price fluctuations on the international market also impact domestic prices in this region, yet to a lower degree than in the Appalachians. Coal supply from the Powder River basin has hardly any interaction with the seaborne market, due to low coal quality and long transport distances. Therefore, prices remained relatively flat between USD 10/t and USD 16/t (unadjusted for energy content) over the past years not following the international price pattern. There is also a certain degree of interaction between the seaborne steam and metallurgical coal markets. This interaction stems from the fact that certain coal qualities can be used in power plants as well as in steel‐making. Theoretically, all metallurgical coals could be used as steam coals, but, in practice, hard coking coal routinely sells at a premium in comparison to steam coals and therefore rarely ends up in boilers. The situation is different with lower rank coking coals, such as soft and semi soft coking coal as well as PCI coals. Depending on demand from steel mills, these coals do not necessarily receive a price premium over steam coals with similar energy content. In times of strong demand from steel mills, a high proportion of these coals are sold as metallurgical coals thus tightening steam coal supply and putting pressure on steam coal prices.
Figure 16 Long‐term historical development of steam and coking coal prices
Note: Index derived from imported prices in OECD countries (in nominal USD).
For more than two decades the difference between coking and steam coal prices was relatively stable. Until 2004, coking coal has received a price premium of about 30% over thermal coal. However, since 2005, coal price volatility increased and the gap between thermal and coking coal prices widened. Over the last years, differences between steam coal and metallurgical coal prices have been at historical maximum levels.
0
50
100
150
200
250
1Q19
80
1Q19
82
1Q19
84
1Q19
86
1Q19
88
1Q19
90
1Q19
92
1Q19
94
1Q19
96
1Q19
98
1Q20
00
1Q20
02
1Q20
04
1Q20
06
1Q20
08
1Q20
10
Steam coal price index Coking coal price index Differential
USD/t
© O
ECD
/IEA
, 201
1
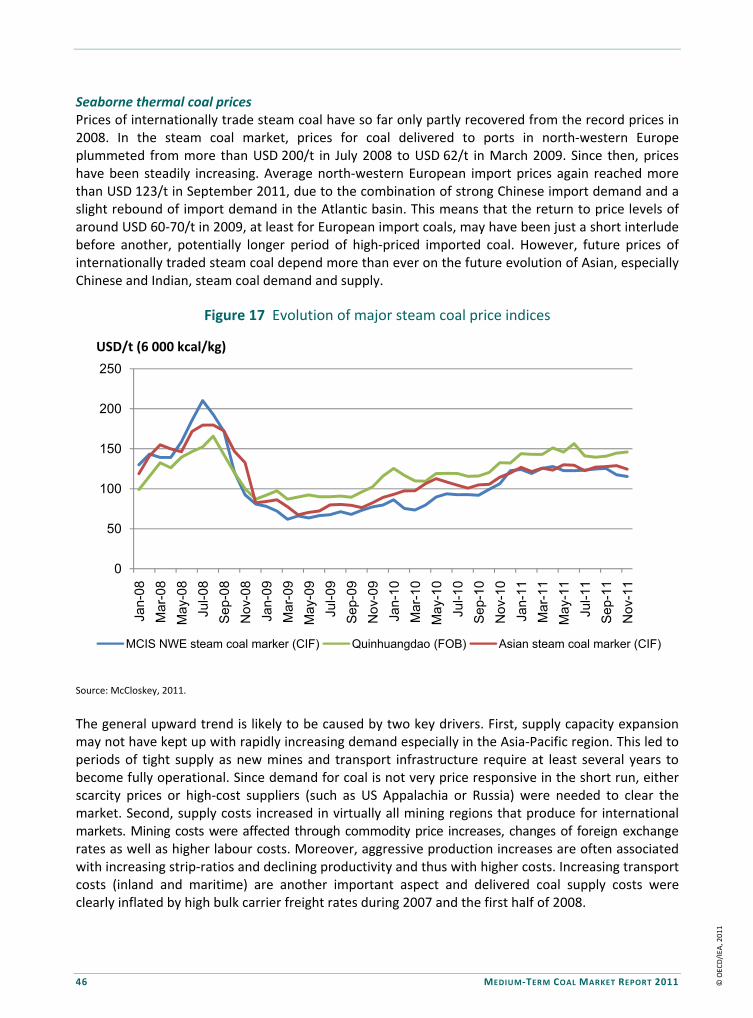
46 MEDIUM‐TERM COAL MARKET REPORT 2011
Seaborne thermal coal prices Prices of internationally trade steam coal have so far only partly recovered from the record prices in 2008. In the steam coal market, prices for coal delivered to ports in north‐western Europe plummeted from more than USD 200/t in July 2008 to USD 62/t in March 2009. Since then, prices have been steadily increasing. Average north‐western European import prices again reached more than USD 123/t in September 2011, due to the combination of strong Chinese import demand and a slight rebound of import demand in the Atlantic basin. This means that the return to price levels of around USD 60‐70/t in 2009, at least for European import coals, may have been just a short interlude before another, potentially longer period of high‐priced imported coal. However, future prices of internationally traded steam coal depend more than ever on the future evolution of Asian, especially Chinese and Indian, steam coal demand and supply.
Figure 17 Evolution of major steam coal price indices
Source: McCloskey, 2011.
The general upward trend is likely to be caused by two key drivers. First, supply capacity expansion may not have kept up with rapidly increasing demand especially in the Asia‐Pacific region. This led to periods of tight supply as new mines and transport infrastructure require at least several years to become fully operational. Since demand for coal is not very price responsive in the short run, either scarcity prices or high‐cost suppliers (such as US Appalachia or Russia) were needed to clear the market. Second, supply costs increased in virtually all mining regions that produce for international markets. Mining costs were affected through commodity price increases, changes of foreign exchange rates as well as higher labour costs. Moreover, aggressive production increases are often associated with increasing strip‐ratios and declining productivity and thus with higher costs. Increasing transport costs (inland and maritime) are another important aspect and delivered coal supply costs were clearly inflated by high bulk carrier freight rates during 2007 and the first half of 2008.
0
50
100
150
200
250
Jan-
08
Mar
-08
May
-08
Jul-0
8
Sep
-08
Nov
-08
Jan-
09
Mar
-09
May
-09
Jul-0
9
Sep
-09
Nov
-09
Jan-
10
Mar
-10
May
-10
Jul-1
0
Sep
-10
Nov
-10
Jan-
11
Mar
-11
May
-11
Jul-1
1
Sep
-11
Nov
-11
MCIS NWE steam coal marker (CIF) Quinhuangdao (FOB) Asian steam coal marker (CIF)
USD/t (6 000 kcal/kg)
© O
ECD
/IEA
, 201
1

MEDIUM‐TERM COAL MARKET REPORT 2011 47
In addition to these structural factors, coal supply chains are occasionally affected by weather‐related interruptions or social tensions in the past years. Heavy rainfall and subsequent floods have severely impacted coal supply from Queensland (Australia) in 2008 and 2010/2011. In other countries, such as Colombia or Indonesia, roads were washed away by rainfalls which hampered truck haulage. Strikes, on the other hand, regularly affect coal mining, e.g. in South Africa, Colombia or Venezuela. These issues have caused temporary supply chain bottlenecks and increased upwards pressure on prices in the context of the already tight supply situation. The tight seaborne market may have enhanced the bargaining power of coal suppliers to bid up prices, adjusting for coal quality, shipment volumes, and supplier creditworthiness. Moreover, the tight market situation, especially in the first half of 2008, may have made several individual suppliers “pivotal” to meet demand, in a sense, that without their supply, market prices would have exceeded marginal costs.
Figure 18 Evolution of monthly Chinese hard coal imports
Source: McCloskey, 2011.
Traditionally, steam coal at Chinese export terminals was traded at discount to European and Asian import prices. However, since the end of 2008, this situation has changed: due to the rapid growth of Chinese import demand, Chinese steam coal prices settled at a premium to European and Asian markers. As steam coal demand in most importing economies was decreasing and international prices fell, foreign imports became cost‐competitive in Chinese coastal demand regions. Key suppliers to China are Indonesia (which has absorbed most of the growth) and Australia for steam coal, Vietnam for anthracite, as well as Mongolia and Australia for metallurgical coals. The growing Chinese import need has redirected international trade flows to China and stabilised trade volumes as well as prices worldwide since suppliers tried to supply the tight Chinese market.
0
1
2
3
4
5
6
7
8
Jan‐09
Mar‐09
May‐09
Jul‐09
Sep‐09
Nov‐09
Jan‐10
Mar‐10
May‐10
Jul‐10
Sep‐10
Nov‐10
Jan‐11
Mar‐11
May‐11
Jul‐11
Australia Vietnam Mongolia Indonesia Other
Mt
© O
ECD
/IEA
, 201
1

48 MEDIUM‐TERM COAL MARKET REPORT 2011
China sources its imports on the spot market and thus, depending on delivered CIF (cost, insurance and freight) prices, the import structure by countries is very volatile. Yet, the marginal supplier to Chinese import regions during the last two years was usually China itself: coastal shipping from the export terminal of Qinhuangdao to the Southern Chinese demand hubs probably has set prices, which would explain the significant price premium of Chinese exports. This hypothesis is also supported by the fact that even the Asian marker, which reflects import prices for Korea, Chinese Taipei and Japan, shows a discount to Chinese export prices. Also, Chinese exports have declined from 45.3 Mt in 2008 to 18.9 Mt in 2010. These high levels of Chinese export prices indicate that domestic Chinese costs of coal supply have increased significantly in the last years, and that Chinese export prices reflect capacity scarcity rents either from bottlenecked transportation or mining infrastructure.
Figure 19 South African steam coal exports to major north‐western European countries and cost advantage of South African steam coal to north‐western European ports
(FOB price in Richards Bay + Freight RB to Rotterdam – CIF price in NWE)
Source: IEA Analysis based on data from McCloskey, 2011.
Higher prices paid by Asian‐Pacific buyers increasingly attracted South African exporters to enter this market and thus lifted South African FOB prices since 2008. This has decreased price‐competitiveness of South African exports, traditionally a major supplier to Europe, via ports in Europe’s north‐west. In 2009 and 2010, South African Free on Board (FOB) prices plus sea freight rates were always higher than north‐western European steam coal import prices (CIF). As a result, steam coal imports from South Africa have declined significantly and South African volumes have been redirected to India and Asia‐Pacific markets. Reasons why there have still been exports to Europe even though South African coals plus transport fees traded at a premium in north‐western Europe could be long term bilateral contracts and coal qualities. Blending of different coal qualities or even petcoke has opened opportunities for arbitrage in the coal market in recent years. Furthermore, despite some flexibility in
0
500
1 000
1 500
2 000
2 500
3 000
‐50
‐40
‐30
‐20
‐10
0
Jan‐08
Mar‐08
May‐08
Jul‐08
Sep‐08
Nov‐08
Jan‐09
Mar‐09
May‐09
Jul‐09
Sep‐09
Nov‐09
Jan‐10
Mar‐10
May‐10
Jul‐10
Sep‐10
Nov‐10
Jan‐11
Mar‐11
Imports to major North‐West European
countries in kt
Cost advantage of South African exports to North‐Western Europe in USD/t (6 000 kcal/kg)
South African exports to major NW‐European countries Cost advantage of South African Exports in NW‐Europe
© O
ECD
/IEA
, 201
1

MEDIUM‐TERM COAL MARKET REPORT 2011 49
coal qualities, coal‐fired power plant boilers are generally built to burn coals with specific qualities in terms of ash, volatile matter and calorific value. Such requirements are captured in international trade flows of coal. Nevertheless, monthly coal exports to Europe have more than halved within a two‐year time frame and will continue to do so if the price disadvantage of South African coal persists. Seaborne metallurgical coal prices
Similar to thermal coal prices, prices for coking coal saw an enormous price spike in 2008. While deals over USD 250/t for Queensland FOB hard coking coal could be observed well into the first quarter of 2009, as order books of steel mills were full of formerly signed contracts, prices collapsed afterwards. Spot prices for Queensland coals reached levels of USD 120/t at the beginning of 2010 due to the global economic recession, as well as the demand slump in steel products. Since then, spot prices have almost doubled, reaching levels beyond USD 230/t FOB for Australian coals. Most of this demand originates from a massive increase of domestic Chinese steel production and increased steel production in Japanese steel mills, which export steel to China.
Figure 20 Evolution of coking coal price benchmark contracts and price indices
Source: McCloskey (2011); ABARES (2011a).
In February and March 2010, BHP Billiton and Japanese Steel Mills (JSM) agreed to switch from an annual reference pricing scheme to a quarterly reference pricing scheme for prime hard coking coal. Shortly after this first move, most other key metallurgical buyers agreed also on BHP Billiton’s quarterly reference pricing scheme, namely Indian, Chinese and South American steel mills. This basically ends several decades of annual coking coal reference pricing. Recent advances of BHP Billiton to push for monthly coking coal price agreements have met strong resistance especially from JSM. Other coking coal suppliers have exploited this situation and have been able to capture coking coal contracts formerly supplied by BHP Billiton.
0
50
100
150
200
250
300
350USD/t
Japan-Australia benchmark for prime hard coking Japan-Australia benchmark for semi-soft coking
Prime hard coking FOB marker price (McCloskey)
© O
ECD
/IEA
, 201
1

50 MEDIUM‐TERM COAL MARKET REPORT 2011
Hard coking coal benchmark prices reached an unprecedented price level of USD 330/t (FOB Australia) in spring 2011 with some spot deals settling even around USD 400/t. Prices for coking coals remained high during 2011 due to sluggish recovery from the floods in Queensland, the main supply region for coking coal. Lower rank coking coals and PCI coals also received record prices. Since these coal types could also be used as steam coals, strong demand from the steel industry has contributed to tighten thermal coal supply in the past years. Generally, metallurgical coal prices have decoupled from supply costs in recent years and suppliers have generated considerable profits. Seaborne freight rates
Seaborne dry bulk shipping constitutes an important part of the coal supply chain. Most internationally traded coal has to be shipped from exporting countries to the place of consumption.
Figure 21 Breakdown of coal supply chain components for major coal mining regions (CIF north‐western Europe)
Source: IEA Clean Coal Centre analysis based on data from Marston Associates, McCloskey (2011), IEA Analysis.
0
30
60
90
2007 2009 2007 2009 2007 2009 2007 2009 2007 2009 2007 2009
Indonesia South Africa Open‐cast
South Africa Underground
Colombia New South Wales Open‐
cast
New South Wales
Underground
USD /t
Shipping to north‐western European ports Port and loading
Inland transport Taxes and royalties
Coal processing Mining
© O
ECD
/IEA
, 201
1

MEDIUM‐TERM COAL MARKET REPORT 2011 51
This is handled by dry bulk freight vessels of different sizes. In the bulk freight carrier market, coal competes with other commodities, such as iron ore or copper ore. Supply of bulk carrier capacity is quite inflexible in the short run as construction of new bulk carriers typically takes one to two years. Also, construction of new bulk vessels means significant upfront capital investment. This short‐term inflexibility of bulk carrier capacity supply leads to, at best, cyclical and, at worst, very volatile bulk freight rates: if the market is tight, freight prices are basically equal to the best bid of the traders who want to ship dry bulk commodities; if there is an oversupply of freight capacity, freight prices fall below marginal cost‐levels due to the fact that bulk carrier capacity is relatively homogenous and the market can be considered competitive. Because of high global demand for primary commodities, freight rates until August 2008 were at record levels. Bulk carrier capacity could not keep up with increasing demand. In the second half of 2008, freight rates collapsed to about one‐sixth of previous levels. This sharp decline is mainly attributed to reduced international bulk trade due to the impacts of the economic recession on industrial activity on a global scale. High freight rates during 2007 until mid‐2008 raised delivered costs (CIF) of coal supply substantially. Although FOB supply costs generally increased over the past years, the drop in seaborne freight rates has over‐compensated this development and lowered delivered costs (at least on some routes). Furthermore, large numbers of new vessels ordered in times of high freight rates entered the market which led to an oversupply of bulk carrier capacity in the following years. In 2010, around 1 000 dry bulk vessels were delivered. Another 1 700 are scheduled for 2011, 350 of which are cape‐size carriers.
Figure 22 Outlook for bulk carrier freight capacity
Source: Barry Rogliano Salles (2011); DnB NOR (2010); IEA analysis.
‐60
‐40
‐20
0
20
40
60
80
100
120
2010 2011 2012 2013 2014 2015
Million DWT
Orderbook New tonnage required Excess capacity
© O
ECD
/IEA
, 201
1
52 MEDIUM‐TERM COAL MARKET REPORT 2011
Orderbooks are currently still at very high levels with over 1 000 new Panamax and Capesize bulk freighters to be commissioned until 2015 (Barry Rogliano Salles, 2011). This corresponds to approximately 35% of the current fleet. As cancellation rates are still moderate, bulk freight markets are likely to be characterised by excess capacity and low freight rates for the near‐term future even if cancellation and scrapping rates increase. Cost developments
Coal mining is, compared to oil and gas extraction, a much less capital‐intensive business, where the main focus is on variable costs of mining and thus variable costs are a key driver for prices. However, investment costs for transport infrastructure can make up a significant part of total investments: for example, investments for hard coal mining capacity in Australia are on average USD 90/tpa, (tonnes per annum), with a very large difference between projects, as well as domestic transport, USD 20‐40/tpa each, depending on haulage distances.8 For countries such as Indonesia, these figures may be significantly lower. In Indonesia, mining costs and prices for steam coal averaged approximately between USD 56/t and USD 90/t in 2010. This means that coal suppliers are currently generating healthy margins and should be able to rapidly recuperate their investments. This is even more true for metallurgical coal, where prices and hence margins are currently significantly higher. However, market prices depend on global demand and supply, and have not always been as favourable. Indeed the industry has endured a long period of low profitability following expansions in the 1980s. Mining costs have risen significantly in recent years – on average by around 9% per year since 2005. This increase in mining costs was driven by high international prices for fuel, explosives and other mining inputs as well as foreign exchange rate effects. While global coal reserves are plentiful, the significant increase in the extraction rate of coal reserves, especially in Asia, has made it necessary to tap into undeveloped deposits, which have so far been considered too costly or too remote to exploit. Due to strong demand growth, production increased aggressively, causing productivity to decline and increasing mining machinery attrition costs. Moreover, with rapid depletion of existing deposits, new mines have tended to move farther away from export infrastructure and thus incur higher inland transport costs. Port capacity expansions have not been able to keep up with international demand which led to bottlenecks and bulk carriers queuing at the coal loading terminals, incurring demurrage costs. Therefore, the rapid expansion of coal production in recent years to meet demand has come at the price of significantly higher costs of supply. Future mining costs will, to a significant extent, depend on future oil and steel prices as both commodities are major input factors in mining. Apart from input price escalation and foreign exchange effects, supply costs may generally increase for two technical reasons. First, new deposits with good coal quality and a favourable geology are often located farther away from export infrastructure. Second, either coal quality deteriorates or mining conditions become more difficult in heavily exploited deposits that are closely located to infrastructure. Furthermore, environmental and land use legislation in some major exporting countries may be a factor rising costs. Such uncertainties could potentially reduce incentives for mining companies to invest in new mining capacities, as well transport infrastructure in the future.
8 More detail on investment projects and costs is given in the chapter “Utilisation of export capacity and investments”.
© O
ECD
/IEA
, 201
1

MEDIUM‐TERM COAL MARKET REPORT 2011 53
Figure 23 Indicative supply cash‐cost curves for seaborne traded steam coal (FOB) for 2005, 2008 and 2010
Note: Curves depict cash costs of utilised (intramarginal) capacity.
Source: IEA Analysis, Institute of Energy Economics at the University of Cologne.
Seaborne steam coal trade expanded, more quickly than total coal at an average rate of 6.6% during the last ten years, reaching 722 Mt in 2010. Internationally traded steam coal is supplied by a limited number of countries with cost competitive coal mining capacities and the necessary transport infrastructure to deliver the coal to international customers. Costs of coal supply comprise mining costs, domestic transport fees and port handling fees. This cost figure is generally called free‐on‐board (FOB) cash cost.9 The last operation needed to serve demand is marginal in a competitive market environment and sets the price. To deliver coal to the consumer, further costs in the form of dry bulk carrier freight rates apply. The total average FOB cash costs increased by approximately 25%, from USD 44/t in 2008 to USD 56/t in 2010. This mirrors increasing costs for procurement of mining inputs as well as rapid development of new and more costly coal deposits. As in 2009, Indonesia and Colombia continue to occupy the lower left third of the global supply cost curve with FOB cash costs averaging around USD 40/t. The middle third of the curve is occupied by higher cost Indonesian operations and by South Africa, which supplies coal at around USD 50/t. Due to its dependence on diesel fuel in its open cast truck‐and‐shovel operations, as well as declining geological conditions and qualities, Indonesian mining costs have lost some of their cost competitiveness in recent years. Some collieries have faced mining cost increases of up to USD 15/t. This development has repositioned significant Indonesian export capacities from the left to the middle part of the global supply curve. Mining costs in South African
9 The term “cash-cost” reflects that costs do not cover overhead costs or capital costs.
0
10
20
30
40
50
60
70
80
90
0 50 100 150 200 250 300 350 400 450 500 550 600 650
USD/t adjusted to 6 000 kcal/kg
2010 2008 2005
Mt
© O
ECD
/IEA
, 201
1

54 MEDIUM‐TERM COAL MARKET REPORT 2011
operations have also increased since 2009, due to rising commodity prices and labour costs. Australia and the United States have moved up the cost curve to around USD 60‐80/t. The United States is the Atlantic swing supplier and only enters the market when FOB export prices rise above a certain threshold and coincide with low domestic prices. In the United States, export mining operations are mainly located in the Appalachians, where geological conditions, as well as productivity, have decreased, thus increasing public opposition against mountaintop mining, which has hampered expansion. Further, environmental levies and taxes become a more important cost burden in the United States. Similar to the 2009 cash cost curve, Russia has remained the most expensive supplier of export steam coal on an FOB basis due to the long inland transport distances to the ports at the Baltic, Barents and Black Seas as well as on the Pacific coast.
Figure 24 Indicative supply cash‐cost curves for seaborne traded metallurgical coals for 2005, 2008 and 2010
Note: Curves depict cash costs of utilised (intramarginal) capacity.
Source: IEA Analysis and Institute of Energy Economics at the University of Cologne.
Demand for metallurgical coal was strong in 2010 due to rising steel production. Contract prices between Australian miners and Japanese steel mills for hard coking coal reached levels of USD 200/t and more during 2010, reflecting tightness in the market. Metallurgical coal capacities are currently being expanded in all major coal mining areas, most importantly in Australia, the United States and Canada, the three largest global suppliers. However, also new players are entering the market, for example Mozambique, whose mining capacity is projected to reach almost 30 Mt of various coal qualities (mainly hard coking coal) by 2016. In the metallurgical coal trade, Australia clearly has a dominant position with regard to production capacities and costs. The majority of the Australian metallurgical coal output comes from the state of Queensland. Australia currently holds a market share of nearly two thirds and generally has a cost advantage over its main competitors, the United
0
20
40
60
80
100
120
140
0 25 50 75 100 125 150 175 200 225 250
USD/t
2010 2008 2005
Mt
© O
ECD
/IEA
, 201
1

MEDIUM‐TERM COAL MARKET REPORT 2011 55
States and Canada. Supply costs for metallurgical coal may be higher than for thermal coals, as the price premium these coals receive justify more costly operations. Metallurgical coal operations also experienced rising mining costs during past years, due to similar reasons as in thermal coal. However, the positive price environment is offsetting cost increases and is making most metallurgical coal operations currently very profitable. Consequently, mining companies have shifted focus and financial resources from steam coal to metallurgical coal. In general, countries with mining methods involving less exposure to international oil prices have done better in recent years in terms of mining cost increases, as e.g. China, the United States or Russia. Export mining capacities in all three countries feature a relatively large proportion of underground operations, which consume usually less diesel per tonne of coal mined compared to open cast mining (especially truck and shovel methods) and are therefore not as exposed to increases of oil prices. Future mining cost evolution will be driven to a significant extent by prices for mining input factors, such as oil and steel, as well as by future coal demand: in Australia, for example, the next round of new export mines will be established in so far less or undeveloped coal basins such as Surat and Galilee where rail freight distances may be approximately 200 to 480 km, respectively (ABARES, 2011b). Due to longer domestic haulage distances transport costs will probably increase and thus also FOB cash costs. Also, environmental levies and taxes, may become a more important cost burden in several countries, such as, for example, the United States, Australia and China. The evolution of mining cash costs is to a large part defined by a limited number of input factors, such as diesel, explosives, steel or labour (Meister, 2008; Trüby and Paulus 2010). The relative importance of each input factor varies greatly between individual mines (due to geological conditions), but also between countries. The employed mining method determines the distribution of these input factors to a large extend. Underground mining methods are comparatively more labour intensive than open cast methods, where larger mining equipment can be utilized. Underground mining also depends more on steel and machinery parts (for example for roof support) and electricity. Truck and shovel operations typically have high costs for tyres and diesel due to using conventional trucks and excavators. Draglines are less labour and diesel intensive but have higher cost shares for electricity consumption (Trüby and Paulus, 2010). From 2005, prices for diesel, as well as for explosives, tyres, and steel and machinery parts increased dramatically on the world market. As open cast mines, and especially truck and shovel operations, have the highest exposure to these commodities, mining cash costs have significantly increased for mines employing such methods. This has especially affected cash costs of Indonesian mines, which exclusively rely on truck and shovel mining. Oil is an important factor in the production of explosives (in some cases, natural gas is also used) and chemicals, and is the basis for diesel fuel. Therefore, future oil prices will have a substantial impact on coal mining costs (Paulus and Trüby, 2011). Low prices have put pressure on the mining industry to increase productivity for a long time. Productivity increases were primarily realised through modernisation (use of more efficient and larger mining equipment) as well as selective mining, i.e. extracting coal from of “economically favourable” seams first. With increasing prices, productivity in various regions has declined over the last years. The higher prices allow mining companies to operate under more costly geologic
© O
ECD
/IEA
, 201
1

56 MEDIUM‐TERM COAL MARKET REPORT 2011
conditions, such as sinking deeper shafts, exploitation of slimmer seams and dealing with unfavourable seam faults. This evolution increases costs of mining, for example, as more over‐ and interburden has to be removed, less coal can be recovered from a deposit, or trucks have to move coal over longer distances to mine mouth. With deeper underground collieries improved ventilation and cooling may become necessary.
Table 5 Breakdown of important input factors for coal mining in Australia
Input factors Truck and shovel Dragline Longwall
in % of mine-mouth cash costs
Diesel fuel 17% 10% 1%
Explosives, propellants and blasting accessories 13% 14% 0%
Steel mill products and machinery parts 28% 28% 29%
Chemicals and lubricants 2% 1% 0%
Tyres 2% 3% 0%
Labour 32% 37% 39%
Electricity 0% 2% 3%
Other - Outside services, plant hire and general consumables 5% 6% 27%
Source: Coal Industry Advisory Board. Data for 2010.
Although Australian operations are among the most efficient in the world, productivity has declined significantly by 4% per year. A large proportion of the production comes from operations whose low‐cost reserves have already been exploited. However, Queensland saw new underground mines online, which started new efficient operations and thus boosted productivity by 20% between 2006 and 2009. US mines also experienced declining productivity in recent years. Especially underground mines in the Appalachians, an area which has seen extensive coal mining since the 19th century, had to cope with sharp productivity decreases of 4% per year as operations moved deeper and other mining methods as mountaintop removal face increased public opposition. Regional analysis
Exporters
Australia Australia’s hard coal reserves are the fifth largest in the world (BGR, 2010) and can support a further growth in exports. The country also features significant lignite reserves. However, Australia’s coal exports have been plagued by railway and export terminal bottlenecks in recent years. Even though export infrastructure capacity increased significantly, from 277 Mtpa in 2009 to 365 Mtpa in 2010, exports could not completely keep up with rapidly rising mining capacity. This development led to vessel queues of bulk carriers at the main export terminals. Nevertheless, further investments into export capacity will come online in the medium term (see also section Utilisation of Export Capacity and Investments).
© O
ECD
/IEA
, 201
1

MEDIUM‐TERM COAL MARKET REPORT 2011 57
Indonesia Indonesian coal production stood at 336 Mt in 2010, up from 291 Mt in 2009. Approximately 87% of Indonesian coal production comes from the island of Kalimantan, with the remainder mined on the island of Sumatra. The production on Kalimantan is more targeted towards the international market, whereas the production on Sumatra (located more closely to densely populated areas of the country) serves domestic needs. Production comes almost entirely from open‐cast operations where usually conventional truck and shovel methods are employed. Approximately one‐half of current production in Indonesia is of bituminous quality with the balance being of sub‐bituminous quality. Since the majority of Indonesian reserves are relatively low in calorific content, the development of coal qualities will be an important driver for future exports. Indonesia features a coal infrastructure which puts it, to some extent, aside of other coal exporting nations. A large proportion of mining operations in Kalimantan have easy access to navigable rivers. Coal can be hauled by river barges to offshore terminals or directly to customers in Thailand, Malaysia and other parts of South‐East Asia. This transport system allows Indonesia to circumvent the typical port or railway capacity bottlenecks, which have routinely hampered coal exports in Australia or South Africa. However, inland transport usually involves a certain amount of truck haulage. More than half of inland transport is carried‐out by a combination of trucking and barging, with another 25% by direct trucking. Less than 5% of coals are transported via railway in Indonesia. The remainder is hauled by a combination of trucks and conveyor belts. The low energy content of the Indonesian coals makes transport relatively expensive. Costs in Indonesia have risen dramatically in the last five years, as governmental subsidies for diesel where abolished and oil prices have increased. As most Indonesian coal mines are truck‐and‐shovel operations and the inland transport system involves a certain amount of trucking, this significantly affected FOB costs. Moreover, Indonesia is rapidly exploiting their available proven reserves. Therefore, mining operations are moving farther inland and tap coal deposits with less favourable geological conditions, higher stripping ratios and lower coal qualities. This affects inland transport costs, mine productivity and revenues. Thus, it is expected that production costs in Indonesia will rise further in the future. However, today, Indonesian FOB cash‐costs remain among the lowest in the thermal export market and lie in a range of USD 35‐50/t. With 287.8 Mt in 2010, Indonesia is the world’s largest steam coal exporter. This figure includes bituminous and sub‐bituminous coals. Since 2005, Indonesian coal exports showed a compounded average annual growth rate of approximately 12.5%. So far, virtually all of Indonesia’s coal exports are thermal coals. The Indonesian export structure shows a high degree of diversification with substantial trade flows to all major importing regions. Indonesian steam coal exports are expected to further increase. Although, due to rising domestic demand for coal, future exports will likely not grow with the same speed. According to the Indonesian Coal Mining Association, 20% of hard coal production is planned to be used to cover domestic consumption. The bulk of growth in new production will be in lower rank coal qualities (high moisture, lower energy value coals) and very low to low sulphur contents which are especially suited for Chinese and Indian power plants or as blending coals. By the end of 2009, the Indonesian government enacted a new domestic market obligation scheme for the Indonesian mining sector which requires coal producers to sell a certain
© O
ECD
/IEA
, 201
1
58 MEDIUM‐TERM COAL MARKET REPORT 2011
percentage of their production to domestic consumers. In principle, in 2012, coal mining companies are obliged to sell about 25% of their production to Indonesian buyers. The majority of this will go to Perusahaan Listrik Negara (PLN), the state‐owned electricity utility. Between 2010 and 2015, PLN plans to add over 19 GW of new coal‐fired capacity, with over 70% of this on the island of Java. While a significant part of these plants will be based on lignite, this will still draw on steam coal export potentials. In the beginning of 2009, a new Indonesian mining law was enacted, replacing the “coal contracts of work” mine licensing system, which now gives foreign, as well as Indonesian investors, eight years to carry out exploration, and another 23 years to develop and operate collieries. Contrary to the former regulation, foreign investors are no longer obliged to offer stocks to Indonesian investors. The general objective of this policy is to promote mining development by simplifying licensing, improving the planning of the mining areas and by clarifying responsibilities between central, provincial and district authorities. The government has also established a minimum floor price for coal as a means of increasing state revenues from royalties by stopping transfer pricing (i.e. coal producers selling coal to affiliates at below market prices). Russia In 2010, Russia produced 248 Mt of hard coal, an increase from 207 Mt in 2009. Russian coal production was severely affected by the financial crisis in 2009 and was down by more than 15 Mt compared to 2008 production levels. Moreover, Russia is a significant producer of brown coal, 76 Mt in 2010, for domestic electricity generation. Additionally, Russia imports around 30 Mt of steam coal with specific quality parameters from Kazakhstan. Russia is currently the third largest hard coal exporter in the world. About 10% to 15% of Russian hard coal exports are of metallurgical coal quality with the rest being steam coals. Total Russian hard coal exports amounted to 105.6 Mt in 2009 up from 97.5 Mt in 2008. Exports further increased to 108.8 Mt in 2010. Of these volumes, around 10%‐15% are (VDKI, 2011) overland trade. Russia traditionally serves the European market yet hard coal exports into the Pacific market have expanded significantly, as China’s procurements of Russian hard coal went up to 13.5 Mt in 2009 compared to 1.5 Mt in 2008. In the Atlantic region, Russian imports have also increased and filled the gap left by lower South African volumes. The major hard coal mining region in Russia is the Kuznetsk basin (Kuzbass) in South‐Western Siberia. Other important mining regions with substantial growth potential are located in the Far East of the country (e.g., South Yakutsk basin). The Kuzbass is also the region where the vast majority of exported coals are mined. Roughly two‐thirds of Russian coal production comes from surface mining operations and one third comes from underground collieries (VDKI, 2011). Various mining methods can be found in Russia. Direct mining costs in Russia are among the lowest in world. The Russian coal mining industry is highly concentrated with only two companies – SUEK and Kuzbassrazrezugol – controlling about two thirds of the hard coal production. Russian coal exports are transported by rail to the export terminals in the west and the east. The railway system has so far been the weakest link in the supply chain in the past, due to regular bottlenecks, a lack of rolling stock and the enormous haulage distances (4 000‐4 500 km). Currently,
© O
ECD
/IEA
, 201
1

MEDIUM‐TERM COAL MARKET REPORT 2011 59
the system suffers from a rising number of empty railcar journeys which is believed to be the result of a reform that allowed private railcar operators to enter the market. Unsynchronised schedules of various operators have thus decreased the processing capacity of the railway. Due to the long distances to the ports, Russian exporters face some of the highest transport costs in the world, which makes them a high cost supplier on an FOB basis. The railway tariff from the Kuzbass region to the western ports has increased by 40% over the past 5 years, pushing Russian exporters on the verge of profitability. The majority of operations are estimated to have FOB cash‐costs in a range of USD 60/t to USD 85/t. Russian seaborne exports into the Atlantic market are handled by the ports of the Baltic (e.g., Ventspils/Latvia or Ust‐Luga/Russia), Black (e.g., Tuapse/Russia or Mariupol/Ukraine) and Barents (e.g., Murmansk/Russia) Seas. The Russian ports in the Far East (e.g., Vostochny or Vanino) have been expanded recently to accommodate further export growth into the Pacific basin. Future Russian hard coal exports depend on the evolution of domestic coal demand as well as on international price levels. The level of domestic demand determines how much mining capacity is available for exports. Railway tariffs are by far the largest cost component of Russian FOB costs, thus, the development of haulage tariffs determines if prices received on the international market cover costs. This mechanism however affects steam coals to a much higher degree since metallurgical coals receive a price premium. South Africa South African hard coal production stood at 255 Mt in 2010, an increase from 251 Mt in 2009. Hard coal exports from South Africa have stagnated since 2005. In 2009, hard coal export volumes reached 67.5 Mt compared to 71.4 Mt in 2005. Export levels for 2010 are estimated to have nearly reached 70 Mt. The vast majority of the South African production is thermal coal for domestic and international markets. However, a small quantity of metallurgical coals is also produced. South Africa was a traditional supplier in the Atlantic market yet, with the surge of Indian import demand, trade flows were increasingly directed to the Pacific basin in the past years. Five companies – AngloAmerican, Xstrata, Exxaro, BHP‐Billiton and Sasol – account for about 80% of South Africa’s coal production. The bulk of the production is concentrated in the Central basin which comprises the coal fields of Witbank, Highveld and Ermelo. The Waterberg coalfield located in the north of the country, in Limpopo province, already plays an important role for the production of coals for domestic use. This region, however, might also become more important for export markets in the medium‐term, particularly with regard to metallurgical coal qualities. Geological conditions for coal mining are good in South Africa and nearly half of the production comes from surface mining operations (Eberhard, 2011). Both draglines and conventional truck and shovel methods are employed. Due to the geologic features of the seams, underground mining mainly relies on Room and Pillar methods. Export coals generally require washing to reduce ash content. Almost all coals destined for international buyers are transported along the dedicated 580 km railway line that links Richards Bay Coal Terminal to the Central basin. This line is owned and operated by the state‐owned rail monopoly Transnet. Richards Bay Coal Terminal is the major export hub in the country and one of the largest coal terminals in the world. Smaller volumes are also exported via Durban and Maputo (Mozambique). South African coal export collieries belong to the most cost competitive in the world. FOB cash‐costs should lie in a range of USD 35‐60/t.
© O
ECD
/IEA
, 201
1

60 MEDIUM‐TERM COAL MARKET REPORT 2011
South African mining industries’ challenges are twofold: firstly, under the Black Economic Empowerment (BEE) regime, the coal industry structure has undergone significant changes, as newly‐founded BEE companies have taken over existing coal production facilities. During this period of change, little to no investments into mining capacity were undertaken by the new mine owners. However, recently several new mining projects have been approved and thus improved the prospects for future South African exports. A second challenge is the expansion of the constrained export infrastructure capacity. During recent years, either port capacities or railway capacities posed bottlenecks to coal exports. With the recent expansion of the Richards Bay Coal Terminal’s capacity from 76 million tonnes per annum (Mtpa) to 91 Mtpa, port bottlenecks should not be an issue for the next few years. However, current port capacities are badly utilised as Transnet has not been able to meet current coal transport requirements. Derailments, low operating efficiency as well as inadequate capacity investments have made coal railway transport the key bottleneck today. Transnet is planning to invest more than USD 7 billion until 2015 to improve throughput of iron ore and coal railway transportation. The current export infrastructure bottlenecks as well as the effects of the BEE regime make only modest upward export potential in South Africa seem likely over the medium term. Colombia Colombian hard coal production stood at 74.4 Mt in 2010, an increase from 72.8 Mt in 2009. So far, almost all production is steam coal. Colombia is the fifth largest supplier worldwide with hard coal exports of 66.7 Mt in 2009 and 68.5 Mt in 2010. Exports have remained below their maximum mining capacity potential which is estimated to be approximately 80 Mt (Rademacher and Braun, 2011) due to port capacity limitations and heavy rains. Virtually all exports serve the Atlantic market region: in 2009, exports to North America were 17 Mt, 7 Mt went to South America, and 47 Mt went to Europe and the Mediterranean. Since the beginning of 2010, Colombian exports to Asia increased from practically zero to 11.4 Mt. 3.9 Mt alone went to Chinese buyers. Approximately 2 Mt went to Chinese Taipei and 1.1 Mt to South Korea. Other Asian buyers (including India) bought the balance. This recent swing of export streams has been supported by the price differentials between the Atlantic and Pacific markets: free‐on‐board price differentials between Colombia and Australia were above USD 30/t, which made Colombian exports cost competitive in the Asian markets. It remains to be seen if price differentials and bulk carrier rates will continue to support these export flows. Coal production is mostly controlled by large, vertically‐integrated global mining companies, which control production, rail and port capacity. Colombia features two of the world’s largest hard coal mining operations: the Cerrejón mine (32.5 Mtpa) owned in equal parts by BHP Billiton, Xstrata and Anglo American and the Mina Pribbenow/El Descanso (29.5 Mtpa) operated by Drummond. Several smaller mines are scattered all over the country which usually truck‐haul their product to the export terminals. Coal production in Colombia comes from two major mining regions with separate supply chains. La Guajira features the Cerrejon mine which is railway‐linked to the export terminal at Puerto Bolívar. The coal fields in the César region are rail‐linked to the export terminals in the Ciénaga/Santa Marta region. So far, the vast majority of the Colombian production comes from open‐cast mines. Mainly Truck and Shovel methods are employed in these collieries. Colombian producers have low export costs since inland transport distances are relatively short, geological conditions are good and the
© O
ECD
/IEA
, 201
1

MEDIUM‐TERM COAL MARKET REPORT 2011 61
large mines benefit from economies of scale. Although rising fuel prices have increased costs, Colombian FOB cash‐costs are in the lower half of the global supply curve. Colombian FOB cash‐costs are estimated to fall into a range of USD 40/t to USD 55/t. Future Colombian exports depend on how fast mining and infrastructure capacity can be expanded and how well the expansion projects are co‐ordinated. Moreover, the expansion of the Panama‐Canal scheduled to be finished by 2014 may lower transport costs into the Pacific basin and thus open new markets for Colombian exporters. In the long term, Colombian exports could even further increase: the current government recently announced plans to expand coal export infrastructure to 150 Mtpa by 2020. However, in recent years Colombia has had difficulties meeting their stated export targets, as investment schedules of international mining companies were not always in line with the governmental plans. United States Total hard coal production stood at 932 Mt in 2010 up from 922 Mt in 2009. The United States significantly increased hard coal exports from 53.3 Mt to 73.9 Mt and, again, fulfilled its role as an important swing supplier in the global hard coal market. Metallurgical coal exports, 50.9 Mt in 2010, made up the largest part of the increase, as economic growth and steel production in Europe picked up after 2009. US hard coal exports are a function of domestic and global demand: in times of high international demand and price, the United States is able to increase hard coal exports significantly. In times of low international coal prices, export mines in the United States are not cost competitive and therefore reduce production or serve domestic consumers. Most hard coal exports in the United States come from the Appalachians, however some high‐sulphur steam coal from the Illinois basin is also traded internationally at a discounted price. Due to high supply costs, Appalachian mines have traditionally been a marginal supplier to European markets. These regions have been mined extensively for decades, and mining operations have to face increasing production costs as coal deposits get more difficult to mine and stripping ratios increase. Also, Environmental Protection Agency (EPA) standards for mine permit applications have become increasingly stringent, with legislation limiting mountain top mining. Therefore, mining costs in the Appalachians may further increase in the future. Compared to other key supply countries, producers from Appalachia face relatively high inland transport distances up to 1 350 km and thus also high transport costs (Baruya, 2007). Currently, US FOB costs for steam coal in North Atlantic ports lie in a broad range of USD 60/t to more than USD 120/t. For coking coal FOB costs can be higher and fall in a range between USD 70/t to more than USD 140/t. Although steam coals from the Illinois basin are high in sulphur content and can only be sold at a price discount, mining costs are relatively low (about USD 35/t on average for the region) and inland transport can be done via river barges (about USD 28/t) to the export terminals at the US Gulf. Including port charges (about USD 5/t) FOB costs for Illinois coals should currently be around USD 70/t (McCloskey Coal Report, 2011). Thus, an increase in steam coal exports from the Illinois basin seams feasible in tight market situations. Canada Canada exported 21.5 Mt of metallurgical coal and almost 7 Mt of thermal coal in 2009, most of which comes from British Colombia and Alberta, in the west of the country. Metallurgical coal export
© O
ECD
/IEA
, 201
1
62 MEDIUM‐TERM COAL MARKET REPORT 2011
volumes in 2010 have risen to 27.5 Mt and steam coal imports have decreased to 5.7 Mt. Canadian hard coal exports reached 33.3 Mt in 2010 and have thus reached a ten year high. Rising steel productions increased metallurgical coal demand and thus lead to higher metallurgical coal prices in the Pacific basin. This spurred a recovery of Canadian coking coal exports in 2010. Canada could readily increase its exports as current port capacity amounts to more than 50 Mtpa. Furthermore, coal production from newly opened mines in north‐east British Columbia could propel export mining capacity to more than 60 Mt by 2015. However, Canadian coking coal mines generally operate at the high cost end of the global supply cost curve with average FOB costs exceeding USD 100/t. Inland shipping distances from the major mines to the ports on the Pacific shoreline (Roberts Bank, Vancouver and Prince Rupert) can be more than 1 100 km. Hence, inland transport fees, currently around USD 35/t, constitute a major component in Canadian FOB cost. Others Poland’s coal production has been decreasing in recent years. Exports fell from 19.4 Mt in 2005 to 8.4 Mt in 2009 and stood at 9 Mt in 2010. As Polish coal deposits have been mined extensively for decades, production costs are comparatively high. The Polish government plans to privatise the Polish coal mining industry to improve the industry’s financing and investment prospective. However, labour unions oppose the idea which has hindered the process so far. Vietnamese exports have almost exclusively served Chinese import demand. In 2009, Vietnam exported 25.5 Mt, out of which approximately 18 Mt went to China. In 2010, Vietnamese exports dipped to 22.3 Mt. A large proportion of Vietnamese output is of anthracite quality. Future Vietnamese export prospects strongly depend on domestic demand growth. Vietnam plans to increase its coal‐fired power plant capacity with new plants coming online in the next three to four years. Vietnamese authorities are considering a coal export tax increase from the current 15% to 20% to make exports less attractive. Moreover, state‐owned coal company Vinacomin has announced that it plans to gradually reduce coal exports to 3 Mt per year by 2015. Additionally, Vietnam has recently for the first time imported steam coal. Vietnam’s role as a coal exporter seems likely to decline in the future, although the decline of the pace is unclear. Venezuelan coal exports again remained far under their capacity potential with 3.6 Mt (2009) and 3.8 Mt (2010). Reasons for the low production figures are a lack of spare parts for mining equipment and heavy rain that have hampered both mining and trucking the product from the collieries to the terminals. Venezuela’s reserves amount to 850 Mt and free‐on‐board costs are quite low, ranging between USD 50/t to USD 60/t. However, the Venezuelan government actively restricts coal mining through an export cap of 10 Mt. Furthermore, the Venezuelan mining ministry denied the renewal of licenses for two key mines. Coal production and export prospects in Venezuela therefore look bleak in the medium term. Mongolia is a relatively new player in international coal trade. The country has expanded both its coal production and exports quickly during the last few years. Mongolia’s hard coal production more than doubled in the last two years from 7.1 Mt in 2009 to approximately 16.6 Mt in 2010. Basically all hard coal production is for exports with some brown coal production serving domestic needs (8.7 Mt in 2010). With 10.9 Mt in 2010, the majority of the exported coal is of coking coal quality. A major problem is the lack of cost‐efficient transport infrastructure. Currently, the majority of exported coal
© O
ECD
/IEA
, 201
1

MEDIUM‐TERM COAL MARKET REPORT 2011 63
is trucked to the Chinese border and unloaded onto trains, but the construction of a railway link to the Chinese network has started. All exports are so far destined to the adjacent Chinese market. However, this situation may change in the future as talks with Russia’s national railway operator have started with regard to building a railway connecting the Mongolian coal fields to the Russian railway network. This would give Mongolian producers the opportunity to trade their product on the Russian and seaborne markets via Russia’s Pacific ports. Generally, Mongolia is in a good position to become a major player on the global coal market in the future. Reserves of high‐quality coal are plentiful, mining costs are currently very low (USD 15/t to USD 25/t) and there is political support for expansion projects. Once an appropriate transport infrastructure exists, total supply costs will give Mongolian producers a good position both in the Chinese and the seaborne trade market. New Zealand is a tiny player in international coal trade. The country exported about 2.3 Mt of coal, most of which was metallurgical coal, in 2010. Coal is mined on the west coast in open‐cast and underground operations and exported through the port of Lyttleton. So far most of the coal exports were produced by Solid Energy in its Stockton open‐cast mine (truck and shovel). Importers
Japan Japan is the largest hard coal importer in the world. The Japanese economy was severely affected by the global economic downturn, which hit domestic industry as well as coal‐based electricity generation. As a result, coal imports were down by 20 Mt to 164 Mt in 2009 – an 11% reduction. Yet, Japanese hard coal imports rebounded to 186.6 Mt in 2010. Out of this 129 Mt was steam coal with the remainder being metallurgical coal. Generally, Japan is poor in domestic energy resources and all coals are imported. The principal hard coal supplier for Japan is Australia, with a share of more than 60%. Japan is the second largest steel producer in the world behind China and coal‐fired power plants contribute to approximately one‐quarter of Japan’s electricity production. In March 2011, Japan was hit by a heavy earthquake and subsequent tsunami that caused enormous destruction. The nuclear power plant at Fukushima Dai‐Ichi was severely hit by the tsunami wave which damaged the cooling circuit and triggered a nuclear meltdown. Several other power stations especially nuclear power plants went offline as a result of the earthquake and remained shut‐down for most of 2011. This has critically tightened electricity supply. The lost generation was compensated by higher output especially from thermal plants. Therefore, despite an economic slowdown in the aftermath of the earthquake due to the destructions, coal imports remained fairly stable. Before the Fukushima Dai‐Ichi accident Japanese energy policy was strongly in favour of nuclear energy. Energy policy implications are still unclear but it seems likely that there will be a shift of focus to additional thermal capacities and renewables.
© O
ECD
/IEA
, 201
1

64 MEDIUM‐TERM COAL MARKET REPORT 2011
Box 6 Will Fukushima boost coal demand?
Nuclear power is a classic baseload generator: due to its massive investment needs, low marginal costs and operational characteristics nuclear reactors usually operate continuously with full capacity, over 7 000 hours a year. Coal and especially lignite‐fired units are the closest substitutes from a cost and operational point of view: they have higher investment needs, lower marginal costs, and less flexible operational parameters than gas or oil fired units. Unsurprisingly, in countries that do not use nuclear power, coal is mostly the baseload generator. Consequently if the Fukushima disaster leads to lower nuclear production in the future, coal at first sight would seem to benefit.
In 2010, nuclear produced 2 600 TWh globally, roughly equivalent to 1 billion tonnes of coal. Most nuclear generation took place in countries (France, Japan, Switzerland, Korea) that hardly produce coal. Of course, the capital stock of the energy system does not change by a stroke of a wand; on the contrary, it is characterised by decades long asset lifetimes and lumpy and long investment times. This is especially true for nuclear, where a project time can easily be a decade, and the lifetime of the plant can reach 50‐60 years. Although the policy reaction to the Fukushima disaster is still evolving, one thing is certain: any impact that Fukushima might have on new nuclear investment will affect the energy system and coal demand only beyond the time horizon of this report.
Several countries launched safety checks and reviews of their nuclear facilities. Although these are still ongoing, it seems that outside Germany and Japan, most existing nuclear power plants will continue to operate, so any medium‐term coal demand impact would likely come only from these two countries.
Japan has 40 GW of coal‐fired capacity, that operated with a 75% load factor in 2010. In addition to destroying the Fukushima Dai‐Ichi nuclear plant, the Tohoku earthquake and subsequent tsunami caused substantial damage to around 7.5 GW of coal‐fired capacities, of which 3.2 GW recovered by the end of July. The Japanese power system is segmented by network bottlenecks, and the undamaged remainder of the coal fleet is located in regions that cannot supply the Tokyo‐Tohoku area. Consequently the immediate impact of the disaster on coal demand was negative: coal demand from the affected area’s plants was lost, and the damaged nuclear and coal units had to be substituted by demand management and the existing gas and oil capacities of the Tokyo‐Tohoku area rather than coal‐fired units in other regions of Japan. 4 GW of coal‐fired capacity at the usual Japanese load factors would burn over a million tonnes of coal monthly.
However, there are reasons to assume that in the medium term this picture would change. Restoration of the damaged conventional plants is proceeding at an impressive speed. The coal‐fired units damaged by the earthquake are expected to be operational at some point. At current prices, their marginal cost will be substantially below LNG or especially oil fired units, consequently they are expected to run at a high load factor. Moreover, recent regulatory and policy decisions led to a much broader fall of Japanese nuclear production. Several units have been shut down for extensive safety checks on the request of the Japanese government and others failed to receive a permission to restart after maintenance shutdowns. All in all, Japanese nuclear production currently is around 12 TWh/month below its pre disaster average of which the Fukushima Dai‐Ichi plant is only around 2 TWh. Importantly due to the network constraints, some of the lost nuclear is in other regions of Japan. Currently the future of Japanese nuclear production is extremely uncertain. The Japanese government initiated a revision of its previously pro nuclear policy and is on the record preferring a full phase out. However, the existing power plant fleet is not able to supply Japan reliably without nuclear in the medium term. Additional conventional power plant investments in Japan consequently are very likely, of which gas plants might become operational over the outlook period, but additional coal plants probably not. Nevertheless, even if Japan does retain some nuclear production, it is reasonable to assume that existing coal‐fired plants will increase their load factor and be pushed into an even more baseload operation mode to substitute for nuclear. It is estimated that this can lead to an additional annual coal‐fired generation of 10‐15 TWh with only 3 GW recovered or 30‐40 TWh if the whole fleet is on line. This could mean 3‐5 Mt of additional coal demand for partial recovery or 10‐13 Mt with the whole fleet.
© O
ECD
/IEA
, 201
1

MEDIUM‐TERM COAL MARKET REPORT 2011 65
Box 6 Will Fukushima boost coal demand? (continued)
As a reaction to the Fukushima catastrophe, the German government modified its energy policy, with the shut‐down of eight plants and full phase‐out by 2022. Among these, only the decommissioning of Grafenrheinfeld by 2015, will be within the outlook period. The eight nuclear power plants shut down so far would have produced approximately 60 TWh of electricity (11% of German net demand). Contrary to Japan, Germany is not an island, and its electricity system is well interconnected in every direction. Consequently, only one third of the lost nuclear production has been replaced by increased conventional production in Germany. The rest was absorbed by changing trade flows, reduced exports and increasing imports of Germany. It is obviously very difficult to disentangle the effects of the moratorium from fluctuations in demand and renewable production, nevertheless it seems that hard coal‐fired power plants in Germany, the Czech Republic and Poland as well as gas capacities in Germany and the Netherlands were dominant in replacing German nuclear capacity so far. In the medium term additional 11.6 GW of coal‐fired capacity currently under construction will come online in Germany. Lifetime extensions of old coal‐fired capacities as well as new‐built additional gas‐fired capacities are likely to replace nuclear generation and serve peak‐load in the medium term (Fürsch et al. 2011).
The current first order effect of the moratorium is around 5 million tons/year more of coal demand and (together with the increasing gas use) 25 Mt of CO2 emissions, maybe more. However, given that the European Emission Trading (EU‐ETS) system has a hard emission cap, emissions can not just increase by such an amount; rising carbon prices have to deliver additional abatement. Given that coal‐ and gas‐ fired plants are the dominant emission sources in the EU‐ETS, and other industrial sectors (cement, refineries etc.) are generally assumed to have higher abatement costs, a substantial proportion of this abatement is likely to come from the electricity sector itself, by a coal to gas switch. We assume that there is no additional abatement from the industrial sectors and renewable production to be exogenous due to feed‐in tariffs scheme. In addition, we also assume that while the German phase‐out does increase wholesale power prices, due to the low price elasticity of demand this does not have a significant impact on demand. Under these admittedly restrictive assumptions a static model would predict that the European electricity system will have to produce 100 TWh more from gas and 40 TWh less from coal in order to substitute the lost 60 TWh low carbon nuclear from the same carbon budget. In this case the effect on coal demand is around 16 million tonnes. Note that this is a European scale effect in the framework of the EU ETS, and some of the coal to gas switch might take place in systems such as Spain or the United Kingdom that do not physically trade power with Germany but have fuel switching flexibility to respond to carbon prices. On the other hand, Germany has already announced a policy target to cut power demand by 10% with efficiency measures and accelerate renewable deployment, especially offshore wind. Paradoxically, both policies, if successful, have a potential to increase the demand for coal. The reason for this is the interaction of these policies with the EU‐ETS where the emissions of the covered sectors are fixed. Any additional unrelated policy that cuts the demand for conventional generation, the dominant emission source in the EU‐ETS but cutting demand or pushing more renewables, will enable the remaining conventional generation to be more carbon intensive on average. Given that coal ‐fired plants have a lower marginal cost, once falling carbon prices signal the relaxation of the ETS constraint, there is an incentive to increase coal‐fired generation at the expense of gas. Of course operational constraints can limit this effect even if the carbon price falls to zero.
China In 2009, China switched from being a net coal exporter to being the second largest net importer worldwide. Imports have totalled 125.8 Mt in 2009 and are expected to be 177 Mt in 2010. Although Chinese imports remained high during 2011, preliminary figures indicate that total imports for the year may fall slightly below the 2010 total. Exports are controlled by the government through export
© O
ECD
/IEA
, 201
1

66 MEDIUM‐TERM COAL MARKET REPORT 2011
quotas since 2004. Export licenses are in possession of four mining companies10 and export quotas
are fixed in two batches on an annual basis. Export quotas have been continuously dwindling from 80 Mt in 2005 to around 38 Mt in 2011. While Chinese reserves with 180.6 billion tonnes are the second largest of the world, coal deposits in the current coal mining regions have been exploited heavily for decades. Depths of mining operations in Shaanxi have been increasing. Productivity gains from the concentration process in the Chinese mining industry have compensated for this decline in geological mining conditions to a certain extend. In general however, mining costs in the conventional coal mining hubs are expected to rise further as do also governmental and environmental levies and taxes on mining. Chinese domestic production is, to a certain degree, protected by a 17% tax on hard coal imports. Although China is ramping up its domestic coal mining capacity quickly, Chinese demand has still outgrown domestic supply. Chinese production and demand hubs for hard coal are typically spatially separated from each other. Coal demand is concentrated in the east of the country e.g. in the economic centres of Guangdong, Shanghai and Beijing. The majority of Chinese coal production, however, is located in the north and centre of the country, primarily in the provinces of Inner Mongolia, Shanxi, Shaanxi and Henan. More than 60% of Chinese coal production is transported over 550 km, which implies significant railway transport costs of sometimes more than USD 30/t. Inland transport costs are therefore a major cost component and may give domestic coal production a cost disadvantage in coastal areas depending on international coal prices. Future Chinese imports will depend on market conditions, such as international coal prices, but also on the effectiveness of Chinese mining industry reforms and related energy market/pricing reforms, (for example, in electricity). With strong demand growth, the Chinese mining industry faces the challenge of increasing its supply capacity and efficiency at the same time. Yet, lower economic growth rates, as well as a shift of focus away from coal towards natural gas, renewables, nuclear energy and energy efficiency as outlined in the guiding principles of the 12th Five‐Year Plan, could have a dampening effect on Chinese coal demand and hard coal imports in the medium term. Furthermore, the opening of new, low‐cost coal mines in the western China, together with increased investment into electricity transmission rather than transport of coal, may increase competitiveness of domestic supply compared to foreign imports in the longer term. India Indian hard coal imports grew from 59 Mt in 2008 to 73.2 Mt in 2009 and to 90.1 Mt in 2010. Indian coal production has not been able to keep up with increasing coal consumption. Further, large coal consumption centres are located far away from the principal coal mining areas and a large amount or domestic coal is therefore hauled over long distances, which increases supply costs for domestic coal. As a result, Indian coals are sometimes not cost competitive compared to foreign steam coal, even at inland consumption centres. Indonesian and South African steam coals constitute the largest part of Indian steam coal imports. Indonesian steam coal imports rose from 25.1 Mt in 2009 to 41.5 Mt in 2010. South African steam coal imports reached 18.7 Mt in 2010 compared to 16.5 Mt in 2009. Increasing Indian steam coal imports have provided a well‐timed relief for South Africa’s coal export industry during a time of plummeting Atlantic steam coal import demand. Import levels of steam
10 China Coal Company, Shenhua Group, Shanxi Group and Minemetals.
© O
ECD
/IEA
, 201
1

MEDIUM‐TERM COAL MARKET REPORT 2011 67
coals will continue to increase for some years as the power sector strives to meet the shortfall from indigenous production. Some existing coal‐fired plants as well as new facilities will continue to depend on imported coal. Indian coking coal reserves constitute only about 14% of the total coal resource and prime coking coal amounts to only around 2 %, Moreover, it is of poor quality. Therefore, Indian industry has experienced shortages of coking coal for some years (Mills, 2007). As a consequence, India meets much of its requirement through coking coal imports, so far mostly sourced from Australia. Imports of Australian coking coals have risen from 23.5 Mt in 2009 to 28.8 Mt in 2010. Indian coal imports are very likely to further increase over the medium term: in February 2010, the Indian coal ministry stated that during the fiscal year of 2011/2012, Indian hard coal imports could reach 142 Mt, an increase of around 70%, due to regulatory hurdles faced by domestic coal supply growth. In April 2011, the Planning Commission of India has announced that it expects coal imports to increase up to 250 Mt by 2017 due to weak performance of the domestic coal industry and environmental constraints. Moreover, five of the nine sites considered within the Ultra‐mega Power Projects (UMPP) programme are located at the Western and Eastern coasts and will rely on imported coal. The UMPP envisions the construction of 14 large‐scale coal power station projects, each with a capacity of 4 GW. Increasing imports are planned to be supported by an expansion of port and rail capacity. South Korea South Korea used to be the second largest importer of hard coal, but is now the third largest behind Japan and China. South Korean hard coal imports increased throughout the financial crisis and reached 103 Mt in 2009, an increase of 3.4% compared to 2008. In 2010, imports sharply increased by more than 15 Mt and totalled 118.6 Mt by the end of the year. Much of the growth is attributable to the first half of 2010 when the economic activity increased after the financial crisis. Korean steam coal imports have increased by around 14 Mt since 2008 and metallurgical coal imports have increased by about 3.6 Mt. The two principal suppliers are Indonesia and Australia, with some smaller quantities coming from Russia, Canada and China. Similar to Japan, South Korea has minimal domestic fossil fuel reserves and thus relies heavily on imports to secure energy supply. South Korea is currently the sixth largest steel producer in the world. Coal is the backbone of the Korean power system and accounts for more than 45% of electricity generation. Although the share of liquefied natural gas (LNG) in power generation has increased rapidly, gas is a relatively expensive energy source for power generation in South Korea. South Korean, and similarly Japanese, LNG imports are largely indexed to oil prices. Consequently, gas prices in the Asia‐Pacific region are usually higher than in Europe or the United States. This gives coal a relative cost advantage over gas in the power generation sector. Yet, expected additions to the coal‐fired power plant fleet are modest in the medium term and thus much of the growth in coal imports will come from industrial buyers. Europe Hard coal imports among OECD countries decreased from 252.2 Mt in 2008 to 217.5 Mt in 2009. In 2010, hard coal imports stagnated and stood at 217.3 Mt. While steam coal imports further decreased from 176.9 Mt in 2009 to 166.1 Mt in 2010, metallurgical coal imports increased by
© O
ECD
/IEA
, 201
1
68 MEDIUM‐TERM COAL MARKET REPORT 2011
10.6 Mt and reached 51.2 Mt in 2010. The principal suppliers for metallurgical coals are Australia and the United States. Russia, Colombia and South Africa, on the other hand, are main suppliers for steam coal. Germany is Europe largest importer, which procured approximately 45.7 Mt in 2010, up from 38.5 Mt in 2009. Turkey’s coal imports increased rapidly over the past years and have totalled 26.9 Mt in 2010, up from 20.4 Mt in 2009, making Turkey the second largest importer behind Germany. The third largest importer is the United Kingdom with volumes totalling 26.5 Mt in 2010 down from 38.2 Mt in 2009. Coal plays an important role in power system among OECD countries in Europe; approximately one‐quarter of electricity generation comes from coal‐fired power plants. The share of coal‐fired generation varies significantly in Europe. For example, France produces approximately 5% of its electricity from coal and Germany approximately 45%, whereas Poland has a coal share of around 90%. The Fukushima accident also impacted European power markets: in the aftermath of the earthquake German energy policy was reconsidered and eight nuclear power plants were shut‐down. The lower nuclear generation in Germany is mainly compensated by increased output from domestic hard coal‐fired and gas‐fired plants and by a reduction of net exports. The reduction in net trade has also increased utilisation of coal‐fired stations in neighbouring countries (Fürsch et al., 2011). The prospects of future European hard coal import will be determined by the evolution of coal demand and domestic coal production, as well as gas competition. Hard coal production among OECD countries is located mainly in Poland (77 Mt in 2010), the United Kingdom (18 Mt), Germany (13 Mt), Czech Republic (11 Mt) and Spain (6 Mt). Production levels have continuously declined in the past years. However, it is likely that future hard coal demand reduction will be offset by lower domestic supply, which will therefore lead to lower hard coal import levels in the future. The climate package, which the European Union countries committed to, may lead to further decreases in coal burn in the power and heat sector, as the share of renewable generation increases. Energy efficiency measures and moderate economic growth rates will probably dampen heat and electricity demand which in turn will affect hard coal import requirements. Others Hard coal imports in Chinese Taipei decreased as a result of the global economic crisis from 58 Mt in 2008 to 52.7 Mt in 2009. In 2010, imports grew again by 20% and reached 63.2 Mt. While steam coal demand remained relatively flat over the past years most of the growth came from metallurgical coal demand. In 2010, 13% of the total imports were metallurgical coals up from 8% in 2008. However, the structure of imports changed: imports from China have declined by 6.8 Mt since 2008 and have been partly compensated by higher imports from Australia, Colombia and South Africa. Hard coal imports of Malaysia were only slightly affected by the global economic downturn: Imports fell slightly from 18.1 Mt to 17 Mt in 2009 and rebounded to 19.1 Mt in 2010. Brazil is the largest hard coal importer in Latin America. Hard coal imports stood at 12.7 Mt in 2009, down by 2.6 Mt. However, in 2010 imports increased to 17.3 Mt. Being a major steel producer, three quarters of Brazil’s imports are metallurgical coals coming primarily from the United States and Australia.
© O
ECD
/IEA
, 201
1

MEDIUM‐TERM COAL MARKET REPORT 2011 69
The United States’ role as a hard coal importer has declined over the past years. While coal imports stood at 31 Mt in 2008, they have plummeted to 17.4 Mt in 2010. Imported coal is mainly used by power plants located closely off‐shore on the East coast and the Gulf of Mexico. Low domestic gas prices and increasing international coal prices have caused a switch between gas‐fired and coal‐fired power generation which reduced import demand for steam coal. References
ABARES [Australian Bureau of Agricultural and Resource Economics and Sciences] (2011), Minerals and Energy: Major Development Projects – April 2011 Listing, Canberra. Barry Rogliano Salles (2011), “Outlook for the Bulk Carrier Market”, presentation at the IEA Workshop on Outlook for Coal Industry and Markets, Beijing, 14 April. Baruya, P. (2007), Supply Costs of Internationally Traded Steam Coal, IEA Clean Coal Centre, London. BGR [Bundesanstalt für Geowissenschaften und Rohstoffe] (2010), “Reserves, Resources and Availability of Energy Resources”, Federal Institute for Geosciences and Natural Resources, Hannover. DnB NOR (2010), “Dry Bulk Outlook: Iron Ore and Coal”. DnB NOR, Oslo, http://download.hellenicshippingnews.com/pdf/Complete%20ReportAugust.pdf Eberhard, A. (2011), “The Future of South African Coal: Market, Investment and Policy Challenges”, working paper 100, Freeman Spogli Institute for International Studies at Stanford University, Stanford, California. Fürsch, M., D. Lindenberger, R. Malischek, S. Nagl, T. Panke, J. Trüby (2011), “German Nuclear Policy Reconsidered: Implications for the Electricity Market”, EWI working paper 11/12, Institute of Energy Economics, University of Cologne, Cologne. McCloskey (2011), McCloskey Coal Reports 2007 to 2011. McCloskey Group, http://cr.mccloskeycoal.com/. Meister, W. (2008), “Cost Trends in Mining”, presentation at McCloskey's European Coal Conference, Nice. Mills, J. (2007), “Prospects for Coal and Clean Coal Technologies in India”. IEA Clean Coal Centre, London. Paulus, M. and J. Trüby (2011), “Coal Lumps vs. Electrons: How do Chinese Bulk Energy Transport Decisions Affect the Global Steam Coal Market?”, Energy Economics, Elsevier, Amsterdam, forthcoming. Rademacher, M. and R. Braun (2011), “The Impact of the Financial Crisis on the Global Seaborne Hard Coal Market: Are there Implications for the Future?” Zeitschrift für Energiewirtschaft,Vieweg, Wiesbaden, Vol. 35, No, 2, pp. 89‐104.
© O
ECD
/IEA
, 201
1
70 MEDIUM‐TERM COAL MARKET REPORT 2011
Rui, H., R.K. Morse and G. He (2010), “Remaking the World's Largest Coal Market: The Quest to Develop Large Coal‐Power Bases in China”, program on Energy and Sustainable Development, Stanford University, Stanford. Schiffer, H.‐W. (2011), “Rolle der Kohle im weltweiten Energiemix”. Zeitschrift für Energiewirtschaft, Vieweg, Wiesbaden, Vol. 35, No. 1, pp. 1‐13. Trüby J. and M. Paulus (2010), “Have Prices of Internationally Traded Coal been Marginal Cost‐Based?”, EWI working paper 10/05, Institute of Energy Economics, University of Cologne, Cologne. Trüby, J. and M. Paulus (2011), “Market Structure Scenarios in International Steam Coal Trade”, EWI working paper 11/02, Institute of Energy Economics, University of Cologne, Cologne. VDKI [Verein der Kohlenimporteure e.V] ( 2011). “Annual Report 2011 – German Hard Coal Importer’s Association”, July 2011, Hamburg, www.verein‐kohlenimporteure.de/download/ VDKi_ANNUAL%20REPORT%202011_WEB%20Final.pdf?navid=15.
© O
ECD
/IEA
, 201
1

MEDIUM‐TERM COAL MARKET REPORT 2011 71
MEDIUM-TERM PROJECTIONS OF SEABORNE TRADE Summary
• Due to the sheer size of the Chinese coal market, its evolution could have a marked impact on international coal trade. The key uncertainty regarding future Chinese imports is dealt with by analysing two different production scenarios: the high Chinese production scenario (HPS) and low Chinese production scenario (LPS).
• In the LPS, which results in higher Chinese imports, seaborne hard coal trade grows from 856 Mtce to 1 038 Mtce whereas in the HPS, seaborne hard coal trade grows to 890 Mtce.
• While Chinese imports could also decline in the medium‐term, Indian imports
are likely to grow rapidly. In the HPS, India becomes the largest hard coal importer of the world, even overtaking Chinese imports in the LPS.
• The United States is the key swing supplier for both steam and metallurgical coal. Exports from the United States balance the market in terms of high demand, yet at a higher cost than the traditional base suppliers. The United States exports almost 110 Mtce in 2012 in the LPS.
• With more costly supply utilised in the LPS, supply costs are also higher, compared with the HPS. In the LPS, marginal costs of supply (FOB) are projected to be about USD 10/t higher for steam coal and about USD 15/t higher for metallurgical coal, than in the HPS.
• Australia remains a key supplier of metallurgical coals due to its high‐quality products and low supply costs, although competition from new high‐quality operations in Russia and Mozambique will become stronger.
Mongolia, a new market entrant, increasingly serves Chinese coking coal demand overland through the “back door” at low cost. This absorbs trade volumes from the seaborne market and may thus squeeze margins of high cost suppliers such as Canada or the United States.
Assumptions and methodology
According to economic theory, trade flows in a well‐integrated commodity market should reflect a cost minimal allocation of the goods between domestic consumption, exports and imports. Global hard coal markets are assumed to be well integrated. Thus, given information about the future development of several parameters such as export capacities, costs and coal demand, it is possible to derive an estimate of future trade between exporting and importing countries. To do so, spatial equilibrium models for international steam and
© O
ECD
/IEA
, 201
1

72 MEDIUM‐TERM COAL MARKET REPORT 2011
metallurgical coal trade were used.11 Although objections regarding the market conduct of some actors during certain time periods in hard coal trade may arise,12 the underlying market structure with multinational companies, state‐run entities and a large number of smaller national players competing with each other justifies the assumption of competitive behaviour over the outlook period. Theoretically, the outcome is then equivalent to the least‐cost allocation of supply to demand. The models thus minimise the total costs of coal production and transport to meet demand, subject to a set of infrastructure and mining constraints. The models include all major coal mining regions and demand hubs, and feature detailed datasets on mining and transport costs as well as infrastructure and mine capacities. Mining and infrastructure capacity expansions are derived from projects lists. Furthermore, different coal qualities are distinguished with regard to their calorific content, as well as their use (thermal or metallurgical). Mining cost evolution over the outlook period is based on assumptions regarding mining input price developments (e.g. future steel and explosives prices or labour costs). It is assumed that productivity increases do not offset increasing mining and transport cost due to input price escalation and deteriorating geological conditions in existing operations. Furthermore, it is assumed that political parameters such as export quotas, taxes and royalties do not change during the outlook period. Seaborne freight rates are assumed to increase moderately, reflecting the current capacity situation in dry bulk shipping.
Scenario design
The medium‐term coal trade projections span the time horizon until 2016 and make use of the scenario analysis technique to account for key uncertainties regarding future trade volumes. One of the key drivers for future coal trade developments is the ability of the Chinese mining industry to keep up with domestic demand growth. In line with the 12th Five‐Year Plan, Chinese authorities are currently restructuring and consolidating the coal mining industry, a process that had begun during the 11th Five‐Year Plan. The development of new mines as well as increasing efficiency and production from existing mines is dependent on how fast the associated reorganisation measures are put into action and become effective. If Chinese coal production is ramped‐up quickly over the coming years, China is likely to lower its coal import volumes, but if production increases are sluggish, China is likely to import increasing volumes from the international markets. Due to the enormous size of the Chinese market relative to the international trade market, future Chinese coal production levels can have substantial impacts on international trade, as was seen in recent years. Two scenarios are developed to consistently illustrate the impact of Chinese coal production uncertainty on international trade during the outlook period. Both scenarios are based on the global coal demand figures described in the Medium‐Term Projections of Demand and Supply and vary only with regard to the rate at which Chinese coal production increases. The LPS assumes that Chinese coal production and infrastructure expansion cannot keep up with domestic coal demand at competitive prices, implying a continued strong demand for imported hard coal. The HPS assumes that production increases at higher rates during the outlook period. The attempts of Chinese authorities to restructure the industry are assumed to become fully effective in the coming years and infrastructure bottlenecks to be resolved quickly. As a consequence, Chinese import demand is lower in this scenario.
11 For a detailed model description, please refer to Paulus and Trüby (2011). 12 See e.g. Trüby and Paulus (2011) or Paulus et al. (2011) for market power analyses in international steam coal trade. Competition in metallurgical coal has also been argued due to the dominant position of Australia on the supply side and the dominant position of Asian steel mills on the demand side, see e.g. Graham et al. (1999).
© O
ECD
/IEA
, 201
1
MEDIUM‐TERM COAL MARKET REPORT 2011 73
Strictly speaking, the LPS is a sensitivity case for the supply side rather than a different scenario. As this scenario neglects demand response to coal price fluctuations, coal demand is slightly more bullish in the LPS than one would expect in reality. The higher Chinese imports in the LPS tighten the international market and thus drive supply costs upwards. Although steam coal demand is considered inelastic (in the short run), one would expect some demand reactions in regions with spare electricity generation capacities and competitive prices of alternative fuels (in Europe or the United States). Due to a lack of substitutes for metallurgical coal in steel‐making, price elasticity is even lower for this coal variety and demand reactions are negligible in the short run. In the scope of this scenario, the neglect of demand response allows a focused and simple analysis of the coal‐fired impact of different Chinese production levels on international trade. Projections of seaborne hard coal trade13
Chinese hard coal demand is equal in both scenarios and increases to 3 123 Mtce, or around 4 040 Mt, by the end of the outlook period. In the LPS, Chinese hard coal production grows from 2 399 Mtce in 2010 to 2 913 Mtce in 2016. This production level causes Chinese hard coal imports to almost double from 92 Mtce in 2010 to 180 Mtce in 2016. In the HPS, Chinese production grows to 3 054 Mtce in 2016. This production level causes Chinese hard coal imports to drop by 58% from 92 Mtce in 2010 to 39 Mtce in 2016. The difference in Chinese seaborne imports between these two scenarios is 141 Mtce in 2016, with major implications for seaborne hard coal trade. The high imports, in the LPS, tighten the seaborne hard coal market and call for suppliers worldwide. Compared with the HPS, which results in lower imports, the utilisation of export mining and infrastructure capacity is higher on a global scale. Given the tight market situation with high Chinese imports, several suppliers provide higher volumes than they would with lower Chinese imports. These additional volumes come from high‐cost mines, collieries that incur higher transport costs and mines that produce lower coal qualities. The United States is the key swing supplier in both metallurgical and steam coal trade and plays a crucial role in balancing the market when low‐cost supply is scarce. A few high‐cost Australian (mainly steam coal), Indonesian and Russian mines also have swing potential. Besides the United States, Canada is the second swing supplier in metallurgical coal trade. However, with more costly supply utilised in the LPS, marginal costs of supply (the costs of an incremental unit of supply) are also higher in this scenario, compared with the scenario with lower Chinese imports. In the LPS, marginal costs of supply (FOB) are projected to be about USD 10/t higher for steam coal and about USD 15/t higher for metallurgical coal than in the other scenario. The lower supply costs in the HPS attract Indian buyers. Additional Indian imports absorb some of the lower Chinese imports and reduce export capacity slack in this scenario. Therefore, the lower Chinese imports in the HPS are partly offset by higher Indian imports and supply costs are hence stabilised. This mainly affects steam coal trade (seaborne steam coal market volume differs by 71 Mtce in 2016) whereas in metallurgical coal trade, the lower Chinese imports fully feedback to seaborne trade market volume (metallurgical trade market volume differs by 37 Mtce in 2016). Relative to their respective trade volumes, differences in metallurgical coal trade between the two scenarios are more marked than differences in steam coal trade. As a result, the spread in supply costs between the scenarios is larger for metallurgical coals.
13 Tables of exports and imports split by coal type can be found in the section Tables.
© O
ECD
/IEA
, 201
1

74 MEDIUM‐TERM COAL MARKET REPORT 2011
Figure 25 Differences in net trade between LPS and HPS
Note: The graph specifically displays differences in net trade (expressed as net exports). Exporting countries, such as the United States, Australia, Indonesia, Canada and South Africa show higher exports in LPS, so the difference is positive. Importing countries, such as India, show lower imports in LPS, so the difference is positive in LPS. China shows higher imports, so the difference is negative in the LPS.
Differences in marginal supply costs can be interpreted as a lower bound for price differences between the two scenarios. Although freight rates are likely to remain low over the outlook period, differences in trade market volumes may also cause moderate differences in freight rates. Additionally, capacity scarcity and short‐term supply bottlenecks (e.g. weather‐related) can cause price spikes that are not related to supply costs. Clearly, these issues are more likely to cause an upward price trend in the LPS, in which the market is relatively tight, thus further widening the price spread between the scenarios.
Projections of seaborne thermal coal trade
The different Chinese production levels have a significant impact on seaborne thermal trade market volume. In the LPS, maritime steam coal trade increases by around 100 Mtce from 628 Mtce in 2010 to 735 Mtce in 2016. Chinese steam coal imports stand at 137 Mtce by the end of the outlook period – some 104 Mtce higher than in the HPS. This means that even in the case of higher Chinese imports than today, total seaborne trade increases only at an annual rate of less than 3% a year compared with around 5% in the last decade. In the HPS, seaborne steam coal trade grows even more slowly, by only by about 36 Mtce to 664 Mtce in 2016.
‐150
‐100
‐50
0
50
100
2012 2014 2016
United States Australia Indonesia Canada Russia
South Africa India Other China
Mtce High
er in "lo
w Chinese
productio
nscen
ario"
Lower in
"lowChinese
productio
nscen
ario"
© O
ECD
/IEA
, 201
1

MEDIUM‐TERM COAL MARKET REPORT 2011 75
LPS
In the LPS, China needs additional steam coal imports to cover demand from industry and power generators. Steam coal imports are projected to increase more rapidly at first, continuing the recent surge in Chinese imports. Only in the second half of the outlook period are coal industry reorganisation and consolidation measures assumed to become effective in China, which increases domestic production capacities too late. Chinese import growth in the LPS slows down in the latter half of the outlook period, but remains higher than in the HPS. Despite strong Chinese import demand, the fastest growing importer is India. Indian steam coal imports increase in this scenario by 124%, from 53 Mtce in 2010 to 118 Mtce in 2016. Hence, India becomes the second largest steam coal importer, behind China, by the end of the outlook period. Overall, steam coal import demand in Europe and the Mediterranean countries is projected to decline slightly. However growth rates are heterogeneous in this region. West European economies reduce their imports, while imports increase in East European and Mediterranean countries (such as Turkey) until 2016. Japanese steam coal imports are projected to remain relatively flat over the outlook period, while Korean and Taiwanese steam coal imports increase by about 1% a year. The United States, Southeast Asian countries and several smaller players are summarised and referred to as “other”. This region is also heterogeneous in terms of import growth. While Southeast Asian demand is growing, the United States reduces its imports. This is due to the relatively high prices for internationally traded coal as a result of high growth rates in the LPS. With high prices for imported coal, US domestic coal production is more profitable and thus imported coal is substituted by domestic coal. Moreover, with relatively low natural gas prices in the United States, coal‐based electricity generation faces strong competition from gas‐fired plants, leading to lower coal imports. In sum, import demand of traditional players in the market such as Europe, Japan and Korea is sluggish, with most of the incremental growth coming from China and India. Incremental import demand in the LPS is covered by increased exports from traditional suppliers in the seaborne market. Indonesian exports stood at 234 Mtce in 2010 and are projected to grow by about 38 Mtce until 2016. This is the highest growth of all exporters in absolute terms and corresponds to an average growth rate of 2.5% per annum. Consequently, Indonesia, the largest exporter of steam coal, keeps its market share of about 37% during the outlook period. The bulk of the Indonesian production capacity is in the low‐cost half of the global supply curve. Due to the strong market growth in this scenario, most of the Indonesian operations remain intramarginal to the market. Colombian exports grow on average by 6.2% per annum and thereby have the highest growth rate in relative terms. In both scenarios, Colombia manages to expand its constrained export infrastructure. This development is paralleled by production increases from existing large‐scale, open‐cast mines and from new projects currently under construction. These measures allow for Colombian exports of about 91 Mtce from 2014 onwards. Australia remains the second‐largest steam coal exporter and supplies an additional 29 Mtce to the seaborne market by the end of the outlook period. This corresponds to an average export growth rate of 3.3% per annum.
© O
ECD
/IEA
, 201
1
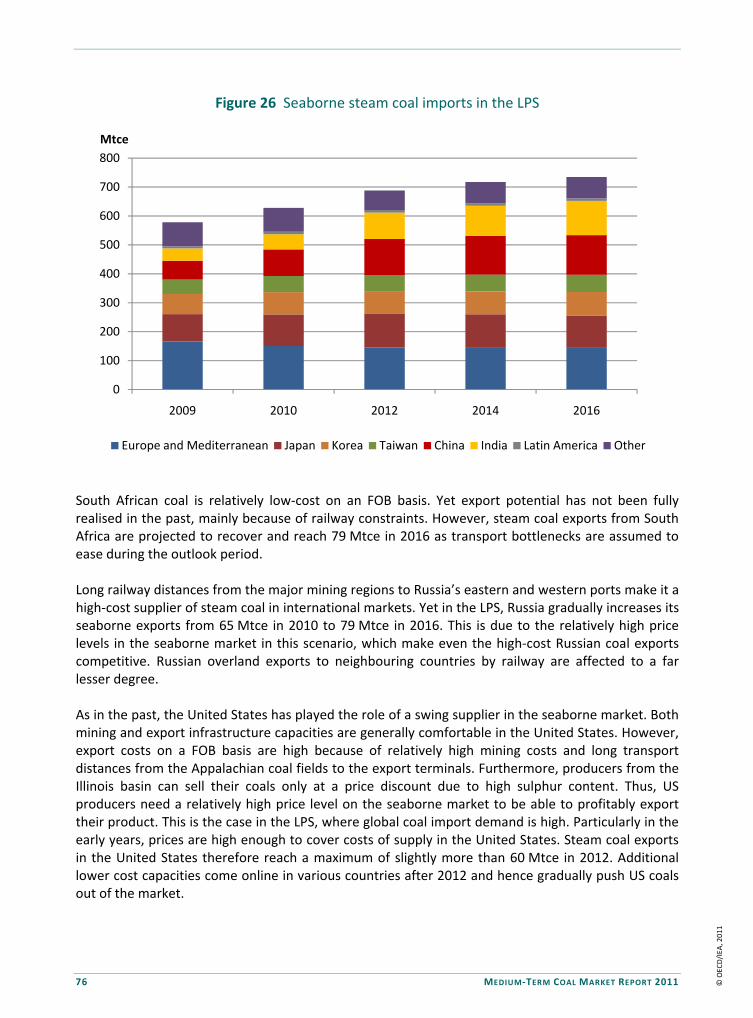
76 MEDIUM‐TERM COAL MARKET REPORT 2011
Figure 26 Seaborne steam coal imports in the LPS
South African coal is relatively low‐cost on an FOB basis. Yet export potential has not been fully realised in the past, mainly because of railway constraints. However, steam coal exports from South Africa are projected to recover and reach 79 Mtce in 2016 as transport bottlenecks are assumed to ease during the outlook period. Long railway distances from the major mining regions to Russia’s eastern and western ports make it a high‐cost supplier of steam coal in international markets. Yet in the LPS, Russia gradually increases its seaborne exports from 65 Mtce in 2010 to 79 Mtce in 2016. This is due to the relatively high price levels in the seaborne market in this scenario, which make even the high‐cost Russian coal exports competitive. Russian overland exports to neighbouring countries by railway are affected to a far lesser degree. As in the past, the United States has played the role of a swing supplier in the seaborne market. Both mining and export infrastructure capacities are generally comfortable in the United States. However, export costs on a FOB basis are high because of relatively high mining costs and long transport distances from the Appalachian coal fields to the export terminals. Furthermore, producers from the Illinois basin can sell their coals only at a price discount due to high sulphur content. Thus, US producers need a relatively high price level on the seaborne market to be able to profitably export their product. This is the case in the LPS, where global coal import demand is high. Particularly in the early years, prices are high enough to cover costs of supply in the United States. Steam coal exports in the United States therefore reach a maximum of slightly more than 60 Mtce in 2012. Additional lower cost capacities come online in various countries after 2012 and hence gradually push US coals out of the market.
0
100
200
300
400
500
600
700
800
2009 2010 2012 2014 2016
Mtce
Europe and Mediterranean Japan Korea Taiwan China India Latin America Other
© O
ECD
/IEA
, 201
1

MEDIUM‐TERM COAL MARKET REPORT 2011 77
Figure 27 Seaborne steam coal exports in the LPS
Various smaller players, e.g. Venezuela, Vietnam and Mozambique, are summarised in the group “others”. This group is heterogeneous in terms of export development. While Vietnam reduces its exports over the outlook period because of domestic coal needs, Venezuela is expected to recover and slightly increase its exports. Further, with the beginning of metallurgical coal production in Mozambique in 2011 also small volumes of steam coal are supplied to the international market. HPS
In the HPS, Chinese imports are projected to drop more rapidly in the first half than in the latter half of the outlook period. This is based on the assumption that Chinese industry reorganisation measures become effective sooner than in the LPS and thus production is ramped up more quickly. Although Chinese steam coal imports drop from 92 Mtce in 2010 to 33 Mtce in 2016, total seaborne trade volume is still projected to slightly increase in this scenario from 628 Mtce in 2010 to 664 Mtce in 2016. Most of this growth can be attributed to India. In this scenario, India increases its steam coal imports from 53 Mtce in 2010 to 148 Mtce in 2016 and becomes the largest steam coal importer. This implies an average growth rate of around 19% per annum. In comparison with the LPS, Indian imports are higher in this scenario (by about 30 Mtce in 2016). The main driver for these increased imports is the cost advantage that imported coal gains over a part of domestic Indian coal production, particularly in coastal demand hubs, as the seaborne market is not as tight in the HPS. Price reactions in other importing regions are minor and hence their development of imports over the outlook period is similar to the LPS. In sum, imports in Europe and Mediterranean countries decline slightly and imports remain flat in Japan, with some growth coming from Korea and Chinese Taipei.
0
100
200
300
400
500
600
700
800
2009 2010 2012 2014 2016
Mtce
Australia Indonesia Russia Other China South Africa Colombia United States
© O
ECD
/IEA
, 201
1
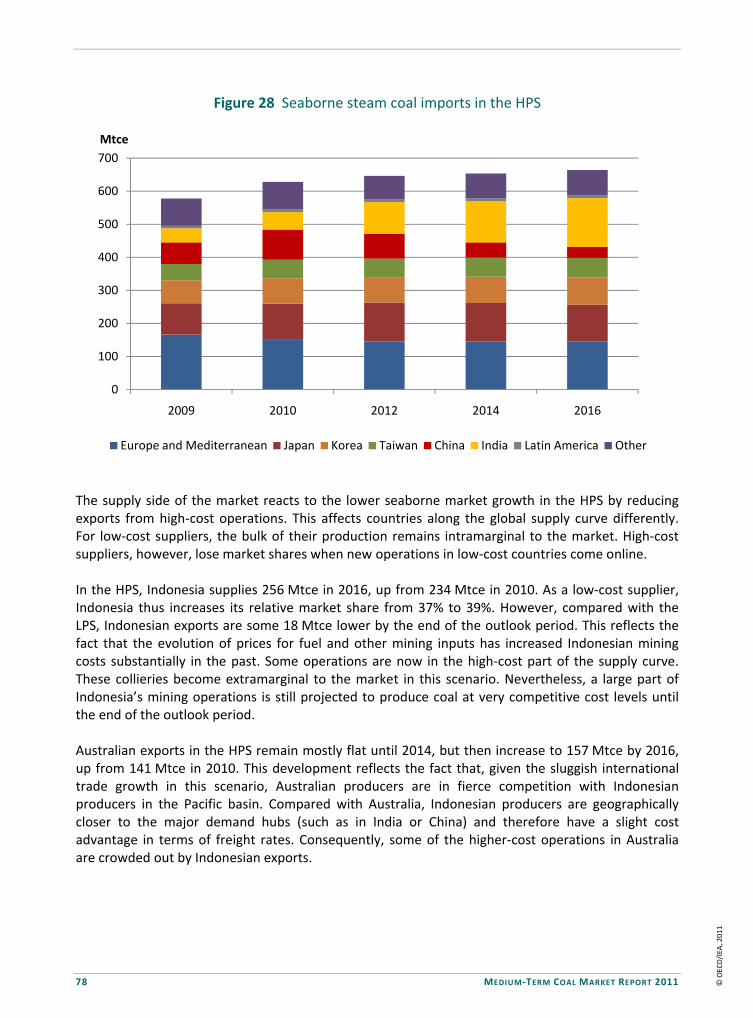
78 MEDIUM‐TERM COAL MARKET REPORT 2011
Figure 28 Seaborne steam coal imports in the HPS
The supply side of the market reacts to the lower seaborne market growth in the HPS by reducing exports from high‐cost operations. This affects countries along the global supply curve differently. For low‐cost suppliers, the bulk of their production remains intramarginal to the market. High‐cost suppliers, however, lose market shares when new operations in low‐cost countries come online. In the HPS, Indonesia supplies 256 Mtce in 2016, up from 234 Mtce in 2010. As a low‐cost supplier, Indonesia thus increases its relative market share from 37% to 39%. However, compared with the LPS, Indonesian exports are some 18 Mtce lower by the end of the outlook period. This reflects the fact that the evolution of prices for fuel and other mining inputs has increased Indonesian mining costs substantially in the past. Some operations are now in the high‐cost part of the supply curve. These collieries become extramarginal to the market in this scenario. Nevertheless, a large part of Indonesia’s mining operations is still projected to produce coal at very competitive cost levels until the end of the outlook period. Australian exports in the HPS remain mostly flat until 2014, but then increase to 157 Mtce by 2016, up from 141 Mtce in 2010. This development reflects the fact that, given the sluggish international trade growth in this scenario, Australian producers are in fierce competition with Indonesian producers in the Pacific basin. Compared with Australia, Indonesian producers are geographically closer to the major demand hubs (such as in India or China) and therefore have a slight cost advantage in terms of freight rates. Consequently, some of the higher‐cost operations in Australia are crowded out by Indonesian exports.
0
100
200
300
400
500
600
700
2009 2010 2012 2014 2016
Mtce
Europe and Mediterranean Japan Korea Taiwan China India Latin America Other
© O
ECD
/IEA
, 201
1

MEDIUM‐TERM COAL MARKET REPORT 2011 79
Figure 29 Seaborne steam coal exports in the HPS
South Africa, another major player, increases its exports slightly in this scenario; growing by up to 10 Mtce in the early years and then dropping by 5 Mtce in 2016, as the most expensive mines are driven out of the market because of low international demand. Russian seaborne exports stagnate over the outlook period. Although Russia is a high‐cost supplier both in the Atlantic and the Pacific basins, its exports are not crowded out by other suppliers. There are two reasons for this: first, Russian railway tariffs (the major cost component) are assumed to increase only moderately over the outlook period. Given that coal transport tariffs are currently cross‐subsidised by oil transport tariffs to some extent, this situation may also change once oil haulage via railways declines in Russia. Second, Russian FOB costs are among the highest in the market, but export ports in the East and the West are located close to the major demand regions in the Atlantic (Europe) and Pacific basins (Korea, Japan, China). Hence, Russian producers have a sea‐freight cost advantage and can successfully compete against other high‐cost suppliers such as the United States. US steam coal exports peak in 2012 at 42 Mtce, up from 14 Mtce in 2010. This is some 18 Mtce less than in the LPS. By the end of the outlook period, all US export capacities are extramarginal to the maritime market, as US supply costs are too high. The evolution of US exports is closely related to the strong increase in Colombian exports in this scenario. Colombian exports reach 91 Mtce in 2014 and remain on this level thereafter. Colombian FOB costs are among the lowest in the world and export terminals on the Caribbean are well positioned to ship the product to Europe and Mediterranean countries. However, recently Colombia has begun to ship its product to the Pacific market as well, and once the Panama Canal expansion is finished, trade with Asian‐Pacific buyers will further increase. Yet, with new Colombian capacities coming online, competition in the saturated Atlantic market gets fiercer. Consequently, US exporters are driven out of the market and Russian exporters are impeded from increasing their exports to Europe and the Mediterranean countries.
0
100
200
300
400
500
600
700
2009 2010 2012 2014 2016
Mtce
Australia Indonesia Russia China Other South Africa Colombia United States
© O
ECD
/IEA
, 201
1

80 MEDIUM‐TERM COAL MARKET REPORT 2011
Projections of seaborne metallurgical coal trade
Different levels of Chinese hard coal production in the two scenarios affect metallurgical coal trade more than steam coal trade. The price premium paid for high quality metallurgical coal (such as hard coking coals) usually justifies more costly mining, under difficult geological conditions and/or without economies of scale. Mining costs for metallurgical coal have increased rapidly in China; the majority of coking coal resources are deeper than 400 metres and thus only suitable for underground operations. Therefore project development delays in China, as well as delays in the implementation of restructuring measures, are likely to affect Chinese metallurgical coal output to a higher degree. Furthermore, the range of coal qualities suitable for metallurgical purposes is smaller than for electricity generation and thus low production levels in a number of operations are more difficult to compensate by higher production levels in other operations. In the LPS, metallurgical coal imports therefore increase by 65% over the outlook period while steam coal imports increase by 49%. Since much of this additional demand is served by overland imports from Mongolia, Chinese seaborne metallurgical imports increase only by 26% until 2016. In this scenario, total metallurgical maritime trade stands at 303 Mtce in 2016, up from 228 Mtce in 2010 (+33%). In the HPS, Chinese metallurgical coal output ramps up quickly. Yet Chinese metallurgical coal import needs drop only by 19% compared with the drop of 64% in steam coal. The decrease in Chinese metallurgical coal imports fully feeds back to maritime trade. In this scenario, seaborne metallurgical trade increases to 266 Mtce by the end of the outlook period (+17%). LPS
Chinese seaborne metallurgical coal imports increase from 34 Mtce in 2010 to 43 Mtce in 2016. This implies an average annual growth rate of 4%. However, total Chinese met coal imports (including overland shipments) are 73 Mtce in 2016, up from 44 Mtce in 2010. This corresponds to an average annual growth rate of 8.7%. Overland imports of metallurgical coal come exclusively from Mongolia, and increase significantly over the outlook period, from about 10 Mtce in 2010 to 30 Mtce in 2016. The majority of these imports are of hard coking coal quality. Indian imports double from 28 Mtce in 2010 to 56 Mtce in 2016. Thus, with an average growth rate of 12.1% per annum, India is the fastest growing importer in this market, as for steam coal. India has limited domestic metallurgical coal reserves and domestic production cannot keep up with the surging demand from India’s steel industry. Strong demand growth also comes from Latin America, where Brazil is the dominant importer of metallurgical coal. Brazil has high GDP growth rates and large reserves of domestic iron ore and is thus in a good position to increase its steel output over the outlook period. Contrary to steam coal import demand, Europe and the Mediterranean countries contribute substantially to total market growth in metallurgical coal trade. This region’s import demand grows by 22% from 61 Mtce in 2010 to 74 Mtce in 2016. Yet, demand growth is heterogeneous within this region. While import demand increases slowly in large European economies such as Germany or the United Kingdom, demand grows at higher rates in Eastern Europe, the Balkans and Turkey. Some demand growth also comes from Asian economies such as Korea, which have significant steel industries and almost no indigenous coal reserves.
© O
ECD
/IEA
, 201
1
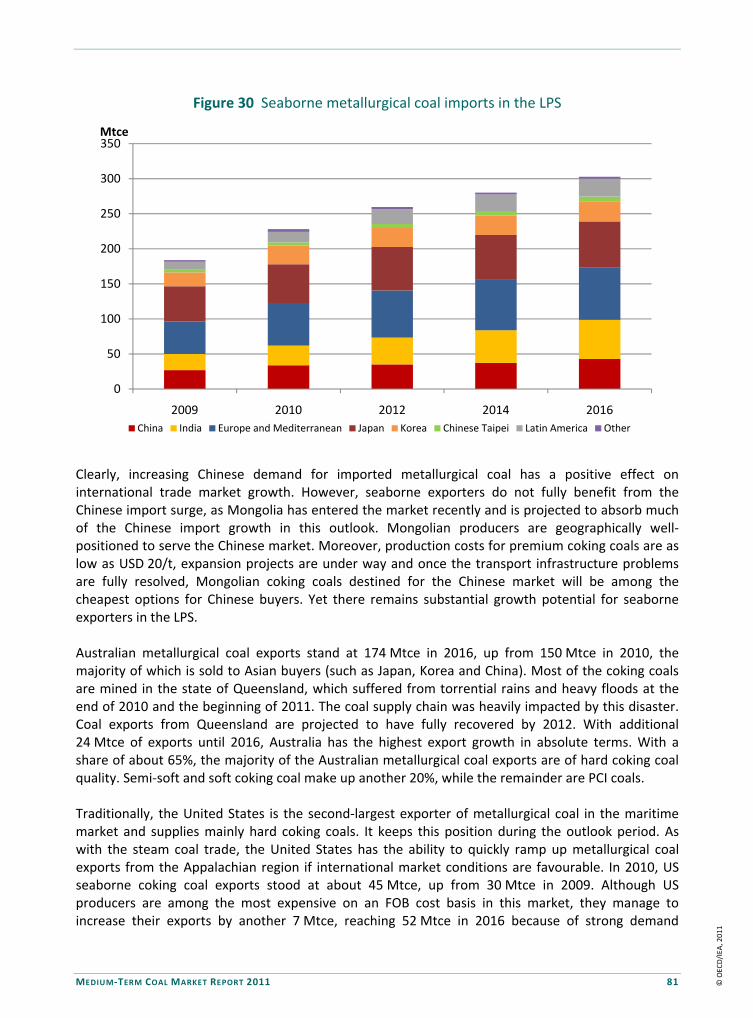
MEDIUM‐TERM COAL MARKET REPORT 2011 81
Figure 30 Seaborne metallurgical coal imports in the LPS
Clearly, increasing Chinese demand for imported metallurgical coal has a positive effect on international trade market growth. However, seaborne exporters do not fully benefit from the Chinese import surge, as Mongolia has entered the market recently and is projected to absorb much of the Chinese import growth in this outlook. Mongolian producers are geographically well‐positioned to serve the Chinese market. Moreover, production costs for premium coking coals are as low as USD 20/t, expansion projects are under way and once the transport infrastructure problems are fully resolved, Mongolian coking coals destined for the Chinese market will be among the cheapest options for Chinese buyers. Yet there remains substantial growth potential for seaborne exporters in the LPS. Australian metallurgical coal exports stand at 174 Mtce in 2016, up from 150 Mtce in 2010, the majority of which is sold to Asian buyers (such as Japan, Korea and China). Most of the coking coals are mined in the state of Queensland, which suffered from torrential rains and heavy floods at the end of 2010 and the beginning of 2011. The coal supply chain was heavily impacted by this disaster. Coal exports from Queensland are projected to have fully recovered by 2012. With additional 24 Mtce of exports until 2016, Australia has the highest export growth in absolute terms. With a share of about 65%, the majority of the Australian metallurgical coal exports are of hard coking coal quality. Semi‐soft and soft coking coal make up another 20%, while the remainder are PCI coals. Traditionally, the United States is the second‐largest exporter of metallurgical coal in the maritime market and supplies mainly hard coking coals. It keeps this position during the outlook period. As with the steam coal trade, the United States has the ability to quickly ramp up metallurgical coal exports from the Appalachian region if international market conditions are favourable. In 2010, US seaborne coking coal exports stood at about 45 Mtce, up from 30 Mtce in 2009. Although US producers are among the most expensive on an FOB cost basis in this market, they manage to increase their exports by another 7 Mtce, reaching 52 Mtce in 2016 because of strong demand
0
50
100
150
200
250
300
350
2009 2010 2012 2014 2016
Mtce
China India Europe and Mediterranean Japan Korea Chinese Taipei Latin America Other
© O
ECD
/IEA
, 201
1
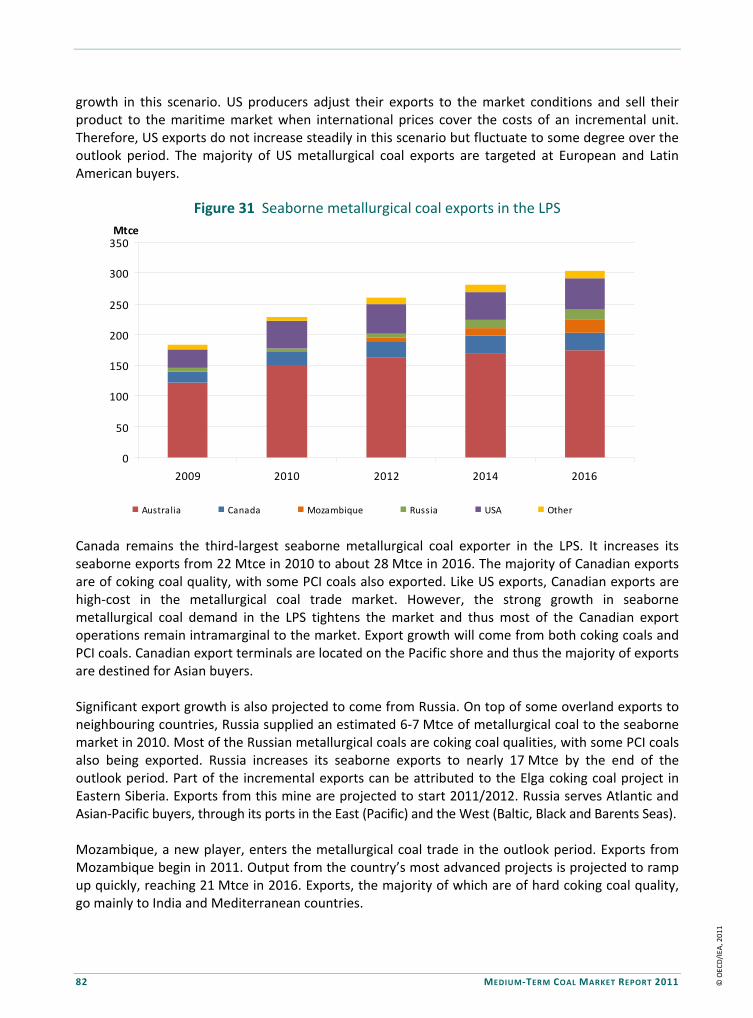
82 MEDIUM‐TERM COAL MARKET REPORT 2011
growth in this scenario. US producers adjust their exports to the market conditions and sell their product to the maritime market when international prices cover the costs of an incremental unit. Therefore, US exports do not increase steadily in this scenario but fluctuate to some degree over the outlook period. The majority of US metallurgical coal exports are targeted at European and Latin American buyers.
Figure 31 Seaborne metallurgical coal exports in the LPS
Canada remains the third‐largest seaborne metallurgical coal exporter in the LPS. It increases its seaborne exports from 22 Mtce in 2010 to about 28 Mtce in 2016. The majority of Canadian exports are of coking coal quality, with some PCI coals also exported. Like US exports, Canadian exports are high‐cost in the metallurgical coal trade market. However, the strong growth in seaborne metallurgical coal demand in the LPS tightens the market and thus most of the Canadian export operations remain intramarginal to the market. Export growth will come from both coking coals and PCI coals. Canadian export terminals are located on the Pacific shore and thus the majority of exports are destined for Asian buyers. Significant export growth is also projected to come from Russia. On top of some overland exports to neighbouring countries, Russia supplied an estimated 6‐7 Mtce of metallurgical coal to the seaborne market in 2010. Most of the Russian metallurgical coals are coking coal qualities, with some PCI coals also being exported. Russia increases its seaborne exports to nearly 17 Mtce by the end of the outlook period. Part of the incremental exports can be attributed to the Elga coking coal project in Eastern Siberia. Exports from this mine are projected to start 2011/2012. Russia serves Atlantic and Asian‐Pacific buyers, through its ports in the East (Pacific) and the West (Baltic, Black and Barents Seas). Mozambique, a new player, enters the metallurgical coal trade in the outlook period. Exports from Mozambique begin in 2011. Output from the country’s most advanced projects is projected to ramp up quickly, reaching 21 Mtce in 2016. Exports, the majority of which are of hard coking coal quality, go mainly to India and Mediterranean countries.
0
50
100
150
200
250
300
350
2009 2010 2012 2014 2016
Mtce
Australia Canada Mozambique Russia USA Other
© O
ECD
/IEA
, 201
1
MEDIUM‐TERM COAL MARKET REPORT 2011 83
The “others” group comprises of New Zealand, Poland, South Africa, Colombia and Indonesia. However, Poland is projected to cease exports over the outlook period. Out of the remaining countries, only New Zealand supplies significant hard coking coal qualities to the maritime market. Exports from New Zealand are 2‐3 Mtce and include some PCI coals as well. The other countries export small volumes of PCI, semi‐soft and soft coking coals to international buyers. With some metallurgical coal projects currently under revision in Indonesia (Lahai, Maruwai, Kalteng, Juloi, Lampunet and Tulup) and South Africa (Vele, Makhado) exports from these two countries are projected to increase slightly in the latter half of the outlook period.
HPS
In the HPS, domestic Chinese metallurgical coal output ramps up more quickly and hence import needs are reduced. This only affects seaborne Chinese imports, which drop from 34 Mtce in 2010 to 6 Mtce in 2016. This implies an average annual decline of 25.7%. On the other hand, total Chinese metallurgical coal imports (including overland trade) decline only by 8 Mtce, from 44 Mtce in 2010 to 36 Mtce in 2016. In this scenario, seaborne imports are more expensive than Mongolian import coals for Chinese steel mills. Hence, Mongolian exports to China increase to 30 Mtce in 2016 and remain fully intramarginal to the Chinese market. This is due to three reasons. First, Mongolian exports into China have a cost advantage since mining costs are low and transport costs decline with reduced truck haulage over the outlook period. Second, Mongolian coals are high‐quality coking coals and can thus substitute imports from Australia, Canada or the United States. Third, Mongolian producers are locked in to the Chinese market due to a lack of access to the international seaborne market. This gives Chinese steel mills a significant advantage in negotiation power and limits Mongolian metallurgical coal export prices. In the longer run, Mongolian coal fields may be connected to the Russian railway system and thus be able to export to Russia or to the seaborne market via Russian ports. Yet, this is unlikely to happen within the outlook period.
India becomes the largest metallurgical coal importer in the HPS, with imports amounting to 56 Mtce in 2016. Although the market is not as tight as in the LPS and therefore prices on the seaborne market are lower, Indian import demand is weakly price‐responsive because of the relatively low quality of Indian domestic metallurgical coals. Thus, in these scenarios, it is neither profitable to substitute premium quality imports by increased production of domestic Indian low quality coals nor the other way around. In other importing countries, domestic metallurgical coal production is too low to cause significant price reactions on import demand.
However, the lower market growth in the HPS causes marked reactions on the supply side. In this scenario, incumbent metallurgical coal suppliers are in fierce competition with market entrants such as Mongolia and Mozambique. High‐cost suppliers lose market shares while low‐cost producers can maintain or increase their market shares. Australia remains the dominant supplier of metallurgical coals, particularly hard coking coal, and increases its exports by 16 Mtce until 2016 in this scenario. Yet Australia’s market share is slightly reduced from 66% in 2010 to 63% in 2016. This is due to increased competition, mainly in the Pacific basin: Mongolia attracts Chinese buyers and thus lowers Chinese import demand and Mozambique enters the global seaborne supply cost curve on the low‐cost end. Mozambique also exports premium coking coal and is geographically well positioned to serve both Asian‐Pacific and Atlantic buyers. Metallurgical coal exports from Mozambique amount to 21 Mtce in 2016, giving the country a market share of 8%. Clearly, Mozambique has the potential to further increase its metallurgical coal production in the longer term and thus play an even more important role in metallurgical coal trade.
© O
ECD
/IEA
, 201
1

84 MEDIUM‐TERM COAL MARKET REPORT 2011
Figure 32 Seaborne metallurgical coal imports in the HPS
Figure 33 Seaborne metallurgical coal exports in the HPS
This development affects some high‐cost operations in Australia but has a more pronounced impact on the United States and Canada, where export costs are generally high. In the HPS, Canada loses significant market shares. From a geographical position, Canadian exports are targeted at Asian‐Pacific buyers and thus Canada’s major competitor is Australia, which in general has a cost advantage
0
50
100
150
200
250
300
350
2009 2010 2012 2014 2016
Mtce
China India Europe and Mediterranean Japan Korea Chinese Taipei Latin America Other
0
50
100
150
200
250
300
350
2009 2010 2012 2014 2016
Mtce
Australia Canada Mozambique Russia USA Other
© O
ECD
/IEA
, 201
1
MEDIUM‐TERM COAL MARKET REPORT 2011 85
in the Pacific basin. Canadian seaborne exports drop to around 13 Mtce in 2016 from 22 Mtce in 2010. As a result, Canada’s market share in maritime metallurgical coal trade drops from 10% in 2010 to 5% in 2016.
Box 7 Big brother is watching you – government interventions in coal trade
Whereas there is not a group such as OPEC to establish coal production quota and coal subsidies are small compared to those provided to other fossil fuels, this does not mean coal to be free from governments interventions.
In recent years, several major national players have started to implement a variety of regimes or taxes, aiming either to skim producer rents of mining companies, to ensure domestic security of supply, to conserve resources or to contain domestic coal prices.
Indonesia has enforced a domestic market obligation upon coal producers active in the country. In 2009, 8.3 million tonnes of coal was allocated for domestic use, or about 30% of forecasted production. For 2012, coal mining companies are obliged to sell 25% of their production to domestic users under the domestic market obligation ruling. Producers or traders not complying with the allocation rule face harsh cuts of their mining or trading licenses. Furthermore, Indonesia has put a decree into action that requires coal producers to use reference prices set by the government as benchmark for sales. Basically, this legislation corresponds to setting a floor price. Royalty payments will be calculated based on whichever is higher, the actual sales price or the reference price, in order to maximise government revenue. Additionally, Ministry of Trade officials have openly discussed a possible ban on exports of low‐grade coal of less than 5 700 kcal/kg (GAD), which are currently sold on the export market with a significant discount to higher rank coals. Such low‐rank coals make up around one third of total Indonesian coal supply and would have a significant impact on global thermal coal trade. However, given the scale of such an impact and the potential subsequent price reaction, such a strict ban is not likely be implemented by 2014.
Australia has faced a long debate about the introduction of a tax regime that levies revenues from mineral exports, which have been skyrocketing in recent years. The proposed tax regime for coal and iron ore is known by now as the Mineral Rent Resource Tax (MRRT) and is a replacement of the proposed resource super profits tax (RSPT). The MRRT would be levied at a rate of 30% of the operating margin but capital expenditure is compounded forward at the long‐term government bond rate plus 7%. The tax regime also foresees several exemptions and discounts, the most important of which is a 25% discount to the MRRT liability (extraction allowance) to further shield from tax the value added and capital that mining companies bring to mineral extraction.
China has increasingly made use of policy instruments, i.e. quotas and/or taxation, to tightly control participation of Chinese companies in the international coal trade market in recent years. First, political regulations require domestic mining companies to apply for special licenses that allow for a defined export volume. Quotas on steam coal are set and allocated by Chinese institutions in a biannual manner; nevertheless they may be subject to readjustments in case of political or economical requirements. For example, the total export volume restriction for steam coal in 2007 was 70 Mt and has been reduced to 50 Mt in 2010. Second, the Chinese government levies export and import taxes on steam coal. In 2008, export taxes were increased to 10%, compared with no export tariff for steam coal in 2007. Import taxes in 2010 stood at 17% for imported thermal coal. Coal is not the only mineral resource over which China is exerting control through taxes: most recently the State Council of China stated that it will implement a resource tax of 5%‐10% on sales of gas and oil. This tax will be expanded to rare earth elements and to coking coal.
© O
ECD
/IEA
, 201
1

86 MEDIUM‐TERM COAL MARKET REPORT 2011
US metallurgical coal exports to the seaborne market drop slightly from 45 Mtce in 2010 to 37 Mtce in 2016. Although also a high‐cost supplier on an FOB basis, the United States benefits from the fact that its export terminals on the East coast are well positioned to serve traditional buyers in Europe and the Mediterranean countries. In comparison with the LPS, US exports are 15 Mtce lower by the end of the outlook period, thus highlighting again the swing supplier role of US producers. Russian seaborne exports increase by about 11 Mtce in the HPS, reaching 17 Mtce by the end of the outlook period. Since mining costs are low for high‐quality coking coals in Russia, profitability of exports mainly depends on railway tariffs in a scenario with moderate demand growth. Therefore, escalating railway tariffs could hamper Russian metallurgical coal exports in the future. The majority of semi‐soft and soft coking coals as well as PCI coals of smaller exporters remain intramarginal to the seaborne market in the HPS.
References
Graham, P., S. Thorpe and L. Hogan (1999), “Non‐Competitive Behaviour in the International Coking Coal Market”, Energy Economics, Elsevier, Amsterdam, Vol. 21, pp. 195‐212. Paulus, M., J. Trüby, and C. Growitsch (2011), “Nations as Strategic Players in Global Commodity Markets: Evidence from World Coal Trade”, EWI working paper 11/04, Institute of Energy Economics, University of Cologne, Cologne. Paulus, M. and J. Trüby (2011), “Coal Lumps vs. Electrons: How do Chinese Bulk Energy Transport Decisions Affect the Global Steam Coal Market?”, Energy Economics, Elsevier, Amsterdam, (forthcoming). Trüby, J. and M. Paulus (2011), “Market Structure Scenarios in International Steam Coal Trade”, EWI working paper 11/02, Institute of Energy Economics, University of Cologne, Cologne.
© O
ECD
/IEA
, 201
1
MEDIUM‐TERM COAL MARKET REPORT 2011 87
UTILISATION OF EXPORT CAPACITY AND INVESTMENTS Summary
• Utilisation rates of export mining capacity differ between the exporting countries. Low‐cost suppliers such as Indonesia, Colombia, South Africa and Australia constantly realise mining capacity utilisation rates of 80% or more. High‐cost swing suppliers usually realise lower utilisation rates, which fluctuate depending on the tightness of the international trade market.
• Utilisation of hard coal export terminals follows a similar pattern: base suppliers
realise high utilisation rates and swing or fringe suppliers realise lower utilisation rates. Poland and the United States have been major exporters in the past and thus have large‐scale export infrastructure that is only partially utilised.
• Investment pipelines are healthy, with substantial additions to both mining and
infrastructure capacity scheduled to come online over the medium term. Incremental port capacity reaches around 240 Mtpa in 2016, and mine expansion currently already under construction or committed accounts for around 140 Mtpa, with another 280 Mtpa of potential mine expansions in the same time period.
• Investments in coal supply optimally require the coordinated expansion of
several supply chain components (e.g. mines, railway lines and ports). This process usually involves various stakeholders with differing objectives and financial capabilities. As a result, supporting investments are often delayed, causing temporary bottlenecks and overcapacities.
• The high prices for coking coals have attracted investors to develop
metallurgical coal projects all over the world. Apart from Australia, significant new operations are likely to come online in Mozambique and Russia.
• New projects often move away from existing operations and therefore require
parallel infrastructure development, as the examples of Mozambique, Russia and the Galilee basin in Australia show.
Strategic foreign direct investment into coal supply is booming. Indian and
Chinese companies, especially, secure their future coal needs by investing directly in operations abroad, mainly in Australia, Indonesia and Mozambique.
Utilisation of export capacity in 2009-2010
The supply chain of seaborne traded hard coal consists of mining; domestic transport usually by railway, truck or river barge; coal loading at a coal terminal; and finally sea haulage using dry bulk carriers to demand centres. Bottlenecks in any of these links will limit the overall throughput capacity. To ensure supply chain efficiency and optimal utilisation of invested capital, an integrated
© O
ECD
/IEA
, 201
1

88 MEDIUM‐TERM COAL MARKET REPORT 2011
plan to calibrate utilisation and investments into new capacity is important. Such plans are difficult to develop and implement because of technical parameters and stakeholders’ diverging objectives. The main technical challenge is the low elasticity of transport infrastructure capacity. In case of a demand shock, transport infrastructure expansion may take at least several years to realise, which may lead to regional bottlenecks in coal transportation or port throughput. Moreover, lead times for mine expansions are often lower than for transport infrastructure expansions. Mining operations can realise some quick output gains if they employ even more machinery or an extra shift.14 Also, brownfield expansions – the expansion of an already existing colliery – can often be implemented rapidly, as the basic mine facilities are already in place. Therefore, if mine and infrastructure investment plans are not well balanced, bottlenecks in coal transport may arise when mine capacity comes online more rapidly than export infrastructure capacity.15 Another major factor is differences in the objectives of stakeholders of the coal supply chain. For example, if railways belong to state‐owned enterprises, coal freight rates might not reflect competitive freight prices and be subsidised or cross‐subsidised by other operations or higher‐value commodities such as oil.16 Such subsidies reduce incentives for state‐owned companies to invest in their coal railway systems as it will further increase their asset base they have to cross‐subsidise. There are, of course, examples of government‐owned corporations that manage investments more efficiently and realign their expansion plans more rapidly to changes in demand, such as the different government‐owned port co‐operations in Queensland or in New South Wales (e.g. Newcastle). All in all, balancing investments into the different links of the coal supply chain is a challenging task. As demand will probably remain strong in the next years and transport infrastructure in several major coal exporting countries is already utilised to the practical maximum, it will be important that investments in export infrastructure take place in a timely manner to allow the most cost‐efficient suppliers to exploit their full potential, without relying more on the high‐cost capacities of swing suppliers. Utilisation of export mine capacity
Export‐oriented hard coal mining capacity consists of collieries that produce exportable qualities of hard coal (high calorific value, mostly low ash) and have access to export transport infrastructure. Export oriented hard coal mining capacity was around 1 150 Mtpa in 2010, an increase of around 8% compared with 2009. Roughly 25% of this is metallurgical mining capacity and the remainder is thermal coal capacity. Utilisation of global export mine capacity remained on a high level of around 80% in 2009, due to trade market growth despite the financial crisis. In 2010, export mine utilisation increased to 84% despite capacity additions of around 90 Mtpa, as import demand in OECD Europe and OECD Pacific rebounded and Chinese and Indian imports also grew rapidly. Regarding their export mine capacity utilisation, individual countries can be broadly divided into three categories: The first category consists of the major coal exporters, which are typically base suppliers to the market due to competitive production costs or their geographical location. Usually
14 Operating a mine above its designed capacity will of course reduce efficiency and increase unit costs of production. 15 This is currently the case in South Africa, where domestic railway investments cannot keep up with investments into port and mining capacity. 16 This could be the case, for example, in South Africa and Russia. South African Transnet not only operates railway transports but also ports and petroleum pipelines, which account for the largest share of its profits. In Russia, the state-owned railway company RZD probably cross-subsidises its low profitability coal railings through the tariffs for their oil haulage.
© O
ECD
/IEA
, 201
1
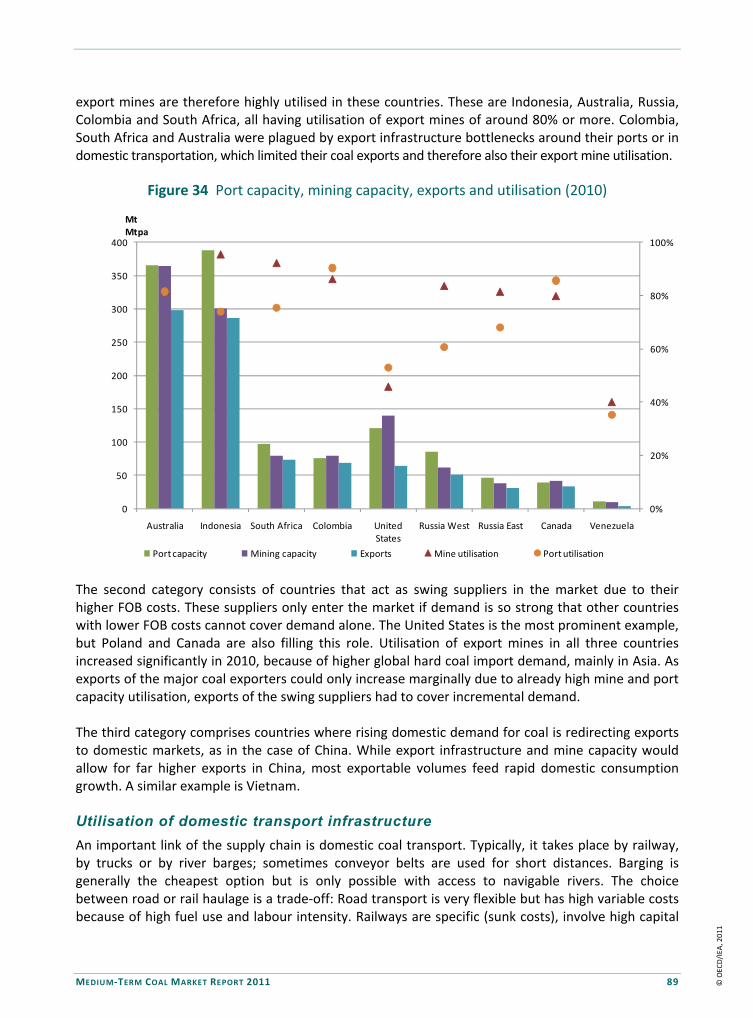
MEDIUM‐TERM COAL MARKET REPORT 2011 89
export mines are therefore highly utilised in these countries. These are Indonesia, Australia, Russia, Colombia and South Africa, all having utilisation of export mines of around 80% or more. Colombia, South Africa and Australia were plagued by export infrastructure bottlenecks around their ports or in domestic transportation, which limited their coal exports and therefore also their export mine utilisation.
Figure 34 Port capacity, mining capacity, exports and utilisation (2010)
The second category consists of countries that act as swing suppliers in the market due to their higher FOB costs. These suppliers only enter the market if demand is so strong that other countries with lower FOB costs cannot cover demand alone. The United States is the most prominent example, but Poland and Canada are also filling this role. Utilisation of export mines in all three countries increased significantly in 2010, because of higher global hard coal import demand, mainly in Asia. As exports of the major coal exporters could only increase marginally due to already high mine and port capacity utilisation, exports of the swing suppliers had to cover incremental demand. The third category comprises countries where rising domestic demand for coal is redirecting exports to domestic markets, as in the case of China. While export infrastructure and mine capacity would allow for far higher exports in China, most exportable volumes feed rapid domestic consumption growth. A similar example is Vietnam. Utilisation of domestic transport infrastructure
An important link of the supply chain is domestic coal transport. Typically, it takes place by railway, by trucks or by river barges; sometimes conveyor belts are used for short distances. Barging is generally the cheapest option but is only possible with access to navigable rivers. The choice between road or rail haulage is a trade‐off: Road transport is very flexible but has high variable costs because of high fuel use and labour intensity. Railways are specific (sunk costs), involve high capital
0%
20%
40%
60%
80%
100%
0
50
100
150
200
250
300
350
400
Australia Indonesia South Africa Colombia United States
Russia West Russia East Canada Venezuela
Port capacity Mining capacity Exports Mine utilisation Port utilisation
MtMtpa
© O
ECD
/IEA
, 201
1
90 MEDIUM‐TERM COAL MARKET REPORT 2011
investment and have long lead times but variable transport costs are low. Consequently, road haulage is optimal for small quantities and short distances, while railways are optimal for large quantities and long distances. Greenfield mine projects often rely on truck haulage before full production capacity is operational and railway access is provided. Domestic transport costs can make up a significant part of total FOB coal supply costs, depending on distances: Indonesian and Colombian mining operations generally face very low domestic transport costs of USD 4/t to USD 8/t due to low‐cost river transport (Indonesia) and short haulage distances. In Colombia, transport distances from the major coal deposits to the export terminals on the Caribbean are well below 300 km. Countries such as Australia and South Africa have transport costs between USD 8/t and USD 15/t as transport has to rely on railways and distances are longer. In South Africa, for example, the coal fields of the Central basin, the major mining region for exports, are almost 600 km from Richards Bay Coal Terminal. Railway tariffs fall in a range of USD 10/t to USD 15/t on this line. Inland transport costs are significantly higher in the United States. Transport distances are 600 km‐1 350 km (rail) from Central Appalachia to the Atlantic ports and around 1 000 km (barge) from the Illinois basin to the ports on the US Gulf coast. Haulage costs for US exporters fall in the range of USD 20/t to USD 30/t. In Russia, transport costs have almost doubled in the last five years and are now around USD 35/t for the 4 000 km from the Kuzbass mining region to the ports in the east and the west. As mining operations move deeper inland due to the depletion of deposits near the coast, domestic transport costs will rise. Furthermore, bottlenecks in railway capacity have become a major issue in recent years, for example in South Africa, or the railway line linking the Russian Kuzbass mining region with the Pacific terminals (VDKI, 2010). If international coal trade continues to grow, new transportation infrastructure will be required to connect new coal basins to the existing export infrastructure. Utilisation of port capacity
Coal turnover at the export terminal comprises the second main link in the coal supply chain, after domestic transport. While actual turnover and handling costs are mostly relatively low,17 between USD 2/t and USD 5/t, port throughput capacities are a critical bottleneck in the coal supply chain. Utilisation of port infrastructure was high in several of the major exporting countries in 2009. For example, more than 100 coal bulk carriers on average queued up at Australian ports during 2010, the main queues off Newcastle. Utilisation in some Russian export regions and South Africa has also been high, with figures of more than 80% in 2009. However, export terminals in several countries, mostly with high‐cost coal mining, such as Poland or the United States, still had plenty of spare port capacity remaining, indicating that security of supply had not been endangered. Apart from supply economics, another reason for the relatively low utilisation of ports in the United States is the difficulty of effective co‐ordination between rail operators and the port authorities responsible for loading schedules, due to limited coal storage space, especially in eastern ports that export high volumes of coking coal, each type of which needs to be stored individually.
17 This is true but for Russia, where port handling costs are higher. This is particularly the case for Russian coal exports via the Latvian ports where additional charges can increase turnover costs to 10 USD/t and more.
© O
ECD
/IEA
, 201
1

MEDIUM‐TERM COAL MARKET REPORT 2011 91
In 2010, port utilisation further increased, also in high‐cost coal mining countries. This increase in utilisation can be attributed to strong seaborne hard coal demand, mostly driven by rebounding coal imports in Europe but especially by rapidly growing Chinese and Indian hard coal imports. Therefore the trade market became tighter in 2010, as even swing suppliers such as the United States and Poland increased their exports. Russian export utilisation dropped in the west but increased in the east, due to strong Asian coal import demand. South African port utilisation actually decreased substantially in 2010, because of the expansion of Richards Bay Coal Terminal.
Export capacity investments 2011-2016
Investments into port capacity and export mining capacity are normally associated with lead times of at least several years. Therefore, analysing expansion projects currently under construction or planned is a good estimator for export capacity developments in the coming years. This is especially true for port capacity investments, where lead times are normally longer than for mine capacity investment projects. The overview of investments until 2016 draws the picture of a rapidly expanding production and delivery capacity, with investments in practically all the major coal exporting countries. Incremental port capacity reaches around 240 Mtpa in 2016 and mine expansion currently already under construction or committed accounts for around 140 Mtpa, with another 280 Mtpa of potential mine expansions in the same time period. If all probable mine expansions are realised as planned, export capacity will increase by 12% by 2016; if all probable and potential projects come online, mining capacity will increase by 37%. Port and domestic transport capacity investments
In recent years, port expansions have been realised in various countries. Several further significant port capacity expansion projects are being developed and constructed in the coming five years. Worldwide, an additional 240 Mtpa, or 19%, of export terminal capacity is estimated to come online by 2016. The majority of the projects are under way in traditional exporting countries such as Australia, South Africa, Colombia or Russia. Ideally, the expansion of different supply chain components is well co‐ordinated. Yet with such large infrastructure projects, short‐term overcapacities or bottlenecks are difficult to avoid. Port bottlenecks should ease if these capacities come online as projected. Some representative export capacity expansion projects in various countries are described in detail below.
© O
ECD
/IEA
, 201
1
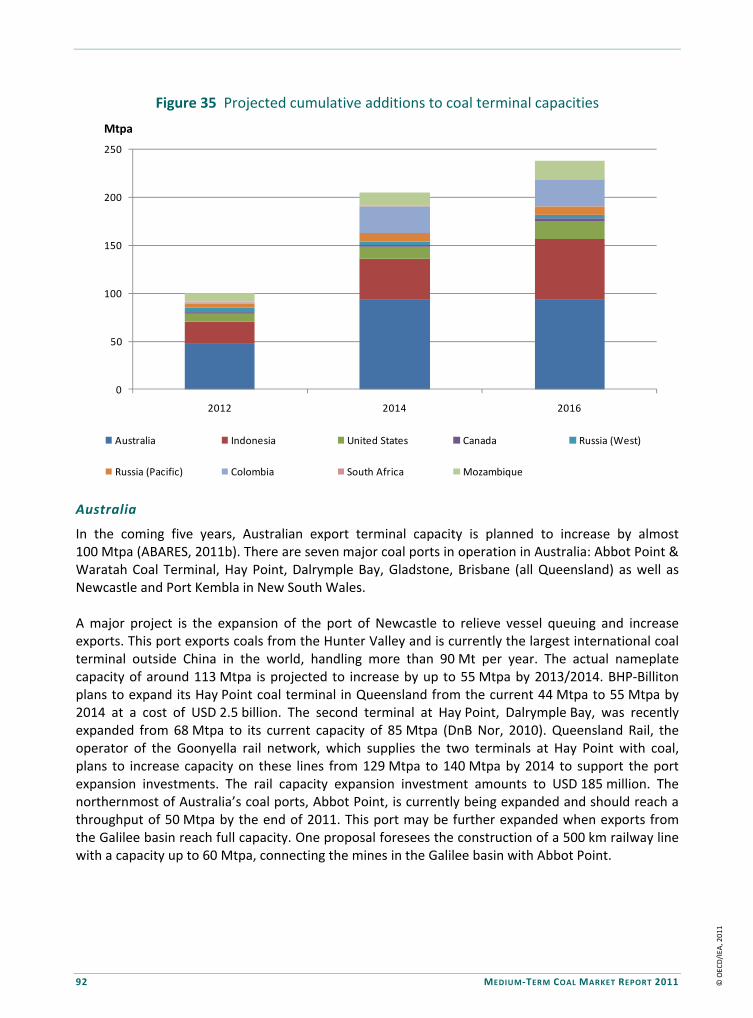
92 MEDIUM‐TERM COAL MARKET REPORT 2011
Figure 35 Projected cumulative additions to coal terminal capacities
Australia
In the coming five years, Australian export terminal capacity is planned to increase by almost 100 Mtpa (ABARES, 2011b). There are seven major coal ports in operation in Australia: Abbot Point & Waratah Coal Terminal, Hay Point, Dalrymple Bay, Gladstone, Brisbane (all Queensland) as well as Newcastle and Port Kembla in New South Wales. A major project is the expansion of the port of Newcastle to relieve vessel queuing and increase exports. This port exports coals from the Hunter Valley and is currently the largest international coal terminal outside China in the world, handling more than 90 Mt per year. The actual nameplate capacity of around 113 Mtpa is projected to increase by up to 55 Mtpa by 2013/2014. BHP‐Billiton plans to expand its Hay Point coal terminal in Queensland from the current 44 Mtpa to 55 Mtpa by 2014 at a cost of USD 2.5 billion. The second terminal at Hay Point, Dalrymple Bay, was recently expanded from 68 Mtpa to its current capacity of 85 Mtpa (DnB Nor, 2010). Queensland Rail, the operator of the Goonyella rail network, which supplies the two terminals at Hay Point with coal, plans to increase capacity on these lines from 129 Mtpa to 140 Mtpa by 2014 to support the port expansion investments. The rail capacity expansion investment amounts to USD 185 million. The northernmost of Australia’s coal ports, Abbot Point, is currently being expanded and should reach a throughput of 50 Mtpa by the end of 2011. This port may be further expanded when exports from the Galilee basin reach full capacity. One proposal foresees the construction of a 500 km railway line with a capacity up to 60 Mtpa, connecting the mines in the Galilee basin with Abbot Point.
0
50
100
150
200
250
2012 2014 2016
Australia Indonesia United States Canada Russia (West)
Russia (Pacific) Colombia South Africa Mozambique
Mtpa
© O
ECD
/IEA
, 201
1

MEDIUM‐TERM COAL MARKET REPORT 2011 93
South Africa and Mozambique
South Africa’s major export port, Richards Bay Coal Terminal, has recently been expanded at a cost of around USD 150 million, increasing its capacity from 76 Mt to 91 Mt in 2009; however, railway capacity linking the coal terminal to the coal fields in the Central basin will be the constraining factor in the next years. Transnet has committed itself to increase the capacity of the railway line up to 81 Mtpa by 2015. This requires an expenditure of USD 2 billion, of which about half is for the acquisition of new rolling stock. In Mozambique, the ports of Beira and Maputo are under construction. Matola coal terminal in Maputo, which is mainly handling South African exports, has been upgraded to a capacity of 6 Mtpa in 2011. The port of Beira is currently expanded to 6 Mtpa and in the longer run the government is planning a new terminal at Beira that should be able to handle 18 Mtpa to 24 Mtpa. Coal is transported via the 665 km Sena railway line, which links the Tete coal fields to the port of Beira. This line is currently being rehabilitated to a capacity of up to 8 Mtpa at a cost of about USD 475 million. Feasibility studies for barging on the Zambeze River are also under way. In total, coal terminal capacity in South Africa and Mozambique is estimated to increase by 22 Mtpa by 2016. Russia
With regard to the strong demand growth in the Pacific basin, several Russian Far Eastern ports are being expanded. Vanino, the second largest coal port in Russia, has a nameplate capacity of 13.5 Mtpa and will be expanded to handle 18.5 Mtpa by 2013. Mechel owns a terminal at Vanino that will be further upgraded and through which the company plans to export its metallurgical coal output from the Elga mine in Yakutia. To do so, a 315 km railway line is under construction that links the mine to the Russian railway system. Investment costs for the interconnection, which has a capacity of 25 Mtpa, are around USD 1.4 billion. The Russian Far Eastern port of Posiet is also being expanded from 5 Mtpa to 7‐9 Mtpa by the end of 2012. Taking into account various other projects, Russian export terminal capacity is projected to increase by about 13 Mtpa over the next five years. Colombia
Several Colombian ports will be upgraded in the coming years. Most are in the region of Santa Marta and Ciénaga. The capacity of Puerto Drummond, through which output from Drummond’s operations in the César region is exported, will be increased by 6 Mtpa to 27 Mtpa by 2013/2014 (DnB Nor, 2010). Puerto Nuevo, a greenfield port project near Santa Marta, is planned to reach a capacity of 23 Mtpa by 2013/2014 (DnB Nor, 2010). Total investments for this project are around USD 550 million. Fenoco Railways, the company that operates the railway between the César deposits and the ports near Ciénaga and Santa Marta, is expanding the capacity on this line from 42‐44 Mtpa to 88 Mtpa. Construction works are scheduled to be finished by the end of 2013. The Brazilian mining company MPX is developing a vertically integrated export project in Colombia. To export the product of four new mines, a new port near Dibulla (on the Caribbean shoreline) is under construction. The first stage of the port project will lead to a capacity of 10 Mtpa by 2013/2014 and requires a capital expenditure of USD 284 million. At the outset, coal may be exported via the ports of Santa Marta and Ciénaga. In this case, truck haulage will cost about USD 15/t. Truck haulage distances will be considerably lower (150 km) when the first stage of the MPX port is finished; this will reduce inland transport costs to around USD 8/t. Furthermore, a
© O
ECD
/IEA
, 201
1

94 MEDIUM‐TERM COAL MARKET REPORT 2011
railway line linking the mines to the new port is under development and scheduled to be finished after 2016. The capital expenditure for this line is estimated at USD 340 million (MPX, 2010). Taking lead times and delays into account, total Colombian port capacity is estimated to increase by 28 Mtpa by 2016. In principle, Colombia, with its access to both the Atlantic and the Pacific, is geographically well positioned to serve the growing Asian coal import demand hubs. However, the infrastructure is so far fully dedicated to the Atlantic market, with all export terminals located on the Caribbean shoreline. The eastern route to Chinese ports is almost double the distance that South African coal shipments have to traverse. The Pacific route is 4 500 miles shorter, but the Panama Canal has been a bottleneck and could so far only accommodate smaller dry bulk vessels. However, Colombia’s transport disadvantage to supply Asian coal demand will improve over the outlook period: the Panama Canal expansion is projected to be completed by 2014. This will allow substantially larger bulk carriers to cross the canal. These larger carriers will be able to ship coal at significantly lower transport costs to China and other Asian‐Pacific buyers. Also, China and Colombia entered talks in February 2011 about building a 220 km railway to allow goods to be moved between the Colombian port city of Cartagena and the Pacific Ocean. This railway line could facilitate exports of Colombian coal to China and provide an alternative to coal shipments via the Panama Canal. Indonesia
Indonesian port capacity is estimated to increase by more than 60 Mtpa over the outlook period. Unfortunately, Indonesian infrastructure development projects are generally non‐transparent and data is poor. In the past, port and inland transport infrastructure could keep up with production increases because mines are close to the shoreline (coal is transported by trucks or by conveyor belts) and a system of navigable rivers. Exports are handled by a comparatively large number of different ports. Currently, two operations can directly load coal onto ocean‐going vessels. It is expected that this relatively unconstrained infrastructure situation will persist over the outlook period. In the future, mining operations will move farther inland in Sumatra as well as in Kalimantan. An example is the Adani/PTBA project in Sumatra. The companies plan to construct a 250 km railway line to link the coal fields of Tanjung Enim to Tanjung Carat, where a port will be built. The railway line and the port will have a capacity of 35 Mtpa with the opportunity to ramp up to 60 Mtpa. Project costs are estimated to be around USD 1.65 billion and development time is expected to be four years. Although this project is primarily targeted at domestic customers, some volumes will also be exported. Moving farther away from the coastline or from navigable rivers usually does not imply the construction of a railway in Kalimantan since overland distances generally remain below 100 km over the outlook period. Many operations in Kalimantan rely on a mix of barging and trucking. Road haulage is relatively flexible and not as capital intensive as railways but variable costs are significant as well as severely exposed to fuel price fluctuations. This implies increasing inland transport costs also in Kalimantan. Export mine capacity investments
Coal mining investment slowed in the aftermath of the financial crisis in 2009 but resumed its strong upwards path during 2010. The share of investments directed to metallurgical coal projects increased recently, reflecting the widening price differential between steam coal and metallurgical coal. Significant additions to export mine capacity are projected to enter the market within the outlook
© O
ECD
/IEA
, 201
1
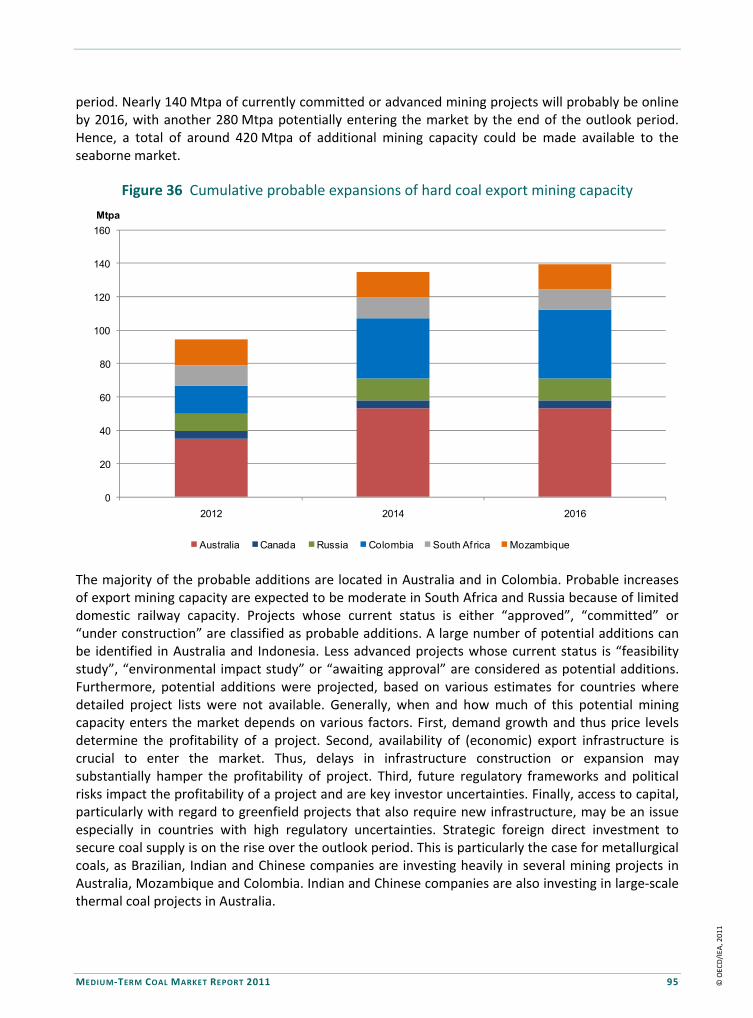
MEDIUM‐TERM COAL MARKET REPORT 2011 95
period. Nearly 140 Mtpa of currently committed or advanced mining projects will probably be online by 2016, with another 280 Mtpa potentially entering the market by the end of the outlook period. Hence, a total of around 420 Mtpa of additional mining capacity could be made available to the seaborne market.
Figure 36 Cumulative probable expansions of hard coal export mining capacity
The majority of the probable additions are located in Australia and in Colombia. Probable increases of export mining capacity are expected to be moderate in South Africa and Russia because of limited domestic railway capacity. Projects whose current status is either “approved”, “committed” or “under construction” are classified as probable additions. A large number of potential additions can be identified in Australia and Indonesia. Less advanced projects whose current status is “feasibility study”, “environmental impact study” or “awaiting approval” are considered as potential additions. Furthermore, potential additions were projected, based on various estimates for countries where detailed project lists were not available. Generally, when and how much of this potential mining capacity enters the market depends on various factors. First, demand growth and thus price levels determine the profitability of a project. Second, availability of (economic) export infrastructure is crucial to enter the market. Thus, delays in infrastructure construction or expansion may substantially hamper the profitability of project. Third, future regulatory frameworks and political risks impact the profitability of a project and are key investor uncertainties. Finally, access to capital, particularly with regard to greenfield projects that also require new infrastructure, may be an issue especially in countries with high regulatory uncertainties. Strategic foreign direct investment to secure coal supply is on the rise over the outlook period. This is particularly the case for metallurgical coals, as Brazilian, Indian and Chinese companies are investing heavily in several mining projects in Australia, Mozambique and Colombia. Indian and Chinese companies are also investing in large‐scale thermal coal projects in Australia.
0
20
40
60
80
100
120
140
160
2012 2014 2016
Mtpa
Australia Canada Russia Colombia South Af rica Mozambique
© O
ECD
/IEA
, 201
1

96 MEDIUM‐TERM COAL MARKET REPORT 2011
Figure 37 Cumulative potential expansions of hard coal export mining capacity
Australia
Australia’s probable export mining capacity additions are estimated at more than 50 Mtpa over the outlook period, with another 125 Mtpa being considered as potential additions. These figures relate to both steam and metallurgical coals. The majority of the probable additions can be found in mature mining regions such as the Hunter Valley, Bowen and Gunnedah basins, whereas the potential additions are mainly located in new basins such as Surat and Galilee. A project example for New South Wales, which is considered as a probable addition, is the Ravensworth North expansion project. This open‐cut mine in the Hunter Valley is expected to produce 8 Mtpa of steam coal and semi‐soft coking coal with a mine lifetime of 26 years. First coal production is scheduled for 2012 and total capital expenditure is USD 1.36 billion. Another example for New South Wales, which is considered probable, is expansion of the Narrabri coal mine, an underground mine in the Gunnedah basin. The expansion project is planned to yield an additional capacity of 4.5 Mtpa of steam coal for 27 years with production beginning in 2012. Coal will be mined with longwalling technology at an investment expense of USD 300 million. Two project examples for Queensland, which are classified as probable additions, are the Daunia and Kestrel collieries. The Daunia open‐cut mine (truck and shovel), a new project in the Bowen basin, will yield hard coking coal over 21 years and have a capacity of 4.5 Mtpa. Production is expected to commence in 2013 and project investment costs are USD 1.6 billion. The Kestrel mine, also in the Bowen basin, is being expanded at a cost of USD 1.1 billion. The expansion will yield an additional capacity of 1.7 Mtpa of coking coal (hard and semi‐soft as well as some steam coal). Lifetime of the longwall underground mine is expected to be 20 years with production starting in 2012/2013.
0
50
100
150
200
250
300
350
400
450
2012 2014 2016
Mtpa
Probable additional mine capacity Australia Indonesia Canada Russia Colombia South Africa Mozambique
© O
ECD
/IEA
, 201
1

MEDIUM‐TERM COAL MARKET REPORT 2011 97
Australia’s potential projects are often located in new basins (e.g. Surat and Galilee basins) that lack access or have only limited access to export infrastructure. A number of large‐scale mining projects are under way in the Galilee basin of Queensland. Tad’s Corner (Alpha) and Kevin’s Corner mining projects are planned to have a capacity of 30 Mtpa (steam coal) each when fully operational. Tad’s Corner (Alpha) is proposed as an open‐cast mine that will rely on draglines, while Kevin’s Corner is proposed as a mixed open‐cast and longwall operation. Operations could start by 2014 depending on approvals and the construction of the 500 km railway line to the port of Abbot Point. With calorific values of approximately 5800 kcal/kg, lower than the average Australian export steam coal, and inland transport distances of 500 km, more than the average Australian inland transport distance, the development of the Galilee basin is a good example of export mining operations moving farther inland and having lower coal qualities. An interesting feature of mining capacity expansion in Australia is the increasing amount of foreign direct investment, particularly from China and India, over the outlook period. Yancoal Australia, a fully owned subsidiary of Yanzhou Coal Mining Company, is developing eight projects in Australia with a total capacity of 48 Mtpa. The main players are Yancoal (China), GVK Energy (India) and Adani (India). Yancoal acquired Felix Resources (operator of two mines in the Bowen Basin and two mines in the Hunter Valley) in 2009 and has recently bought Syntech Resources (operator of one mine in the Surat basin). China Shenhua Energy is developing the 10 Mtpa Watermark project in New South Wales. The Indian company GVK Energy recently acquired a major stake in the Alpha (79%) and Kevin’s Corner (100%) mining and infrastructure projects in the Galilee basin. Indian mining company Adani is planning the USD 6.8 billion Carmichael mining and rail project in the Galilee basin, which should eventually yield up to 60 Mtpa of steam coal. Indian Gujarat NRE is developing two metallurgical coal mines in New South Wales with a capacity of about 3 Mtpa each.
Box 8 Digging deep into the Galilee Basin
The Galilee Basin in Queensland, Australia, is 500 km from the coast and contains vast reserves of coal with relatively low energy content, by Australian standards, of only around 5 800 kcal/kg. It is not surprising that coal mining in the Galilee Basin has not been developed, but that seems about to change. The world has found in Galilee Basin a good place to quench its coal thirst.
The figures on new developments in the Galilee Basin are astonishing. The project that has probably received most attention is the China First Coal project from Waratah Coal, which envisages annual coal production of 40 Mtpa. Alpha, Alpha West and Kevin’s Corner projects from Hancock Coal will jointly account for more than 80 Mtpa. Adani’s Carmichael project aims at 60 Mtpa. There are other projects in the basin, but these three show the magnitude of the new developments.
While developing mine capacity on such a scale is a big challenge, getting this coal to consumer centres in China, India, Korea or Vietnam may be an even bigger undertaking.
The construction of a 500 km railway line from scratch is a huge task. The scale of the investments needed makes any decision very complex. Should the different mining projects share the same infrastructure to reduce costs, or should each big project develop its own link to secure independence and management capacity. Should a double line be built, or a single line with loops every 50 km to 100 km? Using wagons 15 meters long with a capacity of 100 000 kg each, one daily train to deliver the coal from the three projects mentioned above would measure around 75 km in length. Indeed, the timely availability of sufficient lines, engines and rolling stock is another issue.
© O
ECD
/IEA
, 201
1

98 MEDIUM‐TERM COAL MARKET REPORT 2011
Box 8 Digging deep into the Galilee Basin (continued)
The current capacity of Queensland’s ports is almost 240 Mtpa. Although probably not as challenging as rail construction, the expansion needed to increase export capacity to meet the requirements of Galilee Basin development is also formidable. Abbot Point, with a current capacity of 25 Mtpa, seems the best placed to handle Galilee’s coal.
Mine, rail and port developments need a huge amount of financial resources. The current financial environment is not ideal for mobilising the tremendous capital needed.
Finally, the availability of sufficient workers, in many cases specialised workers, is another challenge. Thousands of workers are needed for the mining operations and many more during the construction phase.
If these projects are developed in time, first coal shipments from the Galilee Basin might enter the international market by the end of the outlook period.
Colombia
Several advanced coal mining projects are under way in Colombia, giving the country probable capacity additions of more than 40 Mtpa by the end of the outlook period. Another 18 Mtpa are are considered potential additions in this outlook. Besides various smaller projects, the El Descanso (Drummond), La Jagua (Prodeco) and El Hatillo (Vale) mines are being expanded and are estimated to reach a joint capacity of 37 Mtpa of steam coal output over the outlook period. MPX, a Brazilian player, is entering the coal market with new operations in Colombia. The company is developing one underground (San Juan) and three open‐cast mines (Cañaverales, Papayal, San Benito) in La Guajira province. Output from the four mines may eventually reach 15 Mtpa, but only 6.4 Mtpa may potentially be available by the end of the outlook period. Most of the production will be steam coal, with smaller PCI coal volumes also mined. Total investment expenditure for the four mines is approximately USD 965 million. Mining costs are between USD 36/t and USD 46/t, while inland transport is between USD 6/t (rail to Dibulla) and USD 15/t (truck to Ciénaga). Port handling fees are expected to be USD 6/t to USD 7/t. FOB costs for these operations are therefore mid‐cost in the global supply curve. Several less advanced projects are also under way, e.g. the 9.5 Mtpa Las Cuevas project in César province, which is expected to yield first steam coal output by 2014, or the Cérrejon expansion project from 32 Mtpa to 40 Mtpa capacity (USD 1.3 billion) in La Guajira province. South Africa
Probable mining capacity additions are estimated to be 12 Mtpa, with more than 40 Mtpa classified as potential additions. The Zibulo mining project in the Central basin is well advanced. This multi‐product mine is under construction and is scheduled to reach full production capacity of 6.6 Mtpa by the end of 2012. The mine will produce coal in underground and open‐cast operations and will have a lifetime of 20 years. About half of the output is targeted at export markets, with estimated cash costs in the lower quartile of the global supply curve. Total investment expenditure for the project is USD 51 million. Although the majority of mining capacity additions in South Africa are steam coal projects, a few metallurgical coal projects are also under way. Vele (6.5 Mtpa) and Makhado (6.5 Mtpa), two multi‐product metallurgical coal mines, are in Limpopo province in the north‐east of South Africa. Project investments are USD 300 million and USD 270 million respectively. Although output is targeted at a domestic steel mill, some volumes may enter the seaborne market via the ports of Maputo or even Richards Bay. Operational costs are estimated to be between USD 43/t and
© O
ECD
/IEA
, 201
1
MEDIUM‐TERM COAL MARKET REPORT 2011 99
USD 47/t. With relatively high inland transport costs (USD 25/t to USD 30 /t) to the export terminals and port handling fees (USD 9/t), FOB cash costs are estimated to be more than USD 80/t for these operations. This leaves the projects with a mid‐cost position in the hard coking coal supply curve but with a higher cost position in the supply curves for semi‐soft and PCI coals (Franke, 2011). Russia
Additional Russian capacity is difficult to estimate since it is not always clear how much of a mine’s output is targeted at export and how much at domestic markets. Probable expansions are, rather conservatively, estimated at 13 Mtpa with a similar amount deemed potential additions. A major project in Russia is the development of the Elga coal complex located in Yakutia (Eastern Siberia). The Elga coal mine, developed by Mechel, is an open‐cast operation that may produce up to 27 Mtpa when fully operational by 2021. Of this total, saleable production is expected to include more than 8 Mt of washed premium coking coal, 5 Mt of thermal coal and 6 Mt of middlings. The output will primarily be exported to Asian markets via the Far Eastern ports of Russia, so a 315 km railway track is under construction linking the coal mine to the Russian railway network. First output entered the market in late 2011 supported by road transport. Total project costs are estimated to be USD 2.8 billion. Mozambique
Mozambique is a promising new player in the international hard coal trade. Three projects are being developed in the north‐west: Benga, Moatize and Zambeze. The first two are more advanced and first coal deliveries from the Benga and Moatize open‐cast mines are planned for 2012. Benga is being jointly developed by Riversdale (recently taken over by Rio Tinto) and the Indian company Tata Steel. Moatize is being developed by the Brazilian steel producer Vale. Benga is supposed to reach a capacity of 20 Mtpa, out of which 60% will be attributable to thermal qualities (both domestic and export product) and 40% will be attributable to coking coal qualities. Moatize aims at a capacity of 11 Mtpa, out of which 8.5 Mtpa will be coking coals and the remainder thermal qualities (VDKI, 2011). Investments into the Moatize coal mine are totalling USD 1.3 billion. The Zambeze metallurgical coal project, also in the Tete region, is less advanced. The project is estimated to cost USD 2.9 billion and will jointly be developed by Riversdale and China’s Wuhan Iron and Steel Company. Hard coking coals from Mozambique are expected to have properties similar to those of comparable products from Australia or the United States. The coal will be transported over 665 km by rail to the port of Beira. Generally, Mozambique’s mines are expected to enter the global supply curve on the low cost end with high product quality and a favourable geology. Indonesia
Additions to Indonesian export mining capacity are difficult to project since project lists are generally non‐transparent. Therefore, all Indonesian mining capacity additions are classified as potential additions. In the past Indonesia has managed to expand its mining capacity rapidly. Indonesian potential export mining capacity is projected to increase by about 60 Mtpa over the outlook period. This estimate is on the lower edge of possible capacity additions and expansions twice as high are also conceivable. Political risk and changing regulatory frameworks contribute to general uncertainty related to investment in Indonesia.
© O
ECD
/IEA
, 201
1

100 MEDIUM‐TERM COAL MARKET REPORT 2011
Mine lifetimes are generally shorter in Indonesia than elsewhere, partly because of aggressive output expansions in the past, so investments into operating collieries are required to keep output levels high, especially by the end of the outlook period. New projects and expansions either move deeper inland or produce lower‐rank coals. The latter aspect is particularly characteristic for Indonesia as the majority of its resources have calorific values significantly below 6 000 kcal/kg. Indonesian sub‐bituminous coals have the advantage of very low sulphur content, however, which compensates for their low energy content to some degree. Others
In Canada, mainly metallurgical coal projects are under way. For example, the Brule open cut mine is being expanded to reach a capacity of 2 Mtpa by 2012. The operation applies conventional truck and shovel mining technology and produces PCI coals. Another example is the Mount Klappan PCI/Anthracite project in north‐west British Columbia. This open cut mine is scheduled to produce up to 3 Mtpa of coal for 20 years. Exports are possible through Prince Rupert via a 350 km railway line (so far undeveloped) or through the port of Steward via 150 km road transport. Costs are estimated at around USD 105/t FOB through Prince Rupert. Several smaller metallurgical coal mines are being developed in New Zealand by Bathurst Resources (e.g. Cascade, Brookdale, Escarpment, Deep Creek and North Buller). These open‐cast projects may yield additional capacity up to 2 Mtpa from 2013 onwards and may eventually double. FOB cash costs are estimated to fall from initially over USD 100/t to below USD 90/t when the production target is reached. Exports are handled by the port of Lyttleton. Several projects are under review in Madagascar (Sakoa basin), Botswana (Mmamantswe coal project) and Zimbabwe (Lubimbi coal project). Besides political uncertainty, the lack of infrastructure is likely to impede any coal exports from these projects over the outlook period. References
DnB NOR (2010), “Dry Bulk Outlook: Iron ore and coal”. DnB NOR, Oslo, http://download.hellenicshippingnews.com/pdf/Complete%20ReportAugust.pdf. Franke, M. (2011),”Eine Untersuchung aktueller Entwicklungen auf dem weltweiten Kokskohlenmarkt”, BSc. Thesis, University of Cologne, Cologne. MPX (2010), “Business Plan – MPX Colombia”, http://ri.mpx.com.br/Download.aspx?Arquivo= baDcj6rzrpYc+BivNZFtjA==&IdCanal=z3kRaYvgV3lcVpcKnMVJoA. VDKI [Verein der Kohlenimporteure e.V] (2010), “Annual Report 2010 – German Hard Coal Importer’s Association”. Verein der Kohlenimporteure e.V., Hamburg, www.verein‐kohlenimporteure.de/ wDeutsch/jahresbericht/documents/pdf/vdki_internet_gesamt.pdf. VDKI (2011), “Annual Report 2011 – German Hard Coal Importer’s Association”. Verein der Kohlenimporteure e.V., Hamburg, www.verein‐kohlenimporteure.de/download/VDKi_ ANNUAL%20REPORT%202011_WEB%20Final.pdf?navid=15.
© O
ECD
/IEA
, 201
1

MEDIUM‐TERM COAL MARKET REPORT 2011 101
MEDIUM-TERM PROJECTIONS OF EXPORT CAPACITY UTILISATION Summary
• From a security of supply perspective, global hard coal supply capacity is sufficient to meet demand, but bringing excess capacity to international markets usually implies an increase in supply costs because of higher transport distances, lower coal qualities or more costly mining.
• Investment pipelines are healthy, with substantial additions to mining and
infrastructure capacity scheduled to accommodate strong demand growth over the medium term. Temporary bottlenecks and high capacity utilisation rates are nevertheless likely if key projects in low‐cost countries, such as Australia, Colombia or South Africa, are delayed in the medium term.
• In Australia, South Africa and Russia, projects that are currently at an advanced
stage may not be sufficient to serve trade market growth. Consequently, a share of “potential” projects is needed to prevent bottlenecks.
Low‐cost suppliers such as Colombia may encounter infrastructure bottlenecks
over the medium term because of the long lead times of such investments.
Assumptions and methodology
This chapter integrates the projections of seaborne coal trade (see Medium‐Term Projections of Seaborne Trade) and the projections of export mining and infrastructure expansions (see Utilisation of Export Capacities and Investments). Projected exports of producing countries as well as mining and infrastructure expansion data are used to determine utilisation rates of coal supply chain components over the outlook period. Installed mining capacity comprises dedicated export operations as well operations that serve both domestic and international markets. Export capacities for the latter type of operations are more difficult to estimate. In their case, exports are a function of costs, as well as domestic and international prices and may additionally be hampered by contractual obligations or coal quality issues. Furthermore, existing and additional port handling capacities determine port throughput limits in this analysis. Using country‐specific seaborne export projections, aggregated future utilisation rates of both export terminals and export mining operations can be estimated. However, utilisation rates are aggregated on a national level and thus neglect the fact that the utilisation of individual or regional supply chains, e.g. in Australia or Colombia, can still vary substantially. Generally, mining and infrastructure capacities used in this analysis are more likely to be on the upper‐end of possible developments (with the exception of Indonesia), with the assumption that all projects in the investment pipeline come online as scheduled. However, in reality, projects are often delayed or discarded, for example, because of feasibility problems, public opposition, environmental concerns, changes in investment strategies or the lack of financial capability. These factors are more
© O
ECD
/IEA
, 201
1
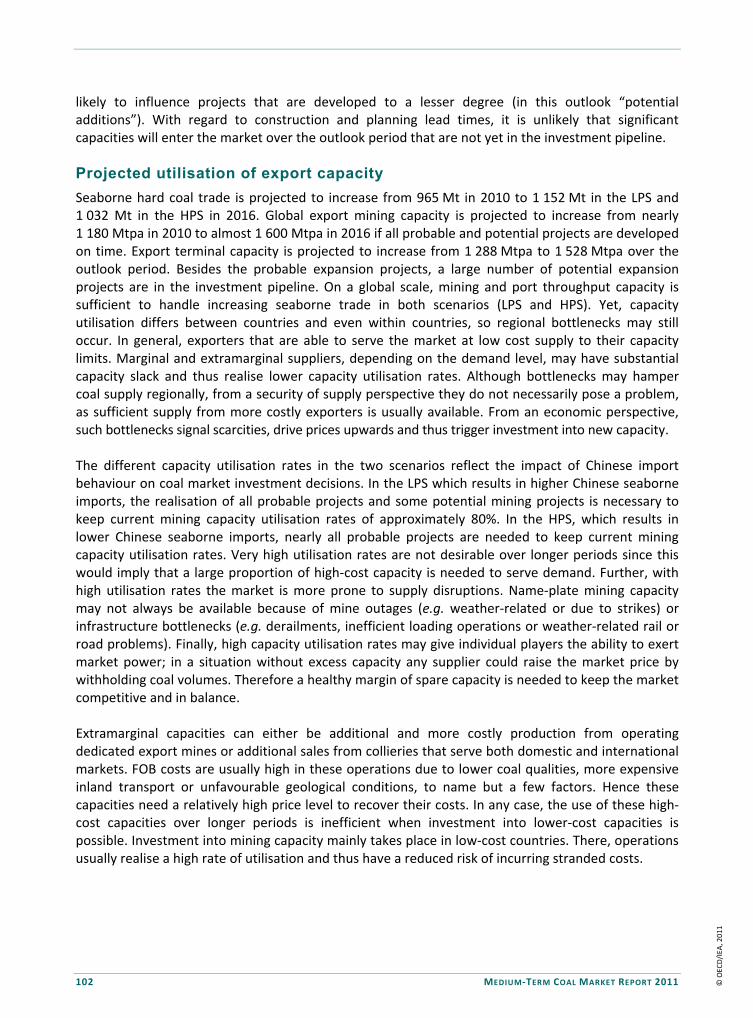
102 MEDIUM‐TERM COAL MARKET REPORT 2011
likely to influence projects that are developed to a lesser degree (in this outlook “potential additions”). With regard to construction and planning lead times, it is unlikely that significant capacities will enter the market over the outlook period that are not yet in the investment pipeline.
Projected utilisation of export capacity
Seaborne hard coal trade is projected to increase from 965 Mt in 2010 to 1 152 Mt in the LPS and 1 032 Mt in the HPS in 2016. Global export mining capacity is projected to increase from nearly 1 180 Mtpa in 2010 to almost 1 600 Mtpa in 2016 if all probable and potential projects are developed on time. Export terminal capacity is projected to increase from 1 288 Mtpa to 1 528 Mtpa over the outlook period. Besides the probable expansion projects, a large number of potential expansion projects are in the investment pipeline. On a global scale, mining and port throughput capacity is sufficient to handle increasing seaborne trade in both scenarios (LPS and HPS). Yet, capacity utilisation differs between countries and even within countries, so regional bottlenecks may still occur. In general, exporters that are able to serve the market at low cost supply to their capacity limits. Marginal and extramarginal suppliers, depending on the demand level, may have substantial capacity slack and thus realise lower capacity utilisation rates. Although bottlenecks may hamper coal supply regionally, from a security of supply perspective they do not necessarily pose a problem, as sufficient supply from more costly exporters is usually available. From an economic perspective, such bottlenecks signal scarcities, drive prices upwards and thus trigger investment into new capacity. The different capacity utilisation rates in the two scenarios reflect the impact of Chinese import behaviour on coal market investment decisions. In the LPS which results in higher Chinese seaborne imports, the realisation of all probable projects and some potential mining projects is necessary to keep current mining capacity utilisation rates of approximately 80%. In the HPS, which results in lower Chinese seaborne imports, nearly all probable projects are needed to keep current mining capacity utilisation rates. Very high utilisation rates are not desirable over longer periods since this would imply that a large proportion of high‐cost capacity is needed to serve demand. Further, with high utilisation rates the market is more prone to supply disruptions. Name‐plate mining capacity may not always be available because of mine outages (e.g. weather‐related or due to strikes) or infrastructure bottlenecks (e.g. derailments, inefficient loading operations or weather‐related rail or road problems). Finally, high capacity utilisation rates may give individual players the ability to exert market power; in a situation without excess capacity any supplier could raise the market price by withholding coal volumes. Therefore a healthy margin of spare capacity is needed to keep the market competitive and in balance. Extramarginal capacities can either be additional and more costly production from operating dedicated export mines or additional sales from collieries that serve both domestic and international markets. FOB costs are usually high in these operations due to lower coal qualities, more expensive inland transport or unfavourable geological conditions, to name but a few factors. Hence these capacities need a relatively high price level to recover their costs. In any case, the use of these high‐cost capacities over longer periods is inefficient when investment into lower‐cost capacities is possible. Investment into mining capacity mainly takes place in low‐cost countries. There, operations usually realise a high rate of utilisation and thus have a reduced risk of incurring stranded costs.
© O
ECD
/IEA
, 201
1
MEDIUM‐TERM COAL MARKET REPORT 2011 103
Figure 38 Outlook for global export capacity utilisation for seaborne hard coal trade until 2016
On a global scale, port capacities do not restrict hard coal trade growth. However, port bottlenecks may still limit exports regionally. Hence, port capacity utilisation also differs between the various exporting countries. Yet investment into export terminal capacity is mainly taking place in countries where ports were highly utilised in the past. These countries are usually intramarginal to the market (such as Colombia, South Africa and Australia) in the trade projections and therefore new port capacity realises healthy utilisation rates over the outlook period. Nevertheless, investment in coal supply infrastructure is very specific and generally more costly than mining capacity. In combination with uncertainty about future utilisation rates, this substantially increases investor risks in reality. Low port utilisation rates are more common with marginal and extramarginal exporters (such as Poland, Russia or the United States) in the trade projections. Coal‐handling port capacities in these countries are usually fully amortised and stranded costs are not likely to be a problem.
Regional analysis
Australia
Australian export mining capacity currently stands at 364 Mtpa and may increase by as much as 178 Mtpa over the outlook period. About 53 Mtpa of the incremental capacity are considered probable and 125 Mtpa are considered potential expansions. Port capacities are projected to increase from 365 Mtpa in 2010 to 459 Mtpa in 2016. In the LPS, Australian exports increase from 298 Mt in 2010 to 362 Mt in 2016. The HPS implies lower trade growth rates and Australian exports increase only to 340 Mt in 2016. Some more costly Australian operations (mainly thermal coal) are swing suppliers and become extramarginal to the market in this scenario.
0
200
400
600
800
1 000
1 200
1 400
1 600
1 800
2009 2010 2012 2014 2016
Mtpa
Potential mine expansions Probable mine expansions Installed mine capacity
Port handling capacity Exports ‐ historic Exports ‐ China low production
Exports ‐ China high production
© O
ECD
/IEA
, 201
1

104 MEDIUM‐TERM COAL MARKET REPORT 2011
Australian export mining capacity utilisation was 78% in 2009 and 82% in 2010. To keep mining capacity utilisation rates around 80%, all probable mining capacity expansions would have to come online without delays. In addition, about one third of the potential expansion projects would be needed in the LPS to maintain a mining capacity utilisation of around 80%.
Figure 39 Outlook for Australian export capacity utilisation for seaborne hard coal until 2016
Box 9 The impact of 2010/2011 floods in Queensland
A series of heavy rainfalls, causing devastating floods, hit Australia at the end of 2010 and the beginning of 2011. Queensland was primarily affected, with large parts of the state declared a disaster zone. The coal supply chain was severely affected by the floods in Queensland: mines, railways and terminals were out of operation or running at low capacity utilisation rates during the rain and in the aftermath. The port of Newcastle (New South Wales) was also affected by the bad weather, though to a much lesser degree.
The coal industry recovered slowly from the disaster; estimates of lost shipments range from 40 Mt to more than 60 Mt. Preliminary data suggests that 2011 exports from Queensland may be down by about 40 Mt compared with 2010 levels. However, assessing lost shipments is difficult since it is unclear how much Queensland’s coal output would have grown year‐on‐year if the floods had not occurred. Saleable production increased in Queensland by about 15 Mt between September 2009 and September 2010, before the first flood events affected coal mining. Extrapolating this growth figure to the year 2011 would bring total losses caused by the floods closer to 60 Mt.
The majority of Australia’s metallurgical coal production takes place in Queensland and was thus particularly affected by the disaster. It is estimated that more than 60% of the lost shipments were metallurgical coals. This tightened supply on the seaborne metallurgical coal market significantly in 2011. Benchmark prices for hard coking coal soared to an unprecedented USD 330/t FOB and some spot deals may have settled even around USD 400/t.
0
100
200
300
400
500
600
2009 2010 2012 2014 2016
Mtpa
Potential expansions Probable expansions Existing export mine capacity
Port capacity Exports ‐ historic Exports ‐ China low production
Exports ‐ China high production
© O
ECD
/IEA
, 201
1
MEDIUM‐TERM COAL MARKET REPORT 2011 105
Box 9 The impact of 2010-2011 floods in Queensland (continued)
PCI coals also received record prices of around USD 270/t FOB. Yet not all of the price increments can be attributed to the floods. Other issues such as the negotiations between Australian producers and Asian buyers regarding the pricing regime for metallurgical coal may also have influenced the prices.
The United States again balanced the market by supplying additional volumes. US seaborne coking coal exports may exceed 60 Mt in 2011, up from 47 Mt in 2010. US producers increased their market share, particularly in the Pacific basin, at the expense of lost Australian shipments. The price spikes also allowed high‐cost producers to enter the international market. However, the floods were not all bad for the Australian coal industry. The increment in prices overcompensated for the loss in output and thus industry revenues generally increased. With costs also rising because of the floods, the impact on industry profits was dampened but still likely to be positive.
The floods were not the first in Queensland but the most disastrous in recent years. During 2008, heavy rainfalls and subsequent floods also affected coal supply but may have reduced thermal and metallurgical coal production by only 8 Mt to 12 Mt.
Port capacity utilisation was 82% in 2009 and 2010 in Australia. However, individual ports were utilised to a higher degree. Vessel queues were long, with over 50 ships sometimes waiting at Newcastle or Dalrymple Bay during 2010. This also suggests that name‐plate capacity is only a rough estimator for actual port throughput capabilities. Port expansion plans are sufficient to handle projected coal exports in both scenarios at a healthy utilisation rate. In the LPS, Australian export terminal utilisation stands at 79% in 2016, whereas in the HPS port utilisation is 74% by the end of the outlook period. The analysis suggests that the strong investment seen today in Australian mining and export infrastructure is appropriate to serve growing demand over the outlook period. However, regional bottlenecks may still restrict Australian exports in the medium term. Australian coal supply comprises various individual supply chains that need coordinated investment into mining, railway and port capacities. Delays or cancellations of projects may therefore affect the whole supply chain and result in temporary bottlenecks or over capacities of supply chain components. Potential mining projects in untapped basins, such as the Galilee basin are particularly prone to delays, since the development also includes the construction of a new railway line and the expansion of port infrastructure. Furthermore, substantial capital expenditure is needed to expand the railway infrastructure of existing supply chains to support mine expansions. Delays in the development of these lines may cause additional individual bottlenecks over the outlook period. Besides typical market uncertainties, such as future price and demand developments, additional country‐specific investor uncertainties include the possible impacts of the proposed Mineral Resources Rent Tax and the carbon tax on Australian mining costs. South Africa
South African export mining capacity may increase by 53 Mtpa over the outlook period. If all probable (12 Mtpa) and potential (41 Mtpa) projects are realised on time, South African mining capacity may reach 132 Mtpa by 2016, up from 79 Mtpa in 2010. Richards Bay Coal Terminal, the major export hub, reached a turnover capacity of 91 Mtpa in 2010. Some shipments are also handled by the ports of Durban and Maputo (Mozambique). No significant further port handling capacities are scheduled to become operational over the outlook period.
© O
ECD
/IEA
, 201
1

106 MEDIUM‐TERM COAL MARKET REPORT 2011
Figure 40 Outlook for South African export capacity utilisation for seaborne hard coal until 2016
Export mining capacity utilisation was 85% in 2009 and 88% in 2010. This relatively high utilisation stems from the fact that South Africa is a low‐cost supplier and therefore usually intramarginal to the market. Utilisation rates are projected to remain high over the outlook period. South African exports could have been higher if rail capacity bottlenecks on the major line from the Central basin to Richards Bay had not restricted them. With sufficient capacities both in mining and in port handling, expansion of railway capacity is key for increasing South African exports. In the LPS, South African exports increase from 70 Mt in 2010 to 94 Mt in 2016. In the HPS, South African exports peak in 2014 at 86 Mt. By the end of the outlook period, South African exports are down to 80 Mt because of a lower export utilisation of mines that produce coals for domestic and for international use. With reduced international demand, lower quality coals are increasingly sold to domestic buyers by the end of the outlook period. Significant investments into all supply chain components are needed in South Africa in the medium term to achieve the projected exports. First, the 81 Mtpa upgrade of the Central basin to Richards Bay line is crucial to support the port terminal expansions. Further rail expansion projects on secondary lines (e.g. upgrade of the 4 Mtpa connection between the coal fields in Limpopo province and Witbank) are necessary to keep up with demand growth in the latter half of the outlook period. Second, probable and potential mining capacity additions are rapidly needed to keep mine utilisation at current levels. In the medium term, the majority of the additional mining capacity will be from thermal coal operations in the Central basin. However, coal exports from Limpopo province (especially metallurgical coals) are projected to increase and play a more important role. Finally, additional port handling capacities may be necessary by the end of the projection period to accommodate exports at reasonable utilisation rates in the LPS.
0
20
40
60
80
100
120
140
2009 2010 2012 2014 2016
Mtpa
existing export mine capacity Probable expansions potential expansions
exports - historic exports - China low production exports - China high production
Port capacity
© O
ECD
/IEA
, 201
1

MEDIUM‐TERM COAL MARKET REPORT 2011 107
Although substantial investments are needed in South Africa, investment conditions are not ideal. South African producers have low FOB costs and are geographically well located but it is unclear if the notoriously constrained railway system can ramp up capacity as scheduled. The Black Economic Empowerment movement has not been a full success story. Investment is low, capacity additions are delayed and production is inefficient. Furthermore, new players may encounter difficulties in securing a coal allocation slot at Richards Bay Coal Terminal. Independently operated additional coal terminals might alleviate market entry for new investors. Finally, recurring rumours about nationalisation of the mining industry add to the political risk investors are facing in South Africa. Colombia
Colombia has the potential to significantly increase its coal mining capacity over the outlook period from 79 Mtpa maximum mining capacity in 2010 to 138 Mtpa in 2016. The majority of the capacity additions (41 Mtp) are classified probable; the remaining 18 Mtpa are considered potential additions. Mining capacities (85%‐87%) and port handling capacities (88%‐91%) were highly utilised in the past. Turnover capacity at Colombian ports stood at 76 Mtpa in 2010 and is projected to increase by 28 Mtpa to 104 Mtpa in 2016. Some Colombian coals are also exported via Venezuelan ports (usually less than 1 Mtpa). Colombian coal exports are projected to increase from 69 Mt in 2010 to 104 Mt in 2016. The majority of the incremental exports are steam coals, though metallurgical coal exports (semi‐soft coking coal and PCI coals) are also projected to increase. This projection is irrespective of the underlying scenario assumption regarding Chinese coal production; as a low‐cost supplier Colombia is fully intramarginal to the market in both scenarios. Colombian exporters have a cost advantage over US and Russian suppliers in the Atlantic basin. Colombia’s main competitor, South Africa, is better positioned with respect to the Pacific basin and thus increasingly directs its exports to the Indian market. After Panama Canal expansion, new opportunities for shipping coal to Asia turn up. Two major supply chains and various smaller ones operate in Colombia. One major supply chain links the coal deposits in the César region to the ports of Santa Marta and Ciénaga via a railway operated by Fenoco and used by Drummond, Glencore, Vale and Goldman Sachs’ CNR. The other links the large Cérrejon mine via a private railway to Puerto Bolívar. Significant investment into mining and infrastructure capacity is needed over the outlook period to accommodate projected Colombian export growth. Mining investments are healthy in Colombia, with a large number of projects approved or under construction. Railway capacities are being doubled on the Fenoco line. In general, inland transport is not likely to be a limiting factor for exports over the outlook period. Transport distances are relatively short in Colombia and complementing truck haulage, at a higher cost, is an option for low‐cost producers. However, projected capacity utilisation based on current expansion plans suggests that port capacity bottlenecks could be a limiting factor for Colombian exports over the medium term. Whether such a situation occurs depends on how fast mining and port capacities are expanded in the coming years. Delays in mine development could ease the tight turnover capacity situation. Moreover, some supporting port infrastructure investments may come online by the end of the outlook period, once the imbalance between mining and port capacities becomes clearly foreseeable.
© O
ECD
/IEA
, 201
1

108 MEDIUM‐TERM COAL MARKET REPORT 2011
Figure 41 Outlook for Colombian export capacity utilisation for seaborne hard coal until 2016
Russia
Russian export mining capacity stood at 100 Mtpa in 2010 and may increase by up to 27 Mtpa over the outlook period. About half of these additions are considered probable, with the balance classified as potential additions. Port turnover capacity available to Russian exports (including Baltic States) is around 133 Mtpa. This is projected to further increase to 147 Mtpa. As in past years, most additions to port capacity are projected to be on the Russian Pacific shore, to serve growing coal demand from Asian buyers. Russian seaborne coal exports are projected to increase to 113 Mt in 2016, up from 87 Mt in 2010 in the LPS. Both metallurgical and steam coal exports increase in this scenario. In the HPS, which implies a lower trade market growth, Russian exports are projected to increase to 97 Mt. In this scenario, Russian steam coal exports remain flat and all the export growth comes from metallurgical coal trade. Although Russian mining costs are among the lowest in the world, inland transport costs are among the highest. Adding port charges and transit fees (in the case of the Baltic States) makes Russia a high‐cost supplier on an FOB basis. Therefore, Russia is to some degree a swing supplier in international coal trade. Since metallurgical coals generally realise higher prices than steam coals, Russian producers of metallurgical coal are less affected by changing market conditions. Mining capacity utilisation, high in the past, is projected to remain high over the outlook period. In the LPS, all projects currently in the investment pipeline need to be developed in time to keep mining capacity utilisation at healthy levels. Similarly, all probable projects need to come online in the HPS to avoid high‐cost utilisation rates. Yet export mining capacity in Russia is dynamic and also depends on domestic market conditions such as prices as well as demand from steel mills and power plants. Hence, Russian export mining capacity, as described here, is only a rough and rather conservative
0
20
40
60
80
100
120
140
160
2009 2010 2012 2014 2016
Mtpa
Potential expansions Probable expansions Existing export mine capacity
Port capacity Exports ‐ historic Exports ‐ China low production
Exports ‐ China high production
© O
ECD
/IEA
, 201
1

MEDIUM‐TERM COAL MARKET REPORT 2011 109
estimator for actual export mining capacity. Although total port handling capacity clearly exceeds both mining capacity and projected exports, individual port utilisation rates vary substantially. With rapidly growing demand in the Pacific basin, Russian export volumes are increasingly directed to the Far Eastern ports over the outlook period, leading to a higher utilisation of these ports. Since demand growth in Europe is sluggish, particularly with regard to steam coal, the ports in the Baltic and Barents Seas are utilised to a lesser degree.
Figure 42 Outlook for Russian export capacity utilisation for seaborne hard coal until 2016
Besides substantial investments needed in the mining sector, railway capacity expansion is crucial for increasing Russian coal exports. Investments into railway links, connecting newly developed deposits to the national railway network, are as important as investments into rolling stock. Indonesia
Indonesian export mining capacity is estimated at 290 Mtpa in 2010 and is projected to increase to about 350 Mtpa by the end of the outlook period. This figure is a rather conservative estimate and substantially higher capacity additions are also conceivable in the medium term. How much capacity actually comes online in Indonesia over the mid‐term depends on factors such as domestic and international demand, geological conditions and financial capability. With rapid production increases, Indonesian collieries have been utilised to capacity in the past. Infrastructure constraints have so far not restricted exports. Most coal deposits are close to the shoreline or to navigable rivers and coal haulage is done by road transport, river barges or conveyor belts. All of these transport modes are more flexible in terms of capacity expansion than railways. Moreover, in these cases, lead times for capacity additions are normally shorter than lead times for railway capacity expansion projects. Similarly, port handling capacity has not limited exports in the past. Several efficient ports and offshore loading terminals are in operation and in a few cases ocean‐going vessels can even directly be loaded from the mines.
0
20
40
60
80
100
120
140
160
2009 2010 2012 2014 2016
Mtpa
Potential expansions Probable expansions
Existing export mine capacity Port capacity
Exports ‐ historic Exports ‐ China low production
Exports ‐ China high production
© O
ECD
/IEA
, 201
1
110 MEDIUM‐TERM COAL MARKET REPORT 2011
Besides mining capacity expansions, the major determinant of Indonesian exports will be cost developments over the outlook period. This relates to mining as well as inland transport when trucking is involved. Operations are moving further inland and thus transport costs are increasing. Although road transport is more flexible in terms of capacity and less capital intensive, its variable distance‐based haulage costs are the highest. Generally, coal supply costs in Indonesia are highly exposed to diesel price fluctuations, because of the large‐scale employment of truck and shovel mining methods and some road transport.
Another major issue influencing the future profitability of Indonesian operations is coal quality deterioration. The majority of Indonesian reserves are low calorific value coals that can only be sold at a price discount on the international market. Indonesian coal qualities sold to international buyers have deteriorated in the past. This trend is expected to continue and additionally, deteriorating geological conditions (higher strip ratios) are projected to increase costs in some operations. Although costs remain relatively low for the majority of Indonesian export operations, some suppliers are pushed into the high‐cost third of the global supply curve. Competition in the Pacific basin becomes fiercer in the trade projections, with Australia and South Africa increasing their thermal coal supply capacity. Yet Indonesia has a sea‐freight cost advantage in the Pacific basin over these two competitors because of its geographic location.
Projected Indonesian exports vary between the HPS and LPS by about 20 Mt in 2016. In the HPS, which implies lower trade market growth, supply costs of some Indonesian operations exceed the prices they can receive for their product. Hence, these mines are extramarginal to the market. Indonesian exports increase to 311 Mt in 2016, up from 287 Mt in 2010. The seaborne market is tighter in the LPS, leading to higher utilisation of Indonesian mining capacity. In this scenario, Indonesian exports stand at 331 Mt by the end of the outlook period. Mining capacity utilisation remains high in Indonesia and stands at 89% in the HPS and 95% in the LPS.
United States
Coal exports in the United States depend on factors such as costs, contractual obligations, domestic and international prices, and the willingness of buyers to accept lower quality coals, for example, high‐sulphur thermal coal from the Illinois basin. Therefore, the mining capacity attributable to international coal trade is difficult to assess. However, mining capacity (including all coal types) that could potentially serve the seaborne market is estimated at 90 Mtpa to 130 Mtpa. With coal exports just below 100 Mt at the beginning of the 1990s, US export infrastructure capacity is large‐scale and flexible. Due to sluggish domestic demand growth, the United States has a large potential to supply the seaborne market in the trade projections. In the LPS, a maximum of 119 Mt of coal exports are reached in the first half of the outlook period. In the latter half of the outlook period, when Australia has fully recovered from the floods and low‐cost mining capacity comes online in other countries, US exports are reduced to 70 Mt in 2016. The HPS also sees high exports from the United States in the first half of the outlook period, at 90 Mt in 2012, but a rapid decline to 40 Mt in 2016 in the latter half. Both mining and infrastructure capacity come close to their limits in the early years of the outlook period, especially in the LPS. There is capacity slack again by the end of the outlook period. The availability of US exports will depend not so much on investments into mining and infrastructure capacity but on domestic demand evolution and cost increases.
© O
ECD
/IEA
, 201
1

MEDIUM‐TERM COAL MARKET REPORT 2011 111
TABLES
Table 6 Coal demand, 2009‐2016, in Mtce
Total coal demand (Mtce) 2009 2010* 2012 2014 2016 CAGR
OECD 1 473 1 562 1 570 1 565 1 576 0.2%
Americas 745 787 751 752 775 -0.3%
Europe 400 419 449 441 432 0.5%
Pacific 328 355 371 372 370 0.7%
Non-OECD 3 241 3 664 4 063 4 362 4 608 3.9%
China 2 187 2 517 2 787 2 988 3 123 3.7%
India 406 434 491 543 610 5.9%
Africa 151 152 166 170 179 2.8%
Former USSR 237 282 294 302 299 1.0%
Other Asia 152 209 241 273 308 6.7%
Other 107 70 84 87 88 3.8%
Total 4 714 5 225 5 634 5 927 6 184 2.8%
* Estimate.
Table 7 Coal production, 2009‐2016, LPS, in Mtce
Total production (Mtce) - LPS 2009 2010* 2012 2014 2016 CAGR
OECD 1 398 1 428 1 496 1 470 1 489 0.7%
Americas 810 825 880 855 862 0.7%
Europe 245 239 230 217 212 -2.0%
Asia Pacific 343 363 385 398 415 2.2%
Non-OECD 3 524 3 831 4 138 4 456 4 695 3.4%
China 2 197 2 399 2 610 2 791 2 913 3.3%
India 349 355 361 393 437 3.5%
Indonesia 238 275 306 331 350 4.1%
Africa 207 210 240 256 281 5.0%
Former USSR 329 375 386 401 412 1.6%
Other Asia 89 101 119 135 155 7.4%
Other 116 116 116 149 148 4.1%
Total 4 922 5 258 5 634 5 927 6 184 2.7%
© O
ECD
/IEA
, 201
1
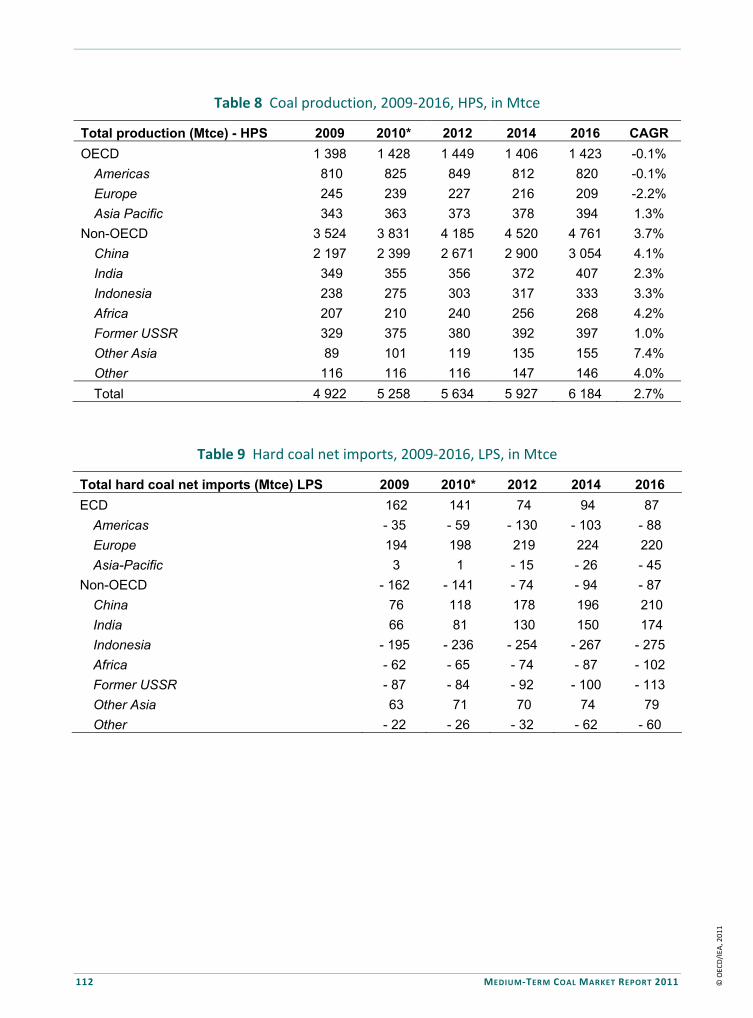
112 MEDIUM‐TERM COAL MARKET REPORT 2011
Table 8 Coal production, 2009‐2016, HPS, in Mtce
Total production (Mtce) - HPS 2009 2010* 2012 2014 2016 CAGR
OECD 1 398 1 428 1 449 1 406 1 423 -0.1%
Americas 810 825 849 812 820 -0.1%
Europe 245 239 227 216 209 -2.2%
Asia Pacific 343 363 373 378 394 1.3%
Non-OECD 3 524 3 831 4 185 4 520 4 761 3.7%
China 2 197 2 399 2 671 2 900 3 054 4.1%
India 349 355 356 372 407 2.3%
Indonesia 238 275 303 317 333 3.3%
Africa 207 210 240 256 268 4.2%
Former USSR 329 375 380 392 397 1.0%
Other Asia 89 101 119 135 155 7.4%
Other 116 116 116 147 146 4.0%
Total 4 922 5 258 5 634 5 927 6 184 2.7%
Table 9 Hard coal net imports, 2009‐2016, LPS, in Mtce
Total hard coal net imports (Mtce) LPS 2009 2010* 2012 2014 2016
ECD 162 141 74 94 87
Americas - 35 - 59 - 130 - 103 - 88
Europe 194 198 219 224 220
Asia-Pacific 3 1 - 15 - 26 - 45
Non-OECD - 162 - 141 - 74 - 94 - 87
China 76 118 178 196 210
India 66 81 130 150 174
Indonesia - 195 - 236 - 254 - 267 - 275
Africa - 62 - 65 - 74 - 87 - 102
Former USSR - 87 - 84 - 92 - 100 - 113
Other Asia 63 71 70 74 79
Other - 22 - 26 - 32 - 62 - 60
© O
ECD
/IEA
, 201
1

MEDIUM‐TERM COAL MARKET REPORT 2011 113
Table 10 Hard coal net imports, 2009‐2016, HPS, in Mtce
Total hard coal net imports (Mtce) HPS 2009 2010* 2012 2014 2016
OECD 162 141 122 158 153
Americas - 35 - 59 - 98 - 61 - 45
Europe 194 198 222 225 222
Asia-Pacific 3 1 - 2 - 6 - 24
Non-OECD - 162 - 141 - 122 - 158 - 153
China 76 118 116 87 69
India 66 81 135 171 203
Indonesia - 195 - 236 - 251 - 253 - 258
Africa - 62 - 65 - 74 - 87 - 89
Former USSR - 87 - 84 - 85 - 90 - 98
Other Asia 63 71 70 74 79
Other - 22 - 26 - 32 - 61 - 58
Table 11 Seaborne steam coal imports, LPS, 2009‐2016, in Mtce
Imports (Mtce) - LPS 2009 2010* 2012 2014 2016 CAGR
Europe and Mediterranean 166 151 145 144 144 -0.7%
Japan 95 110 118 116 111 0.2%
Korea 70 77 77 80 82 1.1%
Chinese Taipei 49 56 56 58 60 1.1%
China 65 92 124 134 137 6.9%
India 43 53 91 104 118 14.4%
Latin America 7 9 9 9 9 0.3%
Other 83 82 68 73 74 -1.8%
Total 578 628 688 718 735 2.6%
Table 12 Seaborne steam coal imports, HPS, 2009‐2016, in Mtce
Imports (Mtce) - HPS 2009 2010* 2012 2014 2016 CAGR
Europe and Mediterranean 166 151 145 146 146 -0.5%
Japan 95 110 118 116 111 0.2%
Korea 70 77 77 80 82 1.1%
Chinese Taipei 49 56 56 58 60 1.1%
China 65 92 75 46 33 -15.6%
India 43 53 96 124 148 18.8%
Latin America 7 9 9 9 9 0.3%
Other 83 82 71 75 76 -1.3%
Total 578 628 646 653 664 0.9%
© O
ECD
/IEA
, 201
1

114 MEDIUM‐TERM COAL MARKET REPORT 2011
Table 13 Seaborne steam coal exports, LPS, 2009‐2016, in Mtce
Exports (Mtce) - LPS 2009 2010* 2012 2014 2016 CAGR
Australia 134 141 147 154 170 3.3%
South Africa 63 65 65 72 79 3.3%
Indonesia 193 234 251 264 272 2.5%
Russia 67 68 76 78 87 4.2%
Colombia 62 64 64 91 91 6.2%
China 20 18 0 0 0 -100%
United States 10 14 62 35 13 -0.5%
Other 29 24 23 23 21 -2.3%
Total 578 628 688 718 735 2.7%
Table 14 Seaborne steam coal exports, HPS, 2009‐2016, in Mtce
Exports (Mtce) - HPS 2009 2010* 2012 2014 2016 CAGR
Australia 134 141 134 134 157 1.8%
South Africa 63 65 65 72 67 0.4%
Indonesia 193 234 248 250 256 1.5%
Russia 67 68 70 68 73 1.1%
Colombia 62 64 64 91 91 6.2%
China 20 18 0 0 0 -100%
United States 10 14 42 14 0 -100%
Other 29 24 23 23 21 -2.3%
Total 578 628 646 653 664 0.9%
Table 15 Seaborne metallurgical coal imports, LPS, 2009‐2016, in Mtce
Imports (Mtce) - LPS 2009 2010* 2012 2014 2016 CAGR
Europe and Mediterranean 46 61 67 72 74 3.4%
Japan 50 55 62 64 66 3.0%
Korea 20 27 27 28 29 1.2%
Chinese Taipei 4 5 6 6 7 6.4%
China 27 34 35 37 43 4.0%
India 23 28 38 47 56 12.1%
Latin America 11 15 21 24 26 9.3%
Other 2 4 3 3 3 -4.7%
Total 184 228 260 280 303 4.8%
© O
ECD
/IEA
, 201
1

MEDIUM‐TERM COAL MARKET REPORT 2011 115
Table 16 Seaborne metallurgical coal imports, HPS, 2009‐2016, in Mtce
Imports (Mtce) - HPS 2009 2010* 2012 2014 2016 CAGR
Europe and Mediterranean 46 61 67 72 74 3.4%
Japan 50 55 62 64 66 3.0%
Korea 20 27 27 28 29 1.2%
Chinese Taipei 4 5 6 6 7 6.4%
China 27 34 23 16 6 -25.7%
India 23 28 38 47 56 12.1%
Latin America 11 15 21 24 26 9.3%
Other 2 4 3 3 3 -4.7%
Total 184 228 248 259 266 2.6%
Table 17 Seaborne metallurgical coal exports, LPS, 2009‐2016, in Mtce
Exports (Mtce) - LPS 2009 2010* 2012 2014 2016 CAGR
Australia 122 150 162 170 174 2.4%
Canada 17 22 26 28 28 4.4%
Mozambique 0 0 8 13 21 n/a
Russia 7 5 6 13 17 21.3%
United States 30 45 47 45 52 2.5%
Other 8 6 11 11 11 11.8%
Total 184 228 260 280 303 4.8%
Table 18 Seaborne metallurgical coal exports, HPS, 2009‐2016, in Mtce
Exports (Mtce) - HPS 2009 2010* 2012 2014 2016 CAGR
Australia 122 150 162 170 166 1.7%
Canada 17 22 20 15 13 -7.9%
Mozambique 0 0 8 13 21 n/a
Russia 7 5 6 13 17 21.3%
United States 30 45 41 37 37 -2.9%
Other 8 6 11 11 11 11.2%
Total 184 228 248 259 266 2.6%
© O
ECD
/IEA
, 201
1

116 MEDIUM‐TERM COAL MARKET REPORT 2011
Table 19 Indicative net calorific values of internationally traded steam coal in kcal/kg18
Calorific values
Australia 6 400-6 800
South Africa 5 900-6 500
Indonesia 5 400-6 000
Russia 6 200-6 800
Colombia 6 000-6 400
China 5 900-6 300
United States 6 300-6 700
Canada 6 500-6 900
Mozambique 6 500-6 900
18 The table is for indicative purposes only and calorific values of traded coals do not necessarily fall into the range displayed in the table.
© O
ECD
/IEA
, 201
1

IEA Publications9 rue de la Fédération, 75739 Paris Cedex 15
Printed in France by CORLET, Janvier 2012
(61 2011 29 1P1) ISBN 978 92 64 16766 7
Cover design: IEA. Photo credits: © Rolf Georg Brenner / Panther Media / GraphicObsession


Market Trends and Projections to 2016
2011Medium-Term Market Report
COAL
Despite public calls in many countries for reducing reliance on coal as a primary but high-carbon energy source, global demand continues to escalate. Coal has traditionally been seen as a low-cost and price-stable source of energy, but recently coal prices have increased and become much more volatile. Moreover, while coal is viewed as a very secure energy source, infrastructure bottlenecks and weather-related events can dramatically tighten the market.
This new annual IEA publication, Medium-Term Coal Market Report 2011, presents a comprehensive analysis of recent trends in coal demand, supply and trade, as well as an IEA outlook for coal market fundamentals for the coming five years. The report places a special focus on trade and infrastructure development in the key exporting countries. Given the existing uncertainties on the production capacity of China to meet its challenging coal demand growth, the book presents two scenarios for coal trade: a high and a low Chinese production outlook. This comparison highlights the massive influence of Chinese behaviour on the international coal trade.
€100 (61 2011 29 1P1)ISBN: 978 92 64 16766 7