Medicare Part D: A First Look at Plan Offerings in 2014
21
October 2013 | Issue Brief Medicare Part D: A First Look at Plan Offerings in 2014 Jack Hoadley, Juliette Cubanski, Elizabeth Hargrave, and Laura Summer 1 The Centers for Medicare & Medicaid Services (CMS) recently released information about the Medicare Part D stand-alone prescription drug plans (PDPs) that will be available in 2014. 2 Of the 36 million beneficiaries enrolled in Part D plans, about 63 percent (22.7 million) are in PDPs; the others are enrolled in Medicare Advantage drug plans. 3 This Medicare Part D Spotlight provides an overview of the 2014 stand-alone PDP options and key changes from prior years. 4 Medicare Part D continues to be a marketplace with an array of competing plans offered at a wide range of premiums and benefit designs. In 2014, Medicare beneficiaries will have a choice of 35 stand-alone PDPs, on average, up by four from 2013. The average premium (weighted by enrollment) is expected to increase by 5 percent across all PDPs from 2013 to 2014 unless many new or current enrollees select lower-priced plans. As in prior years, the average monthly premium for 2014 masks a significant amount of variation across plans. Enrollees in two of the most popular PDPs will experience 50-percent premium increases if they stay in the same plans in 2014, while enrollees in three other popular PDPs will see lower premiums. Beneficiaries receiving Low-Income Subsidies (LIS) will have access to a modestly higher number of plans for no monthly premium in 2014 compared to 2013, but some plans have lost their so-called "benchmark" status for 2014, which will require enrollees to switch plans to maintain the full value of their subsidies. The majority of plans offered in 2014 will offer no gap coverage beyond that which is required by the Affordable Care Act (ACA) of 2010, which phases out the coverage gap by 2020. Under current law, for 2014, manufacturer prices for brand-name drugs purchased in the gap will be discounted by 50 percent (with plans paying 2.5 percent and enrollees paying the other 47.5 percent), and plans will pay 28 percent of the cost for generic drugs in the gap (with enrollees paying 72 percent). Notable trends for 2014 include a growing share of PDPs using preferred pharmacy networks and adopting more formulary cost-sharing tiers. For example, a majority of PDPs now use preferred pharmacy networks where cost sharing is lower when enrollees use preferred pharmacies and higher outside the preferred network. In 2006, few PDPs used this type of pharmacy network. SUMMARY OF KEY FINDINGS
Transcript of Medicare Part D: A First Look at Plan Offerings in 2014

October 2013 | Issue Brief
Medicare Part D: A First Look at Plan Offerings in 2014
Jack Hoadley, Juliette Cubanski, Elizabeth Hargrave, and Laura Summer1
The Centers for Medicare & Medicaid Services (CMS) recently released information about the Medicare Part D
stand-alone prescription drug plans (PDPs) that will be available in 2014.2 Of the 36 million beneficiaries
enrolled in Part D plans, about 63 percent (22.7 million) are in PDPs; the others are enrolled in Medicare
Advantage drug plans.3 This Medicare Part D Spotlight provides an overview of the 2014 stand-alone PDP
options and key changes from prior years.4
Medicare Part D continues to be a marketplace with an array of competing plans offered at a wide range
of premiums and benefit designs.
In 2014, Medicare beneficiaries will have a choice of 35 stand-alone PDPs, on average, up by four
from 2013. The average premium (weighted by enrollment) is expected to increase by 5 percent
across all PDPs from 2013 to 2014 unless many new or current enrollees select lower-priced plans.
As in prior years, the average monthly premium for 2014 masks a significant amount of variation
across plans. Enrollees in two of the most popular PDPs will experience 50-percent premium
increases if they stay in the same plans in 2014, while enrollees in three other popular PDPs will see
lower premiums.
Beneficiaries receiving Low-Income Subsidies (LIS) will have access to a modestly higher number of
plans for no monthly premium in 2014 compared to 2013, but some plans have lost their so-called
"benchmark" status for 2014, which will require enrollees to switch plans to maintain the full value
of their subsidies.
The majority of plans offered in 2014 will offer no gap coverage beyond that which is required by the
Affordable Care Act (ACA) of 2010, which phases out the coverage gap by 2020. Under current law,
for 2014, manufacturer prices for brand-name drugs purchased in the gap will be discounted by 50
percent (with plans paying 2.5 percent and enrollees paying the other 47.5 percent), and plans will
pay 28 percent of the cost for generic drugs in the gap (with enrollees paying 72 percent).
Notable trends for 2014 include a growing share of PDPs using preferred pharmacy networks and
adopting more formulary cost-sharing tiers. For example, a majority of PDPs now use preferred
pharmacy networks where cost sharing is lower when enrollees use preferred pharmacies and
higher outside the preferred network. In 2006, few PDPs used this type of pharmacy network.
SUMMARY OF KEY FINDINGS

Medicare Part D: A First Look at Plan Offerings in 2014 2
KEY FINDINGS
PART D PLAN AVAILABILITY
In 2014, a total of 1,169 PDPs will be offered nationwide, up by 13 percent from the 1,031 PDPs offered in 2013.
Despite the increase in PDPs available in 2014, this total represents 706 fewer PDPs than the peak level in
2007 of 1,875 plans. (Exhibit 1)
Beneficiaries across the country continue
to have a substantial number of Part D
plan choices. The average beneficiary will
have a choice of 35 stand-alone PDPs in
2014.
The number of PDPs per region in 2014
will range from a low of 28 PDPs in the
Alaska region to a high of 39 PDPs in
the Pennsylvania/West Virginia region.
The number of plans is higher in every
region compared to 2013; for example,
up by five in Alaska and by one in
Pennsylvania/West Virginia. (Exhibit
2; Appendix 1, Table A1)
Inside the Part D marketplace in 2014,
212 new PDPs entered the market and 46
PDPs exited the market entirely. Most of
the plan exits are from one company
(EnvisionRx), which eliminated its
enhanced plan option that currently has
only about 7,300 enrollees across 34
regions. Of the new PDP entrants, about
half are PDPs offered by plans sponsors
new to the PDP market, while others are
new offerings by existing plan sponsors;
28 are replacing PDPs offered by the
same sponsor.
Two new plan sponsors are entering
the program with a broad set of 2014
plan offerings: Smartbridge Life
Insurance Company will offer two Transamerica MedicareRx PDPs in all regions except New York; and
Symphonix Heath has a new PDP in 30 regions, co-branded with RiteAid pharmacies in 18 regions.
Exhibit 1
1,429
1,875 1,8241,689
1,576
1,1091,041 1,031
1,169
2006 2007 2008 2009 2010 2011 2012 2013 2014
NOTE: Excludes plans in the territories. Total for 2014 includes 168 plans under CMS sanction and closed to new enrollees as of October 2013.SOURCE: Georgetown/NORC/Kaiser Family Foundation analysis of CMS PDP landscape source files, 2006-2014.
Number of Medicare Part D Stand-Alone Prescription Drug Plans, 2006-2014
Exhibit 2
NOTE: PDP is prescription drug plan. Excludes plans in the territories. Includes 168 plans under CMS sanction and closed to new enrollees as of October 2013.SOURCE: Georgetown/NORC/Kaiser Family Foundation analysis of CMS PDP landscape source file, 2014.
Number of Medicare Part D Stand-Alone Prescription Drug Plans, by Region, 2014
33
36
36
36
34
34 36
3435
33
34
28
29
38
33
36
35
34
34
35
35
33
37
31
28-33 drug plans (9 regions)
34 drug plans (8 regions)
35 drug plans (7 regions)
36-39 drug plans (10 regions)
33CT, MA, RI, VT
36DE, DC, MD
34NJ
32ME, NH
34IA, MN, MT, NE,
ND, SD, WY37ID, UT
35OR, WA
39PA, WV
35IN, KY
35AL, TN
National Average: 35 PDPs

Medicare Part D: A First Look at Plan Offerings in 2014 3
Humana is reorganizing its PDP offerings for 2014 by discontinuing the Humana Complete PDPs, which
have been in the program since 2006; rebranding the Humana Walmart-Preferred PDPs, introduced in 2011,
as Humana Preferred Rx Plans; and introducing a set of new PDPs: the Humana Walmart Rx Plans, priced at
$12.60 per month in most regions (the lowest-priced plan nationwide, excluding the territories). Both PDPs
will use preferred pharmacy networks.5
Cigna has restructured its PDP offerings and added offerings so that three PDPs are available in each region.
In addition, Cigna offers a fourth PDP in each region as a result of its 2012 acquisition of HealthSpring; these
PDPs have been rebranded as Cigna-HealthSpring Rx PDPs.
Both the SilverScript PDPs, offered by CVS Caremark in all 34 regions with 3.4 million enrollees, and the
SmartD Rx PDPs, a new national PDP offering in 2013 with about 88,000 enrollees, were placed under
sanctions that ban any new enrollment and all marketing activities. CVS Caremark has indicated that it
expects to remain under sanction throughout this year’s annual enrollment period. SmartD was acquired by
Express Scripts in September.
MONTHLY PREMIUMS
The projected average monthly PDP
premium for 2014 will be $39.90
(weighted by 2013 enrollment, assuming
beneficiaries remain in their current
plan).6 This is a 5 percent increase
($1.76) from the weighted average
monthly premium of $38.14 in 2013, and
a 54 percent increase from $25.93 in
2006, the first year of the Medicare Part
D drug benefit. Average monthly
premiums (weighted by enrollment) for
PDPs have risen every year since 2006,
except for a modest drop between 2011
and 2012. (Exhibit 3)
CMS has reported that the average
premium for standard Part D coverage offered by PDPs and Medicare Advantage drug plans between 2013 and
2014 is increasing by about $1; the higher premium increase reported here is based on PDPs only, excluding
Medicare Advantage drug plans, and also includes PDPs offering enhanced coverage, which typically have
higher premiums. For PDPs offering only the basic benefit in both years, the 2014 premium is projected to be 1
percent lower than in 2013 (based on current enrollment patterns), whereas premiums for enhanced PDPs are
projected to rise by about 10 percent. Enrollment changes during the annual enrollment period—in particular,
switches to newly available lower-premium PDPs—are likely to reduce modestly the weighted average increase
reported here.
Exhibit 3
$25.93$27.39
$29.89
$35.09$37.25 $38.29 $37.57 $38.14
$39.90
$0
$5
$10
$15
$20
$25
$30
$35
$40
$45
2006 2007 2008 2009 2010 2011 2012 2013 2014
NOTE: Average premiums are weighted by enrollment in each year. Excludes plans in the territories. Estimate for 2014 includes premiums for 168 plans under CMS sanction and closed to new enrollees as of October 2013.SOURCE: Georgetown/NORC/Kaiser Family Foundation analysis of CMS PDP enrollment and landscape files, 2006-2014.
Weighted Average Monthly Premiums for Medicare Part D Stand-Alone Prescription Drug Plans, 2006-2014
2006-2014: 54% increase
2013-2014: 5%
projected increase
Projected

Medicare Part D: A First Look at Plan Offerings in 2014 4
Underneath these overall program trends,
there is wide variation across plans in
premium changes from 2013 to 2014,
with a greater share of enrollees projected
to pay more per month if they stay in
their current plans than the share
expected to pay less or a similar amount.
A majority of all PDP enrollees (58
percent) are projected to pay at least $1
more per month if they stay in their
current plans; this includes 14 percent
(2.5 million beneficiaries) who will
experience an increase of more than
$10 in their monthly plan premium in
2014 unless they select a less expensive
plan and another 44 percent who would pay from $1 to $10 more if they remain in their current plan in
2014.7 (Exhibit 4)
By contrast, 35 percent of all PDP enrollees are projected to see a decrease of $1 per month or more if they
stay in their current plans in 2014; this includes 4 percent of PDP enrollees (approximately 800,000
beneficiaries) who would see premium reductions of at least $10 if they stay with their current PDPs, and
another 31 percent who would experience a premium decrease of between $1 and $10.
The remaining 7 percent of PDP enrollees will face a nominal change in their monthly premium (no more or
less than a $1 increase or decrease) if they stay in their current plan in 2014.
Changes to premiums from 2013 to 2014, averaged across regions and weighted by 2013 enrollment, vary
widely across some of the most popular Part D PDPs. (Exhibit 5)
Premiums for two of the largest PDPs
will increase by more than 50 percent
next year. United HealthCare’s AARP
Medicare Rx Saver Plus, which was new
to the market in 2013 and had the
lowest premium in all regions, is
increasing its average monthly
premium by 55 percent from $15.00 to
$23.22—still well below the national
average but no longer the nation's least
expensive PDP. First Health Value
Plus, which was new to the market in
2012 and now operated by Aetna, is
increasing its average premium by 51
percent from $29.47 to $44.58.
Exhibit 4
Increase of more than $10
14%
$1 to $10 increase
44%
Minimal change7%
$1 to $10 decrease
31%
Decrease of $10 or more
4%
NOTE: “Minimal change” represents premium changes of no more or less than a $1 increase or decrease. Analysis includes 168 plans under CMS sanction and closed to new enrollees as of October 2013.SOURCE: Georgetown/NORC/Kaiser Family Foundation analysis of CMS PDP enrollment, crosswalk, and landscape files, 2014.
Distribution of Changes in Monthly Premium Amounts for Medicare Part D Stand-Alone Prescription Drug Plan EnrolleesIf Enrollees Do Not Switch Plans Between 2013 and 2014
Exhibit 5
NOTE: PDP is prescription drug plan. Some PDPs listed here have undergone name changes since the first year the plan was offeredthat are not shown here. 1Average premiums are weighted by enrollment in each region for each year. 2Plan is under CMS sanction and closed to new enrollees as of October 2013.SOURCE: Georgetown/NORC/Kaiser Family Foundation analysis of CMS PDP enrollment, crosswalk, and landscape files, 2006-2014.
Premiums in Medicare Part D Stand-Alone Prescription Drug Plans with Highest 2013 Enrollment, 2006-2014
Name of PDP in 2014
First year plan
offered
2013 Enrollment (of 18.2 million)
Weighted Average Monthly Premium1 % Change
Number% of Total
First year
2013 20142013-2014
First year-2014
AARP MedicareRx Preferred 2006 3,830,000 21.0% $26.31 $40.45 $43.41 +7% +65%
SilverScript Basic2 2006 2,868,000 15.8% $30.94 $33.05 $29.43 -11% -5%
Humana Preferred 2011 1,817,000 10.0% $14.80 $18.50 $22.72 +23% +54%
Humana Enhanced 2006 1,297,000 7.1% $14.73 $43.73 $47.53 +9% +223%
AARP MedicareRx Saver Plus 2013 723,000 4.0% -- $15.00 $23.22 +55% --
First Health Value Plus 2012 721,000 4.0% $25.44 $29.47 $44.58 +51% +75%
First Health Essentials 2006 704,000 3.9% $24.98 $37.26 $50.80 +36% +103%
Cigna Medicare Rx Secure 2006 684,000 3.8% $35.05 $35.69 $30.85 -14% -12%
WellCare Classic 2007 634,000 3.5% $15.80 $33.39 $20.72 -38% +31%

Medicare Part D: A First Look at Plan Offerings in 2014 5
Enrollees in two other large PDPs will face a double-digit percentage increase, on average, in their monthly
premium between 2013 and 2014 if they stay in the same plan: First Health Essentials (formerly First Health
Premier), with a 36 percent increase (from $37.26 to $50.80), and Humana Preferred Rx Plan (formerly
Walmart-Preferred), with a 23 percent increase (from $18.50 to $22.72).
By contrast, enrollees in another three of the largest PDPs will experience a double-digit percentage
decrease, on average, in their monthly premium if they stay in the same plan: Wellcare Classic (38 percent
lower, from $33.39 to $20.72), Cigna Medicare Rx Secure (formerly Plan One) (14 percent lower, from
$35.69 to $30.85), and SilverScript Basic (11 percent lower, from $33.05 to $29.43).
Looking at the weighted average premium changes over the longer term in the most popular PDPs that have
been available since the start of the Part D program in 2006:
The average premium for Humana PDP Enhanced, although up just 9 percent over 2013, is more than three
times as large as it was in 2006, having increased from $14.73 to $47.53.
The average premium for the PDP with the most enrollees in 2013, UnitedHealth’s AARP Preferred
MedicareRx PDP, has increased 65 percent since 2006 (from $26.31 to $43.41), close to the program’s
overall average premium increase of 54 percent.
By contrast, the monthly premium for SilverScript Basic, operated by CVS Caremark, is 5 percent lower in
2014 ($29.43) than it was in 2006 ($30.94).
Average PDP monthly premiums, weighted by 2013 enrollment, will vary widely in 2014 across regions,
ranging from $27.99 per month for PDPs in the New Mexico region (one of only four regions with an average
under $35) to $46.53 per month for PDPs in the Idaho/Utah region and $45.04 in South Carolina.
(Appendix 1, Table A2)
Premium changes from 2013 to 2014
vary considerably by region. For
example, average premiums in four
regions are projected to fall slightly,
whereas the highest average premium
increases across regions will be 16
percent and 15 percent in Colorado and
Nevada, respectively. (Exhibit 6)
The regional variation in projected
premium changes is influenced by
regional differences in which PDPs
have the highest share of enrollment
and by decisions of plan sponsors to
adjust premiums differently from
region to region. For example, monthly
premiums for the three PDPs with the most enrollees in Florida (which has a statewide premium increase of
14 percent) are increasing by double-digit percentages, whereas premiums for the three largest PDPs in New
York (which has a statewide premium decrease of 4 percent) are either increasing by less than $1 or
Exhibit 6
NOTE: Includes 168 plans under CMS sanction and closed to new enrollees as of October 2013.SOURCE: Georgetown/NORC/Kaiser Family Foundation analysis of CMS PDP enrollment, crosswalk, and landscape files, 2013-2014.
4%
3%
3%
4%
16%
9% 2%
15%4%
-6%
12%
9%
0%
2%
2%
5%
5%
2%
5%
10%
14%
6%
5%
-4%
-6% to 0% change (4 regions)
1% to 3% change (9 regions)
4% to 6% change (9 regions)
7% to 16% change (12 regions)
2%CT, MA, RI, VT
4%DE, DC, MD
11%NJ
-4%ME, NH
Change in Weighted Average Premiums for Medicare Part D Stand-Alone Prescription Drug Plans, by Region, 2014
9%IA, MN, MT, NE,
ND, SD, WY9%ID, UT
7%OR, WA
6%PA, WV
1%IN, KY
2%AL, TN
National Average: 5% increase

Medicare Part D: A First Look at Plan Offerings in 2014 6
decreasing. More specifically, the premium for the AARP MedicareRx Preferred PDP—the plan with the
most enrollees in both regions—increased by 11 percent in Florida, but by only 1 percent in New York.
These average and plan-level premium amounts do not take into account the income-related Part D premium
that took effect in 2011 for Part D enrollees with higher annual incomes ($85,000/individual and
$170,000/couple). Established by the ACA, the income-related Part D premium requires higher-income
enrollees to make an additional payment to the government for Part D coverage, regardless of the plan selected.
In 2014, the monthly surcharge will range from $12.10 to $69.30, depending on income, in addition to the
monthly premium payment for the specific Part D plan.8 An estimated 5 percent of Part D enrollees are
required to make these additional payments in 2013.9 Under current law, the income thresholds are not
indexed to increase annually until 2020, which will result in an increasing share of Part D enrollees paying the
income-related premiums over the next several years.
BENEFIT DESIGN: THE COVERAGE GAP AND DEDUCTIBLES
All beneficiaries who reach the coverage gap, or “doughnut hole,” in 2014 will pay less than the full cost of the
price of their drugs, as a result of changes made by the Affordable Care Act. For 2014, manufacturer prices for
brand-name drugs purchased in the gap will be discounted by 50 percent, with plans paying an additional 2.5
percent and enrollees paying the remaining 47.5 percent. Plans will pay 28 percent of the cost for generic
drugs in the gap, with enrollees paying 72 percent. In 2014, the coverage gap begins after an enrollee incurs
$2,850 in total drug spending and ends after an enrollee has spent a total of $4,550 out of pocket (or $6,691 in
total drug costs under the standard benefit).10 At that point, catastrophic coverage begins, where enrollees
generally pay only 5 percent of drug costs. (Appendix 2)
Most Part D plans will offer little or no gap coverage in 2014 beyond what is required by the ACA under the
standard benefit. With all Part D enrollees now getting coverage for a share of their costs in the gap, the value
of additional gap coverage offered by plans, beyond what the law requires, will become lower each year
approaching 2020, when beneficiaries will only be responsible for 25 percent of their total drug costs in the
gap.
In 2014, about 82 percent of all PDPs
will offer either no or very limited gap
coverage—76 percent of plans will offer
nothing beyond what the ACA requires
and 6 percent will cover fewer than 10
percent of the drugs on their
formulary.11 This is an increase from
2013, when 69 percent of PDPs were
offering no or limited additional gap
coverage—meaning a somewhat smaller
share of plans will offer some gap
coverage beyond what the ACA requires
in 2014 than in 2013. (Exhibits 7 and
8; Appendix 1, Table A3)
Exhibit 7
2% 1% 9% 7%16% 13%13%
27% 29% 25%19%
18% 17%
14%
2%
85%72% 71% 75%
81%73% 76%
69%
82%
NOTE: ACA is the Patient Protection and Affordable Care Act. Analysis excludes plans in the territories. The category "No/little" gap coverage includes plans offering coverage of few generics (and for 2014 few brands). In 2008 and 2009, the number of plans offering gap coverage for brands rounds to 0%. Totals may not sum to 100% due to rounding. Total for 2014 includes 168 plans under CMS sanction and closed to new enrollees as of October 2013; 2014 analysis excludes missing coverage gap data for SmartD Rx Plus PDP (3% of PDPs in 2014).SOURCE: Georgetown/NORC/Kaiser Family Foundation analysis of CMS PDP landscape source files, 2006-2014.
Share of Medicare Part D Stand-Alone Prescription Drug Plans, By Type of Gap Coverage, 2006-2014
2006 2007 2008 2009 2010 2011 2012 2013 20141,429 PDPs 1,875 PDPs 1,824 PDPs 1,689 PDPs 1,576 PDPs 1,109 PDPs 1,041 PDPs 1,031 PDPs 1,169 PDPs
In 2014, the coverage gap is partially filled by a
50% price discount and 2.5% plan payment for brand-name drugs and 28% plan payment for
generic drugs, as required by the ACA
No/Little AdditionalGap Coverage
Mostly Generics
Generics and Brands

Medicare Part D: A First Look at Plan Offerings in 2014 7
Among the 15 percent of PDPs offering
additional gap coverage in 2014 beyond
what the law requires (defined as
covering more than a “few” generics or
brands), a very small share of PDPs (2
percent) limit gap coverage to generic
drugs, with no additional gap coverage
for brand-name drugs. (Exhibit 8)
In 2014, 13 percent of PDPs (115 PDPs,
including those offered by Cigna,
Coventry/First Health, Silverscript,
UnitedHealth, and some Blue Cross
plans) will cover "some" brand-name
drugs (defined as between 10 percent
and 65 percent of the brand-name
drugs on the plan’s formulary) in the
coverage gap, about twice the level in
2012. No PDP will offer full gap
coverage for all drugs on their
formulary in 2014.
A majority of PDPs (53 percent) will
charge a deductible in 2014, the same
as in 2013. Most PDPs with a
deductible will charge the standard
$310 amount (which is down somewhat
from the standard amount of $325 in
2013 as a result of lower per-capita
costs in Part D12). Among PDPs that
charge a deductible, the share with a
deductible below the standard amount
has declined substantially from 2010 to
2014 (from 24 percent to 4 percent). (Exhibit 9)
Exhibit 8
13%
2%No/little additional
gap coverage82%
Total Number of PDPs in 2014 = 1,169
NOTE: ACA is the Patient Protection and Affordable Care Act. PDP is prescription drug plan. Total includes 168 plans under CMS sanction and closed to new enrollees as of October 2013. Missing coverage gap data is for SmartD Rx Plus PDP. *Percent of formulary drugs covered in the gap: “few”=>0%-<10%; “some”=≥10%-<65%; “many”=≥65%-<100%. SOURCE: Georgetown/NORC/Kaiser Family Foundation analysis of CMS PDP landscape source file, 2014.
Share of Medicare Part D Stand-Alone Prescription Drug Plans, By Type of Gap Coverage,* 2014
No/little additional gap coverage includes:• No gap coverage (76%)• Few generics (3%)• Few brands (3%)
Additional gap coverage for mostly generics includes:• Some generics (1%)• Many generics (1%)
Additional gap coverage for generics and brands includes:• Many generics and some brands (6%)• Many generics and few brands (<1%)• Some generics and some brands (7%)
In 2014, the coverage gap is partially filled by a 50% price discount and 2.5% plan payment for brand-name drugs and 28% plan payment for generic drugs, as required by the ACA
Generics and brands
Mostly generics
Missing
Exhibit 9
34% 32% 33% 34% 36% 40% 43% 45% 49%
8% 8% 8% 11%
24% 18% 10% 10% 4%
58% 60% 59% 55%
40% 42% 47% 45% 47%
Nodeductible
Partialdeductible
Standarddeductible
NOTE: Estimates may not sum to total due to rounding. Analysis for 2014 includes 168 plans under CMS sanction and closed to new enrollees as of October 2013.SOURCE: Georgetown/NORC/Kaiser Family Foundation analysis of CMS PDP landscape source files, 2006-2014.
Share of Medicare Part D Stand-Alone Prescription Drug Plans, By Deductible Amount, 2006-2014
Standard deductible amount:
2006 2007 2008 2009 2010 2011 2012 2013 2014
$250 $265 $275 $295 $310 $310 $320 $325 $310

Medicare Part D: A First Look at Plan Offerings in 2014 8
LOW-INCOME SUBSIDY (“BENCHMARK”) PLANS
The total availability of benchmark plans—PDPs available for no monthly premium to Low-Income Subsidy
(LIS) enrollees—will be somewhat greater in 2014 than in the five previous years.
In 2014, 352 plans will be available for
enrollment of LIS recipients for $0
premium. This represents a 6 percent
increase in plans for LIS recipients, or
31 more plans than in 2013. (Exhibit
10; Appendix 1, Table A4)
Policies adopted by CMS in previous
years make it easier for PDPs to qualify
as benchmark plans, including the “de
minimis” policy that allows plans to
waive a premium amount of up to $2 in
order to retain their LIS enrollees.13 Of
the 352 benchmark plans in 2014,
about one in four (79 plans) qualify
through the “de minimis” policy—fewer
than the 113 "de minimis" plans in
2013.
Among the 2013 benchmark plans that
will continue to participate in Part D in
2014, 60 PDPs have lost their
benchmark status due to either higher
premiums in 2014 or to a lower
regional benchmark in 2014. About
517,000 LIS beneficiaries (6 percent of
LIS enrollment in 2013) are enrolled in
these plans—a potential source of
disruption to their coverage.
The number of benchmark plans
available in 2014 will vary by region,
from 4 benchmark PDPs in the Hawaii
and Nevada regions (out of 29 and 34 PDPs, respectively) to 15 benchmark PDPs in the Indiana/Kentucky
region (out of 35 PDPs). (Exhibit 11)
Exhibit 10
409483 442
308 307258 252 218
273
157
53
74 75 11379
409
640
495
308 307332 327 331
352
De minimis plans*
Benchmark plans
NOTE: PDP is prescription drug plan. Excludes plans in the territories. Analysis for 2014 includes 168 plans under CMS sanction and closed to new enrollees as of October 2013. *De minimis plans can retain Low-Income Subsidy beneficiaries despite exceeding the benchmark premium by $2 in 2007, $1 in 2008, and $2 in 2011-2014. SOURCE: Georgetown/NORC/Kaiser Family Foundation analysis of CMS PDP landscape source files, 2006-2014.
Number of Medicare Part D Stand-Alone Prescription Drug Plans Available Without a Premium to Low-Income Subsidy Recipients, 2006-2014
Total number of PDPs:
2006 2007 2008 2009 2010 2011 2012 2013 20141,429 PDPs 1,875 PDPs 1,824 PDPs 1,689 PDPs 1,576 PDPs 1,109 PDPs 1,041 PDPs 1,031 PDPs 1,169 PDPs
Exhibit 11
12
12OR, WA
94
10IA, MN, MT, NE,
ND, SD, WY
13
12
11
11 7
5 8
9
14
1213
8
1311
10
14
12NJ
4HI
5
12 8
8CT, MA, RI, VT
7ME, NH
13
11AL, TN
Number of Benchmark Plans, by Region, 2014
Total Number of Benchmark Plans Across All Regions = 352
13ID, UT
13DE, DC, MD
13PA, WV
15IN, KY
NOTE: Includes “de minimis” plans that can retain Low-Income Subsidy beneficiaries despite exceeding the benchmark premium by $2 in 2014; includes 168 plans under CMS sanction and closed to new enrollees as of October 2013.SOURCE: Georgetown/NORC/Kaiser Family Foundation analysis of CMS PDP landscape source file, 2014.
4 to 7 8 to 10 11 to 12 13 to 15(6 regions) (8 regions) (10 regions) (10 regions)

Medicare Part D: A First Look at Plan Offerings in 2014 9
Benchmark plan availability will decline
in 9 of 34 regions between 2013 and
2014, while more LIS plans will be
available in 20 regions. Year-to-year
changes in most regions are relatively
modest; the largest changes are the loss
of six benchmark plans in the Hawaii
and South Carolina regions. (Exhibit
12)
About 1.9 million people—about one in
four LIS beneficiaries (23 percent)—are
enrolled in PDPs in 2013 that will not
qualify as benchmark plans in 2014
(Exhibit 13). This group includes
517,000 beneficiaries who were in
benchmark plans in 2013; the remaining
three-quarters (72 percent) of these
beneficiaries are currently enrolled in
non-benchmark plans and thus paid a
premium in 2013. In fact, about 470,000
LIS enrollees will pay premiums of at
least $20 per month and nearly 81,000
LIS enrollees will pay premiums of at
least $50 per month if they do not switch
to other PDPs.
The number of LIS beneficiaries who
will potentially pay a premium in 2014
unless they enroll in (or are switched
to) benchmark plans (1.9 million) is
down considerably from the 2.7 million
LIS beneficiaries who were in a similar situation at the time of last year’s open enrollment period.
CMS will reassign a subset of these LIS enrollees, specifically those who were randomly assigned by CMS to
their current plan (last year, one-third of those scheduled to pay a premium were reassigned), and several
states will help reassign those enrolled in their state pharmacy assistance programs (SPAPs).14 But many
other LIS beneficiaries not scheduled to be in benchmark plans in 2014 must switch plans on their own or
pay a premium if they remain in their 2013 plan. Those in the latter group will not be reassigned because in
the past they or someone assisting them made a choice to switch plans. Most affected LIS beneficiaries will
receive a letter from CMS or their SPAP either informing them of their reassignment or reminding them that
they can choose a different plan and avoid paying a premium.
Exhibit 12
Increase +1 to +4 No change Decrease -1 to -6(20 regions) (5 regions) (9 regions)
+3
+4
+2OR, WA
+3
+2
+2IA, MN, MT, NE, ND,
SD, WY
+3
+1
-1
+1 0
+1 0
-4
+4
+2+3
+4IN, KY
-4
0
+4
+2
0
+2NJ
0DE, DC, MD
-6HI
+3
-3 -6
+2CT, MA, RI, VT
-3ME, NH
-2AL, TN
Change in Number of Benchmark Plans, By Region, 2013-2014
Net Change in Benchmark Plans Across All Regions = +21
-1PA, WV
+3ID, UT
NOTE: Analysis includes 168 plans under CMS sanction and closed to new enrollees as of October 2013.SOURCE: Georgetown/NORC/Kaiser Family Foundation analysis of CMS PDP landscape source files, 2013-2014.
Exhibit 13
NOTE: CMS is Centers for Medicare & Medicaid Services. PDP is prescription drug plan. Analysis includes enrollment in PDPs only. Analysis includes 168 plans under CMS sanction and closed to new enrollees as of October 2013. SOURCE: Georgetown/NORC/Kaiser Family Foundation analysis of CMS PDP enrollment, crosswalk, and landscape files, 2013-2014.
Low-Income Subsidy (LIS) Enrollment by Benchmark Plan Status, as of 2014 Open Enrollment Period
Total LIS Enrollment in PDPs in 2013 = 8.2 million
2013 plan ISbenchmark plan
in 2014
6.3 million LIS enrollees
(77%)
2013 plan IS NOT benchmark
plan in 2014
1.9 million LIS enrollees
(23%)
Medicare Part D: A First Look at Plan Offerings in 2014 10
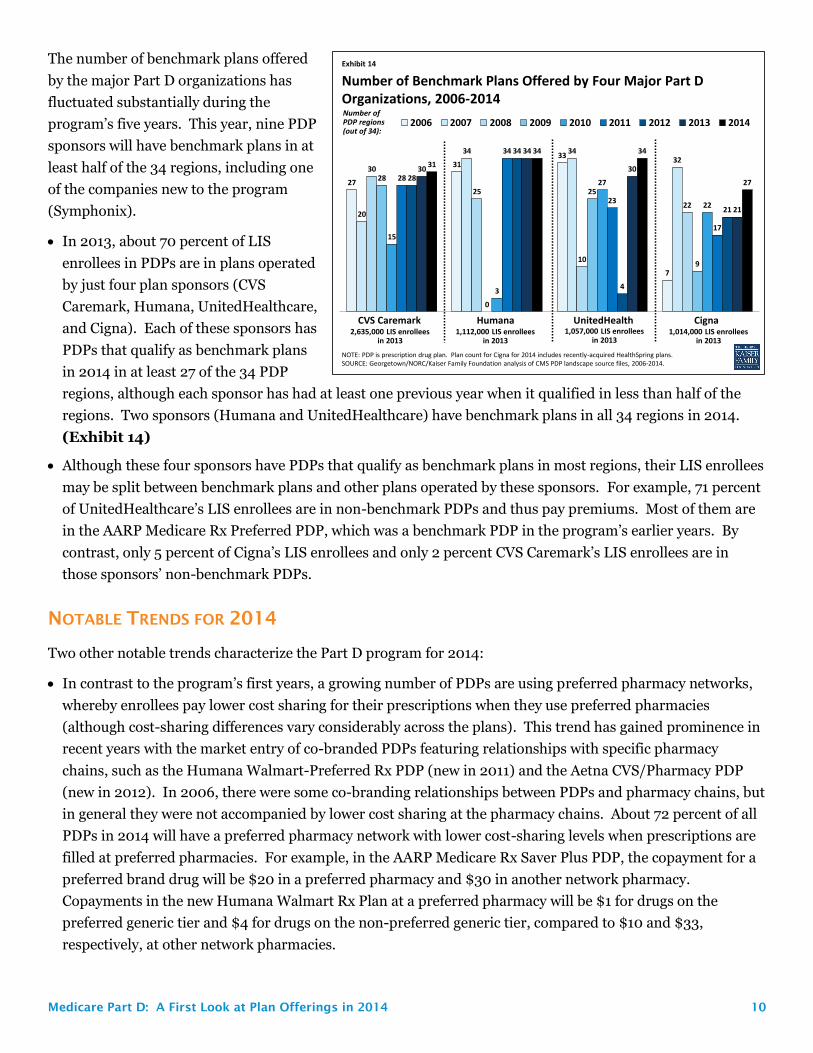
The number of benchmark plans offered
by the major Part D organizations has
fluctuated substantially during the
program’s five years. This year, nine PDP
sponsors will have benchmark plans in at
least half of the 34 regions, including one
of the companies new to the program
(Symphonix).
In 2013, about 70 percent of LIS
enrollees in PDPs are in plans operated
by just four plan sponsors (CVS
Caremark, Humana, UnitedHealthcare,
and Cigna). Each of these sponsors has
PDPs that qualify as benchmark plans
in 2014 in at least 27 of the 34 PDP
regions, although each sponsor has had at least one previous year when it qualified in less than half of the
regions. Two sponsors (Humana and UnitedHealthcare) have benchmark plans in all 34 regions in 2014.
(Exhibit 14)
Although these four sponsors have PDPs that qualify as benchmark plans in most regions, their LIS enrollees
may be split between benchmark plans and other plans operated by these sponsors. For example, 71 percent
of UnitedHealthcare’s LIS enrollees are in non-benchmark PDPs and thus pay premiums. Most of them are
in the AARP Medicare Rx Preferred PDP, which was a benchmark PDP in the program’s earlier years. By
contrast, only 5 percent of Cigna’s LIS enrollees and only 2 percent CVS Caremark’s LIS enrollees are in
those sponsors’ non-benchmark PDPs.
NOTABLE TRENDS FOR 2014
Two other notable trends characterize the Part D program for 2014:
In contrast to the program’s first years, a growing number of PDPs are using preferred pharmacy networks,
whereby enrollees pay lower cost sharing for their prescriptions when they use preferred pharmacies
(although cost-sharing differences vary considerably across the plans). This trend has gained prominence in
recent years with the market entry of co-branded PDPs featuring relationships with specific pharmacy
chains, such as the Humana Walmart-Preferred Rx PDP (new in 2011) and the Aetna CVS/Pharmacy PDP
(new in 2012). In 2006, there were some co-branding relationships between PDPs and pharmacy chains, but
in general they were not accompanied by lower cost sharing at the pharmacy chains. About 72 percent of all
PDPs in 2014 will have a preferred pharmacy network with lower cost-sharing levels when prescriptions are
filled at preferred pharmacies. For example, in the AARP Medicare Rx Saver Plus PDP, the copayment for a
preferred brand drug will be $20 in a preferred pharmacy and $30 in another network pharmacy.
Copayments in the new Humana Walmart Rx Plan at a preferred pharmacy will be $1 for drugs on the
preferred generic tier and $4 for drugs on the non-preferred generic tier, compared to $10 and $33,
respectively, at other network pharmacies.
Exhibit 14
27
3133
7
20
34 3432
30
25
10
22
28
0
25
9
15
3
27
22
28
34
23
17
28
34
4
21
30
34
30
21
31
34 34
27
2006 2007 2008 2009 2010 2011 2012 2013 2014
NOTE: PDP is prescription drug plan. Plan count for Cigna for 2014 includes recently-acquired HealthSpring plans.SOURCE: Georgetown/NORC/Kaiser Family Foundation analysis of CMS PDP landscape source files, 2006-2014.
Number of Benchmark Plans Offered by Four Major Part D Organizations, 2006-2014
UnitedHealth CignaHumana
Number of PDP regions (out of 34):
CVS Caremark1,057,000 LIS enrollees
in 20132,635,000 LIS enrollees
in 20131,014,000 LIS enrollees
in 20131,112,000 LIS enrollees
in 2013

Medicare Part D: A First Look at Plan Offerings in 2014 11
While a majority of Part D plans have adopted some type of tiered cost sharing for their formulary since the
program’s first year, there has been a trend toward the use of more cost-sharing tiers. In 2006, some plans
had three tiers—generics, preferred brand drugs, and non-preferred brand drugs—and some also added a
fourth tier for specialty drugs. By 2013, a five-tier benefit design, with the addition of a second generic tier to
the four-tier arrangement, had become the most common, and it will be the dominant formulary design in
the 2014 PDP market. Of 31 PDPs offered in at least half of all PDP regions in 2014, 24 (77 percent) have this
type of formulary design.
DISCUSSION
In 2014, the number of Medicare Part D stand-alone prescription drug plans offered nationwide will grow
modestly with the entry of new PDP offerings by several long-time plan sponsors. The average Medicare
beneficiary will have a choice of 35 PDPs in 2014, a slight increase from 2013, and most will also have access to
several Medicare Advantage drug plans.
On average, plan enrollees who remain in the same plan will see a modest 5 percent premium increase ($1.76
per month) if they stay enrolled in the same plan in 2014. But moving beyond the overall average change,
about one-third of all PDP enrollees will experience a premium reduction in 2014 and about 14 percent of PDP
enrollees will see a premium increase of $10 or more. Enrollees in four of the program’s most popular PDPs
will experience premium increases of at least 10 percent, and those enrolled in two of these PDPs face increases
of 50 percent. By contrast, enrollees in three other popular PDPs will see lower premiums. As in recent years,
there is a new PDP offered in all regions at a low premium for 2014, and some enrollees may consider
switching from PDPs that are increasing premiums to some of the lower-premium PDPs.
The majority of plans offered in 2014 will offer no gap coverage beyond that which is required by the Affordable
Care Act, and the amount of gap coverage available to all plan enrollees will become increasingly more
generous as the Medicare Part D “doughnut hole” gradually closes by 2020.
Beneficiaries receiving Low-Income Subsidies will have 21 more plans available to them for no monthly
premium in 2014 than in 2013, although nearly one of four LIS beneficiaries will need to change plans between
2013 and 2014 to avoid paying a premium. Although some of the latter group will be reassigned by CMS to
benchmark plans, many are likely to end up in non-benchmark plans and pay premiums for drug coverage in
2014, despite having the option to enroll in a zero-premium plan.
This evaluation of the Part D plan landscape for 2014 and changes over time suggests that many PDP enrollees
will face some changes in their current plan, whether in the form of higher or lower premiums, deductibles, gap
coverage, pharmacy networks, or other benefit design features. While the annual enrollment period is the best
opportunity for people on Medicare to evaluate their coverage options and make changes, a recently released
study of plan switching by several authors of this analysis showed that about 87 percent of all PDP enrollees
stayed in the same plan in annual enrollment periods between 2006 and 2010.15 Even when they were
projected to face large premium increases, 72 percent of PDP enrollees with projected increases of $20 or more
and 79 percent of those with premium increases of $10 to 20 stayed enrolled in the same plan. Furthermore,
evidence from that study indicated that even when PDP enrollees respond to premium changes, enrollees who
switch plans do not always end up with lower out-of-pocket costs for their prescription drug purchases.
Finding ways to get more Part D enrollees engaged in the act of comparing and reviewing plans and making
changes that could save them money remains an ongoing challenge for CMS and policymakers.

Medicare Part D: A First Look at Plan Offerings in 2014 12
APPENDIX 1: INFORMATION ABOUT MEDICARE STAND-ALONE
PRESCRIPTION DRUG PLANS BY STATE
Table A1: Number of Stand-Alone Prescription Drug Plans by State, 2006-2014
STATE/TERRITORY 2006 2007 2008 2009 2010 2011 2012 2013 2014
U.S. Total 1,429 1,875 1,824 1,689 1,576 1,109 1,041 1,031 1,169
Alabama 41 56 53 49 46 34 32 33 35
Alaska 27 45 47 45 41 29 25 23 28
Arizona 43 53 51 49 46 30 30 29 34
Arkansas 40 58 55 52 49 34 30 30 34
California 47 55 56 51 47 33 33 32 36
Colorado 43 55 55 53 48 31 28 29 34
Connecticut 44 51 51 47 48 34 30 30 33
Delaware 47 55 52 48 45 33 31 29 36
District of Columbia 47 55 52 48 45 33 31 29 36
Florida 43 57 58 54 49 32 33 34 35
Georgia 42 55 54 50 45 32 30 30 34
Hawaii 29 46 49 47 41 28 25 23 29
Idaho 44 56 54 51 48 35 33 32 37
Illinois 42 56 53 49 46 35 33 32 38
Indiana 42 53 52 48 44 32 31 31 35
Iowa 41 53 52 48 46 33 33 32 34
Kansas 40 53 52 48 46 33 31 30 33
Kentucky 42 53 52 48 44 32 31 31 35
Louisiana 39 52 50 47 45 32 30 30 33
Maine 41 53 53 46 43 30 28 28 32
Maryland 47 55 52 48 45 33 31 29 36
Massachusetts 44 51 51 47 48 34 30 30 33
Michigan 40 54 55 51 46 35 34 33 36
Minnesota 41 53 52 48 46 33 33 32 34
Mississippi 38 52 49 47 45 32 30 29 33
Missouri 41 53 52 48 45 32 30 31 35
Montana 41 53 52 48 46 33 33 32 34
Nebraska 41 53 52 48 46 33 33 32 34
Nevada 44 54 53 49 46 31 29 29 34
New Hampshire 41 53 53 46 43 30 28 28 32

Medicare Part D: A First Look at Plan Offerings in 2014 13
Table A1: Number of Stand-Alone Prescription Drug Plans by State, 2006-2014
STATE/TERRITORY 2006 2007 2008 2009 2010 2011 2012 2013 2014
New Jersey 44 57 57 52 47 33 30 29 34
New Mexico 43 57 55 50 47 32 30 30 36
New York 46 61 55 51 50 33 29 28 31
North Carolina 38 51 52 49 47 33 30 30 34
North Dakota 41 53 52 48 46 33 33 32 34
Ohio 43 60 58 49 46 34 33 33 37
Oklahoma 42 56 52 49 46 33 30 30 36
Oregon 45 57 55 48 44 32 30 30 35
Pennsylvania 52 66 63 57 55 38 36 38 39
Rhode Island 44 51 51 47 48 34 30 30 33
South Carolina 45 59 56 53 47 34 32 31 35
South Dakota 41 53 52 48 46 33 33 32 34
Tennessee 41 56 53 49 46 34 32 33 35
Texas 47 60 56 53 50 33 33 32 36
Utah 44 56 54 51 48 35 33 32 37
Vermont 44 51 51 47 48 34 30 30 33
Virginia 41 53 52 48 44 32 30 31 35
Washington 45 57 55 48 44 32 30 30 35
West Virginia 52 66 63 57 55 38 36 38 39
Wisconsin 45 54 57 53 48 32 29 30 33
Wyoming 41 53 52 48 46 33 33 32 34
TERRITORY
American Samoa 1 3 4 4 3 2 1 1 1
Guam 1 3 4 4 3 2 1 1 1
Northern Mariana
Islands 1 3 4 4 3 2 1 1 1
Puerto Rico 10 28 34 33 29 17 16 16 13
Virgin Islands 4 6 7 7 6 4 3 1 1
NOTE: Total for 2014 includes 168 plans under CMS sanction and closed to new enrollees as of October 2013.
SOURCE: Georgetown/NORC/Kaiser Family Foundation analysis of CMS PDP landscape source files, 2006-2014.

Medicare Part D: A First Look at Plan Offerings in 2014 14
Table A2: Monthly Premiums for Stand-Alone Prescription Drug Plans by State, 2014
STATE/TERRITORY Low High Weighted Average % Change, 2013-2014
U.S. Total $12.50 $174.70 $39.90 4.6%
Alabama $12.60 $134.50 $40.37 1.9%
Alaska $12.50 $136.50 $39.49 9.3%
Arizona $12.60 $135.10 $34.42 8.7%
Arkansas $12.60 $119.20 $42.22 11.9%
California $12.60 $147.00 $39.05 3.8%
Colorado $12.60 $134.20 $41.68 15.0%
Connecticut $12.60 $125.70 $35.85 1.8%
Delaware $12.60 $170.50 $42.69 3.6%
District of Columbia $12.60 $170.50 $42.69 3.6%
Florida $12.60 $174.70 $39.41 14.1%
Georgia $12.60 $121.00 $40.20 4.7%
Hawaii $12.60 $120.00 $33.64 -0.3%
Idaho $12.60 $138.80 $46.53 8.8%
Illinois $12.60 $125.50 $37.45 2.4%
Indiana $12.60 $124.80 $41.74 0.8%
Iowa $12.60 $140.60 $40.46 9.3%
Kansas $12.60 $140.80 $42.09 4.2%
Kentucky $12.60 $124.80 $41.74 0.8%
Louisiana $12.60 $131.20 $37.00 -5.6%
Maine $12.60 $124.70 $34.76 -4.2%
Maryland $12.60 $170.50 $42.69 3.6%
Massachusetts $12.60 $125.70 $35.85 1.8%
Michigan $12.60 $114.70 $41.41 5.0%
Minnesota $12.60 $140.60 $40.46 9.3%
Mississippi $12.60 $127.90 $39.21 1.7%
Missouri $12.60 $137.90 $40.37 4.3%
Montana $12.60 $140.60 $40.46 9.3%
Nebraska $12.60 $140.60 $40.46 9.3%
Nevada $12.60 $130.40 $38.40 16.2%
New Hampshire $12.60 $124.70 $34.76 -4.2%

Medicare Part D: A First Look at Plan Offerings in 2014 15
Table A2: Monthly Premiums for Stand-Alone Prescription Drug Plans by State, 2014
STATE/TERRITORY Low High Weighted Average % Change, 2013-2014
New Jersey $12.60 $139.50 $44.46 10.6%
New Mexico $12.60 $125.40 $27.99 1.6%
New York $12.60 $144.40 $40.99 -4.1%
North Carolina $12.60 $134.90 $39.45 2.1%
North Dakota $12.60 $140.60 $40.46 9.3%
Ohio $12.60 $119.10 $37.23 5.4%
Oklahoma $12.60 $142.30 $39.92 2.8%
Oregon $12.60 $143.00 $41.11 7.4%
Pennsylvania $12.60 $169.00 $41.68 6.3%
Rhode Island $12.60 $125.70 $35.85 1.8%
South Carolina $12.60 $128.00 $45.04 10.1%
South Dakota $12.60 $140.60 $40.46 9.3%
Tennessee $12.60 $134.50 $40.37 1.9%
Texas $12.60 $127.10 $39.52 3.3%
Utah $12.60 $138.80 $46.53 8.8%
Vermont $12.60 $125.70 $35.85 1.8%
Virginia $12.60 $125.00 $39.29 5.0%
Washington $12.60 $143.00 $41.11 7.4%
West Virginia $12.60 $169.00 $41.68 6.3%
Wisconsin $12.60 $137.00 $42.39 6.0%
Wyoming $12.60 $140.60 $40.46 9.3%
TERRITORY
American Samoa $20.20 $20.20 $20.20 152.5%
Guam $20.50 $20.50 $20.50 107.1%
Northern Mariana
Islands $10.80 $10.80 $10.80 12.5%
Puerto Rico $3.30 $88.70 $59.63 9.5%
Virgin Islands $32.60 $32.60 $32.60 86.3%
NOTE: Analysis includes 168 plans under CMS sanction and closed to new enrollees as of October 2013. Average
monthly premium is weighted by 2013 enrollments for the region in which the state is located.
SOURCE: Georgetown/NORC/Kaiser Family Foundation analysis of CMS PDP crosswalk and landscape source files,
2013-2014.

Medicare Part D: A First Look at Plan Offerings in 2014 16
Table A3: Number of Stand-Alone Prescription Drug Plans
With No Coverage in the Gap by State, 2006-2014
STATE/TERRITORY 2006 2007 2008 2009 2010 2011 2012 2013 2014
U.S. Total 1,208 1,328 1,295 1,273 1,268 744 771 684 891
Alabama 35 39 38 38 37 24 24 22 28
Alaska 22 33 33 34 34 20 19 16 22
Arizona 37 38 36 37 38 21 23 19 27
Arkansas 34 40 39 39 39 23 22 21 27
California 40 41 41 39 38 22 23 21 27
Colorado 36 40 39 40 39 21 21 19 25
Connecticut 37 36 36 35 38 23 23 20 25
Delaware 41 39 37 36 36 22 23 20 27
District of Columbia 41 39 37 36 36 22 23 20 27
Florida 35 41 40 39 39 21 23 21 26
Georgia 35 39 39 38 36 21 22 19 25
Hawaii 24 34 34 35 32 19 19 16 23
Idaho 38 40 39 39 39 24 26 23 29
Illinois 36 40 38 37 37 23 24 21 30
Indiana 35 37 37 36 35 21 22 19 26
Iowa 34 38 36 36 37 22 24 21 26
Kansas 33 37 37 36 37 22 23 20 25
Kentucky 35 37 37 36 35 21 22 19 26
Louisiana 33 37 36 36 37 22 23 21 26
Maine 35 37 37 34 35 20 21 18 24
Maryland 41 39 37 36 36 22 23 20 27
Massachusetts 37 36 36 35 38 23 23 20 25
Michigan 34 39 39 38 37 24 25 22 28
Minnesota 34 38 36 36 37 22 24 21 26
Mississippi 32 37 35 36 37 22 23 20 26
Missouri 34 37 37 36 36 21 22 20 26
Montana 34 38 36 36 37 22 24 21 26
Nebraska 34 38 36 36 37 22 24 21 26
Nevada 37 38 38 37 38 21 22 19 25
New Hampshire 35 37 37 34 35 20 21 18 24

Medicare Part D: A First Look at Plan Offerings in 2014 17
Table A3: Number of Stand-Alone Prescription Drug Plans
With No Coverage in the Gap by State, 2006-2014
STATE/TERRITORY 2006 2007 2008 2009 2010 2011 2012 2013 2014
New Jersey 38 40 39 39 37 22 23 20 26
New Mexico 37 40 39 38 39 22 23 20 27
New York 40 44 40 39 41 23 22 20 24
North Carolina 31 36 36 36 37 22 22 20 26
North Dakota 34 38 36 36 37 22 24 21 26
Ohio 36 43 41 37 37 22 23 20 27
Oklahoma 35 40 37 37 37 22 23 21 28
Oregon 39 40 38 36 35 21 23 21 27
Pennsylvania 44 47 46 44 44 25 25 23 29
Rhode Island 37 36 36 35 38 23 23 20 25
South Carolina 39 43 41 41 38 23 24 21 27
South Dakota 34 38 36 36 37 22 24 21 26
Tennessee 35 39 38 38 37 24 24 22 28
Texas 41 43 40 40 40 22 24 21 28
Utah 38 40 39 39 39 24 26 23 29
Vermont 37 36 36 35 38 23 23 20 25
Virginia 35 37 37 36 35 21 22 20 26
Washington 39 40 38 36 35 21 23 21 27
West Virginia 44 47 46 44 44 25 25 23 29
Wisconsin 36 38 40 39 37 20 20 19 23
Wyoming 34 38 36 36 37 22 24 21 26
TERRITORY
American Samoa 1 2 3 3 2 1 1 1 0
Guam 1 2 3 3 2 1 1 1 0
Northern Mariana
Islands 1 2 3 3 2 1 1 1 0
Puerto Rico 9 21 22 22 21 11 13 11 9
Virgin Islands 4 4 5 5 4 3 3 1 0
NOTE: Total for 2014 includes 168 plans under CMS sanction and closed to new enrollees as of October 2013. Plan
counts reflect the number of plans offering no coverage in the gap, excluding plans that offer coverage of "few"
brands or generics in the gap (where “few” is defined as more than zero percent to less than 10 percent of
formulary drugs).
Beginning in 2011, Part D plans were required to offer additional coverage of drug costs in the coverage gap (a
provision in the Affordable Care Act of 2010). In 2014, beneficiaries will receive a 50% price discount and a 2.5%
payment by plans toward the cost of brand-name drugs and 28% plan payment toward the cost of generic drugs. By
2020, the coverage gap will be phased out and beneficiaries will be responsible for 25% of their total drug costs
prior to qualifying for catastrophic coverage.
SOURCE: Georgetown/NORC/Kaiser Family Foundation analysis of CMS PDP landscape source files, 2006-2014.

Medicare Part D: A First Look at Plan Offerings in 2014 18
Table A4: Number of Stand-Alone Prescription Drug Plans
Below Low-Income Subsidy Benchmark by State, 2006-2014
STATE/TERRITORY 2006 2007 2008 2009 2010 2011 2012 2013 2014
U.S. Total 409 640 495 308 307 332 327 331 352
Alabama 9 17 15 12 9 11 12 13 11
Alaska 8 17 15 7 6 5 4 7 11
Arizona 6 10 7 2 8 9 10 10 11
Arkansas 13 23 18 12 15 17 15 15 12
California 10 14 9 6 7 5 6 6 9
Colorado 10 19 12 8 6 7 5 4 5
Connecticut 11 20 14 12 13 12 10 6 8
Delaware 15 21 18 11 11 12 13 13 13
District of Columbia 15 21 18 11 11 12 13 13 13
Florida 6 10 8 5 5 4 3 2 5
Georgia 14 21 18 11 8 14 12 13 9
Hawaii 8 18 10 5 7 6 10 10 4
Idaho 14 20 14 9 9 11 12 10 13
Illinois 15 23 19 12 10 10 10 10 14
Indiana 13 19 17 12 9 14 13 11 15
Iowa 14 20 16 9 8 10 9 8 10
Kansas 11 20 17 10 9 12 10 10 13
Kentucky 13 19 17 12 9 14 13 11 15
Louisiana 11 12 10 7 13 10 12 14 14
Maine 14 21 18 5 4 7 8 10 7
Maryland 15 21 18 11 11 12 13 13 13
Massachusetts 11 20 14 12 13 12 10 6 8
Michigan 14 26 17 11 9 12 12 10 13
Minnesota 14 20 16 9 8 10 9 8 10
Mississippi 12 21 15 13 10 14 12 13 13
Missouri 10 15 13 6 13 5 8 8 8
Montana 14 20 16 9 8 10 9 8 10
Nebraska 14 20 16 9 8 10 9 8 10
Nevada 7 9 5 1 5 4 2 2 4
New Hampshire 14 21 18 5 4 7 8 10 7

Medicare Part D: A First Look at Plan Offerings in 2014 19
Table A4: Number of Stand-Alone Prescription Drug Plans
Below Low-Income Subsidy Benchmark by State, 2006-2014
STATE/TERRITORY 2006 2007 2008 2009 2010 2011 2012 2013 2014
New Jersey 14 20 18 7 6 6 9 10 12
New Mexico 8 14 11 7 8 8 6 7 7
New York 15 16 15 9 11 11 12 12 8
North Carolina 13 21 17 11 8 11 9 8 10
North Dakota 14 20 16 9 8 10 9 8 10
Ohio 10 22 15 6 5 8 8 8 12
Oklahoma 12 20 13 8 10 10 9 11 12
Oregon 15 20 15 7 9 8 9 10 12
Pennsylvania 15 26 18 9 11 12 12 14 13
Rhode Island 11 20 14 12 13 12 10 6 8
South Carolina 16 26 20 15 13 15 12 14 8
South Dakota 14 20 16 9 8 10 9 8 10
Tennessee 9 17 15 12 9 11 12 13 11
Texas 16 19 15 14 11 12 13 12 11
Utah 14 20 14 9 9 11 12 10 13
Vermont 11 20 14 12 13 12 10 6 8
Virginia 16 21 17 13 11 10 10 10 13
Washington 15 20 15 7 9 8 9 10 12
West Virginia 15 26 18 9 11 12 12 14 13
Wisconsin 14 21 16 16 10 10 10 10 12
Wyoming 14 20 16 9 8 10 9 8 10
TERRITORY
American Samoa N/A N/A N/A N/A N/A N/A N/A N/A N/A
Guam N/A N/A N/A N/A N/A N/A N/A N/A N/A
Northern Mariana
Islands N/A N/A N/A N/A N/A N/A N/A N/A N/A
Puerto Rico N/A N/A N/A N/A N/A N/A N/A N/A N/A
Virgin Islands N/A N/A N/A N/A N/A N/A N/A N/A N/A
NOTE: Benchmark plans are not designated (N/A) in the territories because low-income beneficiaries residing in the
territories are not eligible for the low-income subsidy. Analysis for 2014 includes 168 plans under CMS sanction
and closed to new enrollees as of October 2013.
SOURCE: Georgetown/NORC/Kaiser Family Foundation analysis of CMS PDP landscape source files, 2006-2014.

Medicare Part D: A First Look at Plan Offerings in 2014 20
APPENDIX 2: MEDICARE PART D STANDARD BENEFIT
PARAMETERS, 2006-2014
NOTE: Estimates are rounded to nearest whole dollar. 1
Amount corresponds to the estimated
catastrophic coverage limit for non-Low-Income Subsidy enrollees ($6,455 for LIS enrollees), which
corresponds to True Out-of-Pocket (TrOOP) spending of $4,550 (the amount used to determine when an
enrollee reaches the catastrophic coverage threshold. 2
In 2014, the coverage gap is partially filled by a
50 percent price discount and 2.5 percent plan payment for brand-name drugs and 28 percent plan
payment for generic drugs, as required by the Affordable Care Act of 2010.
SOURCE: Kaiser Family Foundation analysis of data from the Centers for Medicare & Medicaid Services.
$5,100 $5,451
$5,726
$6,154 $6,440 $6,448
$6,730 $6,955
$6,691
$2,250 $2,400 $2,510 $2,700 $2,830 $2,840 $2,930 $2,970 $2,850
$250 $265 $275 $295 $310 $310 $320 $325 $310
$0
$1,000
$2,000
$3,000
$4,000
$5,000
$6,000
$7,000
$8,000
2006 2007 2008 2009 2010 2011 2012 2013 2014
$2,850$3,051
$3,216$3,454
$3,610
Catastrophic Limit
Coverage Gap2
Initial Coverage Limit
Deductible
Total drug spending:
$3,608 $3,800$3,985
1
$3,841

Medicare Part D: A First Look at Plan Offerings in 2014 21
ENDNOTES
1 Jack Hoadley and Laura Summer are with Georgetown University; Juliette Cubanski is with the Kaiser
Family Foundation; Elizabeth Hargrave is with NORC at the University of Chicago.
2 Centers for Medicare and Medicaid Services, “More, higher quality options for seniors in Medicare
Advantage,” September 19, 2013; 2014 PDP, MA, and SNP Landscape Source Files and related files are
available at http://www.cms.hhs.gov/PrescriptionDrugCovGenIn/.
3 These enrollment counts (September 2013) include 6.1 million Part D enrollees in employer-only plans,
not otherwise analyzed for this spotlight.
4 Other Medicare Part D Data Spotlights from 2008 to 2013, based on the authors’ analysis of CMS data,
are available at http://www.kff.org/medicare/resources-on-the-medicare-prescription-drug-benefit-2/.
5 It is unknown at present whether the renamed Humana Preferred Rx Plan will have a broader preferred
network beyond Walmart pharmacies.
6 Based on authors' analysis using the CMS 2014 Part D Crosswalk file.
7 This calculation includes LIS enrollees, who are not necessarily responsible for paying the increased
premium (see the LIS section for more information). The share of non-LIS PDP enrollees projected to
have a premium increase of at least $1 is even larger—78 percent of all enrollees. Nearly one in five
non-LIS enrollees have a projected premium increase of at least $10 per month.
8 Centers for Medicare & Medicaid Services, “Annual Release of Part D National Average Bid Amount and
other Part C & D Bid Related Information,” July 30, 2013.
9 Kaiser Family Foundation, “Income-Relating Medicare Part B and Part D Premiums Under Current Law
and Recent Proposals: What are the Implications for Beneficiaries?” February 2012, available at
http://www.kff.org/medicare/8276.cfm.
10 This amount corresponds to the estimated catastrophic coverage limit for non-Low-Income Subsidy
enrollees ($6,455 for LIS enrollees), which corresponds to True Out-of-Pocket (TrOOP) spending of
$4,550 (the amount used to determine when an enrollee reaches the catastrophic coverage threshold.
11 Information is not available for the gap coverage of one PDP, SmartD Rx Plus, offered in all 34 regions.
This plan is included in the denominator but not in any of the coverage categories.
12 Centers for Medicare & Medicaid Services, “Announcement of Calendar Year (CY) 2014 Medicare
Advantage Capitation Rates and Medicare Advantage and Part D Payment Policies and Final Call Letter,”
April 1, 2013.
13 Plans qualifying through the de minimis policy are eligible for new enrollees, but will not receive auto-
assigned enrollees.
14 Estimates for the total number of beneficiaries subject to paying a premium are based on plan data
from the landscape and crosswalk files, together with CMS enrollment reports. Estimates of the number
scheduled to be reassigned are not available from CMS, as of the publication date.
15 Jack Hoadley, Elizabeth Hargrave, Laura Summer, Juliette Cubanski, and Tricia Neuman, "To Switch or
Not to Switch: Are Medicare Beneficiaries Switching Drug Plans To Save Money?" Kaiser Family
Foundation, October 2013.