What do you remember about mass spectrometry? Mass Spectrometry.


MEDICAL APPLICATIONS OF MASSSPECTROMETRY

This page intentionally left blank

MEDICAL APPLICATIONSOF MASS SPECTROMETRY
Edited by
Károly VékeyChemical Research Center, Hungarian Academy of Sciences
Budapest, Hungary
András TelekesNational Institute of Oncology,
Budapest, Hungary
Akos VertesW.M. Keck Institute for Proteomics Technology and Applications,
Department of Chemistry, The George Washington UniversityWashington, DC, USA
Amsterdam – Boston – Heidelberg – London – New York – OxfordParis – San Diego – San Francisco – Sydney – Tokyo

ElsevierRadarweg 29, PO Box 211, 1000 AE Amsterdam, The NetherlandsLinacre House, Jordan Hill, Oxford OX2 8DP, UK
First edition 2008
Copyright © 2008 Elsevier B.V. All rights reserved
No part of this publication may be reproduced, stored in a retrieval systemor transmitted in any form or by any means electronic, mechanical, photocopying,recording or otherwise without the prior written permission of the publisher
Permissions may be sought directly from Elsevier’s Science & Technology RightsDepartment in Oxford, UK: phone (�44) (0) 1865 843830; fax (�44) (0) 1865 853333;email: [email protected]. Alternatively you can submit your request online byvisiting the Elsevier web site at http://www.elsevier.com/locate/permissions, and selectingObtaining permission to use Elsevier material
NoticeNo responsibility is assumed by the publisher for any injury and/or damage to personsor property as a matter of products liability, negligence or otherwise, or from any useor operation of any methods, products, instructions or ideas contained in the materialherein. Because of rapid advances in the medical sciences, in particular, independentverification of diagnoses and drug dosages should be made
Library of Congress Cataloging-in-Publication DataA catalog record for this book is available from the Library of Congress
British Library Cataloguing in Publication DataA catalogue record for this book is available from the British Library
ISBN: 978-0-444-51980-1
Printed and bound in The Netherlands
08 09 10 11 12 10 9 8 7 6 5 4 3 2 1
For information on all Elsevier publications visitour web site at books.elsevier.com

Contents
List of Contributors xviiPreface xxi
Part I. Motivation and Essentials 1
Chapter 1
Introduction 3Akos Vertes and Károly Vékey
Chapter 2
Basics of Analytical Chemistry and Mass Spectrometry forMedical Professionals 7Károly Vékey and András Telekes1. Introduction 72. Terms and Definitions 93. The Analytical Procedure 114. A Case Study: Analysis of Plasma Sterol Profile 145. Mass Spectrometry 16Reference 18
Chapter 3
Ethical, Legal, Safety, and Scientific Aspects of Medical Research 19András Telekes and Károly Vékey1. Ethical Aspects 202. Legal Aspects 223. Safety Aspects 224. Handling Biological Materials 255. Clinical Trials and Protocols 286. Administrative Procedures 33References 34
vi Contents
Part II. Tools of the Trade 35
Chapter 4
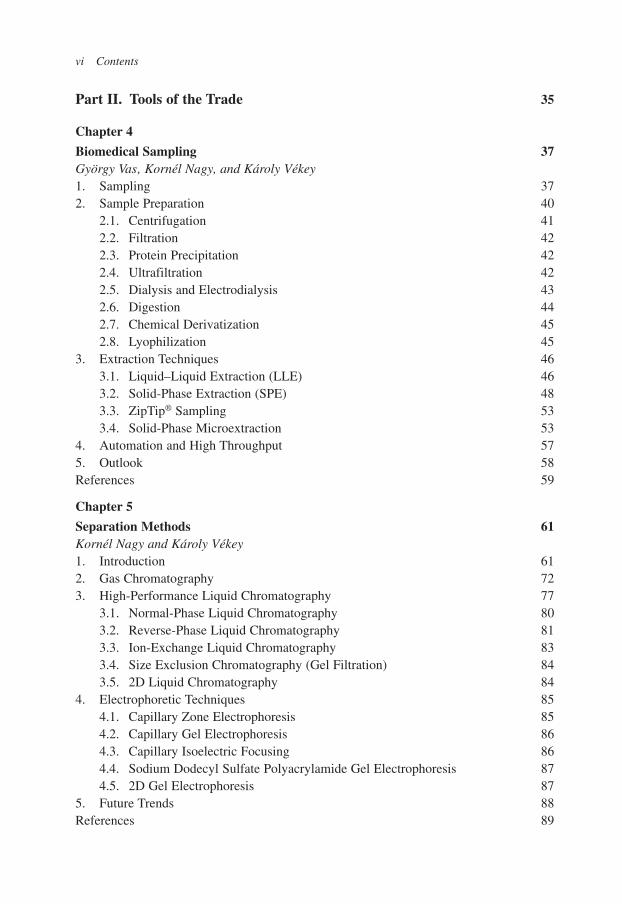
Biomedical Sampling 37György Vas, Kornél Nagy, and Károly Vékey1. Sampling 372. Sample Preparation 40
2.1. Centrifugation 412.2. Filtration 422.3. Protein Precipitation 422.4. Ultrafiltration 422.5. Dialysis and Electrodialysis 432.6. Digestion 442.7. Chemical Derivatization 452.8. Lyophilization 45
3. Extraction Techniques 463.1. Liquid–Liquid Extraction (LLE) 463.2. Solid-Phase Extraction (SPE) 483.3. ZipTip® Sampling 533.4. Solid-Phase Microextraction 53
4. Automation and High Throughput 575. Outlook 58References 59
Chapter 5
Separation Methods 61Kornél Nagy and Károly Vékey1. Introduction 612. Gas Chromatography 723. High-Performance Liquid Chromatography 77
3.1. Normal-Phase Liquid Chromatography 803.2. Reverse-Phase Liquid Chromatography 813.3. Ion-Exchange Liquid Chromatography 833.4. Size Exclusion Chromatography (Gel Filtration) 843.5. 2D Liquid Chromatography 84
4. Electrophoretic Techniques 854.1. Capillary Zone Electrophoresis 854.2. Capillary Gel Electrophoresis 864.3. Capillary Isoelectric Focusing 864.4. Sodium Dodecyl Sulfate Polyacrylamide Gel Electrophoresis 874.5. 2D Gel Electrophoresis 87
5. Future Trends 88References 89

Contents vii
Chapter 6
Mass Spectrometry Instrumentation and Techniques 93Árpád Somogyi1. Introduction 942. General Questions about Mass Measurement and Mass Spectrometry 963. Separation Techniques: Gas Chromatography (GC), and High-Performance
Liquid Chromatography (HPLC) 1004. Ionization Methods 102
4.1. Electron Impact (EI) Ionization 1044.2. Chemical Ionization (CI) 1084.3. Fast-Atom Bombardment (FAB) and Liquid Secondary Ion Mass
Spectrometry (LSIMS) 1104.4. Electrospray Ionization (ESI) 1114.5. Atmospheric Pressure Chemical Ionization (APCI) 1154.6. Matrix-Assisted Laser Desorption/Ionization (MALDI) 116
5. Mass Analyzers 1195.1. Time-of-Flight (TOF) Analyzers 1205.2. Interaction with Electrostatic Fields: Electrostatic (ESA)
and Orbitrap (OT) Analyzers 1235.3. Interactions with a Magnetic Field: Magnetic (B) Analyzer 1245.4. Interactions with a Magnetic and Electrostatic Field: Ion Cyclotron
Resonance (ICR) Analyzers 1255.5. Interaction with Electromagnetic Fields: Quadrupole (Q) Analyzers 1275.6. Interaction with Electromagnetic Fields: Linear Ion-Trap Quadrupole
(LTQ) Analyzers 1285.7. Interaction with Electromagnetic Fields: Three-Dimensional Quadrupole
Ion Trap (3D QIT) Analyzers 1296. Tandem Mass Spectrometry (MS/MS) 1307. Selected Terms for Clarification 135Acknowledgment 137References 137
Chapter 7
Chemoinformatics—Multivariate Mathematical–Statistical Methods for Data Evaluation 141Károly Héberger1. Introduction 1412. Data Types and Data Pretreatment 143
2.1. Data Types 1432.2. Arrangement of Data 1442.3. Data Pretreatment 145
3. Multivariate Methods 1463.1. Principal Component Analysis (PCA) 148

viii Contents
3.2. Cluster Analysis (CA) 1493.3. Multiple Linear Regression (MLR) 1513.4. Linear Discriminant Analysis (LDA) and Canonical Correlation
Analysis (CCA) 1523.5. Partial Least Squares Projection of Latent Structures (PLS) 1543.6. Classification and Regression Trees (CART) 1563.7. Artificial Neural Networks (ANN) 1573.8. Some Methods of Variable Selection 158
4. Selected Applications of Chemometrics 162Terms and Terminology 164References 166
Part III. Biomolecules 171
Chapter 8
Mass Spectrometry in Proteomics 173Akos Vertes1. Introduction 1732. Methods in Proteomics 176
2.1. Peptide Mapping 1772.2. Peptide Fragmentation 1792.3. Sequence Tags 1822.4. De Novo Sequencing 1832.5. Electron Capture and Electron Transfer Dissociations 1842.6. Quantitative Proteomics 1862.7. Higher Order Structures 1872.8. Mapping Protein Function 189
3. Outlook 190References 191
Chapter 9
De Novo Sequencing of Peptides 195Matthew T. Olson, Jonathan A. Epstein, and Alfred L. Yergey
Chapter 10
Protein Bioinformatics 203Peter McGarvey, Hongzhan Huang, and Cathy H. Wu1. Highlights for Medical Professionals 2032. Introduction 2053. Methodology 206
3.1. UniProt Sequence Databases 2063.2. PIRSF Protein Family Classification 207

Contents ix
3.3. iProClass Integrated Protein Database 2103.4. NIAID Proteomic Bioinformatics Resource 212
4. Discussion 2145. Future Trends 215
5.1. iProLINK Literature Mining Resource 2155.2. iProXpress Knowledge System for Gene Expression
and Proteomic Data Analysis 2176. Conclusions 219Acknowledgments 220References 220
Chapter 11 Analysis of Complex Lipidomes 223Andreas Uphoff, Martin Hermansson, Perttu Haimi, and Pentti Somerharju1. Introduction 2242. Methodology 226
2.1. Lipid Extraction 2262.2. Mass Spectrometry 2262.3. Data Analysis 229
3. Phospholipids 2303.1. Phosphatidylcholine and Sphingomyelin 2303.2. Phosphatidylethanolamine 2323.3. Phosphatidylserine 2323.4. Phosphatidylglycerol, Lysobisphosphatidic Acid, and Phosphatidic Acid 2333.5. Cardiolipin 2333.6. Phosphatidylinositol and Polyphosphoinositides 234
4. Acylglycerols 2344.1. Triacylglycerols 2344.2. Diacylglycerols and Monoacylglycerols 235
5. Sphingolipids 2355.1. Free Sphingoid Bases 2355.2. Ceramides 2365.3. Neutral Glycosphingolipids 2365.4. Sulfatides 2365.5. Gangliosides 237
6. Sterols 2376.1. Cholesterol and Other Sterols 2376.2. Steryl Esters and Steroid Hormones 238
7. Medical Applications of MS-Lipidomics 2387.1. Diagnostics and Therapy 2387.2. Disease Mechanisms 2397.3. Nutrition and Other Issues 239

x Contents
8. Future Trends 2409. Conclusions 240References 240
Part IV. Selected Medical Applications 251
Chapter 12
Medical Laboratory Practice—Possibilities for Mass Spectrometry 253Olaf Bodamer 1. Introduction 2532. Quality Management 2543. Inborn Errors of Metabolism 254
3.1. Analysis of Homocysteine 2553.2. Analysis of Organic Acids Including Orotic Acid 2573.3. Analysis of Oligosaccharides 2573.4. Analysis of Lysosomal Enzyme Activities 258
4. Assessment of In Vivo Metabolism Using Stable Isotope Techniques 2585. Conclusions 259References 259
Chapter 13
Therapeutic Drug Monitoring and Measurement of Drug Concentrations Using Mass Spectrometry 263András Telekes, Márta Hegedus, and István Kiss1. Introduction 2632. Antiinfection Drugs 2673. Drugs Acting on the Central Nervous System (CNS) 2714. Cardiovascular Drugs 2735. Anticancer Agents 2766. Analgesics 2807. Miscellaneous Drug Classes 283References 285
Chapter 14
Mass Spectrometry of Infectious Pathogens 291Plamen A. Demirev1. Introduction 291
1.1. Highlights for Medical Professionals 2931.2. Highlights for Chemists 294
2. Methodology 2952.1. MALDI MS-Based Methods for Bacillus Spore Species
Characterization 295

Contents xi
2.2. LD MS Detection of Plasmodium Parasites in Blood 3012.3. Other MS-Based Methods for Pathogen Detection/Identification 304
3. Future Trends and Prospects 305References 305
Chapter 15
Proteomics of Viruses 309Anne Pumfery, Reem Berro, and Fatah Kashanchi1. Introduction 310
1.1. Highlights for Medical Professionals 3101.2. Highlights for Chemists 314
2. Virus–Host Interactions 3172.1. Proteomics of Herpesvirus Virions 3182.2. Proteomics of Epstein–Barr Virus 3192.3. Proteomics of Herpes Simplex Virus 3212.4. Proteomics of Retroviruses—HIV and HTLV 3222.5. Proteomics of Hepatitis C Virus and Hepatocellular Carcinoma 324
3. Diagnostics 3253.1. 2DE-MS: SARS, HBV, HCV, and HIV-1 3253.2. LC–MS: HIV-1 and HCV 3273.3. SELDI ProteinChip: SARS, HIV, and Hepatitis 3283.4. Protein Microarray: Vaccinia Virus 330
4. Discussion 3315. Future Trends 3346. Conclusions 335Acknowledgments 336References 336
Chapter 16
Neonatal Research 345Bruno Casetta 1. Introduction 346
1.1. Essential Medical Concepts 3461.2. Basic Concept of Using LC–MS/MS Technology in the
Clinical Domain 3472. Principle of the Methodology 3483. Quick Reference for Practical Implementation of the Methodology 349
3.1. Extraction 3503.2. Butylation 3503.3. Analytical Equipment 3513.4. Analytical Measurement 3513.5. Expected Performances 352

xii Contents
4. Key Points of the Methodology 3564.1. Quantitation Assessment 3564.2. Derivatization 3564.3. FIA Flow Rate Regime 3584.4. MS Scanning Strategies 3624.5. Data Processing 364
5. Ongoing Extensions of NBS 3665.1. Extended Panel of Amino Acids 3665.2. Very Long Chain Fatty Acids 3695.3. Steroids 3695.4. Bile Acids 371
6. Conclusions 374Acknowledgments 376References 376
Chapter 17
Applications of Mass Spectrometry in Oncology 379John Roboz 1. Introduction 3802. New Methodology—SELDI–TOF–MS 381
2.1. Protein Chips 3812.2. Identification 3822.3. Proteomic Pattern Diagnostics 3832.4. Problems and Prospects 384
3. Other Relevant Methodological Challenges 3843.1. Analysis of Cells 3843.2. Direct Tissue Analysis and Imaging MS 3843.3. The Problem of Dynamic Ranges 3843.4. Low-Abundance, Low-Molecular Mass Proteins or Drugs in Plasma/Serum 3853.5. Quantification 385
4. Diagnostic Oncoproteomics Based on SELDI–TOF–MS 3864.1. Ovarian and Endometrial Cancer 3874.2. Breast Cancer 3874.3. Prostate Cancer 3894.4. Pancreatic Cancer 3904.5. Bladder Cancer 3904.6. Head and Neck Cancer 3914.7. Miscellaneous Malignancies 3914.8. Other Searches for Biomarkers Using SELDI–TOF–MS 393
5. Representative Other Applications 3935.1. Proteomic Studies to Uncover Molecular Mechanisms Associated
with Malignancies 393

Contents xiii
5.2. Proteomic Profiles to Provide Predictors of Drug-Modulated Targets and Responses 394
5.3. Profiles to Identify Proteins Associated with Disease Progression 3945.4. Targeted Biomarker Detection Via Whole Protein Analysis 3955.5. Sphingolipids in Cancer Pathogenesis and Treatment 3955.6. Quantification of Antineoplastic Drugs 3955.7. Helicobacter Pylori 3955.8. Molecular Epidemiology for Chemoprevention 3975.9. Selenium 397
References 398
Chapter 18
Application of Mass Spectrometry in Brain Research:Neurotransmitters, Neuropeptides, and Brain Proteins 407Laszlo Prokai1. Introduction 4072. Methodology 408
2.1. Neurotransmitters 4082.2. Neuropeptides 4092.3. Brain Proteins (Neuroproteomics) 411
3. Discussion 4173.1. Neurotransmitters 4173.2. Neuropeptides 4173.3. Neuroproteomics 419
4. Future Trends 4205. Conclusions 421Acknowledgments 421References 421
Chapter 19
The Human Pituitary Proteome: Clinical Applications 425Xianquan Zhan, Harold Sacks, and Dominic M. Desiderio1. Introduction 426
1.1. Proteomics, Functional Proteomics, and Comparative Proteomics 4261.2. The Pathophysiological Basis of Pituitary Adenoma Comparative
Proteomics 4281.3. Basic Techniques Used for Studying Proteomics 428
2. The Pituitary Gland and Mass Spectrometry: An Endocrinologist’sPerspective 430
3. Methodology 4323.1. Gel-Based Comparative Proteomics of Human Pituitary
Adenoma Tissues 433

xiv Contents
3.2. The Proteomics of PTM Proteins in Human Pituitary Adenomas 4413.3. Challenge of Comparative Proteomics in the Study of Human
Pituitary Adenomas 4454. Discussion 446
4.1. Insights into the Basic Molecular Mechanisms of PituitaryTumor Formation 446
4.2. Discovery of Potential Biomarkers Related to Pituitary Adenomas 4494.3. Pituitary Hormone Isoforms in Human Pituitary Adenomas 449
5. Future Trends 4525.1. Combination of Gel-Proteomics and Non-Gel Quantitative
Proteomics 4525.2. Comparative Proteomics Studies of PTM Proteins in Human
Pituitary Adenomas 4525.3. Integration of Proteomics and Transcriptomics to Study Human
Pituitary Adenomas 4535.4. Protein Chips Coupled with Mass Spectrometry to Study Human
Pituitary Adenomas 4536. Conclusions 454Acknowledgments 455References 455
Chapter 20
Mass Spectrometry of Proteinous Allergens Inducing Human Diseases 459Martina Marchetti, Jasmin Hirschmann, Elisabeth Förster-Waldl,and Günter Allmaier1. Introduction 459
1.1. Highlights for Medical Professionals 4621.2. Highlights for Chemists 463
2. Methodology 4653. Mass Spectrometric Identification of Proteinous Allergens 4694. Future Trends 4775. Conclusions 479References 480
Chapter 21
Mass Spectrometry in Clinical Treatment 487András Telekes, Márta Hegedus, and István Kiss1. Introduction 4872. Pediatrics 4903. Oncology 493References 499

Contents xv
Part V. Emerging Areas 503
Chapter 22
Biomarker Discovery 505Bradley J. Thatcher and Emilia Caputo1. Introduction 506
1.1. Chemical Background for Medical Doctors 5061.2. Basic Medical Aspects 5071.3. Basic Concepts 507
2. Biomarkers in Medicine 5083. Important Definitions 5094. Biomarkers Discovery and Complexity of Biological Systems 5105. Biomarker Discovery and “Omics” 5126. The Biomarker Discovery Project 512
6.1. The Biomarker Discovery Group 5126.2. The Biomarker Discovery Experiment 513
7. Challenges in the Biomarker Discovery Pathway 5167.1. Asking the Right Question 5167.2. Sample Availability 5187.3. Which Sample Should Be Used? 5197.4. Sample Management 520
8. Technical Issues in Experimental Design 5228.1. Sample Preparation 5228.2. Separation Technique 5248.3. Bioinformatics 5248.4. Methods 525
9. The discovery Process Overview 5269.1. Tools for Biomarker Discovery 5269.2. Biomarker Identification and Validation 527
10. Conclusions 530References 531
Chapter 23
Molecular Imaging by Mass Spectrometry 533Sarah A. Schwartz and Richard M. Caprioli1. Introduction 5332. Methods 535
2.1. Sample Preparation 5352.2. Biological Applications 540
3. Discussion 5474. Future Trends 549

xvi Contents
5. Conclusion 550Acknowledgments 551References 551
Chapter 24
Brief Outlook 555Károly Vékey, András Telekes, and Akos Vertes1. Trends in Instrumentation 5562. Emerging Systems Approach 5583. Mass Spectrometry in Translational Medicine 559Index 561

List of Contributors
Günter AllmaierInstitute of Chemical Technologies and Analytics, Vienna Universityof Technology, Vienna, Austria
Reem BerroDepartment of Biochemistry and Molecular Biology, The George WashingtonUniversity, Washington, DC 20037, USA
Olaf BodamerDivision of Biochemical and Paediatric Genetics, University Children’sHospital, Vienna, Austria
Richard M. CaprioliDepartment of Biochemistry and the Mass Spectrometry Research Center,Vanderbilt University School of Medicine, Nashville, TN 37232-8575, USA
Emilia CaputoInstitute of Genetics and Biophysics-IGB, CNR, Naples, Italy
Bruno CasettaApplied Biosystems, Monza, Italy
Plamen A. DemirevJohns Hopkins University Applied Physics Laboratory, 11100 Johns HopkinsRoad, MS 2-217, Laurel, MD 20723–6099, USA
Dominic M. DesiderioCharles B. Stout Neuroscience Mass Spectrometry Laboratory, Universityof Tennessee Health Science Center, 847 Monroe Avenue, Memphis,TN 38163, USAandDepartment of Neurology, University of Tennessee Health Science Center,847 Monroe Avenue, Memphis, TN 38163, USA
Jonathan A. EpsteinNational Institute of Child Health and Human Development, NIH, Bethesda,MD, USA

xviii List of Contributors
Elisabeth Förster-WaldlDepartment of Paediatrics and Juvenile Medicine, Medical University of Vienna,Vienna, Austria
Perttu HaimiInstitute of Biomedicine, Department of Biochemistry, University of Helsinki,00014 Helsinki, Finland
Károly HébergerChemical Research Center, Hungarian Academy of Sciences, Budapest, Hungary
Márta HegedusNational Institute of Oncology, Budapest, Hungary
Martin HermanssonInstitute of Biomedicine, Department of Biochemistry, University of Helsinki,00014 Helsinki, Finland
Jasmin HirschmannInstitute of Chemical Technologies and Analytics, Vienna Universityof Technology, Vienna, Austria
Hongzhan HuangDepartment of Biochemistry and Molecular & Cellular Biology, GeorgetownUniversity Medical Center, Reservoir Road, NW, Washington, DC 20057-1455,USA
Fatah KashanchiDepartment of Biochemistry and Molecular Biology, The George WashingtonUniversity, Washington, DC 20037, USAandThe Institute for Genomic Research, Rockville, MD 20850, USA
István KissSt. Imre Government Teaching Hospital, Budapest, Hungary
Martina MarchettiInstitute of Chemical Technologies and Analytics, Vienna University ofTechnology, Vienna, Austria
Peter McGarveyDepartment of Biochemistry and Molecular & Cellular Biology, GeorgetownUniversity Medical Center, Reservoir Road, NW, Washington, DC 20057-1455,USA

List of Contributors xix
Kornél NagyChemical Research Center, Hungarian Academy of Sciences, Budapest,Hungary
Matthew T. OlsonNational Institute of Child Health and Human Development, NIH, Bethesda,MD, USA
Laszlo ProkaiDepartment of Molecular Biology & Immunology, University of North TexasHealth Science Center, Fort Worth, TX 76107, USA
Anne PumferyDepartment of Biochemistry and Molecular Biology, The George WashingtonUniversity, Washington, DC 20037, USA
John RobozDivision of Hematology/Oncology, Department of Medicine, Mount Sinai Schoolof Medicine, 1 Gustave Levy Place, New York, NY 10029, USA
Harold SacksDivision of Endocrinology, University of Tennessee Health Science Center,847 Monroe Avenue, Memphis, TN 38163, USA
Sarah A. SchwartzMidwest Research Institute, Kansas City, MO 64110-2241, USA
Pentti SomerharjuInstitute of Biomedicine, Department of Biochemistry, University of Helsinki,00014 Helsinki, Finland
Árpád SomogyiDepartment of Chemistry, University of Arizona, Tucson, AZ, USA
András TelekesNational Institute of Oncology, Budapest, Hungary
Bradley J. ThatcherCiphergen, Italy
Andreas UphoffInstitute of Biomedicine, Department of Biochemistry, University of Helsinki,00014 Helsinki, Finland

xx List of Contributors
György VasCordis Corporation, Analytical Technologies, Pharmaceutical & PackageDevelopment, Welsh & McKean Roads, P.O. Box 776, Spring House,PA 19477-0776, USA
Károly VékeyChemical Research Center, Hungarian Academy of Sciences, Budapest, HungaryandHungarian Academy of Sciences, Chemical Research Center, HungarianAcademy of Sciences, Pusztaszeri ut 59-67, Budapest 1025, Hungary
Akos VertesW.M. Keck Institute for Proteomics Technology and Applications, Department ofChemistry, The George Washington University, Washington, DC, USA
Cathy H. WuDepartment of Biochemistry and Molecular & Cellular Biology, GeorgetownUniversity Medical Center, Reservoir Road, NW, Washington, DC 20057-1455,USA
Alfred L. YergeyNational Institute of Child Health and Human Development, NIH, Bethesda,MD, USA
Xianquan ZhanCharles B. Stout Neuroscience Mass Spectrometry Laboratory, University ofTennessee Health Science Center, 847 Monroe Avenue, Memphis, TN 38163,USAandDepartment of Neurology, University of Tennessee Health Science Center, 847Monroe Avenue, Memphis, TN 38163, USA
Preface
The next frontier for mass spectrometry (MS) lies in medicine. This book providesevidence for this proposition and will help to realize it. Over the past 25 years, MSand its accompanying technology, has been driven to a significant degree by theaim of achieving successful application to all classes of biological molecules. It isworthwhile to consider this objective and the methods used to achieve it, in partbecause it embraces many of the results recounted in this text. Such a retrospec-tive also provides guidance for the future as to the likely course of developmentsin MS as it engages ever more directly with the medical sciences and with clini-cal practice.
The main objective which has driven MS over the past quarter century was re-freshingly clear-cut . . . it was the desire to ionize any type of molecule and to ob-tain characteristic molecular mass and structural information with which toachieve identification. The result of this focused effort was the development ofionization methods applicable to an immense variety of chemical and biochemicalmolecular types, present in samples encompassing an array of physical states.Complementary technology was developed to allow the dissociation of particularions so as to provide structural information from the characteristic fragmentationprocesses. The successes in ionization are evident from the large amount of spacedevoted to electrospray ionization (ESI) and matrix-assisted laser desorption ion-ization (MALDI) the standard methods for analyzing biomolecules in solutionand in the condensed phase, respectively. Chapter 6 includes basic coverage of theionization methods; their applications are to be found in many other chaptersthroughout the text. The same chapter introduces the different types of mass ana-lyzers used in mass spectrometry; these devices are based on various physicalprinciples and have complementary advantages. Each has legions of supporters.The successes achieved in developing methods of producing characteristic frag-ments from specific compounds are dependent on the ability to carry out tandemmass spectrometry, (MS/MS), that is, the ability to perform experiments on spe-cific mass-selected ions. These experiments often involve collisions of ions withneutral atoms or molecules (collision induced dissociation) but there is stronginterest in alternatives such as those in which dissociation is a consequence ofelectron capture (electron capture dissociation, ECD) or electron transfer (electrontransfer dissociation, ETD). These techniques have developed rapidly in the pastfew years and are widely applied to the characterization of proteins.
The technologies described here have had major effects in developing new par-adigms in biology. The mass spectrometry developments, in conjunction with

xxii Preface
chromatographic methods which achieve sample separation and automatedintroduction into the mass spectrometer (described in Chapter 5), have led to greatsuccess is characterizing and quantifying proteins (the topic of Chapter 8). Themethod of protein sequencing in which they are degraded to peptides and the pep-tides are sequenced by MS/MS (the “bottom up” methodology) is one of the out-standing achievements of modern mass spectrometry and biology. This, and othercontributions from mass spectrometry, has played a key role in the birth of the fieldof proteomics. The subject is taken up in detail in several chapters (Ch. 8–10, 15)with appropriate emphasis on the need for greatly enhanced methods of automateddata handling and interpretation.
The related topics of metabolomics and lipidomics (Chapter 11) are also, in sig-nificant part, outgrowths of research and developments in mass spectrometry. Thistext contains fascinating chapters on the applications of mass spectrometry to avariety of problems including for example drug and drug metabolite monitoring,(Chapter 13), a classic field in which chromatography and mass spectrometry areused in combination for quantitation of trace amounts of specific compounds incomplex biofluids. Similarly the treatment of infectious pathogens (Chapter 14)presents the range of application of mass spectrometry and its growing potentialto contribute to clinical diagnostics. There are few more striking examples of thislatter application to neonatal screening (Chapter 16), an application that relies onMS/MS methods.
In considering these and other successful applications of MS to biological sam-ples it is worth noting that some objectives have not been fully realized. Thismeans that there is considerable room for future advances. Notable among unre-alized objectives are:
(i) Ionization is inefficient, never more than 0.1%; (ii) The dynamic range ofMS is limited in real (complex) sample analysis; (iii) The application of MS to chi-ral and other stereoisomers has been limited; (iv) Quantitative analysis is achievedby methods that are strongly dependent on solution chemistry and which are slowand relatively expensive. In spite of the strong progress in applying mass spec-trometry in some areas of medicine and biochemistry, there are other areas inwhich much more progress can be and is likely to be made in the future. Areas ripefor progress include (i) Nucleic acids, a subject in which extensions of the molec-ular weight range has been far less successful than in the protein area; (ii) Proteincomplexes, currently an emerging area as instrumentation and methods capable ofproviding high quality data at high mass become available; (iii) Lipids, where thecomplex structure/fragmentation patterns have been incompletely elucidated;(iv) Glycoproteomics and (v) Quantitative proteomics, especially for low copynumber proteins.
The retrospective discussion which this Preface has followed provides a vantagepoint for attempting to discern likely significant future developments. The trendsand achievements just noted refer to the application of mass spectrometry to

Preface xxiii
traditional qualitative and quantitative analysis of biomolecules, albeit biomoleculesin complex solutions. There are other, quite different ways in which mass spec-trometry might in future be useful in medicine. The driving forces for the next stageof development of MS and its applications to medicine include the following:
Imaging mass spectrometryIn situ mass spectrometryIn vivo mass spectrometry
These new tools will allow applications of MS in medicine which go far be-yond biochemistry (and far deeper into biochemistry) to include pathology andforensics and clinical diagnosis. Brief consideration of each of these topics isworthwhile.
The use of mass spectrometry to create molecular images of the distribution ofcompounds in biological material, discussed in Chapter 24, is an experiment thathas rapidly come to the fore in the past decade. There are (as is so often the case inmass spectrometry) several different ways to do the experiment, including MALDIimaging and secondary ion mass spectrometry. These are not rapid experiments butthey provide remarkable spatial and chemical resolution and are beginning to con-tribute significantly to the discovery of biomarkers for disease. In respect to thesecond item, mass spectrometers have generally been designed for the lab environ-ment, not the bedside or operating room. However, a new generation of miniaturemass spectrometers is emerging with capabilities for biomolecule analysis; such insitu instruments may well be major drivers of future progress in clinical practice.The third of these capabilities—in vivo experiments using mass spectrometry—isyet to be realized. However, the conjunction of new ionization experiments inwhich the sample is in the ambient environment—especially the desorption elec-trospray ionization (DESI) method—with the emergence of miniature mass spec-trometers makes this a credible objective.
Graham CooksHenry B. Hass Distinguished ProfessorDepartment of ChemistryPurdue University

This page intentionally left blank

Part IMotivation and Essentials

This page intentionally left blank

Medical Applications of Mass SpectrometryK. Vékey, A. Telekes and A. Vertes (editors)© 2008 Elsevier B.V. All rights reserved
3
Chapter 1
Introduction
AKOS VERTESa,* and KÁROLY VÉKEYb,1
aW. M. Keck Institute for Proteomics Technology and Applications, Department of Chemistry,The George Washington University, Washington, DC, USAbChemical Research Center, Hungarian Academy of Sciences, Budapest, Hungary
Mass spectrometry took the biomedical field by storm. The cross-fertilization ofthese fields was sparked by the confluence of technological development in novelion sources during the late 1980s and the mounting needs for accurate molecularanalysis in biology and medicine. Although the existing technologies at the time,e.g., gel electrophoresis and high-performance liquid chromatography, weresimple and ubiquitous, the accuracy of the obtained information was insufficientand the data were slow in coming. For example, gel-based separations coulddetermine the molecular weight of unknown proteins, but the results were reportedin kilodaltons. Identifying a protein as a 10-kDa molecule through gelelectrophoresis left �10% or up to 1 kDa uncertainty in its size. Thus, exploringcrucial posttranslational modifications, key regulators of protein function, was nota simple matter.
At the same time, mass spectrometry offered exquisite details on the mass andstructure of small (�5000 Da) molecules but was unable to efficiently ionize largerones. The dilemma of the mid-1980s is illustrated in Fig. 1. The results of a two-dimensional gel electrophoresis separation of kidney proteins showed a wealth ofinformation in the �5000 Da range. Results from mass spectrometry, however, leftoff all molecular species in this region. The lack of efficient ion sources for thesemolecules started a decade-long race to produce gas-phase ions from ever largermolecules. This quest culminated in the discovery of electrospray ionization (ESI)and matrix-assisted laser desorption ionization (MALDI) by the end of the decade.Almost overnight, molecules with masses in excess of 100 kDa could be studied by
*Corresponding author. Tel.: �1-202-994-2717; Fax: �1-202-994-5873.E-mail: [email protected] (A. Vertes).1E-mail: [email protected].

4 A. Vertes and K. Vékey
Fig. 1. Gel-separated proteins in human kidney from the SWISS-2DPAGE database (http://www.expasy.org/swiss-2dpage/). In the early 1980s, detecting any species above �5000 Da (right tothe dashed line) was an insurmountable challenge for mass spectrometry. Yet gel electrophoresisshowed that a wealth of information was available on crucial biomedical species in this region. Thelack of efficient ion sources for these molecules started a decade-long race to produce gas-phase ionsfrom ever larger molecules.
Mw (Kd)
10 20 30 50 70 100 200
pH
4.0
5.0
5.5
6.0
6.5
7.0
7.5
8.0
4.5
mass spectrometry. The ensuing interest reordered the landscape of mass spec-trometry and laid the foundations of new scientific disciplines (e.g., proteomics).
In the wake of these discoveries, established instrument manufacturers (pro-ducing sector instruments) became marginalized and others that were quick toembrace the new technology rose to prominence. The opportunity to explore largebiomolecules attracted the attention of academia, government, and industry alike.On the scholarly level, the new insight promised a vastly improved understandingof the molecules of life. On a practical level, it enabled the design of smart drugsthat specifically targeted the cellular processes related to a particular disease.
It is anticipated that in a few years mass spectrometers will be routinely used inclinical settings. With the availability of dedicated instrumentation and the expand-ing discovery of disease biomarkers, diagnostic laboratories will increasingly turn

Introduction 5
to mass spectrometric methods. Assessment of treatment efficacy and monitoringof patient recovery will also be aided by this technology. At the research level, massspectrometry is fast becoming an indispensable tool for the biomedical profes-sional. The current generation of medical students and biologists are being trainedthrough their regular degree education in this highly technical field. Training work-shops, certificate courses, and continuing education are trying to fill the gapbetween the increasingly sophisticated new techniques and the limitations of tradi-tional training in bioanalysis.
Fuelled by the emergence of new disciplines, e.g., proteomics and bioinformat-ics, there is a rapidly increasing demand for advanced information both inlaboratory and in classroom settings. Publishers are scrambling to fill these needs.For example, in 2001 and 2002, there were �19 new volumes published in the fieldof proteomics alone. Although some of these publications are excellent in convey-ing the latest information and techniques, most medical professionals and biologistsneed a more introductory treatise. Indeed, based on surveying the general field ofmass spectrometry in the life sciences, this seems to be a significantly underservedniche in these publications. With a few exceptions, there are no mass spectrometrybooks published specifically dedicated to biomedical professionals.
The structure and the content of this book targets readers at the full spectrum ofthe advanced student–professional–specialist level. For example, parts of the bookwere successfully adopted as a high-level text in the Genomics and BioinformaticsMasters Program at the George Washington University (e.g., in the course“Fundamentals of Genomics and Proteomics”) and in our doctoral programs. Inaddition, various courses offered by the Department of Chemistry (e.g., “Ions: Wetand Dry” and “Mass Spectrometry in Life Sciences”) capitalized on the text.Although online learning technologies enhance the student experience, the avail-ability of a comprehensive text is of great help. Owing to its broad scope, the bookcan also serve as a desk reference for professionals and specialists.
Producing this volume amidst the vigorous development of a continuouslyevolving field, even with our excellent group of contributors, was a challenge.Like in any emerging field, in biomedical mass spectrometry there are “childhooddiseases” associated with the employed tools and the methods themselves.Sometimes inappropriate technology is being developed or legitimate approachesend up in inefficient combinations. For example, biomarker discovery with low-resolution mass spectrometers can produce less than convincing data. In othercases—no names are named here—enthusiastic investigators overinterpret theirdata and “discover” long-sought biomarkers. Although these cases can be embar-rassing, the natural evolution of the discipline is sure to correct such blunders.These problems are common in emerging and fast-growing fields everywhere andcannot subtract from the tremendous value produced by the interaction ofbiomedical fields and mass spectrometry. Therefore, we ask the reader not to lookat this book as a finished picture but as the beginning of a long movie.

6 A. Vertes and K. Vékey
We made sure that the areas that are mature, such as the foundations of massspectrometry and its application as a research tool in the medical fields, arethoroughly and accurately discussed. The clinical applications relevant for thepracticing physician at the bedside (with the exception of pediatrics) are still intheir infancy with only tentative and fragmented information available. Some ofthe related chapters were written by medical professionals who summarized theavailable information and lent their unique perspective to these chapters.
The book is built of five main parts. In the first part, essential information onanalytical concepts and mass spectrometry is summarized. Specifics of the ethical,legal, and safety aspects of medical research are also included here. The secondpart focuses on four essential tools of the trade: biomedical sampling, separationmethods for complex mixtures, a broad foundation in mass spectrometry, and thechemoinformatics principles used in data analysis. The next part demonstrateshow to use mass spectrometry for select classes of biomolecules. Here we mainlyfocus on peptides and proteins, as these are the molecules that have primarilydriven the field. Following short introductions to proteomics, de novo sequencing,and the related bioinformatics, the application of mass spectrometry in lipidresearch is discussed. Clearly, there are numerous other compound groups thatcould have been included here. Metabolomics, the systematic study of small mol-ecules in living organisms, or glycomics, the field specialized on oligosaccharides,would also deserve their chapters. Unfortunately, we failed to convince the expertsin these fields to contribute, so these chapters have to wait for future editions.
The main body of the book in part four is devoted to selected medical applica-tions. Here too, originally we wanted to secure a chapter for every major medicaldiscipline. However, this did not quite work out. Some medical fields are slowerto adapt new technologies than others. At the outset, some are less amenable to theapplication of mass spectrometry. Most fields are still researching the utility ofmass spectrometry, i.e., the methods are not yet in the hands of clinicians.Eventually, we worked out a tradeoff. We asked some top scientists to write abouttheir fields of specialization and some practicing doctors to summarize the variousmedical applications from their point of view. The concluding part of the bookgives a glimpse of some emerging areas including biomarker discovery andmolecular imaging by mass spectrometry. These exciting applications promise torevolutionize medical diagnostics and drug development.
We envision that in the not-too-distant future clinical laboratories will augmenttheir microscopes, centrifuges, and Coulter counters with oligonucleotide micro-array readers and mass spectrometers. As genetics and proteomics are makingheadways into the decision making of practicing physicians, we hope that thisvolume can be of help along the way.

Medical Applications of Mass SpectrometryK. Vékey, A. Telekes and A. Vertes (editors)© 2008 Elsevier B.V. All rights reserved
7
Chapter 2
Basics of analytical chemistry and massspectrometry for medical professionals
KÁROLY VÉKEYa,* and ANDRÁS TELEKESb
aChemical Research Center, Hungarian Academy of Sciences, Budapest, HungarybNational Institute of Oncology, Budapest, Hungary
1. Introduction 72. Terms and definitions 93. The analytical procedure 114. A case study: analysis of plasma sterol profile 145. Mass spectrometry 16Reference 18
1. Introduction
In medical sciences, emphasis is increasingly placed on instrumental techniquesand accurate, quantitative measurements. It is especially apparent in diagnosis,where imaging techniques and laboratory results have became invaluable andcompulsory. Breakthroughs in biochemistry made it possible to characterize phys-iological processes and living organisms at the molecular level. This led to aproliferation of, e.g., DNA tests and the use of biomarkers in daily clinical practice.Characterization of molecular structure and determination of the composition of amixture are the fields of analytical chemistry and analytical biochemistry. There isno clear borderline between them; in the following discussion both will be indicat-ed as analytical chemistry. In a medical environment, this shows a large overlapwith laboratory analysis.
The objective of analytical chemistry is to determine the composition of asample. It means the identity, molecular structure, quantity, and concentration of in
*Corresponding author. Tel.: �361-438-1158; Fax: �361-438-1157. E-mail: [email protected].

8 K. Vékey and A. Telekes
principle all, but in practice some, components of the sample. In most cases we aredealing with complex mixtures, such as blood, urine, or tissue. Complete chemicalanalysis (identifying and quantifying all components) in such a case is notrequired, but is not even possible with current technologies. Typically either a fewtarget compounds or a wide range of a given class of compounds (e.g., proteins)are detected, identified, and possibly also quantified. Classes of compounds (e.g.,total protein content) may also be measured, while in other cases minor structuraldeviations (such as single nucleotide polymorphism) are characterized. In applica-tion fields, like in most pharmaceutical analyses, all compounds above a certainthreshold (e.g., 0.1 or 0.01%) need to be accurately characterized.
In chemical and biochemical analysis first a given compound needs to beidentified and its structure determined. Structural studies are most often performedby spectroscopy (mostly nuclear magnetic resonance (NMR) but also IR or UV),X-ray diffraction, or mass spectrometry, although a large number of othertechniques are used as well. There are techniques (notably NMR and X-raydiffraction) capable of determining the structure of molecules with no or minimalprior information (up to approximately 1000 Da molecular mass), but thesetypically require a relatively large amount of pure compound (e.g., 1 mg). Othermethods for structure determination, such as IR, UV spectroscopy, or mass spec-trometry, also yield valuable structural information, e.g., mass spectrometry isexcellent for protein sequencing. These latter techniques have the advantage ofrequiring less sample (even 10�9 or 10�12 g may be sufficient) and are well adapt-ed to deal with complex materials (e.g., plasma). Structure determination ofmacromolecules is more challenging, usually requiring the use of several differentmethods in combination.
Identification of known compounds is less demanding than the structuredetermination of an unknown. It is also based on molecular characterization, e.g.,spectral features (as discussed earlier), chromatographic retention time, andcomparison with standards of known structure. The reliability of identification is acritical issue. Several decades ago the chromatographic retention time itself wasoften accepted as proof of identification of a compound. It is no longer the case, asvarious examples of false-positive and false-negative results were found. Thecurrent trend is to require more and more detailed and specific information beforeidentification of a compound is accepted. For example, besides retention time,mass spectra and/or accurate mass measurements are also needed.
Following identification of a given compound, its amount (or concentration)needs to be determined as well (quantitation). As a given sample may containthousands of different compounds in widely differing amounts, this is not a trivialtask. Instead of structure identification and quantitation, often the biological effect(such as enzyme activity) is measured in the biomedical field. In many casesmeasurement of biochemical activity and chemical analysis are performed inparallel.

Basics of analytical chemistry and mass spectrometry 9
Analytical techniques yield information on sample composition at a given time—usually at the time of sampling (e.g., taking of blood). Time dependence ofmolecular concentrations can also be followed, like in pharmacokinetics, wherechanges in plasma concentration of a given drug are determined. These are usuallyperformed as a series of measurements on samples taken at different times.Alternatively, continuous monitoring of molecular concentrations may also beperformed. In most cases homogenized samples are studied, where spatialinformation is lost. Occasionally the sample may relate to a particular position(like the central or outer part of tumor growth), but modern analytical techniquesare capable of delivering molecular imaging as well (a usually two-dimensionaldistribution of a given molecule in a slice of tissue). These are particularlyimportant to characterize physiological and metabolic processes. Time-dependentstudies and molecular imaging not only can yield information on the state ofhealth of a given person but also may shed light on the development of disease andon physiological processes.
2. Terms and definitions
Various terms, definitions, and concepts are needed to discuss analytical results.The amount of material is measured in weight (grams, milligrams, etc.) or inmolar amounts (e.g., micromole or �mol). Concentration is also significant,measured in weight/weight, weight/volume, mole/weight, or mole/volume units(e.g., mg/g, �g/l, �mol/g, or nmol/ l). Concentration can also be specified as molarsolutions (e.g., millimolar, indicated as mM), which indicates x millimoles of sam-ple per liter of solution. Concentration may also be given as parts per million(ppm), parts per billion (ppb, 1:109), or parts per trillion (ppt, 1:1012) values (thisusually refers to weight/weight, but depending on context it may also meanmole/mole ratios).
Among the most important characteristics of an analytical process are sensitivityand selectivity (or specificity). Sensitivity means how large signal is obtained froma given amount of material and what is the signal intensity compared to the noise(S/N ratio). Noise may be due to imperfect instrumentation (“instrument” noise dueto the noise of electric circuits, scattered light, etc.) and due to “chemical” noise.The latter is due to a background of signals originating from various moleculespresent in the mixture, which interfere with analysis of the target compound(s).Even in very clean samples there are usually a large number of compounds in lowconcentration, e.g., an “ultra-pure” solvent also contains trace-level impurities.Improving instrumentation reduces instrument noise significantly, but does notreduce the chemical noise, which is becoming the major obstacle while improvingsensitivity. The chemical noise can be reduced by increasing the selectivity, asdiscussed below.

10 K. Vékey and A. Telekes
Sensitivity can be related to sample amount but more often it relates to concen-tration. It is closely connected to the limit of detection (LOD), e.g., 10 pmol LODmeans that we need at least this amount of compound for detection. “Detectable”is usually defined as a given (typically 3:1) signal-to-noise ratio. The limit of quan-titation (LOQ) is a similar term, meaning the minimum amount of compound thatcan be accurately quantified (usually at least 10–20% accuracy is required). LOQis always larger than LOD, and is often defined as a 10:1 S/N ratio. Sensitivitydepends not only on the analytical process and instrumentation but also on thematrix (i.e., whether the target compound measured is dissolved in a pure solventor plasma). Sensitivity often deteriorates when a complex matrix is used; a 100-folddecrease in sensitivity due to matrix effects is not uncommon.
This brings us to another topic, selectivity (or specificity). This characterizeshow well a compound can be measured in the presence of other compounds or in acomplex matrix. The signal of various compounds interfering with analysis can beseparated from that of the studied compound by increasing the selectivity. In ananalogous way, increasing selectivity typically reduces the chemical noise (andtherefore decreases detection limits). The specificity needed depends on theproblem studied and also on the matrix used (e.g., plasma or tissue). Selectivity isa particularly critical issue in studying isomers (e.g., measuring lathosterol in thepresence of cholesterol). To increase selectivity, the sample often needs to beseparated into several fractions or specific detectors must be used. Increasingselectivity may require the use of expensive and time-consuming analyticalmethodology, and can be increased often only at the expense of sensitivity. Mostoften a compromise is necessary among sensitivity, specificity, and the cost ofanalysis.
The quality and reliability of the obtained result are always of prime interest. Inresearch, one has to establish (and maintain and prove) the reliability of analysis;in many cases (in the majority of clinical and pharmaceutical applications) one hasto comply with regulative and administrative requirements as well. The latterrequirements are often in the form of good laboratory practice (GLP) requirements,analogous to good clinical practice in a hospital environment.
Quality of analysis is characterized by accuracy, precision, reproducibility, andrepeatability. Accuracy is the degree of agreement of a measured quantity to itsactual (true) value. Unfortunately, in the biomedical field, the “true” values areoften not known. To overcome this problem, a “consensus” value is often used.This does not necessarily represent the “true” value (of a given property of, e.g., awell-defined standard sample), but is an estimate of the “true” value accepted bythe scientific community. In such a case accuracy is defined as the degree ofagreement of a measured quantity to its accepted “consensus” value. The object isto make results obtained by diverse techniques, methodologies, and laboratoriescomparable. Precision characterizes the degree of mutual agreement among aseries of individual measurements under the same conditions. Repeatability and

Basics of analytical chemistry and mass spectrometry 11
reproducibility are similar to precision, but are more narrowly defined. All arestatistical parameters, usually expressed in units of standard deviation or relativestandard deviation. Repeatability relates to the standard deviation of a series ofreplicate measurements performed by the same person, using the same instrument,and under the same conditions. Reproducibility is also the standard deviation of aseries of replicate measurements, but in this case different persons and differentequipments may be involved. Validation is also a commonly used term (most oftenused in chromatography and in the pharmaceutical industry). This refers toestablishing evidence that a given analytical process, when operated withinestablished parameters (i.e., using solvent composition with 1% reproducibility),will yield results within a specified reproducibility. Robustness is a related termindicating the resilience of a method when confronted with changing conditions.
Speed is another characteristic of the analytical process. One aspect is samplethroughput, which may vary from one sample per week to thousands or millions ofdaily analysis. Another aspect is the time delay between sampling and obtaining theresult of analysis. Chemical and biochemical analyses are usually fast and typicallyrequire seconds or hours to perform. This is in contrast to several biological tests,which often need time (days) for growing bacterial cultures. This time delay maybe a significant factor for selecting proper treatment in serious illnesses.
The cost of analysis is also of critical importance, which is closely related to thenumber of samples analyzed. Development of analytical techniques is alwaysexpensive and time-consuming. This is the major part of the total cost whenanalysis of only a “small” number of samples is required. Analysis of 10–100 sam-ples or 10 samples per month is usually considered a “small” number compared tomore than 1000 samples or 100 samples per month (“high throughput”), althoughanalysis of 100,000 samples per year is also not uncommon. When analyzing largenumber of samples, the major part of the cost comprises labor, consumables, andinstrument time, usually in this order. For high-throughput experiments, therefore,it is always worth investing money and effort to simplify sample preparation and tospeed up analysis, even if this would necessitate using expensive instrumentationand strict quality control.
3. The analytical procedure
All projects require proper strategy and careful planning to be successful. Thisrelates to analytical chemistry as well, so all steps need to be carefully considered.The analytical procedure consists of several distinct steps; the most important are(1) sampling, (2) preparation, (3) separation, (4) analysis, and (5) evaluation. Someof these may not be needed and some may be performed in a single step. For exam-ple, when sample preparation is efficient, separation may not be necessary, whileseparation and analysis may be performed in one step using online combination of,

12 K. Vékey and A. Telekes
e.g., gas chromatography and mass spectrometry (GC–MS). Here we give a shortoutline of the analytical process; a more detailed discussion will be presented inPart II of the book (Tools of the Trade), while particular issues will be discussed insubsequent chapters.
(1) Sampling: This is the first step in any analysis. In clinical studies it is mostoften performed by an MD or by a nurse (e.g., taking blood or tissue samples).Sampling may seem to be straightforward, but it is a critical step, which has tobe designed carefully and executed accurately. The sample taken should berepresentative—easy for biological fluids and not trivial for solid samples such astissues. Analysis often uses internal standards; these should be added to the sam-ple as soon as possible, preferably immediately after sampling. Samples may bechanged or contaminated during sampling, which should be taken into accountand minimized. For example, blood samples are typically taken into vacuumtubes, but these (and often the syringes used) may contain heparin or other sub-stances to prevent clotting. Although this may be necessary, it will contaminate thesample, which has to be taken into account. The samples often are stored beforeanalysis, occasionally even for years. Sample composition may change duringstorage, which has to be minimized (and/or taken into account). The simplest andusually safest way to store samples is freezing them: most samples can be storedfor days or weeks at �20�C. Storage at �80�C is safer; most samples can be storedunder such conditions for several years without change.
(2) Sample preparation: The aim is to make the sample more amenable forsubsequent analysis. This often means removing part of the sample, e.g., bycentrifugation (to remove cells and aggregates from blood) or by extraction (whichremoves or enriches certain types of molecules). Note that sample preparationalways changes sample composition and this has to be taken into account in theevaluation phase. Often several preparation steps are performed in succession, suchas centrifugation, filtration, extraction, derivatization, another extraction, etc., tosufficiently simplify the complexity of the sample and to ensure the success of analy-sis. Sample preparation is time-consuming and often labor intensive. The currenttrend in biochemical analysis is to use a complex, high-quality (and expensive)instrumentation to allow simplification of the sample preparation process.
(3) Separation: The classical approach to analysis is first to separate mixtures intoits individual components (compounds) and then proceed with identification,structure determination, and quantitation. High-quality analytical methods are nowoften capable of dealing with mixtures of compounds, so complete separation of mix-tures into individual components is no longer necessary. Many modern analyticalinstruments consist of a combination of separation and structure characterization

Basics of analytical chemistry and mass spectrometry 13
methods, such as high-performance liquid chromatography–mass spectrometry(HPLC–MS; HPLC to separate the sample and MS to characterize or identify theseparated compound). Separation methods most often mean chromatography, andthese two terms are often (but inaccurately) used as synonyms. Prerequisite of chro-matography is that the sample needs to be soluble (or vaporizable). Insoluble andnonvolatile particles cannot be separated by chromatography. The most commonchromatographic methods are the following:
(a) Gas chromatography (GC) is very efficient for separating volatile com-pounds. Volatility of some compounds may be increased by derivatization.As most molecules of biochemical or clinical interest are nonvolatile, andderivatization has many drawbacks and is not always possible, GC has alimited (but important) scope in the biomedical field.
(b) Liquid chromatography (LC) is widespread, has many different versions,and can be used to solve a variety of problems. These are well suited to ana-lyze most samples including polar and ionic compounds. The most commonchromatographic method is HPLC.
(c) The methods of choice to separate macromolecules such as proteins andnucleic acids are gel-based electrophoretic methods. These can be performedin one or two dimensions (in a tube or on a chip or on a 2D plate). Theseform the basis of most DNA and RNA diagnostics.
(4) Analysis and detection: It is the high point of an analytical process. The sim-plest and probably oldest version is densitometry or spectrophotometry, whichmeasures light absorbance at a particular wavelength. Signal intensity character-izes the sample amount. Most samples absorb UV light, so it is typical to use a UVlamp for spectrophotometry (e.g., at 254 nm). It is also possible to scan over arange of wavelengths, which yields the UV spectrum, which in turn characterizesthe molecular structure. Spectrophotometry can be performed after separating amixture using chromatography. The time necessary for a sample to pass throughthe HPLC system (called retention time) depends on the molecular structure, andcan also be used for compound identification. Signal intensity (like in conven-tional spectrophotometry) characterizes the sample amount.
UV detection is quite common, but in many cases it is not sufficiently selective:even combined with chromatography, it often leads to false-positive or false-negative results. For this reason many other types of detectors are used in analyt-ical chemistry, to increase selectivity, specificity, or sensitivity. To identify ordetermine the molecular structure, the use of spectroscopic techniques is common.Mass spectrometry, the main topic of this book, is among the most commonly usedand highest performance methods. Infrared spectroscopy (IR) and NMR are alsooften used, although the relatively low sensitivity of NMR restricts its use in thebiomedical field.

14 K. Vékey and A. Telekes
(5) Data evaluation: First, the signal detected during analysis needs to be evalu-ated in terms of structure determination of unknown components, and identificationand quantitation of various known (or presumably present) components—this is anintegral part of the analytical process. Second, the results obtained this way have tobe evaluated in terms of biomedical relevance. The latter involves mathematical orstatistical procedures, often referred to as “chemometrics.” To be efficient, a jointeffort of chemists, biochemists, analytical specialists, statisticians, and medicaldoctors is required. It is highly advantageous that these specialists communicateefficiently and have at least a superficial knowledge of each other’s specialty.
4. A case study: analysis of plasma sterol profile
The analytical process discussed above can be illustrated by an example of deter-mining plasma sterol concentrations, which was published recently (see ref. [1]). Thepurpose is not to go into detail but to illustrate the various aspects of analytical work.Before starting the analytical procedure, the study needs to be carefully planned: theobjective was to develop a method capable of determining plasma concentration ofvarious sterols to study cholesterol metabolism and related diseases. It was decidedto determine plasma level of desmosterol, lathosterol (precursors of cholesterolsynthesis in the liver), cholestanol, and �-sitosterol (sterols present in food but notsynthesized in the human body). The analytical challenge was that these sterols needto be separated from cholesterol (in fact, lathosterol and cholesterol are closelyrelated isomers) at a 1000-times lower concentration in plasma than that of choles-terol (�mol/l vs. mmol/l). It was determined what patient and control groups wereneeded and what was the minimum number of people for a meaningful pilot study(10 in each group but would be much higher in a full-scale project).
Analytical chemistry starts only after this phase. As it is a multiple-step proce-dure, first it is decided that the main strategy is to use a relatively simple sampletreatment and follow it by a highly efficient HPLC–MS analysis. This offers thepossibility of relatively high throughput (hundreds of samples analyzed) withmedium time and cost requirement. In the present example, the following analyt-ical procedure was developed: sampling consisted of taking 5-ml blood samplesfrom each individual. Sample preparation started by centrifugation to obtainplasma, which was stored at �80�C until utilized. (Note that obtaining plasmafrom blood is often considered part of the sampling process, as it is typically donein the same laboratory.) Plasma samples were thawed, and 50-�l aliquots wereused for analysis. First, the protein content was precipitated (by adding methanol,centrifuging and pipetting the supernatant clear liquid, and finally diluting itwith water). This is one of several well-established procedures to separate macro-molecular components from plasma. Further sample cleanup was performed bysolid-phase extraction (SPE). It can be viewed as a simplified chromatographic

Basics of analytical chemistry and mass spectrometry 15
separation and is one of the most common sample preparation methods. For solid-phase extraction of sterols from plasma the following method was developed:C18ec-type cartridges were used, which were preconditioned (first by MeOH,then by MeOH/water mixture). Diluted plasma samples were applied to the car-tridges, washed with MeOH/water mixture, and briefly dried in vacuum. Thesterols were then eluted with a mixture of MeOH/acetone/n-hexane (of course,selection of solvents and solvent ratios are of critical importance and were opti-mized). The eluted substances were dried and the residue was dissolved in MeOH.This SPE process resulted in a clear liquid, which did not contain macromoleculesand was enriched in sterols. Efficiency of the sample preparation process was con-trolled using various standards (i.e., to check that the sterols were not lost duringpreparation, but the amount of interferences was reduced).
Separation and analysis were performed in one step using an online coupledHPLC–MS instrument. Both chromatographic and mass spectrometric methodsneeded to be developed. To separate various sterols from each other and fromvarious other compounds present in the prepared sample, a novel, reverse-phaseHPLC method was developed. This involved using an RP-18e column of 3 �mparticle size. Initial solvent composition was methanol/water, which was changed(in two fast steps) to methanol/acetone/n-hexane. As it is typical in the biomedicalfield, HPLC alone was not sufficient to separate all compounds completely, evenafter the sample preparation discussed earlier. To increase selectivity, massspectrometry was used and likewise optimized. Best results were obtained byatmospheric pressure chemical ionization in positive ion mode; the most character-istic ion for sterols was formed by water loss from the protonated molecule, whichwas used for quantitation. Using mass spectrometry signals of the various sterolswere separated from each other and from that of interfering compounds (notresolved by chromatography). Cholesterol and its isomer lathosterol gave identicalspectra (even in tandem mass spectrometry). Separation of these isomers was themain reason to develop the novel chromatographic method discussed earlier.
The first phase of data evaluation was to determine plasma concentration ofsterols analyzed as described earlier. The standard addition method was used,calibration curves were constructed, and plasma sterol concentrations were deter-mined. The second phase of data evaluation was to look for characteristicbiomarkers and separate patient groups based on sterol concentrations. This wasdone by applying chemometrics (e.g., linear discriminant analysis) with sufficientvalidation. It was found that sterol concentration ratios are much more character-istic disease markers than the individual concentrations. For example, theconcentration ratio of desmosterol to sitosterol was a much better marker ofcholesterol-related disorders than the cholesterol concentration itself, and the con-centration ratio of lathosterol to total plasma cholesterol was an excellent markerof statin treatment. Application of these analytical results by biochemists andmedical doctors will hopefully result in better treatment of patients.

16 K. Vékey and A. Telekes
Analytical chemistry is, however, time-consuming, and method developmentneeds highly trained personnel. The study discussed above required original ideasand a significant amount of method development: about two months of work for twoscientists at the PhD level. Application of the method, however, is much morestraightforward. Using high-quality conventional equipment (not designed for highthroughput), a good technician or PhD student can prepare 20 samples per day, whichcan easily be measured in a day using a good-quality HPLC–MS instrument—that isdeemed perfectly adequate for the present purpose. This type of research requiresexpensive instrumentation; the cost of an HPLC–MS instrument is in the range of$100,000–500,000 depending on its capabilities. Sample preparation requires lessinvestment; $100,000 is a reasonable figure for purchasing the various smallinstruments needed in such a lab.
When high throughput is desired, suitable equipments are needed, but this way100 or 200 samples may be prepared in a day, and this process can even be per-formed by robots (further improving throughput). Measurements by HPLC–MScan also be automated and accelerated. Throughput in this case mainly depends onthe length of chromatography (this is the reason for the current trend of trying tosubstitute HPLC–MS by MS/MS, whenever possible).
5. Mass spectrometry
A mass spectrometer is a very special kind of balance, which measures the mass ofmolecules and their subunits. It can be used to characterize and identify com-pounds, to detect trace-level components, and to measure their concentration incomplex matrices. Mass spectrometry will be described in detail in Chapter 6; hereonly a very brief introduction is presented.
Mass spectrometry yields a mass spectrum (or spectra) of a compound, whichestablishes its molecular mass and the characteristics of the molecular structure. It is among the most sensitive molecular probes, which can detect compounds infemtomol, attomol, or even zeptomol amounts (10�15, 10�18, 10�21). Peak intensi-ties are proportional to the amount of the material or concentration of thecompound present (such as light absorption in photometry). This is the basis ofquantitative measurements. Mass spectrometry is also very selective, so tracecomponents may be analyzed in the presence of a large amount of matrix. Tandemmass spectrometry (MS/MS) is also commonly used. This increases the amount ofstructural information obtained and the specificity of analysis. As a consequence,the chemical noise decreases, which improves detection limits. Using high-specificity MS/MS techniques often allows simplification of sample preparationprocedures. High-resolution mass spectrometry also increases specificity of analy-sis and allows determination of the accurate mass of a molecule. This establishesthe elemental formula of an unknown molecule.

Basics of analytical chemistry and mass spectrometry 17
Solids, liquids, and gaseous samples can all be analyzed by mass spectrometry.The sample can be inserted into the mass spectrometer as they are or after samplepreparation. This way of sample insertion is best suited to study pure samples,but mixtures can also be analyzed in this way. For studying mixtures (e.g., bio-logical fluids) it has become a common practice to couple chromatography andmass spectrometry online. In such a case the sample is fractionated by chro-matography and the individual components eluting from the chromatographiccolumn pass directly into the mass spectrometer, where detection and structureanalysis are performed. The first such successful combination has been gaschromatography–mass spectrometry (GC/MS or GC–MS), which is widely usedin the biomedical field for at least 20 or 30 years. GC–MS is well suited to studyrelatively volatile compounds (not ionic and not very polar compounds up toapproximately 500 Da molecular mass). Most biologically important moleculesare polar, so derivatization of the sample is often necessary to make themamenable for GC–MS. To overcome this problem, the use of another combinationHPLC–MS has become most common, and is still gaining ground. It is anexcellent method to study polar and even ionic molecules and requires less samplepreparation than GC–MS.
Its high sensitivity, high specificity, and straightforward coupling to chro-matography make mass spectrometry one of the best and most widely usedtechniques in analytical chemistry. It is the method of choice for analyzing minorcomponents in complex matrices, both for qualitative analysis and for quantita-tion. It is often used when chromatography is not sufficiently selective (there aretoo many peaks or the chemical background is too high) or yields equivocalresults. Mass spectrometry is among the highest performance analytical tools inthe biomedical field, and mass spectrometry-based methodologies are oftenconsidered as “gold standards.” Mass spectrometry is widely used in thepharmaceutical and biomedical fields.
To help orient the reader, a few typical applications are listed below:(a) Determination of the impurity profile, i.e., detection and quantitation of
impurities. It is a typical problem in the pharmaceutical field, but also inmany other areas. All impurities (typically down to 0.01%) need to beidentified and often quantified. Mass spectrometry (GC–MS, HPLC–MS,HPLC–MS/MS) is the method of choice, especially at low concentrations.
(b) Quantitation of impurities, usually at the trace level. It is similar to thatdiscussed above. Only selected (predefined) target compounds are studied,but their concentration may be much lower than 0.01%. A typical case isdoping control; another application field is forensic analysis. Mass spec-trometry (GC–MS, HPLC–MS, HPLC–MS/MS) is the method of choice,especially at low concentrations.
(c) Studies on metabolism. The structure and amount of drug metabolites (inblood, urine, and faces) need to be determined prior to phase I clinical

18 K. Vékey and A. Telekes
studies, and later on in human volunteers as well. Mass spectrometry is oneof the key techniques in this field.
(d) Pharmacokinetic studies. The object is to monitor the time dependence andclearance of drug concentrations usually in plasma. In simple cases this isperformed by chromatography, the more challenging problems are usuallysolved by GC–MS, HPLC–MS, or HPLC–MS/MS techniques.
(e) Therapeutic drug monitoring. Plasma level of various drugs is monitored inpatients. This is more and more often being used in the clinical field, espe-cially in cases where the therapeutically necessary and toxic concentrationsare close to each other.
(f) Neonatal screening, i.e., studies on metabolic disorders. Various smallmolecules (amino acids, fatty acids, steroids, etc., commonly called metabo-lites) are determined in biological fluids, usually in blood. Some of thesemolecules may have abnormally high or abnormally low concentration,indicative of an inherited metabolic disorder.
(g) Proteomics is a popular and fast-developing field. Mass spectrometrycombined with chromatography (most typically 2D gels) is the primeanalytical method to identify proteins, and to study protein expression andposttranslational modifications. The proteome (all proteins present in asample, e.g., tissue or cell culture) reflects the current state of the organismand yields valuable information on the physiological state, diseaseprogression, etc.
(h) Analogous to proteomics, all metabolites (i.e., practically the assembly of allsmall molecules in a cell or tissue) represent the “metabolome” and are stud-ied by “metabolomics.” These also reflect the state of the organism, and oneof the prime techniques in these studies is mass spectrometry, most usuallyHPLC–MS.
(i) There are other analogous applications, studying the assembly of a givenclass of molecules in an organism, and these are often called “–omics” (suchas lipidomics, glycomics, etc.). Mass spectrometry plays an important rolehere as well.
Reference
1. Nagy, K., Jakab, A., Pollreisz, F., Bongiorno, D., Ceraulo, L., Averna, R.M., Noto, D. andVekey, K., Analysis of sterols by high-performance liquid chromatography/mass spectrometrycombined with chemometrics. Rapid Commun. Mass Spectrom., 20, 2433–2440 (2006).

Medical Applications of Mass SpectrometryK. Vékey, A. Telekes and A. Vertes (editors)© 2008 Elsevier B.V. All rights reserved
19
Chapter 3
Ethical, legal, safety, and scientificaspects of medical research
ANDRÁS TELEKESa,* and KÁROLY VÉKEYb,1
aNational Institute of Oncology, Budapest, HungarybChemical Research Center, Hungarian Academy of Sciences, Budapest, Hungary
1. Ethical aspects 202. Legal aspects 223. Safety aspects 224. Handling biological materials 255. Clinical trials and protocols 286. Administrative procedures 33References 34
Regardless of whether it is a clinical trial or analytical investigation of a sample(e.g., plasma), the subjects of medical research are human beings. Ethical consid-erations are therefore important; they influence decision making and are wellregulated in the medical field.
The basic aim of medical research is to improve clinical practice, and thisshould be evidence based, if possible. Clinically relevant research evidence mayrelate to basic medical science, but it especially relates to patient-centered clinicalresearch, e.g., to the study of the accuracy and precision of diagnostic tests, thepower of prognostic markers, and the efficacy and safety of therapeutic, rehabili-tative, and preventive regimens. New evidence from clinical research at the sametime invalidates previously accepted diagnostic tests and treatments and replacesthem with new ones that are more powerful, more accurate, more efficacious, andsafer [1]. Ethical decision making is based on the Declaration of Helsinki,
*Corresponding author. Tel.: �36-204-119080; Fax: �36-139-52835.E-mail: [email protected] (A. Telekes).1E-mail: [email protected] (K. Vékey).

20 A. Telekes and K. Vékey
although research methodology should usually be conducted according to GoodClinical Practice (GCP). Laboratories contributing to medical research shouldcomply with rules and regulations relating to human samples, the aspects of whichare well regulated in most countries (although the respective laws may be differ-ent in various countries).
Despite significant advances in medicine and the fast improvement of technol-ogy, clinical decision making is still the cornerstone of medical practice. Medicaldecision making is challenging since it involves problem identification, selection,and evaluation of diagnostic information and a choice among various possibleinterventions. Note that medical decisions are sometimes based on ambiguousbackground since our knowledge quickly changes, data are often contradictory ormay not be available, and the validity and reliability of even published data maybe uncertain. Medical decision making is further complicated by biological varia-tion of diseases and by differences in preferences and values among variouspatients. Uncertainty of clinical decision making is an inherent part of clinicalpractice and a possible source of bias in clinical trials.
In the present chapter we summarize fundamental ethical, legal, and safety-related aspects of medical (and especially clinical) research. These are well knownfor medical professionals, but chemists and biologists may be less familiar withthese aspects. Nevertheless, it is essential that all persons working in studies relatedto medical research should be familiar with the basic concepts and rules that apply.
1. Ethical aspects
The intersection of ethics and evidence and the context of scientific uncertaintyrelate to the problem of ethical decision making [2]. Since uncertainty is an inher-ent part of nature, one can never be sure to prevent harm from occurring. Medicalpractice, typically and unfortunately, requires judgments under uncertainty. This isthe reason why ethical aspects compete (and sometimes override) scientific pointsof view. The ethical aspect of medical science requires that every possible stepshould be made to prevent harm from occurring, which includes careful consider-ation of all available data. A study is considered unethical if the potential harmoverwhelms the true benefit to patients or healthy volunteers. This also means thatinitiation of a clinical study without sufficient preclinical data (e.g., short- andlong-term toxicity profile, dose–effect and dose–toxicity relationships, dose-limiting toxicity, pharmacokinetics, etc.) is unethical since the potential harmcannot be properly estimated. Therefore, every clinical trial requires a detailedtrial design, including careful assessment of all preclinical evidence and whetherit is ethically acceptable for patients or healthy volunteers to participate in it in theproposed fashion. It is of great importance from the ethical point of view to avoidany unnecessary suffering or other inconvenience of the involved participants.

Ethical, legal, safety, and scientific aspects of medical research 21
The balance between achieving medical progress and ensuring individualpatient care and safety is an ethical dilemma of medical research [3]. Thus,clinical trials require a delicate balance between individual and collective ethics.On the one hand, individual ethics means that each patient should receive thetreatment, which is believed to be the most appropriate for his condition. Onthe other hand, collective ethics is concerned with achieving medical progress inthe most efficient way to provide superior therapy for the future patients. It is ofimportance that the real interest of the participating individual should never besacrificed for possible benefits of future patients! As stated in the Declaration ofHelsinki: “In medical research on human subjects, considerations related to thewell-being of the human subject should take precedence over the interests ofscience and society” [4]. In order to provide medical progress, one needscollaborating patients. To settle this ethical paradox usually two principlesshould be met. Patients can only be involved in therapeutic trials if the efficacyof available treatments is insufficient (e.g., the patient is incurable), and enroll-ment always should be voluntary, based on the free will of the informed patient.Any pressure put on the patient to obtain his or her consent is unethical (even ifwell meaning and true, e.g., referring to her children who might benefit from theresult of the trial).
Because of the complex nature of these issues, there are well-established ethicalguidelines and statements even for special situations [5–9]. To assure compliancewith these guidelines, ethical committees are formed in most countries, whichhave to approve and might have the right to control clinical trials. Ethical com-mittees are usually made up of clinicians (who are not involved in the trial), otherprofessionals (such as spiritual counselors, lawyers, psychologists, statisticians,etc.), and laypeople. Thus, all protocols are subjected to profound social controland sound judgment by the committee members representing different aspects ofsociety. In the committee, clinicians explain clinical implications and technicalaspects of each protocol. Ethical committees may be local (i.e., at the hospitalwhere the trial is to be carried out), regional, or national. All clinical trials (andother types of clinical research projects) need to have their protocol approved bysuch a committee before the trial is started. In the case of a multicenter trial, eitherthe regional or the national committee grants the permission, or each collaborat-ing partner must have approval from its local ethical committee. Note that not onlythe trial’s design but also all details of conducting the trial need to be approved,since these may affect the individual patients. Maintenance of high ethical stan-dards cannot be achieved by purely administrative procedures, so it is the job ofall clinical investigators to make sure that his or her patients do not suffer as aconsequence of clinical research. There are ethical implications of substandardresearch as well [10]. For example, it is unethical to misuse patients by exposingthem to unjustified risk and inconvenience, or to publish misleading results thatmay promote further unnecessary work.

22 A. Telekes and K. Vékey
2. Legal aspects
The ethical issues discussed above are, in most countries, codified in legal form.Treatment of human beings and human samples depends on the legal environment.Research objectives may also be subject to legal issues, like in cloning or stem cellresearch.
Tissue research (including bone marrow, blood, urine, sputum, etc.) is cur-rently regulated by distinct and sometimes contradictory laws and regulations. Thelegal edicts that determine the research on human specimens are clearly affectedby many factors including policy decisions, cultural, religious and moral issues,jurisprudence, etc. In a recent review, a comparison of the laws in the U.S. andEurope regarding the use of human biological samples in research was presented[11]. Since there are a wide variety of laws to be applied, international collabora-tive research should take these differences into account, especially those affectinghow to obtain, transfer, and investigate the human samples. In all cases researchersshould be alert to implement all the local laws and regulations.
In most countries there are offices, institutes, and legal bodies relating to med-ical research. For example, in the U.S., the Office for Human Research Protectionsof the Department of Health and Human Services is responsible for the federalpolicy of human subject protection, and the Food and Drug Administration forresearch on products. In case of any legal or ethical doubt, it is often worthwhileasking for their advice or approval.
3. Safety aspects
Handling biological material always raises the issue of safety for the personnelinvolved. Chemical hazards and safety procedures relating to these are well knownfor chemists. Regarding biological hazards, first the staff participating in theresearch should be aware of them, and second, adequate precautions should be takenand the personnel should be trained on how to handle human samples safely.
As a principle, all human specimens should be regarded as potentially infec-tious. Detailed tests for pathogen profiles are rarely carried out (e.g., on hepatitis,HIV, etc.), and they can never be complete. As a general precaution, all personnelworking with human samples (e.g., blood or body fluids) should be immunizedagainst hepatitis B (and sometimes against hepatitis A as well). The application ofother vaccines is optional (e.g., against typhoid fever and tetanus) depending onthe circumstances. It is important to note that immunization must never be con-sidered as a substitute for safe working practices.
Laboratory personnel should avoid any direct contact of skin and mucousmembranes with the human specimens including blood or blood products, excretions,secretions, tissues, or other biological materials. Note that most accidental personnel

Ethical, legal, safety, and scientific aspects of medical research 23
Table 1
Classification of laboratories according to safety hazards
CSL 1Use of chemicals is highly restricted; hazardouschemicals cannot be used or stored. Low riskof exposure due to the strong restriction forusing hazardous chemicals.
CSL 2Use and storage of hazardous chemicalsis restricted. Moderate risk of exposure,controlled by limiting the use of hazardouschemicals.
CSL 3Use of chemicals is generally unrestricted;the use of hazardous chemicals is restrictedto closed environment. Substantial risk ofexposure, controlled by stringent engineeringcontrols, by minimizing the use and storageof hazardous chemicals, and by carefullyreviewing work practices.
CSL 4Use of chemicals is unrestricted, hazardouschemicals are frequently used. There ispossibility of high risk of exposure andcontamination during operations, controlledby stringent engineering controls and designrequirements of such facilities and bycarefully defining and monitoring workpractices.
Chemical safety levels (CSL) [12] Biological safety levels (BSL) [13]
BSL 1The agents used are well characterized and arenot associated with disease in healthy adulthumans. The potential hazard is minimal tolaboratory personnel and the environment.
BSL 2The agents used can cause human disease. Thepotential hazard is moderate to personnel andthe environment. Treatment or prophylaxis isavailable. Risk of spread is limited.
BSL 3The agents used are indigenous or exotic,which may cause serious disease. The potentialhazard to personnel and the community (incase of spreading) is serious. Usually there iseffective treatment or prophylaxis available.The infection usually does not spread bycasual contact.
BSL 4Dangerous and exotic agents can be used thatcan cause severe or lethal human disease. Theindividual risk of aerosol-transmitted laboratoryinfections and life-threatening disease issignificant. Usually there is no effectivetreatment or prophylaxis available. The infectioncould be transmitted directly from one individualto another or from animals to humans.
contaminations are due to sharp items such as needles. Laboratories working withchemical and/or biological materials are classified according to the level of hazard(Table 1).
The classification of laboratories using radioactive material is usually based onthe relative radiotoxicity per unit activity. One of such classification is presentedin Table 2.
Low-level laboratory correspond to a CSL 1/CSL 2 chemical laboratory (e.g.,normal ventilation is usually sufficient). Intermediate-level laboratory is speciallydesigned for the use of radioisotopes. High-level laboratory is engineered for han-dling radionuclide materials with high activities. High-level laboratories must be keptat a slightly negative pressure, and personnel working in it should be monitored.
The least strict is safety level 1, and the most dangerous level is safety level 4.Working in different safety level laboratories requires special rules, safety

24 A. Telekes and K. Vékey
equipments, and various permits. The operations of chemical and biomedical lab-oratories are usually strictly controlled by internal regulations and external author-ities, but discussing these is outside the scope of the present chapter. Here we listsome general advice for working in biomedical laboratories:
(1) Used needles and other sharp objects should not be sheared, bent, broken,recapped, etc., by hand.
(2) All needles and sharps objects should be discarded in rigid, puncture-proof containers.
(3) Safety gloves, coats, gowns, or uniforms should be worn while workingwith potentially infectious materials. Never wear these outside the work-ing area, and these should be changed at least once per week. If they areobviously contaminated, they should be decontaminated (by autoclaving)prior to laundry, or disposed off as hazardous waste.
(4) Gloves should always be worn for those manipulations that might lead todirect contact with potentially infectious specimens. Never leave the workarea in these gloves. Disposable gloves should be collected and disposedoff as hazardous material.
(5) All procedures with potentially infectious materials should possibly becarried out without creation of aerosols. Face shields and masks shouldbe worn during all manipulation where a “splash” hazard exists. Eye
Table 2
Classification of laboratories according to limitation on activities [14]
The limit of use (mCi)
Low hazard Intermediate hazard High hazard Very high hazardType of laboratory (examplesa) (examplesb) (examplesc) (examplesd)
Low-level radioactive �5 �0.5 �0.05 �0.01materials laboratoryIntermediate-level 5–50 0.5–5 0.05–0.5 0.01–0.1radioactive materialslaboratoryHigh-level radioactive �50 �5 �0.5 �0.1materials laboratory
a Com-58; Csm-134; Cs-135; Ge-71; H-3; I-125; Inm-113; Kr-85; Nb-97; Ni-59; O-15; Ptm-193;Ptm-197; Rb-87; Re-187; Sm-147; Srm-85; Tcm-96; Tcm-99; U-238; U-Nat; Ym-91; Zn-69; Zr-93.b As-73; Be-7; Ba-133; C-14; Ca-47; Cd-109; Co-57; Co-58; Cr-51; Cs-137; Cu-64; Fe-55; Fe-59;Gd-153; Hgm-197; I-129; I-133; Ir-190; K-42; Kr-85; Mn-54; Mo-99; Na-24; Ni-63; P-32; P-33;Pm-147; S-35; Se-75; Sr-85; Sr-89; Tc-99; Xe-133; Y-90; W-181; Zn-65; Znm-69.c Ba-140; Bi-207; Ca-45; Cdm-115; Ce-144; Cl-36; Co-60; Cs-134; Eu-152; Eu-154; Ge-68; I-125;I-131; Ir-192; Mn-54; Na-22; Ru-106; Sb-124; Sr-90; Th-232; Th-Nat; Tem-127; TI-204; U-236;Zr-95; Y91.d Ac-227; Am-241; Cf-252; Cm-243; Cm-244; Np-237; Pb-210; Po-210; Pu-236; Pu-238; Pu-239;Pu-242; Ra-223; Ra-226; Ra-228; Th-228; Th-230; U-232; U-233; U-235.

Ethical, legal, safety, and scientific aspects of medical research 25
protection is required for all personnel in all locations where chemicalsare used or stored.
(6) Never use mouth pipetting; mechanical pipetting devices should be usedfor the manipulation of all liquids.
(7) Appropriate disinfectant should be applied following any spill of poten-tially infectious materials or at the end of daily work to decontaminatelaboratory work surfaces. Spill kits (containing absorbent pads and/orneutralizing agents) should be prepared for all frequently used chemicalsor biological waste.
(8) Before disposal, laboratory waste should always be decontaminated byautoclaving and all waste should be identified by unambiguous labelingwhether or not the decontamination had been carried out. Remains ofbiological material (e.g., blood or tissue samples) should be regarded ashazardous material. Chemicals should be treated as hazardous if they areignitable, corrosive, reactive, or toxic.
(9) All chemicals should be stored properly and according to compatibility(i.e., acids and solvents must be stored separately). Chemical waste shouldnever be mixed (i.e., mixing acids and alkaline liquids could lead to heatgeneration and violent reaction).
(10) In each laboratory using chemicals, safety shower, emergency eyewash,fire blanket, and extinguishers should be provided. All emergency equip-ments should be maintained in proper working order and their accessshould not be obstructed.
(11) All personnel should be trained in emergency procedures and they mustbe informed about the locations of emergency equipments. Telephonenumbers of emergency contacts should be available.
(12) There should be adequate space and shielding for radioactive materialsused in the laboratory as well as for storing radioactive waste.
(13) The access to the laboratory should be limited during operations.(14) Before leaving the laboratory each staff member should wash their hands
with soap and water. Personnel working with radioactive materials arerequired to survey themselves when leaving the laboratory.
(15) In laboratories, storing food, eating, drinking, smoking, or applying cos-metics is prohibited.
(16) Signs should always be posted at the entrance of the laboratory identify-ing biological/chemical hazards.
4. Handling biological materials
Sample handling is always a crucial part of analysis. In the biomedical field, thereare several issues not commonly encountered in general analytical work, and thesewill be described in this section. Biological materials are potentially hazardous;

26 A. Telekes and K. Vékey
this aspect has been discussed above. Using human samples for research is anethical issue as well; thus, operational and ethical guidelines apply [15].
To obtain human samples (e.g., blood), first the patient should be informed andvoluntarily consent to sample collection (as discussed earlier concerning ethicaland legal aspects). The possibility to obtain repeated samples is limited in manycases since condition of the patient may change or a given volunteer may no longerbe available. Every precaution should be made to process all samples in as similarmanner as possible, including the samples taken from different study groups.Sample collection and analysis are often separated in space and time, which makeissues regarding sample handling, labeling, transporting, and storage very critical,and sample flow needs to be organized. Samples often need pretreatment beforestorage (e.g., centrifuging blood to obtain plasma), and the pretreated sample isstored until further analysis. Samples are often stored for a very long time (evenyears) before analysis; avoiding sample deterioration is therefore a significantissue. To avoid errors, it is essential that issues relating to sample collection andsample handling should be described in detail for any clinical trial and a standardoperating procedure (SOP) should also be developed describing all particulars bothfor volunteers and for staff. Note also that hospital nurses are often overworked,and may deviate from the given SOP. For this reason it is often advantageous toassign a study-nurse for a given project, whose only job is sample collection. Incomplex or long-term studies, it is often helpful to run a pilot study to assess thebest conditions for sample collection, storage, and organization of the workflow.
Univocal communication between study subjects, medical staff, and researchersare essential for reliable and consistent sample collection. Clear-cut instruc-tions regarding the timing of collection, specific containers to be used, samplevolumes required, sample handling (e.g., place on ice until it is transferred to thestudy personnel), etc., are the foundation of reliable results. The study scientistsmust also deliver easily understandable instructions to patients and healthy volun-teers on how to prepare for the trial (e.g., fasting before blood withdrawal). It is agood practice to give all information in writing to everyone participating in thestudy, such as nurses, physicians, research staff, and sometimes the subjects as well.It is critical to explain the importance of precisely following sample collectionprotocols to the personnel who are responsible for it since deviation from theprotocol could ruin the whole study.
Sample collection may be noninvasive (e.g., urine, feces, sputum, collection ofexfoliated cells with buccal swab) or invasive (e.g., blood taking and biopsy). Themeasured parameter may show time dependence; in such cases the sample shouldbe taken at various intervals and the time course of the parameter (such as drugclearance) should be determined. Biological fluids are (in most cases) homoge-nous. For nonhomogenous samples (such as tissues), it is important to establishthat the sample taken is representative and for all persons involved in the study thesame type (or same fraction) of sample is studied.
Ethical, legal, safety, and scientific aspects of medical research 27
For biological samples their stability is a critical issue. There are various factorsinfluencing stability, and these should be carefully controlled: (1) presence of anti-coagulants; (2) endogenous degrading factors, such as proteases or other enzymes;(3) stabilizing agents, such as protease inhibitors; (4) sterility; (5) temperature;(6) time before preprocessing (such as centrifuging); and (7) storage time [16]. Todecrease sample deterioration often various additives are added and the sample iscooled down or frozen. Although sample pretreatment is nearly always essential,these factors do change and may deteriorate the sample in some manner. Definingsample treatment and storage conditions is therefore an essential part of studydesign. Many cases are known in which large and expensive trials went amiss dueto sample deterioration. To complicate matters, optimum sample pretreatment andstorage often depends on the type of analysis desired. Often (as mentioned earlier)a pilot study is helpful to define optimum conditions.
To cite a few examples, anticoagulants must nearly always be added to the bloodsample. There are various anticoagulants, for example, heparin, citrates, or EDTA.Best quality of RNA and DNA samples may be obtained from citrate-stabilizedblood, but it may lead to a higher yield of lymphocytes for culture. On the contrary,heparin-stabilized blood could influence T-cell proliferation, and moreover heparinbinds to many proteins and may therefore compromise proteomic studies. EDTA issuitable for both DNA assays and proteomics, but it affects Mg�� concentrationcausing problems for cytogenetic analyses (e.g., decreases mitotic index).
The time between sample collection and analysis is called holding time. This isthe sum of the transportation time (from the location where the sample was obtainedto the laboratory) and the storage time (keeping the sample in the laboratory priorto analysis). Quickly reducing the temperature of the biological samples in order tominimize deterioration is frequently required. Since it is difficult to control tem-perature outside the laboratory, transportation time (e.g., from operating theatre tolaboratory) may be critical. In an optimal case, the sample is separated immediatelyafter collection into different components (e.g., plasma and cells) and each of themis kept at the most appropriate temperature. For proteomic studies, freezing theplasma to �80�C is ideal, whereas for DNA and RNA profiling freezing the cellshould be avoided, if possible.
The intended storage time also influences what temperature should be consideredoptimal. Isolated DNA may be stored at 4�C for several weeks, at �20�C for sev-eral months, and at �80�C for several years. On the contrary, isolated RNA shouldalways be kept at �80�C. Live cells are stable at room temperature up to 48 h, butafter that they must be either cultured or cryopreserved in liquid nitrogen at �150�Cin order to remain alive. Since serum and plasma contain a large amount of solublemolecules, it should be kept at very low temperature (�80�C) to remain intact. Atthis temperature, plasma is regarded stable (in most respects) for several years.
Proteins are sensitive to degradation by proteases; thus, if the cells are damagedthe result of the assay may be misleading. To avoid this problem the proteins

28 A. Telekes and K. Vékey
should be protected by applying commercially available protease inhibitors (suchas 1 �g/ml pepstatin, etc.) On the contrary, protease inhibitors are toxic to cells;thus, they must not be added if cell viability is prerequisite for the assay.
There are several other precautions to consider. Cooling/freezing the samplesmay be necessary not only during storage but also during sample preparation. Forexample, centrifugation should be performed in a cool environment, for whichspecial equipment (chilled centrifuge) is available. Light also degrades the sample,so it is often recommended to store/transport samples in brown or amber glasscontainers. Some compounds may be absorbed on surfaces (like glassware), socontainers need to be made of plastic (usually polypropylene). Some studies/samples are sensitive to microbes, so the use of sterile equipment may be needed.
All aspects of sample collection and handling need to be carefully consideredand described in detail before starting the study. All these should be part of thestudy (or trial) protocol, to be described next.
5. Clinical trials and protocols
The previous sections described various aspects of studies in a clinical environment.Owing to the complexities and interrelation of the different aspects, establishing awell-defined protocol for a clinical trial is probably even more important than inother fields of science. Here, both bureaucratic and scientific aspects need to bestudied and accommodated. The methodology of clinical research is well estab-lished, and many possible sources of bias are recognized [17], which need to beeliminated. In this section, the most important terminology and basic conceptsrelated to clinical trials will be explained.
Clinical trials comprise research that is designed and evaluated to provide reli-able information for preventing, detecting, or treating certain diseases or for improv-ing quality of life of patients. Common types of clinical trials are listed in Table 3.
Table 3
Different types of clinical trials
Prevention trials The aim is to identify interventions that can prevent the particulardisease.
Early detection trials The aim is to identify the methods that can reveal or recognize the particular disease early in its development.
Treatment trials The aim is to identify interventions that are effective in inverting,stopping, or slowing down the progression of the selected disease.
Quality-of-life trials The aim is to identify strategies or interventions that improve the quality of life (QoL) of patients during and/or after treatmentof the particular disease.
Symptom management trials The aim is to identify the interventions that ease or prevent the symptoms of the particular disease and/or its treatment.

Ethical, legal, safety, and scientific aspects of medical research 29
The objective of a clinical trial is to determine the effectiveness of a plannedintervention in achieving its stated goals. Three phases of clinical trials are distin-guished; each represents a certain level of knowledge on the question to beanswered. In Phase I trials a given intervention is tested in human beings for thefirst time. The aim of these studies is to find the optimum dose, the method ofadministration (e.g., intravenous injection), and/or possible side effects of theintervention. The aim of Phase II trials is to determine the efficacy against thedisease specified in the protocol. The objective of Phase III trials is to comparethe new treatment against the gold standard treatment(s) on a larger number ofpatients. Most clinical trials require a major effort. Often before starting a full-scale project, it is worthwhile performing a pilot study to assess feasibility, poten-tial error sources, and various practical aspects of the whole study.
It is important to emphasize that the patients participating in clinical trials mayhave personal benefits, but there is no guarantee for a therapeutic advantage.Moreover, the chance for a negative outcome can never be completely ruled out.When the treatment of patients is based on the results of well-designed large-scaleclinical trials, evidence-based medicine is practiced.
A prospective trial means preplanned study in which the question to beanswered is formulated before the trial is initiated. Trials should be conductedaccording to the study protocols, which are formal documents specifying all rele-vant aspects of the planned investigation including which patients are eligible,which treatments are to be evaluated (what questions should be answered), howeach patient’s response is to be assessed, etc. Protocols should be followed by allinvestigators to ensure comparability of results. Each protocol should contain anoperation manual and a scientific study design. The operation manual should con-tain detailed specification of the trial procedure relating to each individual patient(e.g., including the patient selection criteria, treatment schedule and procedure,evaluation of the results, method of data collection, case report form, etc.).Scientific design should include a description of the trial’s motivation, its theoret-ical background, data on which questions were formulated, specific aims to beachieved, and explaining how the results might be utilized. It should also outlinethe rationale behind the chosen study design, statistical aspects, randomizationprocedures, and ethical considerations (e.g., the procedures for obtaining informedpatient consent prior to commencement of treatment). The main features of a studyprotocol are shown in Table 4.
Careful documentation is always very important since the report on a trial is usu-ally written a long time, sometimes years, after the first patient is entered. The studyprotocol therefore serves not only as a basis of decisions made during the trial butalso as the source of those decisions. The protocol is also important since clinicalinvestigators may change or new ones join the study. In fact, a protocol should bewritten clearly in order to help researchers to repeat the trial elsewhere. All docu-ments (including patient data collecting forms) should be kept for a long time toprovide the possibility to reanalyze the trial if needed.

30 A. Telekes and K. Vékey
The importance of study design cannot be overemphasized since subsequentanalysis is unable to compensate for major design errors. The choice for a given trialdepends on many aspects of the study including the question to be answered,the seriousness of the disease to be treated, the type of treatment to be given, thetime course of response to be measured, the endpoint to be evaluated, etc. Theterm “design” encompasses all the structural aspects of a trial. An important aimof trial methodology is to obtain a bias-free meaningful result by using the leastpossible resources.
An essential part of any clinical trial is establishing two or more groups of patients(or healthy individuals), which (or responses in the respective groups) are compared.In the simplest case, two groups are compared in some respect. One is the treatmentgroup; the other is the control group. One group of patients is treated by the drug (ortreatment method) under evaluation, and response of these patients is compared tothat of the untreated control or control group receiving the standard treatment of the
Table 4
Main features of a study protocol
(1) Introduction (background and general aims)(2) Specific objectives (questions to be answered, aims to be achieved)(3) Patient selection criteria (inclusion and exclusion criteria)(4) Treatment schedules (drug formulation, route of administration, amount and frequency of
each dose, treatment duration, possible side effects, and their treatment, etc.)(5) Methods of patient evaluation (assessment of the treatment, criteria for response, side
effects checklist, followup. It must include all intervention, e.g., the frequency and amountof blood samples taken)
(6) Trial design (choice of control group, procedures for avoiding bias, criteria for interimanalysis, etc.)
(7) Registration and randomization procedures (method of registering a patient to the trial, e.g., telephone, fax, e-mail. Method of randomization, e.g., randomization table, balancedrandomization, etc.)
(8) Informed consent (according to legal requirements)(9) The required size of study (patient number per group to be able to detect prespecified
differences between groups)(10) Monitoring trial progress (usually carried out by independent monitors)(11) Case report forms (CRF) and data handling (codes to preserve patient anonymity, etc.)(12) Protocol deviations (dose modifications, checks on patient compliance, patient withdrawal,
etc.)(13) Plans for statistical analysis (statistical test(s) to be used, level of significance, statistical
power, etc.)(14) Administrative responsibilities (who should file the CRF, how long the documentation
should be kept, etc.)(15) Funding (who is the sponsor, what kind of research grant or financial support is to be
used, etc.)(16) Reporting (to sponsor, publications)(17) Summary of protocol (the general outline and the flow chart of the study)

Ethical, legal, safety, and scientific aspects of medical research 31
time. The efficiency of the treatment is determined by some preestablished criterion(such as how many subjects are completely cured after a certain time). Success ofthis comparison rests on correct selection of the treatment and control groups: Bothshould be identical regarding a number of parameters such as distribution of sex,age, physical condition, degree of illness, etc., and (in case of placebo trial) shouldbe treated in exactly the same manner but administering the drug in question.Evaluation of the result (e.g., “complete response”) should be objective, unbiasedby, e.g., preconception of the doctor believing in the treatment.
To provide unbiased results, a number of concepts have been established inthe medical community. The concept of random allocation was developed about70 years ago [18]. This means that patients will be randomly assigned to treat-ment and control groups. Randomization is expected to produce groups that arecomparable on all important characteristics, so there is no significant differencebetween the two groups. This protects against preconception, systematic arrange-ment, or accidental bias, which can distort the groups. Randomization does notautomatically guarantee balance in every aspect (due to the groups having arestricted size, statistical fluctuations may be significant), so the investigatorshould check whether a satisfactory balance has emerged. Random allocation hasthe further advantage that it allows using standard statistical methods (such assignificance tests) for data evaluation.
To most correctly evaluate results, it is important that both groups should getexactly the same treatment (but the drug in question). To obtain this condition,patients in the control group should get placebo (if possible), which is identical in allrespect to the active drug except that the active ingredient is absent. This is impor-tant, as it is known that a treated patient’s attitude will change since something isbeing done. (Note that many patients could be treated effectively by placebo.) Itis also important that the study should be double blind, meaning that neither doctornor patient is informed if a given patient belongs to the treatment or control group.This prevents biased evaluation of the results. If the result of a trial is subjective(e.g., pain relief ), double-blind treatment is especially significant.
Although above simple cases have been discussed, in real life there are variouscomplicating factors. Parameters (variables) in clinical studies may have only twocategories (e.g., male/female), or several (such as mild, moderate, severe), or couldbe objectively measurable (such as age or cholesterol level) or not measurable(such as pain). In some studies there are only two groups (treatment and control),in other cases several treatment groups are compared. Sometimes restricted ran-domization is carried out if investigators want to ensure that the numbers of patientsallocated to each treatment or important subgroups of patients are approximatelyequal in number. The method of random permuted blocks is often used when thereare more than two groups of patients; stratification is used to protect against ran-dom allocation producing imbalance between groups regarding important variablessuch as stage of the disease or age. Selecting the control group is not always easy,

32 A. Telekes and K. Vékey
as it is unethical not to treat patients. In such a case the control group may receivethe standard treatment against the illness.
Those discussed above relate to conventional treatment trials, but (as listed inTable 3) there are other types of clinical trials as well. The main concepts areanalogous: A well-selected control group is essential, and unbiased statistical dataevaluation should be provided. For example, in the case of early detection trials usu-ally the level of a potential biomarker is determined in a group of patients and it iscompared to that of the control group. In such a case it is important that the onlydifference between the two groups should be that of the presence of a given illness.False results may easily be obtained (and are often even reported) if, e.g., melanomapatients are compared to a group of healthy individuals. In such a case the foundbiomarker may be representative of very ill persons and not that of melanoma.
In case of observational studies it is essential that the data obtained should beas representative of the population as possible. If the sample is not representativeenough, the results will be unreliable and of dubious value. It is often useful tosample several subgroups (e.g., by age, sex, etc.). Defining suitable control groupsare often difficult in such a case as well. A cohort study is a prospective, observa-tional study that follows a group (cohort) over a period of time and investigatesthe effect of a treatment or a risk factor. Historical (retrospective) controls areused sometimes, but these are very prone to errors. In such a case data are col-lected initially on patients receiving a different treatment considered as the controlgroup. Possibly the worst case is comparison with published results because apublication is strongly biased toward positive results.
Information regarding the relative value of treatments is often accumulatedslowly. Hence, interim analysis is important. This means that results of a clinicaltrial are analyzed while the study is still in progress. When the results becomestatistically relevant (which may happen much earlier than predicted in the studyprotocol), the new treatment may prove beneficial or undesirable. In such a caseethical considerations require the trial to be concluded, in order that all patientsshould receive the more efficient treatment.
In clinical routine it is often observed that some patients do not stick to theirtreatment, so patient compliance is a critical aspect of clinical trials. Noncompliancemay be reduced by careful explanation regarding the treatment schedule and thetrial’s objectives, by handing overwritten instructions to the patients, and by regularcheckups (e.g., counting the number of remaining tablets, by blood analysis throughmeasuring plasma level of drugs, etc.). It is important to differentiate between lackof cooperation and misunderstanding. The latter can and should be avoided by betterplanning.
All trials require precise definition which patients can or cannot participate,which is defined by patients’ eligibility criteria and often controlled by an eligi-bility checklist. In each trial the number of ineligible patients and the reasons forineligibility should always be reported. Even when using careful planning, a small

Ethical, legal, safety, and scientific aspects of medical research 33
proportion of ineligible patients are often included by mistake, which is a case ofprotocol deviation. If the proportion of ineligible patients goes above a certainthreshold value (e.g., 10%), it ruins the whole trial. Protocol violation is a moreserious event which greatly influences the study results and which is often causedby or could have been prevented by the investigator. Patient withdrawal fromtreatment, for whatever reason, should not preclude a patient from subsequentevaluation; in fact, they should be followed for reporting of morbidity and mor-tality. Patient withdrawal could occur in case of serious noncompliance of apatient, because of patient refusal for further participation, and due to clinicaljudgment (i.e., due to severe side effect or disease progression). If such evidenceis lacking, it should be regarded as protocol violation.
Regardless of the type of statistical design sample size is of high importance ina clinical trial. The required sample size often depends on trial design. In small-scale trials or pilot studies approximately 10, in medium-size trials typically50–100, and in large-scale trials several hundred subjects participate in eachpatient group. When the required number of patients is too large, several institu-tions may participate, so multicenter or multinational trials are organized. Slowpatient recruitment is a serious concern in all trials.
6. Administrative procedures
Biomedical research and, in particular, clinical trials are very complex and wellregulated. Administrative procedures have two objectives: to provide help inobtaining correct and unambiguous results, and to prove that experiments wereperformed as described, according to high scientific and ethical standards, andtherefore to increase confidence in the conclusions obtained. Administrative pro-cedures also involve various controls (inside and outside the institute performingthe study).
Quality assurance/quality control should be a standard part of research prac-tice, and this includes sample handling. Since it is inevitable that several individ-uals and often several laboratories will collaborate, strict adherence to SOP isessential. Inappropriate handling of the samples could endanger the result of thewhole project. It also helps the technical personnel to avoid misunderstanding ormisinterpretation.
Labeling, retrieval, and storage of samples should be regulated in detail, justas sample flow. Equipment should be maintained and calibrated regularly; thepersonnel operating them should be trained properly. Note that these not just have tobe performed adequately, but have to be documented in detail. Clinical work shouldtypically be performed according to GCP: an international ethical and scientificquality standard. Its main objective is to ensure that the data and reported results arecredible and accurate, and that the rights of trial subjects are adequately protected.

34 A. Telekes and K. Vékey
References
1. Sackett, D.L., Straus, S.E., Richardson, W.S., Rosenberg, W. and Haynes, R.B., Evidence-basedMedicine: How to Practice and Teach EBM (2nd edition). Churchill Livingstone, Edinburgh,2000.
2. Goodman, K.W., Ethics and Evidence-Based Medicine. Cambridge University Press,Cambridge, 2003.
3. Pocock, S.J., Clinical Trials. A Practical Approach. John Wiley & Sons, Chichester, NewYork, Brisbane, Toronto, Singapore, 1983.
4. World Medical Association, The Declaration of Helsinki. www.wma.net. Copyright WorldMedical Association. All Rights Reserved, 2006.
5. Lötjönen, S., Medical research in clinical emergency settings in Europe. J. Med. Ethics, 28,183–187 (2002).
6. Fulford, K.W. and Howse, K., Ethics of research with psychiatric patients: principles, prob-lems and the primary responsibilities of researchers. J. Med. Ethics, 19, 85–91 (1993).
7. Lo, B., Zettler, P., Cedars, M.I., Gates, E., Kriegstein, A.R., Oberman, M., Reijo, P.R., Wagner,R.M., Wuerth, M.T., Wolf, L.E. and Yamamoto, K.R., A new era in the ethics of human embry-onic stem cell research. Stem Cells, 23, 1454–1459 (2005).
8. McIntosh, N., Bates, P., Brykczynska, G., Dunstan, G., Goldman, A., Harvey, D., Larcher, V.,McCrae, D., McKinnon, A., Patton, M., Saunders, J. and Shelley, P., Guidelines for the ethi-cal conduct of medical research involving children. Royal College of Paediatrics and ChildHealth: Ethics Advisory Committee. Arch. Dis. Child., 82, 177–182 (2000).
9. Obermeyer, C.M., Ethical guidelines for HIV research: a contextual implementation process.J. Int. Bioethique, 15, 134–135 (2004).
10. Altman, D.G., Statistics and ethics in medical research. In: Statistics in Practice. BritishMedical Associstion, Tavistock Square, London, 1994, pp. 1–24.
11. Baeyens, A.J., Hakimian, R., Aamodt, R. and Spatz, A., The use of human biological samplesin research: a comparison of the laws in the United States and Europe. Biosci. Law Rev., 5(5),155–160 (2002).
12. Hill, H.R. Jr., Gaunce, J.A. and Whithead, P., Chemical safety levels (CSLs): a proposal forchemical safety practices in microbiological and biomedical laboratories. Office of Health and Safety Centers for Disease Control and Prevention, 1999. http://www.cdc.gov/od/ohs/CSL%20article.htm.
13. Centers for Disease Control and Prevention/National Institutes of Health, Biosafety in Micro-biological and Biomedical Laboratories (4th edition). In: McKinney, R.W. and Richmond,J.Y. (Eds.), HHS Publication No. (CDC) 93-8395; U.S. Government Printing Office,Washington DC, 1999.
14. Georgia Tech Radiological Laboratory Classification, 1999. http://www.ors.gatech.edu/labclass.htm.
15. Auray-Blais, C. and Patenaude, J., A biobank management model applicable to biomedicalresearch. BMC Medical Ethics, 7, E4 (2006). http://www.biomedcentral.com/1472-6939/7/4.
16. Holland, N.T., Smith, M.T., Eskenazi, B. and Bastaki, M., Biological sample collection andprocessing for molecular epidemiological studies. Mutat. Res., 543, 217–234 (2003).
17. Sackett, D.L., Bias in analytic research. J. Chronic Dis., 32, 51–63 (1979).18. Fischer, R.A., The Design of Experiments. Oliver and Boyd, Edinburgh, 1935.

Part IITools of the Trade

This page intentionally left blank

Medical Applications of Mass SpectrometryK. Vékey, A. Telekes and A. Vertes (editors)© 2008 Elsevier B.V. All rights reserved
37
Chapter 4
Biomedical sampling
GYÖRGY VASa,*, KORNÉL NAGYb, and KÁROLY VÉKEYb
aCordis Corporation, Analytical Technologies, Pharmaceutical & Package Development, Welsh & McKean Roads, P.O. Box 776, Spring House, PA 19477-0776, USAbChemical Research Center, Hungarian Academy of Sciences, Budapest, Hungary
1. Sampling 372. Sample preparation 40
2.1. Centrifugation 412.2. Filtration 422.3. Protein precipitation 422.4. Ultrafiltration 422.5. Dialysis and electrodialysis 432.6. Digestion 442.7. Chemical derivatization 452.8. Lyophilization 45
3. Extraction techniques 463.1. Liquid–liquid extraction (LLE) 463.2. Solid-phase extraction (SPE) 483.3. ZipTip® sampling 533.4. Solid-phase microextraction 53
4. Automation and high throughput 575. Outlook 58References 59
1. Sampling
Mass spectrometry is a highly selective analytical technique, which can providereliable information about the molecular composition of a biological sample. The
*Corresponding author. Tel.: �1-215-628-5841; Fax: �1-215-540-4601.E-mail: [email protected] (G. Vas).

38 G. Vas et al.
latest improvements in mass spectrometry can cope with more and morechallenging bioanalytical problems, thereby dramatically increasing the utility ofmass spectrometric applications. Nevertheless, the success does depend not onlyon the actually applied analytical technique but also on other steps of the wholeanalytical protocol, from sampling to data evaluation. Among the most crucialand time-consuming steps are sampling and sample preparation, which maycomprise over 80% of total analysis time [1]. The quality of these steps is a keyfactor in determining the success of analysis [2]. The majority of analyticalprocesses consist of four primary steps: sampling, sample preparation, analysis,and data evaluation, as discussed briefly in Chapter 2.
Even for a highly efficient analytical method, such as mass spectrometry, the sam-pling is of critical importance. It ensures that the analyzed sample is representativeand reflects the condition of the biological object. Clinical and biomedical aspectsof sampling have been discussed in Chapter 3. Improper sample handling may intro-duce drastic errors in the process, making the analysis useless or misleading. Samplepretreatment is generally also required to avoid interferences and improve theperformance of the analytical protocol, especially when complex matrices such asblood or tissue are studied.
In the sampling step, the material to be analyzed is collected, for example,blood is drawn into heparin-containing vacuum tubes. The objective of anysampling strategy is to obtain a homogenous and representative sample that isa prerequisite for obtaining meaningful results. Homogeneity is generally not acritical issue for gaseous and fluid samples, but it really matters for solidsamples.
Sample collection includes a decision on where and when to get samples sothat it properly represents the biological objects being analyzed. For instance,what time span must be spent between administration of a drug and drawing ofthe blood sample, or shall the sampling happen before or after alimentation, etc.Sampling also includes the selection of a method that obtains samples in theappropriate amounts (e.g., is the blood needed only for dried blood spots or formethods requiring several milliliters?). For trace analysis, sampling is a verycritical issue. If not properly planned and performed by using appropriatesampling tools with care and expertise, the total error caused by sampling canincrease from the usually expected few percentages to several orders ofmagnitude.
In bioanalytical studies it is always necessary to collect appropriate blank sam-ples. These blank samples are the matrices that have no measurable amount of theanalyte of interest. The ideal blank will be collected from the same source as thesamples, but will be free of analyte. All the conditions related to the collection ofthe blank sample—storage, pretreatment, extraction, concentration, and analysis—have to be the same as for the actual samples. Such an ideal blank sample is notalways available, so often a compromise is necessary. For example, when an

Biomedical sampling 39
endogenous analyte is studied (which is always present in the given biologicalmatrix), a well-defined standard sample should be used. This should contain thestudied analyte in a well-defined (not variable) amount.
In most cases, standards are also needed for analysis, and these should be addedto the sample as soon as possible, preferably at the time of sampling. The standardis often an isotope-labeled compound. A big advantage of mass spectrometry-based methods is that they can detect stable isotope labels and are not radioactive;therefore, they do not pose a health hazard and can be freely used. Stable isotopelabeling is also called “isotope labeled affinity tags,” especially in the field ofproteomics.
Biological matrices may be liquid or solid, and contain a variety of differentmolecules and particles. Various biological samples are used for chemical analy-sis. Most commonly blood and urine are used, but saliva, milk, sweat, feces, andvarious tissues (liver, kidney, brain, etc.) are also studied. The properties of thesematrices for sampling and sample preparation are described in books [3,4] andreviews [5]; here only a brief description is given.
Blood is a fluid connective tissue in which the blood cells are suspended in afluid matrix called plasma. The blood transports oxygen, the products of diges-tion, hormones, enzymes, and many other chemical substances including thewaste products of metabolism. If fresh blood is placed in a centrifuge tube androtated rapidly, it separates into its three basic components. The upper layer,about 55% of whole blood, is a light-amber fluid called plasma. The remaining45% is a mixture containing the formed elements, mostly red blood cells (lowerlayer) and approximately 1% white blood cells (middle layer, also called buffycoat). Serum is also studied; this is a yellowish liquid obtained after clotting.Clotting is an important property of blood, and is usually undesirable foranalytical work. Most often clotting is inhibited by anticoagulants like heparin(a mucopolysaccharide) or ethylene diamine tetraacetic acid (EDTA). In mostcases EDTA is considered more appropriate, as heparin may interact with someanalytes changing sample composition. However, EDTA may not be used forstudying metals or organometallics.
Molecular composition of blood is most often analyzed by studying plasma orserum. For a long period these should be stored at �80�C; for a few weeks stor-age at �20�C is usually acceptable. Note that storage plasma is a critical issue; thetype of analysis to be performed may dictate different conditions. For example,and arguably, RNA profiling may give meaningful results only when fresh sam-ples are used. Blood contains both small molecules and a large amount of proteins.After obtaining the plasma (or serum), the next step is usually separation ofmacromolecules (mostly proteins) and small molecules, e.g., by protein precipita-tion (see the following text). Analysis of these two molecular fractions requiresdifferent methodologies. Note that small molecules may bind to proteins, and thispossibility has to be taken into account.

40 G. Vas et al.
Urine is also a very commonly studied biological matrix. It is much less com-plex than blood, and contains only a small amount of macromolecules. It has a highsalt content and both organic and inorganic constituents. Its main componentsinclude NaCl (10 g/ l), K (1.5 g/ l), sulfate (0.8 g/ l), phosphate (0.8 g/ l), Ca and Mg(0.15 g/ l), urea (20 g/ l), creatinine (1 g/ l), and uric acid (0.5 g/ l). Urine should beprotected from bacterial degradation, which is mostly accomplished by freezing thesamples until analysis.
Other body fluids such as saliva or milk are also sometimes analyzed. Saliva con-tains approximately 0.3% protein (mostly enzymes), 0.3% mucin, and some salts.It can often be analyzed directly, without sample preparation or extraction. Humanmilk contains mainly proteins (3%), lipids (3%), and carbohydrates (mainly lactose,6.8%). Lipids are suspended in the form of droplets, so homogeneity of the studiedsample must be ensured. From the third week from the start of lactation, composi-tion of human milk is quite constant, but that of the initially secreted colostrum issignificantly different. Milk samples are commonly used for the trace analysis ofpesticides, heavy metals, antibiotics, and some drugs.
Various tissues are also analyzed, although much less frequently than blood orurine. This is partly because these are far more difficult to obtain (especiallyhuman samples), partly because sample preparation is much more challenging.Obtaining a representative sample is important (and often difficult) and requireshomogenization. Tissues often have high fat content, which also complicatessample preparation. Combination of various sample preparation and extractionmethods is often required, and precise protocols are indispensable. These protocolsdepend significantly on the type of tissue studied.
Hair is a special case, and is an attractive target for chemical analysis: It isnoninvasive to collect, requires relatively simple sample preparation protocols,and provides a historical record of exposure to various chemicals and drugs. Hairis usually collected from the area at the back of the head, and to provide a repre-sentative sample, at least 200 mg should be collected. Hair analysis is being oftenused, especially in forensic applications.
2. Sample preparation
Biological matrices are mostly highly complex aqueous (except the fat or lipidtissues) mixtures, usually having high protein and salt content. Most are notadequate for direct chromatographic or mass spectrometric analysis but requiresample preparation including cleanup, extraction, and/or derivatization. The mainobjective of sample preparation is to convert a real biological matrix into a formsuitable for analysis by the desired analytical technique [6]. The theory andimplementation of sample cleanup and extraction are based on similar physico-chemical principles as chromatographic methods, so the present chapter and the

Biomedical sampling 41
following one on “separation methods” are strongly related and complement eachother.
The first aim of sample preparation is the removal of potential interferences.For example, inorganic salts need to be removed from the sample before analysisby mass spectrometry, as they suppress ionization of organic analytes and reducesensitivity. For analyzing small molecules, such as drugs, fatty acids, and sugarphosphates, proteins and glycoproteins need to be removed.
The second aim of sample preparation is to increase the concentration ofanalytes to achieve adequate signal intensities. Enrichment is usually performedby extraction methods, such as liquid–liquid (LLE) or solid-phase (SPE) extrac-tion. The simplest form of enrichment is drying the sample and reconstituting it ina smaller solvent volume. Extraction is often combined with a change of solvent(e.g., an aqueous sample, after extraction, will be reconstituted in an organicsolvent).
There may be several other reasons for using sample preparation. Analytes areoften changed chemically (i.e., are derivatized) to become better suited for analy-sis or detection. Furthermore, sample preparation should be robust to providereproducible samples independent of variations in the sample matrix.
A large variety of different sample preparation methods are available. In mostcases one technique is rarely sufficient; usually several are used in combination.Here only the most commonly used ones will be discussed. Sample preparationusually starts with separating the sample into various fractions. First, particles(such as cells, fibers, etc.) are separated, using centrifugation and/or filtration toprovide a homogenous solution. In the next step, small molecules are separatedfrom macromolecules. Commonly this is done by protein precipitation, ultrafiltra-tion, or dialysis. Salt content may also be reduced by dialysis. Following thesepreliminary steps, proteins and other macromolecules are usually digested.Derivatization is also commonly used to convert the sample into a form moreamenable for analysis. Other simple sample preparation methods include removalof the solvent, often done using vacuum evaporation or lyophilization. Samplepreparation also includes various extraction methods that will be discussed in thenext section.
2.1. Centrifugation
Centrifugation is a very common technique to separate solid particles dispersed inliquid medium, e.g., blood cells and plasma. The liquid sample is placed in aspecial vial or holder, which is rotated very fast. Sample components are separateddue to the centrifugal force, based on their density difference. Centrifugation iscommonly used in combination with a variety of sample preparation techniques.Centrifugation can also be used to separate emulsions (such as milk) and immis-cible solvents (e.g., in combination with LLE).

42 G. Vas et al.
Laboratory centrifuges usually work with 20–40 cm diameter rotors holding10–100 sample vials or two to four microtiter plates. Efficiency depends onrotational velocity; typical laboratory centrifuges work with 100–20,000 rotationsper minute, allowing separations in a few minutes time.
Ultracentrifuges are different specialized equipment, working at highervelocities. These are mostly used to separate macromolecules based on molecularmass. Vacuum centrifuges are also common; their purpose is evaporating solvents—centrifugation is used to help in keeping the solution at the bottom of the vial.
2.2. Filtration
Filtration is another common method to separate solid particles dispersed in aliquid. The simplest case is filter paper, although mostly polymer-based filtermembranes are used. The most important quality of filters is the size (diameter) ofthe particles filtered out, corresponding to the pore size of the filter. In the case ofultrafiltration, macromolecules can be filtered out—this is discussed in Section 2.4.Filters come in various sizes, depending on the quantity of sample to be analyzed.They may be incorporated into the tips of pipettes, which make it easy to removesmall solid particles from a solution, for example, before injecting it onto achromatographic column.
2.3. Protein precipitation
Probably the simplest way to separate proteins from small molecules is proteinprecipitation. It is needed for studying low-molecular-weight compounds (MWbelow 2–5 kDa), as the presence of macromolecules typically deteriorates analyt-ical performance. In chromatography they lift the baseline, cause noise, and mayeven ruin chromatographic columns. In MS, they deteriorate ionization and mayblock the ion source.
Precipitation is performed by adding organic solvent (acetonitrile, methanol),inorganic acid (perchloric acid), or salt (zinc sulfate) to the sample. After mixing,the proteins aggregate, and after centrifugation, they form a pellet at the bottom ofthe sample vial. This pellet can be easily removed from the remaining liquid,making separation of proteins and small molecules easy and quick. However, thedisadvantage of protein precipitation is that various proteins precipitate underdifferent conditions, so protein removal is not perfect. The precipitated proteinsmay bind various small molecules and remove them from the solution. This mayinfluence quantitation, which has to be taken into account.
2.4. Ultrafiltration
Ultrafiltration is another common way of separating small and large molecules(e.g., sodium vs. albumin). The liquid sample is dispensed into an ultrafiltration

Biomedical sampling 43
tube. The bottom of this tube is a membrane, usually made of regenerated cellu-lose. After the tube is put into a centrifuge, the centrifugal force pushes the solventand the small molecules through the membrane. The macromolecules (in the pres-ent example albumin) are retained on the membrane. After ultrafiltration they canbe washed from the membrane. Both the macromolecules and the solution con-taining the small molecules may be used for further analysis. Care must be takenwith ultrafiltration because the membrane material might bind some analytes. Thismust be checked before applying ultrafiltration.
The most important characteristic of an ultrafiltration tube is its MW cutoffvalue, usually expressed in kilodaltons. A tube with 10 kDa cutoff retains the mol-ecules with molecular mass higher than approximately 10 kDa. This cutoff valueis not very accurate; in the present example, a small fraction of compounds with5–10 kDa may be retained, while some of 15–20 kDa may pass through the filter.There are various filters, with cutoff values in the range 3–100 kDa.
2.5. Dialysis and electrodialysis
Like the other methods, the main purpose of dialysis and electrodialysis is theseparation of small and large molecules; it is often used for desalting purposes.These are based on the phenomenon that certain compounds can diffuse through asemipermeable membrane, while others cannot. This differentiation is mainlybased on molecular size. The principle of dialysis is, in fact, quite similar to ultra-filtration; the driving force is not only gravity (assisted by centrifugation) but alsoosmotic pressure.
In a typical dialysis experiment, a membrane separates two liquid phases, oneof which is the sample (see Fig. 1) and the other is a clean washing liquid. Themembrane is permeable for small molecules but retains large ones. Small mol-ecules can therefore diffuse through the membrane into the other liquid phase.This diffusion process goes on until equilibration is reached. In practice, a largeamount of washing liquid and a small amount of sample solution are used, so
Fig. 1. Schematic diagram of dialysis.
Beaker
Buffer solution
Semi-permeablemembrane
Protein sample
Dialysis tube

44 G. Vas et al.
concentration of the (unwanted) small molecules in the sample is significantlyreduced.
A typical example of dialysis is desalting of proteins. About 500 �l proteinsolution is put into a dialysis tube, which is immersed in 500 ml buffer solution(see Fig. 1). The salts diffuse from the sample into the buffer solution, while thebuffer (since diffusion can occur in the opposite direction too) diffuses intothe sample and maintains the pH. This process not only desalts the protein but alsocan be used to exchange the buffer.
Various dialysis membranes are used; those of 10–15 kDa molecular weightcutoff are most common. Dialysis may also be used to clean small moleculesfrom unwanted macromolecules. It is easy to miniaturize; sample volumes assmall as a microliter can be used (e.g., one drop of sample placed onto a smallfilter floating on pure water). Various parameters may influence the efficiency ofdialysis, such as the type of the membrane, temperature, the volume of the sam-ple, extractant volume, etc. Efficiency of the dialysis may significantly bedecreased if the analytes bind to the membrane either by electrostatic or byhydrophobic interaction. The use of a low-concentration surfactant may decreasethis effect.
In electrodialysis, diffusion of charged compounds through the membrane isaided by an electric potential difference. Naturally, this potential difference actsonly on charged species, so in electrodialysis the charge on the analyte has keyimportance.
2.6. Digestion
Digestion is among the most commonly used preparative steps for studyingmacromolecules. Most analytical techniques yield only limited information onmacromolecules, so breaking them into smaller fragments is often necessary.These small fragments are then studied by “conventional” methods, such aschromatography and mass spectrometry. Tryptic digestion of proteins is probablymost common, but many other digestion procedures are also used. These break upproteins and other macromolecules, and are invaluable tools for studying thestructure and function of macromolecules. Many enzymes have special selectivity.These may be used not only to break up macromolecules but also to study specialstructural features.
In the case of trypsine, proteins are cleaved at basic sites (lysine and arginine).Using this enzyme is very popular as it has high specificity, it is easy to use andthe result is well reproducible. Tryptic digestion is commonly accompanied withother chemical treatment, such as unfolding the protein and cleavage of the sulfurbridges. Various experimental protocols can be found in the literature for usingtrypsine; most of them are quite effective. The obtained digest, which is a complexmixture, is then analyzed by MALDI–TOF or HPLC–MS–MS experiments. The

Biomedical sampling 45
results are evaluated by using bioinformatics and identifying the protein; it mayalso yield other structural information (e.g., on posttranslational modifications).Tryptic digestion is the most common tool in proteomics, and will be discussed indetail later in the book.
2.7. Chemical derivatization
Chemical derivatization is often applied when the properties of target analytes arenot compatible with the analytical procedure, when detection is not sufficientlysensitive, to label a given analyte, or to increase selectivity. While derivatizationmay increase analytical performance, it is time-consuming and often laborintensive. The most critical issue is, however, that derivatization changes samplecomposition, may not be quantitative, may lead to by-products, and may lead tothe loss of the analyte (especially if done at a very small scale). These problemsneed to be carefully considered (increasing the time and cost of methoddevelopment) and may compromise reproducibility and robustness of the analyti-cal procedure. For these reasons although derivatization is often indispensable, ifpossible, it is often avoided.
A popular application of chemical derivatization in the biomedical field isamino acid and carnitine analysis using tandem mass spectrometry. Free aminoacids in dried blood spots are butylated, which increases both selectivity andionization efficiency. This way the time-consuming chromatography–mass spec-trometry analysis can be substituted by very fast tandem mass spectrometry(requiring approximately 1 min). This opens up the possibility of population-widescreening for inherited metabolic disorders, which is applied in many countries.Another typical example is volatilization of polar compounds to make themamenable for gas chromatographic analysis. Many such procedures are known,e.g., methylation or silylation. One such application in the biomedical field ismethylation of very long chain fatty acids in plasma to screen peroxisomal disor-ders. Although time-consuming, this makes very long chain fatty acid analysispossible using gas chromatography (GC).
2.8. Lyophilization
The purpose of lyophilization is to evaporate the solvent under very gentleconditions. First, the sample is frozen and then the solvent is sublimed away usingvacuum. The remaining solid sample forms a very light structure with high surfacearea. In practice, it means that it is easy to collect and/or re-solvate the sample,even if the quantity is very small. Note that conventional, complete solvent evap-oration (using heating and often also using vacuum evaporation) often results in avery compact solid material, partly sticking to the wall of the vial, which isdifficult to collect or re-solvate. It is a particularly important aspect of handling

46 G. Vas et al.
small amounts of material—complete solvent evaporation often results in asignificant loss of sample. Lyophilization is therefore an efficient method forconcentrating and handling small amounts of samples.
3. Extraction techniques
Extraction methods form an integral part of sample preparation. They are groupedtogether, as their main purpose is to increase the concentration of the analyte andthey are strongly connected to chromatography. In fact, these can be regarded asa very simplified form of chromatography. The oldest, but efficient and still usedversion is LLE. SPE is probably most common; it has many versions and hasbecome an indispensable tool in the biomedical field. Its further simplified formis “ZipTip” preparation. The principle of solid-phase microextraction (SPME) ismore similar to LLE than to SPE; it is commonly used sample preparation methodfor analyzing volatile compounds.
3.1. Liquid–liquid extraction (LLE)
LLE is also called solvent extraction. It is used for both sample cleanup and con-centration of the analyte. LLE is based on the phenomenon that a compound willdistribute between two nonmiscible liquid phases. The equilibrium is stronglydetermined by the physicochemical parameters of the two liquids and can beadvantageously used to concentrate some while dilute other components of thesample.
In a typical LLE experiment, an aqueous sample is mixed with an apolar, non-miscible solvent (like n-hexane). This may be performed in a simple vial or in aspecial separatory funnel. After combining the two liquids the vial (or separatoryfunnel) is shaken vigorously to aid mixing of the two liquids. Once the shaking isover liquid droplets are formed (as the two solvents are not miscible); these areallowed to coalesce (possibly aided by centrifugation) and the two bulk phases areseparated from each other. In this experiment, polar and apolar analytes are sepa-rated to a large degree: The polar ones are concentrated in the aqueous phase andthe apolar ones in the organic phase. The phase in which the analyte is dissolvedis collected (e.g., by pipetting that phase into another vial).
The success of LLE is mainly determined by the choice of the solvents, the useof additives (e.g., by adjusting the pH, which strongly determines solubility inwater), and the type of impurities which needed to be separated. When theinterferences are similar to the analytes, LLE cannot be applied successfully.Important advantages of LLE are its large sample capacity and negligible memoryeffects. Disadvantages are that it uses large amounts of organic solvents (whichare expensive and toxic), is very labor intensive, and is difficult to automate.

Biomedical sampling 47
A common application of LLE is extraction of drugs from aqueous matricesusing volatile organic solvents (e.g., dichloromethane), which is easy to concen-trate by evaporation of the solvent and can be directly injected into a GC orGC/MS instrument for analysis. A very efficient method is the so-called back-extraction, which can be used for various drugs that can be ionized in a certain pHrange. First, the pH of the aqueous phase is adjusted so that the analyte will be inneutral form when it migrates into the organic phase, where it is well soluble. Thismay be aided by salting the aqueous phase. In the next step (back-extraction) theorganic phase is mixed with an aqueous phase, in which the pH is adjusted so thatthe analyte will be ionized. This strongly favors solubility in the aqueous phase,so the analyte will be “back-extracted.” This method is able to separate the analytefrom both apolar and many polar impurities, resulting in an efficient and easysample cleanup procedure.
The conventional LLE technique requires large sample size (10–100 ml atleast), which is usually not available in the biomedical field (a possible exceptionis urine analysis). To overcome this difficulty (and also that of the cost of largevolumes of organic solvents), liquid-phase microextraction techniques have beendeveloped—these rapidly gain popularity. Easiest and the most common amongthese is the “single liquid drop” technique, which utilizes a microliter or smallersize droplet of organic solvent suspended in a large volume of aqueous phase [7],as shown in Fig. 2. Analyte distribution and equilibration between the two phases
Fig. 2. Schematic diagram of the “single liquid drop” LLE technique.
Water bath
Sample
Extraction vial
Syringe
Solvent drop

48 G. Vas et al.
occur similarly to classical LLE. When the extraction is terminated, the drop canbe withdrawn into the syringe and injected directly into an analyzer system(usually GC or HPLC) [7].
Unsupported liquid membrane techniques with three phases involve an aqueoussample phase separated from another aqueous phase (called as receiver phase) bya layer of organic solvent (e.g., octane). Analyte components first diffuse from thesample into the organic liquid membrane and then back-extract out of the mem-brane into the receiving phase. At the same time, interferences do not diffuse intothe organic membrane layer but stay in the original sample phase.
Supported liquid membrane extraction techniques employ either two or threephases, with simultaneous forward- and back-extraction in the latter configuration.The aqueous sample phase is separated from the bulk organic or an aqueous receiverphase by a porous polymer membrane, in the form of either a flat sheet or a hollowfiber that has been impregnated with the organic solvent phase. The sample phase iscontinuously pumped, the receiver phase may be stagnant or pumped, and theorganic phase in the membrane pores is stagnant and reusable [8–10].
3.2. Solid-phase extraction (SPE)
The principal goals of SPE are analyte enrichment, purification, and mediumexchange (e.g., from aqueous to organic) [11]. SPE is very similar to liquidchromatography and uses the same physicochemical principles, solvents, andstationary (solid) phases. It has become a very successful and widespread method;most biomedical laboratories use it in everyday practice.
A typical SPE experiment includes several SPE cartridges placed onto avacuum manifold, as shown in Fig. 3. The SPE cartridge is a short column,resembling an open syringe barrel, containing sorbent material (the solid orstationary phase) packed between porous metal or plastic frits. First, the cartridgeis treated with a solvent (to wet the surface) and then the sample solution is placed(pipetted or poured) into the open tube. The solvent passes through the columnmaterial and drops into the container below. To speed up the process, vacuum isapplied to the bottom of the column. Using proper solvents and cartridges, theanalytes will be absorbed on the sorbent material, while the impurities will not beretained and pass through the column with the solvent. In the next step the analyteswill be eluted using another solvent and collected into Eppendorf tubes. In typicalSPE applications, approximately 1 ml sample size is used, the cartridges arewashed with a few millimeters of solvent, and elution may require 10–20 min.A typical vacuum manifold accommodates about 10 SPE cartridges (which areeasy to manage manually). In order to improve reproducibility and avoid cross-contamination, SPE cartridges are used only once; then they are discarded.
SPE, like other sample preparation procedures, requires careful and accurateexecution. As it is very common, various steps of the SPE procedure will be

Biomedical sampling 49
described in detail. Viscous samples often need to be diluted before SPE. As a typ-ical example, 200 �l serum is studied, which is first diluted four times with waterto 800 �l, and it is studied by reverse-phase (RP) SPE, using a C18 cartridge of500 mg capacity (or bed volume).
(1) First, the packing material in the SPE cartridge must be conditioned andequilibrated. The role of conditioning is to solvate the functional groups inthe sorbent material. Equilibration maximizes the efficiency and repro-ducibility of retention and also reduces the amount of sorbent impuritieswashed off at the elution stage. Conditioning is particularly important forprocessing aqueous samples. Conditioning and equilibration occur at thesame time by flushing the packing material with the same solvent (i.e.,water) as used for the sample. This and all other washing steps should takeplace at a controlled flow rate, typically one to two drops per second, usingapproximately 2 ml of water. Solvent flow can be adjusted by the vacuumpressure applied. After conditioning and equilibration the SPE cartridge isready for the sample.
(2) The sample is applied to the cartridge, maintaining the flow rate in order toallow efficient binding onto the phase.
(3) After the sample is applied to the SPE cartridge, a washing step is typical-ly included to complete elution of the interferences. This washing step canbe performed with either the same or a different (stronger) solvent thanused for the sample, using again approximately 2 ml of water. In some casesthis washing step is followed by drying, when traces of the washing solvent(typically an aqueous phase) should be completely eliminated.
Fig. 3. Schematic setup of an SPE experiment.
SPE cartridges
Teflon taps
Vacuum manifold
Test tubes
Connection ofvacuum pump
Valve
Vacuum gauge
Eppendorf tubes

50 G. Vas et al.
(4) Finally, the analytes of interest are eluted from the sorbent in a smallvolume of strong solvent, in the present case 0.5–1 ml of methanol oracetonitrile. The result of this final elution is an effluent that contains thepurified analyte. This SPE preparation usually requires about 20 min time;preparing 10 samples in parallel is typical. Note that sometimes SPE can beused in the “opposite” direction, when the analyte to be purified is elutedand the impurities are bound to the cartridge.
There are various practical aspects to consider when performing SPE operation.The high surface tension and high polarity of water often result in a slow anduneven flow through the packing, leading to low analyte recovery. To overcomethis problem, addition of a small amount of organic solvent to aqueous phases issuggested, which helps to maintain constant flow even if large sample volumes areused. Viscous samples often exhibit irreproducible results, mainly because they donot allow a stable flow through the cartridge. In such cases dilution (especiallywith relatively low viscosity solvent) helps to overcome this problem. In thetypical case of plasma samples, it is diluted three to five times using watercontaining 5–10% methanol, which often solves both problems discussed earlier.Accurate adjustment of pH and ion strength is often necessary both to ensureefficient separation and to obtain good reproducibility, particularly when ioniccompounds are studied. In some cases proteins and other macromolecules areremoved from the biological fluid before SPE, but this is not always necessary.The most typical practical problem with SPE is nonuniform flow of the liquidthrough the extraction bed. This should be carefully controlled by the operator.Changing the vacuum pressure and degree of dilution and not allowing theextraction bed to dry are needed to avoid this problem.
Development of SPE methods requires a sound knowledge of liquidchromatography. The most important parameters are the SPE cartridge (type of thesorbent) and the type of solvents used. The size of the cartridge (which determinesthe sample amount) is also important: Too small sorbent size is easily overloaded,while too large sorbent size may bind the analyte, thereby decreasing recovery.Like in chromatography, various additives, especially buffers, may be used toimprove performance.
The three most important types of SPE are RP, normal phase (NP), and ionexchange (IE). RP-SPE is best to clean up polar samples from an aqueous phase;NP-SPE is best used for apolar compounds dissolved in an organic matrix, whileionic compounds are best retained on IE-SPE cartridges. Fig. 4 provides a usefulguide for selecting the SPE method. Retention mechanism on SPE cartridges isessentially the same as that in chromatography and this is discussed in more detailin the next chapter.
Reverse-phase SPE separations, like RP chromatography, uses a polar (aqueous)sample, an apolar stationary phase, and an organic solvent to elute the analyte.Commonly used stationary phases are alkyl-bonded silicas such as C18, C8, and C4,

Biomedical sampling 51
but occasionally polymers (such as styrene/divinylbenzene [12]) may also beused. Retention of organic analytes is primarily due to the attractive (van derWaals) forces. A typical example of RP-SPE extraction of drugs from plasmawas described earlier. Slightly acidic or basic compounds can be also purifiedusing this method, if one adjusts the solvent pH to the value at which the analytesare present in their nondissociated form. A different, somewhat more complex,application of RP SPE cartridges is the extraction of very polar componentsfrom aqueous matrices by using ion-pair SPE [13]. The highly polar compoundshave poor retention on RP media, but with the help of an ion-pairing reagent(such as triethanolamine) they can also be retained by the apolar reverse phase. First,the ion-pairing reagent binds to the SPE surface and then the polar analyte bindsto the ion-pairing reagent. If SPE is followed by mass spectrometric analysis, volatileion-pairing reagent should be used at a relatively low (maximum 10 mM) con-centration to avoid suppression effects.
Normal-phase SPE methods use apolar solvents and a polar stationary phase(cartridge packing). These are mostly applied to clean up and concentrate polaranalytes in mid- to nonpolar matrices (e.g., acetone, chlorinated solvents, andhexane). The most widely used NP packings are pure or occasionally functional-ized silica (cyano, amine, and diol phases). Retention of the analytes is primarilydue to interactions between polar functional groups between the analyte and silicapacking. Compounds absorbed on the cartridge are then eluted using a polar sol-vent, such as methanol or water. A typical example to extract slightly polar drugs
Fig. 4. General guidelines for selecting the type of SPE cartridge to be used. SAX, strong anionexchange; amino, amino column; SCX, strong cation exchange; WCX, weak cation exchange;RP, reverse phase; NP, normal phase; IE, ion exchange.
SAMPLE PROPERTIES
Liquid Sample
Aqueous Solution
Ionized Neutral
Anionic Cationic
Weak Strong Weak Strong
Organic Solution
Low Polarity High Polarity
Ionized Neutral
SAX AMINO SCX WCX RP NP RP or IE RP or NP
RECOMMENDED SPE SORBENT

52 G. Vas et al.
from biological matrices such as plasma is the following. The first step is LLEof plasma with hexane:ethylacetate 95:5 mixture. A silica SPE cartridge isconditioned with two bed volumes of hexane, followed by equilibration with twobed volumes of hexane:ethylacetate 95:5 mixture. The hexane:ethylacetate extractof the sample is diluted with hexane:ethylacetate 95:5 to about one bed volumeand is applied to the cartridge. It is washed with one bed volume of hexane:ethyl-acetate 95:5. Finally, the analytes are eluted with 0.5–3 ml of hexane:ethylacetate2:1 mixture.
Ion-exchange SPE is best used for the extraction of ionized compounds orcompounds which may be ionic by shifting the pH. Negatively charged com-pounds can be retained with strong anion exchange (SAX) or weak anion-exchange (silica-based amine) cartridges. Positively charged compounds can beretained by strong cation exchange (SCX) or weak cation exchange (WCX)phases. Retention mechanism is based on electrostatic attraction between thecharged functional group on the compound and the charged group that is bond-ed to the silica surface. In the case of SAX, SPE packing material containsaliphatic quaternary amine groups bound to the silica surface. This is a strongbase in the form of a permanent cation (pKa of a quaternary amine is very high,greater than 14) that attracts anionic species present in the solution. Likewise,strong or weak anion-exchange phases may be used to extract positively chargedanalytes.
More sophisticated SPE methodologies are also in use, for example, involvinga mixture of different cartridge packings (so-called mixed phases). Several SPEsteps can also be performed in sequence, resulting in highly efficient purification.SPE is also well adapted to high-throughput operations, using 96-well sampleplates, which may be used to collect samples in a conventional 96-well plate.Method optimization is made easier by using special plates where different SPEpackings are placed, so the result of parallel experiments can be evaluated and themethod (SPE cartridge–solvent combination) giving the best results can bedetermined easily.
Application of SPE offers an opportunity to obtain an exceptionally clean,concentrated fraction of analytes from very complex matrices. This approach isattractive in biological sciences, since the samples are nearly always highlycomplex mixtures. The SPE process is based on physicochemical sorptionprocesses and it does not involve chemical treatments, so it is less prone tointroduce artifacts. SPE is well suited to a sample size small enough to be easilyavailable (less or much less than a milliliter of body fluid or a gram of tissue), butlarge enough that even minor components could be identified in the subsequentanalysis step. Disadvantages of SPE include that it is a multistep, labor-intensiveprocess. Automation is possible but expensive. In some cases, irreversible adsorp-tion of the analytes can occur on the SPE cartridge, leading to recovery problems,especially when very small sample size is used.

Biomedical sampling 53
3.3. ZipTip® sampling
To overcome problems with automation and recovery, ZipTip sampling hasbeen developed, which is best regarded as miniaturized and simplified SPEequipment. It is frequently used in the field of proteomics, mostly as the lastsample preparation step. Sample amount is only a few (3–30) �l, containingless than a picomole protein digest. Commonly it is used to remove salts anddetergents from the sample, e.g., after tryptic digest, just before mass spectro-metric analysis.
The ZipTip equipment is similar to a conventional pipette tip, packed with asmall amount of sorbent. Usually 10 �l pipette tips are used with 0.2–0.6 �l bedvolume; the sorbent is packed into the tip region. Similar types of sorbents areused as in SPE, although with less variety. Most common are C18, C4, occasion-ally SCX, and metal chelate stationary phases. Operation is similar to SPE: First,the tip is conditioned by aspirating and dispensing a few microliters of cleansolvent. Then, the sample is aspirated and dispensed, followed by washing withthe same solvent (usually water). The sample is bound to the sorbent, while con-taminants (salts, detergents, etc.) are washed away. Last, the sample is eluted in afew microliters of stronger solvent, e.g., 0.1% formic acid:75% methanol. Therecovered samples are directly transferred to the MALDI target or injected into themass spectrometer or loaded directly into a nanospray needle [14]. For MALDIanalysis, it is also common to elute the sample with the MALDI matrix, spottingit directly onto the target.
There are different resins available. C18 and C4 packings are often used fordesalting and concentrating peptides and proteins, SCX phases for removingdetergents, and metal chelate packings for enriching phosphopeptides. The mainadvantages of using ZipTip are that it is very simple and fast (requires less than aminute), and recovery problems are minimized (due to the use of only very smallsorbent size).
3.4. Solid-phase microextraction
A recent and very successful approach to sample preparation is SPME invented byPawliszyn and coworkers [15], and reviewed recently [16]. SPME integratessampling, extraction, concentration, and sample introduction into a single, solvent-free step. It is excellent as a sampling tool for GC and gas chromatography–mass spectrometry (GC–MS). It is routinely used for extraction of volatile andsemivolatile organics, mostly as headspace (HS) analysis.
The SPME apparatus looks like a modified syringe (see Fig. 5) consisting of afiber holder needle and a fiber assembly, the latter equipped with a 1–2 cm longretractable SPME fiber. The fiber itself is a thin fused-silica optical fiber, coatedwith a thin polymer film (such as polydimethylsiloxane, PDMS), as shown

54 G. Vas et al.
in Fig. 5. The polymer coating on the fiber acts as a sponge, concentrating theanalytes by absorption/adsorption processes. The principle of extraction is anal-ogous to that of GC, based on a partitioning process [17]. There are various typesof fibers; the choice depends mainly on the polarity and volatility of analytes.Extraction usually takes place in the gas phase (HS sampling), though occasion-ally the fiber may be immersed into a liquid sample.
During sampling, the SPME needle is first introduced into the sample vialusually by piercing a septum, as shown in Fig. 6. Then the extraction fiber ispushed out of the needle, either into a gas, into the HS of a sample, or immersedinto a liquid sample (direct immersion (DI) or DI-SPME analysis). Agitation of thesample (by stirring or by sonication) improves transport of analytes from the bulkphase, accelerating equilibration. After equilibrium is reached, the fiber iswithdrawn into the needle, taken out of the sample vial, and introduced into the GCinjector. The fiber is exposed; analytes are desorbed and carried onto the separa-tion column by the carrier gas. The GC injector is usually at a high temperature, sodesorption is fast. As there is no solvent, splitless injection can usually be per-formed, making the analysis very sensitive. Finally, the SPME device is withdrawnfrom the GC injector. The SPME fibers can easily be cleaned by heating. This isusually performed by keeping the fiber in the GC injector for some time (switch-ing to split mode after injection) or using a special syringe cleaner. In the case ofHS analysis, fibers can be reused hundreds of times, so SPME operation isrelatively inexpensive.
Fig. 5. Schematic diagram of an SPME needle.
PlungerBarrel
Hub viewing window
Z-slot
Plunger retaining screwAdjustable needle guide
Septum piercing needle
Fiber attachment tubing
Fused silica fiber

Biomedical sampling 55
The sampling process in SPME depends on a number of parameters. Probablythe most important is temperature—in the case of both traditional HS analysis andSPME. Polymer coating has a similar influence as the stationary phase in GC. Thetypes of SPME fibers are analogous to the types of GC columns available.Probably, most commonly the apolar PDMS coating is used. Film thickness notonly relates to sample capacity and volatility of the analyte but also has aninfluence on the time needed to establish equilibrium. Establishing equilibriumconditions depends on many parameters (volatility of the sample, volume of headspace, intensity of stirring, etc.) and may require a few minutes or several hours.The SPME fiber has to be immersed into the HS either till equilibrium is estab-lished or, in order to obtain good reproducibility, for a well-defined and preciselycontrolled period. Note that SPME fibers should be carefully handled as they arefragile and the fiber coating can be easily damaged.
The most widespread SPME applications utilize injection to a GC (orGC–MS) system. Thermal desorption in the GC injection port depends on thetemperature, exposure time, analyte volatility, and the type and thickness of thefiber coating. To ensure a high linear flow, a narrow-bore GC injector insert isrequired. The fiber needs to be inserted to a depth corresponding to the hot injec-tor zone. This is important because the temperature varies along the length ofthe injector, and desorption of analytes is very sensitive to the temperature.
Fig. 6. Illustration of the SPME process.
A B C D E F

56 G. Vas et al.
Desorption time is generally in the 10–100 s range, but it needs to be optimized.To ensure high sensitivity, the injector is usually operated in splitless mode—thisis possible as no solvent is used in SPME. A frequent practical problem usingSPME is that GC septa are easily damaged with the wide (24-gauge) SPMEneedles. To avoid septum coring, predrilled GC septa or septum-less injectorvalves may be used.
The main advantages of SPME are good analytical performance combined withsimplicity and low cost [18]. It is well adapted to most compounds, which can bestudied by GC. SPME produces clean and concentrated extracts and is ideal forGC–MS applications [17,19,20]. SPME is suitable for automation, which notonly reduces labor costs but also often improves accuracy and precision. The maindisadvantage of SPME is that it is less well adapted for quantitative analysis.Accurate measurements (in terms of quantitation) require careful control of anumber of experimental variables, which is elaborate and not always feasible.
Success of SPME coupled to HS analysis using GC and GC–MS promptedstudies to extend this technique to study nonvolatile, polar compounds.Compounds that are amenable for GC analysis, but have low vapor pressure, maybe studied by DI SPME. In this case the fiber is immersed into the liquid samplewhere extraction takes place. Subsequently the fiber is inserted into the GCinjector. This technique retains most advantages of SPME, notably simple opera-tion, solvent-free extraction, and high sensitivity. However, in this case the fiberis easily damaged (mainly by irreversible absorption of large polar molecules) andcan be reused only few times (which makes operation expensive). Extractionefficiency and the time necessary to reach equilibrium are influenced by severalparameters (such as agitation, pH, ion strength, etc.), and reproducibility (in termsof quantitation) is usually worse than for HS analysis. To prevent the loss of polaranalytes, deactivation of glassware before use is recommended [21].
A further extension of the SPME technique is coupling to HPLC (orHPLC–MS), which extends the method to (usually polar) compounds that are notamenable for GC analysis. This is also performed by DI sampling. After extrac-tion, compounds bound to the fiber are extracted by a strong solvent. Note that themuch simpler thermal desorption cannot be used, as the compounds to be studiedare not volatile. This extraction takes place in a special extraction chamber,connected to a modified Rheodyne or Valco valve of an HPLC system. To facili-tate HPLC analysis, a special, so-called in-tube SPME device has been developed.With this technique, organic compounds in aqueous samples are directly extract-ed from the sample into the internally coated stationary phase of a capillarycolumn and then desorbed by introducing a moving stream of mobile phase.
In conclusion, SPME is an ideally suited sample preparation method to preparesamples for GC or GC–MS. Most compounds well suited for GC analysis can beextracted and concentrated using SPME, which is easy and results in excellentanalytical performance. SPME is, however, less well adapted as a sample prepa-ration for HPLC to study polar or large molecules.

Biomedical sampling 57
4. Automation and high throughput
High-throughput (HT) analysis is becoming more and more important. It meansanalysis of dozens, hundreds, or even thousands of samples per day in a given lab-oratory or on a particular instrument. In the biomedical field, it makes large-scaleexperiments and testing a large number of compounds (e.g., combinatoriallibraries for a particular biological effect) possible, while in the clinical field, it isessential for population-wide screening, but often also to test a particular group ofpatients.
The main methodologies needed for HT are automation and robotization. Mostanalytical methods, including sample preparation, can be adapted for this purpose.HT requires very large investment in instrumentation (and also in method develop-ment), but running costs (per sample analyzed) are much lower, mainly due toreduction of manual labor. A further advantage of automatic/robotic operation isthat of finding qualified personnel, which is becoming more and more difficult.
Performing high-throughput analysis requires careful design. First, the analyti-cal method needs to be developed in “low throughput,” keeping in mind require-ments for future HP experiments. In the next step this should be adapted for HT.This usually means a simplification of sample handling, parallel manipulation of alarge number of samples, speeding up all steps which include long waiting time oranalysis time. Bottlenecks in the sample flow should be identified and eliminated.Note that to perform HT experiments the sample preparation and analyticalmethods often need to be changed. Sample preparation and analytical methodsneed to be very robust to perform under HT conditions. In most cases analyticalperformance (e.g., detection limit) is not as good as in conventional analysis—thisneeds to be taken into account in the development phase. On the other hand, repro-ducibility is often improved using automatic and robotic techniques. An integralpart of HT operation is proper labeling (usually bar codes are used), managing sam-ple flow, evaluation, and reporting the results. These are controlled by special(often individually developed or adapted) software.
Sample preparation involves one step in any HT experiment—as this step isusually the most time-consuming, it is an essential aspect of designing andperforming HT analysis. Luckily, most sample preparation methods can be adapt-ed for HT. Probably most important is the use of well plates: a two-dimensionalarray of sample vials, usually handling 96-well (occasionally 384) samples. Theseare well standardized and can be used in most commercial analytical instruments.Special automatic pipettes are developed to use with these well plates, containing(8, 10, or 12) parallel pipette tips. These well plates are often used in manualoperation, but they still allow high-throughput operation (96 samples can beprepared instead of 1, requiring only somewhat more time). There are commer-cially available and often-used versions of most sample preparation laboratoryequipments (centrifuges, thermostats, automatic injectors, etc.) that can be usedin combination with these well plates. The following three examples will give

58 G. Vas et al.
information related to HT operation of techniques discussed earlier: proteinprecipitation, LLE, and SPE.
The protein precipitation can be easily performed by an automated liquid handler(e.g., Packard Multiprobe II, Tecan Genesis, Gilson 215, Tomtec Microtape, etc.) ina well plate or a microwell plate, by adding a water-miscible organic solvent (typ-ically 3:1 (v/v) ratio) to the biological matrix. Proteins are then collected in thebottom of the well by centrifugation and the handler can take the aliquot of the clearliquid and transfer it to a well plate prior to LC–MS injection. Additional tasks suchas adding internal standards for calibration and quality control can also be handledby automated liquid handlers.
LLE can also be automated by using a liquid handler (Tomtec Quadra96) usinga microplate platform. The biological matrix is mixed with immiscible organicsolvent (e.g., chloroform and ether). Depending on the particular application, LLEmay require manual intervention, such as decapping tubes or vortexing (shaking).Removal of the organic layer can be done automatically; freezing the aqueouslayer reduces possible errors in sampling.
SPE can be automated offline by using SPE microplates or by a multiple-tipliquid-handling workstation (e.g., Zymark XP series). The SPE extraction can beperformed online as well, using a versatile automated system such as Prospektfrom Spark Holland. This automated unit includes a solvent delivery unit, acartridge transport, a sealing mechanism, and an autosampler. Samples are intro-duced by the autosampler and loaded to a disposable cartridge (2 mm 10 mm);a weak solvent then elutes the unretained salts and the polar matrix components.An optimized sequence of solvents is used to wash the trapped analytes to an ana-lytical column for HPLC separation, followed by detection. Each sample isprocessed by a single-use, disposable cartridge, so carryover is minimal [2].
5. Outlook
Sampling and sample preparation are cornerstones of any analytical methodology.Probably the most important advances in this field are miniaturization, simplifica-tion of methodologies, and their adaptation to HT. On the technical side, usingdevices analogous to very simplified chromatography have become widespread.These usually take the form of a small disposable cartridge, such as SPE, ultrafil-tration tubes, etc. These are very efficient, are easy to adapt to the requiredproblem, need small sample size, minimize problems related to contamination(carryover), and are easy to automate. Most other sample preparation equipmentsserve to support or complement these techniques.
Future developments in sampling are likely to follow these lines. There is moreand more need for automatic operation, for both HT and reduction of manuallabor.

Biomedical sampling 59
References
1. Pawliszyn, J., Solid Phase Microextraction: Theory and Practice. Wiley-VCH, New York,1998.
2. Pawliszyn, J., Sampling and Sample Preparation for Field and Laboratory. Elsevier,Amsterdam, 2002.
3. Richard, S.S., Clinical and Functional Histology. Little Brown and Co., Boston, MA, USA,1984.
4. Watson, I.D., Sample Preparation for Biomedical and Environmental Analysis. Plenum Press,New York, NY, USA, 1994.
5. Sporkert, F. and Pragst, F., Use of headspace solid-phase microextraction (HS-SPME) in hairanalysis for organic compounds. Forensic. Sci. Int., 107, 129–148 (2000).
6. Smith, R.M., Before the injection-modern methods of sample preparation for separationtechniques. J. Chromatogr. A, 1000, 3–27 (2003).
7. Buszewski, B. and Ligor, T., Single-drop extraction versus solid-phase microextraction for theanalysis of vocs in water. LC-GC Eur., 15, 92–96 (2002).
8. Rasmussen, K.E., Bjergaard, S.P., Krogh, M., Ugland, H.G. and Gronhang, T., Developmentof a simple in-vial liquid-phase microextraction device for drug analysis compatible withcapillary gas chromatography, capillary electrophoresis and high-performance liquid chro-matography. J. Chromatogr. A, 873, 3–11 (2000).
9. Jonsson, J.A. and Mathiasson, L., Membrane-based techniques for sample enrichment.J. Chromatogr. A., 902, 205–225 (2000).
10. Halvorsen, T.G., Bjergaard, S.P. and Rasmussen, K.E., Liquid-phase microextraction and cap-illary electrophoresis of citalopram, an antidepressant drug. J. Chromatogr. A, 909, 87–93(2001).
11. Soriano, T., Jurado, C., Menendez, M. and Repetto, M., Improved solid-phase extractionmethod for systematic toxicological analysis in biological fluids. J. Anal. Toxicol., 25,137–143 (2001).
12. Leon-Gonzalez, M.E. and Perez-Arribas, L.V., Chemically modified polymeric sorbents forsample preconcentration. J. Chromatogr. A, 902, 3–16 (2000).
13. Carson, M.C., Ion-pair solid-phase extraction. J. Chromatogr. A, 885, 343–350 (2000).14. Van Pelt, C.K., Zhang, S., Fung, E., Chu, I., Liu, T., Li, C., Korfmacher, W.A. and Henion, J.,
A fully automated nanoelectrospay tandem mass spectrometric method for analysis of caco-2samples. Rapid Comm. Mass Spectrom., 17, 1573 (2003).
15. Arthur, C.L. and Pawliszyn, J., Solid phase microextraction with thermal desorption usingfused silica optical fibers. Anal. Chem., 62, 2145 (1990).
16. Vas, G. and Vekey, K., Solid-phase microextraction: a powerful sample preparation tool priorto mass spectrometric analysis. J. Mass Spectrom., 39, 233 (2004).
17. Ulrich, S.J., Solid-phase microextraction in biomedical analysis. J. Chromatogr. A, 902,167–194 (2000).
18. Kataoka, H., Lord, H.L. and Pawliszyn, J., Applications of solid-phase microextraction in foodanalysis. J. Chromatogr. A, 880, 35–62 (2000).
19. Lancas, F.M., Queiroz, M.E.C. and Eugenia, M., Tips on preparing plasma samples for druganalysis by SPME. LC-GC, 22, 970 (2004).
20. Snow, N.H., Solid-phase micro-extraction of drugs from biological matrices. J. Chromatogr A,885, 445–455 (2000).
21. Wercinski, S.C.S., Solid Phase Microextraction—A Practical Guide. Marcel Dekker,New York, 1999.

This page intentionally left blank

Medical Applications of Mass SpectrometryK. Vékey, A. Telekes and A. Vertes (editors)© 2008 Elsevier B.V. All rights reserved
61
Chapter 5
Separation methods
KORNÉL NAGY* and KÁROLY VÉKEY
Chemical Research Center, Hungarian Academy of Sciences, Budapest, Hungary
1. Introduction 612. Gas chromatography 723. High-performance liquid chromatography 77
3.1. Normal-phase liquid chromatography 803.2. Reverse-phase liquid chromatography 813.3. Ion-exchange liquid chromatography 833.4. Size exclusion chromatography (gel filtration) 843.5. 2D liquid chromatography 84
4. Electrophoretic techniques 854.1. Capillary zone electrophoresis 854.2. Capillary gel electrophoresis 864.3. Capillary isoelectric focusing 864.4. Sodium dodecyl sulfate polyacrylamide gel electrophoresis 874.5. 2D gel electrophoresis 87
5. Future trends 88References 89
1. Introduction
Biomedical analysis nearly always relates to complex matrices. Following sam-pling and sample preparation, chromatography is the primary technique to separatemixtures into their chemical components. In most cases this step is necessary beforestructural analysis or quantitation can be performed. In general, in chromatographya fluid (containing the multicomponent sample) moves over a nonmoving(stationary) phase. When there is a strong interaction between a given compound
*Corresponding author. Present address: Nestlé Research Center, Lausanne. Tel.: � 4121-785.8290; Fax: � 4121-785.8566. E-mail: [email protected]

62 K. Nagy and K. Vékey
and the stationary phase, the migration of the component will slow down. Whenthe interaction is minimal, the compound will migrate with the same velocity as themobile phase. This results in the separation of the various components of a mixture.Chromatography yields two basic pieces of information on the separated compo-nents: the degree of retention (characteristic of molecular structure) and signalintensity (related to the amount of the component). Chromatography is usuallybased on the distribution of the various compounds between a stationary and amobile phase and/or on the electrophoretic mobility of the compounds. Separationcan be implemented in several ways. The three major groups of chromatographictechniques are (1) gas chromatography (GC), (2) high-performance liquid chro-matography (HPLC), and (3) electrophoretic techniques. These techniques differ inthe applied mobile phase (gas or liquid) and in the type of retention and flow mech-anism (see the following text).
As a rule of thumb, GC is used for the separation of volatile compounds.Thus, it isuseful for determination of low-molecular-weight compounds (below 500 Da) butcannotbeusedforlarge,highlypolarorthermallylabilecompounds.Implementationof GC is simple and routine. GC is mostly coupled with flame ionization detection(FID), electron capture detection (ECD), or mass spectrometry (MS).
HPLC is used for nonvolatile compounds and is well suited for the analysis oflow- and high-molecular weight compounds such as peptides and proteins. HPLCis mostly coupled with ultraviolet visible (UV–VIS) wavelength spectroscopy ormass spectrometric detection.
Electrophoretic techniques are used for nonvolatile compounds, which arepermanently or temporarily charged, such as proteins or organic salts.Electrophoretic techniques have an increasing importance in biomedical fields,such as proteomics.
Chromatographic techniques help in ensuring the selectivity and sensitivitynecessary for clinical analysis and contribute to the success of the analyticalprocess. Complete separation in biological samples is rarely feasible. The purposeis more often to reduce the complexity of a mixture, enrichment of a given com-ponent, or removal of interferences. In most cases chromatography is used foranalytical purposes, although it may also be used in preparative chemistry. Theexpression “chromatographic techniques” covers a wide range of analytical meth-ods that can separate chemical components of a sample on the basis of theirmolecular properties such as size or polarity. Several detailed studies can be foundin the literature discussing the implementation and mechanism of separation tech-niques [1–11]. Commonly used chromatographic methods are listed in Table 1. Inthe present chapter we only provide a basic description and a brief overview: FirstGC, then HPLC, and finally electrophoretic techniques are discussed.
Chromatography is a collective name for methods that separate compoundsbased on their interaction with a mobile phase (in which the sample is dissolved ormixed) and a stationary phase. For instance, the strength of interaction between anapolar compound and an apolar stationary phase is strong; thus, the compound will

Separation methods 63
Table 1
Commonly used chromatographic methods
Technique Acronym Meaning
1 2D electrophoresis 2DE Combined application of electrophore-sis and isoelectric focusing in a thingel-based layer.
2 Affinity chromatography A method of separating and purifyingcompounds using their biochemicalaffinity to the stationary phase.
3 Capillary electrophoresis CE Usually the same as CZE, but some-times used as a collective name forseveral electrophoretic methods.
4 Capillary gel electrophoresis Electrophoretic separation performedin gel-filled capillary columns.
5 Capillary isoelectric focusing An electrophoretic technique that sepa-rates and focuses compounds into peaksaccording to their isoelectric points.
6 Capillary zone electrophoresis CZE A separation technique based on theelectrophoretic mobility of analytes inelectrolytes. It is performed in fusedsilica capillaries by applying highvoltage to the ends of the column.
7 Column chromatography Liquid chromatography performed bymoving the mobile phase through apacked column using gravity.
8 Gas chromatography GC A type of chromatography when themobile phase is a gas.
9 Gel filtration Size exclusion chromatographyperformed with aqueous solvents forthe separation of biopolymers.
10 Gel permeation GPC Size exclusion chromatographychromatography performed with organic solvents for
the separation of synthetic polymers.11 Gradient elution A type of elution in liquid chromatogra-
phy where the composition of mobilephase is changed during the experiment.
12 High-performance liquid HPLC A type of chromatography when thechromatography mobile phase is a liquid and is trans-
ferred through the column viamechanical pumps.
13 Ion-exchange HPLC IE-HPLC A type of liquid chromatography inwhich the retention is based onion-pair formation.
14 Liquid chromatography LC A type of chromatography in which themobile phase is liquid.
15 Multidimensional A type of chromatography in which chromatography basically different separation processes
are applied on the same sample in aconsecutive arrangement.
(continues)

64 K. Nagy and K. Vékey
Table 1
Continued
Technique Acronym Meaning
16 Normal-phase HPLC NP An expression to characterize an HPLCsystem. Under NP circumstances themobile phase is less polar than the sta-tionary phase. Typical example is elutionon a silica column with hexane solvent.
17 Reverse-phase HPLC RP An expression to characterize achromatographic system. Under RPcircumstances the mobile phase is morepolar than the stationary phase. Typicalexample is methanol/acetonitrilesolvent on octadecyl silica phase.
18 Size exclusion chromatography SEC A type of liquid chromatography inwhich the retention is based on thehydrodynamic size of the analytes.
19 Sodium dodecyl sulfate SDS-PAGE Electrophoretic separation performedpolyacrylamide gel in polyacrylamide gel in SDS-richelectrophoresis media. It is used to separate
compounds according to theirmolecular weight.
20 Thin-layer chromatography TLC A type of liquid chromatographyperformed on a thin two-dimensionallayer used as stationary phase.
be strongly retained on the column. On the contrary, a polar compound interactsless strongly with an apolar stationary phase; thus, it moves through the column ata faster rate. When a mixture of two different compounds is injected onto the topof a column, they will be retained to a different degree and will arrive to the endof the column at a different time. If a detector is placed at the end of the column,then the signal as a function of time depicts the elution sequence of the compoundsas consecutive peaks and this is called chromatogram (illustrated in Fig. 1).
Among the various features that characterize the chromatograms the mostimportant ones are retention time, resolution, and signal intensity. Retention time(tR) is the time elapsed between sample introduction (beginning of the chro-matogram) and the maximum signal of the given compound at the detector. Theretention time is strongly correlated with the physicochemical properties of theanalyte; thus, it provides qualitative information about the compound, which insimple cases may be identified using this information. Resolved compoundsalways have different retention times. Retention volume is a related parameter.It is the volume of the mobile phase that is required to elute a given compoundfrom sample introduction to the detector. It can be calculated by multiplying the retention time with the flow rate of the mobile phase. The retention factor

Separation methods 65
(or capacity factor, often abbreviated as k) is also related, and is a measure ofdistribution of a given compound between the stationary and mobile phases. Itexpresses the strength of adsorption of the analyte on the stationary phase.
(1)
where nS is the number of moles of the given compound in the stationary phase,nM the number of moles of the same compound in the mobile phase, tR the reten-tion time of the compound, and t0 the dead time or holdup time (retention time ofa compound which does not interact with the stationary phase).
Resolution is a measure of the quality of separation between two componentsand is defined as:
(2)
where R is the resolution, tR,1 the retention time of the first component, tR,2 theretention time of the second component, and w1 and w2 are the peak widths of thefirst and second components (projected onto the baseline), respectively. Its ana-lytical meaning is similar to the selectivity, which is defined as:
(3)
Both selectivity and resolution are properties of an experimental method, whichreflects the extent of discriminating power between two compounds. If resolution
α
R,2 0
R,1
�
�
t tt t0
Rt t
w w 2
R,2 R,1
1
�
�2
knn
t tt
S
M
R
0
� 0
Fig. 1. An example of chromatogram showing parameters used to characterize chromatographicpeaks.

66 K. Nagy and K. Vékey
between the two compounds is good, then they are fully separated, arrive to thedetector at different times, and do not interfere with each other. Good resolutionof compounds is a prerequisite of quantitative analysis. Resolution is stronglyrelated to the widths of chromatographic peaks. The theoretical plate number is ameasure of peak width, and can be calculated by the following equation:
(4)
where �t is half of the peak width measured at 0.6 peak height. The higher the the-oretical number of plates the narrower the peaks are. The expression efficiency orplate number/meter (theoretical number of plates for a 1 m long column) is oftenused to characterize and compare performance of different stationary phases.Typical efficiency values fall in the 10,000–100,000 range for modern LC and inthe 2500–5000 range for GC. Note, however, that HPLC columns are typically�10 cm, while GC columns �50 m long, so the plate number of GC columns ismuch higher than that of the HPLC, resulting in better resolution.
The height and area of the recorded peaks are also very important as thesereflect the quantity of a given compound. Accordingly, accurate determination ofpeak height and peak area is a prerequisite of quantitative analysis. Note that thesensitivity of a detector is different for various compounds and different detectorsalso have different relative sensitivities. To perform quantitative analysis, carefulcalibration is always needed.
Chromatograms are usually obtained by the elution technique: The sample isinjected onto the column and is carried by a fluid through the column to the detector,so various compounds arrive to the same place at different times. Chromatographicpeaks obtained by the elution technique ideally possess a Gaussian-like shape. Inpractice, peak shapes are often different, frequently indicating problems with theseparation process. The two common problematic peak shapes are shown in Fig. 2.
Nt
t R
22
σ
Fig. 2. Illustration of typical peak shapes.
0 10 20 30 40 50 60 70 80
0.000
0.005
0.010
0.015
0.020
0.025
0.030
C
B
A
Inte
nsity
[%]
Retention time [min]

Separation methods 67
Peak A illustrates strong tailing, which is most often the result of loose connec-tions or the presence of large dead volumes in the system, but may also be causedby problems with the separation process. Dead volumes are often present whenmetal fittings are applied, so the use of flexible and easily adjustable “finger-tight”PEEK fittings and ferrules is advisable in most cases. Peak B is an ideal Gaussian-shaped peak, while peak C depicts a peak with strong fronting. This is typically theresult of overloading the column and can be avoided by diluting or decreasing theamount of sample injected. Detailed description on peak shapes and their deter-mining factors can be found elsewhere [12–14].
A common aim in chromatographic method development is to produce thehighest possible resolution of the components within the shortest possible time.This is possible only if the peaks are narrow. Selective and fast methods requirehigh theoretical plate number, high selectivity, and short retention times asshown in the model chromatogram in Fig. 3C. Other, less desirable examplesare also shown in the figure, where A illustrates a nonselective, slow chro-matogram, B a nonselective, but fast chromatogram, and D a selective, but slowchromatogram.
Physicochemical properties of different compounds span a very large range, soit is impossible to develop a universal method well suited for all analyticalpurposes. Various chromatographic techniques were developed and optimized fordifferent analytes (a list of common techniques is provided in Table 1). As a ruleof thumb, GC methods are useful for determining low-molecular-weight (below500 Da), not-very-polar, thermally stable compounds, but cannot be used, e.g., fordetermination of peptides or proteins. LC is the method of choice for nonvolatile,polar or thermally labile compounds, which represent the vast majority of
Fig. 3. Illustration of variations in selectivity and retention time in chromatograms.
100 5 15 20 25 30
D
C
Retention time [min]
B
A
Inte
nsity

68 K. Nagy and K. Vékey
compounds found in biological systems. The most widespread liquid chromato-graphic method is HPLC, in which high pressure (50–400 bar) pushes the mobilephase through the column. Electrophoretic techniques are increasingly used and arewell suited for the analysis of ionized (or ionizable) molecules (including macro-molecules).
Chromatographic separations must be followed by detection to see the resultof the separation process. GC typically uses FID, ECD, or mass spectrometricdetection. In HPLC, UV–VIS and MS detection are very common, while one-dimensional (1D) and two-dimensional (2D) gel electrophoretic techniquesgenerally use staining to make component spots visible. In the last decade, detec-tion using MS was particularly often used as it provides structural informationand can be utilized to increase selectivity and specificity and to lower detectionlimits.
Chromatography combined with MS is also often considered as the mostefficient “gold standard method.” MS provides unusually high selectivity andspecificity because it delivers molecular mass and structural information on agiven compound/chromatographic peak. Using MS allows faster chromatograms,as problems caused by coelution may be overcome by selective MS detection.Using high resolution or tandem mass spectrometry (MS/MS) further increasesselectivity. The use of MS detectors often results in lower detection limits, as itshigh selectivity reduces chemical noise (which is often the most serious issue inanalysis, especially in the case of biological samples). MS expands the applica-bility of chromatographic methods, e.g., by overcoming problems of UVdetection, as in the case of apolar compounds lacking suitable UV absorptionband. On the contrary, mass spectrometric detection puts some restrictions on thechromatographic method used. A typical limitation is that the commonly usedpotassium phosphate buffer blocks the orifice of a mass spectrometer. To over-come this problem, only volatile buffers, such as ammonium formate, can be usedin HPLC/MS applications [15]. In general, combination of MS with chromatog-raphy provides far more advantages than disadvantages. The most importantadvantages are increased selectivity, shorter analysis times, lower detection limits(especially for biological samples), and simplification of sample preparationprotocols.
Quantitation is a widely used application of chromatography for a wide varietyof compounds with biological importance. Just like in any other case, quantitationis based on a calibration curve that determines the relationship between the meas-ured signal and the concentration of the compound of interest. Plotting detectorresponse as a function of analyte concentration, one can obtain the calibrationcurve. Ideally there is a linear relationship between the detector signal and the sam-ple amount, but in practice calibration curves often deviate from linearity both atvery low and very high sample concentrations. For quantitation purposes, the linearmiddle range is desirable. Linearity of the calibration curve is often characterized

Separation methods 69
by the R2 value. The closer this value is to 1, the better is the linearity (typically lin-earity better than 0.99 is required). The lower end of the linear range of the cali-bration curve determines the limit of quantitation. Typically this is defined by theposition, where the calibration curve deviates from the trendline by 10%. This is thesmallest analyte amount that can be quantified by the method. The smallest sampleamount that can be detected by the given method (defined typically by a signal-to-noise ratio of 3) is the limit of detection. Note that it is always smaller than the limitof quantitation, which is frequently estimated as 10 times signal-to-noise ratio.Repeatability and reproducibility are also important parameters of an analyticalprocess, and must be determined to check the reliability of the results. Typically“same day” and “day-to-day” repeatability values are calculated from 3 to 10replicate measurements. For the validation of a chromatographic method otherparameters are often needed as well, such as robustness, precision, accuracy, andrecovery—but these topics are outside the scope of this chapter [16–18].
Chromatography—like other sciences—uses special terminology and acronyms.Navigating through these may occasionally become frustrating for the nonspecial-ist reader. As a guide, commonly used terms and acronyms in chromatography aresummarized in Table 2.
Table 2
Commonly used terms and acronyms in chromatography
Term Acronym Meaning
1 Capacity factor k A number characterizing the capacity andretention of chromatographic columns.
2 Carrier gas The gas used in GC as the mobile phaseto carry the analytes from the injector todetector.
3 Chromatogram Plot of the detector response as a functionof time.
4 Coating (GC capillary) Mostly polymeric material on the inner wallof GC capillaries used as the stationary phase.
5 Dead time t0, tM Time interval for an absolutely nonbindingcompound to travel through the column.Also called holdup time.
6 Efficiency Analytical power of a column filling materialexpressed as number of theoretical plates per1 m long column.
7 Effluent The mobile phase is called effluent whenleaving the column.
8 Eluent Mobile phase that elutes the analytes.9 Elution The process of driving the analyte from the
entry to the end of the column.
(continues)
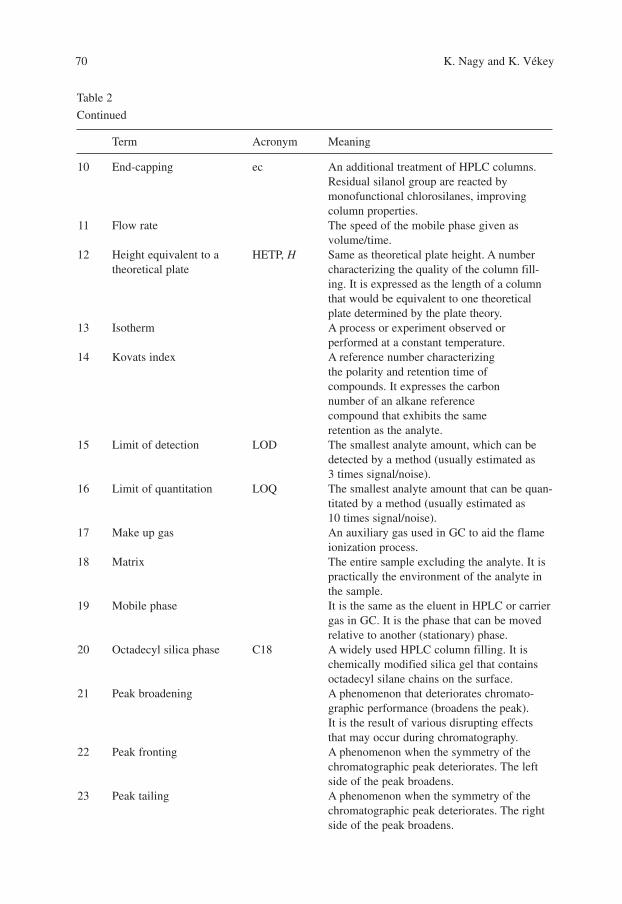
70 K. Nagy and K. Vékey
Table 2
Continued
Term Acronym Meaning
10 End-capping ec An additional treatment of HPLC columns.Residual silanol group are reacted bymonofunctional chlorosilanes, improvingcolumn properties.
11 Flow rate The speed of the mobile phase given asvolume/time.
12 Height equivalent to a HETP, H Same as theoretical plate height. A numbertheoretical plate characterizing the quality of the column fill-
ing. It is expressed as the length of a columnthat would be equivalent to one theoreticalplate determined by the plate theory.
13 Isotherm A process or experiment observed orperformed at a constant temperature.
14 Kovats index A reference number characterizingthe polarity and retention time ofcompounds. It expresses the carbonnumber of an alkane referencecompound that exhibits the sameretention as the analyte.
15 Limit of detection LOD The smallest analyte amount, which can bedetected by a method (usually estimated as3 times signal/noise).
16 Limit of quantitation LOQ The smallest analyte amount that can be quan-titated by a method (usually estimated as10 times signal/noise).
17 Make up gas An auxiliary gas used in GC to aid the flameionization process.
18 Matrix The entire sample excluding the analyte. It ispractically the environment of the analyte inthe sample.
19 Mobile phase It is the same as the eluent in HPLC or carriergas in GC. It is the phase that can be movedrelative to another (stationary) phase.
20 Octadecyl silica phase C18 A widely used HPLC column filling. It ischemically modified silica gel that containsoctadecyl silane chains on the surface.
21 Peak broadening A phenomenon that deteriorates chromato-graphic performance (broadens the peak).It is the result of various disrupting effectsthat may occur during chromatography.
22 Peak fronting A phenomenon when the symmetry of thechromatographic peak deteriorates. The leftside of the peak broadens.
23 Peak tailing A phenomenon when the symmetry of thechromatographic peak deteriorates. The rightside of the peak broadens.

Separation methods 71
Table 2
Continued
Term Acronym Meaning
24 Peak width Sigma, w Width of a chromatographic peak measuredeither on the projected baseline (w) or at 60% height (also called 2 times sigma).
25 Purge A collective name for all those events where achromatographic volume is cleaned by flushingit with mobile phase at high flow rate.
26 Repeatability Repeatability characterizes the analytical powerof the actual method. It shows how large is thedeviation of the results if one person repeats theexperiment using the very same conditions onthe very same instrument with the same sample.
27 Reproducibility Reproducibility characterizes the analyticalpower of the actual method. It shows howlarge is the deviation of the results if differentpersons repeat the same experiment using thesame conditions on different instruments.
28 Resolution R Resolution is the extent of separation betweentwo components.
29 Retention factor k The extent of retention in a given chromato-graphic system is characterized by the reten-tion factor. If retention factor is high, then theanalyte binds strongly to the stationary phaseand the retention time will be long.
30 Retention index A number expressing the extent of retention ofa given compound compared to the retentionof the reference compound.
31 Retention time tR Time elapsed between injection and maximumdetector response for a compound.
32 Retention volume VR It is the volume of eluent that passes throughthe column while eluting a given compound.
33 Robustness Robustness is a characteristic of the developedmethod. It represents the sensitivity of themethod to the change of experimentalparameters.
34 Selectivity � Selectivity is the measure of discriminationamong analytes.Amethod is selective if it distin-guishes among the measured compounds easily.
35 Specificity Specificity is a characteristic of the method.A method is called specific for a compound ifit can distinguish it from other compounds andcan identify it with full confidence.
36 Split injection Split injection is an injection techniquecommonly used in GC. When performingsplit injection, the injected sample is splitted
(continues)

72 K. Nagy and K. Vékey
Table 2
Continued
Term Acronym Meaning
in the injector and only a small portion of thesample enters the chromatographic column.
37 Splitless injection Splitless injection is an injection techniquecommonly used in GC. When performingsplitless injection, the injected sample is notsplitted, but the whole amount is directed intothe column. After having the appropriatesample amount on the column, the rest of thesample is flushed from the injector.
38 Staining Staining is a commonly used visualizationtechnique in 2D gel separations. In a stainingprocess the separated spots are treated withstaining reagent making the spots visible.
39 Stationary phase It is the phase that is considered as static rela-tive to another (mobile) phase. This meanspractically the sorbent of the columns.
40 Theoretical plate height HETP, H Same as height equivalent to a theoretical plate.41 Theoretical plate number N Theoretical plate number is a number that
characterizes the separation efficacy of thecolumn. The higher this number the narrowerare the peaks in the chromatogram.
42 UV/VIS detection UV, UV/VIS A commonly used detection in HPLC thatmeasures the ultraviolet (UV) or visible (VIS)absorbance of the sample.
43 Validation A procedure designed to estimate the reliabilityof the results measured by a given method.
44 van Deemter equation Equation explaining the separation and peak-broadening effects in liquid chromatography.Its simplified form: H A � B�u � Cu.
2. Gas chromatography
GC [5,19–24]—as the name implies—is a separation technique where the appliedmobile phase is a gas, while the stationary phase is a solid or a liquid. It has relativelyfew variants; now nearly exclusive capillary GC is used. The sample is evaporatedin an injector and a gas flow carries it through an open capillary tube (column) to thedetector. The schematic diagram of a gas chromatograph is shown in Fig. 4.
The heart of the GC system is the capillary column, which is operated inside aspecial thermostat. The inner wall of this capillary is coated with a liquid station-ary phase, which binds and thus retains the components of the sample. Separationis based on the distribution of various compounds between the liquid (stationary)and the gas (mobile) phases. Accordingly, retention of a given compound on the

Separation methods 73
column depends strongly on not only the vapor pressure of the analyte but also thecoating of the capillary column. Depending on the degree of retention, variouscomponents of a mixture will arrive to the detector at different times. The chro-matogram is obtained by plotting the signal intensity vs. arrival time. Detection canbe performed by a variety of techniques; the most common ones are FID, ECD,and MS. In GC applications relatively few parameters need to be optimized, somethod development is usually simpler and quicker than in the case of HPLC. GCand GC–MS have been used in analytical practice for a long time, so a largenumber of methods are developed, validated, and widely accepted. This means thatfor many applications there are already well-tested GC methods available. VariousGC columns are available; their most important characteristic is the type of thestationary phase. Other features are thickness of the stationary phase (film), innerdiameter, and length of the capillary. The majority of today’s applications workwith 20–60 m long, few hundred micrometer wide fused silica capillary columnscoated with a thin (0.01–5 �m) liquid (occasionally 5–50 �m solid) stationaryphase. The outside of the capillaries is coated with polyimide to make themflexible. Long, narrow capillaries coated with thin liquid film are the best for highresolution, while wide capillaries coated with thick film have higher samplecapacity. A typical column used in analytical practice is 60 m long, has 0.32 mminternal diameter, and is coated with 0.5 �m thick stationary phase.
The most commonly used stationary phases are silicon based, such as theapolar 100% polydimethylsiloxane phase. Addition of 5% diphenyldimethyl-polysiloxane makes the phase slightly more polar, favoring analysis formoderately polar compounds. Probably this is the most commonly used station-ary phase in GC. To separate compounds of high polarity, polar phases (such aspolyethylene glycol which has the trade name Carbowax) give the best results.Several other phases are used in practice, such as hydrocarbon, phtalate, glycolester, or nitrile-based phases. Note that while these stationary phases are liquid,
Syringe
To mass spectrometerand data system
To other detectorand data system
Inje
ctor
Capillary column
Thermostat
Car
rier
gas
sour
ce
Fig. 4. Schematic representation of a GC system.

74 K. Nagy and K. Vékey
they must not evaporate (even at the highest analysis temperature) and must notreact with the analyte. The so-called bleeding of a column is a typical problem inGC, which means that the stationary phase slowly evaporates from the surfaceduring analysis, deteriorating column performance and sensitivity. Bleedingeffects can be minimized by avoiding water for dilution of the sample and avoid-ing acidic or basic samples (or such additives). Bleeding might also occur if thecolumn is operated at very high temperature (above 250–300�C). For such appli-cations the use of special heat-resisting columns is needed.
The mobile phase (also called carrier gas) is an inert gas such as helium, argon,nitrogen, or hydrogen; its selection has little influence on the analytical performance.Performance of the GC system can be modeled by various equations, which includethe peak-broadening effects. For liquid-coated capillary columns, commonly theGolay equation is used [19]; its simplified form is shown in the following equation:
(5)
Here H is the theoretical plate height (reflecting the separation power of the system,the smaller the H the better the separation is), u the linear flow rate, B, CM, and CS
are constants representing the peak broadening effects (the longitudinal diffusion ofthe analytes in the mobile phase, mass transfer in the mobile phase, and mass trans-fer in the stationary phase, respectively). This relationship (which is very similar tothe van Deemter equation used in HPLC) includes the parameters of a given GC sys-tem and describes the effect of the flow rate on the separation power. CM and CS areproportional to the square of column diameter, so smaller diameter columns providesmaller (better) plate heights. Film thickness also influences H, which decreaseswith film thickness. However, thin films have less sample capacity, so the columncan get easily overloaded. Note also that GC columns can be characterized by theso-called beta value, � di / (4 df) where di is the inner diameter of the columnand df the thickness of the liquid stationary phase. Columns with � � 100 are usu-ally suited for analysis of very volatile compounds, columns with 100 � � � 400are applicable for general purposes, and columns with � � 400 are suited for theanalysis of compounds of high boiling point.
The main limitation of GC is the need to evaporate the sample. This limits thetype of compounds that can be studied. Polar, ionic, or thermally labile com-pounds (such as salts, peptides, etc.) or those with molecular mass above 500 Dacan rarely be studied. To extend the range of compounds amenable for GC analy-sis, derivatization methods have been developed to increase volatility [25–28].Derivatization makes it possible to use GC–MS for analysis of various smallorganics in body fluids. Note, however, that derivatization is time-consuming andit is a potential source of artifacts.
The most important parameter of a GC analysis is temperature. It has a profoundinfluence on the vapor pressure of analytes, and therefore on the partitioning
HBu C u C u M S � �

Separation methods 75
between the liquid and gas phase, and changes retention of compounds to a verylarge degree. Initially GC analysis was often done at a constant temperature (isother-mal); now temperature is commonly changed during analysis (temperatureprogramming). If the temperature is increased, retention time will be shortened;however, if it is decreased the retention time will increase. When retention is reducedthen the separation efficacy will also be decreased, so one must always find a trade-off between good resolution and acceptable separation time. Optimization of GCmethods is predominantly done by temperature programming, which is an essentialfeature of modern GC applications. In practice, it means that the GC column is keptisotherm at a given temperature for a certain time, and then the column temperatureis raised to X�C (with 5–20�C/min rate) and maintained at that temperature. Ifneeded, the temperature can be further raised in the second (or third) step.
A typical example for a GC program for separating widely different compoundsis the following: Start at 60�C with a 5 min long isotherm. Then, increase tempera-ture by 10�C/min rate to 220�C and maintain it for 20 min. If unresolved peaks occurin the chromatogram, the initial temperature may be decreased or the heating rate canbe slowed down (to 5�C/min for instance) to increase retention and enhanceselectivity. If all peaks are well separated, the initial temperature and/or the finaltemperature may be increased to speed up the analytical process. To reduce contam-ination and the possibility of artifacts, columns need to be regularly “conditioned”(after a day’s work). This means column temperature should be increased for 2–3 hto at least 20�C higher than the maximum temperature used during the analysis. Thisensures that strongly retained contaminations leave the column.
Another critical feature of GC analysis is sample injection. A schematic diagramof a typical GC injector is shown in Fig. 5.
Expansion space
Split line
Purge line
Quartz linerCarrier gas
Inlet end of thecapillary column
Septum
Fig. 5. Schematic diagram a typical GC injector.

76 K. Nagy and K. Vékey
The main role of the injector is to evaporate the sample completely and to getit to the front of the column. The temperature of the GC injector is crucial. It mustbe high enough to allow complete evaporation of the sample (200–350�C), butlow enough to minimize thermal degradation. Usually it should be 20–40�Chigher than the maximum column temperature used. The injector is connected tothe carrier gas source and to the inlet end of the capillary column. It also has athird connection to a waste line, which serves for purging the injector. All meas-urements begin with injection of the liquid (occasionally gas) sample into theexpansion space of the injector. First, the sample is drawn into the syringe andthe septum of the injector is pierced with the sharp needle of the syringe. Thesample is then injected into the expansion space of the injector and the syringe iswithdrawn. The speed and accuracy of this process have key importance in GC.Note that there is pressure inside the injector, so one must always keep safe theplunger of the syringe from being expelled. The injector is kept at a hightemperature in order to aid quick evaporation of the sample. After evaporationthe sample is carried by the carrier gas onto the capillary column. Capillarycolumns have low sample capacity, while the minimal sample volume that canbe reliably measured is around 1 �l. This sample amount would typically over-load the column. Two basic approaches are used in GC to overcome this problem.One is the so-called split injection [29]. In this case only a small fraction of theevaporated sample is carried onto the column, most of it is carried out into thewaste by the split line.
Another technique is the so-called splitless or combined split/splitless injection[29]. In this case the split line is first closed. After the desired amount of sampleis loaded onto the column, the split line opens (typically 10–100 s after injectionand evaporation of the sample) and the remaining (superfluous) sample is purgedfrom the injector.
Special injectors may also be used, such as the temperature-programmed injec-tor [29]. The main goal of this case is to use the injector to enrich analytes priorto carrying them onto the column. In this case a cold (�40 to �40�C) injector isused. An inert gas flow purges the low-boiling-point solvent from the expansionspace while the high-boiling-point analytes remain condensed inside the injector.After removal of the solvent, the purge line is closed and the injector is rapidlyheated. At this phase target analytes evaporate and are carried onto the column.Using this technique large sample amounts can be injected into the system and thesignal-to-noise ratio can be improved.
A practical difficulty in GC is that the nonvolatile fraction of any sample (com-mon in biological matrices) remains precipitated on the wall of the injector or in thebeginning of the column. These may accumulate, decompose, and may even catalyzedecomposition of analytes, deteriorating the performance of the analysis. To avoidthese problems, the injector needs to be cleaned frequently, and the front end of thecapillary column (0.5 m or so) needs to be cut off occasionally and discarded.

Separation methods 77
The output end of the GC column is connected to a detector such as FID, ECD,or mass spectrometer. Gas chromatography–mass spectrometry (GC–MS) is avery efficient analytical tool and also quite straightforward to use. To indicatesimplicity in some GC–MS systems the mass spectrometer is also termed “massselective detector.” Coupling GC with MS usually does not deteriorate GC sepa-ration; the gas effluent of the GC can be introduced directly into the ion source ofthe mass spectrometer.
In summary, the most important parameters to keep in mind while planning GCexperiments are the temperature program of the separation, the stationary phase ofthe column, the temperature of the injector, and the properly selected detectionsystem. Typical applications of GC in the biomedical field include the determina-tion of low-molecular-weight compounds in body fluids, such as amino acid andfatty acid profiling of blood, or organic acid profiling of urine.
3. High-performance liquid chromatography
LC is a separation technique where the applied mobile phase is a liquid, while thestationary phase may be either solid or liquid. The technique is used mainly to sep-arate nonvolatile compounds. In its original version, a fairly large (about 1 m long,few centimeters wide) vertical column is packed with the stationary phase. Thesolution is introduced onto the top of the column and gravitation forces the liquidto pass through the column. This version (also called column chromatography) isoften used for the separation of relatively large quantity of compounds (in therange of 100 mg). A modified version of column chromatography is flash chro-matography, where the liquid flow through the column is assisted by a vacuummanifold or a vacuum pump. For analytical purposes, column and flash chromato-graphy are not considered efficient and are superseded by HPLC.
In the case of HPLC [2,30,31] the liquid sample is driven through a packed tube(column) by liquid flow at high pressure (typically 50–400 bar) provided bymechanical pumps. Various components of the sample reach the end of the columnat different times and are detected most often by UV–VIS spectrometry (whichmeasures the absorbance of the effluent in the wavelength range �200–600 nm)or by MS. The chromatogram is obtained by plotting the signal intensity vs. time.The sequence of the components reaching the detector strongly depends on themolecular structure of the analytes, the composition of the mobile phase, andcolumn packing (stationary phase).
The majority of current applications use stationary phases [32] made of poroussilica, aluminum oxide, or polymer particles. Solid-phase particles need to havesmall particle size (3–5 �m are commonly used) and a well-defined pore diameter.The most commonly used silica phases have good mechanical stability (i.e., can beused at least up to 400 bar pressure) but have low pH tolerance (so can be used only
78 K. Nagy and K. Vékey
between pH 2 and 7–8) [33]. Polymer-based phases can be used up to pH 12, butthese have a lower mechanical stability and can be used only up to 50–100 barpressure. Metal-based stationary phases (zirconium, aluminum) overcome both ofthese limitations, i.e., they have both good mechanical stability and are stable in awide pH (1–14) range and up to 200�C temperature, but they exhibit undesired elec-trostatic interactions which may complicate development of a separation method.
Mobile phases can be selected from a wide range of solvents including water,methanol, acetonitrile, isopropanol, acetone, n-hexane, etc. The main parametersfor selecting the mobile phase are the following: polarity (which defines the elu-ent strength, see the following text), miscibility, low viscosity, high boiling point,low UV light absorbance (if used with UV detection), and low toxicity.
In HPLC, the sample is dissolved in a solvent (preferably same as the HPLCmobile phase) and injected onto the column. Attention must be paid to avoid pre-cipitation of the injected sample and blockage of the column. The HPLC columnis usually a 3–25 cm long metal tube of 1–5 mm diameter. Conventionally 4.6 mmcolumns are used in HPLC, with a flow rate of about 1 ml/min. Nowadays nar-rower columns (1 and 2 mm) are becoming very popular, especially combinedwith MS (using much less, 50–200 �l/min solvent flow). Micro- and nano-HPLCis also gaining ground (e.g., using 75 �m diameter quartz tubes and �200 nl/minsolvent rate), especially in the field of proteomics [34]. Note that narrow columnsrequire very small amounts of sample (approximately proportional to the internalvolume of the column), and thus require very sensitive detectors.
HPLC columns are packed with the stationary phase, which retains the samplemolecules. Retention of compounds depends on not only various factors predom-inant on molecular properties but also particle size, pore size, homogeneity of thestationary phase, viscosity and polarity of the mobile phase, etc. These effects aresummarized in the van Deemter equation [14] (Equation (6), analogous to theGolay equation used in GC), which describes peak broadening in LC:
(6)
Here H is the theoretical plate height, a parameter that characterizes the effective-ness of the chromatographic separation. The smaller the H the more powerful is theseparation. A is the Eddy diffusion term (or multipath term), B relates to longitudi-nal diffusion, C represents the resistance of sorption processes (or kinetic term), andu is the linear flow rate. For a given chromatographic system, A, B, and C are con-stants, so the relationship between H and u can be plotted as shown in Fig. 6.
The theoretical plate height curve has a minimum that corresponds to the optimalflow rate. The minimal theoretical plate height is influenced by the average particlesize of the stationary phase. The smaller the average particle size the smaller the Hand the better the resolution is [35,36]. Current technologies can provide columns
HBu
Cu � �A

Separation methods 79
with a particle size down to 1.5 �m in diameter. High porosity (which correlateswith high surface area and small pore diameter) of the particles is also important toachieve maximum selectivity. However, if the pore size is too small then target mol-ecules cannot penetrate into the pores, deteriorating column performance. This isespecially important if macromolecules are studied. Optimal pore size is therefore acompromise; usually the 10–100 nm range is considered best.
The third term of the van Deemter equation includes diffusion of analyte mole-cules into and out of the pores of the particles. To obtain minimal peak broadening,diffusion needs to be fast. The diffusion rate correlates with the viscosity; thus inHPLC low-viscosity solvents are preferred. Diffusion also depends on temperature;thus, maintaining the column at high temperature by using a column thermostat isoften advantageous. However, it must be kept in mind that the temperature range ofstationary phases is limited and that at high temperature longitudinal diffusion maybecome dominant, also leading to peak broadening. At high temperature, the vaporpressure of solvents increases further limiting the usable temperature range. Inpractice, column temperature up to 50–60�C is used.
Solvent strength is defined as the capability of the solvent to elute a given com-pound from the stationary phase. The stronger the solvent the quicker it can elutethe analyte from the column. Elution of analytes in HPLC can be performed by twobasic approaches, namely by isocratic or gradient elution. In the case of isocraticelution the same solvent mixture is used during elution, while in gradient elutionthe composition of the mobile phase is systematically changed, so that the solventstrength is increased. Isocratic and gradient elution techniques in HPLC are anal-ogous to isotherm and temperature programming methods in GC. Isocratic elutionhas the advantage of simplicity and it is better suited for high-throughput applica-tions. Its main disadvantage is that it cannot cope with widely different analytes. Ifweakly and strongly binding analytes are studied together then either the resolu-tion will be unacceptably low at the beginning of the chromatogram, or stronglybinding components will not be eluted. Gradient elution is the method of choicefor separating widely different compounds. It requires better quality and more
Optimal flow rate for the minimal theoretical plate height
H
u [cm/s]
Fig. 6. Schematic representation of a van Deemter curve.

80 K. Nagy and K. Vékey
expensive instrumentation than isocratic elution and in this case the column mustbe equilibrated with the initial solvent composition after each analysis (before anew sample can be injected), which increases analysis time. The main advantageof gradient elution is that at the beginning of the experiment a low solvent strengthmobile phase is used; thus, analytes that bind weakly to the column can beresolved. Subsequently the solvent strength is increased gradually and compoundsthat bind strongly to the column are resolved and eluted too. Gradient elution there-fore can deal with complex mixtures; the shape of the gradient can be optimized toachieve good resolution of all compounds while maintaining acceptable analysistime [37]. Today, gradient elution techniques are more and more widespread andthey are becoming indispensable to deal with complex mixtures such as biologicalextracts.
Several detector types can be used for HPLC, such as UV–VIS absorbancedetection (either operating at a given wavelength or using a diode array to detectthe whole spectrum), fluorimetric detection, refractive index detection, evapora-tive light scattering detection, or mass spectrometric detection (HPLC–MS).Among these methods mass spectrometric detection is probably most selectiveand is rapidly gaining ground. There are several MS techniques compatible withHPLC, such as ESI, nanospray, and APCI.
In addition to the solvent, additives are often used in HPLC in low amounts(0.01–1%) to optimize performance and minimize undesired side effects, such aspeak broadening. One of the prime factors determining retention is the chargestate of the analyte that strongly depends on the pH. For this reason buffers(traditionally potassium phosphate buffers) are typically used to adjust the pHaccurately. Note that in the case of HPLC–MS, nonvolatiles cannot be used, sotypically ammonium acetate or formate buffer is preferred. Various other addi-tives may also be used, such as trimethyl amine or trifluoroacetic acid, to sup-press the interaction of analytes with the residual silanol groups of the stationaryphase, thereby improving the resolution.
In summary, the most important parameters in designing and optimizing HPLCare the solvent system and the gradient program. The type of the applied column(packing type and particle size of the stationary phase, length, and diameter of thecolumn), the flow rate, and column temperature are also significant. Overallperformance of HPLC depends on several factors and cannot be optimized by con-sidering one parameter only. Below the most common versions, normal and reverse-phase HPLC, ion exchange, and size exclusion chromatography are discussed.
3.1. Normal-phase liquid chromatography
Normal-phase liquid chromatography (NP-HPLC), as the name implies, is the orig-inal version of HPLC. Nowadays it is not often used, only when results obtained withreverse-phase LC prove unsatisfactory. It is discussed first for didactic reasons.

Separation methods 81
In NP-HPLC the stationary phase is more polar than the mobile phase and theinteraction between analyte and column has predominantly polar character(hydrogen bonding, �–� or dipole–dipole interactions, etc.). The most commonlyused NP stationary phase is silica gel ([SiO2]x � [H2O]y). After column preparationthe surface of silica gel consists mainly of hydroxyl groups bound to silica atomsas shown in Fig. 7.
These hydroxyl groups are often called silanol groups. These predominantlybind analytes by polar interactions. Other stationary phases are also used, such asaluminum oxide or chemically modified silica gel. In the latter case usually amino,diol, nitro, or cyano group containing chemicals are reacted with the free silanolgroups to modify their binding properties.
Mobile phases in NP-HPLC are mostly apolar solvents (or solvent mixtures) suchas n-hexane, n-heptane, dichloromethane, dichloroethane, diethyl ether, methylacetate, ethyl acetate, acetone, isopropanol, ethanol, or methanol. In NP-HLPC morepolar solvents represent higher solvent strength and these elute compounds fasterfrom the column. The typical order of solvent strength is hydrocarbons � ethers �esters � alcohols � acids � amines (going from weak to strong).
The biggest problem in using NP-HPLC is its dramatic sensitivity to water. Evenwater traces (in the mobile phase or from the sample) may bind to the column, dete-riorate its performance, and cause irreproducibility. In addition, particular caremust be taken to ensure accurate pH, as in NP-HPLC, retention is very sensitive tothe charge state of the analyte. Owing to these practical problems NP-HPLC is rel-atively rarely used. Its main application fields are separation of polyaromatichydrocarbons, sterols, vitamins, chlorophylls, ceramides, and other lipid extracts.
3.2. Reverse-phase liquid chromatography
Reverse-phase liquid chromatography (RP-HPLC) is the most important and mostwidely applied version of LC. It is well suited to separate both apolar and polarcompounds, but less well suited for studying permanently ionized molecules. It iseasy to couple with MS.
Mob
ile p
hase
OH
OH
OH
O
Si
Si
O
OS
tatio
nary
pha
se(S
ilica
par
ticle
)Fig. 7. Molecular properties of a typical NP stationary phase.

82 K. Nagy and K. Vékey
In RP-HPLC the stationary phase is less polar than the mobile phase and theinteraction between analyte and the stationary phase has a predominantlyhydrophobic (apolar) character. The most commonly used stationary phase in RP-HPLC is silica gel in which octadecyl silica chains are covalently bound to the freehydroxyl groups, indicated as a C18 phase. The typical surface of such a phase isshown in Fig. 8.
Other commonly used stationary phases are silica gels modified using octyl(indicated, e.g., as a C8 phase), hexyl, butyl, or ethyl groups. Occasionally organicpolymer-based phases are also used. Modified silica gels may be used up to sev-eral hundred bars pressure and across a pH range of 2–8.5. Care must be taken toselect the right pH, as the chemically bound groups begin to hydrolyze at pHbelow 2 and the silica gel begins to dissolve at pH higher than 8–9 [38]. Retentionof compounds occurs by apolar interaction between the analyte and the immobi-lized octadecyl silica chain. Most compounds exhibit hydrophobic character tosome extent and thus they can be analyzed by RP-HPLC. Even strongly polar orionic substances can be analyzed by RP-HPLC if the pH is adjusted so that theanalyte will be in neutral form. Such an example is RP-HPLC separation of basicamphetamines at pH 8.5 [39].
The surface of C18 phases always contains unreacted silanol groups, whichmay form secondary polar interactions with the analyte. This is generally disad-vantageous in RP-HPLC as it often causes peak broadening [33,40]. An importantimprovement is the introduction of the so-called end-capping procedure: Theresidual silanol groups in the C18 phase are reacted with monofunctional chlorosi-lane, which decreases surface polarity. This very popular stationary phase is calledC18ec, where the notation “ec” stands for end-capped.
Mobile phases in RP-HPLC are mostly polar solvents such as water, acetoni-trile, methanol, and isopropanol. In RP-HPLC apolar solvents have high solventstrength. Accordingly, the order of solvent strength is water � acetonitrile �ethanol � acetone (from weak to strong). The most commonly used solvent mix-ture is a water–acetonitrile gradient, in which the amount of acetonitrile isincreased during a chromatographic run to elute first the polar components andthen the more strongly bound apolar compounds. Mixtures containing a wide
O
O
CH3
CH3
C18H37Si
Si
Si
OH
O
O
Sta
tiona
ry p
hase
(Sili
ca p
artic
le)
Mob
ile p
hase
Fig. 8. Molecular properties of a typical RP stationary phase.

Separation methods 83
range of compounds may be studied by a fast gradient starting from high watercontent (e.g., 90%) and ending at high (usually 100%) acetonitrile content.
RP-HPLC is widely applicable, although pH control must often be applied. Mostimportant application areas include peptide and protein analysis (proteomics),drugs and their metabolites, fatty acids, and also volatile compounds such asaldehydes and ketones, although these require derivatization.
3.3. Ion-exchange liquid chromatography
Ion-exchange liquid chromatography (IE-LC) is not very common, but it isgaining importance [41–43]. It separates ionized compounds, which excellentlycomplements RP-HPLC. In ion-exchange chromatography separation of differentcompounds is achieved by using ion–ion interactions between the analyte and thestationary phase. To ensure that this interaction is dominant, the surface of the sta-tionary phase must contain either permanently or temporarily ionized groups andof course the sample must be in ionized form. Most commonly used stationaryphases in IE-LC are chemically modified silica gels containing immobilizedanionic or cationic groups. These groups are most commonly primary, secondary,quaternary amine, and carboxyl or sulfonyl groups. The retention of acidic com-pounds occurs with anion-exchange phases (immobilized amines), while theretention of basic compounds occurs with cation-exchange phases (immobilizedacids). In performing IE-LC particular care must be paid to ensure the adequatepH, as retention is very sensitive to the charge state of the analyte. The surface ofa typical anion-exchange stationary phase is shown in Fig. 9.
Here the surface of silica gel is modified by the introduction of quaternaryamine groups. These groups are permanently positively charged; thus, they attractnegatively charged analytes (anions).
The applied mobile phases in IE-LC are mostly solvents with acid, base, orbuffer content. The strength of the mobile phase can be influenced either bychanging the pH to shift the ionization state of the analyte or by displacing the ana-lyte with solvent additives (e.g., displace a fatty acid from the cationic stationaryphase by adding 1–2% of acetic acid to the mobile phase).
Fig. 9. Molecular properties of a typical anion-exchange stationary phase.

84 K. Nagy and K. Vékey
IE-LC is suitable for the separation of either permanently or temporarily ion-ized compounds. Typical application areas are separation of amino acids (e.g.,amino acid analyzers) or separation of enzymatically digested protein fragmentsprior to reverse-phase separation. The complementary features of IE and RP chro-matography can be excellently utilized in 2D chromatography (see the followingtext), which is gaining importance for protein analysis.
3.4. Size exclusion chromatography (gel filtration)
Size exclusion chromatography is a method where separation of different com-pounds occurs according to their size (hydrodynamic volume) measured by howefficiently they penetrate the pores of the stationary phase [44,45]. Size exclusionchromatography has two basic versions. When performed using organic solvents,it is called gel permeation chromatography (GPC). The main application field ofGPC is polymer analysis. When size exclusion chromatography is performedusing aqueous solvents, it is called gel filtration. A typical example of gel filtra-tion is desalting of proteins. In this case the protein–salt mixture is applied ontothe column. The inorganic salt ions have small size; they penetrate the small porespresent in the stationary phase and therefore will be retained on the column. Incontrast, large protein molecules cannot enter the very small pores and so will beeluted by the solvent flow with minimal retention. As a consequence, the proteinswill first elute from the column while the salt will be retained.
3.5. 2D liquid chromatography
In 2D chromatography [46], two different chromatographic columns are connectedin sequence, and the effluent from the first system is transferred onto the second col-umn. Application of 2D LC is suggested when very complex mixtures have to beseparated. In a typical HPLC experiment, the average peak width is 30 s while thechromatogram is about 1 h long, so at most 120 compounds can be separated. Thispeak capacity can be substantially improved when the effluent of the first column iscollected in fractions and is further analyzed by a separate chromatographic run,usually based on a different separation mechanism. This can be implemented in bothoffline and online modes. A typical online experiment for 2D HPLC is used for pro-teomics applications [46], where a complex mixture of digested proteins has to beanalyzed (often thousands of peptides are present in the sample). The digested sam-ple is first injected onto a cation-exchange column, as the commonly used trypsinyields basic peptides. First, the neutral peptides elute from the column, and these arewashed onto the next, very short octadecyl silica column. This column binds (andtherefore concentrates) the first fraction of peptides. After changing the solventcomposition (switching to a different solvent mixture) the peptide fraction is washedonto a longer, analytical octadecyl silica column, where the peptides are separatedon the basis of their polarity (a typical RP-HPLC application). In the next step the

Separation methods 85
cation-exchange column is washed with an eluent containing low salt concentration,which elutes the weakly retained peptides. These are trapped, washed, and analyzedon the octadecyl silica column similarly to the first fraction. In repeated steps thecation-exchange column is washed with eluents of higher and higher salt content andthus peptides with higher and higher basicity are eluted from the column. These frac-tions are trapped and analyzed on the C18 column as described earlier. In summary,the peptides are fractioned according to their basicity on the first column (firstdimension) and the obtained fractions are further separated on the basis of their apo-lar character on the second column (second dimension). This protocol reduces coelu-tion and thus enhances the confidence of identification for unknown proteins.
4. Electrophoretic techniques
Electrophoretic techniques are well suited to separate charged compounds.Separation is due to migration induced by high voltage and takes place either in abuffer solution or in the pores of a gel filled with buffer solution. Several elec-trophoretic techniques are used; here only the most important ones will bediscussed. Most of these methods are used for analysis, but some (such as 2D gels)also for isolating macromolecules for further studies. Electrophoretic techniquesare particularly important for studying macromolecules, especially proteins.
4.1. Capillary zone electrophoresis
Capillary zone electrophoresis [9,10,47–54] (CZE) is a separation techniquewhere components of the sample are separated using 10–30 kV potential differ-ence between the two ends of a 50–100 �m diameter capillary filled with a buffersolution. The basic instrumental setup is demonstrated in Fig. 10.
The capillary column is immersed into two buffer-filled reservoirs. High volt-age is applied to these reservoirs via platinum electrodes. The sample is stored in
Capillary column
Pt electrode Pt electrode
Sam
ple
rese
rvoi
r
Buf
fer
rese
rvoi
r
Buf
fer
rese
rvoi
r
Fig. 10. Schematic representation of a capillary electrophoresis system.

86 K. Nagy and K. Vékey
a separate reservoir and can be injected into the capillary by various techniquessuch as a hydrodynamic or electrokinetic impulse. The injected sample volume isin the low nanoliter range.
Separation of components occurs by the simultaneous effect of the electrophoreticand electro-osmotic forces that develop inside the capillary. Electrophoretic force(and flow) is a result of the applied potential difference (high voltage) between twoends of the capillary. It attracts the positively charged ions towards the cathode(negative end) and negatively charged ions towards the anode (positive end).Electro-osmotic force is a result of the electrical double layer, which develops onthe wall of the capillary and induces a flow by its motion towards the cathode. CZEprovides unusually high resolution since several peak-broadening effects present intraditional HPLC are absent. The only significant peak-broadening effect in CZE islongitudinal diffusion along the column. Resolution is determined by the appliedhigh voltage and the electrophoretic mobility of the ions. The applied flow rates inCZE are in the nanoliter range; thus, this separation technique can be coupled withnanospray MS.
4.2. Capillary gel electrophoresis
Capillary gel electrophoresis [55,56] (CGE) is very similar to CZE. The maindifference is that in CGE the column is packed with a gel, which affects themotion of the analytes. Accordingly, separation will be determined not only bythe electrophoretic force acting on the ions but also by the size of analyte mole-cules. The effect of the gel present inside the column has a similar effect to sizeexclusion chromatography (see earlier). A typical application is the separation ofproteins in a capillary which is filled with polyacrylamide gel and sodiumdodecyl sulfate (SDS). The presence of SDS aids the electrophoretic mobility ofproteins, as it coats their surface proportional to their size. Consequently, themolecular structure will have little influence on mobility, so macromoleculeswill migrate according to their molecular mass. This technique is very similar toSDS-PAGE.
4.3. Capillary isoelectric focusing
Capillary isoelectric [54,57,58] focusing is closely related to the techniques dis-cussed above, but separates compounds based on their isoelectric point. Separationoccurs in a capillary, which is internally polymer-coated to eliminate the electro-osmotic flow. The cathode end of the capillary column is immersed into a base andthe anode end into an acid. This results in the formation of a pH gradient along thecolumn. Similarly to capillary electrophoresis, positively charged ions migratetowards the cathode and negatively charged ions migrate towards the anode. Thepredominant effect in this case is the pH dependence of the charge state of the

Separation methods 87
analyte. A positively charged compound will migrate in the capillary columntowards the cathode, but during this migration it arrives into an increasingly basicenvironment. At the position where the pH is equal to the isoelectric point of thecompound, the net charge on the analyte becomes zero (this is, in fact, the defini-tion of the isoelectric point) and the compound stops migrating. This way eachcompound is concentrated at the pH value that is the same as its isoelectric point.The separated zones can be displaced from the capillary by either a hydrodynamicor an electrokinetic impulse and measured as a chromatogram.
4.4. Sodium dodecyl sulfate polyacrylamide gel electrophoresis
An especially important technique in proteomics is sodium dodecyl sulfate poly-acrylamide gel electrophoresis (SDS-PAGE) [59,60]. This method can separatehigh-molecular-mass proteins or glycoproteins (up to several hundred kilodal-tons). Just like in other electrophoretic methods, the separation of the analytesoccurs by migration induced by a high potential difference. In this case an anionicdetergent (SDS) is used to aid solubility, denaturation, and charging of proteins.SDS wraps around the peptide backbone of proteins and confers multiple negativecharges to the protein. The amount of bound SDS is proportional to the size of theprotein; thus, the net charge and therefore the migration of the protein will be pro-portional to its size and molecular weight. Separation is often implemented on avertically positioned gel strip, so the separated proteins form horizontal bands onthe gel. To visually observe the protein bands the gel is stained [61] typically usingCoomassie blue or copper chloride chemicals. After the separation the individualbands in the gel are often cut out for further analysis (usually by MS), i.e., theSDS-PAGE can be used for small-scale preparative purposes as well.
4.5. 2D gel electrophoresis
2D gel electrophoresis [59,60,62–65] is performed on a plate by the combinationof isoelectric focusing in 1D, and SDS gel electrophoresis in the other direction.The separation is based on two different, unrelated (orthogonal) phenomena, andprovides exceptionally high resolution. The separated compounds (mostly pro-teins) form spots on the plate, which may be cut out for further studies. Althoughit requires very careful work and large experience, 2D gels are very powerful andare capable of resolving over a 1000 spots in a plate. 2D gel electrophoresis hasbecome one of the most important and widely used techniques in the field ofproteomics.
In practice, 2D gel electrophoresis is implemented mostly on porous agarose orpolyacrylamide gel in the form of a homogenous, flat, square-shaped layer. In a2D gel experiment, the sample is first separated by applying isoelectric focusingon a strip (first dimension). Then, this strip is attached to a gel plate and further

88 K. Nagy and K. Vékey
separation is performed by SDS gel electrophoresis (second dimension). Althoughseparation by electrophoretic mobility in a gel is very similar to capillary gelelectrophoresis, isoelectric focusing in a gel is somewhat more complex.Isoelectric focusing in a flat gel is achieved by applying pH gradient along oneedge of the surface. The pH gradient can be formed either by applying the so-called ampholyte chemicals or by using a gel that consists of prefabricated gelstrips with immobilized buffer on the surface. To reduce secondary effects (hydro-gen bonds and hydrophobic interactions between the analytes and the gel)additional chemicals (such as urea or thiourea) are often used. The separatedcompounds are stained for visualization using various methods such as Coomassieblue staining or copper chloride chemicals. Developed 2D plates are typicallyscanned and then analyzed by advanced computerized techniques, identifyingthose spots that change (are overexpressed or underexpressed) between two dif-ferent samples. These spots are typically cut out (manually or robotically) and therespective proteins are identified by MS.
5. Future trends
The most important role of chromatographic techniques is that they ensure the nec-essary selectivity and chemical purity prior to detection. Although there have beendramatic improvements in detection systems, it is still very important to boost theperformance of separation methods. Better separation often means lower detectionlimits, better quantitation, and more confident identification of unknowns. As mostcompounds in biological systems are nonvolatile, LC-based techniques dominateover GC in the biomedical field.
We see three major aspects for future developments in chromatography. Onerelates to improving analytical performance: to lower detection limits, toincrease selectivity, to be able to analyze less sample, etc. To achieve this, man-ufacturers are constantly modifying their instruments, new chromatographiccolumns become available, and especially pure solvents are used. For example,ultra performance liquid chromatography (UPLC) [35,36] uses very small parti-cle size (approximately 1.5 �m). This results in narrower peaks but needs unusu-ally high pressure (up to �1000 bar). Significant improvements are emerging inthe field of GC as well. Application of time-of-flight MS for detection providesacquisition rates at hundreds of spectra per second, which opens up new possi-bilities for ultra-fast GC. Using this technique chromatograms take only a fewminutes, and peak widths are less than a second [66,67]. Such improvements willappear in the future, but a major breakthrough is not expected. A different optionto improve performance is the online combination of techniques—this is capableof achieving stunning results. To enhance selectivity different chromatographic

Separation methods 89
techniques are often combined in order to separate those compounds that wouldcoelute by applying merely one technique. These multidimensional techniquesare already often used [46], but they will spread even more as they becomeavailable as standard components of HPLC systems. Simple HPLC–MScombinations are already considered routine. More complex combinations, suchas 2D HPLC combined with high-resolution tandem MS, are also likely tobecome more common.
The second trend to watch is miniaturization. This is advantageous not onlybecause sample amount is often limited but also because performance may beimproved, and running costs can be reduced (e.g., by using less chemicals). Smallsize also means that more equipment can be put into the (often-limited) laboratoryspace. The main limitation of miniaturization is sensitivity. In this respect MS, dueto its sensitivity, is also invaluable. Luckily an important mass spectrometric tech-nique, nanospray ionization, is ideally suited for coupling to nano-HPLC [34](requires nl/min flow rates). This reduces sample requirement, and also facilitatescoupling MS with electrophoretic techniques.
The third and possibly the most important trend is high throughput andautomatization/robotization. The prerequisite is very robust methodology, which isbecoming available. Most high-quality instruments are capable of automatic oper-ation; this will become increasingly widespread. This can reduce labor costs andmay make individual-based medication and population-wide medical screeningpossible.
References
1. Armstrong, D.W. and Boehm, R.E., Gradient Lc Separation of Macromolecules—Theory andMechanism. J. Chromatogr. Sci., 22, 378–385 (1984).
2. Bird, I.M., High-Performance Liquid-Chromatography—Principles and Clinical-Applications.Br. Med. J., 299, 783–787 (1989).
3. Celis, J.E. and Gromov, P., 2D protein electrophoresis: can it be perfected? Curr. Opin.Biotechnol., 10, 16–21 (1999).
4. Dolan, J.W., Temperature selectivity in reversed-phase high performance liquid chromatography.J. Chromatogr. A, 965, 195–205 (2002).
5. Eiceman, G.A., Hill, H.H. Jr. and Gardea-Torresdey, J., Gas chromatography. Anal. Chem., 70,321R–339R (1998).
6. Ettre, L.S., Headspace-gas chromatography—An ideal technique for sampling volatiles presentin non-volatile matrices, in Headspace Analysis of Foods and Flavors. Adv. Exp. Med. Biol.,488, 9–32 (2001).
7. Fey, S.J. and Larsen, P.M., 2D or not 2D. Curr. Opin. Chem. Biol., 5, 26–33 (2001).8. Jiskra, J., Claessens, H.A., Cramers, C.A. and Kaliszan, R., Quantitative structure-retention
relationships in comparative studies of behavior of stationary phases under high-performanceliquid chromatography and capillary electrochromatography conditions. J. Chromatogr. A,977, 193–206 (2002).
9. Robert, F., Bouilloux, J.P. and Denoroy, L., Capillary Electrophoresis—Theory and Applications.Ann. Biol. Clin. (Paris), 49, 137–148 (1991).

90 K. Nagy and K. Vékey
10. Tagliaro, F., Turrina, S. and Smith, F.P., Capillary electrophoresis: Principles and applicationsin illicit drug analysis. Forensic Sci. Int., 77, 211–229 (1996).
11. Barth, H.G., Boyes, B.E. and Jackson, C., Size-Exclusion Chromatography. Anal. Chem., 66,595R–620R (1994).
12. Gotmar, G., Fornstedt, T. and Guiochon, G., Peak tailing and mass transfer kinetics in linearchromatography—Dependence on the column length and the linear velocity of the mobilephase. J. Chromatogr. A, 831, 17–35 (1999).
13. Papai, Z. and Pap, T.L., Analysis of peak asymmetry in chromatography. J. Chromatogr. A,953, 31–38 (2002).
14. Piatkowski, W., Gritti, F., Kaczmarski, K. and Guiochon, G., Influence of the particle porosityon chromatographic band profiles. J. Chromatogr. A, 989, 207–219 (2003).
15. McCalley, D.V., Comparison of peak shapes obtained with volatile (mass spectrometry-compatible) buffers and conventional buffers in reversed-phase high-performance liquid chro-matography of bases on particulate and monolithic columns. J. Chromatogr. A, 987, 17–28(2003).
16. Krouse, S.O., Analytical method validation for biopharmaceuticals—A practical guide.Biopharm. Int., l, 26 (2005).
17. Swartz, M. and Krull, I., Analytical method validation: Accuracy in quantitation. LC–GC, 23,46 (2005).
18. Taverniers, I., De Loose, M. and Van Bockstaele, E., Trends in quality in the analytical labo-ratory. II. Analytical method validation and quality assurance. Trends Anal. Chem., 23,535–552 (2004).
19. Golay, M.J.E., In: Desty, D.H. (Ed.), Gas Chromatography. Butterworths, London, 1958.20. Ettre, L.S. and Hinshaw, J.V., Basic Relationships of Gas Chromatography. Advanstar,
Cleveland, 1993.21. Karasek, F.W. and Clement, R.E., Basic Gas Chromatography—Mass Spectrometry Principles
and Techniques. Elsevier, Amsterdam, 1988.22. Bartle, K.D. and Myers, P., History of gas chromatography. Trends Anal. Chem., 21, 547–557
(2002).23. Grant, D.W., Capillary Gas Chromatography. Wiley, Chichester, 1996.24. Eiceman, G.A., Gardea-Torresdey, J., Overton, E., Carney, K. and Dorman, F., Gas chro-
matography. Anal. Chem.,76, 3387–3394 (2004).25. Zaikin, V.G. and Halket, J.M., Derivatization in mass spectrometry—2. Acylation. Eur. J. Mass
Spectrom., 9, 421–434 (2003).26. Halket, J.M. and Zaikin, V.G., Derivatization in mass spectrometry—1. Silylation. Eur. J. Mass
Spectrom., 9, 1–21 (2003).27. Halket, J.M. and Zaikin, V.G., Derivatization in mass spectrometry—3. Alkylation (arylation).
Eur. J. Mass Spectrom., 10, 1–19 (2004).28. Halket, J.M. and Zaikin, V.G., Derivatization in mass spectrometry—5. Specific derivatization
of monofunctional compounds. Eur. J. Mass Spectrom., 11, 127–160 (2005).29. Bailey, R., Injectors for capillary gas chromatography and their application to environmental
analysis. J. Environ. Monit., 7, 1054–1058 (2005).30. Lindsay, S., High Performance Liquid Chromatography. Wiley, Chichester, 1992.31. Katz, E.D., High Performance Liquid Chromatography Principles and Methods in
Biotechnology. Wiley, Chichester, 1996.32. Majors, R.E., A review of HPLC column packing technology. Am. Lab., 35, 46 (2003).33. Espada, A. and Rivera-Sagredo, A., Ammonium hydrogencarbonate, an excellent buffer for
the analysis of basic drugs by liquid chromatography-mass spectrometry at high pH.J. Chromatogr. A, 987, 211–220 (2003).
Separation methods 91
34. Ishihama, Y., Proteomic LC-MS systems using nanoscale liquid chromatography with tandemmass spectrometry. J. Chromatogr. A, 1067, 73–83 (2005).
35. Swartz, M.E., Ultra performance liquid chromatography (UPLC): An introduction. LC–GC,23, 8–14 (2005).
36. Swartz, M.E., UPLC (TM): An introduction and review. J. Liq. Chromatogr. Rel. Technol., 28,1253–1263 (2005).
37. Snyder, L.R., Chromatogr. Rev., 7, 1 (1965).38. Claessens, H.A. and van Straten, M.A., Review on the chemical and thermal stability of sta-
tionary phases for reversed-phase liquid chromatography. J Chromatogr. A, 1060, 23–41(2004).
39. Pichini, S., Pacifici, R., Pellegrini, M., Marchei, E., Lozano, J., Murillo, J., Vall, O. andGarcia-Algar, O., Development and validation of a high-performance liquid chromatography—Mass spectrometry assay for determination of amphetamine, methamphetamine, and methyl-enedioxy derivatives in meconium. Anal. Chem., 76, 2124–2132 (2004).
40. Nawrocki, J., The silanol group and its role in liquid chromatography. J. Chromatogr. A, 779,29–71 (1997).
41. Crimmins, D.L., Applications of strong cation-exchange (SCX)-HPLC in synthetic peptideanalysis. Methods Mol. Biol., 36, 53–64 (1994).
42. Bahr-Lindstrom, H., Moberg, U., Sjodahl, J. and Jornvall, H., Ion-Exchange High-PerformanceLiquid-Chromatography Steps in Peptide Purifications. Biosci. Rep., 2, 803–811 (1982).
43. Edelson, E.H., Lawless, J.G., Wehr, C.T. and Abbott, S.R., Ion-Exchange Separation ofNucleic-Acid Constituents by High-Performance Liquid-Chromatography. J. Chromatogr.,174, 409–419 (1979).
44. Kostanski, L.K., Keller, D.M. and Hamielec, A.E., Size-exclusion chromatography—a reviewof calibration methodologies. J. Biochem. Biophys. Meth., 58, 159–186 (2004).
45. Irvine, G.B., High-performance size-exclusion chromatography of peptides. J. Biochem.Biophys. Meth., 56, 233–242 (2003).
46. Liu, H.B., Lin, D.Y. and Yates, J.R., Multidimensional separations for protein/peptide analy-sis in the post-genomic era. Biotechniques, 32, 898 (2002).
47. Watzig, H. and Gunter, S., Capillary electrophoresis—A high performance analytical separa-tion technique. Clin. Chem. Lab. Med., 41, 724–738 (2003).
48. Kasicka, V., Recent advances in capillary electrophoresis of peptides. Electrophoresis, 22,4139–4162 (2001).
49. Li, S.F., Capillary Electrophoresis. Elsevier, Amsterdam, 1992.50. Grossman, P.D. and Colburn, J.C., Capillary Electrophoresis Theory and Practice. Academic
Press, San Diego, 1992.51. Petersen, J.R., Okorodudu, A.O., Mohammad, A. and Payne, D.A., Capillary electrophoresis
and its application in the clinical laboratory. Clin. Chim. Acta, 330, 1–30 (2003).52. Hernandez-Borges, J., Neususs, C., Cifuentes, A. and Pelzing, M., On-line capillary
electrophoresis-mass spectrometry for the analysis of biomolecules. Electrophoresis, 25,2257–2281 (2004).
53. Cooper, J.W., Wang, Y.J. and Lee, C.S., Recent advances in capillary separations for pro-teomics. Electrophoresis, 25, 3913–3926 (2004).
54. Hutterer, K. and Dolnik, V., Capillary electrophoresis of proteins 2001–2003. Electrophoresis,24, 3998–4012 (2003).
55. Pantazaki, A., Taverna, M. and Vidal-Madjar, C., Recent advances in the capillary elec-trophoresis of recombinant glycoproteins. Anal. Chim. Acta, 383, 137–156 (1999).
56. Engelhardt, H. and Grosche, O., Capillary electrophoresis in polymer analysis, in NewDevelopments in Polymer Analytics I, 150, 189–217 (2000).

92 K. Nagy and K. Vékey
57. Shimura, K., Recent advances in capillary isoelectric focusing: 1997–2001 Electrophoresis,23, 3847–3857 (2002).
58. Kilar, F., Recent applications of capillary isoelectric focusing. Electrophoresis, 24, 3908–3916(2003).
59. Hu, Y., Huang, X., Chen, G.Y.J. and Yao, S.Q., Recent advances in gel-based proteome pro-filing techniques. Mol. Biotechnol., 28, 63–76 (2004).
60. Oh-Ishi, M. and Maeda, T., Separation techniques for high-molecular-mass proteins. J. Chromatogr. B, 771, 49–66 (2002).
61. Patton, W.F., A thousand points of light: The application of fluorescence detection technolo-gies to two-dimensional gel electrophoresis and proteomics. Electrophoresis, 21, 1123–1144(2000).
62. Van den Bergh, G. and Arckens, L., Recent advances in 2D electrophoresis: an array of possi-bilities. Expert Rev. Proteomics, 2, 243–252 (2005).
63. Lilley, K. S., Razzaq, A. and Dupree, P., Two-dimensional gel electrophoresis: recent advancesin sample preparation, detection and quantitation. Curr. Opin. Chem. Biol., 6, 46–50 (2002).
64. Gorg, A., Obermaier, C., Boguth, G., Harder, A., Scheibe, B., Wildgruber, R. and Weiss, W.,The current state of two-dimensional electrophoresis with immobilized pH gradients.Electrophoresis, 21, 1037–1053 (2000).
65. Molloy, M.P., Two-dimensional electrophoresis of membrane proteins using immobilized pHgradients. Anal. Biochem., 280, 1–10 (2000).
66. Cramers, C.A., Janssen, H.G., van Deursen, M.M. and Leclercq, P.A., High-speed gas chro-matography: an overview of various concepts. J. Chromatogr. A, 856, 315–329 (1999).
67. van Deurse, M.M., Beens, J., Janssen, H.G., Leclercq, P.A. and Cramers, C.A., Evaluation oftime-of-flight mass spectrometric detection for fast gas chromatography. J. Chromatogr A, 878,205–213 (2000).

Medical Applications of Mass SpectrometryK. Vékey, A. Telekes and A. Vertes (editors)© 2008 Elsevier B.V. All rights reserved
93
Chapter 6
Mass spectrometry instrumentationand techniques
ÁRPÁD SOMOGYI*
Department of Chemistry, University of Arizona, Tucson, AZ, USA
1. Introduction 942. General questions about mass measurement and mass spectrometry 963. Separation techniques: gas chromatography (GC), and high-performance liquid
chromatography (HPLC) 1004. Ionization methods 102
4.1. Electron impact (EI) ionization 1044.2. Chemical ionization (CI) 1084.3. Fast-atom bombardment (FAB) and liquid secondary ion mass
spectrometry (LSIMS) 1104.4. Electrospray ionization (ESI) 1114.5. Atmospheric pressure chemical ionization (APCI) 1154.6. Matrix-assisted laser desorption/ionization (MALDI) 116
5. Mass analyzers 1195.1. Time-of-flight (TOF) analyzers 1205.2. Interaction with electrostatic fields: electrostatic (ESA)
and orbitrap (OT) analyzers 1235.3. Interactions with a magnetic field: magnetic (B) analyzer 1245.4. Interactions with a magnetic and electrostatic field: ion cyclotron
resonance (ICR) analyzers 1255.5. Interaction with electromagnetic fields: quadrupole (Q) analyzers 1275.6. Interaction with electromagnetic fields: linear ion-trap quadrupole
(LTQ) analyzers 1285.7. Interaction with electromagnetic fields: three-dimensional quadrupole
ion-trap (3D QIT) analyzers 1296. Tandem mass spectrometry (MS/MS) 1307. Selected terms for clarification 135Acknowledgment 137References 137
*Tel.: �1-520-626-7272; Fax: �1-520-621-8407. E-mail: [email protected].

94 Á. Somogyi
1. Introduction
In this chapter we provide a general overview of mass spectrometry instrumenta-tion and techniques. After the discussion of some general questions and mainfeatures of mass spectrometers, the ionization methods, separation techniques,mass analyzers, and tandem mass spectrometry will be discussed. At the end ofthe chapter, a few arbitrarily chosen mass spectrometry terms will be mentionedfor clarification. Somewhat surprisingly, these terms are not well understood andmisleadingly used in everyday jargon.
One can justifiably argue that such a detailed discussion of instrumentationand technical features may not be interesting for general users with no massspectrometry background. The author has a different opinion based on his manyyears of experience in teaching mass spectrometry for a quite general audi-ence, including not only chemists but also biochemists, biologists, geneticists,medical doctors, and other colleagues working in clinical laboratories. These“inexperienced general users” find the discussion of instrumentation interestingand useful for better understanding of the mass spectra, and most importantly, theirneeds, and at times the limitations of mass spectrometry in certain areas of theirresearch.
Of course, a compromise should be made and it is not the purpose of this chap-ter to bury the reader with a lot of technical details. The discussion presented heremimics a “lecture style” presentation, i.e., when simple but important questions areasked and analogies are given for better understanding. For technically inclinedreaders, we provide some references for guidance. We further encourage the read-ers to find more relevant and detailed works in relation to their research. Theseworks (by the hundreds) are easily available on the Internet, for example.
Maybe the first questions we should ask at this point are: “Why do we need thisbook at all? Is mass spectrometry so much better than any other analyticalmethod?” The golden rule in analytical chemistry is not to rely exclusively on oneanalytical method but rather use as many as you can and put the pieces of infor-mation together to get the best answers possible to your questions. What oneshould consider is the structural information content provided by a givenanalytical technique per unit time. For example, to study chirality in carbohydratederivatives, nuclear magnetic resonance (NMR) spectroscopy is a much morereasonable choice than mass spectrometry. This does not mean that massspectrometry cannot be used to study chirality (in fact, there are several papers inthe literature in this field), but at present NMR undoubtedly providesstereochemical information in a much shorter time than mass spectrometry.Another example is the determination of protein structures. Obviously, X-ray crys-tallography can provide the greatest information content, such as bond lengths,bond angles, and torsion angles, but this technique requires the preparation of apure (and in most cases, crystalline) protein that may take a lot of time. Even

Mass spectrometry instrumentation and techniques 95
though mass spectrometry cannot provide “X-ray quality” structural information,it can be used to check, for example, protein sample purity and to sequence proteinsin a reasonably short time. (Note here that although it is widely used, the term“structural information” is not well defined and can mean different parameters(such as bond lengths and angles in X-ray crystallography) or structural units/chemical groups (such as the order of the amino acids in peptides and/or proteins).)Protein purity measurements can be performed within minutes with matrix-assistedlaser desorption/ionization time-of-flight (MALDI-TOF) mass spectrometry, andsequencing of protein mixtures can be done in a couple of hours with currentnanospray/high-performance liquid chromatography tandem mass spectrometry(nanospray–HPLC–MS/MS) measurements by using very little sample. The gen-erally short analysis times make mass spectrometry suitable for high-throughputanalyses, which is a significant advantage in clinical laboratories. The great sensi-tivity of mass spectrometry is definitely one of its strengths over other analyticaltechniques. Fluorescent-tag spectroscopy can, in principle, compete with massspectrometry, but the application of this technique requires a more intensive pre-treatment of the sample. For correctness, it should be noted that sample prepara-tion for mass spectral analyses is also necessary, but the general trend in researchand application is to reduce this time.
In summary, we can objectively state that mass spectrometry is among the mostpowerful analytical tools in clinical and medicinal chemistry. The samples fromthese laboratories are very often complex mixtures that may contain small amountof physiologically important analytes (e.g., drugs and metabolites) buried in thedirty environment of “biological matrices.” Clinical diagnostic laboratoriesproduce large number of samples, the timely analysis of which is crucial to makecorrect diagnosis. Pharmacokinetics (drug metabolism) studies also require thequantitative analysis of large number of samples taken at different times fromdifferent biological fluids, e.g., urine or blood. Multiple reaction monitoring(MRM) on a triple quadrupole instrument coupled with HPLC separation is a per-fect technique for these quantitative studies and provides much more relevantinformation than an HPLC analysis with a ultraviolet (UV) detector only. Anotherimportant advantage of using a mass spectrometer over a UV detector is thatstructural information on coeluting components can be routinely obtained byHPLC–MS/MS measurements, but coelution may be overlooked by using solelya UV detector. Thus, mass spectrometry overlaps with many other analytical tech-niques providing not only an alternative way of analysis but also more coherentand reliable information on components of complex mixtures. Together withmany other areas of applications (such as environmental, forensic, and materialsciences), mass spectrometry is an important tool in medicinal chemistry with anexpanded role and availability in more and more laboratories. The main aim ofthis chapter is to shed some light on the physical phenomena that make massspectrometry such a powerful analytical technique.

96 Á. Somogyi
2. General questions about mass measurement and mass spectrometry
How do we measure masses of big and small objects? It is relatively easy todetermine the mass of heavy things, such as a book, a car, or a human being. Inmost cases, we use one of nature’s four forces, the gravitational force (more specif-ically the Earth’s gravity), to help us out and, in fact, we measure the weight of anobject and use this information to determine the mass. For example, if you have apatient who complains about weight loss, you simply ask him or her to stand on aconventional scale and measure his/her weight. If the person weighs 70 “kilos”(used in everyday language), the mass of the person is approximately 70 kg. As adoctor, you can easily monitor the change in mass by measuring the weight in aneasy, conventional way.
With lighter and lighter objects (or, equivalently, smaller and smaller masses) theuse of a conventional scale would not be adequate—just think about measuring theweight (mass) of a light feather (for example, the one that flows with the wind inthe beginning and the end of the movie Forrest Gump). With smaller and smallermasses, we would need more and more sensitive scales but, eventually, there is alowest mass limit (e.g., a microgram, 10�6 g) that we could measure in the con-ventional way of measuring weights (i.e., by using the gravitational force).
We must have a different approach if we want to measure the mass of muchlighter species, such as atoms and molecules. Fortunately, nature offers us a rela-tively simple way. This is because besides the gravitational force there are threeother forces in nature. These are (i) the strong force (that holds the atomic nucleitogether), (ii) the electroweak force (which is responsible for radioactivity ofcertain isotopes some of them are even used in clinical diagnostics), and (iii) theelectromagnetic force (which is related to moving (accelerating) electronicallycharged particles). For our present goal of measuring the mass of atoms and mol-ecules, the latter one, the electromagnetic force, is crucial. What we need to do isrelatively simple: We have to make the atoms and molecules charged by a processcalled ionization and allow them to interact with electrostatic, magnetostatic, orelectromagnetic fields by which the ions are separated (ion separation).
What are mass spectrometers? The instruments in which originally neutral atomsand/or molecules become charged (ionized) and are subjected to electrostatic, mag-netostatic, or electromagnetic fields (ion separation) are called mass spectrometers.Large number of possible combinations of ionization (ionization methods) and ionseparation (mass analyzers) are available in a great variety of both homemade andcommercially available mass spectrometers. The common feature of the majorityof mass spectrometers is that ionization and ion separation occur in the gas phase.The analyzed compounds need to be vaporized or transferred into vacuum eitherbefore or during the ionization. Most mass spectrometers operate in the vacuumrange of 10�4 to 10�11 Torr.

Mass spectrometry instrumentation and techniques 97
How can mass spectrometry be used for chemical analysis? It is quite difficult togive a brief definition of mass spectrometry that fully covers all of its crucial features.Ashort definition recommended in the book by Sparkman (2000) is that “mass spec-trometry is the study of matter based on the mass of molecules and on the mass of thepieces of the molecules” [1]. In broader terms, we can also say that mass spectrom-etry is a powerful tool in analytical and bioanalytical chemistry that provides detailedstructural information on a wide variety of compounds with molecular weight (MW)of 1–1,000,000 Da by using a small amount of sample (nanogram, picomole, or fem-tomole of material). Another important feature is that mass spectrometers are easilycoupled with separation technology, such as gas chromatography (GC) or HPLC.Mass spectrometry is an “ideal” tool to analyze complex mixtures, e.g., peptidesresulting from the enzymatic digestion of proteins. With automated analyses, massspectrometry is also a high-throughput technique with the capability of analyzingseveral hundreds of samples a day per instrument.
What is a mass spectrum? Fig. 1 shows a 70 eV electron impact (EI) ionizationspectrum of acetone. This spectrum is a plot of relative abundance versus mass-to-charge ratio (m�z). The term “relative abundance” is used because the vertical axisis calculated by assigning the most intense ion signal to 100 (base peak) andthe other ion signals (peak intensities) are normalized to this value. We measure themass-to-charge ratios (m�z) from which the mass of a given ion can be determinedbased on the knowledge of the charge state. Obviously, if the charge state is one(such as in singly charged ions formed by loosing an electron, e�), the m�z valuedirectly gives the ion mass. The charge states of multiply charged ions can easilybe determined, as will be discussed in the following text.
20 30 40 50 600
20
40
60
80
100
m/z
CH3CO+
CH3+
C2H3+
58
43
27
15
59
(CH3)2CO+.
(M+.)
Rel
ativ
e A
bund
ance
Fig. 1. Electron impact (EI) ionization spectrum of acetone (70 eV).

98 Á. Somogyi
Fig. 2. Basic components of a mass spectrometer.
Ionization Source Mass Analyzer Detector Computer
Sample IntroductionDirect probe/infusion
GCHPLC
Sample Preparation
Vacuum System
Electron Impact (EI)Chemical Ionization (CI)Atmospheric Pressure Chemical Ionization (APCI)Electrospray Ionization (ESI)Matrix Assisted Laser Desorption/Ionization (MALDI)Fast Atom Bombardment (FAB)
Electrostatic (ESA)Magnet (B)Time-of-flight (TOF)Quadrupole (Q)Ion Traps (2D & 3D IT)Ion-CyclotronResonance (ICR)Orbitrap (OT)
Rough, Turbomolecular,Diffusion or Cryo pumps
Electron MultiplierPhoto multiplierFaraday CapArray DetectorsMultichannel Plate
What are the general components of a mass spectrometer? A simplified blockdiagram of a mass spectrometer is shown in Fig. 2.
As was discussed in detail in Chapter 4, sample preparation is crucial, especial-ly for samples of biological /biochemical origin. Samples can be introduced via adirect inlet, a GC, or an HPLC. Direct introduction may include a heated reservoir(for volatile compounds that are liquids at room temperature), a direct insertionprobe (for relatively pure, synthesized solid organic compounds (EI) or fast-atombombardment (FAB) and biomolecules (MALDI), and a direct infusion or flowinjection for electrospray ionization (ESI) or atmospheric pressure chemical ion-ization (APCI, see the following text). GC and HPLC are strongly recommendedand routinely used for the analysis of complex mixtures. (These separationtechniques will be discussed briefly in Section 3, and has already been discussedin somewhat more detail in Chapter 5.)
Ionization is a crucial process occurring in the ionization source of massspectrometers: There are several requirements about the ionization process: (i) Theionization process and ion extraction from the ionization source should be reason-ably efficient to maintain low detection limits (high sensitivity); and (ii) the ion-ization efficiency, desirably, should not be sample dependent and the generated ioncurrent should stay steady for reliable quantitation. The current state-of-the-artmass spectrometers are equipped with efficient ionization sources; however, forquantitation the use of internal standards is strongly recommended.

Mass spectrometry instrumentation and techniques 99
There are two main ways of generating positively charged ions: either by theremoval of an electron, e.g., EI and field desorption (FD) ionizations or by additionof a proton or other “cationizing” agents, such as Na�, K�, Ag�, etc. In the lattercase, the proton/cation transfers are established by the so-called “soft” ionizationtechniques, including chemical ionization (CI), APCI, FAB, liquid secondary ionmass spectrometry (LSIMS), laser desorption (LD), MALDI, surface-enhancedlaser desorption ionization (SELDI), ESI, desorption electrospray ionization(DESI), and direct analysis in real time (DART). Note that proton detachmentscan easily be achieved by most of the soft ionization techniques leading to theformation of negatively charged ions that are widely investigated as well.
Another important part of a mass spectrometer is the mass analyzer that is usedto separate the ions. The simplest way of ion separation is just to let them fly andmeasure their time of flight. This type of analyzer is called time of flight (TOF).Here, electrostatic potential gradients are used to accelerate/decelerate the ions.Ion separation is achieved by the interaction of ions with an electrostatic (electricsector analyzer, ESA or orbitrap (OT)) or a magnetostatic (magnet, B) field. A res-onant electromagnetic field is applied in quadrupoles (Q), and three-dimensionalor linear ion traps (3D-IT and LTQ, respectively). A combination of electric (E)and magnetic (B) fields is used in Fourier transform ion cyclotron resonance (FT-ICR) instruments. Spatial coupling of mass analyzers is also used to perform tan-dem mass spectrometry (MS/MS) experiments. These types of experiments willbe discussed later in this chapter (Section 6).
The final step of a mass spectral analysis is recording of the mass spectrum bydetecting the ions after their separation. The detection of ions can be obtainedconsecutively in time (“sweeping” techniques) where a characteristic parameter ofthe analyzer, e.g., the magnetic field strength or radio frequency (RF) fieldamplitude, is being varied in time so that only ions with a particular m/z can hitthe detector at a given time. In contrast, ions or ion packets can be detectedsimultaneously by recording the signal associated with all the ions at the detectorplates. This complex ion signal (transient) is then deconvoluted by Fourier trans-formation (FT) that provides us the mass spectra. Modern mass spectrometers areequipped with detectors of great sensitivity. The detectors most commonly usedinclude the electron multiplier, the photomultiplier, the conversion dynode, theFaraday cap, the array detector, and the charge or inductive detector. Detaileddescriptions of these detectors are beyond the scope of the present chapter.
From the operational point of view, reliable vacuum systems are a prerequisitefor mass spectral measurements. In most cases, manufacturers apply differentialstage pumping to achieve the required pressure range(s). Rotary pumps are used toprovide an initial vacuum of approximately 10�2 to 10�3 Torr. High-vacuum pumpssuch as diffusion pumps (10�6 to 10�8 Torr), turbomolecular pumps (10�7 to 10�8
Torr), and cryopumps (10�9 to 10�11 Torr) are used to reduce pressure further.Adequate knowledge in vacuum technology is essential in instrument design;however, this is also beyond the scope of this chapter.

100 Á. Somogyi
As mentioned, mass spectrometry is a high-throughput analytical method. Onecan easily generate several megabytes or even gigabytes of data in an hour ofoperational time. Successful data processing in a timely manner requires state-of-the-art computers with intelligent data processing and search programs. In somecases, such as for proteomics research, clusters of computers are used to improvethe speed and the reliability of database searching.
Finally, we note that there are numerous books and articles available in the lit-erature for those who are interested in rigorous details of mass spectrometry. Toadequately cite all these works would create a long list. Therefore, we provide afew to guide the technically inclined readers. For example, for general descriptionsabout mass spectrometry instrumentation, terminology, and mass spectral inter-pretation, we recommend the books by Sparkman [1], Watson [2], Chapman [3],Gross [4], Busch et al. [5], and McLafferty and Turecek [6]. For those who areinterested in biological mass spectrometry and proteomics, the books by Siuzdak[7], Liebler [8], and Baer et al. [9] are recommended. Additional references willbe recommended in the following sections.
3. Separation techniques: gas chromatography (GC), and high-performanceliquid chromatography (HPLC)
Why do we need separation techniques? As will be discussed in Sections 5 and 6,state-of-the-art mass analyzers and tandem mass spectrometry allow mass spec-trometry to be a powerful tool for the analysis of complex mixtures. The couplingof classical separation techniques with mass spectrometry further improves the util-ity of these combined techniques for mixture analysis. Mass spectrometers are themost sensitive and structure-specific detectors for separation techniques that, ingeneral, provide more detailed and reliable structural information on componentsof complex mixtures than other conventional detectors (such as flame ionization,UV, reflective index detectors, etc.).
A simplified schematics for three main separation techniques, namely GC, high-performance or high-pressure liquid chromatography (HPLC), and supercritical fluidchromatography (SFC), are shown in Fig. 3. In all cases, the analyte molecules in amixture (such as M1 and M2) are partitioned between a liquid-phase film on a solidsubstrate and a carrier flow (mobile phase). In GC, the carrier is a gas, most com-monly helium (He), in HPLC, the carrier flow is a combination of common solvents,such as water, methanol, acetonitrile, etc., and in SFC the mobile phase is a super-critical fluid, usually CO2. The partition of analyte molecules between the carrierphase and the liquid (stationary) phase depends on many factors, such as volatility,polarity, and hydrophobicity/hydrophilicity of the analyte, the chemical compositionof the liquid phase, the flow rate, and the temperature applied. This partition can bevisualized as a flooding river carrying debris of different sizes and shapes (analyte

Mass spectrometry instrumentation and techniques 101
molecules) that are bouncing back and forth between the water (mobile phase) andthe branches of the trees and bushes (stationary liquid phase) on the riverbank.
In GC, there is not much variance in the “chemical composition” of the mobilecarrier phase, which is usually He gas. Therefore, chemical composition of liquid-phase molecules on the column and the temperature change during separationdetermine the effectiveness of separation. Combinations of chemical structuresin the liquid-phase chains are common, such as the use of different ratios ofmethyl/phenyl silicons. The retention time, i.e., time necessary for a compound topass through the column increases with the volatility of the compounds. To achievebetter separation, a temperature gradient is applied that reduces peak broadeningdue to diffusion.
GC–MS is still widely used technique in environmental, forensic, and plane-tary (space) sciences. It is, however, limited to volatile and thermally stablecompounds as they are injected to the GC via a high-temperature (250–300�C)injection port. Nonvolatile compounds can be analyzed after specific derivatiza-tion such as methylation, silylation, etc.; however, that requires additional sam-ple preparation time. This is not always feasible as HPLC–MS is a bettertechnique for a large variety of nonvolatile compounds, including those of bio-logical importance. These include drugs and their metabolites, peptides, proteins,oligosaccharides, and oligonucleotides. For more details about GC �MS operation
M1
M1
M1
M1
M1
M1
M1
M1
M2
M1
M2
M2
M2
M2
to MS
interface
carrier
flow
time
Intensity m/z
liquid film on substrate
a
b
Fig. 3. (a) GC chromatogram and mass spectra of a two-component system. The plot of total ionintensity vs. increasing time is the total ion chromatogram (TIC). Individual mass spectra areobtained in a real-time mode for each component. (b) A simplified mixture flow of a two-componentsystem in a GC column.

and for a practical user guide, we recommend the book by McMaster andMcMaster [10].
In HPLC, a greater variety of both the mobile (carrier) phase and the liquidphase is available to optimize separation for a wide variety of compounds. Byvarying the ratio of solvents by applying a solvent gradient, one can change thepolarity of the mobile phase, which is a unique feature of HPLC compared to GC.Two main categories of liquid phases are applied: the “normal” phase and the“reverse” phase liquid layers. In reverse phase, nonpolar alkyl chains are exposedto the mobile phase. This provides stronger interactions with nonpolar (hydropho-bic) analytes that will appear at longer retention time compared to more polar(hydrophilic) analytes. For further details of separation mechanisms and ioniza-tion techniques used in HPLC–MS, a good introductory book by Ardrey [11] isrecommended.
The advantage of combining GC, HPLC, and SFC with mass spectroscopy isthat fast-scanning mass analyzers allow us to record several mass spectra everysecond so that numerous mass spectra are produced during a chromatographicrun. These mass spectra can either be direct “electron or chemical ionization”spectra (GC–MS) that are rich in fragments (see Section 4) or tandem massspectra (see Section 6), in which an ion of interest at its retention time is selectedand then further fragmented by an ion-activation method, usually collision-induced dissociation (CID). Fig. 4 shows such a combined HPLC–MS/MS runfor a peptide mixture obtained by digesting a protein. Fig. 4a shows the basepeak ion current as a function of time. The mass spectrum (MS) at a particularretention time (26.47 min) is shown in Fig. 4b. It is clear from this MS spectrumthat there are two coeluting components (see doubly charged ions at m/z 571.4and 643.2). The doubly charged ion at m/z 571.4 is then selected and fragmentedto produce the MS/MS (fragmentation) spectrum (Fig. 4c). The fragment ionsprovide important structural information such as peptide sequence. Although notshown here, the structural information on the other component (m/z 643.2) wasalso obtained in about a second. Thus, MS/MS spectra are automatically gener-ated for coeluting components allowing us to derive structural information, e.g.,peptide sequence.
4. Ionization methods
Why do we need different ionization methods? Depending on the chemical prop-erties of a molecule studied, different ionization methods should be applied. Allionization methods are not applicable to all molecules. For example, nonvolatile,heat-sensitive molecules, such as most of the biomolecules, cannot be ionized byEI ionization because the prerequisite for this ionization is the (thermal) evapo-ration of the sample. Also, the ion yield (ionization efficiency) depends on the
102 Á. Somogyi

Mass spectrom
etry instrumentation and techniques
103Fig. 4. HPLC is used to separate the components of a protein digest mixture. (a) Base peak ion current as a function of time. MS and MS/MS massspectra are recorded in real time. (b) Full MS spectrum obtained at retention time 26.47 min. Two main coeluting components are detected (see,e.g., doubly charged ions at m/z 571.4 and 643.2). (c) The tandem MS/MS (fragmentation) spectrum of the doubly charged peptide ion at m/z 571.The m/z values of the fragments are used to sequence the peptide.
Ion Currentover 60 min
MS
MS/MS
a
b c
571

104 Á. Somogyi
chemical structure of a molecule so that the application of more than one ioniza-tion method for a given compound is desirable. In this chapter a brief summaryof the most commonly used ionization methods is provided.
4.1. Electron impact (EI) ionization
Volatile molecules can be ionized in the gas phase by colliding them with a beamof high-energy (70 eV) electrons. Typically, lower molecular mass compounds aremore volatile. EI is suitable for the analysis of these compounds in the molecularmass range of 1–800 Da. (Note, however, that there are compounds, such as fluo-rinated hydrocarbons or some transition metal complexes, that have MWs higherthan 1000 Da and, yet, they are still volatile enough for EI analysis.)
A scheme of an EI ionization source is shown in Fig. 5. The electrons are emit-ted from a heated filament (made of tungsten or rhenium) and accelerated towardthe source chamber. In the ionization chamber, some of these accelerated electronscollide with the evaporated neutral molecules so that the emission of two electronsoccurs leaving behind a positively charged molecular ion. To form positivelycharged ions, the average energy of the electrons must exceed the ionization poten-tial of the (originally) neutral molecule. Although the ionization potentials of most
S N
Focusing lenses andslits
SampleinletIon repeller
Electron beam
Filament
Ions
++++
+
+ +
Ionization chamber
Magnet
Vaporized analyte molecules
Fig. 5. Schematics of an electron impact (EI) ionization source.

Mass spectrometry instrumentation and techniques 105
common organic compounds are in the range of 8–12 eV, for routine and compar-ative studies a 70 eV electron beam is applied. At around this value of energy, theionization efficiency (ion yield) is constant. Desirably, the electron beam shouldbe well focused and a narrow energy spread of the beam should be maintained.This can be achieved by appropriate focusing and by a magnet (indicated by S(south) and N (north) poles in Fig. 5).
In most cases, the average background and/or analyte pressure in the EI sourceis low enough (less then 10�4 to 10�5 Torr) to avoid ion–molecule collisions (i.e.,the mean free path is much longer than the dimension of the ionization chamber).As a consequence, EI mass spectra, in general, are free from ions originatingfrom ion–molecule reactions. The applied repeller voltage of 1–5 V is highenough to force the ions to leave the source within a few microseconds. Thus,parent and fragment ions detected in EI mass spectra must be formed within thetime frame of a few microseconds. This means that the unimolecular rate con-stants (k) are in the range of about 105 to 106 s�1. To drive fragmentation reac-tions with this rate, a significant amount of internal energy is required, i.e., thekinetic shift (the difference between the actual average internal energy and theactivation energy) is relatively large. The two main theory (Rice, Raisberger,Kespel, and Marcus (RRKM) and quasi equilibrium theory (QET)) that describethe main features of ion activation and fragmentation are beyond the scope of thischapter, but we recommend some fundamental works by Beynon and Gilbert[12], Cooks et al. [13], Forst [14], McLafferty and Turecek [6], and Vékey [15]and Drahos and Vékey [16].
The excess internal energy can easily be provided by collisions with 70 eV elec-trons since the electron energy is significantly larger than the ionization energiesof common organic molecules (8–10 eV). Thus, during the ionization not only theelimination of an electron from a molecule (M) occurs but also an excited molec-ular ion (M∗) is obtained (Equation (1)).
(1)
Owing to the excitation of the molecular ion, the extra internal energy depositedvia EI allows the ion to fragment in the microsecond timescale, and if the internalenergy is high enough, the fragments (Fij) can even fragment further. The ionsappearing in the mass spectra are, therefore, a result of competitive and consecu-tive reactions as illustrated by the “fragmentation” matrix of Equation (2).
(2)(M+.)*F11 F12 F13
F21 F22 F23
F31 F32 F33
….….….
M e M e* � ��− −→ ( ) � 2

106 Á. Somogyi
20 30 40 50 60 70 800
20
40
60
80
100R
elat
ive
Abu
ndan
ce
m/z
78 (M+.)
7963
52
39
27
12C6H6+.
12C513CH6
+.(M-CH3)+
C4H4+.
C3H3+
C2H3+
77
C6H5+
Fig. 6. Electron impact (EI) ionization spectrum of benzene (70 eV).
50 100 150 200
50 100 150 200
0
20
40
60
80
100
0
20
40
60
80
100
m/z
Rel
ativ
e A
bund
ance
a EI (70 eV)
bCI (CH4)
M+.
185
[M+H]+
186
Fig. 7. (a) 70 eV EI spectrum and (b) CI spectrum (with methane reagent gas) of tributyl amine.
In Equation (2), Fij denotes the fragment ion formed in the ith competitive andjth consecutive fragmentation step.
Three characteristic 70 eV EI ionization spectra are shown in Figs. 1, 6, and 7a(acetone, benzene, and tributyl amine, respectively). In the EI spectrum of acetone(Fig. 1) the molecular ion is at m/z 58 and this is the nominal MW of the neutral

Mass spectrometry instrumentation and techniques 107
acetone. More precisely, this is the nominal mass of the acetone molecular ion. (Forthe definition of nominal and accurate masses, and isotope patterns, see thefollowing text.) The ion at m/z 59 corresponds to a molecule in which one carbon isa 13C isotope. (A reminder: Historically, mass spectrometry was developed toseparate and determine the masses of different isotopes of elements.) Other peaks inthe spectrum in Fig. 1 correspond to fragment ions of the molecular ion of acetone.The most abundant ion is a fragment ion at m/z 43 corresponding to the acetyl cation(CH3CO�). The most intense peak in the mass spectrum is called the base peak and,conventionally, all the other peak intensities are normalized to the intensity of thebase peak (which is taken as 100%). Other ions include the ions at m/z 15, 14, and13 corresponding to the methyl cation (CH3
�) and subsequent (consecutive)hydrogen losses from the methyl cation. Formation of both the acetyl and methylcations can be associated with a direct (C�C) bond cleavage. On the contrary, ionsat m/z 27 and 29 originate from rearrangement processes in which some bonds arebeing broken while others are being formed. The activation energies of rearrange-ment reactions, in general, are lower than those of direct bond cleavages. However,rearrangement reactions require specific orientation (conformational and/or otherrearrangement) of the atoms in the fragmenting ions, which is manifested in lowerfrequency factors. (For more details of ion-fragmentation mechanisms, see refs.[6,12,13,15].)
As demonstrated in Fig. 1, the molecular ion peak (M��) is not necessarily themost intense (base) peak in the spectrum (in case of acetone, its relative intensityis approximately 64% and represents only about 28% of the total ion intensity).This is the measure of the “fragility” of the molecular ion; the relative intensity ofthe molecular ion increases with its stability. In comparison to the acetone molec-ular ion, for example, the peak corresponding to the molecular ion of benzene isthe base peak in the 70 eV EI spectrum, which can easily be rationalized by themore conjugated (more stable) character of this ion (compare Figs. 1 and 6). Thepresence of the fragment at m/z 63 is particularly interesting because it corre-sponds to the loss of a methyl radical from the benzene molecular ion. Such a lossis difficult to rationalize from a closed-ring-type molecular ion. Instead, isomer-ization of benzene molecular ion to a [CH3�CCCC�CH3]
�� conjugatedstructure is assumed. Isomerization reactions are quite common in mass spec-trometry so that the structure of the molecular ion and that of the correspondingneutral are not necessarily the same.
Even though the 70 eV spectra of acetone (Fig. 1) and benzene (Fig. 6) showcharacteristic differences, there are important similarities as well. In both cases,the odd-electron molecular ions tend to lose neutral radicals to form even-electroncations. These reactions are driven by the fact that, generally speaking, even-electron ions are more stable than odd-electron ions. (As will be seen in thefollowing text, this general rule has an important consequence for fragmentationof even-electron-protonated (or deprotonated) molecules that prefer to lose even-electron fragments, e.g., small neutral molecules.)

108 Á. Somogyi
Although with different intensities, the molecular ions of both acetone andbenzene can easily be observed in Figs. 1 and 6. Thus, the molecular massinformation can be deduced for both compounds based on the position of themolecular ion peaks. There are cases, however, when the molecular ion is sofragile that it fragments completely, so that the molecular ion peak is either ofvery low intensity (see, e.g., Fig. 7a for tributyl amine) or not detected at all.Obviously, in these cases, the molecular mass determination based on 70 eV EIspectra becomes ambiguous, if not impossible. To reduce the fragmentation effi-ciency of the molecular ion, i.e., to obtain MW information, more gentle (“soft”)ionization methods are required. Five of these methods are discussed in thefollowing text.
4.2. Chemical ionization (CI)
CI is a gas-phase ion–molecule reaction in which the analyte (molecule) is ionizedvia a proton transfer process. (For more detailed description of the CI processes andanalytical applications, a “classic” book by Harrison [17] is recommended.) Theformation of the reactive ions in this ion–molecule reaction process is triggered byEI ionization of a reagent gas that is, most commonly, methane, isobutene, orammonia. The partial pressure of the reagent gas (1–0.1 Torr) is much higher thanthat of the analyte (ca. 10�4 to 10�5 Torr), so the gas molecules can be consideredas a protective shield for the analyte molecules to avoid direct EI ionization. EI ion-ization of methane results in the fragmentation of methane molecular ion and someof these ions react with neutral methane. The ionization of the analyte moleculeoccurs by proton transfer between reagent gas ions and the analyte, or to a lessextent, by adduct formation. Some characteristic mechanistic steps for methane CIcan be summarized as follows:
(3)
(4)
(5)
(6)
(7)
(8)
The CH5� ion formed in Reaction (4) is a strong acid. Reaction (6) is, therefore,
likely exothermic and the protonated molecule can gain enough internal energy tofragment. Thus, methane is considered as a relatively “hot” CI gas.
C H M M C H2 5 2 5� � � � → [ ]
C H M M H C H2 5 2 4� � � � � → [ ]
CH M M H CH5 4� � � � � → [ ]
CH CH C H H3 4 2 5 2� � � � →
CH CH CH CH4 4 5 3� � � � � →
CH e CH CH CH CH4 4 3 2� � � � � �→ →� �, ,

Mass spectrometry instrumentation and techniques 109
Reaction (6) can be rewritten to illustrate the proton-transfer process in a moregeneral way:
(9)
Here, RH� is the “protonated” reagent gas, M the analyte, [M � H]� the protonatedanalyte molecule, and R the reagent gas. Energetically, this reaction is preferred ifthe enthalpy change is negative (�Hr � 0). This is true if the proton affinity (PA) ofthe analyte is greater than that of the gas. (As we will see later, this statement will begeneralized for all of the soft ionization methods discussed below by substituting the“specific” reagent partner (gas) with a more general “matrix.”) PA of a molecule (M)is defined as the negative value of the heat of the following reaction:
(10)
(11)
Notice that the �Hr for Reaction (10) is less than zero due to the large value ofheat of formation of proton (1530 kJ/mol). PAs of several compounds have beenreported by Meot-Ner in the literature with special attention to the calibration ofthe PA scale [18]. The order of PAs of the most commonly used CI gases is:methane (PA 5.7 eV) � isobutene (PA 8.5 eV) � ammonia (PA 9.0 eV).This is in agreement with the “strong acid” character of CH5
�, which also impliesthat practically all organic compounds can be protonated by methane CI.
To illustrate characteristic differences between EI and CI spectra, the 70 eV EIand methane CI spectra of tributyl amine (MW: 185 Da) are shown in Fig. 7a and b,respectively. In the EI spectrum, the molecular ion at m/z 185 (M��) is very low inintensity, making the MW determination somewhat ambiguous. In the case of CIionization using methane as a reagent gas, the peak corresponding to the protonatedmolecule [M � H]� can easily be recognized at m/z 186. Owing to the low PA ofmethane, fragmentation of the [M � H]� still occurs providing structural informa-tion. For example, a fragment ion at m/z 142 can be assigned as (C4H9)2NCH2
�.Although the ion at m/z 142 is the base peak in both the EI and CI spectra, there areimportant differences between the mechanisms leading to this ion: In the EI mode,this ion is formed by the loss of propyl radical from the odd-electron molecular ion,while in CI this ion is generated by the loss of a neutral molecule, propane, fromthe even-electron-protonated molecule. This is again consistent with the relativestability of even-electron ions (as discussed earlier).
The spectra in Fig. 7 can also be used to illustrate another important rule inmass spectrometry, the nitrogen rule. The nitrogen rule states that any commonorganic molecule or odd-electron ion that contains odd number of nitrogen atomshas an odd (nominal) molecular mass. For example, tributyl amine contains onenitrogen atom; thus, the nominal MW must be odd, and so it is (185 Da). However,
PA r � Δ H
M H M H� � � �→ [ ]
RH M M H R� � � � � → [ ]

110 Á. Somogyi
acetone (MW 58) and benzene (MW 78) that contain no nitrogen atoms haveeven molecular mass. The nitrogen rule has many important implications andapplications. For example, the fragment ion at m/z 142 cannot be an odd electronion containing one nitrogen. Indeed, it is an even-electron ion containing onenitrogen atom (see above). Naturally, the nitrogen rule can be applied for proto-nated (or deprotonated) molecules as well. Of course, in this case the numbers“flip” around: The nominal mass of an ion corresponding to a protonated mole-cule that contains odd number of nitrogen atoms must be an even number (see,e.g., the [M � H]� of tributyl amine at m/z 186). Detailed interpretation of EI andCI spectra are beyond the scope of this book, but for interested readers the bookby McLafferty and Turecek [6] is, again, strongly recommended.
4.3. Fast-atom bombardment (FAB) and liquid secondary ion mass spectrometry(LSIMS)
FAB and LSIMS are closely related soft ionization techniques. A simplified schemefor both techniques is shown in Fig. 8.
The main difference between the two techniques is that a neutral atomic beam(Ar or Xe) is used in FAB, while a Cs� cation beam is used in LSIMS as a primary(ionizing) beam. In both cases, the analyte is mixed with a high-viscosity liquidmatrix (proton-transfer agent), such as glycerol, thioglycerol, m-nitrobenzene alco-hol, triethanol amine (TEA), etc. Combinations of these matrix components are alsoused to enhance ionization efficiency. For example, a glycerol:thioglycerol:m-NBA2:1:1 mixture containing 0.1% of trifluoroacetic acid (TFA) effectively generatesprotonated molecules for many organic compounds. Although FAB and LSIMS
MH+ to mass analyzer
Ion-molecule reaction(proton transfer)between matrix and analyte
High energy beam of neutral atoms (FAB) or Cs+ (LSIMS)
Mixture of liquid matrix and analyte
Fig. 8. A simplified scheme for FAB and LSIMS ionization.

Mass spectrometry instrumentation and techniques 111
ionizations are sometimes considered to be “outdated,” they are useful and alterna-tive ionization techniques to electrospray/nanospray ionization (ESI), APCI, andMALDI. The application of FAB and LSIMS is especially justified in an academicenvironment for elemental composition determination of relatively small syntheticorganic compounds by accurate mass (high resolution) experiments. For moredetails about the chemical aspects of FAB, we recommend the review by Fenselauand Cotter [19].
4.4. Electrospray ionization (ESI)
The significance of ESI in the analysis of biomolecules by mass spectrometry iswell acknowledged by awarding a shared Nobel Prize in 2002 to its inventor JohnFenn (currently at the Virginia Commonwealth University, Richmond, VA, USA).As he pointed it out demonstratively, “we taught elephants to fly.” Elephants, ofcourse, stand for a wide variety of large biomolecules including peptides, proteins,oligonucleotides, oligosaccharides, glycolipids, etc. (For early papers on ESI ion-ization, see, e.g., the ones by Doyle et al. [20] and Fenn et al. [21, 22], and for anoverview book, see the one edited by Cole [23].)
Electrospray ionization is an ionization process by which analyte molecules orions present originally in solution are transferred to the gas phase through eithersolvent or ion evaporation. Although the experimental setup is relatively simple,the ion-formation mechanisms are still under systematic studies [24–26]. Ascheme for an electrospray source is shown in Fig. 9, while a simplified ion-formation mechanism is indicated in Fig. 10.
In ESI the analyte previously dissolved in a solution is introduced into the ESIsource via a needle either by direct infusion or as an eluent flow from an HPLCchromatograph. The most commonly used solvents include water, methanol, andacetonitrile. Their combinations and specific use depend on the solubility of theanalyte. For direct infusion, a typical flow rate is in the range of 1–5 �l/min. More
Eluent with analyte (syringe pump or HPLC)
N2 flow
Spray/needle capillary
Spray (analyte-solvent droplets)at atmospheric pressure
Heated (transfer) capillary
to MS
SkimmerCone electrode
Pumping region
Fig. 9. Characteristic components of an electrospray ionization (ESI) source.

112 Á. Somogyi
recently, samples were analyzed with much lower flow rates of a few tens ofnanoliters per minute. This technique is called nanospray ionization that requiresmuch less sample amount providing greater sensitivity than “conventional” ESI.The ESI flow rate is characteristically higher when HPLC is used for sampleintroduction (approximately 50 �l/min). In many cases, microbore analyticalcolumns are used in the HPLC analysis. When higher flow rates are necessary forthe HPLC analysis, the eluent leaving the HPLC column can be split so that onlya small percentage of it is transferred to the ESI needle.
The electrospray itself is formed as a result of a large electrostatic potentialdifference between the syringe needle and a counter (cone) electrode. In the absenceof this electrostatic field, the droplet formed at the end of the syringe needle wouldsimply drop to the ground whenever the adhesive surface tension cannot compen-sate for the weight of the droplet. However, in the presence of a large electrostaticfield, the solution at the end of the needle is polarized (see Taylor cone in Fig. 10)and torn away from the needle. This way, depending on the applied potentials, pos-itively or negatively charged droplets are formed (Fig. 10). (To form positivelycharged droplets, the needle potential can be kept, for example, at �4 kV, and conevoltage at, e.g., 200 V.)
The more or less uniformly sized droplets enter a heated transfer capillaryin which the solvent molecules are being further evaporated. As a consequence,the surface charge density increases until the droplet size reaches the “Rayleigh”limit at which the surface tension cannot compensate for the “Coulombic” repul-sion associated with the surface charge. At this point, the droplet explodes(“Coulombic” explosion, Fig. 10) and smaller size droplets are formed. Thisprocess can continue until virtually no solvent molecules are present, but only
M MM
M M
M
+
+
+
++
++ +
++
+
+
++
++
+
+
+
+
+ +
+
+
+
+
+
+
+
+-
-
--
-
-
-
-+
+
-
+
Neutral eluent
Polarized eluent (Taylor cone)
+ + + + ++
++++++
Multiply chargeddroplet
M+++
+ + + ++
++
MMMM
MM
M
M++
+++
+
++
+ ++
+
++
M+
++
Solvent evaporation
Droplet withRayleigh limit
Coulumbicdroplet explosion
+ ve
Fig. 10. A simplified mechanism of ion formation in the electrospray ionization process.

Mass spectrometry instrumentation and techniques 113
protonated (or deprotonated) analyte molecules. Alternatively, ions can be evapo-rated directly from the charged droplets. It is easy to envision that in these processmultiply charged ions can easily be generated. In fact, formation of multiplycharged ions is an important characteristic feature of ESI. Note that depending onthe transfer capillary temperature and the solvent used, small droplets can survivethe journey through the transfer capillary. To retain these droplets and preventthem from entering the ion guide and analyzer region of the mass spectrometer, askimmer is used at the “entrance” of the lower pressure ion guide/mass analyzersection. Another disadvantage of the “linear” arrangement sketched in Fig. 9 isthat small salt particles can also enter the mass analyzer region causing contami-nation. Perpendicular (or Z-type) sprays are currently developed and successfullyused to overcome this problem.
A typical ESI spectrum for a protein (lysosyme) is shown in Fig. 11. The mul-tiply charged molecular ion pattern is clearly recognizable. Note that although thisESI spectrum corresponds to only one protein, there is a mixture of ions in thespectrum each of which has a different mass-to-charge ratio (reminder: In massspectrometry, the m/z ratio is measured). To calculate the molecular mass (or MW)of the protein, the charge states of the individual ions should also be determined.Thus, we have two unknowns, the MW and the charge state (n). To determine
Fig. 11. ESI spectrum of lysosyme.

114 Á. Somogyi
the values of two unknowns, we need at least two independent equations. Forexample, for two neighboring ions, the m/z values of which are denoted by aand b in Fig. 11, the relationship between a, b, the charge state, and MW can bewritten as:
(12)
(13)
With simple arithmetic rearrangements, the charge state at the ion a can bedetermined as:
(14)
Equation (14) provides a “geometric” solution that is easy to remember. The pro-cedure is simple: (i) Select any two neighboring peaks in the spectrum, (ii) calcu-late the difference between these two peaks ( ), and (iii) divide the m/z of one ofthe peaks by this difference, which will give the charge state of the other one. Thissimplified method works because, in most cases, b �� 1, so the correction is neg-ligible. In the spectrum, shown in Fig. 11, � 130 so that 1301�130 � 10 and thisis the charge state of ion a. The MW of the protein can then be determined as[1431.47 10�10] � 14,305 Da. The correction by 10 is necessary because themeasured ion mass is larger than the MW by the mass of 10 ionizing protons. Formore precise determination, all peaks should be considered in a similar way and thecalculated MW values should be averaged. This simple mathematical process iscalled “deconvolution” and provided by several manufacturers as a part of their dataprocessing program. It will be demonstrated in the FT-ICR mass analyzer section(Section 5.4) that, if the resolution of a mass spectrometer is good enough to separatethe isotopes of a given ion, the charge state can directly be determined by using theobserved m/z differences (1/n) between the (carbon) isotope peaks of an ion as well.
ESI has a great advantage over other “matrix assisted” ionization methods (suchas FAB (LSIMS) and MALDI) that peaks associated with matrix ions do not appearin the ESI spectra. This is especially useful for the analysis of smaller molecules,such as pharmaceutical products and their metabolites. Another advantage is relat-ed to sample introduction: Because samples are introduced in solution, HPLC is,naturally, a good “coupling” component of ESI making it suitable for mixtureanalysis. Another consequence of the sample introduction in solution phase is thatESI provides a way to study biomolecules in their native-like (solution phase) envi-ronment. For example, noncovalent (e.g., enzyme/substrate) interactions or proteindenaturing kinetics can be followed by ESI measurements at least in a qualitativeway. Other advantages of ESI/nanospray include a wide mass range of the
�
�
n
�
�
( )( )ba b
b1 �Δ
m
z
n
nb
⎛⎝
⎞⎠
[ ]
MW
� �
�b
11( )
mz
nna
⎛⎝
⎞⎠
[ ]
�
MW a

Mass spectrometry instrumentation and techniques 115
compounds to be measured with good sensitivity (from the low picomole to a fewtens of femtomole level). As an impressive feature of these ionization methods, werefer here to the analyses of large protein complexes with molecular masses greaterthan 200,000 Da, e.g., by the groups of Robinson [27] and Wysocki [28].Disadvantages include easy contamination of the transfer line and low salt toler-ance so that sample pretreatment may be necessary before analysis.
These drawbacks can be overcome by using two recently developed desorptionionization techniques. One of them is desorption electrospray ionization (DESI)[29]. This technique is related to both ESI and desorption ionization methods, suchas secondary ion mass spectrometry (SIMS) and LD. In DESI, electrosprayedcharged droplets generated from solvents are directed at a surface of interest in air.No matrix is necessary and the surface investigated can easily be moved duringthe analysis allowing “mapping” of the surface for certain analytes. The usefulnessof DESI has been demonstrated for small molecules (drugs), peptides, and pro-teins, as well as for in vivo analysis [29]. Another technique is the so-called directanalysis in real time (DART) developed by Cody et al. [30]. DART refers to anatmospheric-pressure ion source that allows analysis of gases, liquids, or solids onsurfaces in open air. The DART source operates by exposing the sample to a drygas stream (typically He or N2) that contains long-lived electronically and/orvibrationally excited atoms or molecules. The excited-state species can directlyinteract with the sample to desorb and ionize the sample (Penning ionization).Similarly to DESI, DART has been successfully used for the direct analysis ofsamples such as clothing, human skin, pills, plant materials, etc.
4.5. Atmospheric pressure chemical ionization (APCI)
As the term implies, in APCI, analyte molecules are ionized by ion–moleculereactions that take place at atmospheric pressure. A scheme for an APCI source isshown in Fig. 12. This ionization technique shows similarities with ESI in that thesamples are sprayed into the source; thus, this technique is also very commonlyused with HPLC (in fact, APCI allows higher flow rates than ESI). On the contrary,there are significant differences between ESI and APCI. First, in APCI, the samplesare sprayed into a heated ionization source (t � 400�C) so that the analyte mole-cules are vaporized. (This implies that APCI is not suitable for the analysis ofthermally labile compounds.) An essential part of the APCI source is a corona dis-charge in which O2 and N2 molecules are ionized and further react with solventmolecules in the gas phase at atmospheric pressure to form ions that will protonate(or deprotonate) the analyte molecules. (Reminder: In “classical” CI, ion–moleculereactions also take place in the gas phase, but at lower pressure (1�0.1 Torr).) APCIis widely used for ionization of smaller molecules, such as drugs and their metabo-lites, pesticides, steroid derivatives, lipids, etc. ESI and APCI are often comparedto each other in several applications. For example, for the determination ofcyclosporin A in rat plasma, see, e.g., the work by Wang et al. [31].

116 Á. Somogyi
4.6. Matrix-assisted laser desorption/ionization (MALDI)
“Elephants,” i.e., large biomolecules, can be taught to fly not only by ESI but alsoby using laser desorption ionization (LDI). This technique was also greatlyacknowledged by awarding the shared 2002 Nobel Prize to its developer KoichiTanaka [32]. At about the same time, Karas and Hillenkamp realized that laser ion-ization efficiency could be significantly improved by applying a matrix so that amodified method termed “matrix-assisted laser desorption/ionization (MALDI)”was developed [33].
As the name indicates, MALDI is a desorption/ionization method, so it has somesimilarities with FAB and LSIMS ionization (see Section 4.3). There are, however,important differences as indicated in Fig. 13. First, the analyte is crystallizedtogether with the matrix, i.e., no liquid matrix is involved. Second, the primarybeam is a laser (photon) beam and not a particle beam. Many of the commerciallyavailable instruments are equipped with a N2 laser, the frequency of which falls inthe UV region (337 nm). Infrared (IR) lasers are also used, but they are not as com-mon as the N2 laser. The most common matrices used in UV MALDI experimentsinclude nicotinic acid, benzoic acid and cinnamic acid derivatives, dithranol,azobenzoic acid derivatives, etc. (Asection of a MALDI plate in Fig. 14. shows spotswith different colors that are associated with different matrices.) These matrices havetwo common structural features: They contain a group that is a source of an acidicproton and they have absorption at or around 337 nm (the N2 laser wavelength).Similarly to ESI ionization, the mechanisms of MALDI processes are still underinvestigation (see, e.g., Dashtiev et al. [34] and Vértes et al. [35]). The most impor-tant steps of MALDI ionization mechanism can be briefly summarized as follows.The matrix molecules that are in great excess to the analyte molecules are electron-ically excited by the UV laser, and this energy is transferred to vibrational energy
Nebulizer gas
Sheath gas
Heated block(vaporizer)
++
+++
++
+
Corona discharge(plasma) region
+ve
corona needle
e- e-
e- e-
N2
H2O H3O+
H2O+.
N2 N2+.
N2+ H2O
MM
MH+ to MS
Ions are formedin the collisionregion
Fig. 12. Main components of an APCI ionization source. Ion formation in the corona discharge andcollision region is also indicated.
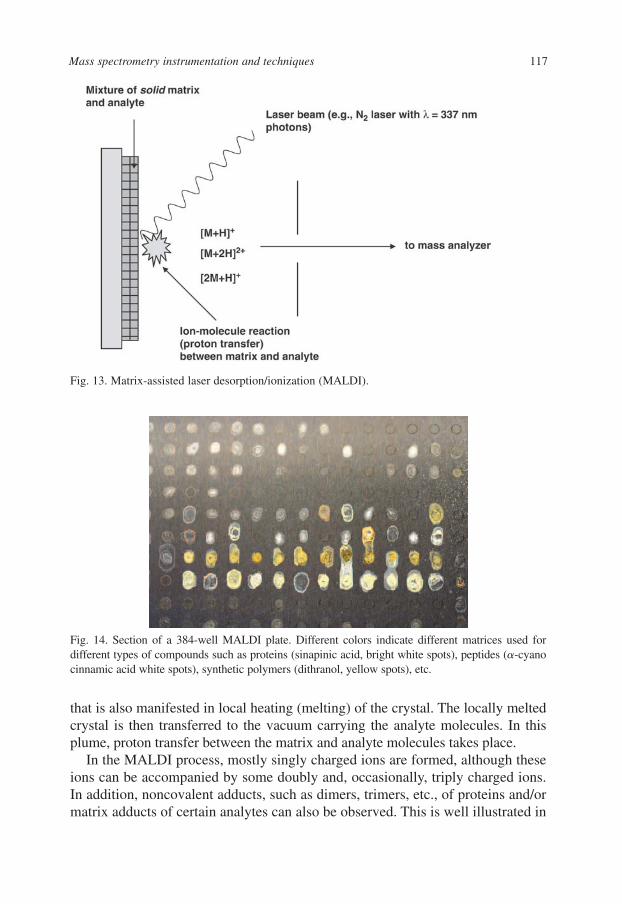
Mass spectrometry instrumentation and techniques 117
Fig. 13. Matrix-assisted laser desorption/ionization (MALDI).
Fig. 14. Section of a 384-well MALDI plate. Different colors indicate different matrices used fordifferent types of compounds such as proteins (sinapinic acid, bright white spots), peptides (�-cyanocinnamic acid white spots), synthetic polymers (dithranol, yellow spots), etc.
that is also manifested in local heating (melting) of the crystal. The locally meltedcrystal is then transferred to the vacuum carrying the analyte molecules. In thisplume, proton transfer between the matrix and analyte molecules takes place.
In the MALDI process, mostly singly charged ions are formed, although theseions can be accompanied by some doubly and, occasionally, triply charged ions.In addition, noncovalent adducts, such as dimers, trimers, etc., of proteins and/ormatrix adducts of certain analytes can also be observed. This is well illustrated in

118Á
. Somogyi
Fig. 15. MALDI-TOF spectrum of two proteins obtained by using a linear acquisition mode with sinapinic acid as matrix. The two proteins haveaverage molecular weights M1 12,385 Da and M2 18,014 Da, respectively.
5000 10000 15000 20000 25000 30000 35000 40000 m/z 0
5000
10000
15000
20000
25000
30000
35000
40000
45000
50000
a.i.
[M2+H]+
[M1+2H]2+
[M2+2H]2+
[M1+H]+
[2M1+H]+
[M1+M2+H]+
[2M2+H]+
[2M1+M2+H]+

Mass spectrometry instrumentation and techniques 119
Fig. 15, which shows a characteristic MALDI-TOF spectrum of a two-componentprotein mixture using sinapinic acid (SA) as a matrix. A broad, tailing peak isobserved in the lower mass region of the spectrum (�2000 Da) that is associatedwith ions from the matrix. This matrix interference is not disturbing in this partic-ular case of protein analysis but could be a disadvantage when smaller moleculesare studied. One way to eliminate the matrix interference is the application of theso-called “desorption/ionization on silicon” (DIOS) technique [36].
DIOS is a matrix-free laser desorption ionization technique that uses a pulsedlaser shined on porous silicon. Because the porous silicon is a UV-absorbingsemiconductor, a conventional N2 laser (337 nm) can also be used in DIOS. No other significant modifications are necessary, so a conventional MALDI-TOF instrument can be used for DIOS experiments. In comparison with directlaser desorption/ionization (LDI), DIOS does not result in fragmentation of thegenerated ion. This is because the UV photon energy is mostly absorbed by the silicon surface and only part of this energy is transferred to the analyte. Thelarge surface area of porous silicon allows obtaining low detection limits. High-throughput DIOS analysis of several small molecules has already beendemonstrated and mechanistic studies have been carried out by the groups ofSiuzdak and Vértes [36, 37].
MALDI ionization is, in general, more sensitive than ESI; it is routinely usedfor the analysis of peptides at the low femtomole or high attomole level. Anotheradvantage of MALDI is that, coupled with a TOF analyzer, biomolecules up toabout 500,000 Da can be investigated. The mass range can even be stretched fur-ther to 1–2 MDa, but detection of these “ultrahigh” masses requires sensitive andspecific detectors, such as the low-temperature detector used by, e.g., the Zenobigroup [38]. Disadvantages of MALDI include low salt tolerance, even though it isgenerally less critical than for ESI. There are several cases when sample pretreat-ment (e.g., desalting by the solid phase extraction) is desirable, if not required.
5. Mass analyzers
Why do we need mass analyzers? Obviously, it is not enough to generate ions bydifferent ionization techniques (see Section 4) but it is also necessary to separatethem from each other. Mass analyzers are used for ion separation, and severalmass analyzer types are commercially available. Overview of these mass analyz-ers can be simplified by considering two basic physical phenomena:
i) charged species can be easily accelerated by applying an electrostatic poten-tial difference, and
ii) an accelerated electric charge generates an electromagnetic field.As a consequence, we can separate charged species based on their
i) time of flight (TOF analyzers), and

120 Á. Somogyi
ii) their interaction with an electrostatic (electrostatic analyzer (ESA) and orbitrap(OT)), a magnetostatic (magnetic sector (B)) and a magnetostatic and electro-static fields (ion cyclotron resonance (ICR) analyzers), or an electromagneticfield (quadrupole (Q), three-dimensional quadrupole ion trap (3D QIT), or“two dimensional” linear ion-trap (LTQ) mass analyzers).
One can argue that this classification is quite arbitrary and does not follow theconventional or historical description of mass analyzers. We believe, however, thatemphasizing the similarity of physical phenomena that are essential for ion sepa-ration helps greatly in better understanding their basic operational principle.Combinations of these analyzers are also very common, especially in tandem massspectrometers that will be discussed briefly in Section 6.
A few general and desirable properties of mass analyzers should be mentionedhere. (i) To achieve good selectivity, mass analyzers should separate the ions withreasonable resolution. (ii) Sensitivity (i.e., the number of ions detected) dependsnot only on the ionization efficiency but also on the transmittance of massanalyzers. (Note that state-of-the-art detectors are good enough to detect only10–100 ions.) (iii) It is desirable to have a mass analyzer that is compatible withthe ionization source that can provide continuous or pulsed ion beams with eitherlow or high initial kinetic energy. (iv) Finally, the mass analyzers should have theappropriate mass-to-charge (m/z) limit to be able to detect compounds with a widemolecular mass range.
In the forthcoming sections a brief summary of the most important mass ana-lyzers is presented. Detailed description of their operation is beyond the purpose ofthis book, but readers with special interest in the physics and mathematics of oper-ations can easily find hundreds of articles and books in the literature. We provide afew relevant references for guidance throughout the text.
5.1. Time-of-flight (TOF) analyzers
An excellent and detailed overview of TOF analyzers can be found in Cotter’sbook [39]. The principle of operation is relatively simple: By applying an electro-static acceleration field (V ), ions with a charge of zq (where q is the unit chargeand z indicates the charge state) will gain a well-defined kinetic energy (Ekin) fromwhich the velocity (v) of the ion can be determined.
(15)
If we just simply let the ion with a velocity of v to fly for a distance of d, thetime of flight (t) can be determined as:
(16)td
v
E z q V mvkin 12
2
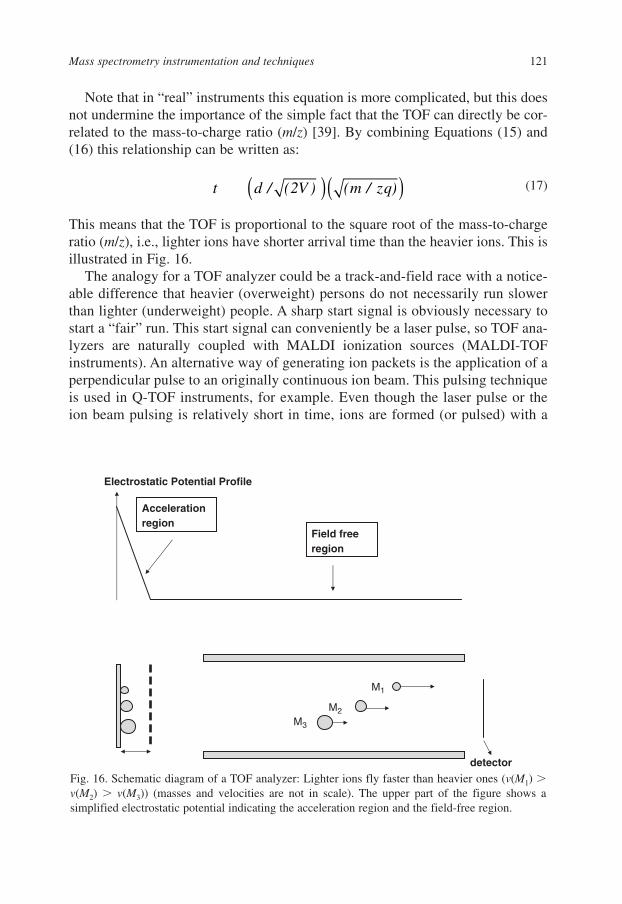
Mass spectrometry instrumentation and techniques 121
Note that in “real” instruments this equation is more complicated, but this doesnot undermine the importance of the simple fact that the TOF can directly be cor-related to the mass-to-charge ratio (m/z) [39]. By combining Equations (15) and(16) this relationship can be written as:
(17)
This means that the TOF is proportional to the square root of the mass-to-chargeratio (m/z), i.e., lighter ions have shorter arrival time than the heavier ions. This isillustrated in Fig. 16.
The analogy for a TOF analyzer could be a track-and-field race with a notice-able difference that heavier (overweight) persons do not necessarily run slowerthan lighter (underweight) people. A sharp start signal is obviously necessary tostart a “fair” run. This start signal can conveniently be a laser pulse, so TOF ana-lyzers are naturally coupled with MALDI ionization sources (MALDI-TOFinstruments). An alternative way of generating ion packets is the application of aperpendicular pulse to an originally continuous ion beam. This pulsing techniqueis used in Q-TOF instruments, for example. Even though the laser pulse or theion beam pulsing is relatively short in time, ions are formed (or pulsed) with a
t d V m zq / ( ) ( / )2( )( )
Electrostatic Potential Profile
detector
Acceleration region
Field free region
M3
M2
M1
Fig. 16. Schematic diagram of a TOF analyzer: Lighter ions fly faster than heavier ones (v(M1) �v(M2) � v(M3)) (masses and velocities are not in scale). The upper part of the figure shows asimplified electrostatic potential indicating the acceleration region and the field-free region.

122 Á. Somogyi
noticeable spatial and velocity spread. These definitely decrease separation effi-ciency of the ions that may be manifested in not adequate resolution and also notsatisfactory mass accuracy. Nevertheless, even the low-resolution, “linear mode”ion detection technique provides important information about protein purity (see,e.g., Fig. 15). This linear MALDI-TOF acquisition technique is also widely usedin cell imaging (or protein profiling) studies that have great potential in clinicaldiagnosis.
The resolution and mass accuracy of TOF analyzers has been significantlyimproved by introducing the delayed extraction technique and the reflectron (ionmirror). The delayed extraction is used to compensate for the spatial spread, whilethe reflectron is used to reduce the velocity (kinetic energy) spread. The latter isillustrated in Fig. 17. Ions with higher velocity (but with the same m/z ratio) pen-etrate deeper in the electrostatic field of the reflectron so that they are forced totravel a longer distance. Hence, ions with greater velocities have a longer flightpath than those with lower velocities. The detector should be positioned at a placewhere the faster moving ions “catch up” with the slower ions.
TOF analyzers have several advantages: (i) A reasonably good resolution (upto approximately 20,000) can be achieved, (ii) large mass range (up to approxi-mately m/z 2,000,000) is accessible with special detectors, (iii) fast duty cycles(10–5000 scans/spectra/s) can be used, and (iv) its high transmission providesexcellent sensitivity (e.g., at the 1–10 fmol level). It is not surprising, therefore,
Electrostatic Potential Profile (V)
MALDIplate
Reflectron lenses
detector
Reflectron
Fig. 17. Schematic representation of a reflectron (ion mirror) in a TOF analyzer: Ions with the samem/z formed with higher initial velocity (- - -) penetrate deeper in the electrostatic field of the reflec-tron than those with lower initial velocity (. . .).
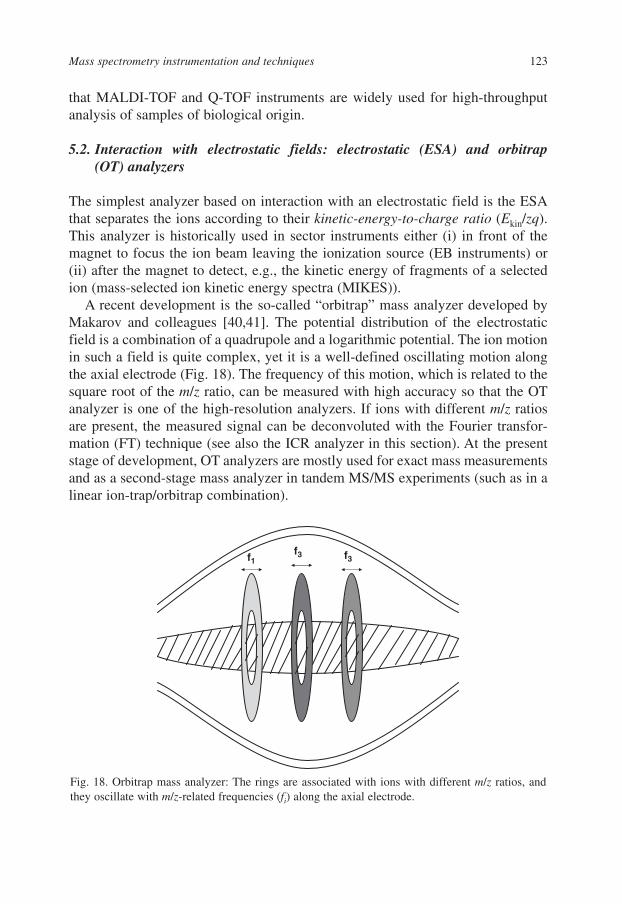
Mass spectrometry instrumentation and techniques 123
that MALDI-TOF and Q-TOF instruments are widely used for high-throughputanalysis of samples of biological origin.
5.2. Interaction with electrostatic fields: electrostatic (ESA) and orbitrap(OT) analyzers
The simplest analyzer based on interaction with an electrostatic field is the ESAthat separates the ions according to their kinetic-energy-to-charge ratio (Ekin/zq).This analyzer is historically used in sector instruments either (i) in front of themagnet to focus the ion beam leaving the ionization source (EB instruments) or(ii) after the magnet to detect, e.g., the kinetic energy of fragments of a selectedion (mass-selected ion kinetic energy spectra (MIKES)).
A recent development is the so-called “orbitrap” mass analyzer developed byMakarov and colleagues [40,41]. The potential distribution of the electrostaticfield is a combination of a quadrupole and a logarithmic potential. The ion motionin such a field is quite complex, yet it is a well-defined oscillating motion alongthe axial electrode (Fig. 18). The frequency of this motion, which is related to thesquare root of the m/z ratio, can be measured with high accuracy so that the OTanalyzer is one of the high-resolution analyzers. If ions with different m/z ratiosare present, the measured signal can be deconvoluted with the Fourier transfor-mation (FT) technique (see also the ICR analyzer in this section). At the presentstage of development, OT analyzers are mostly used for exact mass measurementsand as a second-stage mass analyzer in tandem MS/MS experiments (such as in alinear ion-trap/orbitrap combination).
f1f3 f3
Fig. 18. Orbitrap mass analyzer: The rings are associated with ions with different m/z ratios, andthey oscillate with m/z-related frequencies (fi) along the axial electrode.

124 Á. Somogyi
5.3. Interactions with a magnetic field: magnetic (B) analyzer
Historically, the magnetic analyzer was the first mass analyzer used, e.g., byThomson and Aston to separate isotopes of elements in the beginning of the twen-tieth century. The principle of separation is based on the Lorenzian force that actson a charged particle in a magnetic field (B) as a centripetal force so that a circu-lar motion with a radius of r is generated (Fig. 19):
(18)
Equivalently, Equation (18) can be written as:
(19)
Equation (19) indicates that the magnet separates ions according to theirmomentum-to-charge ratio.
The instrument geometry is fixed (i.e., r is constant) so that an ion with a givenm/z can be detected at a given and well-defined B. By changing the magnetic fieldin time, a mass spectrum with a defined m/z range can be obtained. By incorpo-rating the acceleration voltage (V ) and so the kinetic energy of an ion intoEquation (18), the mass-to-charge ratio can be written as:
(20)
Even though magnetic analyzers are now considered outdated and are notwidely used, it should be acknowledged that they played an important role inestablishing mass spectral fragmentation rules and also the theory of mass spec-tra (see, e.g., ref. [13]). The fading glory of magnetic sector mass analyzers isrelated to the fact that they are just too bulky and cannot compete with other high-resolution analyzers such as the OT and ICR mass analyzers.
mz
B r
V
2 2
2
Brmvzq
zqmv
r[ ]v B×
2
v
B
Fcp
Fcp = q [vxB]
Fig. 19. Circular motion of a charged species generated by a centripetal force (Fcp) in a magneticfield. B is perpendicular to the plane.
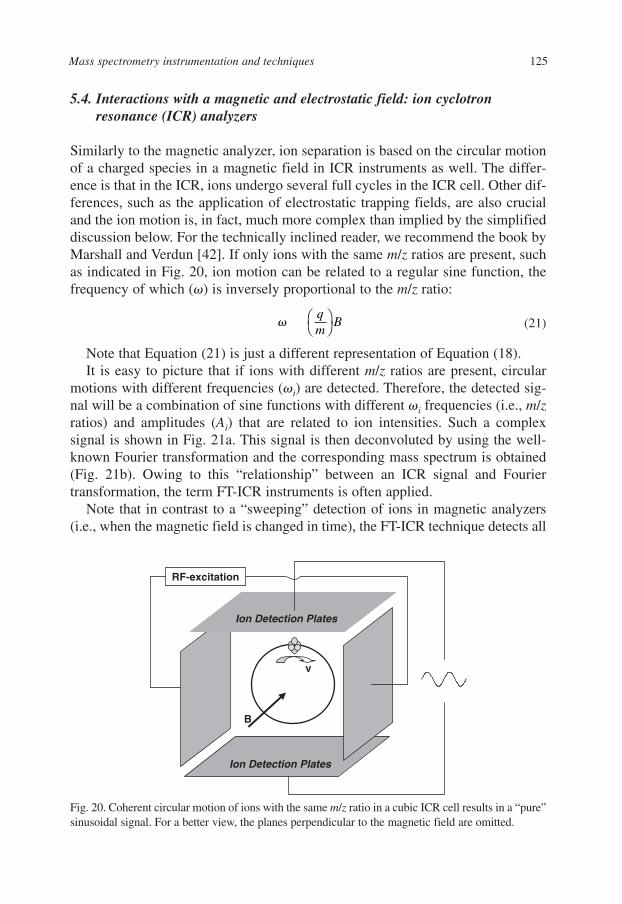
Mass spectrometry instrumentation and techniques 125
B
Ion Detection Plates
Ion Detection Plates
RF-excitation
v
Fig. 20. Coherent circular motion of ions with the same m/z ratio in a cubic ICR cell results in a “pure”sinusoidal signal. For a better view, the planes perpendicular to the magnetic field are omitted.
5.4. Interactions with a magnetic and electrostatic field: ion cyclotronresonance (ICR) analyzers
Similarly to the magnetic analyzer, ion separation is based on the circular motionof a charged species in a magnetic field in ICR instruments as well. The differ-ence is that in the ICR, ions undergo several full cycles in the ICR cell. Other dif-ferences, such as the application of electrostatic trapping fields, are also crucialand the ion motion is, in fact, much more complex than implied by the simplifieddiscussion below. For the technically inclined reader, we recommend the book byMarshall and Verdun [42]. If only ions with the same m/z ratios are present, suchas indicated in Fig. 20, ion motion can be related to a regular sine function, thefrequency of which (�) is inversely proportional to the m/z ratio:
(21)
Note that Equation (21) is just a different representation of Equation (18).It is easy to picture that if ions with different m/z ratios are present, circular
motions with different frequencies (�i) are detected. Therefore, the detected sig-nal will be a combination of sine functions with different �i frequencies (i.e., m/zratios) and amplitudes (Ai) that are related to ion intensities. Such a complexsignal is shown in Fig. 21a. This signal is then deconvoluted by using the well-known Fourier transformation and the corresponding mass spectrum is obtained(Fig. 21b). Owing to this “relationship” between an ICR signal and Fouriertransformation, the term FT-ICR instruments is often applied.
Note that in contrast to a “sweeping” detection of ions in magnetic analyzers(i.e., when the magnetic field is changed in time), the FT-ICR technique detects all
� qm
B⎛⎝
⎞⎠

126 Á. Somogyi
ions at the same time with high resolution and mass accuracy. A good analogy of anFT-ICR analysis is the identification of individuals outside a lecture room byrecording the noise behind a closed door with a microphone (or simply just by lis-tening). Assuming that everybody talks at the same time, deconvolution of the noisefrom the room could lead to the unambiguous identification of every individualfrom the outside (knowing, of course, their characteristic “voice” frequencies). Inthis respect, our ears are our best Fourier transformers. Obviously, the longer we lis-ten, the greater the reliability of identification. This is valid for ion-signal detectionas well: Longer transients in time provide us better mass resolution. To achievelonger detection time, one should maintain the ion trajectories close to the detectionplates, i.e., we should maintain ion velocities (v) unchanged for a reasonableamount of time. Ions can lose their velocities by colliding with residual gas mole-cules in the cell. Ultrahigh vacuum is, therefore, a requirement to achieve ultrahighresolution. Another requirement is a strong, stabile, and homogenous magnetic fieldthat is maintained by superconductive magnets. These requirements make FT-ICRinstruments more expensive than most other instruments.
The main power of FT-ICR instruments lies in the ultrahigh resolution and massaccuracy. Very complex mixtures, such as crude oil samples and protein digests (pep-tide mixtures), can be easily analyzed without separating the individual components
a
b c
194.1657
194.1154
C11H20N3
C9H16N5194.1405
C7H12N7
time (ms)
Fig. 21. (a) A detected 500 ms transient signal in an ICR cell, and (b) the corresponding mass spec-trum obtained by Fourier transformation, and (c) a small part of the spectrum around the nominalmass m/z 194, showing five different ions separated easily by the ultrahigh resolving power of theFT-ICR.

Mass spectrometry instrumentation and techniques 127
prior to mass analysis. Different ion-activation methods are also easily applicable sothat FT-ICR is widely used in tandem mass spectrometry (see Section 6).
5.5. Interaction with electromagnetic fields: quadrupole (Q) analyzers
As the name indicates, quadrupole mass analyzers consist of four parallel rods justas indicated in Fig. 22.
In a quadrupole mass analyzer, direct current (DC) and alternate current (AC)voltages are applied to the rods in such a way that two opposite rods have the samevoltage, while the perpendicular ones have a voltage with opposite sign (� and �,respectively). To be able to interact with this vibrating electromagnetic field inbetween the rods, the ions should enter the quadrupolar field with low velocity(e.g., with a few eV kinetic energy). Consequently, no high voltage (HV) is nec-essary to accelerate the ions before the mass analysis. This is particularly usefulwhen ESI or APCI is used as there is relatively high pressure in the source region(which may result in HV discharge).
Two opposite rods have positive potential except for a short period of time whenthe negative RF voltage exceeds the positive DC voltage (Fig. 22). Because of thisshort period of negative potential, only the lighter positively charged ions will bedefocused by these rods. This also means that these rods will focus only relativelylarge positively charged ions so that they can be considered as high mass filters. Withsimilar considerations, the other two rods will defocus the positively charged ionsmostof the timeandwill focusonly the lighter (positivelycharged) ionsduringashort
+
+
--
negative DC offset
positive DC offset
-DC
+DC
Fig. 22. Schematic representation of a quadrupole mass analyzer and a voltage profile on the rods. Ata particular AC and DC voltages, only the ion with a given m/z passes through the quadrupole field.
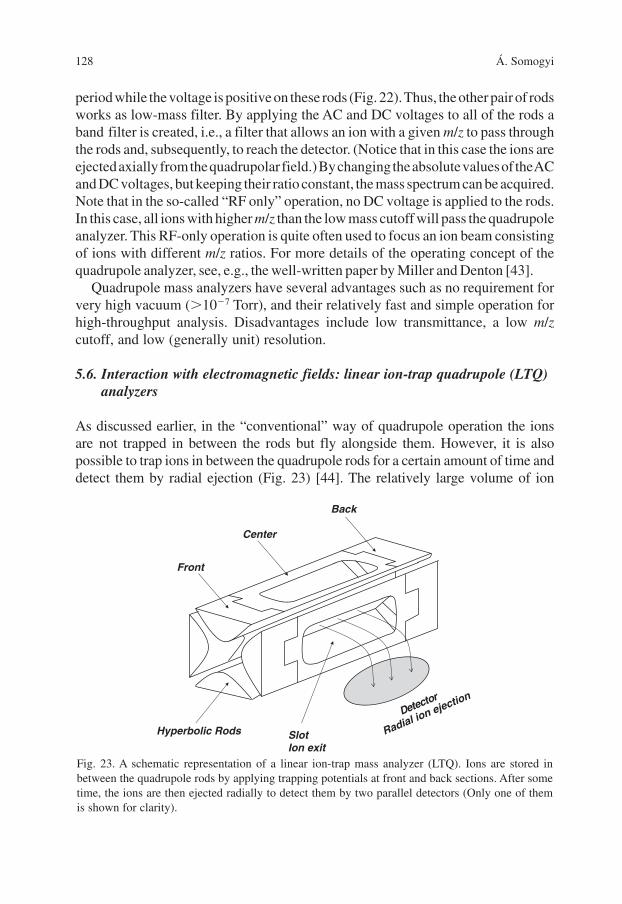
128 Á. Somogyi
period while the voltage is positive on these rods (Fig. 22).Thus, the other pair of rodsworks as low-mass filter. By applying the AC and DC voltages to all of the rods aband filter is created, i.e., a filter that allows an ion with a given m/z to pass throughthe rods and, subsequently, to reach the detector. (Notice that in this case the ions areejectedaxiallyfromthequadrupolar field.)Bychangingtheabsolutevaluesof theACand DC voltages, but keeping their ratio constant, the mass spectrum can be acquired.Note that in the so-called “RF only” operation, no DC voltage is applied to the rods.In this case, all ions with higher m/z than the low mass cutoff will pass the quadrupoleanalyzer. This RF-only operation is quite often used to focus an ion beam consistingof ions with different m/z ratios. For more details of the operating concept of thequadrupole analyzer, see, e.g., the well-written paper by Miller and Denton [43].
Quadrupole mass analyzers have several advantages such as no requirement forvery high vacuum (�10�7 Torr), and their relatively fast and simple operation forhigh-throughput analysis. Disadvantages include low transmittance, a low m/zcutoff, and low (generally unit) resolution.
5.6. Interaction with electromagnetic fields: linear ion-trap quadrupole (LTQ)analyzers
As discussed earlier, in the “conventional” way of quadrupole operation the ionsare not trapped in between the rods but fly alongside them. However, it is alsopossible to trap ions in between the quadrupole rods for a certain amount of time anddetect them by radial ejection (Fig. 23) [44]. The relatively large volume of ion
Detector
Radial ion ejection
Hyperbolic Rods SlotIon exit
Front
Center
Back
Fig. 23. A schematic representation of a linear ion-trap mass analyzer (LTQ). Ions are stored inbetween the quadrupole rods by applying trapping potentials at front and back sections. After sometime, the ions are then ejected radially to detect them by two parallel detectors (Only one of themis shown for clarity).

Mass spectrometry instrumentation and techniques 129
storage allows more ions to be trapped than in a conventional 3D-IT instrument(see the following text). This, together with the axial ion detection, significantlyincreases the sensitivity of ion detection. Therefore, LTQ mass analyzers are moreand more often used in areas where sensitivity is a crucial issue, such as pharma-cokinetics and proteomics (including, e.g., posttranslational modification studies).
5.7. Interaction with electromagnetic fields: three-dimensional quadrupoleion trap (3D QIT) analyzers
Historically, the 3D QIT analyzers have been developed before the linear iontraps. Their invention paved the road to small, bench-top mass spectrometers. Theoperational principle of a QIT is similar to that of the quadrupole even though theirphysical appearances are quite different. 3D QIT analyzers consist of three mainparts: the end cap, the entrance cap, and the inner ring (doughnut) (Fig. 24). Byapplying a RF field the ions can be oscillated in the trap (see a simplified illustra-tion in Fig. 24). The ion trajectories are stabilized by a buffer gas (most often He).By ramping the voltage, the ions are ejected out of the trap through the exit hole.Intuitively, it is easy to predict that this analyzer can store less ions and more ionsare lost during the ejection than in the LTQ instruments. Indeed, the 3D QIT is lesssensitive than the LTQ.
The 3D QIT instruments have played and still play a revolutionary role in high-throughput mass spectral analyses. They are literally “work horses” that canoperate in a “24/7” mode. Instrument maintenance is easy and not time-consuming.One disadvantage is that usually only unit resolution is achievable, but thisdrawback is overshadowed by the easy use for tandem MS/MS experiments (i.e.,structural investigation, including, e.g., peptide sequencing that is fundamental forproteomics studies).
Ionsfrom source
Ionsto detector
Ring electrode
Ring electrode
Entrance cap End cap
Hegas
Fig. 24. Main components of a 3D QIT and a characteristic ion trajectory in the trap.

130 Á. Somogyi
6. Tandem mass spectrometry (MS/MS)
Why do we need tandem mass spectrometry (MS/MS)? Is single stage MS not sat-isfactory? The rapid development of tandem MS/MS techniques have been trig-gered by the introduction of soft ionization techniques (most importantly ESI,nano-ESI, and MALDI). Soft ionization techniques usually provide intact, non-fragmenting ions that are crucial for molecular mass determination. However, amolecular mass (even an accurate one) does not provide enough information aboutthe structure of the compound, simply because of the possible existence of struc-tural isomers. For example, peptides of YAGFL and AFGLY have exactly the sameMW, yet they differ significantly in their sequence.
Tandem mass spectrometry is an invaluable analytical technique to obtainstructural information on originally stable, nonfragmenting ions. The main dif-ference between a single-stage MS and tandem MS/MS is illustrated in Fig. 25. Inthe regular MS mode, ions formed in the ionization source are separated by asingle-stage mass analyzer. The problem is that either the ions originating from thesource may represent molecular ions of certain components of a mixture or someof the lower m/z ions can be fragments of ions of larger m/z ratio (i.e., they can bein a precursor–fragment relation). Even if a separation technique (GC or HPLC) isused prior to ionization, coelution may occur so that ions formed in the source atthe same (retention) time may represent different components of a mixture. Withtandem mass spectrometry, however, any individual ion can be selected and thenactivated to generate fragments of the selected ion. These fragments are character-istic for the precursor ion structure. The fragments originating exclusively from theprecursor ion can then be analyzed separately with another mass analyzer. In short,there are three main steps in tandem mass spectrometry: (i) ion selection, (ii) ionactivation (fragmentation), and (iii) analysis of the fragments of the selected ion.
There are several tandem MS/MS instrument types available commercially.A detailed overview of these instrumentations and techniques is beyond
Ionization
Ionization Selection Activation Analysis
MS:
MS/MS:
Analysis
Collide withtarget to producefragments
Fig. 25. Single-stage MS and tandem MS/MS.

Mass spectrometry instrumentation and techniques 131
the scope of the book, but a brief classification and summary are providedhere.
Tandem MS/MS experiments can be performed either (i) in space (just asillustrated in Fig. 25) or (ii) consecutively in time in trapping analyzers. In the lattercase, every step of a tandem mass spectrometry measurement (ion selection, ionactivation, and fragment analysis) occurs in the same trap (i.e., same space but at dif-ferent time). The great advantage of trapping instruments is that these steps can beconsecutively repeated many times so that we can get structural information on thesecond, third, and, in general, the nth generations of fragments (MSn techniques).
Depending on the resolving power of the first mass analyzer, ions can beselected either monoisotopically or with multiple isotopes. For practical reasons,and to improve sensitivity, multiple isotope selections (i.e., 2–3 m/z units) arepreferred, especially for automated runs.
The main purpose of the ion-activation step is to provide additional internalenergy to the originally “cold” ions that have not enough internal (vibrational)energy to fragment within the timescale of the instrument. As summarized inTable 1, this goal can be achieved in different ways, but all of them are related to
Table 1
Abrief summary of ion-activation methods commonly used in tandem mass spectrometry experiments
Activation Modes and Number of Amount of internal energypartner instruments collisions deposited and dominant
fragmentation processes
Gas (He, Ar, Xe) Low energy (eV)QQQ Several Medium energyQIT, LTQ Multiple Low energySustained off- Multiple Low to medium energyresonanceirradiation(SORI-CID) in FT-ICR
High energy (keV)TOF–TOF Single High energySector–TOF Single High energy
Photon IRMPD (QIT, FT-ICR) Multiple Low energyBIRD (FT-ICR) Multiple Low energy
Low-energy ECD (FT-ICR) Single Low energyelecron
Low-energy anion ETD (LTQ) Single Low energy
Surface eV SID Single High energy, withrelatively narrowdistribution
Q-SID-QSector–TOFFT-ICRkeV SID SIMS

132 Á. Somogyi
collisions of the selected ions. The colliding partner most often is a gas (gas-phase collision-induced dissociation, CID [5,45], including sustained off-resonance irradiation-CID, SORI-CID in FT-ICR instruments [46]), but it may bea photon (photodissociation [47], infrared multiphoton dissociation (IRMPD)[48–51], or blackbody irradiative dissociation (BIRD) [52–53]), a low-energyelectron (electron capture dissociation (ECD) [54–56]), a negatively chargedanion (electron transfer dissociation (ETD) [57]), or a surface (surface-induceddissociation, SID [58–60]). The extent of fragmentation depends on the amountand distribution of internal energy deposited to the selected ions: As intuitivelyexpected, more internal energy triggers more extensive fragmentation. For furtherdetails of the internal energy distribution and its influence on fragmentation, see,e.g., the books by Cooks et al. [13], Forst [14], and Beynon and Gilbert [12], aswell as a detailed tutorial by Vékey [15].
Ion activation can also be classified as low- (eV) or high-energy (keV) colli-sions. In this case, the laboratory collision energy is used for guidance, but itshould be noted that only the so-called “center of mass” energy is available forthe kinetic-to-internal-energy (T → V ) transfer. Another way of grouping ion-activation methods is to consider the number of collisions so that we can talk aboutsingle or multiple collision conditions. These are also indicated in Table 1.
The final appearance of a tandem MS/MS spectrum depends not only on themode of ion activation (high vs. low internal energy deposition) but also on thetime lag between ion activation and the recording of the fragmentationspectrum. This can easily be understood if one accepts that ion fragmentation isassumed to be unimolecular after ion activation: As expected, a longer time gapleads to more fragments. The main practical conclusion is that tandem MS/MSspectra of the same precursor ion can be quite different if they are acquired indifferent instrument configurations. This is well illustrated in Fig. 26 for proto-nated N-acetyl OMe proline [61]. In an ion-trap instrument, where the internalenergy is deposited in small increments by multiple collisions, only low-energyprocesses, such as the loss of methanol (CH3OH) and a subsequent loss of CO,are observed. On the contrary, when the internal energy is deposited in one step(CID in QQQ and SID in Q-TOF), the high-energy process of the ketene lossbecomes a competitive channel and the corresponding fragment ion at m/z 130is clearly detected. Despite this dependence on experimental conditions, tandemMS/MS spectra can be reasonably compared if obtained under similar instru-mental conditions.
The tandem MS/MS spectra shown in Fig. 26 are typical “product ion” spectra.In most tandem MS/MS applications this scan mode is used to obtain structuralinformation of a selected (precursor) ion. A variation of product ion scans are usedalso in multiple reaction monitoring (MRM), which is a useful technique for quan-titation and kinetic studies (see the following text). Other MS/MS scan types arealso applied even though not all of them are easily available in all tandem MS/MS

Mass spectrom
etry instrumentation and techniques
133
172
140
112
a)
MH+
[MH
-CH
3OH
]+
[MH
-CH
3OH
-CO
]+
ITCID (He)16% relative energy
P70
130
140
112b)
172MH+
[MH
-CH
2=C
=O]+
[MH
-CH
3OH
]+
[MH
-CH
3OH
-CO
]+
QQQCID (Ar) 13 eV
MH+
[MH
-CH
3OH
-CO
]+
P70
112
130
140
c)
Q-TOFSID13 eV
[MH
-CH
3OH
]+
[MH
-CH
2=C
=O]+
Fig. 26. Tandem MS/MS spectra of protonated N-acetyl OMe proline obtained using different ion-activation methods and instruments, such as gas-phase collisional activation in (a) a Thermoelectron (Finnigan) LCQ classic 3D QIT instrument, (b) a Thermoelectron (Finnigan) triple quadrupole(QQQ) instrument, and (c) surface-induced dissociation (SID) in a Micromass Q-TOF instrument.

134 Á. Somogyi
Table 2
MS/MS scan modes applicable in a triple quadrupole instrument (QQQ)
Scan modes Quadrupole 1 (Q1) Quadrupole 2 (Q2) Quadrupole 3 (Q3)
Product ion Select a desired Ion activation/ Scan for fragmentsm/z dissociation of m/z
Precursor ion Scan for parents of Ion activation/ Select and monitor a given fragment, F dissociation fragment, F
Neutral loss Scan Ion activation/ Scan with shift ofdissociation mass of the neutral
Selected/multiple Select a desired m/z Ion activation/ Select and monitor reaction monitoring dissociation desired fragment(s)(SRM or MRM)Ion–molecule Select a desired m�z Ion–molecule Scan for reaction
reactions products
instruments. For easier understanding, these scan modes are summarized in Table 2for a triple quadrupole (QQQ) instrument.
In precursor ion scan mode, all precursors that form a given fragment ion (F) aredetected. In this mode, the second quadrupole is set to the given m/z value of the frag-ment ion and the first quadrupole is scanned so that the software can reconstruct theprecursor ion spectrum. In other words, the software “finds” those precursor ions fromwhich a given fragment is formed. In the neutral loss scan both the first and the sec-ond quadrupoles are scanned in a synchronized way, i.e., their scans are “shifted” bythe desired mass of the neutrals (e.g., by 18 for water or by 80 (HPO3) for protein phos-phorylation studies). Neutral loss measurements are, therefore, especially useful fordetection of laboratory (or natural) modifications of an analyte. If higher sensitivity isdesired, the second quadrupole is not scanned over a wide mass range of the fragmentsbut, instead, it is set up to monitor only a selected fragment or fragments (SRM orMRM scans). Finally, we note that tandem mass spectrometry can also be used forstudying ion–molecule reactions, i.e., when a selected ion reacts in the “collision cell”(second quadrupole, or in general, in any trapping analyzer). Specific examples forion–molecule reactions include hydrogen/deuterium (H/D) exchange studies orreactions of multiply charged (positive) ions with anions in a linear ion trap (chargetransfer dissociation (CTD)). These ion–molecule reactions are particularly useful todistinguish between structural isomers of ions with the same chemical formula.
Throughout this book the readers can find beautiful examples for the applicationof tandem MS/MS. Although many good instruments are available commercially,there is no “ideal” or “perfect” instrument for general use. Depending on the appli-cation, different instruments may have ideal performance. We encourage the readerto carefully choose an instrument that is the best for his/her needs. Hopefully, theinformation and discussion presented in this chapter will help the reader in makingthe best choice.

Mass spectrometry instrumentation and techniques 135
7. Selected terms for clarification
The author of this chapter takes the freedom to explain a few selected terms that—based on his teaching experience—are often not well understood and may even bemisused. Although this is not an exhaustive list, clarification of these terms mayhelp in reading the whole book more comprehensively by readers whose primaryexpertise is not in mass spectrometry. For a detailed guidance of terminology, werefer again to the book by Sparkman [1].
Nominal mass is the integer mass of the most abundant naturally occurringstable isotope of an element. As a consequence, the nominal mass of an ion is thesum of the nominal masses of the elements in the empirical formula (for the ace-tone molecular ion the formula is C3H6O
��; thus, the nominal mass is 58). This,sometimes, is mistaken with the average molecular mass that is also commonlyused, e.g., by synthetic chemists. In the average molecular mass, average atomicmasses are used: the accurate atomic masses of various isotopes, weighted by theirnatural abundance. For example, the average atomic weights of chlorine andbromine are 35.5 and 80 Da, respectively. Nonetheless, in mass spectral analysisof common organic molecules these average masses are never measured. Instead,each isotope is observed, in the case of the above-mentioned case of chlorine anion pair corresponding to 35Cl and 37Cl, while in the case of bromine those relatedto 79Br and 81Br.
Accurate mass is the experimentally measured mass of an ion that is preciseenough to determine its elemental composition, e.g., has at least 5 ppm accuracy.This accuracy can easily be achieved in the m/z range of 1–3000 Da by using var-ious commercially available mass spectrometers, such as sectors, TOF, QTOF,OT, or FT-ICR instruments. For accurate mass measurements, appropriately cho-sen internal standards are required. In a general procedure, the analyte ion isbracketed by two internal standard ions, the m/z values of which are known withvery high accuracy. The spectrum obtained with the internal standard is then recal-ibrated by using the standard m/z values of the internal standard ions (“peakmatching” technique). A wide variety of internal standards can be used. The mostcommonly applied ones include perfluoro kerosene (PFK) for EI ionization andpolyethylene (PEG) or polypropylene (PPG) glycol in FAB (LSIMS), ESI, andMALDI measurements. The use of peptide internal standards is also common inaccurate mass measurements by ESI and MALDI.
Although they are related, the measured accurate mass should be distinguishedfrom the calculated exact mass, which is the mass determined by summing theexact isotope masses of the elements present in a particular ion. For example, thecalculated exact mass of 12C3
1H616O�� (acetone molecular ion) is 58.0419 Da, and
a measured accurate mass could, for example, be 58.0416 Da, which correspondsto a �5.2 ppm error. In this calculation, the following atomic (isotopic) exactmasses are used: 12C: 12.0000 Da, 1H: 1.007825 Da, and 16O: 15.9949 Da. (For

136 Á. Somogyi
374 376 378 380 3820
20
40
60
80
100
Rel
ativ
e In
tens
ity
m/z
3570 3572 3574 3576 35780
20
40
60
80
100
Rel
ativ
e In
tens
ity
m/z
a
b
374.4183 (average mass)
374.2040 (exact mass)
3570.8741 (exact mass)
3572.9742 (average mass)
0 2000 4000 6000 8000012345678
Dev
ianc
e fr
om n
omin
al m
ass
(dal
ton)
m/z
c
[Ala5+H]+
[Ala50+H]+
exact mass
average mass
C15H28O6N5
C150H253O51N50
Fig. 27. Calculated isotope pattern distribution of singly protonated (a) Ala5, and (b) Ala50, and (c) the calculated deviance between the nominal mass, the exact mass of the first isotope peak, andthe average mass for singly protonated polyalanines as a function of the nominal mass.
accurate isotope masses and an exact mass calculator program, see, e.g., the websites www.sisweb.com/referenc/source/exactmaa.htm and www.sisweb.com/referenc/tools/exactmass.htm, respectively.)
Fig. 27 illustrates the differences between nominal, exact, and average masses for singly protonated alanine oligomers: [(Ala)5 � H]� and [(Ala)50 � H]�.When the nominal ion mass is relatively small (e.g., around 400 Da), thenominal, exact, and average masses do not differ significantly (Fig. 27a and c).However, with increasing masses, differences between the nominal, exact, andaverage masses become more and more significant that should be accounted for(Fig. 27b and c). If, for example, the resolution of a mass spectrometer is notgood enough to separate individual isotopes, the measured peak will provideonly an “envelope” of the isotope distribution from which the average mass ofthe ion can be approximately determined (see solid curve line in Fig. 27b).
Resolution of a mass spectrometer is related to the ability of a mass analyzer toseparate two ions with different m/z ratios. The resolution is defined as R M/�M,where M is a given mass and �M is the difference between the given mass and theneighboring mass peak with, for example, 10% peak height (see Fig. 28).
The terms “low resolution” and “high resolution” are often misused meaning“not accurate mass/survey” and “accurate mass” measurements, respectively. High

Mass spectrometry instrumentation and techniques 137
resolution is only a prerequisite for accurate mass measurements in which the useof internal standards with precisely known ion masses and a stable mass scale orcalibration of the instrument are required.
Acknowledgment
The author greatly appreciates the careful reading and comments by Drs. RonaldWysocki (Director of Chemical Synthesis Laboratory, Department of Chemistry,University of Arizona) and Linda Breci (Associate Director of the ProteomicsConsortium, Department of Chemistry, University of Arizona).
References
1. Sparkman, O.D., Mass Spectrometry Desk Reference. Global View Publishing, Pittsburg, PA,2000.
2. Watson, J.T., Introduction to Mass Spectrometry (3rd edition). Lippincott-Raven Publishers,Philadelphia, New York, 1997.
3. Chapman, J.R., Practical Organic Mass Spectrometry (2nd edition). John Wiley & Sons,New York, 1985.
4. Gross, J.H., Mass Spectrometry. A Textbook. Springer Verlag, Berlin, Heidelberg, New York,2004.
5. Busch, K.L., Glish, G.L. and McLuckey, S.A., Mass Spectrometry/Mass Spectrometry:Techniques and Applications of Tandem Mass Spectrometry. VCH Publishers, Berlin, 1989.
6. McLafferty, F.W. and Turecek, F., Interpretation of Mass Spectra (4th edition). UniversityScience Books, Mill Valley, CA, 1993.
Fig. 28. Resolution of a mass spectrometer: The presented ion separation is related to a resolutionof 1000 (at 10% valley).

138 Á. Somogyi
7. Siuzdak, G., Mass Spectrometry for Biotechnology. Academic Press, San Diego, CA, 1996.8. Liebler, D.C., Tools for the New Biology. Introduction to Proteomics. Humana Press, Totova,
NJ, 2002.9. Baer, T., Ng, C.-Y. and Powis, I. (Eds.), Large Ions: Their Vaporization. Detection and
Structural Analysis. John Wiley & Sons, Chichester, UK, 1996.10. McMaster, M. and McMaster, C., GC/MS: A Practical User’s Guide. Wiley-VHC, New York,
NY, 1998.11. Ardrey, R.E., Liquid Chromatrography Mass Spectrometry: An Introduction. John Wiley &
Sons, Chichester, UK, 2003.12. Beynon, J.H. and Gilbert, J.R., Application to Transition State Theory to Unimolecular
Reactions. An Introduction. John Wiley & Sons, Chichester, UK; New York, NY, 1984.13. Cooks, R.G., Beynon, J.H., Caprioli, R.M. and Lester, G.R., Metastable Ions. Elsevier,
Amsterdam, 1973.14. Forst, W., Theory of Unimolecular Reactions. Academic Press, London, UK, 1973.15. Vékey, K., Internal energy effects in mass spectrometry. J. Mass Spectrom., 31, 445–463 (1998).16. Drahos, L. and Vékey, K., MassKinetics: a theoretical model of mass spectra incorporating
physical processes, reaction kinetics and mathematical descriptions. J. Mass Spectrom., 36,237–263 (2001).
17. Harrison, A.G., Chemical Ionization Mass Spectrometry. CRC Press, Boca Raton, FL, 1983.18. Meot-Ner (Mautner), M., The proton affinity scale, and effects of ion structure and salvation.
Int. J. Mass Spectrom., 227, 525–554 (2003).19. Fenselau, C. and Cotter, R.J., Chemical aspects of fast atom bombardment. Chem. Rev., 87,
501–512 (1987).20. Doyle, M., Mack, L.L., Hines, R.L., Mobley, R.C., Ferguson, L.D. and Alice, M.B., Molecular
beams of macroions. J. Chem. Phys., 49, 2240–2249 (1968).21. Fenn, J.B., Mann, M., Meng, C.L., Wong, S.F. and Whitehouse, C.M., Electrospray ionization
for mass-spectrometry of large biomolecules. Science, 246, 64–71 (1989).22. Fenn, J.B., Mann, M., Meng, C.K., Wong, S.F. and Whitehouse, C.M., Electrospray ionization—
principles and practice. Mass Spectrom. Rev., 9, 37–70 (1990).23. Cole, R. (Ed.), Electrospray Ionization Mass Spectrometry: Fundamentals, Instrumentation,
and Applications. John Wiley & Sons, New York, NY, 1997.24. Znamenskiy, V., Marginean, I. and Vértes, A., Solvated ion evaporation from charged water
nanodroplets. J. Phys. Chem. A, 107, 7406–7412 (2003).25. Marginean, I., Nemes, P., Parvin, L., and Vértes, A., How much charge is there on a pulsating
Taylor cone? Appl. Phys. Lett., 89, 064104 (2006).26. Marginean, I., Nemes, P. and Vértes, A., Order-chaos-order transitions in electrosprays: the
electrified dripping faucet. Phys. Rev. Lett., 97, 064502 (2006).27. McKay, A.R., Ruotolo, B.T., Ilag, L.L. and Robinson, C.V. Mass measurements of increased
accuracy resolve heterogeneous populations of intact ribosomes. J. Am. Chem. Soc., 128,11433–11442 (2006).
28. Jones, C.M., Beardsley, R.L., Galhena, A.S., Dagan, S., Cheng, G. and Wysocki, V.H.,Symmetrical gas-phase dissociation of noncovalent protein complexes via surface collisions.J. Am. Chem. Soc., 128, 15044–15045 (2006).
29. Takáts, Z., Wiseman, J.M., Gologan, B. and Cooks, R.G., Mass spectrometry sampling underambient conditions with desorption electrospray ionization. Science, 306, 471–473 (2004).
30. Cody, R.B., Laramée, J.A. and Durst, H.D., Versatile new ion source for the analysis of mate-rials in open air under ambient conditions. Anal. Chem., 77, 2297–2302 (2005).
31. Wang, G., Hsieh, Y. and Korfmacher, W.A., Comparison of atmospheric pressure chemicalionization, electrospray ionization, and atmospheric pressure photoionization for the determi-nation of cyclosporin A in rat plasma. Anal. Chem., 77, 541–548 (2005).

Mass spectrometry instrumentation and techniques 139
32. Tanaka, K., Waki, H., Ido, Y., Akita, S., Yoshida, Y. and Yoshida, T., Protein and polymeranalyses up to m/z 100000 by laser desorption ionization time-of-flight mass spectrometry.Rapid Commun. Mass Spectrom., 2, 151–153 (1988).
33. Karas, M. and Hillenkamp, F., Laser desorption ionization of proteins with molecular massesexceeding 10000 daltons. Anal. Chem., 60, 2299–2301 (1988).
34. Dashtiev, M., Frankevich, V. and Zenobi, R., Kinetic energy of free electrons affects MALDIpositive ion yield via capture cross-section. J. Phys. Chem. A, 110, 926–930 (2006).
35. Vértes, A., Luo, G., Ye, L., Chen, Y. and Marginean, I., Laser pulse length dependence ofinternal energy transfer in UV-MALDI-MS. Appl. Phys. A., 79, 823–825 (2004).
36. Go, E.P., Apon, J.V., Luo, G., Saghatelian, A., Daniels, R.H., Sahi, V., Dubrow, R., Cravatt,B.F., Vértes, A. and Siuzdak, G., Desorption/ionization on silicon nanowires. Anal. Chem., 77,1641–1646 (2005).
37. Wei, J., Buriak, J.M. and Siuzdak, G., Desorption/ionization mass spectrometry on porous silicon. Nature, 399, 243–246 (1999).
38. Yanes, O., Nazabal, A., Wenzel, R., Zenobi, R. and Aviles, F.X., Detection of noncovalentcomplexes in biological samples by intensity fading and high-mass detection MALDI-TOFmass spectrometry. J. Proteome Res., 5, 2711–2719 (2006).
39. Cotter, R.J., Time-of-Flight Mass Spectrometry: Instrumentation and Applications inBiological Research. (ACS Professional Reference Books). American Chemical Society,Washington D.C., 1997.
40. Makarov, A., Electrostatic axially harmonic orbital trapping: a high performance technique ofmass analysis. Anal. Chem., 72, 1156–1162 (2000).
41. Hu, Q. and Noll, R.J., Li, H., Makarov, A., Hardman, M. and Cooks, R.G., The orbitrap: a newmass spectrometer. J. Mass Spectrom., 40, 430–443 (2005).
42. Marshall, A.G. and Verdun, F.R., Fourier Transforms in NMR, Optical, and Mass Spectrometry.Elsevier, Amsterdam, 1990.
43. Miller, P.E. and Denton, M.B., The quadrupole mass filter: basic operational concepts. J. Chem. Ed., 63, 617–623 (1986).
44. Hager, J.W., A new linear ion trap mass spectrometer. Rapid Commun. Mass Spectrom., 16,512–526 (2002).
45. Senko, M.W., Speir, J.P. and McLafferty, F.W. Collisional activation of large multiply-chargedions using Fourier-transform mass-spectrometry. Anal. Chem., 66, 2801–2808 (1994).
46. Gauthier, J.W., Trautman, T.R. and Jacobson, D.B., Sustained off-resonance irradiation forcollision-activated dissociation involving Fourier-transform mass-spectrometry—collision-activated dissociation technique that emulates infrared multiphoton dissociation.Anal. Chim. Acta, 246, 211–225 (1991).
47. Bowers, W.D., Delbert, S.S. and McIver, R.T., Consecutive laser-induced photodissociation asa probe of ion structure. Anal. Chem., 58, 969–972 (1986).
48. Little, D.P., Speir, J.P., Senko, M.W., O’Connor, P.B. and McLafferty, F.W., Infrared multi-photon dissociation of large multiply-charged ions for biomolecule sequencing. Anal. Chem.,66, 2809–2815 (1994).
49. Woodin, R.L., Bomse, D.S. and Beauchamp, J.L., Multiphoton dissociation of molecules withlow-power continuous wave infrared-laser radiation. J. Am. Chem. Soc., 100, 3248–3250 (1978).
50. Flora, J.W. and Muddiman, D.C., Determination of the relative energies of activation for thedissociation of aromatic versus aliphatic phosphopeptides by ESI-FT-ICR-MS and IRMPD. J. Am. Soc. Mass Spectrom., 15, 121–127 (2004).
51. Zhang, J., Schubothe, K., Li, B., Russell, S. and Lebrilla, C.B., Infrared multiphoton ioniza-tion of O-linked mucin-type olicosaccharides. Anal. Chem., 77, 208–214 (2005).
52. Dunbar, R.C. and McMahon, T.B., Activation of unimolecular reactions by ambient blackbodyradiation. Science, 279, 194–197 (1998).

140 Á. Somogyi
53. Price, W.D., Schnier, P.D. and Williams, E.R., Tandem mass spectrometry of large biomole-cule ions by blackbody infrared radiative dissociation. Anal. Chem., 68, 859–866 (1996).
54. McLafferty, F.W., Horn, D.M., Breuker, K., Ge, Y., Lewis, M.A., Cerda, B., Zubarev, R.A.and Carpenter, B.K., Electron capture dissociation of gaseous multiply charged ions byFourier-transform ion cyclotron resonance. J. Am. Soc. Mass Spectrom., 12, 245–249 (2001).
55. Zubarev, R.A., Kelleher, N.L. and McLafferty, F.W., Electron capture dissociation of multiplycharged protein cations. A nonergodic process. J. Am. Chem. Soc., 120, 3265–3266 (1998).
56. Zubarev, R.A., Horn, D.M., Fridriksson, E.K., Kelleher, N.L., Kruger, N.A., Lewis, M.A.,Carpenter, B.K. and McLafferty, F.W., Electron capture dissociation for structural characteri-zation of multiply charged protein cations. Anal. Chem., 72, 563–573 (2000).
57. Syka, J.E.P., Coon, J.J., Schroeder, M.J., Shabanowitz, J. and Hunt, D.F., Peptide and proteinsequence analysis by electron transfer dissociation mass spectrometry. Proc. Acad. Natl. Sci.U.S.A., 101, 9528–9533 (2004).
58. Mabud, Md. A., DeKrey, M.J. and Cooks, R.G., surface-induced dissociation of molecularions. Int. J. Mass Spectrom. Ion Proc., 67, 285–294 (1985).
59. Dongré, A.R., Somogyi, Á. and Wysocki, V.H., Surface-induced dissociation: an effective toolto probe structure, energetics and fragmentation mechanisms of protonated peptides. J. MassSpectrom., 31, 339–350 (1996).
60. Laskin, J. and Futrell, J.H., Activation of large ions in FT-ICR mass spectrometry. MassSpectrom. Rev., 24, 135–167 (2005).
61. Komáromi, I., Somogyi, Á. and Wysocki, V.H., Proton migration and its effect on the MSfragmentation of N-Acetyl OMe Proline: MS/MS experiments and ab initio and densityfunctional calculations. Int. J. Mass Spectrom., 241, 315–323 (2005).

Medical Applications of Mass SpectrometryK. Vékey, A. Telekes and A. Vertes (editors)© 2008 Elsevier B.V. All rights reserved
141
Chapter 7
Chemoinformatics—multivariatemathematical–statistical methods for data evaluation
KÁROLY HÉBERGER*
Chemical Research Center, Hungarian Academy of Sciences, Budapest, Hungary
1. Introduction 1412. Data types and data pretreatment 143
2.1. Data types 1432.2. Arrangement of data 1442.3. Data pretreatment 145
3. Multivariate methods 1463.1. Principal component analysis (PCA) 1483.2. Cluster analysis (CA) 1493.3. Multiple linear regression (MLR) 1513.4. Linear discriminant analysis (LDA) and canonical correlation
analysis (CCA) 1523.5. Partial least squares projection of latent structures (PLS) 1543.6. Classification and regression trees (CART) 1563.7. Artificial neural networks (ANN) 1573.8. Some methods of variable selection 158
4. Selected applications of chemometrics 162Terms and terminology 164References 166
1. Introduction
Chemometrics, or chemoinformatics, was established at the beginning of the 1970sby Svante Wold, Bruce L. Kowalski, and D.L. Massart. The term ‘chemometrics’was first coined by S. Wold, who applied for funding from the government of
*Tel.: �361 438 1103; Fax: �361 438 1143. E-mail: [email protected] (K. Héberger).

142 K. Héberger
Sweden and thought it would be much easier to receive it for a new discipline.Since then a lot of definitions of chemometrics have been proposed. We apply herethe definition given in Chemometrics and Intelligent Laboratory Systems—theleading journal in the field:
Chemometrics is the chemical discipline that uses mathematical, statistical,and other methods employing formal logic to design or select optimal meas-urement procedures and experiments, and to provide maximum relevantchemical information by analyzing chemical data.
Despite the advent of disciplines such as biometrics, chemometrics is not dyingout; on the contrary, it achieved maturity around the millennium.
The features of the chemometric approach can perhaps be best understood bycomparing it with the classical approach. The classical approach aims to understandeffects—which factors are dominant and which ones are negligible—whereasthe chemometric approach gives up the necessity to understand the effects, andpoints out other aims such as prediction, pattern recognition, classification, etc.
The classical approach is reductionist, one factor examined at a time; the effectsare separated as much as possible. The chemometrics approach uses multivariatemethods, i.e., all variables are considered at the same time. In this way, the modelis fit to the data. When building a model to fit the data, the conclusions should bein harmony with the information present in the data. This is sharply different fromthe classical approach, where the model is derived from theory and the data aresearched to show the validity of the model. For many scientists, the theory is thenonplus ultra; it cannot be criticized. They can rather measure what should be meas-ured according to the theory. In this way, however, the conclusions drawn may be incontradiction with the information present in the data.
As a result, the classical approach determines new (causal) relationship(s) anddiscovers new natural laws, whereas the chemometric approach finds usually aformal relationship, which has the elements of causality. Moreover, prediction andclassification are possible by applying these “formal” models.
Naturally the classical approach has the advantage of being successful,accepted, and well based; the constants in the models have definite physical sig-nificance. The disadvantage, however, is that the factors are correlated and theireffects cannot be separated. Nature is not orthogonal unlike the mathematicaldescription. The advantage of the chemometric approach is that correlationsamong variables can be utilized. The disadvantage is that the constants in modelsdo not necessarily have physical relevance.
As can be seen, the two approaches are complementary. The modern, newerapproach cannot be substituted by the older, classical one and vice versa. Thechemometric approach simply provides information not otherwise accessible.
Two new ideas have to be introduced before going into details: prediction andpattern recognition.

Data evaluation by multivariate methods 143
Prediction means declaration in advance, especially foretelling on the basis ofobservation, experience, or scientific reason. Prediction concerns not only tempo-ral processes but also, for example, the toxicity of a compound on the basis ofsimilar compounds. Even if you do not have a causal model, prediction is valuableusing black box models.
Pattern recognition is to unravel patterns in the data. Although patterns are per-ceived automatically, the process is difficult to define: A pattern is a natural orchance configuration, reliable sample of traits, tendencies, or other observablecharacteristics of data. In chemometrics, patterns are usually simplified to group-ings (clusters) and outliers.
Consider the blood test of healthy and ill patients. If you consider one featureat a time, all features may be within the given limits of healthiness but still apatient might be ill. On the contrary, some of the healthy patients can provideextreme values. If you consider large number of patients and all features at once,usually the healthy and ill patients can be distinguished using multivariatechemometric methods.
2. Data types and data pretreatment
2.1. Data types
It is expedient to distinguish the variables on the basis of three scales: nominal,ordinal, and numeric.
The nominal scales are categorical in nature, i.e., qualitative only. They can bemeasured only in terms of whether the individual items belong to somedistinctively different categories, but we cannot quantify or even rank order thosecategories. Each category is “different” from others but cannot be quantitativelycompared to others. Two kinds of nominal scales are differentiated: binary andgrouping scales. The binary scales can have only two values (e.g., yes or no, zeroor one, ill or healthy, etc.). Group scales can have several categories (e.g., integernumbers or strings are assigned to groups, e.g., several types of cancer or seasonaldifferences—spring, summer, winter, etc.—can be distinguished).
The ordinal scales are also qualitative, but they can rank (order) the itemsmeasured in terms of which has less and which has more of the quality representedby the variable, but still they do not allow us to say “how much more.” A typicalexample of an ordinal variable is the toxicity: A compound can be classified ashighly toxic, moderately toxic, hardly toxic, or nontoxic. Although the compoundscan be ordered according to the toxicity, how much more toxic they are cannot beestablished. The ordinal scale provides more information than nominal scale, but“how much more” cannot be established.

144 K. Héberger
The numerical scale is quantitative in nature. This scale of measurementallows us not only to rank the items that are measured but also to quantify andcompare the sizes of differences between them. Some authors distinguish inter-val and ratio scales, whether an absolute zero point is defined or not, but this isnot mandatory. For example, the temperature measured in Celsius is on aninterval scale, whereas in Kelvin it is on a ratio scale. Interval scales do not havethe ratio property.
2.2. Arrangement of data
One single number, called a scalar, is not appropriate for data analysis.
Vectors: A series of scalars can be arranged in a column or in a row. Then, theyare called a column or a row vector. If the elements of a column vector can beattributed to special characteristics, e.g., to compounds, then data analysis can becompleted. The chemical structures of compounds can be characterized withdifferent “numbers” called descriptors, variables, predictors, or factors. Forexample, toxicity data were measured for a series of aromatic phenols. Theirtoxicity can be arranged in a column arbitrarily: Each row corresponds to aphenolic compound. A lot of descriptors can be calculated for each compound(e.g., molecular mass, van der Waals volume, polarity parameters, quantum chem-ical descriptors, etc.). After building a multivariate model (generally one variablecannot encode the toxicity properly) we will be able to predict toxicity values forphenolic compounds for which no toxicity has been measured yet. The above ap-proach is generally called searching quantitative structure – activity relationships orsimply QSAR approach.
Matrices: Column vectors when put one after one form a matrix. Generally twokinds of matrices can be distinguished denoted by X and Y. The notation X is usedfor the matrix of independent variables. The notation Y is used for the matrix ofdependent variables; their values are to be predicted. If we can arrange our datainto one (X ) matrix, still we can unravel patterns in the data in an unsupervisedway, i.e., we do not use the information of groupings present in the data. Suchmatrices are suitable for a principal component analysis (PCA).
Matrices (arrays) can be multidimensional; three-dimensional matrices are alsocalled tensors. Analysis of tensors is frequently called 3-way analysis. Typicalexample is the data from a hyphenated technique, e.g., gas chromatography–massspectrometry (GC–MS) data; one direction (way) is the mass spectrum, seconddirection is the chromatographic separation (time, scan), and the third direction isthe samples (of different origin, repetitions, calibration series, etc.). The 3-wayanalyses can easily be generalized into n-way analysis including more directions.

Data evaluation by multivariate methods 145
3-Way analyses require routine use of matrix operations; besides this, they canbe unfolded into 2-way arrays (matrices). Therefore, we deal with analysis ofmatrices further on.
2.3. Data pretreatment
The data are arranged in a matrix form; the column vectors are called variablesand the row vectors are called mathematical–statistical cases (objects or samples):
(1)
with m columns and n rows, j 1, 2, . . . , m and i 1, 2, . . . , n, respectively.Centering means to subtract the column averages from each matrix element:
(2)
Standardization means to divide each centered matrix element with the columnstandard deviations:
(3)
where xij is a matrix element, is the column average, and sj is the columnstandard deviation.
Sometimes standardization is termed as normalization, which must not be con-fused with normalization to unit length. Of course, other scaling options also exist,e.g., range scaling:
(4)
and block scaling (scaling only a part of the matrix).Covariance and correlation matrix can be formed from the original input
matrix X:
(5)
(6)R xn
X XjT cor
( ) ( )
11−
′′ ′′
C xn
X XjT
� cov( ) ( )
11
′ ′
′′′xx x
x xij
ij j
j j
�
�
min( )
max( ) min( )
x j
xx x
sijij j
j′′
−
x x xij ij j′ �
X
x x x
x x x
x x x
n m
m
m
n n nm
,
11 12 1
21 22 2
1 2
L
L
M M M
L

146 K. Héberger
Centering and standardization leads to some information loss. However, someof the statistical methods require (or at least works better; the interpretation iseasier) the use of standardized data. Therefore, standardization is always recom-mended for beginners. The purpose and use of centering and scaling are discussedin depth in ref. [1].
In practice, it often happens that some items are missing from the matrix. Thebest way is to substitute missing data with column means (or partial mean of aninterval if applicable). Alternatively, a random number within the range can beput instead of an empty place. If the empty places are numerous and they are notrandomly located, then substitution is not recommended. Similarly, puttingzeros in empty places is never the advocated practice. If a measurement value isbelow the detection limit, then half of the detection limit is a much better choicethan zeros.
Generally, no data can be eliminated from the matrix without well-documentedreasons. However, constant “variables” are not useful, and similarly, some of thehighly correlated variables may be cancelled as they do not represent independentinformation. The qualitative statement “highly correlated” can hardly be quanti-fied as it depends on the problem.
3. Multivariate methods
Let us group the methods in the simplest way. If the data can only be arranged inone matrix (X ), then unsupervised pattern recognition can be carried out. Suchmethods are PCA and cluster analysis (CA). It is relatively easy to assign a dummyvariable to the rows (objects, cases) in the matrix. Supervised pattern recognitionmethods aimed to predict the dummy variable also called grouping variable (Y).All prediction methods can be applied in a supervised way, i.e., to predict thegrouping variable(s). What is the use of employing supervised pattern recognitionwhen the aim is to group the data into classes and class memberships have to beknown before the analysis? However, we can build models on known samples(training or learning data sets) and make predictions on unknown, not yetmeasured samples or compounds.
The most frequently used supervised pattern recognition method is the lineardiscriminant analysis (LDA), not to be confused with its twin brother canonicalcorrelation analysis (CCA) or canonical variate analysis (CVA). Recently,classification and regression trees (CART) produced surprisingly good results.Artificial neural networks (ANNs) can be applied for both prediction and patternrecognition (supervised and unsupervised).
If two matrices can be defined, matrices of dependent variables (Y) andindependent variables (X), then prediction methods are applicable. The simplest

Data evaluation by multivariate methods 147
and best-understood prediction method is the multiple linear regression (MLR). Ituses only one Y variable measured on a numerical scale (one at a time). Principalcomponent regression (PCR) and partial least squares projection of latent struc-tures (PLS) can have more Y vectors of numerical scale. The use of all patternrecognition and prediction methods is connected to variable (feature) selection.Many variables are not useful for prediction; they encode irrelevant information oreven noise. Canceling uninformative variables ensures the successful applicationof chemometric techniques. The variable selection is implemented in the algorithmof prediction methods; here, only two general variable selection methods are men-tioned: genetic algorithm (GA) and generalized pairwise correlation method(GPCM).
There are virtually endless number of methods for prediction and patternrecognition. The methods are frequently abbreviated. All of them have advantagesand disadvantages; some of them have found use in special cases. In chemistry,“landscape” matrices often emerge, i.e., matrices having more columns than rows;LDA cannot handle such a situation but PLS can. Similarly, MLR cannot toleratehighly correlated variables but PLS can.
The methods of pattern recognition are summarized in Fig. 1.
Fig. 1. Pattern recognition methods. ANN, artificial neural networks; BP ANN, back-propagationANN; CA, cluster analysis; CART, classification and regression trees (recursive partitioning); CCA,canonical correlation analysis; CVA, canonical variate analysis; kNN, k-nearest neighbor methods;LDA, linear discriminant analysis; PCA, principal component analysis; PLS DA, partial leastsquares regression discriminant analysis; SIMCA, soft independent modeling of class analogy;SOM, self-organizing maps.
Pattern Recognition PARC
Fuzzy Non fuzzy
Non supervised CA
Supervised (classification)
Hierarchical (more level)
Non hierarchical(one level)
LDA, CVA CCA
BP ANN SIMCA PLS DA
Agglomerative
Divisive
kNN K means procedures
ANN Kohonen, SOM
PCA

148 K. Héberger
3.1. Principal component analysis (PCA)
An n m matrix can be considered n points in the m-dimensional space (or mpoints in the n-dimensional space). The points can be projected into a smallerdimensional subspace (smaller than n or m, whichever is the smaller) using propertechniques as PCA. Therefore, PCA is often called as a projection method.Projecting the points, dimension reduction of the data can be achieved. Theprincipal components are often called underlying components; their values are thescores. The principal components are, in fact, linear combinations of the originalvariables. PCA is an unsupervised method of pattern recognition in the sense thatno grouping of the data has to be known before the analysis. Still the datastructure can be revealed easily and class membership is easy to assign.
The principal components are uncorrelated and account for the total variance ofthe original variables. The first principal component accounts for the maximumof the total variance, the second is uncorrelated with the first one and accounts forthe maximum of the residual variance, and so on, until the total variance is account-ed for. For practical reasons, it is sufficient to retain only those components thataccount for a large percentage of the total variance.
In summary, PCA decomposes the original matrix into multiplication of loading(P) and score (T) matrices:
X TPT (7)
PCA will show which variables and compounds are similar to each other, i.e.,carry comparable information, and which one is unique. The schematic represen-tation of PCA can be found in Fig. 2.
The algorithm of PCA can be found in standard chemometric articles andtextbooks [2–4]. Fig. 3 shows an example of PCA. The separation in gas–liquidchromatography is ensured by stationary phases (liquids bound to chromatographiccolumns). These liquids have various separation abilities. Generally the polarity of
Fig. 2. Schematic representation of principal component analysis. (X original input matrix is decom-posed into sum of several matrices (E is the residua, i.e., the error matrix); each matrix is calculatedas outer product of two vectors. t, score; p, loading; p�, transpose of p; “a” is the number of princi-pal components to be retained in the model.)
EX
mm m m
m
n n t1 t2
=
p’1 p’2 p’a
+ +…+
n n tan
+

Data evaluation by multivariate methods 149
stationary phases is used to characterize the separation. However, the polarity is nota unique, well-defined characteristic. Different authors define it differently. Eightpolarity parameters are used to characterize the polarity of stationary phases [5]. Theinformation they carry is redundant. Which polarity parameter is similar to otherscan be seen in the figure. Proximity of points means similarity: The closer a point,the more similar its polarity parameter is. The four polarity parameters form a densecluster; the points for MR and RP are identical and XN is an outlier.
3.2. Cluster analysis (CA) [6, 7]
Two kinds of CA can be differentiated: hierarchical and nonhierarchical. Treeclustering producing dendrograms is a good example for hierarchical clustering,
Fig. 3. Characterization of polarity (and selectivity) in gas chromatography. Principal componentanalysis of eight different polarity parameters: DC, MR, Kc, and RP are polarity parameters; XB, YB,XD, and XN are selectivity parameters. Notably, MR and RP carry exactly the same information(R 0.9999561); XB and YB show close resemblance. The original eight-dimensional problem canbe simplified into three dimensions without observable information loss.

150 K. Héberger
Fig. 4. Characterization of polarity (and selectivity) in gas chromatography. Cluster analysis of eightpolarity parameters (cf. Fig. 3) using Euclidian distance and simple linkage. The polarity (DC, MR,Kc, RP) and selectivity (XB, YB, XD and XN) parameters are well distinguished. The close resem-blance of MR and RP and to a lesser extent of XB and YB can also be seen.
DC
MR
RP
KC
XD
XB
YB
XN
0 1 2 3 4 5 6 7 8 9Linkage distance
Fig. 5. Characterization of polarity (and selectivity) in gas chromatography. Cluster analysis of eightpolarity parameters (cf. Fig. 3) using city block (Manhattan) distance and Ward’s method.
DC
MR
RP
KC
XD
XB
YB
XN
0 20 40 60 80 100
Linkage distance
whereas the k-nearest neighbor (kNN) method is for nonhierarchical ones. In fact,cluster analyses incorporate different algorithms. The common feature in the clus-tering algorithms is that they use distances for groupings (close objects form acluster). CA helps to organize observed data into meaningful structures, that is, to

Data evaluation by multivariate methods 151
develop taxonomies. Similarly, the correct diagnosis of a group of symptoms suchas paranoia, schizophrenia, etc., is essential for successful therapy in the field ofpsychiatry. As said, an X matrix can be considered as m points in an n-dimen-sional space (column-wise) or n points in an m-dimensional one (row-wise).
Clustering algorithms differ from each other in how they define the distancemeasure and the distances among groups. Several measures for distance exist,e.g., Euclidian, Mahalanobis, city block (Manhattan), etc. Similarly, a number oflinkage (amalgamation) rules have been defined: simple linkage, complete link-age, Ward’s method, etc.
As the distance measure can be combined with various linkage rules, the resultsof CA are different; the unraveled pattern depends on the methods used. If alltechniques provide the same pattern, the clustering, the classification can beaccepted, otherwise it is not clear why the given linkage rule or distance measureprovides acceptable/explainable groupings. Except using Mahalanobis distance,all clustering methods require standardization of data.
Figs. 4 and 5 embody CA results of exactly the same problem solved by PCAand shown in Fig. 3.
The results change using other distance measure and different linkage rule.Although the closeness of MR and RP and XB and YB remained, the polarity–selectivity distinction suffers: XD got into the cluster of polarity parameters; XN isnot an outlier any more.
3.3. Multiple linear regression (MLR)
It is perhaps the most frequently applied chemometric method. One Y vector isrelated to the X matrix. The implicit assumption in MLR is the uncorrelatednessof variables (vectors of X ). It works well with long and lean (portrait) matrices, ifthe ratio of object exceeds at least five times the number of variables.
The basic regression equation to be solved is:
(8)
where b is the vector of parameters to be fitted. Each b vector elementcorresponds to a variable (column) in X. Variables that have b parameters notsignificantly different from zero should be eliminated from the model (variableselection). An estimation for b can be calculated by:
(9)
where the superscripts “T” and “�1” mean transpose and inverse of the matrix,respectively.
ˆ )b X X X Y ( T T �1
Y Xb � ε

152 K. Héberger
Several model-building techniques were elaborated: forward selection andbackward elimination, both in stepwise manner, all possible regressions, etc. [8].
Using the polarity example as mentioned earlier, it can be demonstratedhow the various polarity variables are related. The most frequently used McReynoldspolarity (MR) served as dependent variable. The following model can be built:
MR 501.7 � 429.3 DC � 3601 XBR 0.9860; F(2,27) 472.4; p 0.0000; s 157.6
where R is the multiple correlation coefficient, F is the overall Fisher statistic, p isthe significance of the equation, and s is the standard error of the estimate. (Theabove example shows the standard way of providing regression results.)
Backward elimination procedure has kept X variables: DC and XB from amongsix polarity variables. The remaining variables (YB, XN, XD, and Kc) are notsignificant at the 5% level.
Fig. 6 shows a typical result of MLR. Dotted lines are the 95% confidence inter-val for the regression line.
3.4. Linear discriminant analysis (LDA) and canonical correlationanalysis (CCA)
LDA allows us to classify samples with a priori hypothesis to find the variableswith the highest discriminant power. This analysis is used to determine whether
3500
3000
2500
2000
1500
1000
500
0
3500300025002000150010005000
Mea
sure
d M
R v
alue
s
Predicted MR values
Fig. 6. Results of multiple linear regression for description of polarity in gas chromatography.Predicted and measured McReynolds polarity values.

Data evaluation by multivariate methods 153
the model (with all variables) leads to significant differences between the a prioridefined groups, and which variables have significantly different means across thegroup. The selected variables are submitted to linear combinations to give rise todiscriminant canonical functions, whose number is equal to the number of groupsminus one (or equal the number of variables if it is smaller than the number ofgroups minus one). The first function provides the most overall discriminationbetween groups, the second provides the second most, and so on.
The discriminant power of the variables has been evaluated using Wilk’s ,F (Fisher statistics), and p-level parameters. The Wilk’s is computed as the ratioof the determinant of the within-group variance/covariance matrix to the deter-minant of the total variance/covariance matrix: Its values ranges from 1 (no dis-criminatory power) to 0 (perfect discriminatory power).
LDA is perhaps the most frequently used supervised pattern recognitiontechnique. It is supervised, that is, the class membership has to be known for theanalysis. LDA, similarly to PCA, can be considered as a dimension reductionmethod. For feature reduction, we need to determine a smaller dimension hyper-plane on which the points will be projected from the higher dimension space.While PCA selects a direction that retains maximal structure in a lower dimensionamong the data, LDA selects a direction that achieves maximum separation amongthe given classes. The latent variable obtained in this way is a linear combinationof the original variables. This function is called the canonical variate; its valuesare the roots. In the method of LDA, a linear function of the variables is to besought, which maximizes the ratio of between-class variance and minimizes theratio of within-class variance. Finally, a percentage of correct classification isgiven. A variant of this method is the stepwise discriminant analysis that permitsthe variables with a major discriminant capacity to be selected. The description ofLDA algorithm can be found in refs. [6,9,10].
Description of the discriminant analysis modules of StatisticaTM programpackage [11]: A discrimination model will be built with the forward stepwise(forward selection) module of discriminant analysis step by step. Specifically, ateach step the Statistica program will review all variables and evaluate which onewill contribute to the most of the discrimination between groups. This variablewill then be included into the model, and Statistica will proceed to the next step.In the general discriminant analysis module, a significance limit (1 � �, say95%) can be predefined. All variables that do not surpass the error limit (�, say 5%) will be included in the model, and all variables that surpass it willbe eliminated.
Again, the earlier polarity example is utilized. The 30 stationary phases wereclassified into three categories: slightly, moderately, and highly polar according tovariable “DC.” LDA procedure in forward selection mode has selected the follow-ing variables: DC, YB, XN, MR, Kc, and XB at the 10% level. Only XD is notinformative besides the other five. (RP was excluded from the analysis as it ishighly correlated to MR.) Four stationary phases were classified into wrong groups

154 K. Héberger
(misclassified). Considering that the classes were arbitrary and we used fivediscriminating variables instead of one, the results are satisfactory. The canonicalvariates show the discrimination of the classes. Stationary phase nos. 8, 9, 12, and19 were misclassified (indicated with asterisks in Fig. 7).
3.5. Partial least squares projection of latent structures (PLS)
Partial least squares projection of latent structures (PLS) is a method for relatingthe variations in one or several response variables (Y variables or dependentvariables) to the variations of several predictors (X variables), with explanatory orpredictive purposes [12–14]. PLS performs particularly well when the variousX variables express common information, i.e., when there is a large amount ofcorrelation or even collinearity among them. PLS is a bilinear method whereinformation in the original X data is projected onto a small number of underlying(“latent”) variables to ensure that the first components are those that are mostrelevant for predicting the Y variables. Interpretation of the relationship betweenX data and Y data is then simplified, as this relationship is concentrated on thesmallest possible number of components [15].
Fig. 7. Classification of stationary phases in gas chromatography. Canonical variates are plottedagainst each other. The misclassified stationary phases are marked with asterisks.

Data evaluation by multivariate methods 155
The partial least squares regression discriminant analysis (PLS DA) is a classifi-cation method based on modeling the differences between several classes with PLS[16–18]. If there are only two classes to separate, the PLS model uses one responsevariable, which codes for class membership as follows: 1 for the members ofone class, 0 (or �1) for members of the other class (dummy variables) [18]. If thereare three classes (or more), three dummy variables (or more) are needed. Fromthe predicted Y values, we assigned the groups using the closest distance (maximumprobability) approach. The maximum predicted values were assigned to unity (tothe given class); smaller ones (all negative values) were assigned to zeros.
Again, the earlier polarity example is used for prediction of three dummyvariables composed of zeros and unities showing the class memberships. The 30stationary phases were classified into three categories: slightly, moderately, andhighly polar according to DC. As PLS is not sensitive to collinearity of X vari-ables, all variables were used including RP. Only XD is not informative besidesthe other five. Again, as in the case of LDA, four stationary phases were misclas-sified: stationary phase nos. 12, 13, 19, and 20, but they were different from theearlier misclassified ones (Fig. 8).
X S
core
2
2
6
4
2
0
-2
-4
-6
7 14
345 6
110
1211
8913 17
1518
2021
1922
2325 24 26 29
2728 30
X Score 1-2 0 2 4 6
Slightly polarModerately polarHighly polar
16
Fig. 8. Classification of stationary phases in gas chromatography. Partial least squares X scores areplotted against each other, whereas three PLS components were retained. Dotted lines show the sep-aration of slightly, moderately, and highly polar phases. The misclassified stationary phases are nos.12, 13, 19, and 20 (cf. Fig. 7).

156 K. Héberger
The second X score expresses important features related to polarity: Stationaryphase nos. 2 and 16 exert hydrogen donating and accepting ability, which mightbe important in many applications.
The misuse of chemometric methods is well summarized in ref. [19].
3.6. Classification and regression trees (CART)
Classification and regression tree (CART, eventually C&RT) is a tree-shapedstructure that represents a set of decisions. These decisions generate rules for theclassification of a data set. CART provides a set of rules that can be applied to anew (unclassified) data set to predict which records will have a given outcome[20,21]. It is easy to conjure up the image of a decision “tree” from such rules.A hierarchy of questions is asked and the final decision that is made depends onthe answers to all the previous questions. Similarly, the relationship of a leaf to thetree on which it grows can be described by the hierarchy of splits of branches(starting from the trunk) leading to the last branch from which the leaf hangs. Therecursive, hierarchical nature of classification trees is one of their most basicfeatures; CART is also called recursive partitioning.
The final results of using tree methods for classification can be summarizedin a series of (usually few) logical if–then conditions (tree nodes). Therefore,
14
10
RP<=23.877
5 2
9
12
19
DC<=5.6672
1 1
3 3
11
Slightly polarModerately polarHighly polar
Fig. 9. Classification and regression trees using univariate split and prune on misclassification error.Using two variables (DC and RP) better classification can be achieved than using LDA or PLS. Fromamong the three misclassified phases, one can only be seen at the first split.

Data evaluation by multivariate methods 157
there is no implicit assumption that the underlying relationships between the pre-dictor variables and the dependent variable are linear or follow some specificnonlinear link function. The interpretation of results summarized in a tree is verysimple. This simplicity is useful for purposes of rapid classification of newobservations.
Unlike LDA, CART works well not only with numerical descriptors but alsowith categorical descriptors.
The Statistica program package implements three basic algorithms for CART:univariate split, linear combination split, and exhaustive search. Similarly, threestopping options can be chosen: prune on misclassification error, prune ondeviance, and direct stop [11].
Fig. 9 shows the results of CART using univariate split and prune on misclas-sification error. Apart from the trivial solution (the polarity was classified usingmonotonous increase of DC ), two variables (DC and RP) provide betterclassification than using five variables in LDA or eight variables in PLS. Threestationary phases were misclassified: nos. 11, 12, and 20. However, the CARTsolution does not reflect the complexity of the problem.
3.7. Artificial neural networks (ANN) [22–24]
A bunch of different methods of artificial intelligence are grouped under the termANN. They can be used for pattern recognition both for supervised and unsupervisedmanner and for prediction purposes. ANNs are among the best available fitting meth-ods; they can be applied for highly complex and strongly nonlinear relationships.
Artificial neural networks consist of groups of interconnected processing ele-ments called neurons. The neurons are organized in layers producing“architecture.” The first layer is termed the input layer, and each of its neuronsreceives information from outside (generally the independent variables are used asinputs). The last layer is the output layer; the layers of neurons between the inputand output layers are called hidden layers. Input and output data (X and Y matri-ces) are used to train the networks, e.g., change the weights for each connection;sum of all inputs for individual neuron transfers the information using appropriatetransfer function (e.g., sigmoid, tangent hiperbolicus) and passes the results for-ward. Feed-forward neural networks connect the neurons in the upward direction,i.e., connections are not allowed among the neurons themselves (loops) and with-in one layer; they are consecutive (i.e., no jumps are allowed between layers). Theweights are adjusted in such a way that the difference of measured and calculatedoutputs should decrease. The error propagates backwards during the training offeed-forward neural networks (80% of the ANN applications use back propagationlearning). Kohonen’s maps are self-organizing neural networks and have two lay-ers only; they can unravel pattern in the data without using dependent variables(unsupervised pattern recognition).

158 K. Héberger
ANN is adaptive, i.e., it can learn from data and recognize dominant patterns.ANN is able to generalize; however, it has serious drawbacks as well. As a blackbox model, ANN can hardly be interpreted. It tends to overfit the data; it is notapplicable for extrapolation but just for interpolation. There is no guarantee thata given architecture and training will find the global minimum. The selectedvariables depend on the initial random weights used for training. Careful cross-validation (CV) is needed to prove that the learned pattern is real and does notcontain idiosyncrasy from noise.
Fig. 10 shows the architecture for the well-known polarity example. There is noneed to use all variables to predict the grouping variable for polarity, except four vari-ables (DC, MR, Kc, and RP). Selectivity parameters are not necessary for a properclassification (stationary phase no. 21 was misclassified with two hidden neurons;two phases (nos. 19 and 20) were misclassified with one hidden neuron). However,one variable DC classifies the phases as slightly, moderately, and highly polar.
3.8. Some methods of variable selection
3.8.1. Genetic algorithms
GAs are implementations of various search paradigms inspired by naturalevolution.At a very general level, a GAmay be any (chromosome-type) population-based model that uses selection and recombination operators to generate newsample points in a research space. Each input parameter (e.g., independentvariables) is uniquely associated with a chromosome gene. The first step is tochoose the size of chromosomes and to put in place an encoding scheme, uniquelymapping combinations of model parameters of the same size with chromosomes.The next step is to generate the initial populations of the chromosomes.
BP-ANN Architecture
DC
MR
RP
Kc
Groupingvariable
Fig. 10. Artificial neural network architecture for prediction of the polarity of columns in GC (opti-mized, but not fully optimal).

Data evaluation by multivariate methods 159
Implementing genetic competition requires definition of a fitness function for thechromosome population, e.g., R2 (correlation coefficient) or R2
CV (correlation coef-ficient for CV).
The GA starts with one or more current populations. The next population(s) is theresult of genetic manipulation of the chromosomes through recombination (exchangeof genes between chromosomes) and/or mutation (randomly replacing genes withgenes not present in the chromosome; its role is to restore lost genetic material). Thechromosomes are evaluated after each cycle using fitness function. Generation ofnew populations is represented until a satisfactory solution is identified [24–26].
Leardi and Gonzalez have addressed the issue of the use of GAs for extractionof the most relevant variables for PLS analysis. The critical point is summarizedin their paper: “. . . a variable/objects ratio equal to 5 has been found to be the crit-ical point, beyond which using GA will be very dangerous” [27].
The Moby digs software of Todeschini [28] applies the GA for variable selectionin a MLR algorithm. The variable pool consists of 2000 variables at maximum twopopulations are allowed at a time. As a fitness function, R2
CV can be selected.
3.8.2. Generalized pairwise correlation method
The pairwise correlation method (PCM) [29,30] utilizes a portion of informationpresent in the data but overlooked till now. PCM selects from two independent vari-ables (X1 and X2) which one is superior, i.e., “correlates” better to the dependentvariable Y. Three vectors are defined: Y (dependent variable), X1, and X2 (inde-pendent variables). The task is to choose the superior one from X1 and X2. First, itis assumed that both of the independent variables correlate positively with thedependent variable Y. Other cases are discussed in refs. [29,30] exhaustively. All thepossible element pairs of the Y vector are considered that can occur when thedifferences �X1 for Y vs. X1, and �X2 for Y vs. X2 are determined. Only the signs of
the differences are taken into account. There will be point
pairs and differences �X1 as well as �X2. The frequencies for the four possible dif-ferent signs of �X1 and �X2 are arranged in a 2 2 contingency table. If both dif-ferences are positive (and both are negative), the distinction cannot be madebetween X1 and X2. However, if the frequency value for opposite signs of differ-ences for X1 is significantly greater, then X1 is termed as superior, otherwise X2.Whether the frequency value is significant or not, this can be determined usingsuitable statistical tests: the Williams’ t-test as a parametric test and theMcNemar’s, the Chi-square and the conditional Fisher’s tests as nonparametricstatistical tests [29].
In its generalized form (GPCM), all possible independent variable pairs are com-pared and the number of “superiority” is determined. The number of “superiority”
mn
n n � �21 2⎛
⎝⎞⎠ ( )

160 K. Héberger
is termed as the number of wins: How many times a given X variable was “superior”to the other X variables. The number of “inferiority” is termed as the number oflosses: How many times an X variable was “inferior” to the other X variables. Thenumber of wins is simply summed for all variable pair comparisons. Severalranking methods, namely (i) simple ranking according to the number of wins,(ii) ranking according to the differences in wins and losses, and (iii) probabilityweighted ranking according to the differences in wins and losses, were elaboratedfor GPCM [31,32].
GPCM needs an independent variable; then, it rank orders all the remainingvariables. If MR was used as supervisor, the next most similar variable to it is RP,second next is Kc, and so on. (Table 1a). If XB were selected as supervisor, the nextmost similar variable to it is YB, second next is XD, and so on (Table 1b). In bothcases, the polarity and selectivity parameters are well distinguished.
3.8.3. Other aspects of data analysis
In the exploratory phase of any data analysis it is expedient to calculate means,standard deviation medians, skewness, and kurtosis of variables. They are impor-tant indicators of the distribution of data. Box and Whisker plot using medianreveals easily the asymmetry in the distribution. If the number of data makes itpossible, it is worth to plot the histogram of each variable and test the normality(Kolmogorov-Smirnov, Shapiro-Wilk’s test, etc.). If the number of variables is
Table 1
Results of generalized pairwise correlations for the polarity example: Dependent variables were(a) MR and (b) XB
(a) RP Kc DC XD XN YB XB
No. of wins 6 4 4 2 1 1 0No. of losses 0 1 1 3 3 4 6No. of decisions 0 1 1 1 2 1 0Rank ordering wins–losses 1 2 3 4 5 6 7
� (user) 0.05 � (emp.) 0 Crit. sum 11.4 12
(b) YB XD XN Kc MR RP DC
No. of wins 6 4 4 3 1 1 0No. of losses 0 1 1 3 4 4 6No. of decisions 0 1 1 0 1 1 0Rank ordering wins–losses 1 2 3 4 5 6 7
� (user) 0.05 � (emp.) 0 Crit. sum 11.4 12
Conditional exact Fisher test as selection criterion and “ranking according to the number of winsminus losses” were used in both cases. Bold numbers indicate the variables selected.

Data evaluation by multivariate methods 161
small (�8–10), matrix plot can show strong patterns and outliers in the data imme-diately. Similarly, calculating the correlation matrix is certainly useful. If the dataare not normally distributed, nonparametric alternatives of correlation coefficients[32] should be used, such as Spearman and Kendall �. Fig. 11 shows that thedistribution of XN is far from being normal. Although the Kolmogorov-Smirnovtest is conservative, the two other tests indicate the nonnormal distribution equiv-ocally, at the 5% level.
Correlation coefficient is applied most frequently to reveal relationships andconnections between variables. However, its use is seldom correct. Misuse andabuse of correlation coefficient is well spread in all scientific fields. First of all, itsvalue without the degrees of freedom says nothing. Even r 0.997 is not signifi-cant at the 5% level if n 3; in contrast, r 0.300 is significant if n � 44 [33].Large correlation coefficient does not mean causal relationships between thevariables necessarily. Two increasing series of numbers are always correlated.Even zero correlation coefficient does not mean that there are no relationshipsbetween the variables, but then it means that no linear relationship exists.Clustering the data in two groups can provide high correlation coefficient with theillusion of definite relationship.
3.8.4. Validation of model building techniques
The most frequently used technique for model validation is no doubt the CV.It can be applied in several variants: leave-one-out (LOO), leave-multiple-out
Fig. 11. Histogram for XN (Kolmogorov-Smirnov d 0.18221, p � 0.20; Lilliefors p � 0.05;Shapiro-Wilk W 0.89464, p 0.00623).
0.30 0.32 0.34 0.36 0.38 0.40 0.42 0.44 0.46 0.48X < = Category Boundary
0
2
4
6
8
10
12
14
16
18
No.
of o
bser
vatio
ns (
freq
uenc
y)

162 K. Héberger
(leave-n-out) splitting the data set into training an test sets [34]. Unfortunately, thereis no agreed method how to split data set into training, calibration, and test sets.
There is a widespread perception among statisticians that CV is a poor methodof verifying the fit of a model. Especially, LOO method is damned. On the con-trary, Miller recommends splitting the data into three sets: One is used for modelselection, the second one for parameter estimation (calibration), and the third onefor external validation (CV is a poor alternative instead) [35]. Tropsha andGramatica also support the view in insisting to the external validation [36].
The prediction error is estimated using CV almost unbiasedly in case no fea-ture selection has been made. However, CV is heavily biased when the variablesare selected from a large number of variables. The indicators of the fit are decep-tively overoptimistic in such cases [37].
A correct LOO cross-validation can be done by moving the delete-and-predictstep inside the subset search loop. In other words, we take the sample of size n,remove one case, search for the best subset regression on the remaining n � 1cases, and apply this subset regression to predict the holdout case. Repeat for eachof the cases in turn, getting a true holdout prediction for each of the cases. Usethese holdouts as a measure of the fit [38,39].
A fast and effective way is to estimate the performance of a fit by using gener-ated matrices consisting of random numbers. The same number of variables shouldbe generated as was used in the modeling, prediction step for real measured data.The same procedure should be followed as in the real case, variable selection,model building, etc., and the indicators of the fit (correlation coefficients for thetraining and prediction sets, prediction errors) should be compared with the samevalues of the real case. If the random numbers indicate approximately the same fitand/or prediction, the variables selected, the models built on real data are of littlevalue even if physical significance can be found for the parameters of the model.
4. Selected applications of chemometrics
There are numerous applications evaluating results of instrumental–analyticalmethods (like mass spectrometry, NMR spectroscopy, chromatography, etc.) using chemoinformatics. Combinations involving NMR spectroscopy and chro-matography have many applications in the biomedical field. On the other hand,although chemometric techniques have frequently been applied to analyze massspectral data, applications in the biomedical field are rare. Multivariate data analy-sis has been applied to mass spectrometry [40], especially revealing relationshipsof mass spectral data and chemical structure [41]. The state of the art for structureelucidation can be found in critical reviews and evaluations [42, 43]. Even thedifferentiation of stereoisomers can be solved using mass spectral data coupledwith chemometric data evaluation [44].

Data evaluation by multivariate methods 163
Mass spectrometry and chemometric methods cover very diverse fields:Different origin of enzymes can be disclosed with LC–MS and multivariate analy-sis [45]. Pyrolysis mass spectrometry and chemometrics have been applied forquality control of paints [46] and food analysis [47]. Olive oils can be classified byanalyzing volatile organic hydrocarbons (of benzene type) with headspace–massspectrometry and CA as well as PCA [48]. Differentiation and classification ofwines can similarly be solved with headspace–mass spectrometry using unsuper-vised and supervised principal component analyses (SIMCA soft independentmodeling of class analogy) [49]. Early prediction of wheat quality is possible usingmass spectrometry and multivariate data analysis [50].
Pyrolysis mass spectrometry and chemometrics have been coupled to analyzethe adulteration of orange juice quantitatively [51], to test the authenticity ofhoney [52], and to discriminate the unfractionated plant extracts [53].
GC–MS coupled with chemometric techniques has been used to characterizeroasted coffees [54], to detect adulterants in olive oils [55], and to determine fattyacids in fish oils [56]. GC–MS data have also been used in toxicology assessmentsto reveal patterns in complex chemical mixtures with the help of multivariateanalyses [57,58].
Novel fast developing fields are metabonomics, metabolomics, proteomics,and genomics (the “omics world”). The connection to chemometric methods caneasily be established without going into details and discussing their definition.However, the utilization of mass spectral data is relatively rare in these fields:More than 300 compounds can be distinguished with GC–MS after deconvolu-tion of overlapping peaks [59]. Screening biomarkers in rat urine have beensolved using LC–MS data (electrospray ionization) and 2-way data analysis[60]. The useful methods of chemoinformatics have been summarized in thereview [17].
Time of flight mass spectrometry has also provided data for chemometricanalyses, e.g., for PCA [61,62] and for trilinear (3-way) analysis [63].
The chemometric approach has been applied on diverse field of mass spectral dataevaluation: peak resolution and quantification [64], calibration [65], instrumentstandardization [66], fast interpretation [67], and evaluation of rate constants [68].
Finally some sources are mentioned, which are not necessarily bound to massspectrometry, but they illustrate well the usefulness of chemometric methods inmedical diagnosis: multilevel component analysis of metabolomic fingerprintingdata [69], artificial neural network applications for the clinical diagnosis of tumors[70,71], lipoprotein analysis [72], searching cardiovascular markers [73], differen-tiation of heroin samples [74], and quantification of pollution levels by multiwaymodeling [75]. Patients with low, normal, and high plasma cholesterol and statintherapy level were classified using LDA: Variables (markers) with highestdiscrimination power were selected [76]. The inherent accuracy of 1H-NMRspectroscopy to quantify plasma lipoproteins is subclass dependent [77].

164 K. Héberger
Terms and terminology
“All possible regressions” is a model-building method, when all possible variablecombinations are examined in the model.
Backward elimination is a variable selection algorithm for multiple linear regres-sion; it starts with all variables in the model and eliminates all nonsignificantvariables; see forward selection as well.
Calibration data set is a part of the data on which the estimation of model param-eters is carried out.
Canonical variate is a linear combination of the original variables for the highestdiscrimination power.
City block (Manhattan) distance equals the sum of absolute distances for eachvariable.
Class membership information shows groups or clusters in the data.Complete linkage defines the distance between clusters as the distance between
the two farthest objects.Confidence intervals for the regression line are limits within the estimated regres-
sion line that can be found with a certain, say 95%, probability.Cross-validation is the collective term for a bunch of validation techniques.Dendrogram or branched diagram is a diagram showing the relationships of items
arranged like the branches of a tree.Dimension reduction is generally achieved by combining the original variables in a
linear way (defining principal components) and not using all linear combinations.Euclidian distance is computed by finding the square of the distance between each
variable, summing the squares, and finding the square root of the sum.Fisher statistic, Fisher value: ratio of variances for two models to be compared.
It can be overall or partial F value. The overall Fisher statistic tests the entireequation, whether all coefficients are significant in the model. The partial Fvalue is used to test whether the incriminated variable is significant in themodel.
Forward selection is a variable selection algorithm for multiple linear regression;it starts with no variable in the model and introduces all significant variables;see backward elimination as well.
Grouping variable (Y ) shows whether a given object (statistical case) belongs toa certain class (e.g., the code 0 means “ill” and the code “1” means healthy); itis also called dummy variable.
Hierarchical clustering uses algorithms, which find successive clusters usingpreviously established clusters. Hierarchical algorithms can be agglomerative(bottom–up) or divisive (top–down). Agglomerative algorithms begin with eachelement as a separate cluster and merge them in successively larger clusters.
“Landscape” matrix is a short and fat matrix, i.e., matrices having (substantially)more columns than rows.

Data evaluation by multivariate methods 165
Latent variable is a linear combination of the original variables.Linkage (amalgamation) rules differ from each other in how they define the dis-
tances between clusters.Loading (P) matrix consists of linear coefficients for principal component analysis
(Equation 7).Mahalanobis distance is based on correlations between variables by which differ-
ent patterns can be identified and analyzed. It differs from Euclidean distance inthat it takes into account the correlations of the data set and is scale-invariant,i.e., not dependent on the scale of measurements.
Nonhierarchical or partitional clustering uses algorithms, which determine allclusters at once.
Partial least squares projection of latent structures (PLS) is a method for relatingthe variations in one or several response variables (Y variables or dependentvariables) to the variations of several predictors (X variables), with explanatoryor predictive purposes.
“Portrait” matrix is a long and lean matrix, i.e., matrices having (substantially)more rows than columns.
Prediction set is an independent part of the data that serves to check the modelperformance (also called test set).
p-level parameters: significance level parameters.Principal components are linear combinations of the original variables.Projection methods project the points into a smaller dimensional subspace.Roots: values of the canonical variate; cf. scores and principal components.Score (T) matrix consists of linear combinations of the original variables (Equa-
tion 7).Significance limit is a predefined probability: 1 � �, where � is the error limit.Significance of an equation (p) is the limit (threshold) probability, where the equa-
tion is still significant.Simple linkage defines the distance between clusters as the distance of the two
closest objects.Stepwise linear regression is a variant of multiple linear regression in which vari-
ables are added one at a time according to the F test.Supervised pattern recognition methods are the methods that use the class mem-
bership information while revealing dominant pattern in the data.Taxonomy refers to either a classification of things or the principles underlying the
classification.Training data set is a part of the data on which model building is carried out (also
called learning set).Underlying components or principal components are linear combinations of the
original variables; it is also called latent variables.Unsupervised pattern recognition methods are methods that do not use the class
membership information while searching dominant pattern in the data.

166 K. Héberger
Validation data set. See calibration data set.Ward’s method takes into account the number of objects when defining distance
between clusters.Wilk’s is the standard statistic that is used to denote the statistical significance of
the discriminatory power of the current model.
References
1. Bro, R. and Smilde, A.K., Centering and scaling in component analysis. J. Chemom., 17,16–33 (2003).
2. Wold, S., Esbensen, K. and Geladi, P., Principal component analysis. Chemom. Intell. Lab.Syst., 2, 37–52 (1987).
3. Vandeginste, B.G.M., Massart, D.L., Buydens, L.M.C., Jong, S.D.E., Lewi, P.J. and Smeyers-Verbeke, J., Principal component analysis. In: Handbook of Chemometrics and Qualimetrics:Part B. Elsevier, Amsterdam, The Netherlands, 1998, pp. 88–149 (Chapter 31.1).
4. Otto, M., Chemometrics Statistics and Computer Application in Analytical Chemistry. Wiley-VCH, Weinheim, Germany, 1999. Chapter 5.2. Principal component analysis, pp. 125–132.
5. Héberger, K., Evaluation of polarity indicators and stationary phases by principal componentanalysis in gas-liquid chromatography. Chemom. Intell. Lab. Syst., 47, 41–49 (1999).
6. Otto, M., Chemometrics Statistics and Computer Application in Analytical Chemistry. Wiley-VCH, Weinheim, Germany, 1999. Chapter 5.2.2. Cluster analysis, pp. 148–158.
7. Hartigan, J.A., Clustering Algorithms. Wiley, New York, 1975.8. Draper, N.R. and Smith, H., Applied Regression Analysis (2nd edition). Wiley, New York, 1981.9. Hastie, T., Tibshirani, R. and Friedman, J., Linear methods for classification. In: The Elements
of Statistical Learning. Data Mining, Inference, and Prediction. Springer, New York, 2001,pp. 79–113 (Chapter 4).
10. Vandeginste, B.G.M., Massart, D.L., Buydens, L.M.C., Jong, S.D.E., Lewi, P.J. and Smeyers-Verbeke, J., Supervised pattern recognition. In: Handbook of Chemometrics and Qualimetrics:Part B. Elsevier, Amsterdam, The Netherlands, 1998, pp. 207–223 (Chapter 33).
11. Statistica 6 software package, StatSoft Inc., Tulsa, OK, USA.12. Wold, S., PLS for multivariate linear modeling. In: van de Waterbeemd, H. (Ed.),
Chemometric Methods for Molecular Design. VCH, Weinheim, 1995, pp. 195–218(Chapter 4.4).
13. Geladi, P. and Kowalski, B.R., Partial least squares regression: a tutorial. Anal. Chim. Acta,185, 1–17 (1986).
14. Vandeginste, B.G.M., Massart, D.L., Buydens, L.M.C., Jong, S.D.E., Lewi, P.J. and Smeyers-Verbeke, J., Partial least squares regression. In: Handbook of Chemometrics and Qualimetrics:Part B. Elsevier, Amsterdam, The Netherlands, 1998, pp. 329–342 (Chapter 35.7).
15. Esbensen, K.H., Multivariate Data Analysis—in Practice (5th edition). CAMO Process AS,Oslo, 2002.
16. Barker, M. and Rayens, W., Partial least squares for discrimination. J. Chemom., 17, 166–173(2003).
17. Eriksson, L., Anti, H., Gottfries, J., Holmes, E., Johansson, E., Lindgren, F., Long, I., Lundstedt,T., Trygg, J. and Wold, S., Using chemometrics for navigating in the large data sets of genomics,proteomics and metabonomics (gpm). Anal. Bioanal. Chem., 380, 419–429 (2004).
18. Ståhle, L. and Wold, S., Partial least squares analysis with cross validation for the two-classproblem: a Monte Carlo study. J. Chemom., 1, 185–196 (1987).
Data evaluation by multivariate methods 167
19. Defernez, M. and Kemsley, E.K., The use and misuse of chemometrics for treating classifica-tion problems. Trends Anal. Chem., 16, 216–221 (1997).
20. Breiman, L., Friedman, J.H., Olshen, R.A. and Stone, C.J., Classification and RegressionTrees. Wadsworth & Brooks/Cole Advanced Books & Software, Monterey, CA, 1984.
21. Mazzatorta, P., Benfenati, E., Lorenzini, P. and Vighi, M., QSAR in ecotoxicity: an overviewof modern classification techniques. J. Chem. Inf. Comput. Sci., 44, 105–112 (2004).
22. Zupan, J. and Gasteiger, J., Neural Networks for Chemists. VCH Verlagsgesellschaft,Weinheim, Federal Republic of Germany, 1993.
23. Masters, T., Practical Neural Network Recipes in C��. Academic Press, Inc., AcademicPress Inc., San Diego, CA and Academic Press Inc., London, UK, 1993.
24. Niculescu, S.P., Artificial neural networks and genetic algorithms in QSAR. J. Mol. Struct.(Teochem), 622, 71–83 (2003).
25. Lucasius, C.B. and Kateman, G., Understanding and using genetic algorithms: Part 1.Concepts, properties and context. Chemom. Intell. Lab. Syst., 19, 1–33 (1993).
26. Lucasius, C.B. and Kateman, G., Understanding and using genetic algorithms: Part 2.Representation, configuration and hybridization. Chemom. Intell. Lab. Syst., 25, 99–145(1994).
27. Leardi, R. and González, A.L., Genetic algorithms applied to feature selection in PLS regres-sion: how and when to use them. Chemom. Intell. Lab. Syst., 41, 195–207 (1998).
28. Todeschini, R., Ballabio, D., Consonni, V., Mauri, A. and Pavan, M., MobyDigs Professionalversion 1.0 2004 Milano Chemometrics and QSAR Research Group.
29. Rajkó, R. and Héberger, K., Conditional Fisher’s exact test as a selection criterion for pair-correlation method. Type I and type II errors. Chemom. Intell. Lab. Syst., 57, 1–14 (2001).
30. Héberger, K. and Rajkó, R., Generalization of pair-correlation method (PCM) for nonpara-metric variable selection. J. Chemom., 16, 436–443 (2002).
31. Héberger, K. and Rajkó, R., Variable selection using pair-correlation method. Environmentalapplications. SAR QSAR Environ. Res., 13, 541–554 (2002).
32. Conover, W.J., Measures of rank correlation. In: Practical Nonparametric Statistics (2nd edi-tion). John Wiley & Sons, New York, 1980, pp. 250–256 and pp. 256–263 (Chapter 5.4).
33. Bevington, P.R., Data Reduction and Error Analysis for the Physical Sciences. McGraw-HillBook Co., New York, 1969.
34. Baumann, K., Cross-validation as the objective function for variable-selection techniques.Trends Anal. Chem., 22, 395–406 (2003).
35. Miller, A.J., Subset Selection in Regression. Chapman and Hall, London, 1990, pp. 43–82.36. Tropsha, A., Gramatica, P. and Gombar, V.K., The importance of being earnest: validation is
the absolute essential for successful application and interpretation of QSPR models. QSARComb. Sci., 22, 69–77 (2003).
37. Baumann, K., Chance correlation in variable subset regression: influence of the objectivefunction, the selection mechanism, and ensemble averaging. QSAR Comb. Sci., 24, 1033–1046(2005).
38. Hawkins, D.M., Assessing model fit by cross validation. J. Chem. Inf. Comput. Sci., 43,579–586 (2003).
39. Hawkins, D.M., The problem of overfitting. J. Chem. Inf. Comput. Sci., 44, 1–12 (2004).40. Varmuza, K., Penchev, P., Stancl, F. and Werther, W., Systematic structure elucidation of
organic compounds by mass spectra calssification. J. Mol. Struct., 408/409, 91–96 (1997).41. Varmuza, K., Recognition of relationships between mass spectral data and chemical structures
by multivariate data analysis. Anal. Sci., 17(Suppl.), 1467–1470 (2001).42. Varmuza, K., Chemical structure information from mass spectrometry, Encyclopedia of
Spectroscopy and Spectrometry. Academic Press, San Diego, 2000.

168 K. Héberger
43. Demuth, W., Karlovits, M. and Varmuza, K., Spectral similarity versus structural similarity:mass spectrometry. Anal. Chim. Acta, 516, 75–85 (2004).
44. Le Bizec, B., Antignac, J-P., Bertrand, D., Qannari, E.M. and Andre, F., Multidimensionalstatistical analysis applied to electron ionization mass spectra to determine steroid stereo-chemistry. Rapid Commun. Mass Spectrom., 19, 509–518 (2005).
45. Bylund, D., Samskog, J., Markides, K.E. and Jacobsson, S.P., Classification of lactate dehy-drogenase of different origin by liquid chromatography-mass spectrometry and multivariateanalysis. J. Am. Soc. Mass Spectrom., 14, 236–240 (2003).
46. Wilcken, H. and Schulten, H.-R., Quality control of paints; Pyrolysis—mass spectrometry andchemometrics. Anal. Chim. Acta, 336, 201–208 (1996).
47. Guillou, C., Lipp, M., Radovic, B., Reniero, F., Schmidt, M. and Anklam, E., Use of pyrolysis-mass spectrometry in food analysis: application in the food analysis laboratory of theEuropean Commissions’ Joint Research Centre. J. Anal. Appl. Pyrolysis, 49, 329–335 (1999).
48. Peña, F., Cárdenas, S., Gallego, M. and Valcárcel, M., Direct screening of olive oil samples forresidual benzene hydrocarbon compounds by headspace-mass spectrometry. Anal. Chim. Acta,526, 77–82 (2004).
49. Marti, M.P., Busto, O. and Guasch, J., Application of a headspace mass spectrometry systemto the differentiation and classification of wines according to their origin, variety and ageing.J. Chromatogr. A, 1057, 211–217 (2004).
50. Ghirardo, A., Sorensen, H.A., Petersen, M., Jacobsen, S. and Sondergaard, I., Early predictionof wheat quality: analysis during grain development using mass spectrometry and multivari-ate data analysis. Rapid Commun. Mass Spectrom., 19, 525–532 (2005).
51. Goodacre, R., Hammond, D. and Kell, D.B., Quantitative analysis of the adulteration oforange juice with sucrose using pyrolysis mass spectrometry and chemometrics. J. Anal. Appl.Pyrolysis, 40–41, 135–158 (1997).
52. Radovis, B.S., Goodacre, R. and Anklam, E., Contribution of pyrolysis-mass spectrometry(Py-MS) to authenticity testing of honey. J. Anal. Appl. Pyrolysis, 60, 79–87 (2001).
53. Goodacre, R., York, E.V., Heald, J.K. and Scott, I.M., Chemometric discrimination of unfrac-tionated plant extracts analyzed by electrospray mass spectrometry. Phytochemsitry, 62,859–863 (2003).
54. Zambonin, C.G., Balest, L., De Benedetto, G.E. and Palmisano, F., Solid-phase microextraction-gas chromatography mass spectrometry and multivariate analysis for the characterization ofroasted coffees. Talanta, 66, 261–265 (2005).
55. Lorenzo, I.M., Pavón, J.L.P., Laespada, M.E.F., Pinto, C.G. and Cordero, B.M., Detection ofadulterants in olive oil by headspace-mass spectrometry. J. Chromatogr. A, 945, 221–230 (2002).
56. Jalali-Heravi, M. and Vosough, M., Characterization and determination of fatty acids in fishoil using gas chromatography-mass spectrometry coupled with chemometric resolution tech-niques. J. Chromatogr. A, 1024, 165–176 (2004).
57. Eide, I., Neverdal, G., Thorvaldsen, B., Grung, B. and Kvalheim, O.M., Toxicological evalu-ation of complex mixtures by pattern recognition: correlating chemical fingerprints to muta-genecity. Environ. Health Perspect., 110(6 Suppl.), 985–988 (2002).
58. Eide, I., Neverdal, G., Thorvaldsen, B., Arneberg, R., Grung, B. and Kvalheim, O.M.,Toxicological evaluation of complex mixtures: fingerprinting and multivariate analysis.Environ. Toxicol. Pharmacol., 18, 127–133 (2004).
59. Jonsson, P., Gullberg, J., Nordström, A., Kusano, M., Kowalczyk, M., Sjöström, M., andMoritz, T., A strategy for identifying differences in large series of metabolomic samples ana-lyzed by GC/MS. Anal. Chem., 76, 1738–1745 (2004).
60. Idborg-Björkman, H., Edlund, P-O, Kvalheim, O.M., Schuppe-Koistinen, I. and Jacobsson,S.P., Screening of biomarkers in rat urine using LC/electrospray ionization-MS and two-waydata analysis. Anal. Chem., 75, 4784–4792 (2003).

Data evaluation by multivariate methods 169
61. Sinha, A.E., Hope, J.L., Prazen, B.J., Fraga, C.G., Nilsson, E.J. and Synovec, R.E., Multivariateselectivity as a metric for evaluating comprehensive two-dimensional gas chromatography—time-of-flight mass spectrometry subjected to chemometric peak deconvolution.J. Chromatogr A, 1056, 145–154 (2004).
62. Sinha, A.E., Fraga, C.G., Prazen, B.J. and Synovec, R.E., Trilinear chemometric analysis oftwo-dimensional comprehensive gas chromatography—time-of-flight mass spectrometry data.J. Chromatogr. A, 1027, 269–277 (2004).
63. Pacholski, M.L., Principal component analysis of TOF-SIMS spectra, images and depth pro-files: an industrial perspective. Appl. Surf. Sci., 231/232, 235–239 (2004).
64. Fraga, C.G., Chemometric approach for the resolution and quantification of unresolved peaksin gas chromatography—selected-ion mass spectrometry data. J. Chromatogr. A, 1019, 31–42(2003).
65. Araujo, P., Nguyen, T-T. and Froyland, L., Chemometric approaches in calibration experi-ments of trilinolenoylglycerol by liquid chromatography ion-trap mass spectrometry. J. Am.Soc. Mass Spectrom., 16, 388–396 (2005).
66. Goodacre, R., Timmins, É.M., Jones, A., Kell, D.B., Maddock, J., Heginbothom, M.L. andMagee, J.T., On mass spectrometer instrument standardization and interlaboratory calibrationtransfer using neural networks. Anal. Chim. Acta, 348, 511–532 (1997).
67. Windig, W., Smith, W.F. and Nichols, W.F., Fast interpretation of complex LC/MS data usingchemometrics. Anal. Chim. Acta, 446, 467–476 (2001).
68. Carpignano, R., Operti, L., Rabezzana, R. and Vaglio, G.A., Chemometric approach to evalu-ate the parameters affecting the determination of reaction rate constants by ion trap mass spec-trometry. J. Am. Soc. Mass Spectrom., 9, 938–944 (1998).
69. Jansen, J.J.; Hoefsloot, H.C.J., Greef, J.V.D., Timmermann, M.E. and Smilde, A.K., Multilevelcomponent analysis of time-resolved metabolic fingerprinting data. Anal. Chim. Acta, 530,173–183 (2005).
70. Shan, Y., Zhao, R., Xu, G., Lieblich, H.M. and Zhang, Y., Application of probabilistic neuralnetwork in the clinical diagnosis of cancers based on clinical chemistry data. Anal. Chim. Acta,471, 77–86 (2002).
71. Zhao, R., Xu, G., Yue, B., Lieblich, H.M., Zhang, Y., Artificial neural network classificationbased on capillary electrophoresis of urinary nucleosides for the clinical diagnosis of tumors.J. Chromatogr. A, 828, 489–496 (1998).
72. Dyrby, M., Petersen, M., Whittaker, A.K., Lambert, L., Norgaard, L., Bro, R. and Engelsen,S.B., Analysis of lipoproteins using 2D diffusion-edited NMR spectroscopy and multi-waychemometrics. Anal. Chim. Acta, 531, 209–216 (2005).
73. Balla, B., Mocak, J., Pivovarnikova, H. and Balla, J., Comparative study of cardiovascularmarkers data by various techniques of multivariate analysis. Chemom. Intell. Lab. Syst., 72,259–267 (2004).
74. Klemenc, S., In common batch searching of illicit heroin samples—evaluation of data bychemometrics methods. Forensic Sci. Int., 115, 43–52 (2001).
75. Flåten, G.R., Grung, B. and Kvalheim, O.M., Quantification of pollution levels by multiwaymodelling. J. Chemom., 18, 173–182 (2004).
76. Nagy, K., Jakab, A., Pollreisz, F., Bongiorno, D., Ceraulo, L., Averna, M.R., Noto, D. andVékey, K., Analysis of sterols by high-performance liquid chromatography/mass spectrometrycombined with chemometrics, Rapid Commun. Mass Spectrom., 20, 2433–2440 (2006).
77. Ala-Korpela, M., Lankinen, N., Salminen, A., Suna, T., Soininen, P., Laatikainen, R., Ingman, P.,Jauhiainen, M., Taskinen, M.-R., Héberger, K. and Kaski, K., The inherent accuracy of 1H NMRspectroscopy to quantify plasma lipoproteins is subclass dependent. Atherosclerosis, 190,352–358 (2007) (available online via Science Direct, 30 May 2006).

This page intentionally left blank

Part IIIBiomolecules

This page intentionally left blank

Medical Applications of Mass SpectrometryK. Vékey, A. Telekes and A. Vertes (editors)© 2008 Elsevier B.V. All rights reserved
173
Chapter 8
Mass spectrometry in proteomics
AKOS VERTES*
W. M. Keck Institute for Proteomics Technology and Applications, Department of Chemistry, The George Washington University, Washington, DC, USA
1. Introduction 1732. Methods in proteomics 176
2.1. Peptide mapping 1772.2. Peptide fragmentation 1792.3. Sequence tags 1822.4. De novo sequencing 1832.5. Electron capture and electron transfer dissociations 1842.6. Quantitative proteomics 1862.7. Higher order structures 1872.8. Mapping protein function 189
3. Outlook 190References 191
1. Introduction
In recent decades, rapidly expanding knowledge in molecular biology has providedthe biochemical framework for the functioning of all eukaryotic organisms. Thecore principles of this framework are based on three fundamental classes ofmolecules: nucleic acids, proteins, and metabolites. In a living organism a gene,coded in the DNA, is transcribed into an RNA molecule. Through processing, thenoncoding regions of the RNA are removed and a messenger RNA, mRNA, isspliced. Genes in the DNA are studied by genomics, whereas their expression inthe form of mRNA is explored by transcriptomics. The past 20 years witnessed the
*Tel.: �1-202-994-2717; Fax: �1-202-994-5873. E-mail: [email protected].

174 A. Vertes
sequencing of the human genome [1,2]; thus, discovering the genetic basis ofcertain diseases became feasible.
According to current estimates, there are approximately 25,000 genes in thehuman genome. Owing to alternative splicing and other mechanisms, the tran-scriptome of an organism is much more complex than the genome. As transcrip-tion and processing are influenced by the condition of the organism, disease statescan be reflected in expression level changes in the transcriptome. Analysis of thetranscribed mRNAs is typically carried out using DNA microarrays.
The second group of molecules, proteins, is produced through the ribosome-mediated translation of the mRNAs. Proteins serve as the general actors incarrying out most cell functions from motility to mitosis. The nature and activityof these functions are regulated by multitudes of posttranslational modifications,e.g., by acetylation, phosphorylation, or ubiquitination, of the proteins. Thesemodifications emerge as the main regulators of protein functions. Proteomics, avigorously developing field, is the systemic study of all proteins produced by anorganism.
Owing to posttranslational modifications, there are many more proteins thanmRNAs. It is estimated that approximately one million different proteins corre-spond to the �25,000 human genes. In addition, protein concentrations varygreatly in space, time, and expression level. Therefore, it is not sufficient to ascer-tain that a particular protein is present in the organism; the spatial and temporaldistributions of its concentration also have to be established. Spatial variations ofprotein expression in an organism are traditionally imaged using quantitativeautoradiography and fluorescent labeling methods, including tagging with greenfluorescent protein. These approaches, however, require the development oflabels for every individual protein. Therefore, their utility for high-throughputsystemic studies is very limited.
Importantly, the proteome can change in response to a disease. The alteredexpression levels can be used in diagnostics or form the basis of treatmentstrategies. Conventional methods of expression profiling were largely based ontwo-dimensional gel electrophoresis (2-DE). However, because of the limitedaccuracy, resolution, and specificity of this method, positive protein identificationhad to rely on additional forms of analysis. As a result of these complicatingfactors, proteomics presents an even greater challenge than genomics.
Some of the common objectives in proteomics include identification of pro-teins in a particular tissue or biological fluid (through peptide mapping, sequencetags, de novo sequencing, etc.), secondary, tertiary, or quaternary structure analy-sis of known proteins, function analysis through epitope mapping, quantitation ofprotein expression levels, and imaging of their distributions. The main methodused for protein identification and quantitation in proteomics is mass spectrometry.An introduction to the established methods of mass spectrometry in proteomics isthe subject of this chapter.
Mass spectrometry in proteomics 175
Mass spectrometry is uniquely positioned among the large variety of analyticaltechniques to achieve the outlined objectives [3]. Chapter 6 presents a thoroughintroduction to the principles and instrumentation of mass spectrometry. Massspectrometric methods provide a better sensitivity, dynamics range, and selec-tivity than nuclear magnetic resonance (NMR) techniques. Mass spectra aremore specific and less complex than many forms of optical spectroscopy and,given the right ionization technique, they can provide structural information.With the discovery of electrospray ionization [4] (ESI) and matrix-assisted laserdesorption/ionization [5,6] (MALDI) in the late 1980s, the ion sources with thenecessary capabilities (no high mass limit and adjustable amount of fragmenta-tion) became available and the stage was set for the birth of proteomics. For theirrespective role in developing these enabling technologies, John Fenn and KoichiTanaka received the 2002 Nobel Prize in Chemistry [7].
The thirdclassofmolecules,metabolites, is adiversecollectionof typically smallerspecies (�1500 Da) that participate in cellular energy production and in the synthesisand degradation of macromolecules. The systematic study of the human metabolomehas started only recently. By early 2007 already over 2000 endogenous metaboliteshave been identified, quantitated, and catalogued [8]. There is clearly a large diversityfor this class of molecules; for example, the number of different metabolites in theplant kingdom is estimated to be �200,000. In addition to the endogenous metabo-lites, molecules introduced from the environment through nutrition or as drugs andtheir degradation products are also present in living organisms. A simplified view ofthe three major molecular classes, their hierarchy and interactions, and the corre-sponding disciplines devoted to their study are presented in Fig. 1.
Most biomedical samples contain thousands of biochemical components andthus are too complex even for mass spectrometry. Separation methods are needed toreduce this complexity by selecting smaller groups of components from the origi-nal specimens (see Chapter 5). The most commonly used separation methods in pro-teomics are affinity chromatography with its high selectivity, multidimensionaltechniques, such as 2-DE, and the combination of ion exchange (IEX) and high-performance liquid chromatography (HPLC). More recently, ion mobility spec-trometry was used to separate the polypeptide components before mass analysis.
These separation methods and especially their combinations with mass spectrom-etry are capable of producing data in large volumes. Curated archiving and interpre-tation of these data require sophisticated computational resources. Bioinformaticsaims to manage and mine the rapidly growing information from genomic, prote-omic, and metabolomic investigations including the discovery of reaction networks(see Chapter 10). There are numerous bioinformatics databases and tools availableon the Internet (e.g., http://www.ncbi.nlm.nih.gov/, http://www.expasy.ch/, andhttp://prospector.ucsf.edu/) and from commercial sources. The leading mass spec-trometer manufacturers integrate their data acquisition systems with these tools toprovide comprehensive solutions for proteomics research.

176 A. Vertes
2. Methods in proteomics
A common task in proteomic analysis is to identify a subset of proteins in a bio-medical sample. In principle, this can be accomplished through two differentroutes. The first, and most common, approach is to break down the proteins intopeptide segments of manageable size through enzymatic digestion and analyzethese building blocks using mass spectrometry. This is the so-called bottom-upapproach. The other, less common, method that relies on the analysis of intact pro-teins is the top-down approach. The top-down strategy requires high-performancemass spectrometers (e.g., ion cyclotron resonance, ICR, or orbitrap systems; seeChapter 6) with exceptional mass resolution and accuracy in combination withpowerful fragmentation techniques (such as electron capture dissociation, ECD) to
Fig. 1. Fundamental molecular classes in eukaryotic organisms and their interactions. Subdisciplinesdevoted to studying particular classes are shown on the perimeter. Genomics gives an unprecedentedglimpse into the DNA-based molecular design of life. Proteomics studies the translated and modifiedproteins, the main actors of cellular processes, and metabolomics tracks the dynamic changes in themakeup of small molecules brought about by inherent and environmental conditions. Ultimately, allthe molecular constituents, their interactions, and the knowledge of the entire reaction network areneeded to understand the basic processes in physiology.
DN A
RN A /mR N A
PR OTE INS
Tr an s c r ip t io n
Tran s lat io n
M etab o lit es
RE A CTI ON N ETW OR K S
ge n es
M o di fi ed pr o tein s
METABOLOMICS
PR OTE O M ICS
GENOMICS
Pro c essi n g
Mo d i f ic at io n s
TR A N SCRI PTO M ICS
DNA genes
RN A /mR N ARNA/mRNA
PROTEINS
Transcription
Translation
Metabolites
REACTION NETWORKS
M o di fi ed pr o tein sModified proteins
M E T A B O L O M I C S
PROTEOMICS
G E N O M I C S
Processing
Modifications
TRANSCRIPTOMICS

Mass spectrometry in proteomics 177
enable sequence readout. In the following sections we briefly review the methodsused in the bottom-up and top-down approaches.
2.1. Peptide mapping
Peptide mapping takes advantage of the accurate mass measurement of uniqueprotein fragments produced by highly specific enzymatic digestion. Typically,trypsin is used due to its high fidelity in producing peptides in the size rangemost efficient for protein identification (400 � m/z � 5000). This range corre-sponds to �4–45 amino acid residues; thus, the corresponding peptides exhibitsufficient specificity. It also coincides with the m/z range where some commonmass analyzers (e.g., quadrupoles or ion traps) show their best performance.
Accurate mass measurement of the resulting peptides produces a set of m/zvalues that can be compared against a database of protein fragment masses[9,10]. These fragment databases are produced by the in silico digestion of all theentries in large protein databases. Several fragment databases are availableonline with the necessary searching tools. For example, as of January 9, 2007, theSwissProt protein database contained 252,616 entries. Their in silico digestionusing trypsin with a single missed cleavage allowed the production of 10,225,094peptides [11]. The search algorithm finds the proteins with enzymatic fragmentsin this database that match the measured peptide masses within a predefined tol-erance. Usually there are multiple possible matches and a review is required tofurther narrow the set and ultimately identify the unknown protein.
The efficiency of identification greatly depends on the performance of the massspectrometer. Most notably, the mass accuracy of the instrument, usually deter-mined by studying standards, has a dramatic effect. Clearly, the more accurate themeasured masses are the narrower is the set of proteins that produce fragmentswith masses within the tolerance. The number of peptides identified is correlatedwith the amino acid residue coverage of the original protein.
We demonstrate the mechanics of peptide mapping using the example ofthe �-chain of human hemoglobin. This protein is composed of 141 residues:VLSPADKTNVKAAWGKVGAHAGEYGAEALERMFLSFPTTKTYFPHFDLSHGSAQVKGHGKKVADALTNAVAHVDDMPNALSALSDLHAHKLRVDPVNFKLLSHCLLVTLAAHLPAEFTPAVHASLDKFLASVSTVLTSKYR.Unfragmented, it appearsin the MALDI mass spectrum as a protonated ion with a molecular weight of15,126.5 Da. This single number is clearly not specific enough to identify theprotein. There are many other proteins with the same m/z, e.g., the ones with anypermutation of the residues. Tryptic digestion with no missed cleavages producescharacteristic fragments in the 400 � m/z � 5000 range. Table 1 shows thesefragments, their location in the original protein molecule, and the correspondingcalculated monoisotopic and average masses.

178 A. Vertes
Table 1
Monoisotopic (mi) and average (av) peptide masses from tryptic digestion of human hemoglobin � chain [11]
m/z (mi) m/z (av) Start Sequence End
461.2718 461.5416 8 TNVK 11532.2878 532.6235 12 AAWGK 16729.4141 729.8564 1 VLSPADK 7818.4407 818.9537 93 VDPVNFK 991071.5543 1072.3195 32 MFLSFPTTK 401252.7147 1253.4903 128 FLASVSTVLTSK 1391529.7343 1530.6470 17 VGAHAGEYGAEALER 311833.8919 1835.0415 41 TYFPHFDLSHGSAQVK 562996.4894 2998.3651 62 VADALTNAVAHVDDMPNALSALSDLHAHK 903038.6496 3040.6206 100 LLSHCLLVTLAAHLPAEFTPAVHASLDK 127
In our first example we use a low-performance mass spectrometer. Assumingthat five peptides (m/z 729.86, 818.95, 1072.32, 1253.49, and 1530.65) appear inthe mass spectrum (e.g., as commonly observed, due to the ion-suppressioneffect we do not detect all tryptic peptides), the average masses are determinedwith 2000 ppm mass accuracy, and the search in the SwissProt database isrestricted to the proteins of Homo sapiens, the MS-Fit searching tool of ProteinProspector [11] finds 114 entries that are more or less consistent with this data.The relevant section of the mass spectrum is shown in Fig. 2. Note that in thisexample no impurities complicate the spectrum.
Fig. 2. Five fragment masses determined from the mass spectrum of the mock unknown protein(human hemoglobin � chain) tryptic digest form the basis of peptide mapping. The mass-to-chargeratio is labeled m/z on the horizontal axis.
500 1000 1500 20000
20
40
60
80
1001530.65
1253.49
818.95
729.86
Inte
nsity
m/z
1072.32

Mass spectrometry in proteomics 179
The top-ranked hit is human hemoglobin � subunit with all five massesmatched, but with only 35.5% coverage (in light gray below).
The other proteins on the list showed fewer number of matching peptides or lowerdegree of coverage.
There are several ways to increase the fidelity of protein identification. Chiefamong them are to use better performing instrumentation [12] (nowadays a typicalhigh-performance mass spectrometer can achieve �5–10 ppm mass accuracy) andto identify more peptides. Improving the mass accuracy to 50 ppm for the sameset of m/z values does not increase the coverage, but it reduces the number of hitsfrom 114 to a single one, human hemoglobin � subunit.
Increasing the number of peptides used in the search to 10 (m/z 461.54, 532.62,729.86, 818.95, 1072.32, 1253.49, 1530.65, 1835.04, 2998.37, and 3040.62) with-out improving mass accuracy (keeping it at 2000 ppm) actually increases thenumber of hits in the search to 1151, but the coverage of the top scoring humanhemoglobin � subunit increases to 93.6%.
Enhanced mass accuracy (50 ppm) for this set of peptides reduces the numberof hits to one, the human hemoglobin � subunit, with 93.6% coverage. Thus, theright sample preparation and ionization method in combination with speciesinformation and reasonable instrument performance enabled us to identify a singleprotein in a database of over 250,000 entries.
2.2. Peptide fragmentation
Peptide mapping does not require any knowledge about the primary structure of theprotein or of its fragments. Owing to peptide fragmentation, however, parts of theprimary structure might become known from the mass spectra. The spontaneousfragmentation of peptides is relatively slow; it mostly takes place in the postsourceregion of the mass spectrometer. In time-of-flight instruments equipped with anion reflector, the ions produced by postsource decay (PSD) become observablein the mass spectrum at appropriate reflector voltage settings. This gives rise topeptide-sequencing capabilities [13].
More energetic ionization methods (in-source decay, ISD) or collisions withinert (collision-activated dissociation, CAD, also known as collision-induced
1 VLSPADKTNVKAAWGKVGAHAGEYGAEALERMFLSFPTTKTYFPHFDLSHGSAQVKGHGKKVADALTNAVAHVDDMPNAL81SALSDLHAHKLRVDPVNFKLLSHCLLVTLAAHLPAEFTPAVHASLDKFLASVSTVLTSKYR
1 VLSPADKTNVKAAWGKVGAHAGEYGAEALERMFLSFPTTKTYFPHFDLSHGSAQVKGHGKKVADALTNAVAHVDDMPNAL81SALSDLHAHKLRVDPVNFKLLSHCLLVTLAAHLPAEFTPAVHASLDKFLASVSTVLTSKYR

180 A. Vertes
dissociation, CID) or reacting species (ECD and electron transfer dissociation,ETD) also produce structural data. In these techniques, fragmentation of thepeptide backbone is induced through increasing the internal energy of the ions(ISD and CAD) or through ion chemistry (ECD and ETD). Thus, the presence ofparticular fragments in the spectrum is the function of the different ionizationmethods, e.g., MALDI and ESI, and more recently desorption/ionization on sili-con [14] (DIOS) and laser-induced silicon microcolumn arrays [15] (LISMA) aswell as instrument types (TOF, ion trap, ICR, etc.). There is more control overfragmentation patterns in tandem mass spectrometers (e.g., MS/MS and MSn),where the primary ion internal energy can be adjusted by, for example, CAD.
Depending on the actual bond that breaks in the peptide backbone (C–C, C–N,or N–C) and on the partitioning of the charge on the resulting fragments (amino orcarboxyl side fragment), there are six major fragment types. Their nomenclaturefor a pentapeptide is shown below.
Other less common fragmentation pathways, e.g., resulting in internal fragmentsor neutral loss ions, are not discussed here. As an example we can look at the neu-ropeptide leucine enkephalin, which has a sequence of YGGFL and a protonatedmonoisotopic mass of m/z 556.28. The fragmentation of this ion in a collision cellthrough CAD might produce a tandem mass spectrum similar to the one in Fig. 3.
H2NNH
HN
O
O
O
NH
HN
O
O
OHR1
R2
R3
R4
R5
a1 b1 c1 a2 b2 c2 a3 b3 c3 a4 b4 c4
x4 y4 z4 x3 y3 z3 x2 y2 z2 x1 y1 z1
Fig. 3. Fragmentation of the protonated leucine enkephalin molecular ion via CAD in a tandem massspectrometer.
0 100 200 300 400 500 6000
20
40
60
80
100
LFGGG
a1
136.09
b2
221.10
425.17556.29
336.20
278.12
Inte
nsity
m/z
279.16
[M+H]+b4
y3
y2
b3
Y

Mass spectrometry in proteomics 181
In this simplified case the identity of amino acid residues in the peptide canbe inferred from the mass differences of successive peaks by comparing themwith the known masses of the amino acids. In real-world samples, the presence ofother ions and the absence of certain fragments make this task fairly com-plex. Comparison of the measured m/z values in the spectrum with the calculatedfragment masses in Table 2 enables the assignment of the peaks.
In addition to a1 and the molecular ion, parts of the bn and yn series are presentin Fig. 3. The sequence can be read as YGGFL. Note that the y series reads thesequence from right to left, whereas the b series reports it from left to right.Coincidentally, the mass difference between b2 and b3 and between y2 and y3 iden-tify the same residue.
Changing the internal energy of the ions through CAD can reveal more aboutthe primary structure. This can be induced by changing the collision energy ofthe primary ions or by changing the collision gas pressure in the tandem massspectrometer [16]. With the emergence of new laser desorption/ionizationplatforms based on nanostructured silicon, simpler instrumentation can alsoyield similar data. Fig. 4 shows the spectrum of a vasodilator peptide,bradykinin (RPPGFSPFR), as a function of relative laser intensity. At low laserpower the molecular ion dominates the spectrum. This can be advantageous incomplex mixtures, where the molecular weights of the different components canbe identified. Increasing the laser power from 95 to 145 relative value resultedin enhanced structure-specific fragmentation. Although the entire primary struc-ture cannot be inferred from this spectrum, the identity of the N-terminalresidues is revealed.
Even in the case of unmodified residues, entire peptide sequences are rarelyrevealed by fragment spectra induced by CAD. The task is even more complexwhen posttranslational modifications are present. Phosphorylation, for example, isprevalent due to its role in signal transduction and in the regulation of proteinfunction. In eukaryotic cells, as much as 30% of the proteins can be phosphory-lated. Histone protein functions are believed to be regulated by acetylation,phosphorylation, methylation, and ubiquitination. These modifications play animportant part in fundamental biological functions, e.g., gene silencing. Identifying
Table 2
Monoisotopic masses of major fragment ions for leucine enkephalin
N-terminal ions C-terminal ions
N 1 2 3 4 N 4 3 2 1
an 136.08 193.10 250.12 397.19 xn 419.19 362.17 305.15 158.08bn – 221.09 278.11 425.18 yn 393.21 336.19 279.17 132.10cn – 238.12 295.14 442.21 zn 377.19 320.17 263.15 116.08

182 A. Vertes
the modified residues by mass spectrometry requires comprehensive fragmentationof the protein domains of interest [17].
2.3. Sequence tags
Although comprehensive sequence information on protein domains is not avail-able on most instruments, shorter segments are often revealed by PSD, CAD, orother techniques. The concept of a sequence tag is based on using the partialsequence of a peptide digestion product, usually composed of a few residues, incombination with the masses of the adjoining N- and C-terminal fragments to effi-ciently search protein databases for the identity of unknown proteins [18,19].
For example, let us assume that we find three b series fragment ions, m/z 908.4,1021.5, and 1108.5 in the CAD spectrum from the tryptic digest of the humanhemoglobin � subunit that belong to the peptide parent ion with m/z 1833.9 (seeFig. 5). This is the peptide between residues 41 and 56 in Table 1.
The mass differences in the b series reveal the presence of L/I followed by S inthe sequence. This information is sufficient to attempt a sequence tag search.Searching the SwissProt database for H. sapiens proteins by entering m/z 1833.9for the parent ion and 1108.5, 1021.5, and 908.4 for the b series fragments in theMS-Seq searching tool of Protein Prospector [11] turns up a single protein, humanhemoglobin � subunit with primary accession number P69905.
Fig. 4. Laser desorption/ionization of 1 pmol of bradykinin from a LISMA surface produces increas-ing amount of structure-specific fragmentation as the relative laser power increases.
0
100
80
60
40
20
a5 [M+H]+
c6
-NH
3
-NH
3
a6
y8
y7
y6 Laser Power145
135
120
95
Mass/Charge600 800 1000 1200 1400

Mass spectrometry in proteomics 183
The initial 252,616 entries in the database are reduced to 1328 by the parentmass filter. Using the three fragment masses the number of matching proteins forall species is 80. At this point, all the hits are related to the hemoglobin � subunit.Introducing the information on the species produces a single hit. Note, however,that the sequence coverage of the protein is only 11.3%. This limitation curtailsthe value of sequence tag identifications in the presence of multiple posttransla-tional modifications.
2.4. De novo sequencing
We have seen powerful methods to identify proteins in a sample based on massspectra and information from large protein databases. These strategies require thatthe protein of interest exists in the database. Protein databases contain informationthat was originally produced by traditional Edman sequencing or by meticulousmass spectrometric methods commonly known as de novo sequencing. Theseapproaches are necessary if the protein of interest is undescribed or substantiallymodified. Although both Edman degradation and tandem mass spectrometry canprovide sequences with acceptable accuracy, recently mass spectrometry seems tohave come out on top due to its dramatically higher throughput and better sensitivity.
There are two major approaches to de novo sequencing by mass spectrometry.The first one is based on a number of empirical rules obtained by observing typi-cal peptide fragmentation schemes [20]. Current versions of this approach rely oncomputerized expert systems that are built on the dozens of empirical rules andfactors. These include general observations on the prevalence of certain fragmentsin spectra produced by the used fragmentation methods and in typical instruments.For example, CAD is known to produce predominantly y- and b-type ions. There
Fig. 5. MS/MS mass spectrum reveals the partial sequence of a tryptic peptide from the humanhemoglobin � subunit. This information is sufficient to successfully perform a sequence tag searchand identify the protein. L�I stands for leucine or isoleucine, whereas Xm and Xn denote unknownsequences.
600 800 1000 1200 1400 1600 1800 20000
20
40
60
80
100
XnSL/I
Xm
b7
908.4
1108.5
1833.9
1021.5
Inte
nsity
m/z
[M+H]+
b9
b8

184 A. Vertes
are other rules related to neutral losses and relative intensities of spectral features,and on determining the presence of certain amino acid residues based on immoniumions formed by the combination of a- and y-type cleavages.
Furthermore, it is imperative to recognize the ambiguities resulting from iden-tical or indistinguishable masses (isobars). Common examples are leucine andisoleucine or lysine and glutamine with only 0.0364 Da mass difference for thelatter. Similar problems arise when dipeptide masses are isobaric with singleamino acids or with other dipeptides. These challenges can only be resolved byusing instrumentation of sufficiently high mass accuracy or by residue-specificchemical derivatization. The expert systems can successfully call sequences ofover 10 residues, including posttranslational modifications.
The other approach to de novo sequencing is based on a systematic treatmentof tandem mass spectrometric data and database search. An excellent descriptionof these methods is available in Chapter 9; thus, we refrain from the detailed dis-cussion here.
As the exploration of the human proteome advances from better known proteinsto more and more obscure ones, the significance of de novo sequencing as the pri-mary source of information is likely to grow. Similarly, the identification of splicevariants, mutations, and modifications calls for increasing number of de novoinvestigations.
2.5. Electron capture and electron transfer dissociations
As we pointed out in Section 2.2, the y and b series ions induced by CAD, or othermethods of gradually producing elevated internal energy, rarely reveal even themajority of the residues. For example, only �25% of the 76-residue ubiquitinsequence can be identified through CAD. This incomplete information leaves theprimary structure unresolved.
The problem with gradually energizing these polypeptide ions seems to be therapid redistribution of internal energy, which leads to the preferential breakage ofa low number of the weakest bonds. After several years of searching for a methodto produce more complete fragmentation, great improvement was achieved byreacting low-energy electrons and the multiply charged peptide ions, [M � nH]n�,produced by ESI [21]. This method, termed electron capture dissociation (ECD),produced a radical cation, [M � nH](n�1)�•, that in turn rapidly dissociated intoc and z series ions with the degree of fragmentation approaching 80% and withoutpreference to bond strength [22]. An alternative fragmentation pathway can alsoproduce a- and y-type ions. Not only the fragments in ECD provide higher cover-age than CAD but also the information in the two methods is complementary.Thus, a mass spectrometric method to sequence large peptides and small proteins intheir entirety became feasible. This also presented a realistic approach to top-down

Mass spectrometry in proteomics 185
proteomics, i.e., to the analysis of intact protein components without enzymaticcleavage.
A comparison of the fragments produced by CAD and ECD shows the advan-tages of the latter in phosphopeptide analysis. Quadruply charged molecular ionsof a 28-mer phosphopeptide, atrial natriuretic peptide substrate (ANPS),SLRRSpSCFGGRIDRIGAQSGLGCNSFRY, were fragmented by the two methods[23]. The resulting patterns showed incomplete fragmentation (20 of the 27 pep-tide bonds) for CAD with significant loss of the phosphorylation site information.The corresponding ECD spectrum showed complete sequence coverage and thelocation of the phosphorylation site (see Fig. 6).
ETD takes the concept of ECD to the next level [24]. Owing to the conditionsrequired to trap the thermalized electrons that produce ECD, it can only be per-formed in ICR mass spectrometers. These systems are large and expensive;thus, this technical requirement limits the availability of ECD to a relativelysmall number of laboratories. To make the benefits of ECD available on morecommon instrumentation (e.g., ion traps), heavier electron-donating agents, i.e.,low electron affinity anions are needed that can be trapped together with thepeptide ions. Anthracene [24] and fluoranthene [17] radical anions as ETDagents were shown to generate primarily c- and z-type ions from multiplycharged large peptide, phosphopeptide, and small protein species. Like ECD,ETD produces close to complete fragmentation and thus enables the elucidationof primary structures.
Fig. 6. Comparison of fragmentation patterns for a 28-mer phosphopeptide. In the top pattern pro-duced by CAD, incomplete backbone fragmentation and extensive phosphate loss (denoted by �P)can be observed. Numbers indicate the charge carried by a particular fragment. Complete sequencereadout and identification of the phosphorylation site are straightforward for ECD (bottom pattern).(Reprinted with permission from: Shi, S.D.H., Hemling, M.E., Carr, S.A., Horn, D.M., Lindh, I. andMcLafferty, F.W., Anal. Chem., 73, 19–22 (2001). Copyright 2001. American Chemical Society.)
186 A. Vertes
A fascinating application of ETD is the analysis of posttranslational modifica-tions on the H3.1 histone tail [17]. Histones are proteins found in chromatin andserve as the core for DNA coils. It is hypothesized that particular combinations ofposttranslational modifications, e.g., acetylation, methylation, and phosphoryla-tion, on the histone tail at the amino terminus, form a code that is directly involvedin gene regulation [25]. A 50-mer peptide from the amino terminus of H3.1 wasisolated from human cells and subjected to ETD by fluoranthene anions in an ion-trap mass spectrometer. To reduce the charge state of the produced fragments,proton-transfer reactions were performed by benzoic acid anions. The resultingmass spectra showed a unique pattern of methylation sites that showed systematicvariations during chromatographic separation. Correlating these modificationswith gene expression data is instrumental in understanding the role of histonemodifications in gene regulation.
2.6. Quantitative proteomics
Unlike nucleic acids, proteins in an organism are present at very different concen-tration levels. Thus, it is not sufficient to demonstrate that a particular protein ispresent; we also need to know its concentration. From the high-concentrationglobulins in blood to the low-copy-number proteins that are represented by only afew molecules per cell, there is an enormous dynamic range. This presents achallenge to the utilized analytical methods because of the potential interferences,especially when quantitating the proteins at low concentration. For example, thehigh-abundance proteins can compete in the ionization process and suppressthe ion formation from the low-level species. This ion suppression effect is quitecommon in MALDI and ESI ion sources.
Common approaches to minimize these problems include extensive separationbefore mass spectrometric analysis. Typical separation protocols consist of anorthogonal combination of affinity chromatography, 2-DE, IEX, HPLC, and ionmobility techniques. If these steps can reduce the sample complexity to a singlecomponent, the signal from the separation method (e.g., chromatographic peakarea) can be used for quantitation. Frequently this is not achievable or verifiable.Relative quantitation in these instances can be performed by stable isotope labelingmethods.
A common example of relative quantitation is used in comparative pro-teomics. For example, to uncover the differences in protein makeup and concen-tration levels between the healthy state and a particular disease (e.g., proteinexpression in normal vs. HIV-infected cells [26]), stable isotope labeling can beapplied to one or the other. A frequently used variant of this approach is the iso-tope-coded affinity tag (ICAT) method [27]. Fig. 7 shows how an ICAT reagentis used to tag the cysteine residues of a peptide, human insulin chain B in thisexample. First, the reactive end of the ICAT reagent covalently attaches to the

Mass spectrometry in proteomics 187
cysteine residues through thiol chemistry. One form of the reagent, d0-ICAT withno deuterium atoms, can be used to label the sample from the healthy source,whereas the other, d8-ICAT with eight hydrogens in the linker replaced by deu-terium, can designate the diseased sample. As a result the tagged peptides in thehealthy and the diseased samples will exhibit a mass difference of 8 or its multi-ples depending on the number Cys residues. In the next step the two samples arecombined and the biotin end of the ICAT reagent is used to separate the taggedpeptides through affinity capture with avidin. This results in significantlyreduced sample complexity.
The mass spectrum of the captured mixture exhibits the peptide peaks as dou-blets with a mass shift of 8 or, in case of multiple cysteine residues, its multiplesbetween the normal and the diseased sample. The abundance ratios of these dou-blets characterize the relative quantity of a particular protein in the two samples.As both the d0- and the d8-tagged components are in the same matrix and differonly in isotope composition, the relative peak intensities are a true reflection of theprotein level changes in disease. The ICAT method is limited to cysteine-containingproteins, but other tagging protocols (e.g., through proteolytic 18O labeling) arebeing developed to eliminate this restriction [28].
2.7. Higher order structures
The efficiency of mass spectrometric methods in determining primary proteinstructure naturally leads to the question of their utility to characterize secondary,tertiary, and quaternary structures as well as the formation of noncovalent com-plexes. The success of mass spectrometry in approaching these problems is morelimited. For example, there are some legitimate questions about the correspondence
Fig. 7. Cysteine residues of human hemoglobin chain B are tagged with ICAT reagent. The codingof the linker, X, can be hydrogen (d0-ICAT) for the normal sample and deuterium (d8-ICAT) for thediseased sample.
NH NH
S
O
H N
O
O
X
XX
X
OO
X
X H N
X
XI
O
Phe Val Gln His Leu Cys Gly Ser His Leu Val Ala Leu Tyr Leu Val Cys Gly Glu ArgGlyPhePheTyrThrProLysThr
ICAT ICAT
BIOTIN ISOTOPE CODED LINKER REACTION WITH Cys
GluAsn

188 A. Vertes
of these structures between the native solution state and their ionized form in thegas phase. Are there significant structure changes as the molecule is ionized? Howdoes the structure change when the molecule loses its solvation shell duringvolatilization?
It was noticed in the early 1990s that conformation changes, for example, dueto pH changes, resulted in altered charge-state distributions in ESI spectra [29].Although there are literature reports on successful deconvolution of these chargedistributions to assess the relative weight of coexisting conformations (bothsecondary and tertiary structures) [30], the method is far from being routinelyapplicable. This approach hinges on the differences in the available protonationsites in a multiply charged ion in its folded and stretched conformations. When themolecule is folded, only the protonation sites exposed on its surface are accessi-ble, whereas in its stretched conformation, at least in principle, all amenable sitesshould be ionized. Thus, unfolding of the molecule is reflected in a charge statedistribution shifted to lower m/z values. Under limited conditions, folding andunfolding kinetics can also be followed measuring the time dependence of chargestate distributions following a chemical perturbation (e.g., pH change) of thesystem.
Another method to study higher order protein structure is hydrogen–deuteriumexchange [31]. When a protein molecule is dissolved in deuterium oxide, D2O(“heavy water”), deuterium atoms start to exchange their accessible hydrogens. Theresulting mass difference in the mass spectrum of the protein and its digestion prod-ucts can reveal which part of the folded protein is accessible for the D2O molecules.
Carbon-bound hydrogens do not exchange, whereas the exchange on the sidechains of certain residues (e.g., Arg, Asn, Cys, and Trp) is very fast, essentiallyimmediate on the timescale of the experiment. The exchange rate of amide hydro-gens on the peptide backbone is between the two extremes and can be used toexplore protein structure. The exchange rates of these amide hydrogens alsodepend on the pH and the temperature, so adjusting these parameters gives addi-tional control. A typical experiment starts with exchanging the solvent to D2O atpH 7.0 and at room temperature. This initiates the exchange of accessible amidehydrogens at the surface of the protein to deuterium. Changing the pH to 2.5 andthe temperature to 0ºC arrests the exchange process and gives enough time to per-form enzymatic digestion (typically with pepsin) followed by HPLC separationand mass spectrometry. A complicating factor is back exchange that can replacethe deuterium already in the peptide fragments with hydrogen. This effect can beestimated and the results corrected for it.
The hydrogen–deuterium exchange method can be used to study secondary, ter-tiary, and even quaternary structures. Amide hydrogens in the hydrophobic core ofthe protein or at the interface of attached subunits are less accessible for theexchange reaction. Studying the kinetics of the exchange can reveal unfolding

Mass spectrometry in proteomics 189
dynamics and the association of partners in noncovalent complexes. The advantagesof mass spectrometry over competing techniques used in combination with hydrogen–deuterium exchange (e.g., NMR) are the very low amount of protein required(�1 nmol) and the ability to tackle very large proteins including an entire 2.5 MDaribosome and its subunits [32]. In addition, protein mixtures can also be studied withmass spectrometry.
Molecular recognition and noncovalent complexes are at the core of reactionnetworks in biology. Molecular complexes are often associated with the prolif-eration of disease (see, for example, the Tax-associated complexes in humanT-cell leukemia type 1, HTLV-1 [33]). Along with other competing techniques(e.g., surface plasmon resonance), mass spectrometry can be successfully usedto detect noncovalent complex formation. The corresponding ions can be pres-ent in both MALDI [34] and ESI [35] spectra, although the latter is used moreoften. A wide variety of protein–protein interactions as well as protein interac-tions with other species (nucleotides, carbohydrates, etc.) have been studied.The spectra can reveal the components of the complex and in some cases theassociation constant.
2.8. Mapping protein function
From the biomedical perspective, structural and kinetic studies are incompletewithout determining the function of the protein. In the discussion of posttransla-tional modifications and noncovalent complexes, we have already indicated theirimportant role in regulating the role a protein plays. In addition to biological func-tion, protein-based drug and vaccine design also requires the elucidation of theirmechanism of action. From heart disease to cancer, there are many examples inthis volume showing the variety of implicated proteins [36]. Conversely, structuraldiscrepancies in proteins are shown to result in disease states.
An interesting example of using mass spectrometry to unravel protein functionis epitope mapping. In broad terms, an epitope is the binding site on the surface ofa protein that attaches to another molecule; for example, to a monoclonal antibody.There are two general strategies to identify the epitope. In the first one the proteinis attached to the antibody. Then, proteolytic digestion is performed that removesthe nonattached parts of the protein. Mass spectrometric analysis of the removedfragments and the segment retained on the antibody can reveal the epitope. In thesecond strategy, the studied protein is digested first and the resulting mixture isaffinity separated by the monoclonal antibody. The protein fragment that containsthe epitope is preferentially captured [37].
Even if the participating protein segments are discontinuous, epitopes can alsobe identified by hydrogen–deuterium exchange. The components of the noncova-lent complex are deuterated in D2O environment and allowed to react. When the

190 A. Vertes
solvent is changed to water, the amide deuterium atoms on the exposed surface ofthe formed complex are exchanged with hydrogen. The epitope region, however, isnot affected because it is not exposed. Displacing the protein from the complex fol-lowed by pepsin digestion produces peptides that are deuterated at the epitope. Theresulting mass differences can be detected by MALDI mass spectrometry [38].
Although epitope mapping can contribute an important piece of the puzzle,identifying protein function requires a more complex approach. The available sub-set of genetic, X-ray diffraction, NMR, and mass spectrometric data has to be con-sidered in its entirety to shed light on the function of newly discovered proteins [39].Often similarity searches in genomic and proteomic databases can provide an ini-tial hypothesis based on homology with proteins of known function. For example,proteomic analysis of the Torpedo californica electric organ, a large-scale modelfor the neuromuscular junction, identified 11 human open reading frames codingfor proteins of unknown function [40]. When similarity is not found, high-resolution structures (X-ray and NMR data) as well as mass spectrometric study ofnoncovalent complexes can be used to identify active sites and infer the possiblefunctions of the protein.
3. Outlook
In the past few years we have witnessed the explosive growth in the field ofproteomics. During this period, proteomics has captured the attention of academia,government, and industry alike. At the universities, new courses are being intro-duced to teach the related technologies and applications for the emerging genera-tion of biomedical professionals. Government funding in developed countries isincreasingly available in the proteomics field. The landscape of mass spectrometermanufacturing has been reordered by the technological demands of proteomics;reagent, diagnostic, and pharmaceutical vendors gear up to take advantage of thenew market opportunities.
This dramatic new focus was already clearly discernable from the presentationsat the 2002 symposium organized by the U.S. National Academies, Defining theMandate of Proteomics in the Post-Genomics Era as well as from the launchingof three dedicated journals, Journal of Proteome Research, Molecular andCellular Proteomics, and Proteomics. Learning from the lessons of the HumanGenome Project, it was clear from the outset that international efforts had to becoordinated. In 2001 an international consortium, the Human ProteomeOrganization (HUPO), was launched to facilitate several initiatives, includingprojects related to the proteomes of the liver, brain, and plasma, to the develop-ment of proteomics standards, and to mouse models of human disease [41].
Despite its short history, the field of proteomics has already started to differen-tiate. Beyond the basic distinction between methods, including instrumentation and

Mass spectrometry in proteomics 191
bioinformatics, and applications to biomedical problems of interest, more or lesscoherent subfields are beginning to appear. Among them are proteomics within thesubdisciplines of biology (e.g., proteomics in cell biology and microbiology, plantproteomics, and animal proteomics) as well as proteomics in the medical fields(e.g., the proteomics of a certain organ or disease). As the discovery of disease-related protein biomarkers continues, proteomics is poised to become an everydaytool in clinical diagnostics and serve as a basis for new therapies.
References
1. Lander, E.S., Linton, L.M., Birren, B., Nusbaum, C., Zody, M.C., Baldwin, J., Devon, K., Dewar,K., Doyle, M., FitzHugh, W., Funke, R., Gage, D., Harris, K., Heaford, A., Howland, J., Kann, L.,Lehoczky, J., LeVine, R., McEwan, P., McKernan, K., Meldrim, J., Mesirov, J.P., Miranda, C.,Morris, W., Naylor, J., Raymond, C., Rosetti, M., Santos, R., Sheridan, A., Sougnez, C., Stange-Thomann, N., Stojanovic, N., Subramanian, A., Wyman, D., Rogers, J., Sulston, J., Ainscough,R., Beck, S., Bentley, D., Burton, J., Clee, C., Carter, N., Coulson, A., Deadman, R., Deloukas,P., Dunham, A., Dunham, I., Durbin, R., French, L., Grafham, D., Gregory, S., Hubbard, T.,Humphray, S., Hunt, A., Jones, M., Lloyd, C., McMurray, A., Matthews, L., Mercer, S., Milne,S., Mullikin, J.C., Mungall, A., Plumb, R., Ross, M., Shownkeen, R., Sims, S., Waterston, R.H.,Wilson, R.K., Hillier, L.W., McPherson, J.D., Marra, M.A., Mardis, E.R., Fulton, L.A.,Chinwalla, A.T., Pepin, K.H., Gish, W.R., Chissoe, S.L., Wendl, M.C., Delehaunty, K.D.,Miner, T.L., Delehaunty, A., Kramer, J.B., Cook, L.L., Fulton, R.S., Johnson, D.L., Minx, P.J.,Clifton, S.W., Hawkins, T., Branscomb, E., Predki, P., Richardson, P., Wenning, S., Slezak, T.,Doggett, N., Cheng, J.F., Olsen, A., Lucas, S., Elkin, C., Uberbacher, E., Frazier, M., Gibbs, R.A.,Muzny, D.M., Scherer, S.E., Bouck, J.B., Sodergren, E.J., Worley, K.C., Rives, C.M., Gorrell,J.H., Metzker, M.L., Naylor, S.L., Kucherlapati, R.S., Nelson, D.L., Weinstock, G.M., Sakaki, Y.,Fujiyama, A., Hattori, M., Yada, T., Toyoda, A., Itoh, T., Kawagoe, C., Watanabe, H., Totoki, Y.,Taylor, T., Weissenbach, J., Heilig, R., Saurin, W., Artiguenave, F., Brottier, P., Bruls, T., Pelletier,E., Robert, C., Wincker, P., Rosenthal, A., Platzer, M., Nyakatura, G., Taudien, S., Rump, A.,Yang, H.M., Yu, J., Wang, J., Huang, G.Y., Gu, J., Hood, L., Rowen, L., Madan, A., Qin, S.Z.,Davis, R.W., Federspiel, N.A.,Abola,A.P., Proctor, M.J., Myers, R.M., Schmutz, J., Dickson, M.,Grimwood, J., Cox, D.R., Olson, M.V., Kaul, R., Raymond, C., Shimizu, N., Kawasaki, K.,Minoshima, S., Evans, G.A.,Athanasiou, M., Schultz, R., Roe, B.A., Chen, F., Pan, H.Q., Ramser,J., Lehrach, H., Reinhardt, R., McCombie, W.R., de la Bastide, M., Dedhia, N., Blocker, H.,Hornischer, K., Nordsiek, G., Agarwala, R., Aravind, L., Bailey, J.A., Bateman, A., Batzoglou,S., Birney, E., Bork, P., Brown, D.G., Burge, C.B., Cerutti, L., Chen, H.C., Church, D., Clamp,M., Copley, R.R., Doerks, T., Eddy, S.R., Eichler, E.E., Furey, T.S., Galagan, J., Gilbert, J.G.R.,Harmon, C., Hayashizaki, Y., Haussler, D., Hermjakob, H., Hokamp, K., Jang, W.H., Johnson, L.S.,Jones, T.A., Kasif, S., Kaspryzk, A., Kennedy, S., Kent, W.J., Kitts, P., Koonin, E.V., Korf, I.,Kulp, D., Lancet, D., Lowe, T.M., McLysaght, A., Mikkelsen, T., Moran, J.V., Mulder, N.,Pollara, V.J., Ponting, C.P., Schuler, G., Schultz, J.R., Slater, G., Smit, A.F.A., Stupka, E.,Szustakowki, J., Thierry-Mieg, D., Thierry-Mieg, J., Wagner, L., Wallis, J., Wheeler, R., Williams,A., Wolf,Y.I., Wolfe, K.H.,Yang, S.P.,Yeh, R.F., Collins, F., Guyer, M.S., Peterson, J., Felsenfeld,A., Wetterstrand, K.A., Patrinos, A. and Morgan, M.J., Initial sequencing and analysis of thehuman genome, Nature, 409, 860–921 (2001).

192 A. Vertes
2. Venter, J.C., Adams, M.D., Myers, E.W., Li, P.W., Mural, R.J., Sutton, G.G., Smith, H.O.,Yandell, M., Evans, C.A., Holt, R.A., Gocayne, J.D., Amanatides, P., Ballew, R.M., Huson,D.H., Wortman, J.R., Zhang, Q., Kodira, C.D., Zheng, X.Q.H., Chen, L., Skupski, M.,Subramanian, G., Thomas, P.D., Zhang, J.H., Miklos, G.L.G., Nelson, C., Broder, S., Clark,A.G., Nadeau, C., McKusick, V.A., Zinder, N., Levine, A.J., Roberts, R.J., Simon, M.,Slayman, C., Hunkapiller, M., Bolanos, R., Delcher, A., Dew, I., Fasulo, D., Flanigan, M.,Florea, L., Halpern, A., Hannenhalli, S., Kravitz, S., Levy, S., Mobarry, C., Reinert, K.,Remington, K., Abu-Threideh, J., Beasley, E., Biddick, K., Bonazzi, V., Brandon, R., Cargill,M., Chandramouliswaran, I., Charlab, R., Chaturvedi, K., Deng, Z.M., Di Francesco, V.,Dunn, P., Eilbeck, K., Evangelista, C., Gabrielian, A.E., Gan, W., Ge, W.M., Gong, F.C., Gu,Z.P., Guan, P., Heiman, T.J., Higgins, M.E., Ji, R.R., Ke, Z.X., Ketchum, K.A., Lai, Z.W., Lei,Y.D., Li, Z.Y., Li, J.Y., Liang, Y., Lin, X.Y., Lu, F., Merkulov, G.V., Milshina, N., Moore,H.M., Naik, A.K., Narayan, V.A., Neelam, B., Nusskern, D., Rusch, D.B., Salzberg, S., Shao,W., Shue, B.X., Sun, J.T., Wang, Z.Y., Wang, A.H., Wang, X., Wang, J., Wei, M.H., Wides, R.,Xiao, C.L., Yan, C.H., Yao, A., Ye, J., Zhan, M., Zhang, W.Q., Zhang, H.Y., Zhao, Q., Zheng,L.S., Zhong, F., Zhong, W.Y., Zhu, S.P.C., Zhao, S.Y., Gilbert, D., Baumhueter, S., Spier, G.,Carter, C., Cravchik, A., Woodage, T., Ali, F., An, H.J., Awe, A., Baldwin, D., Baden, H.,Barnstead, M., Barrow, I., Beeson, K., Busam, D., Carver, A., Center, A., Cheng, M.L., Curry,L., Danaher, S., Davenport, L., Desilets, R., Dietz, S., Dodson, K., Doup, L., Ferriera, S., Garg,N., Gluecksmann, A., Hart, B., Haynes, J., Haynes, C., Heiner, C., Hladun, S., Hostin, D.,Houck, J., Howland, T., Ibegwam, C., Johnson, J., Kalush, F., Kline, L., Koduru, S., Love, A.,Mann, F., May, D., McCawley, S., McIntosh, T., McMullen, I., Moy, M., Moy, L., Murphy, B.,Nelson, K., Pfannkoch, C., Pratts, E., Puri, V., Qureshi, H., Reardon, M., Rodriguez, R.,Rogers, Y.H., Romblad, D., Ruhfel, B., Scott, R., Sitter, C., Smallwood, M., Stewart, E.,Strong, R., Suh, E., Thomas, R., Tint, N.N., Tse, S., Vech, C., Wang, G., Wetter, J., Williams,S., Williams, M., Windsor, S., Winn-Deen, E., Wolfe, K., Zaveri, J., Zaveri, K., Abril, J.F.,Guigo, R., Campbell, M.J., Sjolander, K.V., Karlak, B., Kejariwal, A., Mi, H.Y., Lazareva, B.,Hatton, T., Narechania, A., Diemer, K., Muruganujan, A., Guo, N., Sato, S., Bafna, V., Istrail,S., Lippert, R., Schwartz, R., Walenz, B., Yooseph, S., Allen, D., Basu, A., Baxendale, J.,Blick, L., Caminha, M., Carnes-Stine, J., Caulk, P., Chiang, Y.H., Coyne, M., Dahlke, C.,Mays, A.D., Dombroski, M., Donnelly, M., Ely, D., Esparham, S., Fosler, C., Gire, H.,Glanowski, S., Glasser, K., Glodek, A., Gorokhov, M., Graham, K., Gropman, B., Harris, M.,Heil, J., Henderson, S., Hoover, J., Jennings, D., Jordan, C., Jordan, J., Kasha, J., Kagan, L.,Kraft, C., Levitsky, A., Lewis, M., Liu, X.J., Lopez, J., Ma, D., Majoros, W., McDaniel, J.,Murphy, S., Newman, M., Nguyen, T., Nguyen, N., Nodell, M., Pan, S., Peck, J., Peterson, M.,Rowe, W., Sanders, R., Scott, J., Simpson, M., Smith, T., Sprague, A., Stockwell, T., Turner,R., Venter, E., Wang, M., Wen, M.Y., Wu, D., Wu, M., Xia, A., Zandieh, A. and Zhu, X.H., Thesequence of the human genome, Science, 291, 1304–1351 (2001).
3. Siuzdak, G., The Expanding Role of Mass Spectrometry in Biotechnology (2nd edition). MCCPress, San Diego, CA, 2003.
4. Fenn, J.B., Mann, M., Meng, C.K., Wong, S.F. and Whitehouse, C.M., Electrospray Ionizationfor Mass-Spectrometry of Large Biomolecules, Science, 246, 64–71 (1989).
5. Tanaka, K., Waki, H., Ido, Y., Akita, S., Yoshida, Y. and Yoshida, T., Protein and PolymerAnalyses up to m/z 100000 by Laser Ionization Time-of-flight Mass Spectrometry, RapidCommun. Mass Spectrom., 2, 151–153 (1988).
6. Karas, M. and Hillenkamp, F., Laser Desorption Ionization of Proteins with Molecular MassesExceeding 10000 Daltons, Anal. Chem., 60, 2299–2301 (1988).
7. See the web site at http://nobelprize.org/nobel_prizes/chemistry/laureates/2002/index.html(accessed February 28, 2007).

Mass spectrometry in proteomics 193
8. Wishart, D.S., Tzur, D., Knox, C., Eisner, R., Guo, A.C., Young, N., Cheng, D., Jewell, K.,Arndt, D., Sawhney, S., Fung, C., Nikolai, L., Lewis, M., Coutouly, M.A., Forsythe, I., Tang, P.,Shrivastava, S., Jeroncic, K., Stothard, P., Amegbey, G., Block, D., Hau, D.D., Wagner, J.,Miniaci, J., Clements, M., Gebremedhin, M., Guo, N., Zhang, Y., Duggan, G.E., MacInnis,G.D., Weljie, A.M., Dowlatabadi, R., Bamforth, F., Clive, D., Greiner, R., Li, L., Marrie, T.,Sykes, B.D., Vogel, H.J. and Querengesser, L., HMDB: the human metabolome database,Nucleic Acids Res., 35, D521–D526 (2007).
9. Henzel, W.J., Billeci, T.M., Stults, J.T., Wong, S.C., Grimley, C. and Watanabe, C., IdentifyingProteins from 2-Dimensional Gels by Molecular Mass Searching of Peptide-Fragments inProtein-Sequence Databases, Proc. Nat. Acad. Sci. U.S.A., 90, 5011–5015 (1993).
10. Yates, J.R., Speicher, S., Griffin, P.R. and Hunkapiller, T., Peptide Mass Maps—a HighlyInformative Approach to Protein Identification, Anal. Biochem., 214, 397–408 (1993).
11. See the web site at http://prospector.ucsf.edu/ (accessed March 14, 2007).12. Clauser, K.R., Baker, P. and Burlingame, A.L., Role of accurate mass measurement (�/� 10 ppm)
in protein identification strategies employing MS or MS MS and database searching, Anal.Chem., 71, 2871–2882 (1999).
13. Spengler, B., Kirsch, D., Kaufmann, R. and Jaeger, E., Peptide Sequencing by Matrix-AssistedLaser-Desorption Mass-Spectrometry, Rapid Comm. Mass Spectrom., 6, 105–108 (1992).
14. Wei, J., Buriak, J.M. and Siuzdak, G., Desorption-ionization mass spectrometry on poroussilicon, Nature, 399, 243–246 (1999).
15. Chen, Y. and Vertes, A., Adjustable fragmentation in laser desorption/ionization from laser-induced silicon microcolumn arrays, Anal. Chem., 78, 5835–5844 (2006).
16. Baeten, W., Claereboudt, J., Vandenheuvel, H. and Claeys, M., Tandem Mass-Spectrometry ofLeucine Enkephalin and Physalaemin Using a Hybrid Instrument, Biomed. Environ. MassSpectrom., 18, 727–732 (1989).
17. Coon, J.J., Ueberheide, B., Syka, J.E.P., Dryhurst, D.D., Ausio, J., Shabanowitz, J. andHunt, D.F., Protein identification using sequential ion/ion reactions and tandem mass spec-trometry, Proc. Nat. Acad. Sci. U.S.A., 102, 9463–9468 (2005).
18. Mann, M. and Wilm, M., Error Tolerant Identification of Peptides in Sequence Databases byPeptide Sequence Tags, Anal. Chem., 66, 4390–4399 (1994).
19. Mortz, E., Oconnor, P.B., Roepstorff, P., Kelleher, N.L., Wood, T.D., McLafferty, F.W. andMann, M., Sequence tag identification of intact proteins by matching tandem mass spectraldata against sequence data bases, Proc. Nat. Acad. Sci. U.S.A., 93, 8264–8267 (1996).
20. Hunt, D.F., Henderson, R.A., Shabanowitz, J., Sakaguchi, K., Michel, H., Sevilir, N.,Cox, A.L., Appella, E. and Engelhard, V.H., Characterization of Peptides Bound to the Class-IMhc Molecule Hla-A2.1 by Mass-Spectrometry, Science, 255, 1261–1263 (1992).
21. Zubarev, R.A., Kelleher, N.L. and McLafferty, F.W., Electron capture dissociation ofmultiply charged protein cations. A nonergodic process, J. Am. Chem. Soc., 120,3265–3266 (1998).
22. Zubarev, R.A., Horn, D.M., Fridriksson, E.K., Kelleher, N.L., Kruger, N.A., Lewis, M.A.,Carpenter, B.K. and McLafferty, F.W., Electron capture dissociation for structural characteri-zation of multiply charged protein cations, Anal. Chem., 72, 563–573 (2000).
23. Shi, S.D.H., Hemling, M.E., Carr, S.A., Horn, D.M., Lindh, I. and McLafferty, F.W.,Phosphopeptide/phosphoprotein mapping by electron capture dissociation mass spectrometry,Anal. Chem., 73, 19–22 (2001).
24. Syka, J.E.P., Coon, J.J., Schroeder, M.J., Shabanowitz, J. and Hunt, D.F., Peptide and proteinsequence analysis by electron transfer dissociation mass spectrometry, Proc. Nat. Acad. Sci.U.S.A., 101, 9528–9533 (2004).
25. Jenuwein, T. and Allis, C.D., Translating the histone code, Science, 293, 1074–1080 (2001).

194 A. Vertes
26. Berro, R., de la Fuente, C., Klase, Z., Kehn, K., Parvin, L., Pumfrey, A., Agbottah, E.,Vertes, A., Nekhai, S. and Kashanchi, F., Identifying the membrane proteome of HIV-1 latently-infected cells, J. Biol. Chem., 282, 8207–8218 (2007).
27. Gygi, S.P., Rist, B., Gerber, S.A., Turecek, F., Gelb, M.H. and Aebersold, R., Quantitativeanalysis of complex protein mixtures using isotope-coded affinity tags, Nat. Biotechnol., 17,994–999 (1999).
28. Yao, X.D., Freas, A., Ramirez, J., Demirev, P.A. and Fenselau, C., Proteolytic O-18 labelingfor comparative proteomics: Model studies with two serotypes of adenovirus, Anal. Chem., 73,2836–2842 (2001).
29. Chowdhury, S.K., Katta, V. and Chait, B.T., Probing Conformational-Changes in Proteins byMass-Spectrometry, J. Am. Chem. Soc., 112, 9012–9013 (1990).
30. Mohimen, A., Dobo, A., Hoerner, J.K. and Kaltashov, I.A., A chemometric approach to detec-tion and characterization of multiple protein conformers in solution using electrospray ioniza-tion mass spectrometry, Anal. Chem., 75, 4139–4147 (2003).
31. Wales, T.E. and Engen, J.R., Hydrogen exchange mass spectrometry for the analysis of pro-tein dynamics, Mass Spectrom. Rev., 25, 158–170 (2006).
32. Benjamin, D.R., Robinson, C.V., Hendrick, J.P., Hartl, F.U. and Dobson, C.M., Mass spec-trometry of ribosomes and ribosomal subunits, Proc. Nat. Acad. Sci. U.S.A., 95, 7391–7395(1998).
33. Wu, K.L., Bottazzi, M.E., de la Fuente, C., Deng, L.W., Gitlin, S.D., Maddukuri, A., Dadgar,S., Li, H., Vertes, A., Pumfery, A. and Kashanchi, F., Protein profile of tax-associated com-plexes, J. Biol. Chem., 279, 495–508 (2004).
34. Tang, X.D., Callahan, J.H., Zhou, P. and Vertes, A., Noncovalent Protein-OligonucleotideInteractions Monitored By Matrix-Assisted Laser Desorption/Ionization Mass-Spectrometry,Anal. Chem., 67, 4542–4548 (1995).
35. Loo, J.A., Electrospray ionization mass spectrometry: a technology for studying noncovalentmacromolecular complexes, Int. J. Mass Spectrom., 200, 175–186 (2000).
36. Banks, R.E., Dunn, M.J., Hochstrasser, D.F., Sanchez, J.C., Blackstock, W., Pappin, D.J. andSelby, P.J., Proteomics: new perspectives, new biomedical opportunities, Lancet, 356,1749–1756 (2000).
37. Zhao, Y.M. and Chait, B.T., Protein Epitope Mapping by Mass-Spectrometry, Anal. Chem., 66,3723–3726 (1994).
38. Baerga-Ortiz, A., Hughes, C.A., Mandell, J.G. and Komives, E.A., Epitope mapping of a mon-oclonal antibody against human thrombin by R/D-exchange mass spectrometry reveals selec-tion of a diverse sequence in a highly conserved protein, Protein Sci., 11, 1300–1308 (2002).
39. Eisenstein, E., Gilliland, G.L., Herzberg, O., Moult, J., Orban, J., Poljak, R.J.,Banerjei, L., Richardson, D. and Howard, A.J., Biological function made crystal clear-annotation of hypothetical proteins via structural genomics, Curr. Opin. Biotechnol., 11,25–30 (2000).
40. Nazarian, J., Hathout, Y., Vertes, A. and Hoffman, E.P., The proteome survey of an electricity-generating organ (Torpedo californica electric organ), Proteomics, 7, 617–627 (2007).
41. See the web site at http://www.hupo.org/ (accessed March 30, 2007).

Medical Applications of Mass SpectrometryK. Vékey, A. Telekes and A. Vertes (editors)© 2008 Published by Elsevier B.V.
195
Chapter 9
De novo sequencing of peptides
MATTHEW T. OLSON, JONATHAN A. EPSTEIN, and ALFRED L. YERGEY*
National Institute of Child Health and Human Development, NIH, Bethesda, MD, USA
As described elsewhere in this volume and in a number of excellent reviewsincluding the recent one by Steen and Mann [1], the typical strategy for mass spec-trometric identification of proteins employs a combination of peptide mass fin-gerprinting (PMF) and peptide fragment ion spectra to search databases of proteinsequences and look for high-probability matches. Modern algorithms search pro-tein databases for sequences that most consistently match the spectral data.Resulting sequences are ranked according to the statistical significance assignedto the proteins found by the search [2,3].
One must ask however, “What if the protein I am seeking to identify is not likelyto be found in a database?” Potential reasons for such an absence include proteinsisolated from organisms for which genomes have not been sequenced at this time—such as sea urchin, S. purpuratus, and the polyploidal frog X. laevis—as well asmutations and splice variants of otherwise well-characterized proteins. It might beargued that the last two cases could possibly be addressed by the so-called homol-ogy exploration options of the better known search algorithms, but proteins fromorganisms with unsequenced genomes are not likely to be reliably identified by thisapproach. Furthermore, independent validation of sequences may be necessary fornovel or rare peptides. In order to address these and similar essentially insolubleproblems, it becomes the task of investigators to deduce a peptide’s sequence purelyfrom mass spectral fragmentation data. This is de novo sequencing.
Fig. 1 is an illustration of the need for de novo sequencing. The portion of theprotein sequence shown in the box corresponds to the mass of a peptide producedby proteolysis. Above this sequence is shown a series of three amino acid residuesthat have been found to be present in a fragmentation spectrum, a sequence tag [4].Note that, in general, the order of the residues found is not known, i.e., they could
*Corresponding author. Fax: �1-301-480-5793. E-mail: [email protected].

196 M.T. Olson et al.
Fig. 1. Schematic of matching peptide fragments.
Peptide mass
?? ???HEA
HEA ELK PLA - - -
Mass 1 Mass 2
(Proteinsequence)
Sequencetag
GH- - - KKK
be in the order shown or the reverse of that order. Nevertheless, this tag is a pow-erful tool in that it not only provides information about a series of amino acidresidues but also contains information about the peptide’s total mass and the massof those portions of the peptide on both the C- and N-terminal portions of thethree residue tags. The tag is used to search a database for the best match to all ofthe information, i.e., sequence, peptide mass, and the mass of the portions of thepeptide outside of the identified residues. For well-defined protein systems, thisis a very effective approach. However, close inspection of the figure shows sev-eral potential problems, and even if we assume that the peptide matched is the“correct one,” we must continue to be aware of potential problems with the “hit.”First, since there are apparently no fragmentation data present in the spectrum toextend the area of the tag, there can be no definitive proof for the sequence of theresidues on either terminal of the peptide. Second, because of the same lack ofevidence in the spectrum, it is possible to imagine a number of isobaric alternativesto the sequence “found” by a search algorithm. For example, the two residues GHthat are taken to be part of the peptide “identified” have nearly the same mass asthat of the two residues PP, 213.124 and 213.099 Da, respectively. This 0.025 Dadifference in mass can be used very effectively as shown below, but the mostcommonly used instruments producing MS/MS spectra are ion traps and triplequadrupoles, neither of which have mass accuracies better than 0.5–1 Da. Thus,what is routinely ranked as an identified peptide is seen to have a number of weakpoints in terms of its true identity.
There are a number of substantial technical issues involved in de novo sequenc-ing that arise from the fact that peptides do not fragment in an ideal manner. Oneresult of this is that skilled spectral interpreters have devised sets of rules that canbe used to convert mass differences between ions of a spectrum into amino acidsequences; unfortunately, these rules are complicated and are not always fol-lowed. In addition, the fragmentations do not occur in a manner that gives rise touniform ion intensities. This phenomenon results in spectra that have a substantialrange of intensities which, depending on the ionization and mass analyzer used,

De novo sequencing of peptides 197
can lead to spectra in which important information cannot be distinguished frombaseline noise. As a consequence of these physical realities, de novo sequencingremains a challenging problem, and interpretations unaided by a computer cantake substantial time with no guarantee of a correct result (or even a meaningfulone). As instruments developed the capability to generate very large numbers ofspectra, often without trained mass spectrometrists, the possibility for such manualinterventions became much smaller. It became clear in the late 1980s that it wouldbe desirable to incorporate the knowledge of skilled mass spectrometrists intocomputer programs that would not only save them time but also provide solutionsfor investigators who were less experienced in this field.
There are roughly two ways to view the relationship between de novo sequenc-ing and database search algorithms—the first is complementary, and the secondis alternative. Approaches that emphasize the complementary relationshipbetween de novo sequences and database searches treat de novo sequences as ameans to enhance the quality and reliability of database searches. Regimes origi-nating from this approach utilize the spectra to derive one or more highly reliablesequence tags. These tags guide the database matching process, and since theyostensibly represent the most prominent and reliable features of the spectra, thetags also impart a higher degree of confidence to the database results. Thesemethods do not require a complete de novo formulation of the peptide sequenceprior to database searching, but a complete sequence may be yielded occasionallyby these approaches and is highly desirable. In contrast, approaches that attemptto preclude the requirement for a database search focus exclusively on the spec-tral data. This approach requires that the de novo algorithm generate a completesequence, hence the name “complete de novo sequencing.” In general, regimesoriginating from this approach are more difficult to implement in the end becausethey lack a database search to verify the sequence information. Nevertheless, theyremain an ultimate goal for some of the challenges of proteomics researchdescribed earlier. However, due to the difficulty of obtaining independent, com-plete, and reliable de novo sequences, essentially all of the mainstream de novosequencing packages are implementations of the partial sequencing approach andare used to complement database searches.
De novo sequencing approaches also differ according to the way in which theydetermine the fragment type (y or b, etc.) and score the sequence information.These differences in approach tend to generate great differences between de novosequences obtained even from the same spectra. Because of the diverse, incom-plete, and extremely complex fragmentation patterns, better understanding of thesefundamental issues is of central importance to ranking the accuracy of de novosequencing regimes. If the fragmentation process were uniform and complete oreven simple, there would be no problem because a score could be derived from anormalized sum of total spectral intensity. Perhaps the simplest and most widelyused solution is the assignment of arbitrary weighting factors to the intensities of
198 M.T. Olson et al.
peaks based on the ion type they are determined to be. For example, if the peptideis fragmented by unimolecular decomposition, then y and b ions are far more com-mon than the multitude of other possibilities (a, x, w, c, or d ions), so the intensitiesof peaks determined to be of the rare ion types are decreased by an arbitrary scalarin the sum of peak intensities which eventually factors into the score of the sequence[5,6]. Another means of scoring the de novo sequence involves the use of an empir-ical function that adjusts the measured intensities according to the intensitiesobserved in other spectra [7]. Yet another method involves simulated fragmenta-tions of peptides and subsequent matching of the observed for a match of thefragmentation pattern [8,9]. Unfortunately, while each of these methods reportshigh efficacy and accuracy, a broad comparison to determine a superior approach oroptimal usage criteria has not been performed. The complex nature of arbitraryscores, empirical functions, and fragmentation simulations infers a degree ofinstrumental specificity that confounds the difficulty of such comparisons.Althoughsuch complexity will undoubtedly prove useful in a universal solution, if and whenit exists, the authors of this chapter are of the opinion that the weighting schemes ofthe aforementioned methods, though they are complex, do not fully model or predictthe spectra and lead to a high frequency of sequence errors. One approach [6] isnoteworthy because, while it uses arbitrary ion weighting, it circumvents the prob-lem with accurate mass evaluation of ion type. The value of this remains to beproven in coming years.
There have been two principal approaches to the implementation of partialde novo sequencing, and these have been well defined by Pevzner and colleagues[10] and termed by them to be the global and local paradigms. In the most generalterms, the global implementations are those in which theoretical spectra for allpeptides of a given mass are generated initially and then the observed spectramatched against them for the best fit. This approach was described initially bySakurai et al. [11]. Clearly the generation of theoretical spectra for all possiblepeptides for a given mass is a huge task that increases exponentially incomplexity with peptide mass. This reality led later workers to devise methods toprune the number of theoretical possibilities [12–14], typically by calculating asmall subset of possible extensions to ions present in the spectrum, matchingobserved ions in the mass range of these new subsequences and then computingfurther extensions to the highest scoring subsequences. Scoring of the matcheswas typically done by incorporating some subset of the knowledge-based rulesfor peptide fragmentation into their programs. Perhaps the most successful ofthese approaches was that developed by Johnson and Biemann that demonstratedthe ability to sequence peptides from a variety of sources without regard toproteolysis method [14].
The local approaches tend to be somewhat less computationally intensive inthat they filter the spectral data in some fashion prior to any evaluation ofcandidate sequences. The various local approaches [15,16,5,10,17] then employ

De novo sequencing of peptides 199
an algorithm to implement a graph theory approach to determine the amino acidsequence. The filtered spectral data peaks as vertices in a graph with the edges ofthe graph as the connecting links between them; each peak in the spectrum couldpossibly originate from a different ion type, i.e., y, b, a, neutral loss, etc., and soit might be possible to have several ion-type graphs within a single spectrum. Thispossibility can be eliminated by converting all of the peaks into an ion of a spe-cific type, i.e., C-terminal (y series) or N-terminal (b series). Fig. 2 illustrates theoverall concept with a graph for y series ions in a hypothetical spectrum. Thus,the task of an algorithm is to find the longest possible acyclic path among thespectral vertices.
From this brief discussion it is clear that, though high-quality spectra are notabsolutely necessary to obtain at least some results, the very best results will beobtained from spectra that have the highest possible values of signal-to-noiseratio, which provide fragmentations that are as complete as possible representa-tions of full coverage of the peptide(s) being considered. Until very recently,another fundamental aspect of mass spectra has not been given an appropriatelevel of attention. That is, previously algorithms used in the construction of graphsor for the calculations of the global approaches tended to ignore the deviations ofmeasured masses from integer values, i.e., the mass defect. Although there was
369(.004)
G
H
H
R
C
E
X
X
X
H
T X
F
S
W
M
S Y
V
W
312(.022)
472(.005)
262(.006)
175(.074)
361(.004)
448(.044)
611(.018)
393(.009)
506(.021)
748(.005)
849(.004)
962(.023)
619(.029)
506(.021)
Fig. 2. Graphical solution of de novo sequence. Peptide masses, corresponding to graph vertices, areshown within boxes with relative intensities in parentheses. Graph edges for different paths are rep-resented by the amino acid residues allowing vertices to be connected. All paths shown are complete,but the one with the highest score is shown by the edges labeled in italics, XTEXHGHR, where Xis either Ile or Leu.

200 M.T. Olson et al.
never doubt that good mass accuracy was an important aspect of any sequencedetermination, it was not until the recent work of Spengler [6] that this parametercame to the fore as one to be employed prospectively in sequence determinations.In this work, the approach taken was to use the very high mass accuracy possiblewith Fourier transform mass spectrometry in conjunction with what might betermed a hybrid local–global approach. That is, a set of potential sequences isdeveloped from using an algorithm based on filtered spectra. These sequences arethen evaluated using a semiglobal approach in which each sequence has its frag-mentation pattern calculated to a level of mass accuracy of about 1 ppm, i.e., to0.001 Da at m/z 1000. This approach appears to give substantial improvement inthe confidence level of a sequence generated de novo, but, as described in the orig-inal paper, has been used to date principally for improving the confidence level ofdatabase search matches.
More recently, the authors of this chapter have developed an extension ofSpengler’s approach in that it is also something of a local–global hybrid approachthat employs the mass defect of fragment ions. This new approach has beendemonstrated to be effective at somewhat lower levels of mass accuracy [18] andis to some extent also an extension of earlier work from this group [19]. Thisapproach has been employed to date only on MALDI fragment ion spectra that aregenerated by a tandem TOF instrument. The somewhat more extensive andcomplete fragmentation resulting from this technique permits the use of massaccuracies of about 0.05 Da. More fundamental to this approach, however, is theuse of a database consisting of an exhaustive listing of all amino acid combina-tions giving rise to peptides up to and including 2000 Da. By using a combinationof prefiltering of the spectra and an extension of bit-mapping algorithm, theauthors have shown the capability of generating reliable sequences de novo.Although the utility of this approach is yet to be fully evaluated, it appears frompreliminary evaluations that it may prove very useful for generating completepeptide sequences.
De novo peptide sequencing has been shown to be a useful tool particularlywith regard to improving the reliability of database searching algorithms, but inmany respects it remains an open problem with a great deal of work yet to be donein order to make it widely useful for the characterization of peptides from organ-isms with incomplete or poorly characterized genomes and as a robust techniquefor probing novel posttranslational splicing patterns. At this point in time, it is notaltogether clear whether the difficulty in having a completely effective algorithmfor complete de novo sequencing of peptides not present in a database is a conse-quence of computational complexity, inability to achieve reliable complete pep-tide fragmentation, or difficulty in routinely providing adequate mass accuracy infragmentation spectra, or indeed, some combination of all of these factors. Until aclear understanding of all of these factors is achieved, this problem is likely toremain incompletely solved.

De novo sequencing of peptides 201
References
1. Steen, H. and Mann, M., The ABC’s (and XYZ’s) of peptide sequencing. Nat. Rev. Mol. CellBiol., 5, 699–711 (2004).
2. Perkins, D.N., Pappin, D.J., Creasy, D.M. and Cottrell, J.S., Probability-based protein identi-fication by searching sequence databases using mass spectrometry data. Electrophoresis, 20,3551–3567 (1999).
3. Geer, L.Y., Markey, S.P., Kowalak, J.A., Wagner, L., Xu, M., Maynard, D.M., Yang, X., Shi, W.and Bryant, S.H., Open mass spectrometry search algorithm. J. Proteome Res., 3, 958–964(2004).
4. Mann, M. and Wilm, M., Error tolerant identification of peptides in sequence databases bypeptide sequence tags. Anal. Chem., 66, 4390–4399 (1994).
5. Taylor, J. and Johnson, R., Sequence database search via de Novo peptide sequencing by tan-dem mass spectrometry. Rapid Commun. Mass Spectrom., 11, 1067–1075 (1997).
6. Spengler, B., De novo sequencing, peptide composition analysis, and composition-basedsequencing: a new strategy employing accurate mass determination by Fourier transform ioncyclotron resonance mass spectrometry. J. Am. Soc. Mass Spectrom., 15, 703–714 (2004).
7. Ma, B., Zhang, K., Hendrie, C., Liang, C., Li, M., Doherty-Kirby, A. and Lajoie, G., PEAKS:powerful software for peptide de novo sequencing by tandem mass spectrometry. RapidCommun. Mass Spectrom., 17, 2337–2342 (2003).
8. Zhang, Z. and McElavin, J.S., De novo peptide sequencing by two-dimensional fragmentcorrelation mass spectrometry. Anal. Chem., 72, 2337–2350 (2000).
9. Kapp, E.A., Schutz, F., Reid, G.E., Eddes, J.S., Moritz, R.L., O’Hair, R.A., Speed, T.P.and Simpson, R.J., Mining a tandem mass spectrometry database to determine the trends andglobal factors influencing peptide fragmentation. Anal. Chem., 75, 6251–6264 (2003).
10. Dancik, V., Addona, T.A., Clauser, K.R., Vath, J.E. and Pevzner, P.A., De novo peptidesequencing via tandem mass spectrometry. J. Comput. Biol., 6(3/4), 327–342 (1999).
11. Sakurai, T., Matsuo, T., Matsuda, H. and Katakuse, I., Paas 3: a computer program to deter-mine probable sequence of peptides from mass spectrometric data. Biomed. Environ. MassSpectrom., 11, 396–399 (1984).
12. Ishikawa, K. and Niva, Y., Computer-aided peptide sequencing by fast atom bombardmentmass spectrometry. Biomed. Environ. Mass Spectrom., 13, 373–380 (1986).
13. Siegel, M. and Bauman, N., An efficient algorithm for sequencing peptides using fast atombombardment mass spectral data. Biomed. Environ. Mass Spectrom., 15, 333–343 (1988).
14. Johnson, R. and Biemann, K., Computer Program (SEQPEP) to aid in the interpretation ofhigh-energy collision tandem mass spectra of peptides. Biomed. Environ. Mass Spectrom., 18,945–957 (1989).
15. Bartels, C., Fast algorithm for peptide sequencing by mass spectroscopy. Biomed. Environ.Mass Spectrom., 19, 363–368 (1990).
16. Hines, W.M., Falick, A.M., Burlingame, A.L. and Gibson, B.W., Pattern-based algorithm forpeptide sequencing from tandem high energy collision-induced dissociation mass spectra.J. Am. Soc. Mass Spectrom., 3, 326–336 (1992).
17. Chen, T., Kao, M.-Y., Tepel, M., Rush, J. and Church, G.,Adynamic programming approach to denovo peptide sequencing via tandem mass spectrometry. J. Comput. Biol., 8(3), 325–337 (2001).
18. Olson, M., Epstein, J. and Yergey, A., De novo peptide sequencing using exhaustive enumer-ation of peptide composition. J. Am. Soc. Mass Spectrom., 17(8), 1041–1049 (2006).
19. Yergey, A.L., Coorssen, J.R., Backlund, P.S., Blank, P.S., Humphrey, G.A., Zimmerberg, J.,Campbell, J.M. and Vestal, M.L., De novo sequencing of peptides using MALDI/TOF-TOF.J. Am. Soc. Mass Spectrom., 10, 784–791 (2002).

This page intentionally left blank

Medical Applications of Mass SpectrometryK. Vékey, A. Telekes and A. Vertes (editors)© 2008 Elsevier B.V. All rights reserved
203
Chapter 10
Protein bioinformatics
PETER McGARVEY, HONGZHAN HUANG, and CATHY H. WU*
Department of Biochemistry and Molecular & Cellular Biology, Georgetown University MedicalCenter, Reservoir Road, NW, Washington, DC 20057-1455, USA
1. Highlights for medical professionals 2032. Introduction 2053. Methodology 206
3.1. UniProt sequence databases 2063.2. PIRSF protein family classification 2073.3. iProClass integrated protein database 2103.4. NIAID proteomic bioinformatics resource 212
4. Discussion 2145. Future trends 215
5.1. iProLINK literature mining resource 2155.2. iProXpress knowledge system for gene expression and
proteomic data analysis 2176. Conclusions 219Acknowledgments 220References 220
1. Highlights for medical professionals
Bioinformatics is the field of science in which biology, computer science, andinformation technology merge into a single discipline. Proteomics methods used inmass spectrometry require databases of protein sequences and post-translationalmodifications as well as algorithms and tools to match spectra to peptides andpeptides to proteins. Following identification of a protein, further interpretationand knowledge discovery comes from the integration of protein sequence data
*Corresponding author. Fax: �1-202-687-0057. E-mail: [email protected] (C.H. Wu).

204 P. McGarvey et al.
with all forms of additional biomedical data contained in various databases. Herewe review some of the key integrated datasets, tools, and methods used in thisdiscovery process.
The Universal Protein Resource (UniProt) provides the scientific communitywith a centralized, authoritative resource for protein sequences and functionalinformation with three database components. (1) The UniProt Knowledgebase(UniProtKB), produced by a combination of automation and over 25 years ofhuman curation, is the central protein sequence database with accurate, consistent,functional annotation and extensive cross-references. (2) The UniProt ReferenceClusters (UniRef) provide clustered sets of sequences from UniProtKB (includ-ing splice variants and isoforms) in order to obtain complete coverage of sequencespace at several resolutions. The UniRef100 database is particularly useful forMass Spec identifications as it exposes known sequence variation and splice-formannotation contained in UniProtKB records. (3) The UniProt Archive (UniParc)provides a stable comprehensive sequence collection by storing the completebody of all publicly available protein sequence data.
The Protein Information Resource (PIR) (http://pir.georgetown.edu/) is anintegrated public bioinformatics resource supporting genomic and proteomicresearch. PIR provides access to all the UniProt databases and complementarydatabases including iProClass, which provides an integrated view of protein infor-mation from over 90 databases and serves as a bioinformatics framework for dataintegration and associative analysis of proteins and PIRSF, an annotated familydatabase based on the PIRSF classification system, which applies a network struc-ture for protein classification from superfamily to sub-family levels.
Even the most up-to-date databases and tools lag behind actual research resultsby months or years because human reading of the scientific literature is required. Inthe future more automated rule-based systems will take the lead in data analysis andintegration by linking existing protein knowledge to new experimental data almostas soon as they are published or even prior to publication. Some efforts under devel-opment include iProLink, which has tools and resources for automated literaturemining, and iProXpress, where data produced by high-throughput proteomicsresearch can feed into automated analysis and annotation pipeline. However, no onedatabase or institution can keep up with the flood of new biological information.Further efforts on integration of a wider array of literature, data, and analysis toolsrequire community efforts to develop and utilize common standards for dataexchange, ontologies, and object models. Some prominent community effortsinclude the Human Proteome Organization (HUPO) Protein Standards Initiative(PSI) for Proteomics, the Microarray Gene Expression Data (MGED) Society forgene expression data, the National Center for Biomedical Ontology, and theNational Cancer Institute’s Cancer Biomedical Informatics Grid (caBIG) initiativewhich hopes to combine many of the current community efforts into a semanticallyinteroperable grid of database and software resources.

Protein bioinformatics 205
2. Introduction
Bioinformatics can be defined as the field of science in which biology, computerscience, and information technology merge into a single discipline. Bioinformaticscontains a number of important sub-disciplines including: development of new algo-rithms and statistics; the analysis and interpretation of data; development of tools thatmine and manage various types of information; and database development and dataintegration. All these sub-disciplines have played a role in developing the mass spec-trometry methods reviewed in this book. As described in this volume and elsewherethe high-throughput proteomics methods used in mass spectrometry require accuratedatabases of both protein sequences and post-translational modifications as well asalgorithms and tools to match spectra to peptides and peptides to proteins [1,2]. Afteridentification of a protein, further interpretation and knowledge discovery come fromthe integration of protein sequence data with all forms of additional biomedical data.There are many approaches to data integration and the field is evolving as differentapproaches and data collections merge. Here we describe our bottom-up approach atdata integration, starting with protein sequence information and bringing in a widevariety of structural, functional, genetic, and disease information related to proteins.We also discuss some future efforts to link this information to other data collectionsand broader community efforts and approaches to data integration.
High-throughput genome and proteome projects have resulted in the rapidaccumulation of genome sequences for a large number of organisms. Meanwhile,scientists have begun to systematically tackle other complex regulatory processes bystudying organisms at the global scale of transcriptomes (RNA and gene expression),metabolomes (metabolites and metabolic networks), interactomes (protein–proteininteractions), and physiomes (physiological dynamics and functions of whole organ-isms). Associated with the enormous quantity and variety of data being produced isthe growing number of databases that are being generated and maintained. Metadatabases (databases of databases) have been compiled to catalog and categorizethese databases, such as the Molecular Biology Database Collection [3]. This onlinecollection (http://www.oxfordjournals.org/nar/database/cap/) lists over 700 keybiological databases that add new value to the underlying data by virtue of curation,provide new types of data connections, or implement other innovative approaches tofacilitate biological discovery. Based on the type of information they provide, thesedatabases can be conveniently classified into sub-categories. Examples of majordatabase categories include genomic sequence repositories (e.g., GenBank [4]), geneexpression (e.g., SMD [5]), model organism genomes (e.g., MGD [6]), mutationdatabases (e.g., dbSNP [7]), RNA sequences (e.g., RDP [8]), protein sequences (e.g.,UniProt [9]), protein family (e.g., InterPro [10]), protein structure (e.g., PDB [11]),intermolecular interactions (e.g., BIND [12]), metabolic pathways and cellular reg-ulation (e.g., KEGG [13]), and taxonomy (e.g., National Center for BiotechnologyInformation (NCBI) taxonomy [14]).
206 P. McGarvey et al.
To fully explore these datasets, advanced bioinformatics infrastructures must bedeveloped for biological knowledge extraction and management. The PIR [15] is anintegrated bioinformatics resource that supports genomic and proteomic research inthis manner. PIR is a member of UniProt—the world’s most comprehensive catalogof information on proteins, which unifies the previously separate PIR, Swiss-Prot,and TrEMBL databases [9]. The core resources and bioinformatics framework forlarge-scale proteomic data mining at PIR include: the UniProtKB of all knownproteins; iProClass [16] database integrating information from over 90 biologicaldatabases; PIRSF classification-driven and rule-based system for protein functionalannotation [17,18]; iProLINK [19] literature mining resource; and some new toolsfor proteomics data analysis and target identification.
3. Methodology
3.1. UniProt sequence databases
The UniProt provides the scientific community with a single, centralized, authori-tative resource for protein sequences and functional information with three data-base components, each addressing a key need in protein bioinformatics. TheUniProtKB is the central protein sequence database with accurate, consistent, andrich sequence and functional annotation, full classification, and extensive cross-references. Produced by a combination of automated and over 25 years of humancuration, the annotations in UniProtKB include protein name and function,taxonomy, enzyme-specific information (catalytic activity, cofactors, metabolicpathway, regulation mechanisms), domains and sites, post-translational modifica-tions, sub-cellular locations, tissue- or developmentally-specific expression, inter-actions, splice isoforms, polymorphisms, diseases, and sequence conflicts. TheUniParc provides a stable and comprehensive sequence collection by storing thecomplete body of publicly available protein sequence data. While a proteinsequence may exist in multiple databases, UniParc stores each unique sequenceonly once and assigns it a unique UniParc identifier. Cross-references back to thesource databases are provided and include source accession numbers, sequence ver-sions, and status (active or obsolete). The archive thus provides a history of proteinsequences. The UniRef provides clustered sets of sequences from UniProtKB(including splice variants and isoforms) and selected UniParc records, in order toobtain complete coverage of sequence space at several resolutions while hidingredundant sequences from view. The sequence compression is achieved by mergingsequences and sub-sequences that are 100% (UniRef100), 90% (UniRef90), or 50%(UniRef50) identical, regardless of source organism. Removing sequence redun-dancy in UniRef90 and UniRef50 speeds sequence computational methods, e.g.,similarity searches, while rendering such searches more informative. UniRef100

Protein bioinformatics 207
is particularly useful for Mass Spec identifications as it exposes known sequencevariation and splice-form annotation contained in the Swiss-Prot section ofUniProtKB. The UniProt databases can be accessed online at http://www.uniprot.org/or downloaded in several formats (ftp://ftp.uniprot.org/pub). New releases arepublished every two weeks.
3.2. PIRSF protein family classification
The PIRSF family classification system applies a network structure for proteinclassification from superfamily to sub-family levels on the UniProtKB [17]. Theprimary PIRSF classification unit is the homeomorphic family whose members arehomologous (sharing common ancestry) and homeomorphic (sharing full-lengthsequence similarity with common domain architecture). PIRSF classification con-siders both full-length similarity and domain architecture, discriminates betweensingle- and multi-domain proteins, and shows functional differences associatedwith the presence or absence of one or more domains. For example, the relation-ship between domain architecture and function can be illustrated by the varioustypes of response regulator proteins that share the CheY-like phosphoacceptordomain (Pfam domain PF00072) (Fig. 1) and are involved in signal transduction bytwo-component signaling systems. These response regulators usually consist of anN-terminal CheY-like receiver domain and a C-terminal output (usually DNA-binding) domain. In addition to the “classical” well-known response regulators(e.g., PIRSF003173 with the winged helix–turn–helix DNA-binding domain),bacterial genomes encode a variety of response regulators with other types ofDNA-binding domains (e.g., PIRSF006198, PIRSF036392), RNA-binding domain(PIRSF036382), or enzymatic domains (e.g., PIRSF000876, PIRSF006638), or acombination of these types of domains (e.g., PIRSF003187).
For a biologist seeking to collect and analyze information about a protein,matching a protein sequence to a curated protein family provides a tool that is usu-ally faster and more accurate than searching against a protein sequence database,which may only return a sequence and name submitted by a genomic sequencingproject. Human curation of families provides richer information on protein struc-ture and function, as it draws from a wider pool of information and from aclassification-driven and rule-based system for automation of protein functionalannotation that has been developed using PIRSF families [17,18].
The protein family classifications and associated information are stored inthe PIRSF database and can be searched by a variety of methods (http://pir.georgetown.edu/pirsf). The PIRSF family reports (Fig. 2) (e.g., http://pir.george-town.edu/cgi-bin/ipcSF?idPIRSF000514) provide classification and annotationsummaries organized in several sections—(i) general information: PIRSF numberand general statistics (family size, taxonomy range, length range, keywords), as wellas additional annotation for curated families, such as family name, bibliography,

208 P. McGarvey et al.
family description, representative and seed members, and domain architecture;(ii) membership: lists of all members separated by major kingdoms and membersfrom model organisms; and (iii) function, structure, and family relationship: enzymeclassification (EC, http://www.chem.qmw.ac.uk/iubmb/enzyme/), structure hierar-chy (SCOP [20]), gene ontology (GO [21]), as well as family relationships at the full-length protein, domain, and motif levels with direct mapping and links to other family,function, and structure classification schemes, such as Pfam and InterPro [10].
Fig. 1. (A) Selected PIRSF response regulator families all containing the CheY-like phosphoacceptordomain (Pfam domain PF00072) and (B) domain display of the selected PIRSF families.

Protein bioinformatics 209
Fig. 2. PIRSF protein family report. Includes: (A) DAG browser displaying the PIRSF family hier-archy; (B) taxonomy tree browser displaying the taxonomy distribution of all family members;(C) tree viewer with neighbor-joining tree; and (D) alignment viewer displaying ClustalW multiplealignment of seed members. This report can be viewed directly at http://pir.georgetown.edu/cgi-bin/ipcSF?idPIRSF000514.
The PIRSF reports connect to several graphical viewers, including: (i) DAGbrowser, which displays the PIRSF family hierarchy with Pfam domain superfam-ilies and protein membership in a network structure (Fig. 2A); (ii) taxonomy treebrowser, which displays the taxonomy distribution of all family members and the

210 P. McGarvey et al.
phylogenetic pattern of members in complete genomes (Fig. 2B); (iii) alignmentand tree viewer, which displays ClustalW multiple alignment and neighbor-joiningtree dynamically generated from seed members of curated families (Fig. 2C and D);and (iv) domain viewer, which displays domain architecture of seed members or allmembers.
3.3. iProClass integrated protein database
The iProClass database provides an integrated view of protein information [22] andserves as a bioinformatics framework for data integration and associative analysisof proteins [16]. iProClass presents value-added descriptions of all proteins inUniProtKB and contains comprehensive, up-to-date protein information derivedfrom over 90 biological databases. Rich links to the underlying sources are providedwith source attribution, hypertext links, and extracted summary information. Thesource databases include those for protein sequence, family, function, pathway,protein–protein interaction, complex, post-translational modification, proteinexpression, structure, structural classification, gene, genome, gene expression, dis-ease, ontology, literature, and taxonomy. The iProClass protein summary report(Fig. 3) contains—(i) general information: protein ID and name (with synonyms,alternative names), source organism taxonomy (with NCBI taxonomy ID, group,and lineage), and sequence annotations such as gene names, keywords, function,and complex; (ii) database cross-references: bibliography (with PubMed ID andlink to a bibliography information and submission page), gene and genomedatabases including RefSeq [23], Entrez gene [24], GO (with GO hierarchy andevidence tag), enzyme/function (with EC hierarchy, nomenclature, and reaction),pathway (with KEGG pathway name and link to pathway map), protein–proteininteraction, structure (with PDB 3D structure image, matched residue range, andpercent sequence identity for all structures matched at �30% identity), structuralclasses (with SCOP hierarchy for structures at �90% identity), sequence features,and post-translational modifications (with residues or residue ranges); (iii) familyclassification: PIRSF family, InterPro family, Pfam domain (with residue range),Prosite motif (with residue range), COG, and other classifications; and (iv) sequencedisplay: graphical display of domains and motifs on the amino acid sequence.
The source attribution and hypertext links in iProClass facilitate exploration ofadditional information and examination of discrepancies in annotations fromdifferent sources. The data integration in iProClass allows identification of inter-esting relationships between protein sequence, structure, and function. It supportsanalyses of proteins in a “systems biology” context and has led to novel function-al inference for uncharacterized proteins in the absence of sequence homology[25]. Furthermore, iProClass is used to support an ID mapping service that asso-ciates gene and protein IDs (such as NCBI’s gi number and Entrez Gene ID) toUniProtKB identifiers. ID cross-referencing is fundamental to support data

Protein bioinform
atics211Fig. 3. iProClass protein sequence report. This report, for a human phosphoglycerate mutase, can be viewed directly at http://pir.georgetown.edu/
cgi-bin/ipcEntry?idP18669.

212 P. McGarvey et al.
interoperability among disparate data sources and to allow integration and query-ing of data from heterogeneous molecular biology databases. The ID mappingservice, accessible from http://pir.georgetown.edu/pirwww/search/idmapping.shtml, currently maps between UniProtKB identifiers and over 90 other databaseidentifiers.
3.4. NIAID proteomic bioinformatics resource
The identification of proteins expressed in tissue, serum, cell lines, and otherbiological samples provides a mechanism for the discovery of novel biomarkers,particularly where contrasting samples can be derived, such as from healthy anddiseased tissues or cells. Even when the biological mechanism of disease is poorlyunderstood, proteomics studies can provide insight into the proteins and theirisoforms that show evidence of heightened or suppressed abundance in one contextor the other. With the advent of high-throughput proteomics technologies, ever-increasing amounts of proteomic data are being generated. The challenge is to linkrelevant experimental data to other information on the proteins.
The National Institute of Allergy and Infectious Diseases (NIAID) BiodefenseProteomic Research Program has funded seven centers to work on NIAID CategoryA–C priority pathogens and other microorganisms responsible for emerging and/orre-emerging diseases. In addition, they have funded a Resource Center for Biode-fense Proteomics Research (http://www.proteomicsresource.org/) of which PIR is amember. The Administrative Resource is charged with making the data, methods,and conclusions from Proteomic Research Centers available to the scientificcommunity.
For the NIAID project PIR has developed several data integration tools. (1) TheMaster Protein Directory is a complete compilation of proteins and reagents identi-fied by the NIAID Biodefense Proteomics Research Centers. The directory linksprotein sequence and functional annotation to experimental data generated by theproject and eventually to metabolic information. (2) Complete Predicted ProteomesTool (Fig. 4) that allows users to view and search selected proteomes being studiedby the NIAID Biodefense Proteomics Research Centers. Over 50 fields are search-able, a customizable display of functional annotation is provided, and proteins arelinked to the Master Protein Directory of experimental data. (3) Core/Unique ProteinIdentification (CUPID) system [26] provides a list of proteins encoded by selectedorganisms that are unique to the query strain, species, or genus. Such proteins mayserve as potential drug targets or diagnostics for pathogenic organisms. The uniqueprotein “signatures” may be specific to the strain of interest (narrow-range targets) ormay be part of the “core set” of proteins encoded by strains within the same speciesor genus of interest (broad-range targets). These tools are available at http://pir.georgetown.edu/proteomics/.

Protein bioinform
atics213
Fig. 4. Complete predicted Proteomes Tool for the NIAID Biodefense Proteomics Research Program (http://pir.georgetown.edu/pirwww/proteomics/).Tool allows interactive text mining of selected complete proteomes. Features include: over 50 fields for Boolean text searches; customizable displayand export; links to master catalog of experimental data from NIAID Proteomics Research Centers; and links to various reports on additional proteininformation like UniProt, iProClass, BioThesaurus, and PIRSF reports.

214 P. McGarvey et al.
4. Discussion
To fully utilize the increasing flood of biological data requires the creation of inte-grated systems for knowledge discovery and scientific exploration, including theintegration of (i) disparate data sources and scientific literature and (ii) data miningand analysis tools. Here we presented our ongoing efforts at creating an integratedknowledgebase system for proteomic information. Other major groups have trieddifferent approaches for integrating genetic information (i.e., NCBI and EuropeanBioinformatics Institute, EBI) and cancer information (National Cancer Institute,NCI). However, the current system for funding academic bioinformatics researchdoes not provide many options to fund broad infrastructure and integration effortsand is currently more focused on developing new tools and algorithms to addressparticular problems. Thus, further progress on integration of a wider array of litera-ture, data, and analysis tools requires community-wide efforts to develop and utilizecommon standards for data exchange, software architecture, and interoperability.
A number of such community efforts are underway in data exchange standardsfor both genomics and proteomics, including the MGED Society (http://www.mged.org/), which aims to facilitate the sharing of microarray data generated byfunctional genomics experiments, and the HUPO PSI (http://psidev.info/), which istrying to define community standards for data representation in proteomics. Thesegroups are developing XML data exchange standards, minimum reporting require-ments, object models, and ontologies for their area of interest. Minimum reportingrequirements (i.e., Minimum Information about a Proteomics Experiment, MIAPE)are an attempt to define the minimum information required to publish results on agenomic or proteomic study. Object models are a practice derived from softwareengineering that attempts to abstract the data objects and sometimes even analysissteps of a system independent of any implementation. Common object models canthus facilitate the development of compatible search and analysis tools regardless ofplatform, simplifying both the dissemination and the exchange of data. An ontologyis an explicit specification of the objects, concepts, and other entities that areassumed to exist in some area of interest and the relationships that hold among them.If two systems (i.e., databases) share a common ontology it means they share a com-mon vocabulary that can be used in a consistent manner. This allows intelligentautomation of information gathering and knowledge sharing via software agents.The National Center for Biomedical Ontology is one resource for tools and informa-tion on ontologies [27] (http:// bioontology.org).
The NCI-funded caBIG is a community effort of cancer centers in the UnitedStates to develop a web of interoperable data sources and tools that can seamlesslyshare and analyze information from a wide variety of sources including clinicalcancer studies and molecular research laboratories (https://cabig.nci.nih.gov/).The evolving architecture for this system is dependent on developing commonstandards and practices, including object modeling, data exchange standards, and

Protein bioinformatics 215
common ontologies and vocabularies. PIR is an active participant in caBIG andis one of the service nodes available on caGrid 1.0, the first public version of thegrid. The PIR grid service makes search and retrieval services available for infor-mation in the UniProtKB protein database.
5. Future trends
Like many human endeavors, the future trend in bioinformatics data analysis andintegration is to replace routine human intervention as much as possible. Currentlyeven the most up-to-date databases and tools lag behind the actual research resultsby months and sometimes years if human reading and processing of the scientif-ic literature is required. More and more automated rule-based systems will takethe lead in data analysis and integration, linking existing protein knowledge tonew experimental data almost as soon as they are published or even prior to pub-lication. Several such efforts are under development at PIR including iProLinkwhich has tools and resources for automated literature mining and iProXpresswhere data such as those produced by the NIAID Proteomics Centers and otherscan feed into automated analysis and annotation pipeline.
5.1. iProLINK literature mining resource
A large volume of protein experimental data is buried within the fast-growing sci-entific literature. While of great value, such information is limited in databases dueto the laborious process of literature-based curation.Aresource for protein literaturemining, iProLINK provides curated data sources and tools to support text miningin the areas of bibliography mapping, annotation extraction, protein named-entityrecognition, and protein ontology development [19]. The data sources and toolsinclude mapped citations (mapping of annotated bibliography with PubMed IDs toprotein entries), name- or annotation-tagged literature corpora (papers tagged withprotein names [28] or with experimentally validated post-translational modifica-tions), the RLIMS-P rule-based literature mining system for protein phosphoryla-tion [29], and the BioThesaurus of protein and gene names [30]. iProLINK is freelyaccessible at http://pir.georgetown.edu/iprolink/, and serves as a knowledge linkbridging protein databases and literature databases such as PubMed.
The RLIMS-P [29] is a text-mining program that can be used to identify papersdescribing protein phosphorylation from all PubMed abstracts, and to extract fromthese abstracts the specific information on protein phosphorylation, namely thekinases, the protein substrates, and the amino acid residues/positions being phos-phorylated (Fig. 5). The system achieved an overall recall of 96% for paperretrieval and a precision of 98% for extraction of substrates and phosphorylationsites. The RLIMS-P Web site [31] provides online retrieval of phosphorylationpapers using PubMed ID, followed by extraction of phosphorylation information

216 P. McGarvey et al.
Fig. 5. RLIMS-P text-mining results show summary of protein kinase, protein substrate, and phos-phorylation position information extracted from a Medline abstract. Details of information extractedand words tagged as phosphorylation objects in the abstracts text are shown below the summary.
from the Medline abstracts and tagging of the three phosphorylation objects (kinases,substrates, and sites). The Web site also allows mapping of phosphorylated proteinsto UniProtKB protein entries based on PubMed ID and/or protein name.

Protein bioinformatics 217
The BioThesaurus maps a comprehensive collection of protein and gene names toall known proteins in UniProtKB [30]. Currently covering more than 3 million pro-teins, BioThesaurus consists of over 4 million names extracted from multiple molec-ular biological databases according to the database cross-references in iProClass.The BioThesaurus Web site allows the retrieval of all the various names used for asingle protein and the identification of all proteins sharing the same name. The syn-onymous names in BioThesaurus can be used for query expansion during literaturesearch to retrieve relevant papers and extract protein information even when non-standardized names are used.
5.2. iProXpress knowledge system for gene expression and proteomic data analysis
Identification of expressed proteins in biological samples allows the discovery ofnovel disease biomarkers even when the underlying biological mechanism ispoorly understood. Once proteins are identified and their expression profilesdefined, the protein groups can be analyzed for their functional involvement inmetabolic and signaling pathways, cell cycles, apoptosis, and other cellular func-tions and processes. Such biological interpretation requires the data to be related toother types of information at the protein function, pathway, and network level.While numerous resources are available for processing data generated from tran-scriptome and proteome-wide experiments, expression data analysis is often car-ried out in an ad hoc manner, with a fragmented and inefficient use of informationresources.
The iProXpress knowledge system consists of (i) a data warehouse with inte-grated protein information, (ii) analytical tools for protein sequence analysis andfunctional annotation, and (iii) a graphical user interface for categorization andvisualization of expression data. The design of the iProXpress knowledge system(Fig. 6) is outlined below.
5.2.1. Gene/peptide to protein mapping
Gene or protein probes are mapped to the corresponding entries in UniProtKBof all known proteins, based on gene/protein IDs, names, or sequences. Genesare mapped using iProClass cross-references that connect gene identifiers suchas GenBank or Entrez Gene IDs to UniProtKB identifiers. If a common gene orprotein ID is not used for the probe set, the mapping is based on direct sequencecomparison or on name matching if sequence is not available. Peptide data aremapped by matching peptide sequences to protein sequences with subsequentassembly. The name matching is assisted by BioThesaurus; however, oftenthere are ambiguous identifications due to the lack of gene and protein namestandards.

218 P. McGarvey et al.
5.2.2. Functional analysis
The UniProt IDs assigned to corresponding genes and proteins link all mRNA andprotein expression data. Protein family, domain, and functional site features foreach protein are identified by BLAST, HMM, signal peptide, transmembranehelix predictions, and other automated searches. For direct human comparison ofexpressed genes/proteins, a comprehensive protein information matrix is generated,summarizing salient features retrieved from the underlying PIR data warehouse orinferred based on sequence similarity. Attributes in the protein matrix include:
Clustered Matrix Clustered Graph Pathway Map
iProXpressIntegrated Protein Expression Analysis System
Gene/Peptide-Protein Mapping
Functional Analysis (Sequence Analysis & Information Retrieval)
ProteinList
Pathway/Network Discovery(Categorization, Sorting, Visualization)
ComprehensiveProtein
InformationMatrix
Data Warehouse
Protein Family/Structure
Function/Pathway/InteractionExpression/Modification
Genome/Variation/DiseaseTaxonomy/Ontology
Data Warehouse
Protein Family/Structure
Function/Pathway/InteractionExpression/Modification
Genome/Variation/DiseaseTaxonomy/Ontology
Interaction Map
IP/2D/MS Proteomic DataGene Expression Data
Fig. 6. iProXpress integrated knowledge system for gene expression and proteomic data analysis.
Protein bioinformatics 219
protein name, family, domain, motif, site, post-translational modification, isoform,GO, function/functional category, structure/structural classification, pathway/path-way category, protein interaction, and complex.
5.2.3. Pathway and network discovery
Users can conduct iterative categorization and sorting of proteins in the informa-tion matrix and correlate expression and interaction patterns to salient proteinproperties for pathway and network discovery. Proteins are clustered based onfunctions, pathways, and/or other attributes in the information matrix to identifyhidden relationships not apparent in the data on expression patterns and proteininteractions, and to recognize candidate proteins of unknown identity that warrantfurther investigation. We detect new or different clusters based on combinedattributes of the information matrix and the expression and/or interaction data.Unknown “hypothetical” proteins involved in critical pathways or networks canbe manually curated based on phylogenetic analysis, structure homology model-ing, genome context, and functional associations using an integrative approachthat has led to novel functional inference for uncharacterized proteins [25]. Thisbioinformatics analysis thus provides a composite, global view of functionalchanges to identify critical nodes and hidden relationships in the response path-ways and networks. These last iterative categorization steps in the process arecurrently done manually; however, many of them can be automated and rulesdeveloped to flag significant clusters.
A pilot iProXpress system has been applied to gene expression profile analysisfor human chorionic gonadotropin (hCG)-induced changes in MA-10 mouseLeydig tumor cells [32]. The system has further been utilized to analyze pro-teomes of various stages of melanosomes from human melanoma cell lines [33]and for the comparative analysis of seven lysosome-related organelles (LROs) [34].The organellar proteome analyses allow us to identify possible melanosome stage-specific proteins and organelle-specific proteins as well as proteins shared amongdifferent organelles, thereby facilitating a better understanding of melanosome bio-genesis pathways and the dynamic process of LRO biogenesis.
6. Conclusions
Research in the areas of protein science and bioinformatics for over the last threedecades has provided a solid foundation to automatically analyze and classifyprotein information. Here we presented some of the efforts and resources of PIRto annotate, classify, and integrate protein sequence information with other bio-medical information. The ongoing challenges in data integration are as follows.(1) Scaling-up processes to deal with the ever-increasing high-throughput genomic/

220 P. McGarvey et al.
proteomic analysis: PIR’s development of the iProXpress system described aboveis one attempt to do this but there will be many others. Modern mass spectrom-etry methods can rapidly generate more data than humans or available softwarecan quickly analyze for meaningful information. (2) The integration and inter-operation of numerous related biological and medical information: The futurehere seems dependent on community efforts to define common data standards,object models, and ontologies to allow automated queries and analysis of disparatedata sources. PIR is actively participating in many of these efforts including NCI’scaBIG pilot project whose success or failure will have a large influence on howsuch efforts are conducted in the future. (3) Developing better ways to quicklyand accurately present this information in a form that humans can easily use todevelop new biomedical knowledge: This is an area that needs more attention.Bioinformatics professionals need to work more closely with potential usersand human factors specialists to develop improved visualization techniques.To quote one colleague at a large mass spectrometry laboratory, “We routinelyproduce data from a single experiment whose summary of protein identificationscontains more lines than Excel can handle and our biologist customers knowwhat to do with.”
Acknowledgments
The PIR protein bioinformatics activities are supported by the NIH grants forUniProt (U01 HG02712-01), NIAID proteomic resource (HHSN266200400061C),and grid enablement (NCI-caBIG-ICR-10-10-01), and National Science Foundationgrants for iProClass (DBI-0138188) and BioThesaurus (ITR-0205470).
References
1. MacCoss, M.J., Computational analysis of shotgun proteomics data. Curr. Opin. Chem. Biol.,9, 88–94 (2005).
2. Johnson, R.S., Davis, M.T., Taylor, J.A. and Patterson, S.D., Informatics for protein identifi-cation by mass spectrometry. Methods, 35, 223–236 (2005).
3. Galperin, M.Y., The molecular biology database collection: 2006 update. Nucleic Acids Res.,34, D3–D5 (2005).
4. Benson, D.A., Karsch-Mizrachi, I., Lipman, D.J. et al., GenBank. Nucleic Acids Res., 34,D16–D20 (2005).
5. Ball, C.A., Awad, I.A., Demeter, J. et al., The Stanford Microarray Database accommodatesadditional microarray platforms and data formats. Nucleic Acids Res., 33, D580–D582 (2005).
6. Blake, J.A., Eppig, J.T., Bult, C.J. et al., The Mouse Genome Database (MGD): updates andenhancements. Nucleic Acids Res., 34, D562–D567 (2006).
7. Sherry, S.T., Ward, M.H., Kholodov, M. et al., dbSNP: the NCBI database of genetic variation.Nucleic Acids Res., 29, 308–311 (2001).

Protein bioinformatics 221
8. Cole, J.R., Chai, B., Farris, R.J., Wang, Q. et al., The Ribosomal Database Project (RDP-II):sequences and tools for high-throughput rRNA analysis. Nucleic Acids Res., 33, D294–D296(2005).
9. Wu, C.H., Apweiler, R., Bairoch, A. et al., The Universal Protein Resource (UniProt): anexpanding universe of protein information. Nucleic Acids Res., 34, D187–D191 (2006).
10. Mulder, N.J., Apweiler, R., Attwood, T.K. et al., InterPro, progress and status in 2005. NucleicAcids Res., 33, D201–D205 (2005).
11. Kouranov, A., Xie, L., de la Cruz, J. et al., The RCSB PDB information portal for structuralgenomics. Nucleic Acids Res., 34, D302–D305 (2006).
12. Alfarano, C., Andrade, C.E., Anthony, K. et al., The Biomolecular Interaction NetworkDatabase and related tools 2005 update. Nucleic Acids Res., 33, D418–D424 (2005).
13. Kanehisa, M., Goto, S., Hattori, M. et al., From genomics to chemical genomics: new devel-opments in KEGG. Nucleic Acids Res., 34, D354–D357 (2006).
14. Wheeler, D.L., Barrett, T., Benson, D.A. et al., Database resources of the National Center forBiotechnology Information. Nucleic Acids Res., 34, D173–D180 (2006).
15. Wu, C.H., Yeh, L.-S., Huang, H. et al., The Protein Information Resource. Nucleic Acids Res.,31, 345–347 (2003).
16. Wu, C.H., Huang, H., Nikolskaya, A., Hu, Z. and Barker, W.C., The iProClass integrated data-base for protein functional analysis. Comput. Biol. Chem., 28, 87–96 (2004).
17. Wu, C.H., Nikolskaya, A., Huang, H. et al., PIRSF family classification system at the ProteinInformation Resource. Nucleic Acids Res., 32, D112–D114 (2004).
18. Natale, D.A., Vinayaka, C.R. and Wu, C.H., Large-scale, classification-driven, rule-basedfunctional annotation of proteins. In: Subramaniam, S. (Ed.), Encyclopedia of Genetics,Genomics, Proteomics and Bioinformatics. Proteomics Volume. 2005.
19. Hu, Z.Z., Mani, I., Hermoso, V., Liu, H. and Wu, C.H., iProLINK: an integrated proteinresource for literature mining. Comput. Biol. Chem., 28, 409–416 (2004).
20. Andreeva, A., Howorth, D., Brenner, S.E. et al., SCOP database in 2004: refinements integratestructure and sequence family data. Nucleic Acids Res., 32, D226–D229 (2004).
21. Gene Ontology Consortium, The gene ontology (GO) project in 2006. Nucleic Acids Res., 34,D322–D326 (2006).
22. Huang, H., Barker, W.C., Chen, Y. and Wu, C.H., iProClass: an integrated database of proteinfamily, function, and structure information. Nucleic Acids Res., 31, 390–392 (2003).
23. Pruitt, K.D., Tatusova, T. and Maglott, D.R., NCBI Reference Sequence (RefSeq): a curatednon-redundant sequence database of genomes, transcripts and proteins. Nucleic Acids Res., 33,D501–D504 (2005).
24. Maglott, D., Ostell, J., Pruitt, K.D. and Tatusova, T., Entrez gene: gene-centered informationat NCBI. Nucleic Acids Res., 33, D54–D58 (2005).
25. Nikolskaya, A.N., Arighi, C., Huang, H., Barker, W.C. and Wu, C.H., PIRSF family classifi-cation system for protein functional and evolutionary analysis. Evol. Bioinformatics Online, 2,209–221 (2006).
26. Mazumder, R., Natale, D., Murthy, S., Thiagarajan, R. and Wu, C.H., CUPID: computationalidentification of strain-, species- and genus-specific proteins. BMC Bioinformatics, 6, 279 (2005).
27. Rubin, D.L., Lewis, S.E., Mungall, C.J. et al., National Center for Biomedical Ontology:advancing biomedicine through structured organization of scientific knowledge. OMICS, 10,185–198 (2006).
28. Mani, I., Hu, Z.Z., Jang, S.E. et al., Protein name tagging guidelines: lessons learned. Comp.Funct. Genomics, 6, 72–76 (2005).
29. Hu, Z.Z., Narayanaswamy, M., Ravikumar, K.E., Vijay-Shanker, K. and Wu, C.H., Literaturemining and database annotation of protein phosphorylation using a rule-based system.Bioinformatics, 21, 2759–2765 (2005).

222 P. McGarvey et al.
30. Liu, H.F., Hu, Z.Z., Zhang, J. and Wu, C.H., BioThesaurus: a web-based thesaurus of proteinand gene names. Bioinformatics, 22, 103–105 (2006).
31. Yuan, X., Hu, Z.Z., Wu, H.T. et al., An online literature mining tool for protein phosphoryla-tion. Bioinformatics, 22, 1668–1669 (2006).
32. Li, W., Amri, H., Huang, H., Wu, C.H. and Papadopoulos, V., Gene and protein profiling ofthe acute response of MA-10 Leydig tumor cells to human chorionic gonadotropin. J. Androl.,25, 900–913 (2004).
33. Chi, A., Valencia, J.C., Hu, Z.Z. et al., Proteomic and bioinformatic characterization of the bio-genesis and function of melanosomes. J. Proteome Res. (2006), in press.
34. Hu, Z.Z., Valencia, J.C., Huang, H. et al., Comparative bioinformatics analyses and profilingof lysosome-related organelle proteomes. Int. J. Mass Spectrom. (2006), in press.

Medical Applications of Mass SpectrometryK. Vékey, A. Telekes and A. Vertes (editors)© 2008 Elsevier B.V. All rights reserved
223
Chapter 11
Analysis of complex lipidomes
ANDREAS UPHOFF, MARTIN HERMANSSON, PERTTU HAIMI, andPENTTI SOMERHARJU*
Institute of Biomedicine, Department of Biochemistry, University of Helsinki, 00014 Helsinki,Finland
1. Introduction 2242. Methodology 226
2.1. Lipid extraction 2262.2. Mass spectrometry 2262.3. Data analysis 229
3. Phospholipids 2303.1. Phosphatidylcholine and sphingomyelin 2303.2. Phosphatidylethanolamine 2323.3. Phosphatidylserine 2323.4. Phosphatidylglycerol, lysobisphosphatidic acid, and phosphatidic acid 2333.5. Cardiolipin 2333.6. Phosphatidylinositol and polyphosphoinositides 234
4. Acylglycerols 2344.1. Triacylglycerols 2344.2. Diacylglycerols and monoacylglycerols 235
5. Sphingolipids 2355.1. Free sphingoid bases 2355.2. Ceramides 2365.3. Neutral glycosphingolipids 2365.4. Sulfatides 2365.5. Gangliosides 237
6. Sterols 2376.1. Cholesterol and other sterols 2376.2. Steryl esters and steroid hormones 238
7. Medical applications of MS-lipidomics 2387.1. Diagnostics and therapy 238
*Corresponding author. E-mail: [email protected] (P. Somerharju).

224 A. Uphoff et al.
7.2. Disease mechanisms 2397.3. Nutrition and other issues 239
8. Future trends 2409. Conclusions 240References 240
1. Introduction
It is now firmly established that lipids, besides forming the “backbone” of allbiological membranes, are also key players in a variety of other physiologicalphenomena including signal transduction, energy metabolism, intracellular sortingof membrane-bound molecules, morphogenesis, etc. A typical mammalian cell hasbeen estimated to contain more than 1000 different lipid species. The meaning ofsuch a great variety of lipid molecules is not well understood, even if one consid-ers the numerous functions of lipids listed above. “Functional lipidomics” is anovel field of research probing the relationship between a (detailed) lipid compo-sition of a cell or organism (the “lipidome”) and a particular biological or medicalproblem.
Traditionally, lipids are analyzed by means of thin-layer chromatography (TLC),high-performance liquid chromatography (HPLC), and gas chromatography (GC)[1,2]. While still useful for many purposes, these methods are labor-intensive, time-consuming, and insensitive and thus detailed analyses of complex lipidomes havebecome feasible only recently due to the rapid development of novel mass-spectrometric methods, particularly electrospray ionization mass spectrometry(ESI–MS). Although even ESI–MS does not yet allow one to quantify all �1000lipid molecules that form the “lipidome” of a cell or tissue, method development isprogressing so fast that this will probably be feasible within a few years. Becauseof the great body of data produced even in a single ESI–MS analysis, computerizeddata analysis is a necessity. It is also essential to develop novel bioinformatics toolsto correlate lipidomes (and changes therein) with the functions of the system. MS-lipidomics has a great, albeit yet largely unrealized, potential in diagnosing diseasesor pathological conditions including atherosclerosis, metabolic syndrome, andother disorders.
Recent developments in mass spectrometry, particularly the introduction of theESI method, have paved way to “functional lipidomics,” i.e., the use of detailedlipid profile of cell or tissues to unravel biological phenomena and the mecha-nisms underlying various metabolic perturbations or diseases.
At present, ESI–MS allows quantitative analysis of hundreds of phospholipidspecies present in a sample. Two different approaches are commonly used. The

Analysis of complex lipidomes 225
MS/MS method relies on selective detection of lipid classes directly from thecrude lipid extract by precursor ion or neutral loss (NL) scanning. For example,phosphatidylethanolamines (PE) can be selectively detected by scanning for theconstant NL of 141 Da, while phosphatidylinositols (PI) can be analyzed scanningfor the precursor of m/z 241. On the other hand, triacylglycerols (TAGs) have beenanalyzed by constant NL scanning for different fatty acids and many sphingolipidsby scanning for the precursors of the dehydrated sphingoid base. Notably, theMS/MS approach allows very convenient and detailed studies of lipid metabolismby using heavy isotope (2H or 13C)-labeled precursors. For instance, labeling ofcells with D9-labeled choline combined with scanning for the precursors of m/z193 (deuterated choline) allows one to selectively detect only the labeled specieswithout interference by the unlabeled ones.
The other, LC–MS, approach makes use of on-line preseparation of the lipidsbefore MS analysis. This method allows analysis of species for which no specificscan modes exist. Also, many isobaric species, not readily resolved by MS/MS,can be analyzed. Finally, this method, particularly when employing multiple reac-tion monitoring (MRM), provides the highest sensitivity of detection of manyminor lipid classes as the suppression effects are minimized.
Independent of the approach, a particular problem in quantitative analysis of lipidcompositions with MS is the lack of standards. For accurate results, it is obligatoryto include one or preferably several internal standards for each lipid class to beanalyzed. This is because the instrument response can vary markedly depending onstructural details such as the length and unsaturation of the alkyl chains. The mech-anisms behind such structure-dependent variations in instrument response are notfully understood, but differences in ionization and fragmentation efficiencies areprobably involved.
Triple quadrupole MS instruments have been the most common ones in studiesinvolvinglipidanalysis,butnovelhybrid(quadrupoletime-of-flight,etc.) instrumentsare rapidly gaining popularity due to their ability for multiple precursor ion scanssimultaneously. Besides ESI, atmospheric pressure chemical ionization (APCI),atmospheric pressure photoionization (APPI), and matrix-assisted laser desorptionionization (MALDI) have been employed in analysis of lipids. However, thesemethods seem to have an advantage over ESI only in special cases. For instance,APPI and APCI allow analysis of sterols without derivatization, which is neededfor ESI.
Due to its remarkable resolving power and speed of analysis, the amount of dataproduced by MS analysis of lipidomes is often overwhelming, even when a limitednumber of samples are to be analyzed. Therefore, computerized methods are nec-essary and have indeed been published recently for both MS/MS and LC–MS data.Beyond the analysis of primary data, there is an urgent need for programs allowingone to correlate lipid compositions with other compositional and functional data.This is because the lipid profiles as such are often difficult to interpret in terms of

226 A. Uphoff et al.
functions and mechanisms. To this end, lipid databases are needed and are presentlyunder construction.
Due to its novelty, MS-based lipidomics is still evolving and relative few prac-tical applications have emerged so far. However, it is highly likely that in the nearfuture MS-lipidomics will play, in combination with other “omics,” a crucial rolein biology, biotechnology, and medicine.
In this review, we will first describe the general methodology of MS-lipidomics,then present the state-of-the-art of analysis of different phospholipids, neutrallipids, e.g., TAGs, cholesterol esters (CEs), sphingolipids, and sterols, and, finally,we will discuss the potential clinical applications of MS-lipidomics. Unfortunately,due to lack of space we cannot deal with all relevant publications. These can befound in recent reviews on MS-lipidomics [3–10].
2. Methodology
2.1. Lipid extraction
The analysis of lipids by MS (or any another method) usually requires that they arefirst separated from other molecules and ions present in the sample under study. Byfar the most common separation method is extraction of the lipids with organic sol-vents followed by “washing” of the organic phase with a polar one in order to removethe contaminants potentially interfering with the analysis [11,12]. However, somelipids are relatively polar and thus partially lost during such washing procedure. Thisis particularly true for complex gangliosides, free sphingoid bases, and sphingosine-1-phosphate and several lysophospholipids. For these lipid-modified liquid/liquidpartition methods need to be employed [9,13,14]. Alternatively, solid-phase extrac-tion could be exploited [15]. Independent of the method used, it is useful to includeinternal standards before the extraction to correct for any losses upon extraction.
2.2. Mass spectrometry
Recent developments in soft ionization techniques, such as ESI, APCI, and MALDIas well as instrumentation, have “revolutionized” the analysis of lipidomes due totheir simplicity, sensitivity, and resolving power. Several comprehensive reviews ofthe present state-of-the-art are available [3–10]. Most published MS analyses oflipidomes have utilized ESI and triple (or hybrid) quadrupole instruments and,therefore, we will focus on this setup below. However, references to other types ofinstrumentation will be made when they seem to offer special advantages.
Since lipid extracts often contain hundreds of different species, many of whichare structurally very similar (e.g., differ only by one double bond), even standard MSanalysis is not capable of resolving them all, but special strategies need to be applied

Analysis of complex lipidomes 227
to enhance the selectivity of detection and discriminate against chemical noise. Oneapproach is to vary the polarity of the ion source. For instance, phosphatidylcholines(PCs) and sphingomyelins (SMs) provide higher signal in the positive vs. negativemode, while the opposite is true for acidic lipids like phosphatidylinositols and–serines. Additional selectivity can be achieved by a judicious choice of the solvent,pH, and added salts [4]. Nevertheless, such manipulations are not adequate to reli-ably quantify all lipid species present in a typical sample, but additional measuresare necessary to enhance the specificity of detection. To this end, two alternativeapproaches have been adopted. One of them involves (partial) on-line chromato-graphic separation of the lipids before the MS analysis [16–20]. This LC–MSmethod (Fig. 1, upper panel) often allows quantification of isobaric (of equal mass)species due to their differential retention in the column. The other significant bene-fit is that suppression effects are alleviated, thus allowing more sensitive detectionof low-abundance species [3]. LC–MS with MRM is probably the most sensitivemethod of lipid analysis, particularly when using capillary columns.
The second commonly used approach makes use of precursor ion (PI) or NLscans to selectively detect specific lipids in crude lipid extracts directly (i.e., withoutpreseparation) infused to the mass spectrometer [21–23]. A common phenomenonamong phospholipids is the loss of the head group as a charged or neutral fragmentupon collisionally activated dissociation (CAD). Due to differences in the chemicalstructure of the lipid head group, CAD often gives rise to a fragment(s) which ischaracteristic to a phospholipid class (Fig. 2), and thus the members of this class canbe selectively detected by PI or constant NL scanning. This approach (Fig. 1, lowerpanel) can also be used to selectively detect glycerolipids containing specific fattyacids [4]. Analogously, many sphingolipids can be selectively detected by scanningfor the precursors of dehydrated sphingoid bases.
The choice between these (or other) strategies depends on, for example, theaccessible instrumentation, complexity of the lipidome, and the amount of sampleavailable. In general, LC–MS provides higher resolving power and sensitivity,while a notable advantage of the direct infusion MS/MS method is that isotope-labeled lipids can be detected selectively (without interference by the unlabeledones) simply by changing a single scan parameter [24–26].
Full analysis of lipidomes requires that the structures and positions of fatty acylmoieties present in individual lipid species can be resolved. In case of glycero-phospholipids the acyl moieties can be identified based on the formation of thecorresponding fragments upon CAD in the negative ion mode [21]. Even the sn-1and sn-2 positions (cf. Fig. 2) of the acyl moieties can be identified based on therelative intensities of the lysolipid fragments [19,27–30].
Recently, interest in hybrid instruments, such as Q-TOFs, has grown as theseenable simultaneous recording of almost unlimited number of fragmentations[31–33]. This is particularly useful for elucidating the acyl residues present, sincemultiple precursor ion scans can be performed simultaneously [34].

950
900
850
750
700
5 10 15 20 30[min]
[m/z
]
35 40 45
16:0-22:6 PtdCho8127 849.7 (T17:1 TAG)
865.7
863.7
837.7
811.7 835.7
813.7
909.7
911.7
Partial ESI/MS trace C of Fig 2
0
100
50
800 850 900 950
935.7
911.7
887.7865.7
911.7887.7
863.7
849.7
NL 254.2(16.1 FA)
NL 256.2(16.0 FA)
NL 280.2(18.2 FA)
NL 282.2(18.1 FA)
NL 268.2(17.1 FA)
Internal standard
NL 328.3(22.6 FA)
Rel
ativ
e in
tens
ity (
%)
m/z
Fig. 1. Upper panel: 2D display of mouse brain polar lipids as analyzed by LC–MS. Color-coded dataare shown for clarity; original can be found in ref. [19]. The lipid classes from left to right are asfollows: blue at �7 min, PA; black, GalCer; gray, �-OH-GalCer; red, plasmalogen-PE; green at�12 min, diacyl-PE; orange, PC; violet, SM; yellow, sulfatides; pink, �-hydroxysulfatides; green at�25 min, PS; and blue at �38 min, PI (reprinted in part with permission from Hermasson et al.,Anal Chem., 77, 2166–2175 (2005)). Lower panel: 2D MS�MS spectral analysis of triacylglycerolmolecular species from mouse liver. Multiple neutral loss scans specific for different fatty acidmoieties were combined to identify and quantify the triacylglycerol molecular species present(reprinted from Han et al., Anal. Biochem., 330, 317–331 (2004)) (reprinted in part with permission).

Analysis of complex lipidomes 229
2.3. Data analysis
While successful data acquisition is an obvious prerequisite for the elucidation ofa lipidome, the task does not end there. Data analysis can prove to be a difficultundertaking due to complexity of the samples and the various corrections neededfor accurate quantification. The major tasks to be performed are: (i) identificationof all relevant signals, (ii) assignment of signals to lipids, adducts, and fragments,(iii) isotopic correction, (iv) deconvolution of overlapping signals, and (v) quan-tification according to internal standards.
Phospholipids---------------------------------------------------------------Phosphatidylcholine (PC) X = Choline
Phosphatidylethanolamine (PE) X = Ethanolamine
Phosphatidylserine (PS) X = Serine
Phosphatidylinositol (PI) X = Inositol
Phosphatidylglycerol (PG) X = Glycerol
---X
Sphingolipids---------------------------------------------------------------Sphingosine (Dihydrosphingosine lacks the double bond;Phytosphingosine has a OH-group at carbon 4)
Ceramide (Cer) X = H
Sphingomyelin (SM) X = Phosphocholine
Glucosylceramide (GluCer) X = Glucose
Lactosylceramide (LacCer) X = Lactose
X
A.
B.
Apolar Lipids-------------------------------------------------------
Triacylglycerols = 3 x R (acyl chain)
Diacylglycerols = 2 x R
Monoacylglycerols = 1 x R
Cholesterol X = H
Cholesteryl ester X = acyl chain
R1-O
R2-O CH
CH2
CH2R3-O
C.
O-X
Fig. 2. Panel A: Structure of some common glycerophospholipids and the typical fragmentationsites. Panel B: Structure of some common sphingolipids and typical fragmentation sites. Panel C:Structure of acylglycerols, cholesterol, and cholesterylesters.

230 A. Uphoff et al.
Since data analysis is a complicated and very time-consuming task, attempts havebeen made to automate this process. Kurvinen et al. have developed an algorithm thatallows automated assignment and quantification of TAGs based on MS data [35,36].A similar algorithm was implemented by Liebisch et al. for determination of PC andSM species from PI spectra [37]. Han and Gross have published a protocol for theanalysis of phospholipid and triglyceride molecular species (with acyl chain infor-mation) based on a two-dimensional matrix of data produced by multiple MS/MSscans [4]. We have recently developed a method that allows accurate quantitativeanalysis of lipidomes based on two-dimensional LC–MS data [19].
Quantification of lipids based on MS data is significantly complicated by the factthat the ionization efficiency depends markedly on the structure of the polar headgroup and acyl chains [3,9,23]. Additional problems arise from suppression effectsdepending on the concentration of lipids, ions, or other impurities present in the sam-ple. Different solutions to these problems have been suggested including (i) the use ofmultiple internal standards for each lipid class [22,23], (ii) working at low concentra-tion range [4], (iii) determining the response–concentration curve for each individualcompound [38], and (vi) spiking with natural species [37]. Notably, suppressioneffects can be very pronounced in MALDI, as shown, for instance, by the finding thatPC can preclude the analysis of the other phospholipid classes present [39].
Beyond the analysis of the primary MS data, there is a need for tools allowing oneto correlate lipid compositions with other compositional and functional data. This isbecause the lipid profiles alone are difficult to interpret in terms of mechanisms andfunctions. Lipid databases are also needed, but are yet under construction [40].
3. Phospholipids
Phospholipids are the most abundant lipids in nearly all biological membranes.Besides forming the lipid bilayer “backbone” of biological membranes, they par-ticipate in several other processes, such as signal transduction, endocytic sorting,activation of membrane enzymes, and alveolar function. The general structures ofglycerophospholipids and the characteristic fragments formed in ESI are shown inTable 1.
3.1. Phosphatidylcholine and sphingomyelin
PC is the main component of mammalian membranes and lipoproteins. PC is alsokeenly involved in cell signaling [41]. SM is specifically enriched to the plasmamembranes of cells and is also abundant in lipoproteins. Notably, SM and choles-terol are thought to form segregated, ordered domains within the cellular mem-branes [42]. Such domains, also referred as “rafts,” are presently under intensiveinvestigation due to their putative roles in intracellular lipid and protein sorting,cellular signaling molecules, and various diseases [43].

Analysis of complex lipidomes 231
Both PC and SM contain a phosphocholine head group, which makes themolecules zwitterionic and largely dictates their ionization and fragmentationbehavior. PC and SM readily form [M�H]� ions which upon CAD yield an abun-dant phosphocholine fragment with m/z 184 (cf. Table 1) and can thus be selectivelydetected by scanning for parents of this ion. In the presence of different salts, PCand SM form both cation and anion adducts, which may be utilized for the eluci-dation of the fatty acids present in the molecules [19,29,34,44,45]. In case of SM,also a fragment indicative of the long-chain base is found [45].
Quantification of SM species is often hampered by spectral overlap due to themuch more abundant PC species. This problem can be solved either by removingthe PCs with alkaline hydrolysis in silico using a spectral subtraction protocol [37]
Table 1
Lipid class-specific fragments produced by collision-activated degradation
Lipid class Precursor ion Fragment ion Fragmentation type and fragment mass
Acyl glycerols TAG, DAG, MAG [M�NH4]� [M�NH4- NH3- NL of fatty
RCOO]� acid
Steryl esters Cholesteryl esters [M�NH4]� [C27H45]
� PI 369.35
Glycerophospho- PA, PI, PS, PG [M-H]� [C3H6O5P]� PI 153.00lipids
PC [M�H]� [C5H15NO4P]� PI 184.07
PC [M�Li]� [M�Li- N(CH3)3]� NL 59.07
PC [M�HCOO]� [M�HCOO- NL 60.02HCOOCH3]
�
PE [M�H]� [M�H- NL 141.02C2H8NO4P]�
PS [M�H]� [M�H- NL 185.01C3H8NO6P]�
PS [M-H]� [M-H- C3H5NO2]� NL 87.03
PI [M-H]� [C6H10O8P]� PI 241.01
Lysophospholipids [M-H]� [PO3]� PI 78.96
PG, PI, PA, PS
Sphingolipids SM [M�H]� [C5H15NO4P]� PI 184.07
NGSL [M�H]� For example, PI 264[C18H34N](sphingosine)
Sulfatide [M-H]� [HSO4]� PI 96.95
Abbreviations: DAG, diacylglycerol; MAG, monoacylglycerol; TAG, triacylglycerol; NGSL, neutralglycosphingolipids; PA, phosphatidic acid; PC, phosphatidylcholine; PE, phosphatidylethanolamine;PG, phosphatidylglycerol; PI, phosphatidylinositol; PS, phosphatidylserine; SM, sphingomyelin. Seethe text for other details.

232 A. Uphoff et al.
or by employing LC–MS [19]. Also, NL scanning in the negative mode withproperly adjusted instrument settings seems to allow selective detection of SM inthe presence of PC [46]. Many tissues contain PC species with an ether-linkedalkyl chain in the sn-1 position. At present, these molecules are probably mostreadily analyzed by LC–MS [19,47].
3.2. Phosphatidylethanolamine
PE is another major phospholipid in the membranes of eukaryotic cells. PEplasmalogens, which comprise �50% of total PE lipids, contain a vinyl ether-linked hydrocarbon chain in the sn-1 position instead of an ester-linked chain.Plasmalogens represent a major source of arachidonic acid, an important secondmessenger, and are also thought to have an important protective role against oxida-tive damage [48].
PE, including the plasmalogens, can be detected either as the [M�H]� ion inthe positive mode or as [M-H]� ion in the negative mode, particularly under alka-line conditions [3,4,21]. In the positive mode, PE exhibits a specific NL of 141(phosphoethanolamine), whereas in the negative mode carboxylate anions fromfatty acid fragmentation are the most abundant fragments.
The presence of alkenyl ether (plasmalogens), alkyl ether, and diacyl speciescomplicates the analysis of PE, due to extensive spectral overlaps between thesesub-classes. Also, ether PEs do not lose their head group as readily as the diacyl acylspecies, and thus scanning for the neural loss of 141 underestimates their concen-tration [49]. This can be avoided by derivatization of the amino group [50]. The PEsub-classes can be separated and analyzed by using normal-phase LC–MS [19,47].
3.3. Phosphatidylserine
Phosphatidylserine (PS) usually comprises �3–5 mol% of total phospholipids ofmammalian cells, but its concentration is much higher (15–33 mol%) in the innerleaflet of the plasma membrane. PS is an activator of the protein kinase C, and PSexposure to the cell surface plays a key role in platelet aggregation as well as inelimination of apoptotic cells [51].
Due to its net negative charge, PS yields abundant [M-H]� ions in negative ionmode while [M�H]� or [M�Na]� ions are formed in positive mode. Upon CAD,the [M-H]� ion readily loses [serine-H2O] as a neutral fragment as well as the fattyacids as carboxylate anions [21,22,30,52]. Thus, scanning for an NL of 87 allowsspecific detection of PS species in crude lipid extracts, while information on thefatty acyl substituents can be obtained by product or precursor ion scanning.Notably, PS can also be analyzed in the positive mode based on an NL of phos-phoserine (185 Da) [21,22,30].

Analysis of complex lipidomes 233
3.4. Phosphatidylglycerol, lysobisphosphatidic acid, and phosphatidic acid
Phosphatidylglycerol (PG) is a major lipid in many bacterial membranes, but com-prises only 1–2 mol% of phospholipids in animal tissues. However, PG is muchmore abundant (�10 mol%) in the lung surfactant, thus pointing to an importantrole therein. Lysobisphosphatidic acid (LBPA) is another minor lipid and is presentonly in lysosomes and secondary endosomes where it seems to play an importantrole in controlling the formation of multivesicular bodies [53]. Phosphatidic acid(PA) is a key intermediate of glycerolipid synthesis and is also involved in cellsignaling [41]. Lyso-PA (PA lacking one fatty acid moiety) is a highly activesignaling molecule, which is involved in proliferation, migration, and survival ofcells [54].
Ionization of PG can be achieved in positive mode as [M�H]� or [M�Na]3�,but is usually analyzed in the negative mode as the [M-H]� ion. LBPA is isobaricwith PG containing the same (or isobaric) fatty acids, which, together with the factthat abundant class-specific fragments are produced by neither lipid, complicatestheir analysis by the MS/MS method. Both PG and LBPA can be analyzed by scan-ning for precursors of m/z 153 [phosphoglycerol-H2O]� [44,55], but the 153 ion isproduced from several other phospholipids as well. However, PG and LBPA can bereadily analyzed by using normal-phase LC–MS [18,56], since LBPA elutes wellbefore PG (our unpublished data).
PA forms [M-H]� ions avidly and can be usually distinguished from other phos-pholipids due to its smaller mass [57]. The fragmentation of the [M-H]� is quitesimilar to that of PG and LBPA, the most significant fragments being fatty acidanions as well as [phosphoglycerol-H2O]� (m/z 153) [58].
3.5. Cardiolipin
Cardiolipin (CL) is a complex lipid which, in essence, consists of PG moleculesattached to a PA molecule. In mammals it is present only in mitochondria(mainly in the inner membranes), and C18 fatty acids, particularly linoleate(18:2), are predominant in CLs [59]. CL is an activator of many enzymes ofthe respiratory chain and its deficiency results in serious defects. In the Barthsyndrome CL is diminished, probably due to impaired remodeling of its fattyacids [60].
CL forms both [M-H]� and [M-2H]2� ions and its fatty acid moieties can bededuced from the product ion spectrum [33,56,61]. Complete structural analysisof CL, i.e., identification of the positions of the fatty acids in the molecule,requires the use of an ion trap instrument and multiple fragmentation steps[62,63]. Quantification of the positional isomers is not straightforward, however,due to acyl chain structure-dependent fragmentation efficiency [64].

234 A. Uphoff et al.
3.6. Phosphatidylinositol and polyphosphoinositides
Phosphatidylinositol (PI) and its phosphorylated derivatives PI-4-phosphate (PI-4-P), PI-4,5-bisphosphate (PI-4,5-P2), etc., are widespread in nature, albeitthey do not occur in bacteria. While the biological role(s) of PI are not clear yet,polyphosphoinositides are known to be crucial in various physiological phenom-ena, including intracellular signaling and vesicle traffic [65,66].
PI, as other acidic lipids, is best analyzed in the negative mode [21]. The fragmention of m/z 241 (inositol phosphate-H2O) is specific for PI and its phosphorylatedderivatives, thus allowing specific detection by precursor ion scanning [22]. PI-Pshows additional signals at m/z 321 (inositol diphosphate-H2O) and m/z 303 (inosi-tol diphosphate-2 H2O), while PI-3,4-P shows a fragment corresponding toinositol triphosphate-H2O at m/z 401 [28]. These fragments allow specific detectionof polyphosphoinositides by precursor ion scanning [65]. For each lipid, the fattyacid residues can be identified from the product ion spectra [28]. Analysis of PI andPIP with MALDI is also possible [67], but only with rather low sensitivity [39].
4. Acylglycerols
4.1. Triacylglycerols
TAGs in the adipose tissue serve as the main energy store of the body as well as“carriers” of fatty acids in lipoproteins. TAGs are also found in the cytoplasmiclipid droplets present in cells of many tissues.
TAGs can be detected as adducts of NH4�, Na�, Li�, or similar ions added to the
solvent [4]. Only small amounts of H� adducts are found under acidic conditions[68]. The cation adducts of TAGs usually do not fragment spontaneously, whichgreatly assist the interpretation of their spectra. Diagnostic fragments can beobtained by either in-source fragmentation or CAD, or some other activationmethod [69]. The fragments are typically formed via a loss of a fatty acid. High-energy CAD produces charge-remote fragments allowing the determination of thepositions of double bonds in the acyl moieties [70].
A special complication in the analysis of TAGs is the large number of isobarsresulting from presence of different combinations of the three acyl moieties andtheir regioisomers. The “shotgun lipidomics” approach [4] developed by Han andGross provides detailed structural information on TAGs as lithium adducts basedon the molecular mass and NL scans for the expected fatty acids. However, com-plete structural analysis of TAGs requires the use of hyphenated methods likeHPLC–MS/MS [71] or silver-ion chromatography [72] with MS [73]. A review ofseparation methods is available [74].
Besides ESI, chemical ionization (CI orAPCI) has been used for TAG analysis. InCI in the negative ion mode [75], ionization takes place via abstraction of a proton to

Analysis of complex lipidomes 235
form [M-H]� ions. Both [RCOO]� and [M-H-RCOOH-100]� ions are observedand can be used to assign the individual fatty acids as well as the regioisomers.In APCI (usually combined with HPLC) [M�H]� ions are detected [76] and frag-mentation can be used to assign regioisomers [77]. With MALDI, [M�Na]�
ions but no [M�H]� ions are observed [6], possibly due to prompt fragmentationof the latter to [M-RCOO]� ions [78]. The observed, usually not very abundant,fragments do not contain Na� and are again diagnostic of the fatty acid residues.However, the relative intensities of the fragment ions do not seem to reflect the posi-tion of the fatty acids [78].
4.2. Diacylglycerols and monoacylglycerols
These partially acylated glycerols are usually present only in trace amounts infresh tissues. They can be analyzed analogously to TAGs using any of the tech-niques mentioned above [79].
5. Sphingolipids
The best characterized functions of sphingolipids are related to the structure ofbiological membranes, signal transduction, and biological recognition of thesemolecules [42,80–82]. Common to all lipids of this class is the sphingoid base,which comprises the backbone of the molecule. The sphingoid base is acylated,usually with a long-chain fatty acid, to the amino group at position 2 to produceceramide, which serves as a precursor for the synthesis of more complex sphin-golipids. Ceramide is then appended at the 1-position of the sphingoid base to giverise to a variety of different glycosphingolipids or sphingophospholipids [83,84].
5.1. Free sphingoid bases
Sphingosine (d18:1) or sphinganine (d18:0) comprises the backbone of all sphin-golipids. They and their phosphorylated derivatives are also important secondmessengers involved in functions such as cell growth, differentiation, and apopto-sis [81,85]. Sphingoid bases are readily protonated to form [M�H]� ions (e.g.,m/z 300.3 for d18:1 and m/z 302.3 for d18:0). Upon collisional activation they loseH2O to yield a carbocation and can thus be analyzed by scanning for the precursorsof m/z 282�284 (or m/z 264�266 for doubly dehydrated molecules) [86]. The phos-phorylated sphingoid bases can be analyzed in either positive or negative mode as[M�H]� or [M-H]� ion, respectively. Upon collisional activation the [M�H]�
ion of sphingosyl-1-phosphate forms a carbocation product ion (m/z 264 for d18:1base) [87], while the [M-H]� ion gives rise to abundant [PO3]
� ion (m/z 79).Scanning for the precursors of m/z 79 thus yields all free phosphorylated sphingoidbases [88].

236 A. Uphoff et al.
5.2. Ceramides
Ceramides perform similar vital functions as the sphingoid bases [85,89,90] andare also key structural components of stratum corneum [91]. Ceramides produceabundant [M�H]� ions and upon CAD readily lose the fatty acid and one or twowater molecules from the sphingoid base. Accordingly, ceramides can be analyzedby scanning for the precursors of different sphingoid base fragments, e.g., m/z 264for the d18:1 [88,92,93]. Alternatively, CAD of deprotonated ceramides enablestheir analysis based on the sphingoid base-specific NL in the negative ion mode[94]. The benefit in the latter approach is the formation of a single fragmentationproduct, whereas during scanning for the precursors of the sphingoid bases in pos-itive ion mode the analysis may be complicated by the occurrence of double peaksdue to loss of water from the [M�H]� ion.
5.3. Neutral glycosphingolipids
The most abundant neutral glycosphingolipids in mammals are galactosyl-,glucosyl-, and lactosylceramides (GalCer, GlcCer, and LacCer, respectively).GalCer is abundant in tissues of the central nervous system, especially in themyelin sheath. It is also a precursor to sulfatides and the ganglioside GM4, whileGlcCer can be converted to LacCer, which in turn serves as a precursor for a largenumber of different glycosphingolipid species [83,95]. GalCer and GlcCer and/ortheir derivatives are involved in the regulation of cell growth, protein traffickingand sorting, and modulation of cell adhesion and cell morphogenesis [96,97].
Neutral glycosphingolipids are best detected in the positive ionization mode as[M�H]� or [M�Li]� ions, although they also form [M�HCOO]� and [M�Cl]�
adducts in the negative ionization mode [19,88,98,99]. Upon low-energy CAD, the[M�H] ions dissociate by a neural loss of the glycan, the charge remaining inthe ceramide moiety.At higher collision energies, the sphingoid base (�1 or 2 H2O) isthe characteristic product ion and thus these lipids can be selectively detected by scan-ning for precursors of the different sphingoid bases. In some tissues, galactosyl- andglucosylceramides contain additional hydroxyl groups in the sphingoid base and /or inthe fatty acyl moiety. LC–MS allows for accurate quantitation of these lipids, espe-cially with MS�MS [9,19]. It must also be noted that GlcCer and GalCer are isobaric,and thus distinction of these molecules requires their prior separation by LC [87].Alternatively, they can be distinguished by CAD of chlorinated adducts [99].
5.4. Sulfatides
Sulfatides are derived from GalCer via esterification of a sulfate group to 3-hydroxyl of the galactose moiety. Sulfatides are abundant in the brain, where theyact as essential components of the myelin sheaths, and also appear to participate

Analysis of complex lipidomes 237
in protein trafficking, signal transduction, and neuronal cell differentiation [100].Sulfatide has been implicated as a potential cause in some autoimmune diseases(e.g., diabetes mellitus), and substantial loss of sulfatides has been detected inbrains of Alzheimer patients [101].
Sulfatides are readily deprotonated to form [M-H]� ions and upon CAD theyyield an abundant HSO4
� ion (m/z 97), which allows convenient analysis of sul-fatides by precursor ion scanning. Identification of the long-chain base and thefatty acyl constituents is also feasible, since a daughter ion diagnostic of the acylmoiety can be detected. The method allows identification of isobaric speciesand those containing �-hydroxylated fatty acid substituents as well [102,103].Alternatively, the LC–MS method can be used [19,104]. Notably, LC–MS pro-vides a clear distinction between the �-hydroxylated and nonhydroxylated speciesand thus their accurate quantitation.
5.5. Gangliosides
Gangliosides are negatively charged sialic acid containing glycosphingolipidswith a greatly varying number of sugar moieties in their polar head group [95].They are enriched by the outer leaflet of the plasma membrane and participate invital functions including signal transduction, cell–cell interactions, as well as cellproliferation, differentiation, and apoptosis [82,97].
Due to their low abundance, characterization of gangliosides usually involvesisolation from other lipid classes by TLC, LC, or capillary electrophoresis beforethe MS analysis [105–108]. The gangliosides form several types of ions. In the neg-ative mode, they appear as deprotonated pseudomolecular ions, in which the num-ber of charges usually corresponds to the number of sialic acids present [105,109,110]. In the presence of Na� ions also single or multiple sodium adducts are detected[105,107]. The negative ions gives rise to a characteristic fragmentation patternproviding information on the structure of the oligosaccharide and ceramide moi-eties [111]. All gangliosides produce the fragment m/z 290 deriving from the sialicacid moiety, which has been utilized for direct analysis of gangliosides from lipidextracts by precursor ion scanning [112]. Information of the substitutions of theindividual sugars can be obtained by MS/MS analysis of permethylated moleculesin the positive mode.
6. Sterols
6.1. Cholesterol and other sterols
Cholesterol is an essential component of mammalian membranes and is a precur-sor for all steroid hormones. However, cholesterol can accumulate in certain tissues

238 A. Uphoff et al.
and cause serious pathological consequences in the body, such as artherosclerosis.Recently, the analysis of oxidation products of cholesterol (and other lipids) hasgained interest due to their putative pathophysiological role [113]. There is alsogrowing interest toward various plant sterols (phytosterols) as their intake signifi-cantly reduces plasma cholesterol levels [114].
Sterols cannot be analyzed by ESI–MS without derivatization as they are notreadily ionized [115]. Sandhoff et al. have used chemical sulfatation to achievehigh-sensitivity detection of cholesterol [116]. Cholesterol has also been deriva-tized with dimethylglycine, MDMABS [117], or ferrocenecarbamate [118].Notably, derivatization can be avoided by using APCI or APPI, which have beenapplied for the analysis of cholesterol and other sterols [119–122] or oxidizedcholesterol [123].
6.2. Steryl esters and steroid hormones
Although cholesteryl esters (CEs) play an important role in cholesterol metabo-lism, there are few reports on CE analysis by MS. The behavior of cholesterylesters in ESI is very similar to that of TAGs, and thus NH4
� [124,125] and Ag�
adducts [126] have been used for their analysis. Fragmentation of the adduct ionsproduces a characteristic ion of m/z 369.35 corresponding to [cholesterol-H2O]�.Other steryl esters behave similarly (e.g., estrone esters [127]). With APPI, the[M�H-H2O]� ions are the most prominent ones [121].
Steroids are more polar than sterols, and can be analyzed by ESI and APCIwithout derivatization [128], albeit derivatization increases the sensitivity ofdetection [115,129].
7. Medical applications of MS-lipidomics
MS-lipidomics appears to have a great potential in medicine including diagnosisand therapy, analysis of mechanisms underlying various diseases, or other patho-physiological conditions and nutrition. Below we will briefly discuss the resultsobtained so far in these fields.
7.1. Diagnostics and therapy
There are several studies indicating the potential of MS-lipidomics in the diagnosisof genetic and other diseases. Perhaps the most prominent example is the diagnosisof the Barth syndrome based on the analysis of the phospholipid species of theplatelets. Platelets from patients with this disorder contained greatly reduced levelsof the CL molecular species containing four linoleyl (18:2) residues as compared tounaffected individuals [61]. LC–MS analysis allows the detection of this diagnostic

Analysis of complex lipidomes 239
parameter far more easily than traditional methods of lipid analysis, and potentiallyalso allows one to monitor the therapeutic effects of fatty acid supplementation [60].MS-lipidomics is also helpful in diagnosis and therapy of other hereditary diseaseslike Fabry disease based on increased levels of, e.g., trihexosyl and lactosylceramidesfound in the urine due to lack of the lysosomal �-galactosidase [130,131].Also, someperoxisomal disorders like X-linked adrenoleykodystrophy and Zellweger syndromecould be diagnosed based on MS analysis of long-chain fatty acids [132], ceramides[133], or PE plasmalogens (our unpublished data). MS-lipidomics may also allowone to diagnose the Lowe syndrome based on altered polyphosphoinositol lipid com-position [65]. MS analysis of ascitic fluid from patients with ovarian cancer hasrevealed increased levels of some lysophospholipids, which could thus provideuseful biomarkers for this disease [134,135]. Yet, MS-lipidomics has significantpotential in diagnosing and judging the predisposition for various multifactorial dis-orders, such as type 2 diabetes and artherosclerosis, particularly when combined withthe analysis of other biomarkers [136].
7.2. Disease mechanisms
MS-lipidomics is also likely to be very helpful in resolving the metabolic defectsunderlying various common diseases, like type 2 diabetes, atherosclerosis,Alzheimer’s disease, and different cancers. So far, MS-lipidomics has been helpfulin understanding the mechanism of lipid accumulation in atherosclerotic plaques[137,138], optic nerve hypoplasia [139], cystic fibrosis [140], neuronal-ceroid lipo-fuscinosis [18], aggressive periodontal tissue damage [141], ulcerative colitis[142], glycosphingolipid disorders [143], and diabetic cardiomyopathy [144].
Besides compositional data, MS is also highly useful to study lipid metabolismin cells or whole animals. A variety of heavy isotope (2H, 13C)-labeled lipid pre-cursors are commercially available and can be used to obtain highly detailed dataregarding the biosynthetic routes and kinetics of lipid metabolism. So far thisapproach has been employed to study, e.g., the contribution of different pathwaysto the biosynthesis of PC in malignant cells [25], �-oxidation of fatty acids in per-oxisomal disorders [145], surfactant PC synthesis [146], and lipid metabolismrelated to obesity [147].
7.3. Nutrition and other issues
MS-lipidomics also offers a powerful tool for nutritional studies. For instance, theeffect of caloric restriction on lipid composition of murine myocardium has beeninvestigated by this method [148]. In another study, the effect of structure of TAGson the chylomicron TAG composition in humans was investigated [149]. MS-lipidomics also appears to be useful in resolving the mechanisms underlying drugaddiction and related issues [150].

240 A. Uphoff et al.
8. Future trends
Since MS-based lipidomics has evolved only very recently and the methodology isevolving rapidly, we can expect major advancements in understanding the physio-logical roles of the multitude of lipid species present in the human body within thenext few years. However, this will require integration of the lipidomics data withthose of the other “omics,” which remains a major challenge at this time. It doesnot seem unrealistic to assume that MS-lipidomics will become a routine methodin the clinic for screening for rare lipid disorders as well as the predisposition for avariety of common lipid-related pathological conditions such as atherosclerosis,type 2 diabetes, as well as the Alzheimer’s disease.
9. Conclusions
Recent methodological developments in MS have made quantitative analysis ofthe complex lipidomes of mammalian cells and tissues feasible for the first time.Phospholipids can already be analyzed in a routine manner and the analysis ofmost other lipid classes should be possible as soon as some issues regarding quan-tification, particularly the availability of suitable standards, have been resolved.A detailed analysis of lipidomes is expected to provide a powerful tool for thediagnosis and understanding of the mechanism of various lipid-related diseasesand disorders, including atherosclerosis and type 2 diabetes. This, however, willrequire integration of the lipidomics data with those of genomics, proteomics, andother “omics,” which may not be trivial.
References
1. Christie, W.W., Lipid Analysis Isolation, Separation, Identification and Structural Analysis ofLipids. The Oily Press, Bridwater, UK, 2003.
2. Kates, M., Techniques of Lipidology: Isolation, Analysis, and Identification of Lipids. North-Holland Publishing Company, Amsterdam, 1972.
3. Pulfer, M. and Murphy, R.C., Electrospray mass spectrometry of phospholipids. MassSpectrom. Rev., 22, 332–364 (2003).
4. Han, X. and Gross, R.W., Shotgun lipidomics: electrospray ionization mass spectrometricanalysis and quantitation of cellular lipidomes directly from crude extracts of biological sam-ples. Mass Spectrom. Rev., 24, 367–412 (2005).
5. Forrester, J.S., Milne, S.B., Ivanova, P.T. and Brown, H.A., Computational lipidomics: amultiplexed analysis of dynamic changes in membrane lipid composition during signal trans-duction. Mol. Pharmacol., 65, 813–821 (2004).
6. Schiller, J., Suss, R., Arnhold, J., Fuchs, B., Lessig, J., Muller, M., Petkovic, M., Spalteholz, H.,Zschornig, O. and Arnold, K., Matrix-assisted laser desorption and ionization time-of-flight(MALDI-TOF) mass spectrometry in lipid and phospholipid research. Prog. Lipid Res., 43,449–488 (2004).

Analysis of complex lipidomes 241
7. Welti, R. and Wang, X., Lipid species profiling: a high-throughput approach to identify lipidcompositional changes and determine the function of genes involved in lipid metabolism andsignaling. Curr. Opin. Plant Biol., 7, 337–344 (2004).
8. Johnson, D.W., Contemporary clinical usage of LC�MS: analysis of biologically importantcarboxylic acids. Clin. Biochem., 38, 351–361 (2005).
9. Merrill Jr., A.H., Sullards, M.C., Allegood, J.C., Kelly, S. and Wang, E., Sphingolipidomics:high-throughput, structure-specific, and quantitative analysis of sphingolipids by liquid chro-matography tandem mass spectrometry. Methods, 36, 207–224 (2005).
10. Murphy, R.C., Barkley, R.M., Zemski Berry, K., Hankin, J., Harrison, K., Johnson, C., Krank, J.,McAnoy, A., Uhlson, C. and Zarini, S., Electrospray ionization and tandem mass spectrome-try of eicosanoids. Anal. Biochem. (2005).
11. Folch, J., Lees, M. and Stanley, G.H.S., A simple method for the isolation and purification oftotal lipids from animal tissues. J. Biol. Chem., 226, 497–509 (1957).
12. Bligh, E.G. and Dyer, W.J., A rapid method of total lipid extraction and purification. Can. J Biochem. Physiol., 37, 911–917 (1959).
13. Kralik, S.F., Du, X.N., Patel, C. and Walsh, J.P., A method for quantitative extraction of sphin-gosine 1-phosphate into organic solvent. Anal. Biochem., 294, 190–193 (2001).
14. Bjerve, K.S., Daae, L.N.W. and Bremer, J., The selective loss of lysophospholipids in somecommonly used lipid-extraction procedures. Anal. Biochem., 58, 238–245 (1974).
15. Ruiz-Gutierrez, V. and Perez-Camino, M.C., Update on solid-phase extraction for the analysisof lipid classes and related compounds. J. Chromatogr. A, 885, 321–341 (2000).
16. Kim, H.Y., Wang, T.C. and Ma, Y.C., Liquid chromatography/mass spectrometry of phospho-lipids using electrospray ionization. Anal. Chem., 66, 3977–3982 (1994).
17. Taguchi, R., Hayakawa, J., Takeuchi, Y. and Ishida, M., Two-dimensional analysis of phos-pholipids by capillary liquid chromatography/electrospray ionization mass spectrometry.J. Mass Spectrom., 35, 953–966 (2000).
18. Kakela, R., Somerharju, P. and Tyynela, J., Analysis of phospholipid molecular species inbrains from patients with infantile and juvenile neuronal-ceroid lipofuscinosis using liquidchromatography–electrospray ionization mass spectrometry. J. Neurochem., 84, 1051–1065(2003).
19. Hermansson, M., Uphoff, A., Kakela, R. and Somerharju, P., Automated quantitative analysis ofcomplex lipidomes by liquid chromatography/mass spectrometry. Anal. Chem., 77, 2166–2175(2005).
20. Houjou, T., Yamatani, K., Imagawa, M., Shimizu, T. and Taguchi, R., A shotgun tandemmass spectrometric analysis of phospholipids with normal-phase and/or reverse-phase liquidchromatography/electrospray ionization mass spectrometry. Rapid Commun. Mass Spectrom.,19, 654–666 (2005).
21. Kerwin, J.L., Tuininga, A.R. and Ericsson, L.H., Identification of molecular species of glyc-erophospholipids and sphingomyelin using electrospray mass spectrometry. J. Lipid Res., 35,1102–1114 (1994).
22. Brugger, B., Erben, G., Sandhoff, R., Wieland, F.T. and Lehmann, W.D., Quantitative analysisof biological membrane lipids at the low picomole level by nano-electrospray ionization tan-dem mass spectrometry. Proc. Nat. Acad. Sci. U.S.A., 94, 2339–2344 (1997).
23. Koivusalo, M., Haimi, P., Heikinheimo, L., Kostiainen, R. and Somerharju, P., Quantitativedetermination of phospholipid compositions by ESI–MS: effects of acyl chain length, unsatu-ration, and lipid concentration on instrument response. J. Lipid Res., 42, 663–672 (2001).
24. Hunt, A.N., Clark, G.T., Attard, G.S. and Postle, A.D., Highly saturated endonuclear phos-phatidylcholine is synthesized in situ and colocated with CDP–choline pathway enzymes.J. Biol. Chem., 276, 8492–8499 (2001).

242 A. Uphoff et al.
25. DeLong, C.J., Hicks, A.M. and Cui, Z., Disruption of choline methyl group donation for phos-phatidylethanolamine methylation in hepatocarcinoma cells. J. Biol. Chem., 277, 17217–17225 (2002).
26. Boumann, H.A., Chin, P.T., Heck, A.J., De Kruijff, B. and De Kroon, A.I., The yeast phospho-lipid N-methyltransferases catalyzing the synthesis of phosphatidylcholine preferentiallyconvert di-C16:1 substrates both in vivo and in vitro. J. Biol. Chem., 279, 40314–40319 (2004).
27. Brouwers, J., Vernooij, E., Tielens, A.G.M. and van Golde, L.M.G., Rapid separation and iden-tification of phosphatidylethanolamine molecular species. J. Lipid Res., 40, 164–169 (1999).
28. Hsu, F.F. and Turk, J., Characterization of phosphatidylinositol, phosphatidylinositol-4-phosphate, and phosphatidylinositol-4, 5-bisphosphate by electrospray ionization tandemmass spectrometry: a mechanistic study. J. Am. Soc. Mass Spectrom., 11, 986–999 (2000).
29. Hsu, F.F. and Turk, J., Electrospray ionization/tandem quadrupole mass spectrometric studieson phosphatidylcholines: the fragmentation processes. J. Am. Soc. Mass Spectrom., 14, 352–363 (2003).
30. Hsu, F.F. and Turk, J., Studies on phosphatidylserine by tandem quadrupole and multiple stagequadrupole ion-trap mass spectrometry with electrospray ionization: structural characteriza-tion and the fragmentation processes. J. Am. Soc. Mass Spectrom., 16, 1510–1522 (2005).
31. Ekroos, K., Chernushevich, I.V., Simons, K. and Shevchenko, A., Quantitative profiling ofphospholipids by multiple precursor ion scanning on a hybrid quadrupole time-of-flight massspectrometer. Anal. Chem., 74, 941–949 (2002).
32. Ekroos, K. and Shevchenko, A., Simple two-point calibration of hybrid quadrupole time-of-flight instruments using a synthetic lipid standard. Rapid Commun. Mass Spectrom., 16,1254–1255 (2002).
33. Sparagna, G.C., Johnson, C.A., McCune, S.A., Moore, R.L. and Murphy, R.C., Quantitationof cardiolipin molecular species in spontaneously hypertensive heart failure rats using elec-trospray ionization mass spectrometry. J. Lipid Res., 46, 1196–1204 (2005).
34. Ekroos, K., Ejsing, C.S., Bahr, U., Karas, M., Simons, K. and Shevchenko, A., Chartingmolecular composition of phosphatidylcholines by fatty acid scanning and ion trap MS3 frag-mentation. J. Lipid Res., 44, 2181–2192 (2003).
35. Kurvinen, J.P., Aaltonen, J., Kuksis, A. and Kallio, H., Software algorithm for automatic inter-pretation of mass spectra of glycerolipids. Rapid Commun. Mass Spectrom., 16, 1812–1820(2002).
36. Kurvinen, J.P., Rua, P., Sjovall, O. and Kallio, H., Software (MSPECTRA) for automaticinterpretation of triacylglycerol molecular mass distribution spectra and collision induced dis-sociation product ion spectra obtained by ammonia negative ion chemical ionization massspectrometry. Rapid Commun. Mass Spectrom., 15, 1084–1091 (2001).
37. Liebisch, G., Lieser, B., Rathenberg, J., Drobnik, W. and Schmitz, G., High-throughput quan-tification of phosphatidylcholine and sphingomyelin by electrospray ionization tandem massspectrometry coupled with isotope correction algorithm. Biochim. Biophys. Acta-Mol. CellBiol. Lipids, 1686, 108–117 (2004).
38. Zacarias, A., Bolanowski, D. and Bhatnagar, A., Comparative measurements of multicompo-nent phospholipid mixtures by electrospray mass spectroscopy: relating ion intensity to con-centration. Anal. Biochem., 308, 152–159 (2002).
39. Muller, M., Schiller, J., Petkovic, M., Oehrl, W., Heinze, R., Wetzker, R., Arnold, K. andArnhold, J., Limits for the detection of (poly-)phosphoinositides by matrix-assisted laser des-orption and ionization time-of-flight mass spectrometry (MALDI–TOF MS). Chem. Phys.Lipids, 110, 151–164 (2001).
40. Fahy, E., Subramaniam, S., Brown, H.A., Glass, C.K., Merrill Jr., A.H., Murphy, R.C.,Raetz, C.R., Russell, D.W., Seyama, Y., Shaw, W., Shimizu, T., Spener, F., van Meer, G.,

Analysis of complex lipidomes 243
VanNieuwenhze, M.S., White, S.H., Witztum, J.L. and Dennis, E.A., A comprehensive classi-fication system for lipids. J. Lipid Res., 46, 839–862 (2005).
41. Foster, D.A. and Xu, L., Phospholipase D in cell proliferation and cancer. Mol. Cancer Res.,1, 789–800 (2003).
42. Simons, K. and Ikonen, E., Functional rafts in cell membranes. Nature, 387, 569–572 (1997).43. Rajendran, L. and Simons, K., Lipid rafts and membrane dynamics. J. Cell Sci., 118,
1099–1102 (2005).44. Han, X.L. and Gross, R.W., Structural determination of picomole amounts of phospholipids
via electrospray ionization tandem mass spectrometry. J. Am. Soc. Mass Spectrom., 6,1202–1210 (1995).
45. Hsu, F.F. and Turk, J., Structural determination of sphingomyelin by tandem mass spectrome-try with electrospray ionization. J. Am. Soc. Mass Spectrom., 11, 437–449 (2000).
46. Houjou, T., Yamatani, K., Nakanishi, H., Imagawa, M., Shimizu, T. and Taguchi, R., Rapid andselective identification of molecular species in phosphatidylcholine and sphingomyelin byconditional neutral loss scanning and MS3. Rapid Commun. Mass Spectrom., 18, 3123–3130(2004).
47. Uran, S., Larsen, A., Jacobsen, P.B. and Skotland, T., Analysis of phospholipid species inhuman blood using normal-phase liquid chromatography coupled with electrospray ionizationion-trap tandem mass spectrometry. J. Chromatogr. B, 758, 265–275 (2001).
48. Brites, P., Waterham, H.R. and Wanders, R.J., Functions and biosynthesis of plasmalogens inhealth and disease. Biochim. Biophys. Acta, 1636, 219–231 (2004).
49. Berry, K.A.Z. and Murphy, R.C., Electrospray ionization tandem mass spectrometry of glyc-erophosphoethanolamine plasmalogen phospholipids. J. Am. Soc. Mass Spectrom., 15,1499–1508 (2004).
50. Berry, K.A.Z. and Murphy, R.C., Analysis of cell membrane aminophospholipids as isotope-tagged derivatives. J. Lipid Res., 46, 1038–1046 (2005).
51. Vance, J.E. and Steenbergen, R., Metabolism and functions of phosphatidylserine. Prog. LipidRes. (2005).
52. Hsu, F.F. and Turk, J., Studies on phosphatidylserine by tandem quadrupole and multiple stagequadrupole ion-trap mass spectrometry with electrospray ionization: structural characteriza-tion and the fragmentation processes (vol. 16, p. 1510, 2005). J. Am. Soc. Mass Spectrom., 17,640–640 (2006).
53. Matsuo, H., Chevallier, J., Mayran, N., Le Blanc, I., Ferguson, C., Faure, J., Blanc, N.S.,Matile, S., Dubochet, J., Sadoul, R., Parton, R.G., Vilbois, F. and Gruenberg, J., Role of LBPAand Alix in multivesicular liposome formation and endosome organization. Science, 303,531–534 (2004).
54. Moolenaar, W.H., van Meeteren, L.A. and Giepmans, B.N., The ins and outs of lysophospha-tidic acid signaling. Bioessays, 26, 870–881 (2004).
55. Larsen, A., Uran, S., Jacobsen, P.B. and Skotland, T., Collision-induced dissociation of glyc-ero phospholipids using electrospray ion-trap mass spectrometry. Rapid Commun. MassSpectrom., 15, 2393–2398 (2001).
56. Laurinavicius, S., Kakela, R., Bamford, D.H. and Somerharju, P., The origin of phospholipidsof the enveloped bacteriophage phi6. Virology, 326, 182–190 (2004).
57. Ivanova, P.T., Cerda, B.A., Horn, D.M., Cohen, J.S., McLafferty, F.W. and Brown, H.A.,Electrospray ionization mass spectrometry analysis of changes in phospholipids in RBL-2H3mastocytoma cells during degranulation. Proc. Natl. Acad. Sci. U.S.A., 98, 7152–7157 (2001).
58. Hsu, F.F. and Turk, J., Charge-driven fragmentation processes in diacyl glycerophosphatidicacids upon low-energy collisional activation. A mechanistic proposal. J. Am. Soc. MassSpectrom., 11, 797–803 (2000).

244 A. Uphoff et al.
59. Schlame, M., Brody, S. and Hostetler, K.Y., Mitochondrial cardiolipin in diverse eukaryotes—comparison of biosynthetic reactions and molecular acyl species. Eur. J. Biochem., 212,727–735 (1993).
60. Valianpour, F., Wanders, R.J., Overmars, H., Vaz, F.M., Barth, P.G. and van Gennip, A.H.,Linoleic acid supplementation of Barth syndrome fibroblasts restores cardiolipin levels: impli-cations for treatment. J. Lipid Res., 44, 560–566 (2003).
61. Valianpour, F., Wanders, R.J.A., Barth, P.G., Overmars, H. and van Gennip, A.H., Quantitativeand compositional study of cardiolipin in platelets by electrospray ionization mass spectrom-etry: application for the identification of Barth syndrome patients. Clin. Chem., 48, 1390–1397(2002).
62. Hsu, F.F., Turk, J., Rhoades, E.R., Russell, D.G., Shi, Y.X. and Groisman, E.A., Structural char-acterization of cardiolipin by tandem quadrupole and multiple-stage quadrupole ion-trap massspectrometry with electrospray ionization. J. Am. Soc. Mass Spectrom., 16, 491–504 (2005).
63. Hsu, F.F. and Turk, J., Characterization of cardiolipin from Escherichia coli by electros-pray ionization with multiple stage quadrupole ion-trap mass spectrometric analysis of[M � 2H � Na](�) ions. J. Am. Soc. Mass Spectrom., 17, 420–429 (2006).
64. Hvattum, E., Hagelin, G. and Larsen, A., Study of mechanisms involved in the collision-induced dissociation of carboxylate anions from glycerophospholipids using negative ionelectrospray tandem quadrupole mass spectrometry. Rapid Commun. Mass Spectrom., 12,1405–1409 (1998).
65. Wenk, M.R., Lucast, L., Di Paolo, G., Romanelli, A.J., Suchy, S.F., Nussbaum, R.L., Cline,G.W., Shulman, G.I., McMurray, W. and De Camilli, P., Phosphoinositide profiling in complexlipid mixtures using electrospray ionization mass spectrometry. Nat. Biotechnol., 21, 813–817(2003).
66. van Meer, G. and Sprong, H., Membrane lipids and vesicular traffic. Curr. Opin. Cell Biol.,16, 373–378 (2004).
67. Schiller, J., Arnhold, J., Benard, S., Muller, M., Reichl, S. and Arnold, K., Lipid analysis bymatrix-assisted laser desorption and ionization mass spectrometry: a methodologicalapproach. Anal. Biochem., 267, 46–56 (1999).
68. Duffin, K.L., Henion, J.D. and Shieh, J.J., Electrospray and tandem mass spectrometric char-acterization of acylglycerol mixtures that are dissolved in nonpolar solvents. Anal. Chem., 63,1781–1788 (1991).
69. Hsu, F.F. and Turk, J., Structural characterization of triacylglycerols as lithiated adducts byelectrospray ionization mass spectrometry using low-energy collisionally activated dissocia-tion on a triple stage quadrupole instrument. J. Am. Soc. Mass Spectrom., 10, 587–599 (1999).
70. Cheng, C.F. and Gross, M.L., Complete structural elucidation of triacylglycerols by tandemsector mass spectrometry. Anal. Chem., 70, 4417–4426 (1998).
71. Segall, S.D., Artz, W.E., Raslan, D.S., Ferraz, V.P. and Takahashi, J.A., Analysis of triacyl-glycerol isomers in Malaysian cocoa butter using HPLC–mass spectrometry. Food Res. Int.,38, 167–174 (2005).
72. Christie, W.W., A stable silver-loaded column for the separation of lipids by high-performanceliquid-chromatography. J. High Resolut. Chromatogr. Chromatogr. Commun., 10, 148–150(1987).
73. Sandra, P., Medvedovici, A., Zhao, Y. and David, F., Characterization of triglycerides in veg-etable oils by silver-ion packed-column supercritical fluid chromatography coupled to massspectroscopy with atmospheric pressure chemical ionization and coordination ion spray.J. Chromatogr. A, 974, 231–241 (2002).
74. Buchgraber, M., Ullberth, F., Emons, H. and Anklam, E., Triacylglycerol profiling by usingchromatographic techniques. Eur. J. Lipid Sci. Technol., 106, 621–648 (2004).

Analysis of complex lipidomes 245
75. Kallio, H., Tuomasjukka, S., Johansson, A., Tahvonen, R., Nieminen, N., Sjovall, O.,Kurvinen, J.P. and Kivini, H., Analysis of regioisomers of triacylglycerols of northern currantseed oil by tandem mass spectrometry. Eur. J. Lipid Sci. Technol., 107, 101–106 (2005).
76. Nagy, K., Bongiorno, D., Avellone, G., Agozzino, P., Ceraulo, L. and Vekey, K., High per-formance liquid chromatography–mass spectrometry based chemometric characterization ofolive oils. J. Chromatogr. A, 1078, 90–97 (2005).
77. Byrdwell, W.C., The bottom-up solution to the triacylglycerol lipidome using atmosphericpressure chemical ionization mass spectrometry. Lipids, 40, 383–417 (2005).
78. Al-Saad, K.A., Zabrouskov, V., Siems, W.F., Knowles, N.R., Hannan, R.M. and Hill, H.H.,Matrix-assisted laser desorption/ionization time-of-flight mass spectrometry of lipids: ioniza-tion and prompt fragmentation patterns. Rapid Commun. Mass Spectrom., 17, 87–96 (2003).
79. Murphy, R.C., Fiedler, J. and Hevko, J., Analysis of nonvolatile lipids by mass spectrometry.Chem. Rev., 101, 479–526 (2001).
80. Brown, D.A. and London, E., Structure and function of sphingolipid- and cholesterol-richmembrane rafts. J. Biol. Chem., 275, 17221–17224 (2000).
81. Spiegel, S. and Merrill Jr., A.H., Sphingolipid metabolism and cell growth regulation. FASEBJ., 10, 1388–1397 (1996).
82. Hakomori, S., Traveling for the glycosphingolipid path. Glycoconjugate J., 17, 627–647 (2000).83. Sandhoff, K. and Kolter, T., Biosynthesis and degradation of mammalian glycosphingolipids.
Philos. Trans. R. Soc. Lond. B Biol. Sci., 358, 847–861 (2003).84. Degroote, S., Wolthoorn, J. and van Meer, G., The cell biology of glycosphingolipids. Semin.
Cell Dev. Biol., 15, 375–387 (2004).85. Futerman, A.H. and Hannun, Y.A., The complex life of simple sphingolipids. EMBO Rep., 5,
777–782 (2004).86. Lieser, B., Liebisch, G., Drobnik, W. and Schmitz, G., Quantification of sphingosine and
sphinganine from crude lipid extracts by HPLC electrospray ionization tandem mass spec-trometry. J. Lipid Res., 44, 2209–2216 (2003).
87. Sullards, M.C. and Merrill Jr., A.H., Analysis of sphingosine 1-phosphate, ceramides, andother bioactive sphingolipids by high-performance liquid chromatography–tandem mass spec-trometry. Sci. STKE, 2001, PL1 (2001).
88. Sullards, M.C., Analysis of sphingomyelin, glucosylceramide, ceramide, sphingosine, andsphingosine 1-phosphate by tandem mass spectrometry. Methods Enzymol., 312, 32–45 (2000).
89. Ruvolo, P.P., Ceramide regulates cellular homeostasis via diverse stress signaling pathways.Leukemia, 15, 1153–1160 (2001).
90. Pettus, B.J., Chalfant, C.E. and Hannun, Y.A., Ceramide in apoptosis: an overview and currentperspectives. Biochim. Biophys. Acta, 1585, 114–125 (2002).
91. Goldstein, A.M. and Abramovits, W., Ceramides and the stratum corneum: structure, function,and new methods to promote repair. Int. J. Dermatol., 42, 256–259 (2003).
92. Gu, M., Kerwin, J.L., Watts, J.D. and Aebersold, R., Ceramide profiling of complex lipid mix-tures by electrospray ionization mass spectrometry. Anal. Biochem., 244, 347–356 (1997).
93. Liebisch, G., Drobnik, W., Reil, M., Trumbach, B., Arnecke, R., Olgemoller, B., Roscher, A.and Schmitz, G., Quantitative measurement of different ceramide species from crude cellularextracts by electrospray ionization tandem mass spectrometry (ESI–MS�MS). J. Lipid Res.,40, 1539–1546 (1999).
94. Han, X., Characterization and direct quantitation of ceramide molecular species from lipidextracts of biological samples by electrospray ionization tandem mass spectrometry. Anal.Biochem., 302, 199–212 (2002).
95. Kolter, T., Proia, R.L. and Sandhoff, K., Combinatorial ganglioside biosynthesis. J. Biol.Chem., 277, 25859–25862 (2002).

246 A. Uphoff et al.
96. Hakomori, S., Structure, organization, and function of glycosphingolipids in membrane. Curr.Opin. Hematol., 10, 16–24 (2003).
97. Bektas, M. and Spiegel, S., Glycosphingolipids and cell death. Glycoconjugate J., 20, 39–47(2004).
98. Hsu, F.F. and Turk, J., Structural determination of glycosphingolipids as lithiated adducts byelectrospray ionization mass spectrometry using low-energy collisional-activated dissociationon a triple stage quadrupole instrument. J. Am. Soc. Mass Spectrom., 12, 61–79 (2001).
99. Han, X. and Cheng H., Characterization and direct quantitation of cerebroside molecularspecies from lipid extracts by shotgun lipidomics. J. Lipid Res., 46, 163–175 (2005).
100. Merrill Jr., A.H., Schmelz, E.M., Dillehay, D.L., Spiegel, S., Shayman, J.A., Schroeder, J.J.,Riley, R.T., Voss, K.A. and Wang, E., Sphingolipids—the enigmatic lipid class: biochemistry,physiology, and pathophysiology. Toxicol. Appl. Pharmacol., 142, 208–225 (1997).
101. Han, X., Holtzman, D.M., McKeel Jr., D.W., Kelley, J. and Morris, J.C., Substantial sulfatidedeficiency and ceramide elevation in very early Alzheimer’s disease: potential role in diseasepathogenesis. J. Neurochem., 82, 809–818 (2002).
102. Hsu, F.F., Bohrer, A. and Turk, J., Electrospray ionization tandem mass spectrometric analysisof sulfatide. Determination of fragmentation patterns and characterization of molecularspecies expressed in brain and in pancreatic islets. Biochim. Biophys. Acta, 1392, 202–216(1998).
103. Hsu, F.F. and Turk, J., Studies on sulfatides by quadrupole ion-trap mass spectrometry withelectrospray ionization: structural characterization and the fragmentation processes thatinclude an unusual internal galactose residue loss and the classical charge-remote fragmenta-tion. J. Am. Soc. Mass Spectrom., 15, 536–546 (2004).
104. Beausoleil, H.E., Lepine, F. and Dubreuil, J.D., LC–MS analysis of pig intestine sulfatides:interaction with Escherichia coli STb enterotoxin and characterization of molecular speciespresent. FEMS Microbiol. Lett., 209, 183–188 (2002).
105. Metelmann, W., Muthing, J. and Peter-Katalinic, J., Nano-electrospray ionization quadrupoletime-of-flight tandem mass spectrometric analysis of a ganglioside mixture from human gran-ulocytes. Rapid Commun. Mass Spectrom., 14, 543–550 (2000).
106. Zamfir, A., Vukelic, Z. and Peter-Katalinic, J., A capillary electrophoresis and off-line capillaryelectrophoresis/electrospray ionization-quadrupole time of flight-tandem mass spectrometryapproach for ganglioside analysis. Electrophoresis, 23, 2894–2903 (2002).
107. Zamfir, A., Vukelic, Z., Bindila, L., Peter-Katalinic, J., Almeida, R., Sterling, A. and Allen, M.,Fully-automated chip-based nanoelectrospray tandem mass spectrometry of gangliosides fromhuman cerebellum. J. Am. Soc. Mass Spectrom., 15, 1649–1657 (2004).
108. Meisen, I., Peter-Katalinic, J. and Muthing, J., Direct analysis of silica gel extracts fromimmunostained glycosphingolipids by nanoelectrospray ionization quadrupole time-of-flightmass spectrometry. Anal. Chem., 76, 2248–2255 (2004).
109. Ju, D.D., Lai, C.C. and Her, G.R., Analysis of gangliosides by capillary zone electrophoresisand capillary zone electrophoresis–electrospray mass spectrometry. J. Chromatogr. A, 779,195–203 (1997).
110. Ghardashkhani, S., Gustavsson, M.L., Breimer, M.E. and Samuelsson, B.E., Negative electro-spray ionization mass spectrometry of gangliosides, sulphatides and cholesterol 3-sulphate.Rapid Commun. Mass Spectrom., 9, 491–494 (1995).
111. Metelmann, W., Peter-Katalinic, J. and Muthing, J., Gangliosides from human granulocytes: anano-ESI QTOF mass spectrometry fucosylation study of low abundance species in complexmixtures. J. Am. Soc. Mass Spectrom., 12, 964–973 (2001).
112. Tsui, Z.C., Chen, Q.R., Thomas, M.J., Samuel, M. and Cui, Z., A method for profilinggangliosides in animal tissues using electrospray ionization–tandem mass spectrometry.Anal. Biochem., 341, 251–258 (2005).

Analysis of complex lipidomes 247
113. Olkkonen, V.M. and Lehto, M., Oxysterols and oxysterol binding proteins: role in lipid meta-bolism and atherosclerosis. Ann. Med., 36, 562–572 (2004).
114. Miettinen, T.A. and Gylling, H., Effect of statins on noncholesterol sterol levels: implicationsfor use of plant stanols and sterols. Am. J. Cardiol., 96, 40–46 (2005).
115. Higashi, T. and Shimada, K., Derivatization of neutral steroids to enhance their detection char-acteristics in liquid chromatography–mass spectrometry. Anal. Bioanal. Chem., 378, 875–882(2004).
116. Sandhoff, R., Brugger, B., Jeckel, D., Lehmann, W.D. and Wieland, F.T., Determination ofcholesterol at the low picomole level by nano-electrospray ionization tandem mass spectrom-etry. J. Lipid Res., 40, 126–132 (1999).
117. Johnson, D.W., ten Brink, H.J. and Jakobs, C., A rapid screening procedure for cholesterol anddehydrocholesterol by electrospray ionization tandem mass spectrometry. J. Lipid Res., 42,1699–1705 (2001).
118. Van Berkel, G.J., Quirke, J.M., Tigani, R.A., Dilley, A.S. and Covey, T.R., Derivatization forelectrospray ionization mass spectrometry. 3. Electrochemically ionizable derivatives. Anal.Chem., 70, 1544–1554 (1998).
119. Toh, T.H., Prior, B.A. and van der Merwe, M.J., Quantitation of plasma membrane ergosterolof Saccharomyces cerevisiae by direct-injection atmospheric pressure chemical ionization/tandem mass spectrometry. Anal. Biochem., 288, 44–51 (2001).
120. Ruibal-Mendieta, N.L., Rozenberg, R., Delacroix, D.L., Petitjean, G., Dekeyser, A., Baccelli, C.,Marques, C., Delzenne, N.M., Meurens, M., Habib-Jiwan, J.L. and Quetin-Leclercq, J.,Spelt (Triticum spelta L.) and winter wheat (Triticum aestivum L.) wholemeals have similarsterol profiles, as determined by quantitative liquid chromatography and mass spectrometryanalysis. J. Agric. Food Chem., 52, 4802–4807 (2004).
121. Lembcke, J., Ceglarek, U., Fiedler, G.M., Baumann, S., Leichtle, A. and Thiery, J., Rapidquantification of free and esterified phytosterols in human serum using APPI–LC–MS/MS.J. Lipid Res., 46, 21–26 (2005).
122. Nagy, K., Jakab, A., Pollreisz, F., Bongiorno, D., Ceraulo, L., Averna, M.R., Noto, D. andVékey, K., Analysis of sterols by high-performance liquid chromatography/mass spectrometrycombined with chemometrics. Rapid Commun. Mass Spectrom., 20, 2433–2440 (2006).
123. Razzazi-Fazeli, E., Kleineisen, S. and Luf, W., Determination of cholesterol oxides inprocessed food using high-performance liquid chromatography–mass spectrometry withatmospheric pressure chemical ionisation. J. Chromatogr. A, 896, 321–334 (2000).
124. Kalo, P. and Kuuranne, T., Analysis of free and esterified sterols in fats and oils by flash chro-matography, gas chromatography and electrospray tandem mass spectrometry. J. Chromatogr.A, 935, 237–248 (2001).
125. Duffin, K., Obukowicz, M., Raz, A. and Shieh, J.J., Electrospray/tandem mass spectrometryfor quantitative analysis of lipid remodeling in essential fatty acid deficient mice. Anal.Biochem., 279, 179–188 (2000).
126. Seal, J.R., Havrilla, C.M., Porter, N.A. and Hachey, D.L., Analysis of unsaturated compoundsby Ag� coordination ionspray mass spectrometry: studies of the formation of the Ag�� lipidcomplex. J. Am. Soc. Mass Spectrom., 14, 872–880 (2003).
127. Miilunpohja, M., Uphoff, A., Somerharju, P., Tiitinen, A., Wähälä, K. and Tikkanen, M.J.,Fatty acid esterification of lipoprotein-associated estrone in human plasma and follicular fluid.J. Steroid Biochem. Mol. Biol., 100, 59–66 (2006).
128. Ma, Y.-C. and Kim, H.-Y., Determination of steroids by liquid chromatography/mass spec-trometry. J. Am. Soc. Mass Spectrom., 8, 1010–1020 (1997).
129. Chatman, K., Hollenbeck, T., Hagey, L., Vallee, M., Purdy, R., Weiss, F. and Siuzdak, G.,Nanoelectrospray mass spectrometry and precursor ion monitoring for quantitative steroidanalysis and attomole sensitivity. Anal. Chem., 71, 2358–2363 (1999).

248 A. Uphoff et al.
130. Fuller, M., Sharp, P.C., Rozaklis, T., Whitfield, P.D., Blacklock, D., Hopwood, J.J. and Meikle,P.J., Urinary lipid profiling for the identification of Fabry hemizygotes and heterozygotes.Clin. Chem., 51, 688–694 (2005).
131. Whitfield, P.D., Calvin, J., Hogg, S., O’Driscoll, E., Halsall, D., Burling, K., Maguire,G., Wright, N., Cox, T.M., Meikle, P.J. and Deegan, P.B., Monitoring enzyme replacementtherapy in Fabry disease—role of urine globotriaosylceramide. J. Inherit. Metab. Dis., 28,21–33 (2005).
132. Valianpour, F., Selhorst, J.J., van Lint, L.E., van Gennip, A.H., Wanders, R.J. and Kemp, S.,Analysis of very long-chain fatty acids using electrospray ionization mass spectrometry. Mol.Genet. Metab., 79, 189–196 (2003).
133. Pettus, B.J., Baes, M., Busman, M., Hannun, Y.A. and Van Veldhoven, P.P., Mass spectromet-ric analysis of ceramide perturbations in brain and fibroblasts of mice and human patients withperoxisomal disorders. Rapid Commun. Mass Spectrom., 18, 1569–1574 (2004).
134. Xiao, Y.J., Schwartz, B., Washington, M., Kennedy, A., Webster, K., Belinson, J. and Xu, Y.,Electrospray ionization mass spectrometry analysis of lysophospholipids in human asciticfluids: comparison of the lysophospholipid contents in malignant vs nonmalignant ascitic flu-ids. Anal. Biochem., 290, 302–313 (2001).
135. Sutphen, R., Xu, Y., Wilbanks, G.D., Fiorica, J., Grendys Jr., E.C., LaPolla, J.P., Arango, H.,Hoffman, M.S., Martino, M., Wakeley, K., Griffin, D., Blanco, R.W., Cantor, A.B., Xiao, Y.J.and Krischer, J.P., Lysophospholipids are potential biomarkers of ovarian cancer. CancerEpidemiol. Biomarkers Prev., 13, 1185–1191 (2004).
136. Clish, C.B., Davidov, E., Oresic, M., Plasterer, T.N., Lavine, G., Londo, T., Meys, M., Snell,P., Stochaj, W., Adourian, A., Zhang, X., Morel, N., Neumann, E., Verheij, E., Vogels, J.T.,Havekes, L.M., Afeyan, N., Regnier, F., van der Greef, J. and Naylor, S., Integrative biologi-cal analysis of the APOE*3-leiden transgenic mouse. OMICS, 8, 3–13 (2004).
137. Thukkani, A.K., McHowat, J., Hsu, F.F., Brennan, M.L., Hazen, S.L. and Ford, D.A.,Identification of alpha-chloro fatty aldehydes and unsaturated lysophosphatidylcholine molec-ular species in human atherosclerotic lesions. Circulation, 108, 3128–3133 (2003).
138. Ravandi, A., Babaei, S., Leung, R., Monge, J.C., Hoppe, G., Hoff, H., Kamido, H. and Kuksis, A.,Phospholipids and oxophospholipids in atherosclerotic plaques at different stages of plaquedevelopment. Lipids, 39, 97–109 (2004).
139. Rodemer, C., Thai, T.P., Brugger, B., Kaercher, T., Werner, H., Nave, K.A., Wieland, F.,Gorgas, K. and Just, W.W., Inactivation of ether lipid biosynthesis causes male infertility,defects in eye development and optic nerve hypoplasia in mice. Hum. Mol. Genet., 12,1881–1895 (2003).
140. Dombrowsky, H., Clark, G.T., Rau, G.A., Bernhard, W. and Postle, A.D., Molecular speciescompositions of lung and pancreas phospholipids in the cftr(tm1HGU/tm1HGU) cystic fibro-sis mouse. Pediatr. Res., 53, 447–454 (2003).
141. Gronert, K., Kantarci, A., Levy, B.D., Clish, C.B., Odparlik, S., Hasturk, H., Badwey, J.A.,Colgan, S.P., Van Dyke, T.E. and Serhan, C.N., A molecular defect in intracellular lipid sig-naling in human neutrophils in localized aggressive periodontal tissue damage. J. Immunol.,172, 1856–1861 (2004).
142. Ehehalt, R., Wagenblast, J., Erben, G., Lehmann, W.D., Hinz, U., Merle, U. and Stremmel, W.,Phosphatidylcholine and lysophosphatidylcholine in intestinal mucus of ulcerative colitispatients. A quantitative approach by nanoelectrospray–tandem mass spectrometry. Scand. J.Gastroenterol., 39, 737–742 (2004).
143. Sandhoff, R., Hepbildikler, S.T., Jennemann, R., Geyer, R., Gieselmann, V., Proia, R.L.,Wiegandt, H. and Grone, H.J., Kidney sulfatides in mouse models of inherited glycosphin-golipid disorders: determination by nano-electrospray ionization tandem mass spectrometry.J. Biol. Chem., 277, 20386–20398 (2002).

Analysis of complex lipidomes 249
144. Su, X., Han, X., Mancuso, D.J., Abendschein, D.R. and Gross, R.W., Accumulation of long-chain acylcarnitine and 3-hydroxy acylcarnitine molecular species in diabetic myocardium:identification of alterations in mitochondrial fatty acid processing in diabetic myocardium byshotgun lipidomics. Biochemistry, 44, 5234–5245 (2005).
145. Kemp, S., Valianpour, F., Mooyer, P.A., Kulik, W. and Wanders, R.J., Method for measurementof peroxisomal very-long-chain fatty acid beta-oxidation in human skin fibroblasts using stable-isotope-labeled tetracosanoic acid. Clin. Chem., 50, 1824–1826 (2004).
146. Bernhard, W., Pynn, C.J., Jaworski, A., Rau, G.A., Hohlfeld, J.M., Freihorst, J., Poets, C.F.,Stoll, D. and Postle, A.D., Mass spectrometric analysis of surfactant metabolism in human vol-unteers using deuterated choline. Am. J. Respir. Crit. Care Med., 170, 54–58 (2004).
147. Dolnikowski, G.G., Marsh, J.B., Das, S.K. and Welty, F.K., Stable isotopes in obesity research.Mass Spectrom. Rev., 24, 311–327 (2005).
148. Han, X., Cheng, H., Mancuso, D.J. and Gross, R.W., Caloric restriction results in phospholipiddepletion, membrane remodeling, and triacylglycerol accumulation in murine myocardium.Biochemistry, 43, 15584–15594 (2004).
149. Yli-Jokipii, K.M., Schwab, U.S., Tahvonen, R.L., Kurvinen, J.P., Mykkanen, H.M. and Kallio,H.P., Triacylglycerol molecular weight and to a lesser extent, fatty acid positional distribution,affect chylomicron triacylglycerol composition in women. J. Nutr., 132, 924–929 (2002).
150. Hillard, C.J., Lipids and drugs of abuse. Life Sci., 77, 1531–1542 (2005).

This page intentionally left blank

Part IVSelected Medical Applications

This page intentionally left blank

Medical Applications of Mass SpectrometryK. Vékey, A. Telekes and A. Vertes (editors)© 2008 Elsevier B.V. All rights reserved
253
Chapter 12
Medical laboratory practice—possibilitiesfor mass spectrometry
OLAF BODAMER*
Division of Biochemical and Paediatric Genetics, University Children’s Hospital, Vienna, Austria
1. Introduction 2532. Quality management 2543. Inborn errors of metabolism 254
3.1. Analysis of homocysteine 2553.2. Analysis of organic acids including orotic acid 2573.3. Analysis of oligosaccharides 2573.4. Analysis of lysosomal enzyme activities 258
4. Assessment of in vivo metabolism using stable isotope techniques 2585. Conclusions 259References 259
1. Introduction
Diagnosis of disorders that demonstrate (bio)chemical abnormalities frequentlyrequires (semi-)quantitative analysis of small molecules, metabolites, peptides,proteins, or hormones in plasma, urine, or other body fluids [1–3]. Biomarkersmay also be used to judge efficacy of treatment [1]. Modern medical laboratoriesemploy, depending on their analytical repertoire, an array of analytical techniquesincluding gas chromatography–mass spectrometry (GC–MS), high pressure liquidchromatography–mass spectrometry (HPLC–MS), liquid chromatography–massspectrometry (LC–MS), or electrospray tandem mass spectrometry (ESI–MS�MS).In this context MS is typically used for the analysis of small molecules for thediagnosis of inborn errors of metabolism (IEM), endocrine disorders, in
*Tel.: �43-140-400 3232; Fax: �43-1406-3484. E-mail: [email protected](O. Bodamer).

254 O. Bodamer
toxicology and pharmacology. In addition, ESI–MS�MS is used for neonatalscreening of IEM [4–6, see relevant chapter for more detailed information] andtogether with GC–MS is used for analyzing isotopic enrichment in samplesfrom in vivo studies employing stable isotope tracer [7, and below]. Additionalanalytical techniques that are frequently used in a medical laboratory includechromatography (LC, HPLC), enzyme-linked immunosorbent assay (ELISA),radio-immuno assay (RIA), and enzymatic and molecular techniques (PCR,sequencing).
2. Quality management
A well-organized medical laboratory should adapt quality standards not only forthe analytical process itself but also for pre- and post-analytical processes [8,9].Ideally, a quality management system according to International Organization forStandardization (ISO) should be implemented [9]. System requirements includedefinition of laboratory functions and responsibilities (i.e., laboratory manager,technician, secretary), standardization of analytical and operational procedures(SOP) and processes, and definition of quality policy and aims [9]. Particularemphasis should be placed on continued improvement using a system of regularreviews and internal and external audits [9]. Implementation of quality manage-ment systems is frequently required for laboratory certification and accreditationwith health care organizations.
Core processes that are unique to the laboratory have to be identified and doc-umented preferably using flowcharts (Fig. 1). This stepwise approach allows char-acterization of each single step, for example, in sample analysis in laboratories(shipment of samples, pre-analytical processing, analysis and post-analytical pro-cessing, reporting of results), determination of responsibilities, and documentationof analysis-specific SOP’s. All documents are summarized in identical copiesof the Quality Handbook that serve as important source of information for thelaboratory staff (Fig. 1).
3. Inborn errors of metabolism
IEM are individually rare but may be collectively as frequent as 1 affected indi-vidual in 500 newborn infants. They encompass many different single-genedisorders affecting many aspects of cellular metabolism [10]. A significantportion relates to disorders of fatty acid, protein, and carbohydrate metabolism[10]. Analysis of IEM relies on semiquantitative or quantitative measurement ofcharacteristic small molecules in different body fluids including blood, plasma,cerebral spinal fluid, and urine [11,12]. Diagnosis must then be typically

Medical laboratory practice—possibilities for mass spectrometry 255
confirmed using enzyme analysis in appropriate tissues and by genotyping. Someselected applications of MS for IEM are listed in Table 1. The complexity of aselected pathway is shown in Fig. 2 using the methionine–homocysteine cycle asexample.
3.1. Analysis of homocysteine
Homocysteine is markedly elevated in different inborn errors of homocysteinemetabolism such as cystathionine �-synthase, methionine synthase deficiencies,
Fig. 1. Structure of a quality management system at the Division of Biochemical Genetics at theUniversity Children’s Hospital, Vienna. SOP: standard operation procedure; PD: process description;QHB: Quality Handbook.
QHB
PDClinical
Services
PDNNewborn Screening
PDTraining PD
Research
PDLaboratory
Services
PDInternalAudits
PDManagem.
PDCorrective Procedures
SOP
SOP
SOP
SOP
SOP
SOP
SOP
SOP

256 O. Bodamer
Table 1
Selected applications of mass spectrometry in IEM
Analyte(s) Disorder(s) Material Method References
Oligosaccharides Glycoproteinosesa Urine LC–MS�MS [17]Ceramides, LSDb Urine LC–MS�MS [23] glycosylceramidesAcylcarnitine ester Fatty acid oxidation Dried blood ESI–MS�MS [11]
defects, organic plasma acidopathies
Amino acids Amino acidopathies Dried blood ESI–MS�MS [12](PKU, tyrosinemia plasma, urinetype I)
Guanidinoacetate GAMT deficiencyc Dried blood ESI–MS�MS [24]plasma, urine
Homocysteine Homocystinuria Dried blood ESI–MS�MS [13]plasma
Cholesterol and SLOd and other Plasma GC–MS, [25]metabolites defects of LC–MS�MS
cholesterol biosynthesis
Bile acid Disorders of bile Plasma, GC–MS, [26]intermediates acid biosynthesis, urine LC–MS�MS
peroxisomaldisorders
ESI–MS/MS: electrospray tandem mass spectrometry; GC–MS: gas chromatography–mass spec-trometry; LC–MS/MS: liquid chromatography–tandem mass spectrometry.a GM1 gangliosidosis, GM2 gangliosidosis, sialic acid storage disorder, sialidase/neuraminidase defi-ciency, galactosialidosis, I-cell disease, fucosidosis, and Pompe and Gaucher diseases.
b Lysosomal storage disorder including Gaucher, Fabry, Niemann–Pick A/B, Krabbe, and Pompediseases.
c Guanidinoacetate methyltransferase deficiency.d Smith–Lemli Opitz syndrome (defect of cholesterol biosynthesis).
and disorders of vitamin B12 metabolism affecting the conversion of Cbl-I to Cbl-II(Fig. 2). Although betaine-homocysteine methyltransferase deficiency in mice isknown to cause hyperhomocysteinemia, this defect has not been reported inhumans. In contrast, S-adenosyl homocysteine hydrolase deficiency may actuallylead to low homocysteine levels. All compounds in this pathway can be analyzedalthough only few have clinical significance (homocysteine, methionine, arginine,ornithine, glycine, guanidinoacetate). Among the latter homocysteine may serveas an important biomarker to evaluate treatment efficacy and future risk for prematureartherosclerosis. Analysis of homocysteine is readily made by LC–MS�MS orESI–MS�MS [13]. This approach allows fast sample turnover and consequentlyscreening of at-risk populations.

Medical laboratory practice—possibilities for mass spectrometry 257
3.2. Analysis of organic acids including orotic acid
Organic acidemias, also known as organic acidurias, are a group of disorders char-acterized by increased excretion of organic acids in urine. They result primarily fromdeficiencies of specific enzymes in the breakdown pathways of amino acids or fromenzyme deficiencies in �-oxidation of fatty acids or carbohydrate metabolism.Organic acidemias can be classified into five categories including branched-chainorganic acidemias, multiple carboxylase deficiency, including holocarboxylasesynthetase deficiency and biotinidase deficiency, glutaric aciduria type I and relatedorganic acidemias, fatty acid oxidation defects, and disorders of energy metabolism.For example, the diagnosis of methylmalonic aciduria (MMA) is made by measure-ment of organic acids in the urine using GC–MS. In MMA large amounts of methyl-malonic acid, as well as methylcitrate, propionic acid, and 3-OH propionic acid, arepresent [14,15].
3.3. Analysis of oligosaccharides
The application of ESI–MS/MS allows the identification and quantification of indi-vidual oligosaccharides for the diagnosis of glycoproteinoses (oligosaccharidurias)
Fig. 2. Methionine–homocysteine metabolism as an example for the complexity of intermediarymetabolism. Most metabolites in the depicted pathways can be quantified by either GC–MS orESI–MS/MS (AGAT: arginine–guanidinoacetate amidinotransferase; GAMT: guanidionacetatemethyltransferase).
Methionine
Diet
Diet
Protein breakdown/ synthesis
S-Adenosylmethionine
Homocysteine
Methionine synthase
Methionine Adenosyltransferase
Cystathionine
Cystathionine ß-synthase
Cysteine
-Cystathionase
Sulfate
S-Adenosyl homocysteine
S-Adenosyl homocysteine hydrolase
Guanidino- acetate
Creatine
Creatinine
Non-enzymatic
GAMT
-
Glycine
AGAT
Arginine
Ornithine
THF
5-Methyl THF
Betaine Choline
betaine-homocysteine methyltransferase
Dimethylglycine
Cbl-I
Cbl-II
-

258 O. Bodamer
such as GM1 gangliosidosis, GM2 gangliosidosis, sialic acid storage disorder, sialidase/neuraminidase deficiency, galactosialidosis, I-cell disease, fucosidosis, and Pompeand Gaucher diseases [16]. Recent work demonstrated the feasibility of thisapproach using 1-phenyl-3-methyl-5-pyrazolone derivatization and MS/MS precur-sor scan of m/z 175 in positive ion mode [17]. This method has been adapted to high-throughput use allowing the application to management follow-up and eventuallynewborn screening for this group of disorders [17].
3.4. Analysis of lysosomal enzyme activities
Similarly, a direct multiplex assay of lysosomal enzymes in dried blood spots hasbeen developed for newborn screening [18]. This approach is based on the incuba-tion of dried blood spots at 37�C overnight with the appropriate substrates and sta-ble isotopically labeled internal standards. If the enzyme was fully active, substratewas converted completely to the corresponding product which was quantified basedon its relationship to the known concentration of the internal standard. Importantly,samples without dried blood spots (“blank”) have to be used to adjust for back-ground noise. Corresponding enzyme activities were calculated based on theassumption that 10 �l of extraction solution contained 0.98 �l of blood [18].
4. Assessment of in vivo metabolism using stable isotope techniques
Stable isotopes are non-radioactive atoms of the same chemical element, which dif-fer only in their number of neutrons [19]. Many elements also have radioactive(non-stable) isotopes. The most commonly used stable isotopes in studies ofmacronutrient metabolism are 2H (D or deuterium), 13C, 15N, and 18O, while 25Mg,26Mg, 42Ca, 46Ca, 48Ca, 57Fe, 58Fe, 67Zn, and 70Zn are the most commonly used sta-ble isotopes for studies of mineral metabolism. The most commonly used radio-active isotopes are 14C and 3H (tritium) [19]. More than 6000 stable isotope-labeledcompounds (tracers) are commercially available for use in metabolic studies.Examples for some of these tracers are [1-13C] leucine, [1-13C, 15N] leucine, [ring-2H5] phenylalanine, and [6,6]-D2 glucose. It is currently accepted that these com-pounds have negligible biological side-effects, which renders them ethicallyacceptable for use in children [20].
Following intravascular or oral application, the tracer is metabolically indistin-guishable from the equivalent unlabeled compound of interest (tracee). The meta-bolic fate of the compound can be assessed qualitatively and quantitatively bymeasuring the relative abundance of tracer and tracee and/or their respective break-down products with time. The detectable mass difference of tracer and traceeallows the analysis of compounds extracted from plasma by either GC–MS orLC–MS [21]. Both require nanogram or picogram sample size (analytical range is0.1–100 mol%, precision 0.2%). The detection limit is considerably less than

Medical laboratory practice—possibilities for mass spectrometry 259
0.1 mol%, when tracers with multiple stable isotope labels (for example, ring-D5
phenylalanine) are used [22]. Stable isotopes in breath (i.e., 12CO2 and 13CO2) areanalyzed using an isotope-ratio mass spectrometer (IRMS, microgram sample size,analytical range 0.001–10 atom% excess, precision 0.00005 atom% (5 ppm))[19]. Combustion-IRMS essentially has the same analytical capabilities as IRMSbut allows the combustion of tissue samples with subsequent analysis of gaseousisotope enrichment [19]. Stable isotopes of minerals are typically analyzed by ther-mal ionization mass spectrometry (TIMS) or inductively coupled plasma massspectrometry (ICP-MS) with high precision and sensitivity [19].
The advantages of stable isotope-labeled compounds compared with theirradioactive counterparts are manifold. Most importantly, several different stableisotope tracers can be safely administered simultaneously to the same subjectwithout limiting future studies. The plasma volume which is needed for one studyto analyze isotope enrichment is small, allowing even pre-term infants to be stud-ied. On average 0.5 ml of plasma is needed for one study. The intramolecular loca-tion of one or more label(s) is determined easily, which allows the assessment ofmetabolic pathways [19].
Stable isotopes are ideal “tools” for the dynamic assessment of in vivo metabolismin the pediatric population. Not only are these tracers safe and therefore ethically jus-tifiable, in addition these “tools” may be particularly important for the validation ofnew treatment modalities, such as novel drug treatment or gene therapy. Many moreexciting studies are currently under way to enhance our knowledge of pediatricmetabolism and (patho-)physiology, an important factor for the continued reductionof pediatric morbidity and mortality [7].
5. Conclusions
MS is an essential analytical technique in the medical laboratory that provides aunique array of diagnostic opportunities. However, for many applications MS has tobe combined with pre-analytical chromatography to allow optimal separation ofmetabolites and requires an in-depth knowledge of basic chemistry. Day-to-day oper-ation should therefore be the responsibility of a dedicated chemist that works in closecollaboration with laboratory physician and clinicians in a multidisciplinary team.
References
Selected Web sites:
www.cdc.gov: Centers of Disease Control, Atlanta, USA;www.erndimqa.nl: Quantitative External Quality Assessment Schemes European ResearchNetwork;www.eurogentest.org: EuroGenTest—Genetic Testing in Europe;www.orpha.net: OrphaNet—rare disease database.

260 O. Bodamer
1. Leeming, D.J., Alexandersen, P., Karsdal, M.A., Qvist, P., Schaller, S. and Tanko, L.B., Anupdate on biomarkers of bone turnover and their utility in biomedical research and clinicalpractice. Eur. J. Clin. Pharmacol, 62, (August) 781–792 (2006).
2. Trof, R.J., Di Maggio, F., Leemreis, J. and Groeneveld, A.B., Biomarkers of acute renal injuryand renal failure. Shock, 26, 245–253 (2006).
3. Yuan, G., Wang, J. and Hegele, R.A., Heterozygous familial hypercholesterolemia: an under-recognized cause of early cardiovascular disease. CMAJ, 174, 1124–1229 (2006).
4. Marsden, D., Larson, C. and Levy, H.L., Newborn screening for metabolic disorders.J. Pediatr., 148, 577–584 (2006).
5. Schulze, A., Lindner, M., Kohlmüller, D., Olgemöller, K., Mayatepek, E. and Hoffmann, G.F.,Expanded newborn screening for inborn errors of metabolism by electrospray ionization–tandem mass spectrometry: results, outcome, and implications. Pediatrics, 111, 1399–1406(2003).
6. Wilcken, B., Wiley, V., Hammond, J. and Carpenter, K., Screening newborns for inborn errorsof metabolism by tandem mass spectrometry. N Engl. J. Med., 348, 2304–2312 (2003).
7. Bodamer, O.A. and Halliday, D., Uses of stable isotopes in clinical diagnosis and research inthe pediatric population. Arch. Dis. Child., 84, 444–448 (2001).
8. Plebani, M., Errors in clinical laboratories or errors in laboratory medicine? Clin. Chem. Lab.Med., 44, 750–759 (2006).
9. Burnett, D., ISO 15189:2003—quality management, evaluation and continual improvement.Clin. Chem. Lab. Med., 44, 733–739 (2006).
10. Childs, B., Valle, D. and Jiminez-Sanchez, G., The inborn error and biochemical individuality.In: Scriver, C., Beaudet, A., Valle, D. and Sly, W.S. (Eds.), The Metabolic and Molecular Basesof Inherited Disease (8th edition). McGraw-Hill, New York. 2001, p. 155 (Chapter 3).
11. Bodamer, O.A. and Mühl, A., Analysis of acylcarnitine ester for the diagnosis of inborn errorsof metabolism using tandem mass-spectrometry. Chem. Month., 136, 1293–1297 (2005).
12. Roschinger, W., Olgemoller, B., Fingerhut, R., Liebl, B. and Roscher, A.A., Advances in ana-lytical mass spectrometry to improve screening for inherited metabolic diseases. Eur.J. Pediatr., 162, S67–S76 (2003).
13. Tuschl, K., Bodamer, O.A., Erwa, W. and Muhl, A., Novel method for rapid analysis of totalplasma homocysteine by tandem mass spectrometry. Clin. Chim. Acta, 351, 139–141 (2005).
14. Fenton, W.A., Gravel, R.A. and Rosenblatt, D.S., Disorders of propionate and methylmalonatemetabolism. In: Scriver, C.R., Beaudet, A.L., Sly, W.S. and Valle, D. (Eds.), The Metabolicand Molecular Bases of Inherited Disease (8th edition). McGraw-Hill, New York, 2001,p. 2165.
15. Deodato, F., Boenzi, S., Santorelli, F.M. and Dionisi-Vici, C., Methylmalonic and propionicaciduria. Am. J. Med. Genet. C Semin. Med. Genet., 142, 104–112 (2006).
16. Young, S.P., Stevens, R.D., An, Y., Chen, Y.T. and Millington, D.S., Analysis of a glucosetetrasaccharide elevated in Pompe disease by stable isotope dilution-electrospray ionizationtandem mass spectrometry. Anal. Biochem., 316, 175–180 (2003).
17. Ramsay, S.L., Meikle, P.J., Hopwood, J.J. and Clements, P.R., Profiling oligo-sacchariduriasby electrospray tandem mass spectrometry: quantifying reducing oligosaccharides. Anal.Biochem., 345, 30–46 (2005).
18. Li, Y., Scott, C.R., Chamoles, N.A., Pinto, B.M., Turecek, F. and Gelb, M.H., Direct multiplexassay of lysosomal enzymes in dried blood spots for newborn screening. Clin. Chem., 50,1785–1796 (2004).
19. Wolfe, R.R., Basic characteristics of isotopic tracers. In: Wolfe, R.R. (Ed.), Radioactive andStable Isotope Tracers in Biomedicine. Principles and Practice of Kinetic Analysis. Wiley-Liss, New York, 1992, pp. 1–17.

Medical laboratory practice—possibilities for mass spectrometry 261
20. Jones, P.J.H. and Leatherdale, S.T., Stable isotope in clinical research: safety reaffirmed. Clin.Sci., 80, 277–280 (1991).
21. Patterson, B.W., Zhao, G. and Klein, S., Improved accuracy and precision of gas chromatograph/mass spectrometry measurements for metabolic tracers. Metabolism, 47, 706–712 (1998).
22. Bier, D., Stable isotopes in biosciences, their measurement and models for amino acid metab-olism. Eur. J. Pediatr., 156(Suppl. 1), S2–S8 (1997).
23. Fauler, G., Rechberger, G.N., Devrnja, D., Erwa, W., Plecko, B., Kotanko, P., Breunig, F. andPaschke, E., Rapid determination of urinary globotriaosylceramide isoform profiles by elec-trospray ionization mass spectrometry using stearoyl-d35-globotriaosylceramide as internalstandard. Rapid Commun. Mass Spectrom., 19, 1499–1506 (2005).
24. Bodamer, O.A., Bloesch, S.M., Gregg, A., Stockler-Ipsiroglu, S. and O’Brien, W.E., Analysisof guanidinoacetate and creatine by isotope dilution electrospray tandem mass-spectrometry.Clin. Chim. Acta, 308, 173–178 (2001).
25. Moebius, F.F., Fitzky, B.U. and Glossmann, H., Genetic defects in postsqualene cholesterolbiosynthesis. Trends Endocrinol. Metab., 11, 106–114 (2000).
26. Johnson, D.W., ten Brink, H.J., Schuit, C. and Jakobs, C., Rapid and quantitative analysis ofunconjugated C(27) bile acids in plasma and blood samples by tandem mass spectrometry.J Lipid Res., 42, 9–16 (2001).

This page intentionally left blank

Medical Applications of Mass SpectrometryK. Vékey, A. Telekes and A. Vertes (editors)© 2008 Elsevier B.V. All rights reserved
263
Chapter 13
Therapeutic drug monitoring andmeasurement of drug concentrationsusing mass spectrometry
ANDRÁS TELEKESa,*, MÁRTA HEGEDUSa,1, and ISTVÁN KISSb,2
aNational Institute of Oncology, Budapest, HungarybSt. Imre Government Teaching Hospital, Budapest, Hungary
1. Introduction 2632. Antiinfection drugs 2673. Drugs acting on the central nervous system (CNS) 2714. Cardiovascular drugs 2735. Anticancer agents 2766. Analgesics 2807. Miscellaneous drug classes 283References 285
1. Introduction
Measurement of drug concentration is an inherent part of preclinical and clinicalinvestigation of new therapeutic agents since no pharmacokinetic studies can becarried out without it. It is also necessary for investigating drug–effect or drug–toxicity relationship. Moreover, measurement of drug concentrations may help inunderstanding the mechanism of action as well. Most drugs in clinical use havewell-defined pharmacodynamic profiles, i.e., there is a direct relationship betweenserum concentration and pharmacological response. These aspects are well knownand are widely used in drug development.
*Corresponding author. Tel.: �36-204-119080; Fax: �36-139-52835.E-mail: [email protected] (A. Telekes).1E-mail: [email protected] (M. Hegedus).2E-mail: [email protected] (I. Kiss).

264 A. Telekes et al.
To exert any biological/ therapeutic efficacy, molecules should reach appropriateconcentration at the target organ(s). Thus, they should travel from their applicationsite to their receptors, which involves absorption through the skin or from the gas-trointestinal system and distribution via the vascular system and passing throughbiological membranes. The journey of a drug continues even after it express itseffect, as it must still leave the body. Moreover, during their movement drugs aremetabolized. Pharmacokinetics is what the organism does to the drug; pharmaco-dynamics is what the drug does to the body. Thus, pharmacokinetics deals withthe principles of absorption, distribution, metabolism, and elimination of drugs.Pharmacodynamics deals with the mechanism of action and biological activity ofdrugs and drug-induced clinical outcomes. Pharmacodynamics and pharmacoki-netics applied in clinical settings, including patients or healthy volunteers, arecalled clinical pharmacology, which attempts to explain and predict the reasons ofvariability of drug action. Clinical pharmacological investigation of a drug cannotbe carried out without measuring drug concentrations in different compartments ofthe body (e.g., blood, urine, feces, saliva, mother’s milk, etc.). Measuring interpa-tient variability in drug kinetics can lead to implementation of strategies to decreasevariability and thus achieve more consistent clinical outcomes.
Proper dosing of drugs is complicated by various factors. One of the mainsources of interpatient pharmacokinetic variability is that different persons couldmetabolize a particular drug differently. Note, some drugs have high variability,which is due to not only several factors such as altered absorption, genetic poly-morphism, pharmacological interactions, poor aqueous solubility but also a highmetabolism mediated by the CYP450 system or presystemic first-pass effect withthe involvement of transporters, such as P-glycoprotein.
Therapeutic drug monitoring (TDM) is the measurement of drug concentration,usually in plasma or in serum, for individual patients, to help develop and controlproper dosage. It is usually expensive and complicated, so used only in a smallfraction of clinical treatments. Most significant indications of TDM are shown inTable 1. TDM is often performed by chromatographic analysis (HPLC), but massspectrometry (MS) is increasingly used and is becoming the prime analytical tool inthis field. It may be used either alone (usually tandem mass spectrometry, MS–MS)or in combination with chromatography (HPLC–MS). The use of MS is becomingwidespread, as it has much higher sensitivity than conventional HPLC and typic-ally requires simpler sample preparation. Moreover, MS technique provides thepossibility of simultaneous measurement of parent compounds and metabolites.
The therapeutic and toxic blood concentrations of several hundred drugs andxenobiotics have recently been published [1]. This may help in determining criti-cal cases of narrow therapeutic index. The rationale of TDM was proven first forphenytoin treatment of epileptic patients. In other words, it was shown that theside effects were reduced and the seizure control was improved if instead of apply-ing standard doses (based on the body weight of the patients) the dosages were
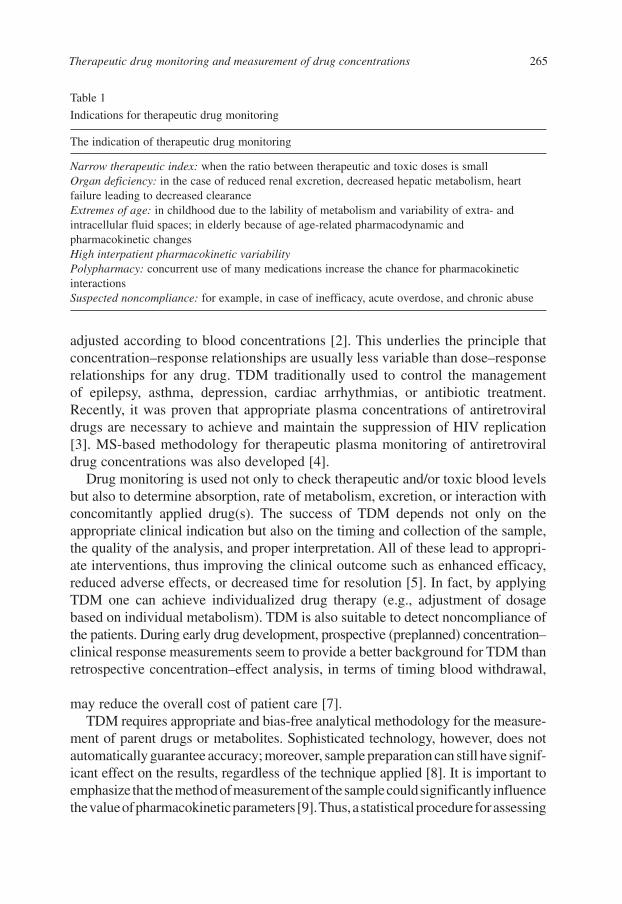
Therapeutic drug monitoring and measurement of drug concentrations 265
Table 1
Indications for therapeutic drug monitoring
The indication of therapeutic drug monitoring
Narrow therapeutic index: when the ratio between therapeutic and toxic doses is smallOrgan deficiency: in the case of reduced renal excretion, decreased hepatic metabolism, heartfailure leading to decreased clearanceExtremes of age: in childhood due to the lability of metabolism and variability of extra- andintracellular fluid spaces; in elderly because of age-related pharmacodynamic and pharmacokinetic changesHigh interpatient pharmacokinetic variabilityPolypharmacy: concurrent use of many medications increase the chance for pharmacokineticinteractionsSuspected noncompliance: for example, in case of inefficacy, acute overdose, and chronic abuse
adjusted according to blood concentrations [2]. This underlies the principle thatconcentration–response relationships are usually less variable than dose–responserelationships for any drug. TDM traditionally used to control the managementof epilepsy, asthma, depression, cardiac arrhythmias, or antibiotic treatment.Recently, it was proven that appropriate plasma concentrations of antiretroviraldrugs are necessary to achieve and maintain the suppression of HIV replication[3]. MS-based methodology for therapeutic plasma monitoring of antiretroviraldrug concentrations was also developed [4].
Drug monitoring is used not only to check therapeutic and/or toxic blood levelsbut also to determine absorption, rate of metabolism, excretion, or interaction withconcomitantly applied drug(s). The success of TDM depends not only on theappropriate clinical indication but also on the timing and collection of the sample,the quality of the analysis, and proper interpretation. All of these lead to appropri-ate interventions, thus improving the clinical outcome such as enhanced efficacy,reduced adverse effects, or decreased time for resolution [5]. In fact, by applyingTDM one can achieve individualized drug therapy (e.g., adjustment of dosagebased on individual metabolism). TDM is also suitable to detect noncompliance ofthe patients. During early drug development, prospective (preplanned) concentration–clinical response measurements seem to provide a better background for TDM thanretrospective concentration–effect analysis, in terms of timing blood withdrawal,or using other compartments for sampling (e.g., urine) [6]. Moreover, proper TDMmay reduce the overall cost of patient care [7].
TDM requires appropriate and bias-free analytical methodology for the measure-ment of parent drugs or metabolites. Sophisticated technology, however, does notautomatically guarantee accuracy; moreover, sample preparation can still have signif-icant effect on the results, regardless of the technique applied [8]. It is important toemphasize that themethodofmeasurementof thesamplecouldsignificantly influencethevalueofpharmacokineticparameters[9].Thus,astatisticalprocedureforassessing

266 A. Telekes et al.
concordance between two methods of clinical measurement (e.g., compare the resultsof different techniques and sample preparation used) has been developed [10].
For reasons discussed above, measurement of drug concentrations and/ormonitoring of prescribed and nonprescribed drug use provide a useful tool for opti-mally managing patients. In the following text, clinical applications of MS-baseddrug monitoring and kinetic measurements are discussed. These partly illustrate therange of MS applications in daily clinical practice, as well as provide some exam-ples for clinicians about the sensitivity of MS when measuring drug concentrations.Note that data obtained from kinetic studies as well as the methodology itself mightbe used for reasoning and applying TDM. In fact, drug prescriptions contain infor-mation about the necessity of TDM if pharmacokinetic or pharmacodynamic dataprovide indications to do so.
In this chapter, various applications of measuring drug concentrations in a clin-ical environment are discussed, where MS is the prime analytical tool. Mostexamples relate to recently introduced drugs. Some are clearly TDM, some areclinical applications that may be used for TDM in the future, while some othersare selected applications illustrating the range in which MS is used for measuring
Actinomycin-D, amitriptyline,amoxapine, amprenavir,apomorphine atazanavir,citalopram, clomipramine,desipramine, dothiepin,doxepin, efavirenz, fluoxetine,imipramine, indinavir,lopinavir, maprotiline,meropenem, mianserin,nelfinavir, nevirapine,norfluoxetine, nortriptyline,pergolide, paroxetine,procarbazine, ritonavir,sertraline, saquinavir,trimipramine, vincristine,zidovudine
Adefovir, amlodipine,busulfan, cefaclor, cefdinir,cefixime, citalopram,cyclosporine, fenofibric acid,hydrocodone, hydromorphone,lonafarnib, nalmefene,rosuvastatin voriconazole
Ajulemic acid, aliskiren,amantadine, azacitidine,carbovir, carvedilol, dextran,diclofenac, isosorbide,lamivudine, 2�-fluoro-5-methyl-beta-L-arabinofuranosyluracil, flunixin,fulvestrant, gefitinib,ibuprofen, imatinib,indomethacin, ketoprofen,lumiracoxib, madol,mefenamic acid,metronidazole, midazolam,naproxen, oritavancin,oxyphenbutazone,phenazopyridine,phenylbutazone, piroxicam,pravastatin, salicylic acid,spiramycin, synthetic insulins,tenofovir, tolmetin,trimetazidine vitamins B5,D, and K
Table 2
Alphabetical list of drugs discussed in the present chapter
Drugs studied Potential candidates Selected studies of drugby TDM for TDM concentration measurements

Therapeutic drug monitoring and measurement of drug concentrations 267
drug levels in clinical samples. The drugs discussed are listed in alphabetical orderin Table 2, while a more detailed discussion is presented in the subsequent sec-tions, where drugs are classified according to their applications.
Modern analytical techniques, and especially those based on chromatographyand MS, make it possible to monitor drug concentrations accurately, fast, using onlya very small amount of biological sample, and in high throughput. These advancesmade TDM possible, which can significantly improve therapy and prevent toxicity.This trend is likely to continue; more and more drugs will be monitored routinelyin everyday clinical practice.
2. Antiinfection drugs
Antibacterial agents can be used empirically, either knowing the pathogen or as aprophylactic treatment. Duration of the treatment can be short (e.g., less than 24 has perioperative prophylaxis) or could take several months (e.g., in the case ofendocarditis or tuberculosis). Since there are several similarly effective antibioticsagainst many pathogens, selection of the treatment depends on various factors, suchas pharmacokinetics, side effects, resistance profile, and cost of the drug. For mostantimicrobial drugs, TDM is not necessary. In case of drugs associated with toxic-ity (e.g., nephrotoxicity, ototoxicity), usually there is a relationship establishedbetween drug concentration and severity of adverse events. TDM is used not onlyto prevent toxicity but also to guide patient-tailored dosing regimens and to assesstissue penetration [11]. Several such applications are summarized in Table 3.
Fungal infections are usually local (such as skin, nails, mouth cavity, urogenitaltract), but systemic, life-threatening infections may also occur. Several antifungal
Table 3
Applications of MS in the measurement of drugs used against infections
Ref. Drug Comment
[13] Cefdinir An LC–MS–MS method to measure cefdinir in humanplasma. Linear calibration curve in the concentration range5–2000 ng/ml, quantification limit is 5 ng/ml. Intra- andinterday standard deviations: �4.3%. Accuracy over thewhole concentration range vary between 97 and 107%.Test time: �3 min. Suitable for pharmacokinetic testing.
[14] Cefixime An LC–MS–MS method to determine cefixime in humanplasma. Linear calibration curve was found between 0.05and 8.0 �g/ml. Quantitative measurements were possibledown to 0.05 �g/ml. Intra- and interday standard deviationsare �12.7%. Accuracy is better than 2% (relative error) forthe whole linear calibration range. Test time: 3.2 min. Themethod was successfully used in pharmacokinetic tests.
(continues)
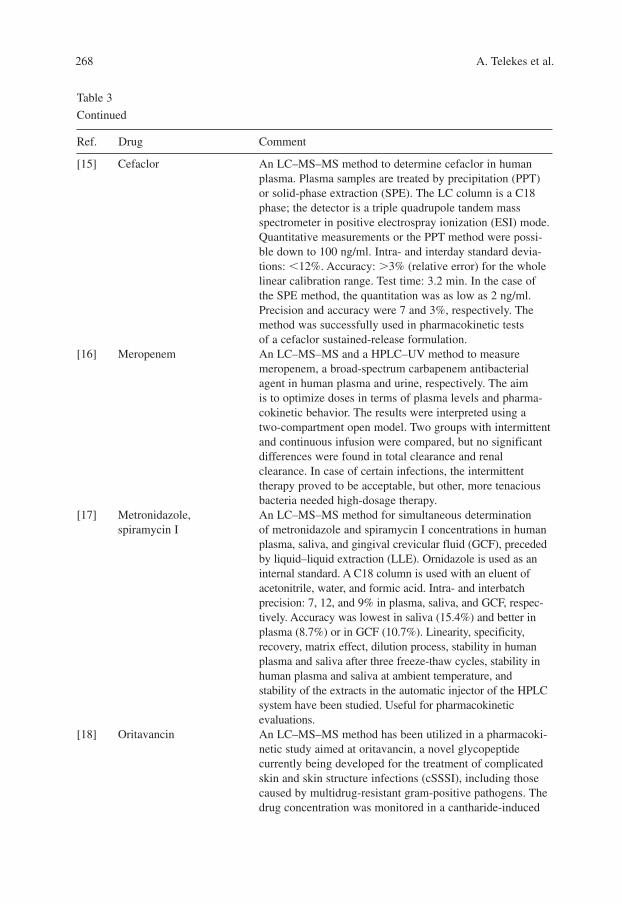
268 A. Telekes et al.
[15] Cefaclor An LC–MS–MS method to determine cefaclor in humanplasma. Plasma samples are treated by precipitation (PPT)or solid-phase extraction (SPE). The LC column is a C18phase; the detector is a triple quadrupole tandem mass spectrometer in positive electrospray ionization (ESI) mode.Quantitative measurements or the PPT method were possi-ble down to 100 ng/ml. Intra- and interday standard devia-tions: �12%. Accuracy: �3% (relative error) for the wholelinear calibration range. Test time: 3.2 min. In the case ofthe SPE method, the quantitation was as low as 2 ng/ml.Precision and accuracy were 7 and 3%, respectively. Themethod was successfully used in pharmacokinetic testsof a cefaclor sustained-release formulation.
[16] Meropenem An LC–MS–MS and a HPLC–UV method to measuremeropenem, a broad-spectrum carbapenem antibacterialagent in human plasma and urine, respectively. The aimis to optimize doses in terms of plasma levels and pharma-cokinetic behavior. The results were interpreted using atwo-compartment open model. Two groups with intermittentand continuous infusion were compared, but no significantdifferences were found in total clearance and renalclearance. In case of certain infections, the intermittenttherapy proved to be acceptable, but other, more tenaciousbacteria needed high-dosage therapy.
[17] Metronidazole, An LC–MS–MS method for simultaneous determinationspiramycin I of metronidazole and spiramycin I concentrations in human
plasma, saliva, and gingival crevicular fluid (GCF), precededby liquid–liquid extraction (LLE). Ornidazole is used as aninternal standard. A C18 column is used with an eluent ofacetonitrile, water, and formic acid. Intra- and interbatchprecision: 7, 12, and 9% in plasma, saliva, and GCF, respec-tively. Accuracy was lowest in saliva (15.4%) and better inplasma (8.7%) or in GCF (10.7%). Linearity, specificity,recovery, matrix effect, dilution process, stability in humanplasma and saliva after three freeze-thaw cycles, stability inhuman plasma and saliva at ambient temperature, and stability of the extracts in the automatic injector of the HPLCsystem have been studied. Useful for pharmacokineticevaluations.
[18] Oritavancin An LC–MS–MS method has been utilized in a pharmacoki-netic study aimed at oritavancin, a novel glycopeptide currently being developed for the treatment of complicatedskin and skin structure infections (cSSSI), including thosecaused by multidrug-resistant gram-positive pathogens. Thedrug concentration was monitored in a cantharide-induced
Table 3
Continued
Ref. Drug Comment

Therapeutic drug monitoring and measurement of drug concentrations 269
blister fluid model. Although the oritavancin level in theblister fluid was much (8–11 times) lower than in theplasma, it was still high enough to inhibit the proliferationof 90% of strains of Staphylococcus aureus, so it has atherapeutic potential.
[19] Voriconazole An LC–LC–MS–MS method for fully automated and directanalysis of voriconazole (a novel broad-spectrum antifungalagent) in raw human serum. The raw serum sample is firstfractionated using a size-selective extraction column,followed by LC (C18 column) and ESI–MS–MS detection.Using parallel extraction and chromatographic separation,analysis time is 13 min. Lower quantification limit:0.05 �g/ml. Eliminates the need for complicated samplepretreatment, and requires only 5 �l serum.
[20] Protease inhibitor A novel XLC–MS–MS (extraction liquid chromatographic �drugs as amprenavir, tandem mass spectrometric) technique for the simultaneous nelfinavir, indinavir, measurement of two samples from diluted human plasma lopinavir, saquinavir, samples for the monitoring of HIV/AIDS patient samples. ritonavir, and atazanavir, Analysis time: 3.3 min; detection limit: 2–70 ng/ml; lower and nonnucleoside limit of quantification: 78–156 ng/ml. Good linearity is reverse transcriptase achieved in a wide concentration range (from the lower limit inhibitors drugs of quantification to 10,000 ng/ml). Intra- and interday nevirapine and precision values: 7.5–13.5% (depending on the efavirenz concentration): accuracy and recovery: 86–113 and 60–110%,
respectively. The method is useful in routine monitoring.[21] Lopinavir An LC–MS method to measure the concentration of
lopinavir (LPV) in cerebrospinal fluid (CSF) samples of HIVpatients. As LPV binds strongly to plasma proteins, it wasnot sure whether the concentration of the drug is enough toinhibit HIV replication. The method developed had a lowerlimit of quantification of 3.7 �g/l. In patients with typicalplasma levels of LPV, the drug is detectable in the CSF atconcentrations that exceed those needed to inhibit HIVreplication. Despite being �98% bound to plasma proteins,LPV penetrates into the central nervous system and maycontribute to the control of HIV in this potential reservoir.
[22] Tenofovir diphosphate, Nucleotide concentrations can be measured directly using carbovir triphosphate, LC–MS in evaluating the intracellular concentrations and lamivudine triphosphate pharmacokinetics of tenofovir diphosphate (TFV-DP),
carbovir triphosphate (CBV-TP), and lamivudine triphos-phate (3TC-TP). An intracellular drug interaction does notexplain the suboptimal viral response in patients treated withthe nucleoside-only regimen of TDF, ABC, and 3TC.
[23] Zidovudine triphosphate An LC–MS–MS method determines molar ZDV directly, (ZDV-TP) corresponding to the intra-hPBMC molar ZDV-TP
Table 3
Continued
Ref. Drug Comment
(continues)

270 A. Telekes et al.
concentration. ZDV-TP concentrations were determined infemtomoles per million hPBMCs (fmol/106 human peripheralblood mononuclear cells). The method is accurate andprecise within the 5–640 fmol/106 cells range with 10 millioncells per sample analyzed. Inter- and intraday accuracy andprecision values fell within 15% of nominal. The assaycorrelates well with previous ELISA results. The methodhas been applied successfully in therapeutic monitoring.
[24] Amantadine An LC–MS–MS method measures directly the concentrationof amantadine (1-adamantylamine, used for treatment ofinfluenza, hepatitis C, parkinsonism, and multiple sclerosis)without protein precipitation, centrifugation, extraction, andderivatization steps. Only 50 �l sample is needed. Internalstandard is 1-(1-adamantyl)pyridinium bromide. The serumsample is diluted by water in a 96-well plate. The chromato-graphic separation is performed using an eluent of isocraticwater/acetonitrile (60/40, v/v) with 5 g/l formic acid on aC8 column. Run time is 3 min. Electrospray atmosphericpressure ionization, positive ion, and selective reactionmonitoring mode were used. Detection limit: 20 mg/l,linearity: 20–5000 mg/l, intraassay/interassay coefficientof variation: �6%/�8%; recovery: 99–101%.
[25] Adefovir An LC–MS–MS method to study the pharmacokineticbehavior of adefovir, an antihepatitis B virus drug. Followingprotein precipitation the sample is analyzed on a C18 column,using a triple-quadrupole tandem mass spectrometer asdetector in the positive electrospray ionization mode andPMPA as the internal standard. The method is linear in theconcentration range 0.25–100 ng/ml, with the lower limit ofquantification 0.25 ng/ml. The intra- and interday relativestandard deviation over the entire concentration range is�5.7%. The accuracy determined at three concentrations iswithin 2.5% relative error. The method was successfullyused in pharmacokinetic studies.
Table 3
Continued
Ref. Drug Comment
drugs have long elimination times; for example, amphotericin B can be detected inthe body even 6 weeks after stopping the treatment [12]. Absorption of oral anti-fungal agents is also variable. Thus, measurement of blood concentration mighthelp to individualize the dose and/or treatment schedule.
The viruses are cell parasites; they use the cell machinery for replication.Targeting the virus-specific enzymes is an attractive option, and may lead tosignificant improvement for the treatment of specific viruses. Since obtainingaccurate viral diagnosis is difficult and time-consuming, the start of a specific

Therapeutic drug monitoring and measurement of drug concentrations 271
antiviral drug treatment is frequently delayed. Maintaining appropriate concentra-tions of antiviral agents may enhance therapeutic activity and reduce developmentof resistance.
3. Drugs acting on the central nervous system (CNS)
Epilepsy can be explained as communication disorder among nerve cells. Thedisintegration of the balance of the excitatory and inhibitory stimuli leads to thepredominance of excitatory impulses; thus, epileptic fit could occur. In the brainthe most important excitatory neurotransmitter is glutamate, while the majorinhibitory neurotransmitter is GABA. Thus, increasing GABA or decreasingglutamate can suppress the incidence of fits. TDM is indicated in the treatment ofepilepsy since the symptoms of inefficacy (uncontrolled disease) and toxicity canbe similar. This is further complicated by the fact that compliance of epilepticpatients is not always appropriate [26]. Moreover, epilepsy is one of the most fre-quently occurring neurological disorder affecting millions of patients worldwide.
Depression is beyond any doubt the major psychiatric disorder that could affectevery fifth individual at least once during their lifetime. There are several theoriesto explain development of depression including the role of noradrenaline,serotonine, acetylcholine, and dysregulation of neurotransmission. Therefore, anti-depressants have many different and well-defined mechanisms of action such asenhancement of neurotransmitter synthesis, inhibition of neurotransmitterreuptake, monoamino oxidase (MAO) inhibition, antagonism of the activity ofpresynaptic inhibitory receptors, or increase in the activity of postsynaptic recep-tors. The reason for TDM in this class of drugs is that the metabolism and elimina-tion show wide interindividual variability; thus, when standard doses are appliedthe serum concentration is often out of the therapeutic range [27].
The most frequent movement disorders are Parkinson’s disease and Huntingtonchorea. The characteristic features of the former are hypokinetic movements andrigor of the muscles, while of the latter are hyperkinetic movements and hypoten-sion of the muscles. In case of Parkinson’s disease, the dopaminerg tracts aredamaged in nigrostriatal system, while in Huntington chorea GABAerg neuronsare insufficiently functioning, acetylcholine synthesis decreased, dopamine levelincreased, and the activity of NMDA receptors are enhanced. Thus, influencingdopamine synthesis and/or metabolism is beneficial in Parkinson’s disease, whilesubstituting acetylcholine, increasing GABA, antagonizing dopamine, and block-ing the activity of NMDA receptors are all therapeutic targets in Huntington chorea.Measuring the correlation of drug concentration and efficacy may improve the ben-efit from all of these therapies or help to individualize dosing (e.g., in elderly).
MS-based methodology used in the measurement of CNS-acting drugs areshown in Table 4.

272 A. Telekes et al.
Table 4
Applications of MS in the measurement of drugs acting on CNS
Ref. Drug Comment
[28] Amoxapine, amitriptyline, A special turbulent-flow liquid chromatographic (TFC) citalopram, clomipramine, technology, coupled with MS–MS to monitor 13 antide-dothiepin, doxepin, pressants and some of their active metabolites in humanfluoxetine, imipramine, serum. Such tests are necessary if the drug either is toxic maprotiline, mianserin, in high concentration or appears ineffective in therapy. paroxetine, sertraline, Owing to their different chromatographic behavior, the trimipramine (and some antidepressants are divided into two separate groups (two of their respective active parallels should be injected to cover the whole range of metabolites: nortriptyline, compounds). Calibration curves have been established for monodesmethyl citalopram, the concentration range of 10–500 ng/ml. No memorydesmethylclomipramine, effect was observed even after the highest concentration desipramine, norfluoxetine, samples. Intraassay and interassay precisions: 0.4–12 anddesmethyl mianserin, 1–16%, respectively.N-desmethyl sertraline)
[29] Citalopram (CIT), A GC–MS technique to elucidate the effect of aging on desmethylcitalo-pram the steady-state plasma concentrations of citalopram (CIT) (DCIT) and desmethylcitalopram (DCIT). One hundred and
twenty-eight depressive patients were treated with 10–80 mg/ day CIT. Patients were divided into three agegroups (�64 years, 65–79 years, and �80 years). Despitecomparable body mass indices (BMI) and renal and hepaticfunctions, plasma levels of CIT and DCIT exhibited largevariations (16-fold and 12-fold, respectively). Whencompared to adults, mean plasma concentration of CITand DCIT was 48% in the oldest age group and 33%higher in the elderly group, which has to be taken intoaccount in their treatment, the dose should be reduced.
[30] Midazolam An HPLC–ESI–MS method simultaneously quantifiesmidazolam (MDZ) and its major metabolite 1�-hydroxymi-dazolam (1�-OHM) in a small volume (200 �l) of humanplasma. Midazolam, 1�-OHM, and 1�-chlordiazepoxide(internal standard) are extracted from plasma samplesusing liquid–liquid extraction with 1-chlorobutane. Thechromatographic separation is performed on a C18 columnusing as mobile phase water–acetonitrile, 75:25% (v/v),containing formic acid (0.1%, v/v). Protonated molecularions were detected in the positive-ion mode. Calibrationcurves are linear (r2 � 0.99) from 15 to 600 ng/ml (MDZ)and 5 to 200 ng/ml (1�-OHM). Limits of detection andquantification: 2 and 5 ng/ml, respectively, for both MDZand 1�-OHM. Mean relative recoveries at 40 and 600 ng/ml(MDZ): 79.4 and 84.2, respectively; for 1�-OHM at 30 and200 ng/ml the values were 89.9 and 86.9, respectively. Theintraassay and interassay coefficients of variation (CVs) forMDZ were less than 8%, and for 1�-OHM less than 13%.

Therapeutic drug monitoring and measurement of drug concentrations 273
There was no interference from other commonly used anti-malarials, antipyretic drugs, and antibiotics. The methodwas successfully applied in a pharmacokinetic study.
[31] Pergolide An LC–MS–MS technique for pharmacokinetic purposesto monitor drug levels in patients with mild-to-moderateParkinson’s disease treated orally by pergolide. Plasmalevels were correlated with the efficacy of the treatment.Steady-state pharmacokinetic profiles and motor scorewere determined on 14 patients in this dose-escalatingstudy. Typical absorption times: 2–3 h, eliminationhalf-life: 21 h. The fast absorption and slow eliminationpresumably help in reducing motor problems in patientswith Parkinson’s disease.
[32] Clozapine Chromatographic (LC–MS) and solid-phase extraction(SPE) conditions have been optimized for Clozapine, withcycle times of 2.2 min. Depending on the ionizationmodes detection limits varied between 0.15 and0.3 mg/ml. A quadratic calibration curve was found forclozapine and its N-oxide and a linear one for thedesmethyl metabolite (R � 0.99 in all cases). Accuracy isbetter than 10% in the whole therapeutic concentrationrange. Interassay precision: 5–20% of the standarddeviation from the highest to the lowest therapeuticconcentrations. Quantitative measurements are possibledown to 350 ng/ml.
Table 4
Continued
Ref. Drug Comment
4. Cardiovascular drugs
Cardiovascular drugs are the common name of compounds used to treat differentheart disorders (such as congestive heart failure, angina, or arrhythmia) or diseasesof the vascular system (e.g., hypertension). Heart failure can be acute (sudden left-ventricular insufficiency and as a consequence lung failure without hypertrophy ofheart muscle), compensatory (no lung failure but hypertrophy of heart muscle), orexhaustive (no more compensation of the heart muscle even though there is hyper-trophy). Heart failure can be influenced by different classes of drugs, includingnitrates, Ca2� antagonists, �-blockers, digitalis, ACE inhibitors, phosphodiesteraseinhibitors, etc.
There are several ion channels that could participate in the pathomechanism ofarrhythmia such as Na�, Ca2�, K�, and Cl� channels. Thus, these channels rep-resent therapeutic targets of the therapy. Hypertension can be treated by drugswith distinctly different mechanism of actions. There are first-line (e.g., diuretics,

274 A. Telekes et al.
�-receptor antagonists, calcium antagonists, ACE inhibitors, angiotensin II recep-tor antagonists, �1-receptor antagonists) and second-line drugs (e.g., �2-receptorantagonists, angiotensin I receptor antagonists, potassium channel activators,direct vasodilators). The therapeutic indices for many of the drugs applied arenarrow, leading to complications [33]. Since all heart disease could lead to acutecardiac death, maintaining the drug concentrations in proper therapeutic rangemight save the patient’s life, especially if the life-threatening danger of significantoverdosing is also considered with some of these drugs. MS also gained role inmeasurement of cardiac drugs as indicated in Table 5.
Table 5
Applications of MS in the measurement of cardiovascular drugs
Ref. Drug Comment
[34] Amlodipine An HPLC–MS–MS method to determine plasma levelsof amlodipine. The results were utilized in bioequivalencetests of two tablets, wherein sex differences and tolerabilitywere also investigated. The pharmacokinetic curves ofall patients were within the ranges prescribed by theauthorities, and both tablets were well tolerated by thepatients. Bioavailability and pharmacodynamic differencesbetween the sexes could be explained by body weightdifferences, and no significant differences appeared betweenthe sexes in drug clearance.
[35] Aliskiren An LC–MS method to monitor the pharmacokinetic behaviorof aliskiren (an orally effective renin inhibitor for the treat-ment of hypertension) and its interactions with lovastatin,atenolol, celecoxib, or cimetidine. Single doses of aliskirenshowed no evidence of clinically important pharmacokineticinteractions with lovastatin, atenolol, celecoxib, or cimetidine.
[36] Carvedilol A GC–MS method to detect carvedilol and its metabolitesin human urine. Before the liquid–liquid extraction of theanalytes, urine samples are exposed to hydrolytic treatmentby beta-glucuronidase/arylsulfatase. Trimethylsilyl deriva-tives are produced using N-methyl-N-trimethylsilyltrifluo-roacetamide (MSTFA). Linear calibration curves areobtained between 3.0 and 75 ng/ml; the recovery rates of thevarious compounds from urine are between 80 and 98%.Detection limits: 0.75–3.0 ng/ml; intraday reproducibilities:1.86–11.5%; interday values: 0.70–1.71%. The method canbe used routinely.
[37] Isosorbide An LC–MS–MS technique coupled with photospray 5-mononitrate ionization and preceded by liquid–liquid extraction to(5-ISMN) determine plasma levels of isosorbide 5-mononitrate
(5-ISMN), an organic nitrate vasodilatant used to alleviatethe pains in angina pectoris. The analyte is extracted from0.5 ml human plasma, followed by a chromatographic

Therapeutic drug monitoring and measurement of drug concentrations 275
separation on a C8 column, and a typical test time is 2 min.A linear calibration curve with R2 � 0.995 is obtained in theconcentration range 20–2000 ng/ml. Interrun precision was5–7% of the standard deviation, while interrun accuracy wasbetter than 90%. The test has been utilized in bioequivalencestudies.
[38] Pravastatin An HPLC–MS–MS method used in a comparative bioavail-ability test on two formulations of pravastatin. The drugwas detected from human plasma with a lowest detectionlimit of 0.40 ng/ml. In addition to a general linear model,gender-related effects were also investigated. Bioequivalencewas established by both models and gender differences couldbe explained by body weight differences.
[39] Rosuvastatin, An LC–MS method to simultaneously determine rosuvastatinfenofibric acid (RST) and fenofibric acid (FFA) in human plasma, using car-
bamazepine internal standard. The analytes are first extracted(LLE) into ethyl acetate. After evaporating the solvent, theresidue is dissolved in a mobile phase consisting of 0.05 Mformic acid:acetonitrile (45:55, v/v) and injected onto a C18column. The MS–MS system is operated under the multiplereaction-monitoring mode (MRM) using EI and positive iondetection mode. Absolute recovery of RST, FFA, and IS was74, 61, and 69%, respectively. The lower limits of quantifica-tion (LLOQ) of RST and FFA were 1.00 and 0.50 �g/ml,respectively. Response function was established for the rangeof concentrations 1.00–50.0 and 0.50–20.0 �g/ml for RSTand FFA, respectively, with r2 of 0.999 for both compounds.The inter- and intraday precision values for RST were in therange 8.93–9.37% relative standard deviation (RSD) and1.74–16.1% RSD, respectively. Similarly, the inter- andintraday precision values in the measurement of FFA were inthe range 9.78–11.6% RSD and 0.22–17.4% RSD, respec-tively. Accuracy values for RST and FFA: 88.1–108 and87–115%, respectively. RST and FFA proved to be stable inthe standard tests. Has been applied in a clinical study.
[40] Trimetazidine An LC–MS method to determine plasma levels of trimetazi-dine using an internal standard [1-(2,4,5-trimethoxybenzyl)piperazine]. Proteins are precipitated with trifluoroacetic acid; the neutralized supernatant is separated on a C(8)column with methanol aqueous 0.11% triethylamine adjustedto pH 3.3 with formic acid (1:4, v/v). Test time is 8 min. Anion trap analyzer with an AP-CI interface is used for detec-tion, in the selected reaction-monitoring mode. Lowest quan-tification limit: 1.5 ng/ml. Used in bioequivalence studies.
Table 5
Continued
Ref. Drug Comment

Table 6
Applications of MS in the measurement of anticancer drugs
Ref. Drug Comment
[43] Actinomycin-D An LC–MS–MS method for the simultaneous quantitative (Act-D), vincristine determination of actinomycin-D (Act-D) and vincristine (VCR) (VCR), which are cytotoxic agents commonly used in the
treatment of pediatric cancers. Following solid-phaseextraction, plasma samples are separated and analyzedusing electrospray ionization (ESI). Lower limit of quantita-tion (LLOQ) for both Act-D and VCR: 0.5 ng/ml. Analyticalaccuracy for detection of both Act-D and VCR: �90%.Analytical precision, as estimated by the coefficient ofvariation: �6% for Act-D and �11% for VCR. Useful inclinical monitoring.
[44] 5-Azacitidine LC–MS–MS was used to monitor the pharmacokineticbehavior of 5-azacitidine (5-AC), a cytidine nucleosideanalog, when given with phenylbutyrate, a histone deacetylaseinhibitor. Pharmacokinetic data were obtained from trials
276 A. Telekes et al.
5. Anticancer agents
TDM in oncology was first applied for the measurement of methotrexate plasmaconcentrations following high-dose treatment, then it was gradually extended to thedose modifications in case of liver or kidney failure [41]. There are arguments infavor of and against TDM in antineoplastic treatment.Anticancer agents are usuallyapplied in maximal tolerable doses even though their pharmacokinetics arevariable; thus, TDM could improve safety (by preventing overdose) and efficacy(providing maximum treatment intensity and preventing underdose). The limita-tion is, however, that blood concentration cannot reliably indicate the concentrationachieved at the site of therapeutic target since the blood supply of tumors highlyfluctuates, even within the same tumor tissue [42]. In case of anticancer treatments,biological features of the tumor (such as growing rate, specific growth factorreceptors on tumor cell membranes, etc.) should also be considered. The differ-ence between tumor and host tissue is sometimes slight; therefore, toxicity ofchemotherapy could be severe. The mechanism of actions of chemotherapeuticdrugs is different, including alkylating agents, antimetabolites, antimicrotubuleagents, antitumor antibiotics, topoisomerase targeting drugs, anthracyclins, etc.Endocrine therapy of hormone-sensitive tumors such as in the case of breast cancer,prostate cancer, etc. should be implemented as standard part of care. Some new bio-logical therapies such as inhibitors of tumor angiogenesis, proteosome inhibitors,growth factor receptor inhibitors, etc. might also be applied in monotherapy orcombinations with chemotherapeutic agents. In Table 6, examples of MS-basedmeasurements of anticancer agents are presented.

Therapeutic drug monitoring and measurement of drug concentrations 277
involving patients with solid tumor and hematologic malig-nancies. 5-AC at doses ranging from 10 to 75 mg/m2 day wasadministered once daily as a subcutaneous injection for 5–21days in combination with phenylbutyrate administered as acontinuous intravenous infusion for varying dose and durationevery 28 or 35 days. Despite a short terminal half-life of1.5 2.3 h, inhibition of DNA methyl transferase activityin tumors of patients receiving 5-AC has been documented.It can be concluded that 5-AC is rapidly absorbed andeliminated when administered subcutaneously. Sufficient5-AC exposure is achieved to produce pharmacodynamiceffects in tumors.
[45] 2�-Fluoro-5-methyl- Ion-pairing, reverse-phase, liquid chromatography/beta-l-arabinofuranosyl electrospray tandem mass spectrometry to determine the level uracil triphosphate of 2�-fluoro-5-methyl-beta-l-arabinofuranosyl uracil triphos(L-FMAU-TP) phate (L-FMAU-TP) from human peripheral blood mononu-
clear cells of hepatitis B virus-infected patients treated withL-FMAU. Limit of detection: 1.6 pmol/106 human peripheralblood mononuclear cells. The calibration curve for L-FMAU-TP is linear over the concentration range 1.6–80 pmol/106
cells. Intra- and interday precision: �11.2%; accuracy:97.1–106.9%. When applied to the determination ofL-FMAU-TP in PBMCs isolated from HBV-infected patientsundergoing L-FMAU treatment, the levels reacheda steady state concentration 4 weeks after daily single oraladministration of 20 mg L-FMAU, and these levels weremaintained for up to 12 weeks, but then decreased 12 weeksafter drug cessation. The terminal half-life of L-FMAU-TP inPBMCs after drug cessation was estimated to be 15.6 days.
[46] Busulfan Busulfan was determined quantitatively by LC–MS–MS insaliva and plasma in children after hematopoietic stem celltransplantation. Lowest limit of detection: 2 �g/l; lower limitof quantification: 10 �g/l. Only 100 �l of plasma/saliva wasneeded. The mean recoveries (SD) of busulfan: 97.2% (2.7)in plasma and 100.4% (1.3) in saliva. Intra- and interassayimprecision: 2–3 and 2–4% for plasma, and 1–2 and 2–4%for saliva (concentration range 30–1500 �g/l). The bias was�4% for both plasma and saliva. The correlation betweenthe busulfan concentration in plasma and saliva was highlysignificant (r 0.958; p � 0.0001; saliva/plasma ratio 1.09 0.04; n 69 sample pairs). The apparent plasmaclearance was slightly higher than the apparent saliva clear-ance (202 31 ml/h/kg vs. 189 28 ml/h/kg; p 0.001).The mean elimination half-life is 2.31 0.46 h for plasma
Table 6
Continued
Ref. Drug Comment
(continues)

278 A. Telekes et al.
and 2.30 0.36 h for saliva; these were not significantlydifferent (p 0.83). Analysis of busulfan in saliva could bea valuable and reliable alternative to plasma analysis.
[47] Fulvestrant HPLC–MS–MS was used in a pharmacokinetic study of along-acting formulation of fulvestrant within two globalphase III efficacy studies comparing intramuscular fulves-trant with oral anastrozole. Preliminary pharmacokineticanalysis suggests that observed single- and multiple-doseplasma profiles can be adequately described with a two-compartment kinetic model. The intramuscular formulationof fulvestrant displays predictable kinetics and approximatelytwofold accumulation on administration once monthly. At theproposed therapeutic dosage (250 mg once monthly), plasmafulvestrant concentrations are maintained within a narrowrange throughout the administration interval, thus ensuringstable systemic drug exposure during long-term treatment.
[48] Gefitinib An LC–MS–MS method to measure the concentration ofgefitinib in human plasma, mouse plasma, and tissue. Thechromatographic separation was preceded by protein precipi-tation with acetonitrile. A deuterated analogue was used asinternal standard. The sample was analyzed on a C18 columnusing isocratic flow and acetonitrile–water (70:30, v/v) mobilephase containing 0.1% formic acid. EI and MS–MS were usedfor detection. Linear calibration curves were found in a wideconcentration range from 1–5 ng/ml (depending on the matrix)up to 1000 ng/ml with R2 � 0.99. Intra- and interday precisionand accuracy values were better than 15%. The method wassuccessfully applied in animal and human pharmacokineticstudies using oral or intraperitoneal administration.
[49] Imatinib An LC–MS–MS method to monitor plasma levels of imatinib,a selective tyrosine kinase inhibitor used for the treatment ofchronic myeloid leukemia (CML) and other malignant diseases.The analyte is extracted from plasma and a deuterated internalstandard is added, prior to analysis on a C18 column usinggradient elution with acetonitrile–ammonium formate buffer4 mmol/l, pH 3.2. EI–MS in multiple reaction-monitoringmode is used for detection. Linear calibration curves are inthe concentration range 10–5000 ng/ml. The limit of quantifi-cation was set at 10 ng/ml. Intra- and interday precisions:�8%. Extraction recovery: �90%. The method can beroutinely used in pharmacokinetic and drug interaction studies.
[50] An LC–MS–MS method used in a pharmacokinetic studywhere imatinib mesylate (Glivec) and its main metabolite(CGP74588) were measured in blood samples of a patient withend-stage renal disease on hemodialysis and compared with
Table 6
Continued
Ref. Drug Comment

Therapeutic drug monitoring and measurement of drug concentrations 279
published data from subjects with normal renal function.Maximum concentrations, absorption rates, and half-lifevalues determined for the drug and its metabolite werecomparable with those obtained on patients with normal renalfunction. Thus, the standard dose of imatinib can be safelyadministered to patients on hemodialysis, and probably withrenal failure, at any stage.
[51] Lonafarnib An LC–MS–MS method to monitor lonafarnib (a novelanticancer drug that inhibits farnesyl transferase) in humanplasma. Deuterated internal standard is used; proteins areprecipitated by acetonitrile. Reverse-phase chromatographicseparation is performed using acetonitrile/water/formic acid(50:50:0.05, v/v/v) mobile phase. Time of analysis: 8 min. Atriple quadrupole tandem mass spectrometer in the positive-ion mode with multiple reaction monitoring is used fordetection. The calibration curve has been established in the2.5–2500 ng/ml concentration range. The validated methodwas successfully used in phase I trials of the drug.
[52] Procarbazine A reverse-phase HPLC method with ESI–MS detection tocharacterize the pharmacokinetic behavior of procarbazine,a cytotoxic chemotherapeutic agent used in the treatment oflymphomas and brain tumors. The data are used in a phase Itrial; concentrations are measured in human plasma. Thecalibration curve is linear in the 0.5–50 ng/ml concentrationrange. Average recovery rate: 102.9%. Lower limit ofquantitation: 0.5 ng/ml; accuracy: 105.2%; interday precision:3.6% RSD; sample volume: 150 �l. Interday precisions atwidely different concentrations: 97–98%. The stability ofthe drug under storage and sample preparation conditionshave also been thoroughly tested. Sensitivity is sufficient for monitoring plasma levels after oral administration.
[53] Tamoxifen An LC–MS–MS method to determine tamoxifen (tam)and its metabolites 4-hydroxytamoxifen (4OHtam),N-demethyltamoxifen (NDtam), N-dedimetvhyltamoxifen(NDDtam), tamoxifen-N-oxide (tamNox), and 4-hydroxy-N-demethyltamoxifen (4OHNDtam) human serum. Proteinsare precipitated with acetonitrile. Deuterated tamoxifen(D5 tam) is added as internal standard. Sample supernatantis injected into an online reverse-phase extraction columncoupled with a C18 analytical column and analytes aredetected by tandem mass spectrometry. Lower limits ofquantification: 0.25 ng/ml for 4OHtam, Ndtam, and tam,and 1.0 ng/ml for NDDtam and tamNox. Within- andbetween-day variation: 2.9–15.4 and 4.4–12.9%, respectively.
Table 6
Continued
Ref. Drug Comment

Table 7
Applications of MS in the measurement of analgesics
Ref. Drug Comment
[55] Ajulemic acid A GC–MS method combined with solid-phase extraction todetect ajulemic acid (AJA), a nonpsychoactive syntheticcannabinoid in human plasma. The calibration curve exhibitstwo linear portions between 10 and 750 ng/ml, and 750 and3000 ng/ml, respectively. Intra- and interday precisionvalues (expressed as the percentage of the RSD value) forthe two segments of the calibration curves: 1.5–7.0 and3.6–7.9, respectively. Detection limit: 10 ng/ml. The amountof the glucoronide derivative could be estimated by compar-ing the free AJA levels with those obtained after enzymatichydrolysis. The method was tested on 21 patients sufferingfrom neuropathic pain with hyperalgesia and allodynia.
[56] Apomorphine The drug could be detected above concentrations of0.010 ng/ml and quantification was possible above0.025 ng/ml. Accuracy and precision tests were made by ana-lyzing 54 quality-control samples for 3 days. The concentrationrange studied was between 0.075 and 15 ng/ml (logarithmicscale, 3 points). Intraday precision: 10.1–3.8%; interday
280 A. Telekes et al.
6. Analgesics
The most consumed drugs are analgesics. Basically there are two main categoriesof analgesics, namely nonsteroidal antiinflammatory drugs (NSAIDs) and opi-oids. Many active ingredients are in the market in several hundreds of brandname. NSAIDs are used to treat not only pain but also other medical problems aswell, including fever, inflammation, and prevention of thrombosis. According totheir chemical structure, NSAIDs can be classified into different classes such asanthranilic acid, indoleacetic acids, naphthylalkanone, oxicam, phenylacetic acid,propionic acid, pyrazolone, pyrrole acetic acid, salicylic acid, etc. Even within thesame class there could be wide variations between the analgesic activities of dif-ferent compounds. It is important to note that antiinflammatory doses of NSAIDsare usually higher than the doses required to achieve analgesia.
Opioids can be classified as antagonists, full agonists, and partial agonists.Agonists can be further divided into weak and strong opioids. The structure–activityrelationships of opioids are well established; thus, synthetic strong opioids areavailable, including fentanyl and methadone. The indications for TDM are suspecteddose-related toxicity, suspected noncompliance, acute overdose, chronic abuse,reduced kidney or liver function, potential interaction with other drugs, evaluation ofabsorption, and optimalization of treatment (in patients who are frail, elderly, obese,etc.) [54]. In Table 7, some examples of measuring analgesics by MS are listed.

Therapeutic drug monitoring and measurement of drug concentrations 281
precision: 4.8–6.6%. Accuracy values: 99.5–104.2%. Simpleand convenient test method for therapeutic drug monitoring andpharmacokinetic studies, requiring only 0.5 ml sample volume.
[57] Hydrocodone, A rapid hyphenated LC assay method based on MS–MShydromorphone detection for hydrocodone (HYC) and its metabolite hydro-
morphone (HYM) in human plasma. Sample handling,internal standard addition, and analyte extraction are performedon a 96-channel automatic workstation, analyte and internalstandard extraction on a 96-well solid-phase extraction car-tridge system. The LC column is based on silica; the mobilephase contains acetonitrile and water and is acidified bytrifluoroacetic acid (TFA). The total time of analysis is 2.5 min.The singly charged precursor ions and the product ions were300 → 199 (m/z) for HYC and 28 → 185 (m/z) for HYM. Avalidated calibration curve was established between 0.100 and100 ng/ml, using 0.3 ml plasma. Correlation coefficients forboth analytes: �0.999. Quantitative determination was possiblefrom 0.100 ng/ml for both HYC and HYM, the signal-to-noiseratio was �50 for HYC and 10 for HYM. Interday precision:�5% standard deviation; interday precision 2% (relativeerror) for both analytes. Intraday precision was about 2.5%(standard deviation) and intraday accuracy was better than 3%(relative error) for both compounds. Five times dilution of theQC sample did not result in a significant deviation of thenominal value. Samples remained stable after 24 h roomtemperature storage of three freeze-thaw cycles. Extractionyields: 86 and 78% for HYC and HYM, respectively. Nocarryover was detected using a blank after a highlyconcentrated test solution.
[58] Lumiracoxib This validated HPLC–MS technique has been utilized in apharmacokinetic study of lumiracoxib, a cyclo-oxygenase-2(COX-2) selective inhibitor in development for the treatmentof rheumatoid arthritis, osteoarthritis, and acute pain. Levelsof the drug and its metabolites (4�-hydroxy-lumiracoxib and5-carboxy-4�-hydroxy-lumiracoxib) were determined inplasma and synovial fluid. The pharmacokinetic curves wereinterpreted by two independent methods. Both absorption(peak plasma concentration after 2 h) and decay (plasmahalf-life 6 h) are relatively fast. Lumiracoxib concentrationswere first higher in the plasma, later in the synovial fluid(peak drug concentrations in the latter were about three timeshigher). Concentrations of 4�-hydroxy-lumiracoxib, theactive COX-2 selective metabolite, remained low incomparison with parent drug in both plasma and synovial
(continues)
Table 7
Continued
Ref. Drug Comment

282 A. Telekes et al.
fluid. The extended presence of the antiinflammatory drugin the synovial fluid extends its therapeutic action beyondthat expected from plasma pharmacokinetics.
[59] Nalmefene A sensitive test method to detect nalmefene, an opioidantagonist in human and rabbit serum, using nalbuphineinternal standard. The analyte is extracted using n-butylchloride/acetonitrile (4:1). HPLC combined with electro-spray and MS–MS detection is used for quantitative tests.First validated for human plasma, and cross-checked byrabbit serum and plasma. Specificities are 3.21, 5.55, and3.62% for human plasma, rabbit plasma, and rabbit serum,respectively. Extraction yield: 80% from human plasma. Acalibration curve has been established for the 0.1–100 ng/mlconcentration range. Within one run, at the lower limit theaccuracy was 18%; the precision was 13.6%. In the concen-tration range 0.3–75 ng/l the accuracy was better than 128%;the precision was 6.6% for all matrix types. Interrunaccuracy and precision: 8.0 and 6.6%, respectively. Theanalyte remained stable after 24 h room temperature storageof three freeze-thaw cycles.
[60] Phenazopyridine An LC–MS method for phenazopyridine, a strong analgesicused in the treatment of urinary tract infections to support invivo pharmacokinetic studies. In spite of its widespread use,no assay method previously available for measuring plasmaconcentrations in human after oral administration. The ana-lyte is extracted using liquid–liquid extraction, followed byLC–MS using a C18 column and soft ionization mode. Anunexpected peak-doubling was observed and a two-siteabsorption compartment model was developed to explain theobserved phenomena. Concentration profiles could be wellexplained for various dosage groups using the model.
[61] Phenylbutazone, An LC–MS method with normal pressure CI using indomethacin, flunixin, negative-ion mode to detect nonsteroidal antiinflammatoriespiroxicam, diclofenac, (NSAIDs) and acetaminophen (ACE). Ion chromatogramsketoprofen, mefenamic for each species have been identified using full-scan acid, oxyphenbutazone, fragmentation spectrograms. Linear quantitative calibration ibuprofen, salicylic acid, curves were obtained for the concentration range of tolmetin, naproxen 0.05–25.0 �g/ml. Detection limits: 0.05–1.0 �g/ml. Matrix
detection limits: 0.05 �g/ml for phenylbutazone (m/z 307);0.1 �g/ml for indomethacin (m/z 312), flunixin (m/z 295), andpiroxicam (m/z 330); 0.5 �g/ml for ACE (m/z 150), diclofenac(m/z 250), ketoprofen (m/z 209), and mefenamic acid (m/z240); 1.0 �g/ml for oxyphenbutazone (m/z 323); 5.0 �g/mlfor ibuprofen (m/z 205), salicylic acid (m/z 137), and tolmetin(m/z 212); and 10 �g/ml for naproxen (m/z 185).
Table 7
Continued
Ref. Drug Comment

Therapeutic drug monitoring and measurement of drug concentrations 283
[62] Salicylic acid, An electrospray LC–MS methodology for monitoring the serum acetaminophen, levels of patients poisoned by salicylic acid, acetaminophen, theophylline, theophylline, barbiturates, and bromvalerylurea. It is precededbarbiturates, by solid-state extraction, using o-acetamidophenol as internal bromvalerylurea standard. As these drugs cause acute poisoning relatively fre-
quently, the test needs to be rapid with a high precision. Foracetaminophen the positive-ion mode is utilized, for all othersthe negative-ion mode, the base ions are used for quantitativedetermination. Quantitative determination is possible from100 �g/ml, the upper limit varies between 0.5 and 5 �g/ml.Lowest detection limit: 0.1–1 �g/ml using full-scan MS foridentifying acute poisoning. Using Oasis HLB 1-cc solid-phaseextraction cartridges the recovery rates are 89–96%. Intradayreproducibility values: 3.55–6.05%; interday values: 3.68–6.38%.
Table 7
Continued
Ref. Drug Comment
7. Miscellaneous drug classes
There are many categories of drugs that are used in clinical practice. In these cases,TDM is usually not required. However, measuring drug concentrations in blood orother body fluids (e.g., urine) might contribute to developing optimal therapeutic(dosing) strategies, predicting accumulation, and measuring elimination. MS canalso be used to differentiate between natural and synthetic molecules within thebody, such as steroids or insulin, to detect doping. In Table 8, results on miscella-neous drug classes are summarized, including immunosuppressives and vitamins.
Table 8
Applications of MS in the measurement of various drugs
Ref. Drug Comment
[63] Cyclosporine An HPLC–MS method used in a pharmacokinetic monitoringstudy of cyclosporine (CsA, an immunosuppressive drug),which has a narrow therapeutic window, immunosuppressive,and/or toxic metabolites and a wide range of metabolic ratesbetween individuals, thus requiring great care in establishingindividual doses. As the drug and its metabolites (AM1,AM1c, DihydroAM1, AM19, and AM4N) tend to bind tolipoproteins, protein precipitation and solid-phase extractionare necessary prior to reverse-phase chromatographic analysis.The drug and its metabolites (which exhibit patient-specificpatterns) are detected by MS in the form of sodium adductsafter EI. Hepatotoxic potential has been confirmed and strongcorrelation between AM19 and CRP and IL6 observed.
(continues)

284 A. Telekes et al.
[64] Dextran A method based on LC–MS–MS for doping control, allowingquantitative determination of the plasma volume expanderdextran. The dextran polymer is enzymatically convertedinto disaccharides, such as lactose, saccharose, and isomal-tose; the analyte is detected in human urine. After the basalconcentration of isomaltose was established, the concentrationof dextran was measured as isomaltose in urine specimensobtained from patients treated with dextran. Linear and repro-ducible calibration curves for dextran were obtained. Inter-and intraassay coefficients of variation: 4.9–7.3% between 53and 1186 �g/ml concentration levels. Recovery scatteredbetween 97 and 112%. Lower limit of detection:3.8 �g/ml; lower limit of quantification: 12.5 �g/ml. Thehighest concentrations measured in control samples weremore than 100-fold lower than those found in urine samplesof patients after treatment with dextran.
[65] Madol A method for rapid screening of urine by GC–MS to measurethe concentration of trimethylsilylated madol (17alpha-methyl-5alpha-androst-2-en-17beta-ol, an alleged anabolicsteroid not covered by routine doping tests) by monitoringpeaks at m/z 143, 270, and 345.
[66] Synthetic insulins Synthetic insulins such as Humalog Lispro, Novolog Aspart,(Humalog Lispro, or Lantus Glargine should be analyzed in doping control asNovolog Aspart, they are sometimes misused for nontherapeutic purposes.Lantus Glargine) Plasma specimens of 2 ml fortified with three synthetic
insulin analogues are purified by immunoaffinity chromatog-raphy, and extracts analyzed by microbore LC and MS–MS.Product ion scan experiments of intact proteins enable thedifferentiation between endogenously produced insulin andits synthetic analogues by collisionally activated dissociationof multiply charged precursor ions. This allows the assign-ment of individual fragment ions, particularly those compris-ing modifications that originate from C-termini of B-chains.Recoveries of synthetic insulins from plasma aliquots:91–98%; detection limit: 0.5 ng/ml for all target analytes.
[67] Vitamin B5 An LC–MS method to measure the concentration of vitaminB5 in human urine. Hopantenic acid (HOPA) is used as inter-nal standard. Quantitative MS detection is performed in thesingle-ion monitoring mode. A linear calibration curve wasobtained with R2 0.999 in the concentration range of0.25–10 �g/ml. The lower limit of detection is 0.1 �g/ml,with an intraassay coefficient of variation �5% andrecoveries between 96 and 108%.
Table 8
Continued
Ref. Drug Comment

Therapeutic drug monitoring and measurement of drug concentrations 285
Table 8
Continued
Ref. Drug Comment
[68] Vitamin D (25-hydroxy) An LC–MS–MS method with AP-CI to determine the con-centration of 25-hydroxyvitamin D (25-OH-D(2)/-D(3)) inhuman plasma. A deuterated standard is used and the tandemspectrometer is in the multiple-reaction-monitoring mode.Intra- and interassay variations: 2–6%; recoveries: 104–99%.Potential applications are the evaluation of the vitamin Dstatus in postmenopausal women and elderly subjects, thediagnosis of vitamin D insufficiency/deficiency, as well asfor the treatment and prevention of osteoporosis.
[69] Vitamin K An LC–MS–MS method with AP-CI to determine the concen-tration of vitamin K and related compounds (phylloquinone(PK), menaquinone-4 (MK-4), and menaquinone-7 (MK-7))in human plasma. The internal standard is an isotope-labeledcompound (O18); detection is by MS–MS using multiplereaction monitoring. Intra and interassay variations: �10%;recoveries: 98–102%. Potential applications are the evaluationof vitamin K status in postmenopausal women and elderlysubjects and in the treatment and prevention of osteoporosis.
References
1. Schulz, M. and Schmoldt, A., Therapeutic and toxic blood concentrations of more than800 drugs and other xenobiotics. Pharmazie, 58(7), 447–474 (2003).
2. Feldman, R.G. and Pippenger, C.E., The relation of anticonvulsant drug levels to completeseizure control. J. Clin. Pharmacol., 16, 51–59 (1976).
3. Rendón, A.L., Núñez, M., Jiménez-Nácher, I., González de Requena, D., González-Lahoz, J.and Soriano, V., Clinical benefit of interventions driven by therapeutic drug monitoring. HIVMed., 6(5), 360–365 (2005).
4. Alexander, C.S., Montaner, J.S., Asselin, J.J., Ting, L., McNabb, K., Harris, M., Guillemi, S.and Harrigan, P.R., Simplification of therapeutic drug monitoring for twice-daily regimens oflopinavir/ritonavir for HIV infection. Ther. Drug Monit., 26(5), 516–523 (2004).
5. Schumacher, G.E. and Barr, J.T., Total testing process applied to therapeutic drug monitoring:impact on patients’ outcomes and economics. Clin. Chem., 44(2), 370–374 (1998).
6. Shaw, L.M., Kaplan, B. and Brayman, K.L., Prospective investigations of concentration-clinical response for immunosuppressive drugs provide the scientific bases for therapeuticdrug monitoring. Clin. Chem., 44(2), 381–387 (1998).
7. Bates, D.W., Soldin, S.J., Rainey, P.M. and Micelli, J.N., Strategies for physician education intherapeutic drug monitoring. Clin. Chem., 44(2), 401–407 (1998).
8. Bowers, L.D., Analytical goals in therapeutic drug monitoring. Clin. Chem., 44(2), 375–380(1998).
9. Aspeslet, L.J., Legatt, D.F., Murphy, G. and Yatscoff, R.W., Effect of assay methodology onpharmacokinetic differences between cyclosporine Neoral® and Sandoimmune® formulations.Clin. Chem., 43, 104–108 (1997).

286 A. Telekes et al.
10. Bland, J.M. and Altman, D.G., Statistical methods for assessing agreement between twomethods of clinical measurement. Lancet, i, 307–310 (1986).
11. Hammett-Stabler, C.A. and Johns, T., Laboratory guidelines for monitoring of antimicrobialdrugs. Clin. Chem., 44(5), 1129–1140 (1998).
12. Gallis, H.A., Drew, R.H. and Packard, W.W., Amphotericin B: 30 years of clinical experience.Rev. Inf. Dis., 12, 308–329 (1990).
13. Chen, Z.J., Zhang, J., Yu, J.C., Cao, G.Y., Wu, X.J. and Shi, Y.G., Selective method for thedetermination of cefdinir in human plasma using liquid chromatography electrospray ioniza-tion tandem mass spectrometry. J. Chromatogr. B, 834(1–2), 163–169 (2006).
14. Meng, F., Chen, X., Zeng, Y. and Zhong, D., Sensitive liquid chromatography-tandem massspectrometry method for the determination of cefixime in human plasma: application to apharmacokinetic study. J. Chromatogr. B, 819(2), 277–282 (2005).
15. Chen, X., Zhong, D., Huang, B. and Cui, J., Determination of cefaclor in human plasma bya sensitive and specific liquid chromatographic-tandem mass spectrometric method.J. Chromatogr. B, 784(1), 17–24 (2003).
16. Krueger, W.A., Bulitta, J., Kinzig-Schippers, M., Landersdorfer, C., Holzgrabe, U., Naber, K.G.,Drusano, G.R. and Sorgel, F., Evaluation by monte carlo simulation of the pharmacokinetics oftwo doses of meropenem administered intermittently or as a continuous infusion in healthyvolunteers. Antimicrob. Agents Chemother., 49(5), 1881–1889 (2005).
17. Sagan, C., Salvador, A., Dubreuil, D., Poulet, P.P., Duffaut. D. and Brumpt, I., Simultaneousdetermination of metronidazole and spiramycin I in human plasma, saliva and gingival crevic-ular fluid by LC-MS/MS. J. Pharm. Biomed. Anal., 38(2), 298–306 (2005).
18. Fetterly, G.J., Ong, C.M., Bhavnani, S.M., Loutit, J.S., Porter, S.B., Morello, L.G., Ambrose,P.G. and Nicolau, D.P., Pharmacokinetics of oritavancin in plasma and skin blister fluidfollowing administration of a 200-milligram dose for 3 days or a single 800-milligram dose.Antimicrob. Agents Chemother., 49(1), 148–152 (2005).
19. Egle, H., Trittler, R., Konig, A. and Kummerer, K., Fast, fully automated analysis of voricona-zole from serum by LC-LC-ESI-MS-MS with parallel column-switching technique.Chromatogr. B, 814(2), 361–367 (2005).
20. Koal, T., Sibum, M., Koster, E., Resch, K. and Kaever, V., Direct and fast determinationof antiretroviral drugs by automated online solid-phase extraction-liquid chromatography-tandem mass spectrometry in human plasma. Clin. Chem. Lab. Med., 44(3), 299–305 (2006).
21. Capparelli, E.V., Holland, D., Okamoto, C., Gragg, B., Durelle, J., Marquie-Beck, J., van denBrande, G., Ellis, R., Letendre, S. and HNRC Group, Lopinavir concentrations in cerebrospinalfluid exceed the 50% inhibitory concentration for HIV. AIDS, 19(9), 949–952 (2005).
22. Hawkins, T., Veikley, W., St Claire, L.R. 3rd., Guyer, B., Clark, N. and Kearney, B.P.,Intracellular pharmacokinetics of tenofovir diphosphate, carbovir triphosphate, andlamivudine triphosphate in patients receiving triple-nucleoside regimens. J. Acquir. ImmuneDefic. Syndr., 39(4), 406–411 (2005).
23. King, T., Bushman, L., Anderson, P.L., Delahunty, T., Ray, M. and Fletcher, C.V., Quantitationof zidovudine triphosphate concentrations from human peripheral blood mononuclear cells byanion exchange solid phase extraction and liquid chromatography-tandem mass spectroscopy;an indirect quantitation methodology. J. Chromatogr. B, 831(1–2), 248–257 (2006).
24. Arndt, T., Guessregen, B., Hohl, A. and Reis, J., Determination of serum amantadine by liquidchromatography-tandem mass spectrometry. Clin. Chim. Acta, 359(1–2), 125–131 (2005).
25. Chen, X., Liu, D., Zhu, L. and Zhong, D., Development and validation of a liquidchromatography/tandem mass spectrometry procedure for the quantification of adefovir inhuman plasma. Rapid Commun. Mass Spectrom., 19(13), 1893–1898 (2005).
26. Dowse, R. and Futter, W.T., Outpatient complience with thephylline and phenytoin therapy.S Afr. Med., 80, 550–553 (1991).

Therapeutic drug monitoring and measurement of drug concentrations 287
27. Linder, M.W. and Keck, P.E. Jr., Standards of laboratory practice: antidepressant drug moni-toring. Clin. Chem., 44(5), 1073–1084 (1998).
28. Sauvage, F.L., Gaulier, J.M., Lachatre, G. and Marquet, P., A fully automated turbulent-flowliquid chromatography-tandem mass spectrometry technique for monitoring antidepressantsin human serum. Ther. Drug Monit., 28(1), 123–130 (2006).
29. de Mendonca Lima, C.A., Baumann, P., Brawand-Amey, M., Brogli, C., Jacquet, S., Cochard,N., Powell-Golay, K. and Eap, C.B., Effect of age and gender on citalopram and desmethyl-citalopram steady-state plasma concentrations in adults and elderly depressed patients. Prog.Neuropsycopharmacol. Biol. Psychiatry, 29(6), 952–956 (2005).
30. Muchohi, S.N., Ward, S.A., Preston, L., Newton, C.R., Edwards, G. and Kokwaro, G.O.,Determination of midazolam and its major metabolite 1�-hydroxymidazolam by high-performance liquid chromatography-electrospray mass spectrometry in plasma from children.J. Chromatogr. B, 821(1), 1–7 (2005).
31. Thalamas, C., Rajman, I., Kulisevsky, J., Lledo, A., Mackie, A.E., Blin, O., Gillespie, T.A.,Seger, M. and Rascol, O., Pergolide: multiple-dose pharmacokinetics in patients with mild tomoderate Parkinson disease. Clin. Neuropharmacol., 28(3), 120–125 (2005).
32. Niederlander, H.A., Koster, E.H., Hilhorst, M.J., Metting, H.J., Eilders, M., Ooms. B. andde Jong, G.J., High throughput therapeutic drug monitoring of clozapine and metabolites inserum by on-line coupling of solid phase extraction with liquid chromatography-mass spec-trometry. J. Chromatogr. B, 834(1–2), 98–107 (2006).
33. Valdes, R. Jr., Jortani, A.S. and Gheorghiade, M., Standards of laboratory practice: cardiacdrug monitoring. Clin. Chem., 44(5), 1096–1109 (1998).
34. Abad-Santos, F., Novalbos, J., Galvez-Mugica, M.A., Gallego-Sandin, S., Almeida, S., Vallee, F.and Garcia, A. G., Assessment of sex differences in pharmacokinetics and pharmacodynamics ofamlodipine in a bioequivalence study. Pharmacol. Res., 51(5), 445–452 (2005).
35. Dieterle, W., Corynen, S., Vaidyanathan, S. and Mann, J., Pharmacokinetic interactions of theoral renin inhibitor aliskiren with lovastatin, atenolol, celecoxib and cimetidine. Int. J. Clin.Pharmacol. Ther., 43(11), 527–535 (2005).
36. Myung, S.W. and Jo, C.H., Gas chromatograph-mass spectrometric method for the determinationof carvedilol and its metabolites in human urine. J. Chromatogr. B, 822(1–2), 70–77 (2005).
37. Silva, L.C., Oliveira, L.S., Mendes, G.D., Gracia, G., Pereira Ados, S. and De Nucci, G.,Quantification of isosorbide 5-mononitrate in human plasma by liquid chromatography-tandem mass spectrometry using atmospheric pressure photoionization. J. Chromatogr. B,832(2), 302–306 (2006).
38. Almeida, S., Filipe, A., Almeida, A., Gich, T., Antonijoan, R., Puntes, M., Barbanoj, M. andCruz Caturla, M., Comparative study on the bioequivalence of two formulations of pravas-tatin. Data from a crossover, randomised, open-label bioequivalence study in healthy volun-teers. Arzneimittelforschung, 56(2), 70–75 (2006).
39. Trivedi, R.K., Kallem, R.R., Mullangi, R. and Srinivas, N.R., Simultaneous determination ofrosuvastatin and fenofibric acid in human plasma by LC-MS/MS with electrospray ionization:assay development, validation and application to a clinical study. J. Pharm. Biomed. Anal.,39(3–4), 661–669 (2005).
40. Medvedovici, A., Albu, F., Georgita, C. and David, V., Non-extractive procedure followedby LC/APCI MS/MS analysis of trimetazidine in plasma samples for assessing bioequiva-lence of immediate/modified release formulations. Biomed. Chromatogr., 19(7), 549–555(2005).
41. Moore, M.J. and Erlichman, C., Therapeutic drug monitoring in oncology. Problems andpotential in antineoplastic therapy. Clin. Pharmacokinet., 13(4), 205–227 (1987).
42. Hon, Y.Y. and Evans, W.E., Making TDM work to optimize cancer chemotherapy: a multi-disciplinary team approach. Clin. Chem., 44(2), 388–400 (1998).

288 A. Telekes et al.
43. Skolnik, J.M., Barrett, J.S., Shi, H. and Adamson, P.C., A liquid chromatography-tandem massspectrometry method for the simultaneous quantification of actinomycin-D and vincristine inchildren with cancer. Cancer Chemother. Pharmacol., 57(4), 458–464 (2006).
44. Rudek, M.A., Zhao, M., He, P., Hartke, C., Gilbert, J., Gore, S.D., Carducci, M.A. and Baker,S.D., Pharmacokinetics of 5-azacitidine administered with phenylbutyrate in patients withrefractory solid tumors or hematologic malignancies. J. Clin. Oncol., 23(17), 3906–3911(2005).
45. Lee, J., Yoo, B.C., Lee, H.S., Yoo, H.W., Yoo, H.H., Kang, M.J. and Kim, D.H., Rapid quan-titative determination of L-FMAU-TP from human peripheral-blood mononuclear cells ofhepatitis B virus-infected patients treated with L-FMAU by ion-pairing, reverse-phase, liquidchromatography/electrospray tandem mass spectrometry. Ther. Drug Monit., 28(1), 131–137(2006).
46. Rauh, M., Stachel, D., Kuhlen, M., Groschl, M., Holter, W. and Rascher, W., Quantificationof busulfan in saliva and plasma in haematopoietic stem cell transplantation in children: val-idation of liquid chromatography tandem mass spectrometry method. Clin. Pharmacokinet.,45(3), 305–316 (2006).
47. Robertson, J.F., Erikstein, B., Osborne, K.C., Pippen, J., Come, S.E., Parker, L.M., Gertler, S.,Harrison, M.P. and Clarke, D.A., Pharmacokinetic profile of intramuscular fulvestrant inadvanced breast cancer. Clin. Pharmacokinet., 43(8), 529–538 (2004).
48. Zhao, M., Hartke, C., Jimeno, A., Li, J., He, P., Zabelina, Y., Hidalgo, M. and Baker, S.D.,Specific method for determination of gefitinib in human plasma, mouse plasma and tissuesusing high performance liquid chromatography coupled to tandem mass spectrometry.J. Chromatogr. B, 819(1), 73–80 (2005).
49. Titier, K., Picard, S., Ducint, D., Teilhet, E., Moore, N., Berthaud, P., Mahon, F.X. andMolimard, M., Quantification of imatinib in human plasma by high-performance liquidchromatography-tandem mass spectrometry. Ther. Drug Monit., 27(5), 634–640 (2005).
50. Pappas, P., Karavasilis, V., Briasoulis, E., Pavlidis, N. and Marselos, M., Pharmacokinetics ofimatinib mesylate in end stage renal disease. A case study. Cancer Chemother. Pharmacol.,65(4), 358–360 (2005).
51. Appels, N.M., van Maanen, M.J., Rosing, H., Schellens, J.H. and Beijnen, J.H., Quantitativeanalysis of the farnesyl transferase inhibitor lonafarnib (Sarasartrade mark, SCH66336) inhuman plasma using high-performance liquid chromatography coupled with tandem massspectrometry. Rapid Commun. Mass Spectrom., 19(15), 2187–2192 (2005).
52. He, X., Batchelor, T.T., Grossman, S. and Supko, J.G., Determination of procarbazine inhuman plasma by liquid chromatography with electrospray ionization mass spectrometry.J. Chromatogr. B, 799(2), 281–291 (2004).
53. Gjerde, J., Kisanga, E.R., Hauglid, M., Holm, P.I., Mellgren, G. and Lien, E.A., Identificationand quantification of tamoxifen and four metabolites in serum by liquid chromatography-tandem mass spectrometry. J. Chromatogr. A, 1082(1), 6–14 (2005).
54. White, S. and Wong, S.H.Y., Standards of laboratory practice: analgesic drug monitoring.Clin. Chem., 44(5), 1110–1123 (1988).
55. Batista, C., Berisha, M., Karst, M., Salim, K., Schneider, U. and Brenneisen, R., Determi-nation of ajulemic acid and its glucuronide in human plasma by gas chromatography-massspectrometry. J. Chromatogr. B, 820(1), 77–82 (2005).
56. Abe, R. and Alvarez, J.C., Sensitive quantification of apomorphine in human plasma using aLC-ESI-MS-MS method. Ther. Drug Monit., 28(3), 407–412 (2006).
57. Chen, Y.L., Hanson, G.D., Jiang, X. and Naidong, W., Simultaneous determination ofhydrocodone and hydromorphone in human plasma by liquid chromatography with tandemmass spectrometric detection. J. Chromatogr. B, 769(1), 55–64 (2002).

Therapeutic drug monitoring and measurement of drug concentrations 289
58. Scott, G., Rordorf, C., Reynolds, C., Kalbag, J., Looby, M., Milosavljev, S., Weaver, M.,Huff, J.P. and Ruff, D.A., Pharmacokinetics of lumiracoxib in plasma and synovial fluid.Clin. Pharmacokinet., 43(7), 467–478 (2004).
59. Fang, W.B., Andrenyak, D.M., Moody, D.E. and Nuwayser, E.S., Determination of nalmefeneby high-performance liquid chromatography-electrospray ionization-tandem mass spectrome-try. J. Anal. Toxicol., 29(3), 169–174 (2005).
60. Shang, E., Xiang, B., Liu, G., Xie, S., Wei, W. and Lu, J., Determination of phenazopyridinein human plasma via LC-MS and subsequent development of a pharmacokinetic model. Anal.Bioanal. Chem., 382(1), 216–222 (2005).
61. Miksa, I.R., Cummings, M.R. and Poppenga, R.H., Multi-residue determination of anti-inflammatory analgesics in sera by liquid chromatography–mass spectrometry. J. Anal.Toxicol., 29(2), 95–104 (2005).
62. Hori, Y., Fujisawa, M., Shimada, K., Hirose, Y. and Yoshioka, T., Method for screening andquantitative determination of serum levels of salicylic Acid, acetaminophen, theophylline,phenobarbital, bromvalerylurea, pentobarbital, and amobarbital using liquid chromatography/electrospray mass spectrometry. Biol. Pharm. Bull., 29(1), 7–13 (2006).
63. Vollenbroeker, B., Koch, J.H., Fobker, M., Suwelack, B., Hohage, H. and Muller, U.,Determination of cyclosporine and its metabolites in blood via HPLC-MS and correlation toclinically important parameters. Transplant. Proc., 37(4), 1741–1744 (2005).
64. Guddat, S., Thevis, M. and Schanzer, W., Identification and quantification of the plasma vol-ume expander dextran in human urine by liquid chromatography-tandem mass spectrometryof enzymatically derived isomaltose. Biomed. Chromatogr., 19(10), 743–750 (2005).
65. Sekera, M.H., Ahrens, B.D., Chang, Y.C., Starcevic, B., Georgakopoulos, C. and Catlin, D.H.,Another designer steroid: discovery, synthesis, and detection of ‘madol’ in urine. RapidCommun. Mass Spectrom., 19(6), 781–784 (2005).
66. Thevis, M., Thomas, A., Delahaut, P., Bosseloir, A. and Schanzer, W., Qualitative determina-tion of synthetic analogues of insulin in human plasma by immunoaffinity purification andliquid chromatography-tandem mass spectrometry for doping control purposes. Anal. Chem.,77(11), 3579–3585 (2005).
67. Heudi, O. and Fontannaz, P., Determination of vitamin B5 in human urine by high-performanceliquid chromatography coupled with mass spectrometry. J. Sep. Sci., 28(7), 669–672 (2005).
68. Tsugawa, N., Suhara, Y., Kamao, M. and Okano, T., Determination of 25-hydroxyvitamin Din human plasma using high-performance liquid chromatography–tandem mass spectrometry.Anal. Chem., 77(9), 3001–3007 (2005).
69. Suhara, Y., Kamao, M., Tsugawa, N. and Okano, T., Method for the determination of vitaminK homologues in human plasma using high-performance liquid chromatography-tandem massspectrometry. Anal. Chem., 77(3), 757–763 (2005).

This page intentionally left blank

Medical Applications of Mass SpectrometryK. Vékey, A. Telekes and A. Vertes (editors)© 2008 Elsevier B.V. All rights reserved
291
Chapter 14
Mass spectrometry of infectiouspathogens
PLAMEN A. DEMIREV*
Johns Hopkins University Applied Physics Laboratory, 11100 Johns Hopkins Road,MS 2-217, Laurel, MD 20723–6099, USA
1. Introduction 2911.1. Highlights for medical professionals 2931.2. Highlights for chemists 294
2. Methodology 2952.1. MALDI MS-based methods for Bacillus spore species characterization 2952.2. LD MS detection of Plasmodium parasites in blood 3012.3. Other MS-based methods for pathogen detection/identification 304
3. Future trends and prospects 305References 305
1. Introduction
It is estimated that a little over 1400 pathogen species (217 viruses, 538 bacteriaand Rickettsia, 307 fungi, 66 protozoa, and 287 helminths) are potential etiologi-cal sources for infectious diseases in humans [1]. Among these, more than 90% ofthe infectious disease mortality world-wide is caused by seven major illnesses: thefigures for 2002 are [2], in million: lower respiratory infections—3.9; HIV—2.8;diarrhea—1.6; tuberculosis—1.6; malaria—1.2; and measles—0.6. While it isobvious that a number of socio-economic and environmental factors (poverty,wars, climate, the emergence of drug-resistant pathogen strains, etc.) influencethese numbers significantly, particularly in the developing world, naturally occurring
*Tel.: 443-778-7712; Fax: 443-778-6905. E-mail: [email protected](P.A. Demirev).

292 P.A. Demirev
(or intentionally inflicted) infectious diseases are a major threat for the industri-alized countries as well. As a result of the rapidly accelerating trends of global-ization, infectious disease pandemics are projected to occur in the not too distantfuture since geographical and political boundaries offer but trivial impediments topathogen spread.
It is clear that the development of new and more efficient molecular-level diag-nostic tools would certainly improve our ability to fight much more efficiently bothcurrent and emerging infections [3]. Effective responses to emerging pathogensrequire enhanced capabilities for rapid and accurate microorganism detection andidentification, discovery of new drugs, finding reliable biomarkers for diseases,and/or creating new vaccines. In the post-genomic era, the emphasis in cellular andmolecular biology is being gradually shifted from DNA sequencing projects to large-scale efforts in identification of individual proteins, their 3D structures, expressionlevels, post-translational modifications, network relationships, and metabolismproducts. The two major components of such a holistic “systems biology” approachare proteomics and metabolomics, and mass spectrometry (MS) is the most promi-nent technology currently applied in both fields [4,5].
For more than three decades MS has been a major analytical tool for the char-acterization of diverse microorganisms in the laboratory [6,7]. MS, among otherspectroscopic methods like NMR, has been indispensable for structural elucida-tion of various classes of natural products, originating from microorganisms,e.g., cyclic peptide antibiotics. After the introduction of the soft ionization MStechniques—matrix-assisted laser desorption/ ionization (MALDI) and electro-spray ionization (ESI) [8–10]—a number of new MS applications in life sciencesand medicine have emerged. These soft ionization techniques (recognized by theNobel Prize in Chemistry in 2002) allowed for the first time the ionization andtransfer into vacuum of large (�30 kDa) intact non-volatile biomolecules, such asproteins. In a MALDI experiment, a low-mass photo-absorbing organic com-pound (matrix) is added to a sample prior to irradiation with nanosecond laserpulses to desorb high-mass biomolecular ions [9,10]. In ESI, large multiplycharged ions are generated by injecting the protein analyte solution through a cap-illary needle biased at high voltage (several kilovolts). Several stages of differen-tial pumping and suitable ion optics allow the interfacing of an ESI ion source,operating at atmospheric pressure (AP), with a mass spectrometer operating inhigh-vacuum conditions [8]. In the post-genomic era, MS approaches, combinedwith bioinformatics algorithms and genome databases, have been applied to ana-lyze the proteomes of a number of pathogens. A number of large-scale proteomicsstrategies for systems biology investigation of microorganisms involve multi-stage chromatography/fractionation and ESI and/or MALDI tandem MS, e.g.,Plasmodium falciparum [11,12], Bacillus anthracis [13], and the SARS virus[14,15] (for a recent collection of articles on proteomics of microbial pathogens,see ref. [16]).

Mass spectrometry of infectious pathogens 293
The current paradigm for rapid MS identifications of pathogens relies on thedetection and identification of unique biomarker molecules from experimentalmass spectra. This paradigm can be traced back to Anhalt and Fenselau [17], whodemonstrated that lower mass biomolecules from different pathogenic bacteria,introduced intact into a mass spectrometer, could be vaporized and ionized directlyby electron impact. Structural elucidation of the unique chemical biomarkers fromdifferent organisms has been achieved by MS [17]. Furthermore, the signaturecomposition and abundances allowed taxonomic distinctions between themicroorganisms to be made. In the following, current developments of this para-digm will be illustrated using various forms of laser desorption (LD) MS as amajor diagnosis and detection platform. In particular, MALDI MS for rapid iden-tification of intact Bacillus spore species, as well as LD MS for detection in bloodof Plasmodium parasites (the causative agent of malaria), will be discussed.
1.1. Highlights for medical professionals
The burden of infectious diseases to global health continues to increase. Effectivediagnosis of current or emerging infectious diseases requires enhanced capabili-ties for rapid and accurate pathogen characterization. Traditional approaches forpathogen diagnosis involve microorganism growth with all of its associateddrawbacks—slow, inadequate sensitivity, and non-viable cultures (sometimes dueto previous or concomitant anti-microbial therapy). Novel molecular-level tech-nologies are being developed for reliable detection and identification of bothnatural and bioengineered microorganisms with applications ranging fromscience and medicine to homeland security. MS is one such emerging biosensortechnology for diagnosis of infectious diseases with several practicaladvantages—speed, sensitivity, and specificity. MS is rapid: a typical experimentincluding sample collection and preparation takes minutes—in contrast to daysfor (often times retrospective) diagnosis via the classical microbiology methods.This is the major advantage of MS. It is also to be compared to other molecular-based pathogen diagnostic methods—e.g., antibody recognition (ELISA) or DNAdetection after PCR amplification—that take several hours to complete. MS isbroadband: upon appropriate sample preparation it can detect all types ofpathogens—viruses, vegetative bacteria and fungi and their spores, as well asparasitic protozoa. MS is sensitive: typically, a signal with a sufficientsignal/noise ratio can be generated from a sample, containing less than 104
organisms. MS can be interfaced to a variety of sample collection and sample pro-cessing modules to allow versatile sampling from different environments—fromaerosols to biofluids. MS can be automated and it is also computer-friendly: e.g.,latest developments in bioinformatics can be coupled to MS experimental data forrobust pathogen diagnosis. Furthermore, MS instruments can be miniaturized anddeployed in the field.

294 P.A. Demirev
The current paradigm in pathogen detection and identification by MS is basedon the fact that a mass spectrum of a microorganism contains masses of intactbiomarker molecules, uniquely characteristic for that organism. Such an experi-mental mass spectrum (mass/charge ratios of the various biomarker ions vs. theirabundances) forms a characteristic “fingerprint” signature of the respectivespecies. These signatures can be derived experimentally (e.g., by acquiring massspectra from a large number of microorganisms under a variety of conditions) ordeduced by bioinformatics means.
In what follows, the uses of MS for pathogen detection would be demonstratedin the examples of intact Bacillus spore species, as well as Plasmodiumparasites—the causative agent of malaria. The types of characteristic biomarkermolecules detected by MS for these two very different cases would be discussedas well as the factors influencing mass spectra of intact organisms.
1.2. Highlights for chemists
In the past decade two ionization methods—MALDI and ESI—have formed thebasis of the new MS. These methods have allowed for the first time the transfer oflarge (�30 kDa) intact non-volatile biomolecules, such as proteins, into vacuum.Thus, the molecular masses of individual large biomolecules could be determinedwith unprecedented accuracy by MS. In the post-genomic era, this new MS, com-bined with bioinformatics algorithms and genome databases, is the cornerstone ofproteomics: the field devoted to characterization of all expressed proteins in a cell.Furthermore, it has been demonstrated that the mass spectrum of an intact microor-ganism contains the masses of intact biomarker molecules, uniquely characteristicfor that organism: a mass spectral “fingerprint” signature. For pathogen identifica-tion by MS several major classes of biomarker molecules can be exploited: proteins(50% of the dry weight of an individual cell), DNA (one double-strand copy percell), RNA (0.01–1%), and polar and non-polar lipids (4–9%). The paradigmbehind the use of MS for pathogen detection and identification is the uniqueness ofthe MS biomarker signature of the respective species.
While ESI, combined with various mass analyses, is mainly used for large-scaleproteomics characterization of different pathogens, LD MS methods form thebasis for the use of MS as a biosensor platform for rapid microorganism detectionand identification. For instance, in a MALDI experiment a low-mass photo-absorbing organic compound (a matrix) is added to a sample, containing intactmicroorganisms (viruses, spores, vegetative bacterial cells) or a protein toxin. Thesolid sample/matrix surface is irradiated with UV (typically 337 nm) nanosecondlaser pulses. The photon–matrix molecule interactions induce rapid sample expan-sion and material ablation into a plume with well-defined aerodynamics charac-teristics. As a result of (predominantly) ion–molecule, ion–ion, and ion–electronreactions in the expanding plume, microorganism-specific biomarker ions are
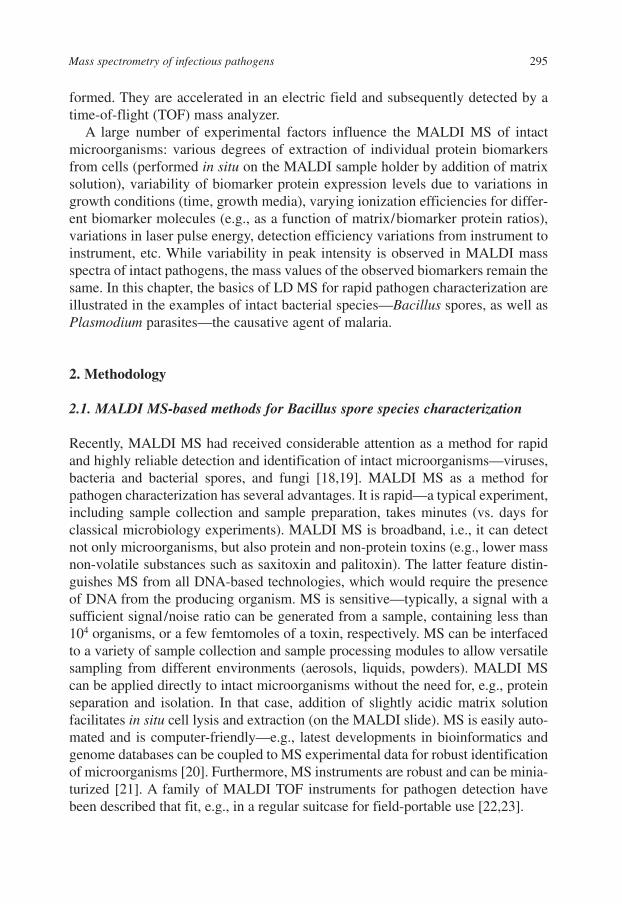
Mass spectrometry of infectious pathogens 295
formed. They are accelerated in an electric field and subsequently detected by atime-of-flight (TOF) mass analyzer.
A large number of experimental factors influence the MALDI MS of intactmicroorganisms: various degrees of extraction of individual protein biomarkersfrom cells (performed in situ on the MALDI sample holder by addition of matrixsolution), variability of biomarker protein expression levels due to variations ingrowth conditions (time, growth media), varying ionization efficiencies for differ-ent biomarker molecules (e.g., as a function of matrix/biomarker protein ratios),variations in laser pulse energy, detection efficiency variations from instrument toinstrument, etc. While variability in peak intensity is observed in MALDI massspectra of intact pathogens, the mass values of the observed biomarkers remain thesame. In this chapter, the basics of LD MS for rapid pathogen characterization areillustrated in the examples of intact bacterial species—Bacillus spores, as well asPlasmodium parasites—the causative agent of malaria.
2. Methodology
2.1. MALDI MS-based methods for Bacillus spore species characterization
Recently, MALDI MS had received considerable attention as a method for rapidand highly reliable detection and identification of intact microorganisms—viruses,bacteria and bacterial spores, and fungi [18,19]. MALDI MS as a method forpathogen characterization has several advantages. It is rapid—a typical experiment,including sample collection and sample preparation, takes minutes (vs. days forclassical microbiology experiments). MALDI MS is broadband, i.e., it can detectnot only microorganisms, but also protein and non-protein toxins (e.g., lower massnon-volatile substances such as saxitoxin and palitoxin). The latter feature distin-guishes MS from all DNA-based technologies, which would require the presenceof DNA from the producing organism. MS is sensitive—typically, a signal with asufficient signal/noise ratio can be generated from a sample, containing less than104 organisms, or a few femtomoles of a toxin, respectively. MS can be interfacedto a variety of sample collection and sample processing modules to allow versatilesampling from different environments (aerosols, liquids, powders). MALDI MScan be applied directly to intact microorganisms without the need for, e.g., proteinseparation and isolation. In that case, addition of slightly acidic matrix solutionfacilitates in situ cell lysis and extraction (on the MALDI slide). MS is easily auto-mated and is computer-friendly—e.g., latest developments in bioinformatics andgenome databases can be coupled to MS experimental data for robust identificationof microorganisms [20]. Furthermore, MS instruments are robust and can be minia-turized [21]. A family of MALDI TOF instruments for pathogen detection havebeen described that fit, e.g., in a regular suitcase for field-portable use [22,23].

296 P.A. Demirev
The paradigm for MALDI TOF MS of intact microorganism identification canbe illustrated in the example of two Bacillus spore species (Fig. 1): differentmicroorganisms give rise to different mass spectra. This is due to the presence ofdifferent expressed biomarker molecules in different organisms. In this case, thedifferences between the two spectra (due to different masses of the detectedbiomarker molecules) allow distinguishing between the two spore species. Thecharacteristic peaks in the respective mass spectra correspond to biomarkers fromdifferent classes of molecules. In MALDI MS, the typical classes employed fordifferentiation between microorganisms (in some instances after fractionation,clean-up, and additional sample preparation procedures) are: proteins (50% of dryweight) [18,19]; DNA (one copy per cell!) and RNA (0.01–1%) [24–26]; and var-ious polar lipids (4–9%) [7]. For the Bacillus spores (Fig. 1), �105 intact sporesare deposited from spore suspensions and mixed with a MALDI matrix/10% tri-fluoroacetic acid solution to extract a set of small (�70 amino acids) proteins withparticularly high abundance in dry spores [27,28]. It takes less than 10 min fromsuspension of the spores in, e.g., water, to obtaining the actual MALDI mass spec-tra shown. The amount of liquids used is less than 1 �l. It is of paramount impor-tance to be able to elucidate the nature of the observed biomarkers from intactmicroorganisms. The proteins detected here—small acid-soluble spore proteins(SASP)—have sequences that differ among different species and as a result theSASPs have different masses as evident in the mass spectra [20]. Another class ofbiomarkers with masses �1 kDa can be observed in the spectra of intact sporespecies as well (Fig. 1). These are lipopeptides, characteristic for specific sporespecies, and their structures have been elucidated by MS [18,29].
The observed protein biomarkers in MALDI mass spectra from intact bacteriaare typically highly expressed proteins with housekeeping functions, such as ribo-somal, chaperone, and translation/transcription factor proteins [20,30]. To achieveidentification, experimental MALDI mass spectra can be compared with a collec-tion of mass spectra of known organisms—MS fingerprints—compiled into areference biomarker signature library (Fig. 2a). However, the biomarker finger-prints detected by MALDI MS exhibit variations (e.g., different biomarkersobserved under different conditions) as a result of various factors—sample prepa-ration, instrumental parameters, microorganism biochemistry, and environmentalconditions, such as diverse biological backgrounds [18,19]. A large number ofspectra for each targeted microorganism need to be compiled in the library so thatthe “fingerprint” approach is effective. Standardized experimental protocols havebeen developed for methicillin-resistant Staphylococcus aureus in order to achievereliable and reproducible species-level identification and sub-typing from theMALDI MS fingerprint libraries. The effects of a number of parameters—incubation period, method of deposition of cell suspension, matrix solution con-centration and drying time, time between sample preparation and analysis, andMALDI TOF instrument parameters—have been examined in order to optimize
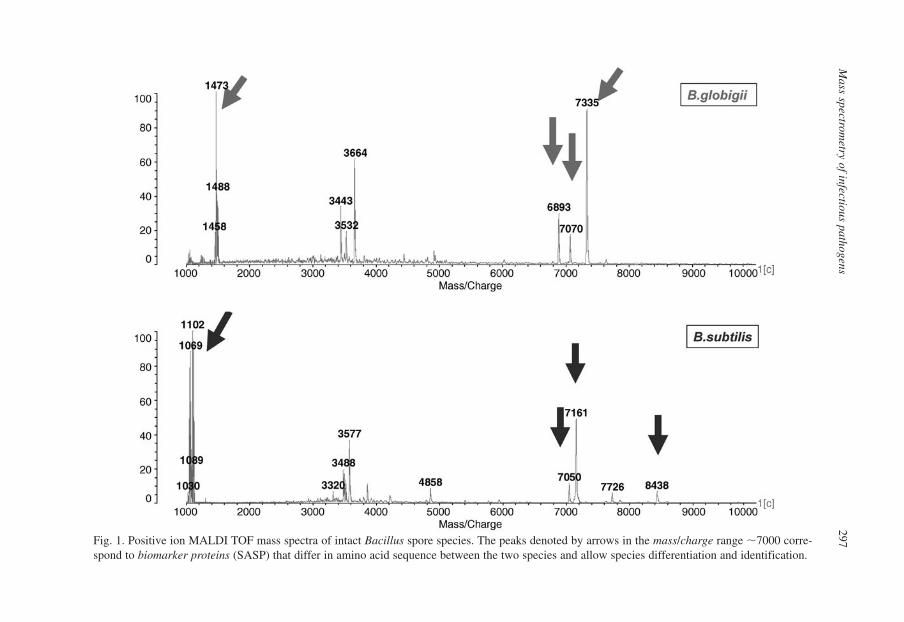
Mass spectrom
etry of infectious pathogens297Fig. 1. Positive ion MALDI TOF mass spectra of intact Bacillus spore species. The peaks denoted by arrows in the mass/charge range �7000 corre-
spond to biomarker proteins (SASP) that differ in amino acid sequence between the two species and allow species differentiation and identification.

298 P.A. Demirev
Fig. 2. MS methods for rapid microorganism identification: (a) fingerprint library matching of massspectra and (b) bioinformatics-based strategies. While the former rely on previously collected exper-imental mass spectra, the latter rely on in silico prediction of biomarker protein sequences from therespective genome sequences.

Mass spectrometry of infectious pathogens 299
the protocol [31]. In the case of continuous Escherichia coli cultures, maintainedin a bioreactor at specific growth rates and pH, the microorganism was correctlyidentified from the MALDI mass spectral library in all cases except for a biofilmsample collected from the reactor [32]. There are other practical limitations to thefingerprint library approach, e.g., no MS signature may be available at hand for anovel or a highly pathogenic organism.
An alternative bioinformatics-based strategy (Fig. 2b) for generation of proteinbiomarker signatures has been proposed [20,30,33–35]. The expected proteinbiomarkers for a microorganism that could be detected in a MALDI spectrum aredetermined from the masses of a subset of all of its potentially expressible proteins,which in turn are available once the respective organism’s genome is sequenced.There is no need to create experimental MS libraries in the bioinformatics-basedapproach, which is its major difference from the fingerprint approach. In bothapproaches, the experimental MS data are compared to expected masses (from ref-erence spectra in the traditional approach, derived from the genome in the newapproach) and the microorganism that provides the most statistically significantmatches is selected. Different sets of proteins can be expressed in a microorganismand experimentally observed by MS (depending on growth stage, growth medium,etc.). The masses of all these proteins can be independently derived in silico fromtheir amino acid sequences. The sequences of these proteins can be found inInternet-accessible proteome databases together with their organism sources, pro-vided the genome of the particular pathogen is known. Conditions and require-ments that secure the successful application of such a bioinformatics-basedapproach have been discussed [20,30,33–35]. These database conditions include:completeness—availability of the genome sequence for the particular pathogen,and fidelity—capability to predict /incorporate various post-translational modifica-tions [35]. Currently (mid-2006), there are more than 300 completely sequencedand publicly available bacterial genomes (The Institute for Genomic Research,www.tigr.org). The list includes all microbial pathogens on the CDC priority agentslist. The bioinformatics approach for microorganism identification has been suc-cessfully demonstrated in a blind study by constructing in silico a database of highlyexpressed proteins (e.g., ribosomal proteins) for more than 30 sequencedmicroorganisms [30]. The obtained results scale to a database of �1000 sequenceddifferent pathogenic organisms being successfully detected at 95% confidencelevel (Table 1).
The availability of genome information for a particular pathogen allows the adap-tation of bottom-up [36,37] or top-down [38–40] proteomics methodologies formicroorganism identification by MS [41–45] (Fig. 3). These proteomics-basedapproaches are based on the initial identification of one or more individual proteinbiomarkers (from, e.g., their corresponding tryptic peptides and/or tandem massspectra). By inference, the microorganism from which these proteins originate isthen identified. For instance, rapid in situ (on a MALDI sample slide) proteolysis of

300 P.A. Demirev
proteins, derived from intact viruses, can facilitate rapid virus identification [41].Proteolytic peptides from SASP biomarkers in various Bacillus spores have beenanalyzed by several different types of tandem mass spectrometers—a MALDI TOFMS with a curved-field ion reflectron [42], a hybrid ion trap/TOF mass spectrometer[43], or an AP MALDI ion trap instrument [44]. In all these instances, unambiguousspore species identification has been provided after SASP biomarkers wereidentified from the partial sequences of their proteolytic peptides, combined withproteome-based database queries using the MASCOT search engine.
The capability to identify an intact protein by deducing its partial amino acidsequence (a sequence tag) in a Fourier transform ion cyclotron resonance (FTICR)MS/MS experiment and subsequent homology search in a proteome database wasfirst demonstrated by Mortz et al. [38]. In analogy to bottom-up proteomics, unam-biguous identification of one or more intact protein biomarkers by top-downproteomics allows successful microorganism identification (provided the proteomedatabase contains both the respective protein sequences and the respective organismsources). Top-down proteomics approaches for Bacillus spore protein biomarkersand from there Bacillus species identification have been also described [27,45].For instance, biomarker proteins from Bacillus cereus T spores have been analyzed
Table 1
Microorganism identification using bioinformatics-derived signatures
Detection (%)
Ribosomes in Matrix
Organism mass range �-Cyano Synapinic acid
Bacillus subtilis 31 100 100Escherichia coli 30 100 100Pseudomonas 26 100 100aeruginosaHaemophilus 25 100 100influenzaeBacillus 20 60 100stearothermophilusBacillus halodurans 10 0 0Salmonella 7 0 0typhimuriumMicrococcus luteus 5 0 0Acinetobacter cloacoa 0 0 0
Source: Adapted with ACS permission from ref. [30].Note: In this case, only highly expressed ribosomal proteins are included in the in silico generatedbiomarker database. Results scale to a database of �1000 organisms at 95% confidence level ofidentification.
Mass spectrometry of infectious pathogens 301
Fig. 3. “Top-down” vs. “bottom-up” MS proteomics-based approaches for microorganism identification.
by high-resolution tandem FTICR MS [27]. Fragmentation-derived sequence tagsand BLAST sequence similarity searches in a proteome database identify the majorbiomarker protein, observed in MALDI MS of intact spores as a SASP. Followingindividual protein identification, the spore species itself could be unambiguouslyidentified [27]. MALDI TOF �TOF MS of whole (undigested) protein biomarkershas been described recently as a method for direct and rapid identification of indi-vidual Bacillus spore species, either pure or in a mixture [45] (Fig. 4). A majoradvantage of this method is that biomarker MS/MS spectra are obtained withoutthe need for biomarker pre-fractionation, digestion, separation, and cleanup.
2.2. LD MS detection of Plasmodium parasites in blood
Recently, a novel physical method for rapid and sensitive malaria detection inblood has been developed [46–50]. This method—ultraviolet LD MS—is basedon the detection of heme (iron protoporphyrin) in blood as a qualitative andquantitative malaria biomarker, both in vitro [46] and in vivo [49,50]. Ininfected erythrocytes, the parasite sequesters heme from digested hemoglobin ina molecular crystal (malaria pigment or hemozoin). LDMS detects only hemefrom hemozoin in parasite-infected blood, and not heme, bound to hemoglobin

302 P.A. Demirev
or other proteins in uninfected blood samples (Fig. 5). Formation of hemozoincrystals is a unique evolutionary feature of Plasmodium parasites. The parasitepresents a volume of high concentration of purified biomarker molecules,uniquely suited for sensitive and specific detection of malaria by LDMS. Thus,the parasite fractionates, purifies, and concentrates the biomarker molecule
Fig. 4. Top-down proteomics for spore identification from MALDI TOF/TOF mass spectra of bio-marker molecular ions: (top) precursor ion spectrum and (bottom) fragment ion spectrum. The inseton top represents the expanded region around the singly charged precursor ion at m/z 6712. Theresulting 68 fragment ions are matched against proteins in Swiss-Prot and the protein P0A4F4(SAS2_BACCR), originating from Bacillus cereus, is identified as the most plausible candidate(adapted with ACS permission from ref. [45]).
6000 7000 8000 90000
10
20
30
40
50
Precursor ion spectrum
6712
6834
7083
2000 3000 4000 5000 6000 7000
0
20
40
60
80
100
Fragment ion spectrum
mass/charge
6702 6704 6706 6708 6710 6712 6714 6716 6718 6720 67220
20
40
60
80
100
RP>12600
mass/charge
.ADAT.
y+30
y+47
.LDQM.
Rel
ativ
e in
ten
sity
[ar
b. u
nit
s]R
elat
ive
inte
nsi
ty [
arb
. un
its]

Mass spectrometry of infectious pathogens 303
(heme), in effect performing itself (rather than a researcher) the complex andtime-consuming sample preparation tasks required for detection of a biomarkerin MS-based proteomics! The LDMS detection of malaria requires only a dropof blood. The method is pan-malarial, i.e., all four Plasmodium species, infect-ing humans, are detected. In contrast to MALDI, external photo-absorbingmatrix does not need to be added to the sample. The heme molecule—a 22 �-electron conjugated protoporphyrin system—is an efficient photo-absorber inthe visible and near UV (with an absorption maximum near 400 nm). The hemephoto-physical properties, concurrently with its low ionization potential, war-rant that direct LDMS possesses extremely low limits for heme detection (lessthan 10 parasites per 1 �l blood can be detected). In LD, the heme molecular iondissociates in several structure-specific fragments, providing at least five addi-tional peaks for detection of the biomarker molecule. LDMS detection of hemeis quantitative, and heme signal tracks the number of parasites per unit volumeof blood. A simplified sample protocol requiring minimal handling combinedwith miniaturized LD TOF instruments can permit the large-scale deployment ofautomated screening systems for rapid and affordable malaria diagnosis in largepopulations.
Fig. 5. Positive ion LD TOF mass spectra: (top trace) blood sample from a patient infected withP. malariae parasites (to be published) and (bottom trace) control sample (uninfected blood). A com-mercial LD TOF system is used, and both spectra are normalized to the same detector responsevalue. Each trace represents the average of 100 single laser shot spectra, obtained from linear scan-ning of an individual sample well. The molecular ion (M� � at m/z 616) and several characteristic“fingerprint” fragment ions of desorbed heme are denoted in the upper trace.
400 500 600 700
0
20
40
60
80
100
mass/charge
No
rmal
ized
inte
nsi
ty
M+.571
557
498
526484

304 P.A. Demirev
2.3. Other MS-based methods for pathogen detection/identification
A combined laser fluorescence/laser ionization TOF mass spectrometer has beendeveloped recently as a tool to identify individual airborne, micrometer-sized par-ticles, comprised of a single cell or a small number of clumped cells [51,52]. Thetechnique, termed bioaerosol mass spectrometry (BAMS), has been evaluated forreal-time detection and identification of individual aerosolized Bacillus sporespecies [51] or Mycobacterium tuberculosis particles [52]. This approach isreagent-less, i.e., no sample preparation with the associated liquid handling isrequired. However, only lower mass (�m/z 200) positive and negative ions areablated and detected. In the reported studies, two Bacillus spore species have beendistinguished from one another and from other biological and abiological back-ground materials by BAMS with no false positives at a sensitivity of 92%. In addi-tion, the BAMS mass spectral signatures for aerosolized M. tuberculosis particlesare distinct from M. smegmatis, Bacillus atrophaeus, and B. cereus particles. In abackground-free environment, BAMS is capable of detecting M. tuberculosis atairborne concentrations of �1 particle/l. This technique is tested as a stand-aloneairborne M. tuberculosis detector in bioaerosols from an infected patient.
MALDI TOF MS has been also used for simultaneous detection of multiple targetmicroorganisms using bacteriophage amplification [53]. In this approach the targetpathogenic bacteria are infected with bacteria-specific bacteriophages (e.g., MS2 andMPSS-1 phages specific for E. coli and Salmonella spp., respectively). Proteins,indicative of the progeny phages, are detected and utilized as a secondary biomarkerfor the target pathogen. For instance, E. coli when mixed with both MS2 and MPSS-1produces only a MS2 biomarker protein (13.7 kDa). Mixing Salmonella spp. with bothphages results in detection of the biomarker (a protein at 13.5 kDa) characteristic ofMPSS-1. Amplification of both phages in a mixture of the two bacteria leads todetection of biomarkers characteristic for both MS2 and MPSS-1 (no deleteriouseffects on bacteriophage amplification have been observed).
An entirely different approach for biological warfare agent detection, combiningnucleic acid detection with MS, has been described recently [25,26]. In thisapproach, analysis of PCR-amplified variable regions of microbial genomes is per-formed by ESI MS. The approach is termed TIGER (Triangulation Identificationfor the Genetic Evaluation of Risks), and relies on “intelligent PCR primers” to tar-get broadly conserved regions that flank the variable genome regions. The samplepreparation procedure takes more than an hour. The masses of PCR products withlengths between 80 and 140 base pairs must be determined with accuracy betterthan 20 ppm (i.e., better than 0.35 Da for a 35 kDa molecule!). Such accuracyshould allow unambiguous assignment of the base composition of the amplifiedregions, which unequivocally determine the microorganism based on comparisonwith available genome sequences. The sample for analysis by this method canoriginate from air filtration devices, clinical samples, or other sources. Examples

Mass spectrometry of infectious pathogens 305
illustrating the TIGER approach include B. anthracis, DNA-genome viruses fromthe Poxviridae family (whose members include the smallpox virus), and RNA-genome viruses (e.g., alphaviruses) [25]. In another application, a high-throughputand high-resolution genotyping and relative quantification of pathogenic bacteriafrom complex mixtures in respiratory samples has been performed [26]. High con-centrations of several respiratory pathogens (Haemophilus influenzae, Neisseriameningitidis, and Streptococcus pyogenes) have been revealed confirming thepolymicrobial nature of respiratory disease epidemics. Although appealing, so farthe TIGER approach has been demonstrated only on FTICR mass spectrometerwith a superconducting magnet—a device that can be utilized only in specializedlaboratory conditions. Furthermore, PCR—a necessary step in this approach—istime-consuming and sensitive to contaminants.
3. Future trends and prospects
The transformation of MS into a viable tool for biomedical diagnostics has been along-standing goal of mass spectrometrists [54]. Current developments in MALDIand LD MS for pathogen detection may bring us closer to that goal. Recent instru-mental developments have demonstrated the capability of building small field-portable and inexpensive LD mass spectrometers. Additional work is certainlyneeded in order to develop simplified sample protocols for detection of a particularpathogen infection in bodily fluids, e.g., blood, urine, saliva, etc. To facilitate large-scale rapid and affordable screening and diagnosis for infectious pathogens in largepopulations, these protocols would require minimal sample preparation and han-dling. Validation of pathogen-specific disease biomarkers (both in vivo and ex vivo)by modern MS proteomics technologies is another obvious avenue for research tobe pursued. Miniaturized multi-array LD TOF MS instruments and advanced signalprocessing can be implemented in a laboratory setting for screening of samples todetect the presence of infectious pathogens like Plasmodium. MS devices can befurther incorporated into a framework of multi-tiered technologies for pathogendetection. In the future, such a framework will merge various molecular-levelsensor platforms, e.g., MS, lab-on-a-chip (microfluidics) devices, DNA and proteinmicroarrays, and computer bioinformatics algorithms for rapid and automatedinfectious pathogen diagnosis at point-of-care facilities.
References
1. Taylor, L.H., Latham, S.M. and Woolhouse, M.E.J., Risk factors for human diseaseemergence. Philos. Trans. R. Soc. Lond. B, 356, 983–989 (2001).
2. WHO, World Health Report 2002, 2004.

306 P.A. Demirev
3. Holland, C.A. and Kiechle, F.L., Point-of-care molecular diagnostic systems—past, presentand future. Curr. Opin. Microbiol., 8, 504–509 (2005).
4. Washburn, M.P., Wolters, D. and Yates, J.R., Large-scale analysis of the yeast proteome bymultidimensional protein identification technology. Nat. Biotechnol., 19, 242–247 (2001).
5. Aebersold, R. and Mann, M., Mass spectrometry-based proteomics. Nature, 422, 198–207(2003).
6. Odham, G., Larsson, L. and Mardh, P.-A. (Eds.), Gas Chromatography–Mass Spectrometry:Applications in Microbiology. Plenum Press, New York, 1984.
7. Fenselau, C. (Ed.), Mass Spectrometry for the Characterization of Microorganisms. AmericanChemical Society, Washington DC, May 1994.
8. Fenn, J.B., Mann, M., Meng, C.K., Wong, S.F. and Whitehouse, C.M., Electrospray ionizationfor mass-spectrometry of large biomolecules. Science, 246, 64–71 (1989).
9. Karas, M. and Hillenkamp, F., Laser desorption ionization of proteins with molecular massesexceeding 10,000 Daltons. Anal. Chem., 60(20), 2299–2301 (1988).
10. Tanaka, K., The origin of macromolecule ionization by laser irradiation. Angew. Chem.-Int.Ed., 42, 3860–3870 (2003) (Nobel lecture).
11. Lasonder, E., Ishihama, Y., Andersen, J.S., Vermunt, A.M.W., Pain, A., Sauerwein, R.W., Eling,W.M.C., Hall, N., Waters, A.P., Stunnenberg, H.G. and Mann, M., Analysis of the Plasmodiumfalciparum proteome by high-accuracy mass spectrometry. Nature, 419, 537–542 (2002).
12. Florens, L., Washburn, M.P., Raine, J.D., Anthony, R.M., Grainger, M., Haynes, J.D., Moch,J.K., Muster, N., Sacci, J.B., Tabb, D.L., Witney, A.A., Wolters, D., Wu, Y.M., Gardner, M.J.,Holder, A.A., Sinden, R.E., Yates, J.R. and Carucci, D.J., A proteomic view of the Plasmodiumfalciparum life cycle. Nature, 419, 520–526 (2002).
13. Francis, A.W., Ruggiero, C.E., Koppisch, A.T., Dong, J.G., Song, J., Brettin, T. and Iyer, S.,Proteomic analysis of Bacillus anthracis Sterne vegetative cells. Biochim. Biophys. Acta-Proteins Proteomic., 1748, 191–200 (2005).
14. Krokhin, O., Li, Y., Andonov, A., Feldmann, H., Flick, R., Jones, S., Stroeher, U., Bastien, N.,Dasuri, K.V.N., Cheng, K.D., Simonsen, J.N., Perreault, H., Wilkins, J., Ens, W., Plummer, F.and Standing, K.G., Mass spectrometric characterization of proteins from the SARS virus.Mol. Cell. Proteomic., 2, 346–356 (2003).
15. Tan, Y.J., Lim, S.G. and Hong, W.J., Characterization of viral proteins encoded by the SARS-coronavirus genome. Antiviral Res., 65, 69–78 (2005).
16. Peter, R.J. and Michael, H. (Eds.), Proteomics of microbial pathogens. Proteomics, 4(10),2829–3106 (2004) (special issue).
17. Anhalt, J.P. and Fenselau, C., Identification of bacteria using mass spectrometry. Anal. Chem.,47, 219–225 (1975).
18. Fenselau, C. and Demirev, P., Characterization of intact microorganisms by MALDI massspectrometry. Mass Spectrom. Rev., 20, 157–171 (2001).
19. Lay, J., MALDI-TOF mass spectrometry of bacteria. Mass Spectrom. Rev., 20, 172–194 (2001).20. Demirev, P.A., Feldman, A.B. and Lin, J.S., Bioinformatics-based strategies for rapid
microorganism identification by mass spectrometry. Johns Hopkins APL Tech. Digest, 25,27–37 (2004).
21. Graham Cooks, R. and Badman, E.R., Miniature mass analyzers. J. Mass Spectrom., 35,659–671 (2000).
22. Bryden, W.A., Benson, R.C., Ecelberger, S.A., Phillips, T.E., Cotter, R.J. and Fenselau, C.,The tiny-TOF mass-spectrometer for chemical and biological sensing. Johns Hopkins APLTech. Digest, 16, 296–310 (1995).
23. Cornish, T.J., Antoine, M.D., Ecelberger, S.A. and Demirev, P.A., Arrayed time-of-flight massspectrometry for time-critical detection of hazardous agents. Anal. Chem., 77, 3954–3959(2005).

Mass spectrometry of infectious pathogens 307
24. von Wintzingerode, F., Bocker, S., Schlotelburg, C., Chiu, N.H.L., Storm, N., Jurinke, C.,Cantor, C.R., Gobel, U.B. and van den Boom, D., Base-specific fragmentation of amplified16S rRNA genes analyzed by mass spectrometry: a tool for rapid bacterial identification.Proc. Natl. Acad. Sci. U.S.A., 99, 7039–7044 (2002).
25. Hofstadler, S.A., Sampath, R., Blyn, L.B., Eshoo, M.W., Hall, T.A., Jiang, Y., Drader, J.J.,Hannis, J.C., Sannes-Lowery, K.A., Cummins, L.L., Libby, B., Walcott, D.J., Schink, A.,Massire, C., Ranken, R., Gutierrez, J., Manalili, S., Ivy, C., Melton, R., Levene, H., Barrett-Wilt, G., Li, F., Zapp, V., White, N., Samant, V., McNeil, J.A., Knize, D., Robbins, D.,Rudnick, K., Desai, A., Moradi, E. and Ecker, D.J., TIGER: the universal biosensor. Int.J. Mass Spectrom., 242, 23–41 (2005).
26. Ecker, D.J., Sampath, R., Blyn, L.B., Eshoo, M.W., Ivy, C., Ecker, J.A., Libby, B., Samant, V.,Sannes-Lowery, K.A., Melton, R.E., Russell, K., Freed, N., Barrozo, C., Wu, J.G., Rudnick, K.,Desai, A., Moradi, E., Knize, D.J., Robbins, D.W., Hannis, J.C., Harrell, P.M., Massire, C.,Hall, T.A., Jiang, Y., Ranken, R., Drader, J.J., White, N., McNeil, J.A., Crooke, S.T. andHofstadler, S.A., Rapid identification and strain-typing of respiratory pathogens for epidemicsurveillance. Proc. Natl. Acad. Sci. U.S.A., 102, 8012–8017 (2005).
27. Demirev, P., Ramirez, J. and Fenselau, C., Tandem mass spectrometry of intact proteins for char-acterization of biomarkers from Bacillus cereus T spores. Anal. Chem., 73, 5725–5731 (2001).
28. Hathout, Y., Setlow, B., Cabrera-Martinez, R.M., Fenselau, C. and Setlow P., Small, acid-soluble proteins as biomarkers in mass spectrometry analysis of Bacillus spores. Appl.Environ. Microbiol., 69, 1100–1107 (2003).
29. Hathout, Y., Ho, Y.P., Ryzhov, V., Demirev, P. and Fenselau, C., Kurstakins: A new class oflipopeptides isolated from Bacillus thuringiensis. J. Nat. Prod., 63, 1492–1496 (2000).
30. Pineda, F., Antoine, M., Demirev, P., Feldman, A., Jackman, J., Longenecker, M. and Lin, J.,Microorganism identification by matrix-assisted laser/desorption ionization mass spectrome-try and model-derived ribosomal protein biomarkers. Anal. Chem., 75, 3817–3822 (2003).
31. Jackson, K.A., Edwards-Jones, V., Sutton, C.W. and Fox, A.J., Optimisation of intact cellMALDI method for fingerprinting of methicillin-resistant Staphylococcus aureus.J. Microbiol. Methods, 62, 273–284 (2005).
32. Wunschel, D.S., Hill, E.A., McLean, J.S., Jarman, K., Gorby, Y.A., Valentine, N. and Wahl, K.,Effects of varied pH, growth rate and temperature using controlled fermentation and batch cul-ture on matrix assisted laser desorption/ionization whole cell protein fingerprints.J. Microbiol. Methods, 62, 259–271 (2005).
33. Demirev, P.A., Ho, Y.P., Ryzhov, V. and Fenselau, C., Microorganism identification by massspectrometry and protein database searches. Anal. Chem., 71, 2732–2738 (1999).
34. Pineda, F., Lin, J.S., Fenselau, C. and Demirev, P., Testing the significance of microorganismidentification by mass spectrometry and proteome database search. Anal. Chem., 72,3739–3744 (2000).
35. Demirev, P., Lin, J., Pineda, F. and Fenselau, C., Bioinformatics and mass spectrometry formicroorganism identification: Proteome-wide post-translational modifications and databasesearch algorithms for characterization of intact H. pylori. Anal. Chem., 73, 4566–4573 (2001).
36. Ho, Y., Gruhler, A., Heilbut, A., Bader, G.D., Moore, L., Adams, S.L., Millar, A., Taylor, P.,Bennett, K., Boutilier, K., Yang, L.Y., Wolting, C., Donaldson, I., Schandorff, S., Shewnarane,J., Vo, M., Taggart, J., Goudreault, M., Muskat, B., Alfarano, C., Dewar, D., Lin, Z.,Michalickova, K., Willems, A.R., Sassi, H., Nielsen, P.A., Rasmussen, K.J., Andersen, J.R.,Johansen, L.E., Hansen, L.H., Jespersen, H., Podtelejnikov, A., Nielsen, E., Crawford, J.,Poulsen, V., Sorensen, B.D., Matthiesen, J., Hendrickson, R.C., Gleeson, F., Pawson, T.,Moran, M.F., Durocher, D., Mann, M., Hogue, C.W.V., Figeys, D. and Tyers, M., Systematicidentification of protein complexes in Saccharomyces cerevisiae by mass spectrometry.Nature, 415, 180–183 (2002).

308 P.A. Demirev
37. Bogdanov, B. and Smith, R.D., Proteomics by FTICR mass spectrometry: top down andbottom up. Mass Spectrom. Rev., 24, 168–200 (2005).
38. Mortz, E., O’Connor, P., Roepstorff, P., Kelleher, N., Wood, T., McLafferty, F.W. andMann, M., Sequence tag identification of intact proteins by matching tandem mass spectraldata against sequence data bases. Proc. Natl. Acad. Sci. U.S.A., 93, 8264–8267 (1996).
39. Kelleher, N.L., Lin, H.Y., Valaskovic, G.A.,Aaserud, D.J., Fridriksson, E.K. and McLafferty, F.W.,Top down versus bottom up protein characterization by tandem high-resolution mass spec-trometry. J. Am. Chem. Soc., 121, 806–812 (1999).
40. Cargile, B.J., McLuckey, S.A. and Stephenson, J.L., Identification of bacteriophage MS2 coatprotein from E. coli lysates via ion trap collisional activation of intact protein ions. Anal.Chem., 73, 1277–1285 (2001).
41. Yao, Z., Demirev, P. and Fenselau, C., Mass spectrometry-based proteolytic mapping for rapidvirus identification. Anal. Chem., 74, 2529–2534 (2002).
42. Warscheid, B. and Fenselau, C., Characterization of Bacillus spore species and their mixturesusing postsource decay with a curved-field reflectron. Anal. Chem., 75, 5618–5627 (2003).
43. Warscheid, B., Jackson, K., Sutton, C. and Fenselau, C., MALDI analysis of Bacilli in sporemixtures by applying a quadrupole ion trap time-of-flight tandem mass spectrometer. Anal.Chem., 75, 5608–5617 (2003).
44. Pribil, P.A., Patton, E., Black, G., Doroshenko, V. and Fenselau, C., Rapid characterization ofBacillus spores targeting species-unique peptides produced with an atmospheric pressurematrix-assisted laser desorption/ionization source. J. Mass Spectrom., 40, 464–474 (2005).
45. Demirev, P., Feldman, A., Kowalski, P. and Lin, J., Top-down proteomics for rapid identifica-tion of intact microorganisms. Anal. Chem., 77, 7455–7461 (2005).
46. Demirev, P.A., Feldman, A.B., Kongkasuriyachai, D., Scholl, P., Sullivan Jr., D. and Kumar, N.,Detection of malaria parasites by laser desorption mass spectrometry. Anal. Chem., 74,3262–3266 (2002).
47. Demirev, P.A., Studies of malaria by mass spectrometry. In: Wilkins, Ch. and Lay, J. (Eds.),Identification of Microorganisms by MS. Wiley-Interscience, Hoboken, New Jersey, 2005,pp. 161–180.
48. Demirev, P.A., Mass spectrometry for malaria diagnosis. Exp. Rev. Mol. Diagn., 4, 821–829(2004).
49. Scholl, P., Kongkasuriyachai, D., Demirev, P.A., Feldman,A., Lin, J., Sullivan, D. and Kumar, N.,Rapid detection of malaria infection in vivo by laser desorption mass spectrometry. Am. J.Trop. Med. Hyg., 71, 546–551 (2004).
50. Nyunt, M., Pisciotta, J., Feldman, A., Thuma, Ph., Scholl, P., Demirev, P., Lin, J., Shi, L.,Kumar, N. and Sullivan, D., Detection of Plasmodium falciparum in pregnancy by laserdesorption mass spectrometry. Am. J. Trop. Med. Hyg., 73, 485–490 (2005).
51. Fergenson, D.P., Pitesky, M.E., Tobias, H.J., Steele, P.T., Czerwieniec, G.A., Russell, S.C.,Lebrilla, C.B., Horn, J.M., Coffee, K.R., Srivastava, A., Pillai, S.P., Shih, M.T.P., Hall, H.L.,Ramponi, A.J., Chang, J.T., Langlois, R.G., Estacio, P.L., Hadley, R.T., Frank, M. andGard, E.E., Reagentless detection and classification of individual bioaerosol particles inseconds. Anal. Chem., 76, 373–378 (2004).
52. Tobias, H.J., Schafer, M.P., Pitesky, M., Fergenson, D.P., Horn, J., Frank, M. and Gard, E.E.,Bioaerosol mass spectrometry for rapid detection of individual airborne Mycobacteriumtuberculosis H37Ra particles. Appl. Environ. Microbiol., 71, 6086–6095 (2005).
53. Rees, J.C. and Voorhees, K.J., Simultaneous detection of two bacterial pathogens using bacte-riophage amplification coupled with matrix-assisted laser desorption/ionization time-of-flightmass spectrometry. Rapid Commun. Mass Spectrom., 19, 2757–2761 (2005).
54. Mann, M., Mass tool for diagnosis. Nature, 418, 731–732 (2002).

Medical Applications of Mass SpectrometryK. Vékey, A. Telekes and A. Vertes (editors)© 2008 Elsevier B.V. All rights reserved
309
Chapter 15
Proteomics of viruses
ANNE PUMFERYa, REEM BERROa, and FATAH KASHANCHIa,b,*
aDepartment of Biochemistry and Molecular Biology, The George Washington University,Washington, DC 20037, USAbThe Institute for Genomic Research, Rockville, MD 20850, USA
1. Introduction 3101.1. Highlights for medical professionals 3101.2. Highlights for chemists 314
2. Virus–host interactions 3172.1. Proteomics of herpesvirus virions 3182.2. Proteomics of Epstein–Barr virus 3192.3. Proteomics of herpes simplex virus 3212.4. Proteomics of retroviruses—HIV and HTLV 3222.5. Proteomics of hepatitis C virus and hepatocellular carcinoma 324
3. Diagnostics 3253.1. 2DE-MS: SARS, HBV, HCV, and HIV-1 3253.2. LC–MS: HIV-1 and HCV 3273.3. SELDI ProteinChip: SARS, HIV, and hepatitis 3283.4. Protein microarray: vaccinia virus 330
4. Discussion 3315. Future trends 3346. Conclusions 335Acknowledgments 336References 336
*Corresponding author. Address: Department of Biochemistry and Molecular Biology,The George Washington University, Washington, DC 20037, USA. Tel.: 202-994-1782; Fax: �1-202-994-1780. E-mail: [email protected].

310 A. Pumfery et al.
1. Introduction
The term “proteome” was first coined in late 1994 by Marc Wilkins at the Sienatwo-dimensional gel electrophoresis (2DE) meeting and defines the entire proteincomplement in a given cell, tissue, or organism [1]. In its wider sense, proteomicsresearch also assesses protein activities, modifications and localization, and inter-actions of proteins in complexes. It relies heavily on technology since it needs toidentify proteins and protein complexes in biological samples comprehensivelyand quantitatively with both high sensitivity and fidelity.
Proteomics is a promising approach for the study of viruses. It allows a betterunderstanding of disease processes and the development of new biomarkers fordiagnosis and early detection of disease, and accelerates drug development. Areasof proteomics that are particularly promising include the determination of alteredprotein expression, not only at the whole-cell or tissue level, but also in subcellularstructures and biological fluids; the development of novel biomarkers for diagnosisand early detection of disease; and the identification of new targets for therapeuticsand the potential for accelerating drug development through more effective strate-gies to evaluate therapeutic effect and toxicity.
There is a growing interest in applying proteomics to the study of infectiousdisease. A complicating factor in therapy for infectious disease is the developmentof resistance to commonly used drugs, which heightens the need for developingeffective new therapies. The availability of the complete sequences of a number ofviruses has provided a framework for identifying proteins encoded in thesegenomes using mass spectrometry (MS). Applying proteomics to the study ofviruses allows the characterization of subviral proteomes (e.g., secreted proteins,surface proteins, and immunogenic proteins), the comparative analysis of differentstains or physiological states, the identification of proteins related to pathogenic-ity and host–pathogen interactions, and the evaluation of mechanisms of action ofantiviral therapies.
1.1. Highlights for medical professionals
Viral infections cause significant morbidity and disease including cancer, immuno-suppression, and death. Often infections are not diagnosed until symptoms appearand, in several cases, this may be years or decades after the initial infection. Theability to diagnose infection or cancer before the appearance of symptoms wouldbe of critical importance for effective treatment. Proteomic analysis of serum hasbeen proposed as a means of diagnosing infectious disease and/or the early diag-nosis of cancer. There have been some recent exciting findings in the proteomics ofthe host or pathogen, and the use of standard mass spectrometric technologies hasenabled many physicians and scientists to examine more closely the pathologicaland biological questions that can only be answered using proteomic approaches.

Proteomics of viruses 311
Therefore, in this chapter we will discuss some recent findings on the proteomicsof DNA and RNA viral infections that are associated with clinically importantdiseases in humans, including human cytomegalovirus (HCMV), herpes simplexvirus (HSV), Epstein–Barr virus (EBV), human immunodeficiency virus (HIV),hepatitis B and C (HBV and HCV, respectively), and adenovirus, as well as thecoronavirus that causes severe acute respiratory syndrome (SARS).
HCMV is the largest member of the human herpesviruses. After initial infection,HCMV remains in a persistent state with the host [2]. Immunity against the viruscontrols replication, although intermittent viral shedding can still take place in theseropositive immunocompetent person [2]. As replication of cytomegalovirus inthe absence of an effective immune response is central to the pathogenesis ofdisease, complications are primarily seen in individuals whose immune system isimmature or suppressed by drug treatment or coinfection with other pathogens [3].Estimates of the coding capacity of HCMV range from 160 open reading frames(ORFs) to more than 200 ORFs [4]. Recent studies using MS to determine the viralproteome suggest that the number of viral proteins may be even greater thanprevious estimates [5]. Analysis of proteins from purified HCMV virion prepara-tions has indicated that the particle contains significantly more viral proteins thanthe previously known 71 HCMV virion proteins. Twelve of the identified proteinswere encoded by known viral ORFs previously not associated with virions, and 12proteins were from novel viral ORFs [6]. Therefore, new protein markers includingHCMV tegument and various cellular structural proteins, enzymes, and chaperonesare now serving as biomarkers for HCMV infection and as possible drug targets.
Other herpesvirus members have also been explored for the presence of possi-ble biomarkers. EBV is a ubiquitous member of the herpesvirus family that isassociated with a variety of lymphomas and lymphoproliferative diseases [7]. Itencodes a multitude of genes that drive proliferation or confer resistance to celldeath [8]. Infection of human B lymphocytes with EBV induces proliferative B-lymphoblastoid cell lines (LCLs). Recently, proteomic profiles of three LCLswere analyzed comparatively at the early and the late passages of cell culture. Thephosphoprotein stathmin was identified, and expression significantly decreasedwith immortalization of LCLs [9]. Stathmin is critically important not only for theformation of a normal mitotic spindle upon entry into mitosis but also for the reg-ulation of the function of the mitotic spindle in the later stages of mitosis and forthe timely exit from mitosis [9]. In another study using standard matrix-assistedlaser desorption/ionization time-of-flight (MALDI-TOF) methods, 20 EBNA2 targetproteins were identified, 11 of which were c-myc dependent and therefore mostprobably associated with proliferation of the host cell [10]. These findings furtherstress the role of EBV viral proteins, namely EBNA and LMP, in disease pathogen-esis. Interestingly, when EBV-infected cells were treated with the drug 5�-azacytidine(AZC)—a demethylating agent that induces the expression of silenced genes,i.e., the p16 tumor suppressor gene—21 polypeptides were down-regulated, while

312 A. Pumfery et al.
14 showed increased expression. Many of the induced proteins were involvedin energy metabolism, organization of cytoskeletal structures, protein synthesis,or cell viability [11]. Therefore, the effect of drugs that activate silenced tumorsuppressor genes and their proteomic profile following treatment is of considerableinterest.
Finally, an important herpesvirus to consider is HSV. HSV types 1 and 2 areubiquitous viruses that cause infections in human populations throughout theworld. The clinical manifestations of HSV infections are varied, ranging fromasymptomatic to life-threatening illness in neonates and immunocompromisedhosts [12,13]. HSV-1 infection induces severe alterations of the host translationalapparatus, including the phosphorylation of a few ribosomal proteins and the pro-gressive association of several nonribosomal proteins to ribosomes [14–16]. Usinga proteomics approach, it was shown that VP19C, VP26, and ICP27 associated withribosomal proteins [17]. Specifically, immediate early ICP27 protein associated withthe cellular translation initiation factor poly A binding protein (PABP), eukaryoticinitiation factor 3 (eIF3), and eukaryotic initiation factor 4G (eIF4G) in infectedcells, resulting in the stimulation of translation of certain viral mRNAs and inhibit-ing host mRNA translation [18]. Another study has shown that approximately50 cellular and viral proteins associate with the HSV-1 ICP8 single-stranded DNA-binding protein, some of which belong to DNA repair and chromatin familymembers [19], implying that HSV-1 infection results in control of host cellularDNA replication/repair and gene expression machineries.
Proteomic analyses of RNA viruses with regard to diagnosis and novel bio-marker detection are also of considerable interest in the medical community. Forinstance, SARS is a new infectious disease that first emerged in the Guangdongprovince, China, in November 2002 [20]. A novel coronavirus was later identifiedin patients with SARS. The detection of the virus in these patients, its absence inhealthy controls or other patients with atypical pneumonia, and the reproductionof a similar disease in a relevant animal model indicated that this coronavirus wasthe causative agent of SARS (SARS-CoV) [21]. Interestingly, the full genomesequence was determined within weeks of the identification of the virus, but the pro-teome and biomarkers associated with SARS are slowly forthcoming. In a recentstudy using a mass spectrometric decision tree classification algorithm, Kang et al.identified four biomarkers determined in the training set that could preciselydetect 36 of 37 (sensitivity, 97.3%) acute SARS and 987 of 993 (specificity, 99.4%)non-SARS samples [22]. A reasonably complete proteomic analysis was also per-formed on four patients with SARS at different times of infection, and a total of38 differential spots were selected for protein identification. Most of the proteinsidentified were acute phase proteins, and their presence represented the conse-quence of a serial cascade of inflammatory reactions initiated by SARS-CoVinfection. Of significance was the level of plasma peroxiredoxin II in patients withSARS, which was significantly higher in SARS patients and could be secreted by

Proteomics of viruses 313
T cells [23]. Finally, while pursuing new enzyme targets, another study identified14 putative ORFs, 12 of which were predicted to be expressed from a nested setof eight subgenomic mRNAs. Distant homologs of cellular RNA processingenzymes were identified in group 2 coronaviruses, with four of them being con-served in SARS-CoV. These newly recognized viral enzymes put the mechanismof coronavirus RNA synthesis in a completely new perspective, which has openedthe door for new drug targets for the treatment of SARS [24].
The proteomes of three other RNA viruses including HCV, HBV, and HIV-1have also been studied. Hepatitis C often progresses to chronic infection in themajority of patients and is an emerging cause of viral hepatitis. Clinically, theinfection is generally asymptomatic, but may present with a wide variety of symp-toms. Cirrhosis, hepatocellular carcinoma (HCC), cryoglobulinemia, autoantibod-ies, and glomerulonephritis have been strongly associated with HCV infection[25]. When analyzing proteins that interacted with the HCV protein NS5A, Choiet al. found that the cytoplasmic heat shock protein 27 (HSP27) bound to NS5Awas concentrated in the ER [26], where drugs for HCV treatment would have easyaccess (as opposed to drugs delivered into the nucleus). Chronic infection withHBV is associated with the majority of HCC. Using woodchucks as a modelsystem, HCC induced dramatically higher levels of serum-associated core alpha-1,6-linked fucose, as compared with woodchucks without HCC. The couplingof this model system with 2D gel electrophoresis has permitted the identificationof several glycoproteins with altered glycosylation as correlated to cancer prog-nosis. One such glycoprotein, the golgi protein 73 (GP73), was found to beelevated and hyperfucosylated in animals with HCC [27]. Finally, in an effort toidentify useful biomarkers for HBV- or HCV-associated HCC, 60 proteins wereidentified which exhibited significant changes in expression between nontum-orous and tumorous tissues. Among these, 14 proteins were commonly changed inall three of the HCC types, but 46 proteins showed a tendency toward viral markerspecificity, suggesting that the pathogenic mechanisms of hepatocarcinogenesismay be different according to the viral etiology of HBV or HCV [28].
Diagnosis and treatment strategies for HCV have become extremely importantas one-third of HIV-infected individuals in Europe and the USA are coinfectedwith HCV [29]. Therefore, defining biomarkers in coinfections after highly activeantiretroviral therapy (HAART) is currently the focus of many laboratories. HIVaccelerates HCV liver disease especially with the progression of HIV-associatedimmunodeficiency. With the introduction of pegylated interferon in combinationwith ribavirin, greatly improved treatment options for patients coinfected withHIV and HCV have become available and have led to sustained virologicalresponse rates of up to 40% [30]. Furthermore, recent cohort analyses have shownthat immune reconstitution induced by HAART can improve the course of hepati-tis C infection leading to a decline in liver-related mortality. However, patientswith HCV coinfection are at increased risk of hepatotoxicity from HAART [29].

314 A. Pumfery et al.
Owing to the high rates of HIV and HCV coinfections worldwide, new improvedbiomarkers and treatment strategies and guidelines for the management of coin-fection remain a major goal. Biomarkers could include protein fingerprints ofHIV-1-infected human monocyte-derived macrophages (MDMs) after viralinfection, as well as HCV-infected liver cells. Recently, 58 proteins have alreadybeen identified to be up- or down-regulated after HIV-1 infection [31].
1.2. Highlights for chemists
The overall awareness of the importance of proteins and peptides in physiology andpathophysiology has increased dramatically over the last few years. With progressin the analysis of whole genomes, the knowledge base in gene sequence andexpression data, useful for protein and peptide analysis, has increased considerably.Therefore, the medical need for relevant biomarkers is enormous. This is particu-larly true for many viral infections and various types of cancer, where there is a lackof useful and adequate diagnostic markers with high specificity and sensitivity.
However, proteomic and peptide-based techniques have evolved in recent yearsto simplify the search for biomarkers. Peptide-based technologies provide newopportunities for the detection of low-molecular-weight protein biomarkers (pep-tides) by MS. Improvements in peptide-based research are based on separation ofpeptides and/or proteins by their physicochemical properties in combination withmass spectrometric detection and identification using sophisticated bioinformaticstools for data analysis. Therefore, peptide-based technologies offer an opportunityto discover novel biomarkers for diagnosis and management of disease includingprognosis, treatment decision, and monitoring response to therapy.
There are a number of critical viral infections that have dominated the researchand biomarker landscape. Many of these findings rely on somewhat simple or “offthe shelf” technologies that are fairly straightforward to use. Perhaps the simplestof these technologies is the surface-enhanced laser desorption/ionization (SELDI)technology. In a study for SARS detection, Kang et al. developed a mass spectro-metric decision tree classification algorithm using SELDI-TOF MS. Serum sampleswere grouped into acute SARS and non-SARS and healthy control cohorts. Dilutedsamples were applied to WCX-2 ProteinChip arrays (Ciphergen), and the boundproteins were assessed on a ProteinChip Reader (Model PBS II). The results clearlyindicated an impressive accuracy for discriminatory classifiers [22]. Another similarstudy indicated that nine serum markers significantly increased and three signifi-cantly decreased in SARS patients as compared to controls [32].
Another ProteinChip assay used to study HIV-1 infection showed a uniqueMDM protein fingerprint during HIV-associated dementia (HAD) and HAART.Seven unique protein peaks between 3.0 and 20.0 kDa were found in the HADMDM samples, all of which were abrogated after HAART [33]. A very similarstudy using specific proteins produced from monocytes from HAD patients

Proteomics of viruses 315
showed a total of 177 protein peaks from 2 to 80 kDa in 31 MDM lysates. Selectprotein peaks, at 5028 and 4320 Da, separated HIV-1-infected from HIV-1-seronegative subjects with 100% sensitivity and 80% specificity [34].
However, most viral proteomics studies to date have utilized either 2DE andMALDI-TOF MS or LC/MS/MS. The HIV virion is composed of a lipid bilayerthat surrounds the viral capsid (Fig. 1A). In a clever study, Fuchigami et al. [35]studied the HIV-1(LAV-1) particles, which were collected by ultracentrifugation,treated with subtilisin, and then purified by Sepharose CL-4B column chromatog-raphy to remove microvesicles. The lysate of the purified HIV-1 particles wassubjected to 2DE and stained, and the stained spots were excised and digested withtrypsin. The resulting peptide fragments were characterized by MALDI-TOF MS.Twenty-five proteins were identified as proteins inside the virion, and the acid-labile formyl group of an amino terminal proline residue of HIV-1(LAV-1) p24(gag)was determined by MALDI-TOF MS before and after weak-acid treatments (0.6 Nhydrochloric acid) and confirmed by postsource decay (PSD) of the N-formylatedN-terminal tryptic peptide (N-formylated Pro(1)-Arg(18)). Interestingly, formyla-tion plays a critical role in the formation of the HIV-1 core for conferring HIV-1infectivity [35].
More recently, the use of liquid chromatography and tandem MS (LC/MS/MS)has also eased purification and recovery methods. For instance, Varnum andcolleagues utilized gel-free two-dimensional capillary LC/MS/MS and Fouriertransform ion cyclotron resonance MS to identify and determine the relative abun-dances of viral and cellular proteins in purified HCMV virions and dense bodies.Analysis of the proteins from purified HCMV virion preparations has indicatedthat the particle contains significantly more viral proteins than previously known.They identified more than 71 HCMV-encoded proteins and 70 host cellular pro-teins in HCMV virions, which included cellular structural proteins, enzymes, andchaperones [6]. Another study using LC/MS/MS for the adenovirus type 5 pro-teome found a total of 11 protein species from 154 peptides, at a sensitivity of10 copies per virus and a detection limit of 70 fmol for two proteins [36].
Two new methods have been used recently to decipher viral proteomes.A method for proteolytic stable isotope labeling was recently used to provide quan-titative and concurrent comparisons between individual proteins from two differ-ent proteome pools or their subfractions. Using this technique two 18O atoms wereincorporated universally into the carboxyl termini of all tryptic peptides during theproteolytic cleavage of proteins in the first pool. Proteins in the second pool wereanalogously cleaved with the carboxyl termini of the resulting peptides containingtwo 16O atoms (i.e., no labeling). The method was used to compare two virusstrains, adenovirus types 2 and 5. This shotgun approach for proteomic studieswith quantitative capability may be a very powerful tool for comparative pro-teomic studies of very complex protein mixtures [37]. Finally, the isotope-codedaffinity tag (ICAT) procedure has also yielded some very interesting results for a

316 A. Pumfery et al.
Envelope
Matrix Core Protein
Nucleocapsid Core Protein (p24)
Transmembrane Glycoprotein (gp41)
Envelope Glycoprotein (gp120)
Viral Genomic RNA
Reverse Transcriptase
Envelope Glycoprotein
Viral Genomic DNA
Tegument
Nucleocapsid
A)
B)
Fig. 1. Virion structures. (A) HIV virion. The HIV virion is composed of a lipid bilayer membrane(envelope) that surrounds the capsid. Two viral glycoproteins (gp120 and gp41) are part of the enve-lope and are important for viral binding and entry. The capsid is composed of the matrix core andnucleocapsid (p24) core proteins and surrounds two copies of the viral genomic RNA and reversetranscriptase. (B) Herpesvirus virion. The herpesvirus virion is composed of a lipid bilayer membrane(envelope) that surrounds the tegument and the capsid. Viral glycoproteins required for binding to andentering the host cell are imbedded into the envelope. The tegument is an amorphous proteinaceousstructure that contains a variety of viral and cellular proteins. The herpesvirus capsid is an icosahe-dron of 150 hexons and 12 pentons that surrounds the double-stranded DNA genome.

Proteomics of viruses 317
rather complex viral infection setting. For instance, proteins from human liver car-cinoma cells, representing transformed liver cells, and cultured primary humanfetal hepatocytes (HFH) were extracted and processed for ICAT chromatography.Proteins from hepatitis C virus-infected cells and corresponding control cells werelabeled with light and heavy cleavable ICAT reagents, respectively. After thelabeled samples were combined, trypsinized, and subjected to cation-exchange andavidin-affinity chromatographies, the resulting cysteine-containing peptides wereanalyzed by microcapillary LC/MS/MS. Using SEQUEST and other bioinformat-ics software a total of �1500 proteins or related protein groups were identified inthree subdatasets from uninfected and infected cells [38]. Collectively, theseresults further emphasize the new targets for biomarkers and drug development forHCV infection.
The described new technologies have collectively added to our arsenal of possi-ble biomarkers when diagnosing various viral infections. However, many of thesemarkers still need to be validated using more rigorous sample methods, biologicaland biochemical tests, and more sophisticated bioinformatics tools. Bioinformaticstools that have been valuable for viral diagnosis and fast retrieval of DNA or proteinsequences include the ORFer program (http://www.proteinstrukturfabrik.de/orfer),2D proteome database (http://proteome.btc.nus.edu.sg/hccm), the Poxvirus pro-teomics database (http://contact14.ics.uci.edu/virus/vaccinia.php), and VirGen(http://bioinfo.ernet.in/virgen/virgen.html).
In this chapter, we will explore the importance of proteomics in studyingvirus–host interactions in several viral systems including HCMV, KSHV, EBV,HSV, HIV-1, HTLV-1, and HCV. We will also describe the methods that have beenemployed to study viral disease progression using several techniques including2DE, LC–MS/MS, SELDI, and protein microarrays.
2. Virus–host interactions
Viral proteomics has included the analysis of viral particles to determine allproteins—viral and cellular—that compose the infectious virus, the examinationof cellular proteins associated with a single viral protein in the hopes of determin-ing all the functions of that viral protein, or the determination of cellular proteinsinduced or altered during a particular disease state. Identification of viral proteinsrequires that the viral genome has been fully sequenced and potential ORFshave been identified. Presently, over 1200 different viral genomes have beensequenced, annotated, and deposited in public sequence databases (GenBank,EMBL, and DDBJ) [39]. Additionally, the National Center for BiotechnologyInformation (NCBI) has established a Viral Genomes Project to provide standardsfor viral genomic research [39]. This resource will further the research of virusproteomics. The viral proteome of several herpesviruses, hepatitis C virus, human

318 A. Pumfery et al.
T-lymphotropic virus (HTLV), and the HIV have been analyzed and will bereviewed here.
2.1. Proteomics of herpesvirus virions
Viral particles of HCMV and Kaposi’s sarcoma-associated herpesvirus/humanherpesvirus 8 (KSHV/HHV-8) have recently been examined. During the her-pesviral replicative cycle, different viral particles are formed. For HCMV, thisincludes mature, infectious virions, noninfectious enveloped particles, and densebodies [6]. Similarly for KSHV, only a portion of the produced virus particles isinfectious [40]. Therefore, analysis of infectious virions requires their separationfrom the noninfectious and immature forms. Density ultacentrifugation gradientsare typically used to separate the various forms. Each fraction can be analyzed byelectron microscopy to determine the level of purity [6,41] or by assaying for viralDNA and an envelope glycoprotein [40].
The herpesviruses are large enveloped DNA viruses (Fig. 1B). The viral particleconsists of a lipid envelope, in which are embedded viral glycoproteins importantfor infection of target cells. The envelope surrounds an amorphous proteinaceousstructure called the tegument [42]. The tegument is often composed of viralproteins critical for the initiation of viral gene expression, for example the VP16protein of HSV [43], as well as other viral and cellular proteins whose functions areunknown. The tegument surrounds the viral capsid, which is composed of a majorcapsid protein, one or more minor capsid proteins, and viral DNA. Identification oftegument and capsid proteins can be differentiated from the envelope glycoproteinsby their differential sensitivity to trypsin and detergents. The tegument and capsidproteins are resistant to trypsin digestion in the absence of detergents. The envelopeglycoproteins, however, are sensitive to trypsin digestion whether or not detergentsare present. However, only the surface-exposed portions of glycoproteins are sen-sitive to trypsin in the absence of detergents.
2.1.1. Identification of proteins in HCMV particles
Following gradient purification of virions, LC/MS/MS was used to identify thecomponents of the HCMV virion [6]. The results were verified by coupling high-accuracy mass measurements with LC and FT-ICR (Fourier transform ioncyclotron resonance) MS. Fifty-nine proteins were identified including 12 pro-teins encoded by known HCMV ORFs not previously known to reside in virions.The classes of proteins identified included capsid proteins, tegument proteins,glycoproteins, and 12 proteins involved in DNA replication and transcription.Additionally, 12 more viral polypeptides were identified that had not beenpreviously characterized [6].
Using the intensities in the FT-ICR spectra, the relative quantities of the virionproteins were determined, indicating that 50% of the virion was composed of

Proteomics of viruses 319
tegument proteins, 30% were capsid proteins, 13% were envelope proteins, while7% were undefined proteins. These undefined proteins are likely to be cellularproteins that are incorporated into the virion. Host cellular proteins were detectedby comparison with peptides predicted from a human-FASTA database. Therewere 71 cellular proteins identified to be associated with the HCMV virion. Theyincluded cytoskeletal proteins, proteins involved in translation control, and severalsignal transduction proteins [6]. The identification of cellular proteins involved intranslation and signal transduction as components of the HCMV virion suggeststhat these proteins may have a function in the initiation of viral gene expression orinducing an environment that is suitable for HCMV infection.
2.1.2. Identification of proteins in KSHV particles
KSHV has only been fully sequenced in the last 10 years [44], and therefore notmuch is known about the composition of the virus particle. Nealon et al. [41] usedSDS-polyacrylamide gel electrophoresis (PAGE) and Western blotting to identifythe major capsid and scaffolding proteins as components of isolated virions. Theythen used ion trap MS to identify three additional components of the virion as ORFs62, 26, and 65. This study, however, was limited and unable to identify all compo-nents of the infectious virus. Zhu et al. used a more comprehensive approach toidentify virion components. Extracellular virions were purified by double gradientcentrifugation. SDS-PAGE revealed 30–40 protein bands whose identity wasdetermined by in-gel trypsin digestion, followed by LC and MS. Both peptidemasses and peptide sequences were produced by tandem MS (MS/MS) and used todetermine protein identity. The isolated proteins included five capsid proteins, eightglycoproteins, six tegument proteins, and five other KSHV ORFs. Twenty cellularproteins were also identified and, as seen with HCMV, these included cytoskeletalproteins, signal transduction proteins, as well as heat shock proteins [45]. Similarresults were seen in the study by Bechtel et al. [40]. However, fewer proteins wereidentified in this study as a single 7.5% SDS-PAGE gel was used to separate virionproteins. Zhu et al. [45] used three SDS-PAGE gel—a 4–12% gel, a 3–8% gel toseparate proteins larger than 50 kDa, and a 12% gel to separate proteins smallerthan 50 kDa. These studies underscore the need for good separation methods to beable to identify all proteins in a virus particle.
2.2. Proteomics of Epstein–Barr virus
The Epstein–Barr virus (EBV) is a B-cell lymphotropic herpesvirus that induces ausually asymptomatic infection and is carried by more than 90% of adults.However, EBV is the causative agent for Burkitt’s lymphoma and nasopharyngealcarcinoma and is involved in a number of acquired immunodeficiency syndrome(AIDS)-associated lymphomas. EBV can induce immortalization of B cells in vitroto generate lymphoblastoid cell lines (LCLs), a model for the carcinogenic potential

320 A. Pumfery et al.
of EBV. LCLs are latently infected with EBV; they maintain the virus as an extra-chromosomal episome, and have limited viral gene expression. The latentlyexpressed proteins are the six EBV nuclear antigens (EBNAs 1, 2, 3A, 3B, 3C,and -LP) and three latent membrane proteins (LMPs 1, 2A, and 2B). Of the latentlyexpressed proteins, EBNA2 and LMP are required for transformation induced byEBV [46]. Characterizations of cellular proteins associated with EBNA2 or proteinsdifferentially expressed in the early stages of the transformation process will be de-scribed in the following text. Results of these studies may lead to a better under-standing of EBV-mediated transformation and the identification of cellular targetsfor therapy.
A proteome database of LCLs, before and after transformation, has been devel-oped to identify the cellular mechanisms of virus-induced immortalization [9,47].2DE was used to first separate proteins based on their relative charge (pI) and thenbased on their molecular weight. Differentially expressed proteins were digestedand subjected to electrospray ionization MS. Proteins were identified based on theirpeptide mass fingerprint and amino acid sequences of peptides determined byEdman degradation. There were 32 differentially expressed proteins and 20 wereassigned to known proteins. The expression of several proteins involved in prolif-eration or nucleotide metabolism was increased in the immortalized cells, whichmay result in the growth stimulation seen in immortalized cells. A database of 2Dgel images as well as the identity of the differentially expressed proteins has beenmade available to the public at www.proteome.jp/2D/. The availability of these im-ages and the identification of the differentially expressed proteins may prove use-ful to others in their analysis of EBV-infected cells.
EBNA2 is required for transformation of LCLs by EBV [48,49] and induces theexpression of c-myc [50]. c-myc is an oncogene which drives cell proliferation;however, the proliferation program induced by c-myc is different than thatobserved by the expression of EBNA2 [51], suggesting that other cellular proteinsand events are induced by EBNA2 to mediate transformation. Furthermore, thereis limited information on the cellular targets of EBNA2. To identify the EBNA2-induced changes as c-myc dependent and c-myc independent, EBNA2 and c-myc-conditionally expressing cell lines were used and the proteome of each cell linewas compared [10]. Proteins were separated by 2D SDS-PAGE and identified byMALDI-TOF MS. In EBNA2 expressing cells, there were 20 differentiallyexpressed proteins; 12 were induced and 8 were repressed. Of the proteins thatwere induced following EBNA2 expression, several were involved in nucleotidemetabolism, protein synthesis, or the control of apoptosis. Many of these proteinswere also induced in c-myc expressing cells, though six proteins were found to beEBNA2 specific. Two EBNA2-specific proteins were induced (Bid and IgE-HRF)and four were repressed (Annexin IV, �-actin, GMF�, and AF103803). Further-more, analysis of the activation kinetics demonstrated that expression of EBNA2preceded that of c-myc, which was then followed by the expression of Nm23-H1

Proteomics of viruses 321
(a nucleotide diphosphate kinase that may suppress metastasis [52]), indicatingthat c-myc was a direct target of EBNA2 [10].
2.3. Proteomics of herpes simplex virus
Herpes simplex virus (HSV) has been the most extensively studied of the human her-pesviruses owing to its ability to easily infect cells in vitro to produce infectiousvirus.As with all herpesviruses, HSV encodes a number of proteins for efficient viralgene expression, viral DNAreplication, and the shutoff of cellular gene transcriptionand translation [53]. These virally expressed proteins do not function in isolationbut associate with a variety of cellular and viral proteins. Furthermore, many haveexhibited multiple different functions. In an effort to understand the biology of HSVand the function of its proteins, a proteomics approach has been used to study a crit-ical viral transactivator (ICP27), the alteration of the cellular translation machinery,and components of the viral replication complex, which will be reviewed here.
The ICP27 protein is expressed early in infection and is essential for viral repli-cation and expression of certain early genes and virtually all late genes. It is amultifunctional protein that may function with the virion host shutoff (vhs) proteinof HSV to repress cellular protein synthesis. This repression serves to direct cellu-lar resources to the synthesis of viral proteins. Using immunoprecipitation of ICP27from HSV-infected cells followed by SDS-PAGE and MS, several translation initi-ation factors were identified, including PABP, eIF3, and eIF4G [18]. The interactionof ICP27 with translation initiation factors may recruit these factors to viral mRNAto facilitate translation of viral mRNAs and also to sequester these factors awayfrom the translation of cellular mRNAs.
HSV infection also induces ribosomal changes and it has been hypothesizedthat these changes may contribute to HSV-mediated translational control of hostand viral gene expression [17]. To identify the changes in ribosomes followingHSV infection, ribosomes were purified by ultracentrifugation, the proteins wereseparated by 2D SDS-PAGE, and their identities were determined by MALDI-TOF MS. Seven additional protein spots were found associated with ribosomesfollowing HSV infection, including several viral proteins: VP19C and VP26—components of the viral capsid, and US11—a tegument protein. Three of the sevenspots were phosphorylated forms of US11. One nonribosomal protein, PABP, wasalso found associated with ribosomes. The association of PABP with ribosomesincreased following HSV infection [17]. Interestingly, PABP was also found asso-ciated with ICP27 in the previous study [18]. Although Greco et al. [17] did notfind ICP27 associated with ribosomes, this is likely due to the different separationprocedures used. Greco et al. [17] used 2DE and focused solely on basic proteinswith a pI greater than 8.6 while Fontaine-Rodriguez et al. [18] separated isolatedproteins based on molecular weight. Together, these results suggest that ICP27likely associates with ribosomes in infected cells.
322 A. Pumfery et al.
Herpesvirus DNA replication occurs in intranuclear structures called replicationcompartments [54,55]. HSV encodes seven proteins that participate in viral DNAreplication; however, it is not known what cellular proteins are involved in thisprocess. To identify cellular proteins in HSV replication compartments, ICP8, theHSV single-stranded DNA-binding protein, was immunoprecipitated from infectedcells and coprecipitating proteins were separated by SDS-PAGE and identified byion trap MS [19]. Greater than 50 viral and cellular proteins were identified as cop-urifying with ICP8. The cellular proteins included those that participate in DNAreplication/repair /recombination, chromatin remodeling, RNA binding/splicing,and transcription factors. Several of these proteins require DNA binding to associ-ate with ICP8, including several chromatin-remodeling proteins. The roles of anumber of interacting cellular proteins are presently unclear and further studies areneeded to determine their exact roles in viral DNA replication.
2.4. Proteomics of retroviruses—HIV and HTLV
HIV encodes a critical transcriptional activator, Tat, which directs a cellular tran-scription factor, pTEFb, to the HIV LTR to mediate transcription elongation [56,57].However, it has been shown that the viral genome is bound by nucleosomes that in-hibit viral gene expression [58,59]. To determine if Tat interacts with additional cel-lular proteins to further assist viral gene expression, we used Tat peptides linked tobiotin to pull down all Tat-associated proteins [60]. Additionally, acetylated andunmodified peptides were also used because acetylation of Tat has been attributedto alternative functions of Tat [61,62]. We found that many more cellular proteinsbound to the unmodified Tat, including proteins involved in modification of chro-matin structure (CHD2 and p/CAF) and additional transcription factors (TIF1—aTRIM family member—and SCL—a bHLH transcription factor) [60]. These resultsindicate that Tat influences viral gene expression at various levels and suggeststhat targeting these specific interactions may be a viable form of treatment of HIVinfection and AIDS.
HIV infects several cell types during the course of infection and progression toAIDS. In HIV-infected patients, the virus establishes a persistent infection in cellsof the monocyte/macrophage lineage. Monocytes and macrophages are the first lineof defense in the immune system: they phagocytose and kill a range of microorgan-isms. However, little is know about how HIV persists in these cells. To understandhow HIV may persist in these cells, Carlson et al. [31] used a “ProteinChip” andSELDI to identify unique protein signatures in HIV-infected monocytes obtainedfrom different donors. Infection of monocytes isolated from humans was used tomimic the virus–host interactions that would occur in an infected individual. TheProteinChips used in the study were used to partially purify samples. One is a weakcation exchange, and the second is a reverse-phase hydrophobic interaction chip.Charged proteins will bind to the cation ion-exchange chip while hydrophobic, i.e.,

Proteomics of viruses 323
membrane-associated, proteins will bind to the reverse-phase chip. Proteins boundto the chip were then analyzed by MS. Each peak represents a protein of a particu-lar mass; however, the nature of the protein in a peak after SELDI MS is unknown.A different, separation technology and MS are needed to determine proteinidentities. To determine the identities of proteins up- or down-regulated followingHIV infection of monocytes, total protein extracts were subjected to trypsin diges-tion, LC, and tandem MS to determine sequences of tryptic peptides. Sequenceswere then analyzed against a Protein Bank to determine the identities of the proteinsand given a score [31]. The problem with this type of study is that there is no quan-titative assessment of the increase or decrease in the protein levels or changes inposttranslational modifications (PTM) following infection.
HAD affects almost one-third of adults infected with HIV [63]. The exact causeof dementia is not known. There is significant neuronal loss but neurons are notinfected with HIV [64]. It has been hypothesized that HIV-infected astrocytes arecritical in the development of HIV dementia, and that Tat is a contributor to thisdisease. Extracellular Tat released from astrocytes induces cell death in neurons,though Tat protects astrocytes from cell death [65]. To understand this dichotomy,proteins differentially expressed in Tat-expressing astrocytes were identified [66].Total protein extracts of Tat-expressing and control cells were separated by 2D gelelectrophoresis and identified by MALDI MS. Interestingly, seven proteins werefound to be repressed in Tat astrocytes, including Rho GDP dissociation inhibitorand protein phosphatase 2A (PP2A) inhibitor. Many of these proteins have beenshown to be involved in the biology of HIV and interact with Tat [66]. Three pro-teins identified by a slot blot technique were found to be induced, and includedHSP70, heme oxygenase, and inducible nitric oxide synthase (iNOS) [66].Previously published data have demonstrated a correlation between iNOS and theseverity of HAD [67,68]; however, the role of the other differentially expressedproteins in astrocyte survival and HIV dementia will require further study.
The human T-cell leukemia virus type 1 (HTLV-1) causes adult T-cell leukemia(ATL) and HTLV-1-associated myelopathy/tropical spastic paraparesis (HAM/TSP) [69]. HTLV-1 encodes a transactivator, Tax, that is critical for virus replica-tion and plays a central role in the development of ATL and HAM/TSP [69].Tax does not bind to DNA directly but functions by interacting with a varietyof cellular proteins [69]. Many protein–protein interactions of Tax have beendetermined by mutational analysis including CREB [70–72] and NF-�B [70,72].To identify all the cellular proteins that interact with Tax, Wu et al. used chro-matography, 2D gel electrophoresis, and mass spectrometric analysis of an HTLV-1-infected cell line (C81) [73]. As Tax functions in both the cytoplasm and thenucleus [70,74], Tax-interacting proteins were identified from both cellular com-partments. Some of the cytoplasmic proteins included small GTPases and compo-nents of the cytoskeleton while some of the more interesting nuclear proteinsincluded components of the SWI/SNF chromatin remodeling complex [73].

324 A. Pumfery et al.
The interaction of Tax with many of the identified cellular proteins may beinvolved in the ability of Tax to dysregulate cellular functions leading to T-cell trans-formation and leukemia.
2.5. Proteomics of hepatitis C virus and hepatocellular carcinoma
Hepatocellular carcinoma (HCC) causes approximately one million deaths a year[75]. Two viruses are the main causes of HCC: HBV and HCV [76–78]. AlthoughHBV is the most important cause of HCC, accounting for 80% of HCC cases, aneffective vaccine is available [79]. HCV, however, is a major cause of the increas-ing incidence of HCC in developed countries [80] and no effective vaccine isavailable. HCC progresses after decades of chronic infection and often is at anadvanced stage once it presents clinically [81]. As such, good noninvasive diag-nostic markers are needed. This will be discussed further in Section 3. The focusof this section will be on the identification of cellular proteins that are inducedfollowing HCV infection or cellular proteins that interact with HCV proteins.
An extensive study by Wirth et al. [82] analyzed normal liver tissue andhepatoma-derived cell lines by 2D gel electrophoresis and N-terminal sequencingand identified a number of proteins that were differentially expressed betweennormal tissue and hepatoma cell lines. Similar studies have been performed byothers as well [83,84]. However, these studies have used cell lines that have beenin culture that may not accurately reflect all the changes seen in HCC. Comparisonof liver tumor tissue with normal tissue would be ideal; however, tissue hetero-geneity is an issue and could confound the results [85]. Until only very recently[86,87], an infectious cell culture model for HCV has not been available. This newmodel system will allow for the identification of cellular proteins that are inducedfollowing HCV infection and further the development of a treatment for HCV.
The HCV genome encodes a large polyprotein that is cleaved to generate 9–10proteins, including the core and envelope proteins E1 and E2, and the nonstruc-tural proteins NS2, NS3, NS4A, NS4B, NS5A, and NS5B [88]. NS5A has beenproposed to act as a cofactor in HCV replication [89], as a transcription activator[90], or as an anti-apoptotic factor [91]. To identify the cellular proteins that in-teracted with NS5A, Choi et al. [26] coimmunoprecipitated NS5A-interactingproteins using antisera against NS5A, separated them via 2D gel electrophoresis,and determined their identity by MS. One cellular protein was found to interactspecifically with NS5a, the heat shock protein (HSP) 27, also known as SRP27.Further analysis indicated that HSP27 interacted with the C-terminal domain ofNS5A and both proteins were shown to colocalize around the nucleus. The HSPsare induced following cellular stress to protect cells from apoptosis [92]; yet, over-expression of HSP27 did not protect cells from HCV core-induced apoptosis. AsHSP27 expression could not be reduced by siRNA, the role of HSP27 in HCVRNA replication could not be determined. However, due to the multifunctional

Proteomics of viruses 325
nature of NS5A, it is surprising that only one protein was found to interact withNS5A. Because an antibody to NS5A was used to coimmunoprecipitate cellularproteins, the antibody used in the study may be interfering with the binding ofother cellular proteins. This problem may be overcome by using different anti-bodies to NS5A or by using a tagged NS5A and affinity chromatography.
3. Diagnostics
Proteomic analysis has provided a unique tool for the identification of diagnosticbiomarkers, evaluation of disease progression, and drug development [93,94]. It isalso an important approach for clinical diagnostics. In fact, early diagnosis of dis-ease could be possible through the use of unique protein profiles, consisting of apanel of biomarkers that serves as a surrogate marker of disease. Novel diagnos-tic tests may be generated through proteomic discoveries, and many more proteinscan be identified as potential drug targets. These biomarkers are likely to servemultiple purposes, including the assessment of drug efficacy and drug toxicity,and diagnosis. We will review the various methodologies used for viral diagnos-tics and discuss the advantages and disadvantages of each technique.
3.1. 2DE-MS: SARS, HBV, HCV, and HIV-1
3.1.1. Description
The classical proteomics platforms include 2DE and MS [85]. 2DE is employedto separate proteins in a mixture in the first dimension by their isoelectric pointsand then in the second dimension by molecular mass. The resulting gel can bestained with a variety of protein dyes to reveal a pattern of spots. In the firstdimension, isoelectric focusing (IEF) is performed by using IPG strips which arebased on the use of bifunctional immobiline reagents, a series of 10 chemicallywell-defined acrylamide derivatives that copolymerize with the acrylamidematrix, to generate extremely stable pH gradients forming a series of buffers withdifferent pK values between 1 and 13. Subsequently, linear or nonlinear wide (IPG3–12), medium (IPG 4–7), narrow (IPG 4.5–5.5), and ultra-narrow (IPG 4.9–5.3)pH range IPGs can be cast [95]. We suggest the reader to refer to the review byGorg et al. for more details about IPG strip rehydration, sample application, andIPG strip equilibration [96]. The second dimension consists of using SDS-PAGEto separate proteins according to their molecular weight. However, the analysis oflow-molecular-weight (�15 kDa) and high-molecular-weight (�150 kDa) pro-teins is challenging since there is no standard 2DE system that effectively allowsseparation of proteins over the entire range between 5 and 500 kDa. A commonapproach is to combine several gels optimized for different molecular weightranges instead of using a single standard 2DE system.

326 A. Pumfery et al.
3.1.2. Application for virus studies
Current methods for the diagnosis of HCC rely on serological markers such as �-fetoprotein (AFP) [97] and certain liver enzymes as well as Des gamma car-boxyprothrombin (DCP) [98]. This type of diagnosis lacks the sensitivity to detectHCC at an early stage when therapy can be more effective. To find markers ofdisease progression, 2DE was employed to resolve and compare proteins presentin serum obtained from individuals infected with HBV or HCV and with varyingrisks for the development of HCC [99,100]. In several studies, proteins expressedat different levels among diseased individuals as compared to those of healthyones were identified as markers for disease progression as well as proteins withdifferent N-glycosylation patterns [99–101]. In another study, 2D-MS was alsoemployed to analyze altered plasma proteins due to SARS-CoV infection. Thirty-eight different plasma proteins from SARS patients were identified, most of whichwere associated with acute phase proteins [23].
3.1.3. Advantages
One advantage of 2D gels is their resolution since they can resolve as many as2000 proteins simultaneously and proteins can be detected at greater than 1 ng inone spot [96]. 2DE is currently the only technique that can be routinely applied forparallel quantitative expression profiling of large sets of complex protein mixturessuch as whole cell lysates. In addition, 2DE produces a map of intact proteins,which reflects changes in protein expression level, different isoforms, or PTM. Infact, a great advantage of this methodology is its capability to study proteins thathave undergone some form of PTM (such as phosphorylation, glycosylation, orlimited proteolysis) that can be detected visually on the 2DE gels as they appearas distinct spot trains in the horizontal and/or vertical axis of the 2DE gel. This isin contrast with other methods, including LC-based methods, which performanalysis on peptides, where molecular weight and pI information is lost, and stableisotope labeling is required for quantitative analysis [96].
3.1.4. Drawbacks
Although 2D gel electrophoresis is a standard technology, it suffers from severalproblems that may limit its utility. These include issues with reproducibility, aswell as the inability to separate hydrophobic proteins, which are poorly soluble.Although the use of IPG strips increases the reproducibility of 2DE, various prob-lems with 2D separation remain such as streaking, poor focusing, and the variableoccurrence of gaps [85]. Although 2DE allows for high resolution of individualspots, a single spot may not correspond to a single protein, since proteins cancomigrate as a single spot on a 2D gel [102]. Furthermore, 2DE requires milligram

Proteomics of viruses 327
quantities of protein, reflecting the low sensitivity of this method. To furtherenhance the utility of 2DE-MS, enrichment of samples for low-abundance pro-teins by improved methods is required. Enrichment can include prefractionationof samples, as well as more sensitive detection and quantitation methods, or theuse of alternative methods including laser capture microdissection [103] for het-erogeneous tissues. In most of the studies mentioned previously, the resolutionproblem was overcome by narrowing the pH range allowing for greater focusing.However, the reduced pH range in IEF can lead to the elimination of a large num-ber of proteins that may be informative. Comparing hundreds of protein spotsacross gel images taken from a large number of different samples is extremelytime-consuming, even with specialized software. For this reason, although 2Delectrophoresis is a promising tool, it is not very practical for clinical application.The challenge is to develop this technique into a system capable of automation,high throughput, and high sensitivity.
3.2. LC–MS: HIV-1 and HCV
3.2.1. Description
Multidimensional LC/MS/MS involves solution proteolysis of a complex mixtureof proteins, which are then fractionated by high-performance liquid chromatogra-phy (HPLC). Peptides are then analyzed by tandem MS consisting of two phases.In the first phase, peptides in each chromatographic fraction are electrosprayedand ionized producing a mass spectrum characteristic of the molecular weight ofeach peptide in the sample. In the second phase, the first mass analyzer of theinstrument is used to select a single (M � H)� ion from the mixture and to trans-mit it to a collision chamber, where the peptide undergoes collisions with argonatoms and suffers fragmentation. The resulting fragment ions are then transferredto a second analyzer, which separates them according to mass [104]. The endresult is a mass spectrum containing ions characteristic of the sequence of aminoacids in the selected peptide. When mixtures are extremely complex, onlinereverse-phase LC is used to concentrate and separate the peptides before sequenc-ing by MS [105]. An online capillary LC/MS/MS system consists of conventionalHPLC pumps, transfer tubing, a precolumn flow splitter, a liquid junction, areverse-phase microcapillary column, and a tandem mass spectrometer [106].
3.2.2. Application for virus studies
Two studies have used LC/MS/MS to identify differential protein expression inHIV- or HCV-infected cells. In the first study, traditional HPLC (ion exchange andreverse-phase columns) coupled to an ultrasensitive ion trap MS was employed to

328 A. Pumfery et al.
identify proteins that were unique to MDM and to identify proteins present inHIV-1-infected MDM lysates by microsequencing [31]. The second study usednormal hepatocytes and immortalized human hepatocytes that can be induced toexpress the entire HCV ORF. The two different cell types were labeled with anisotopically light (12C for stimulated) or heavy (13C, for control cells) reagentcalled isotope-coded affinity tag (ICAT); the two differentially labeled sampleswere then combined and digested with trypsin. Digested peptides were separatedby strong cation-exchange chromatography, affinity purified with an avidin car-tridge, and subjected to LC-ESI-MS/MS. This study led to the identification of2159 unique proteins that could be used as markers for disease progression.
3.2.3. Advantages
Some of the advantages include automation in sample application, ability toswitch columns, and sensitivity, as this method is able to identify proteins at verylow levels [107]. In addition, this method has been extensively used for the deter-mination of drugs and hormone levels in human serum [108–111], making it apromising tool for the detection of disease prognosis markers.
3.2.4. Drawbacks
2DE-based proteome analysis provides information about protein abundance atthe gel level by comparing staining intensities. However, when peptide mixturesare analyzed directly by LC/MS/MS techniques, the original quantitative infor-mation is lost. For this reason, one of the drawbacks of using LC/MS/MS is thedependence on incorporating stable isotope labeling for quantitative proteomeanalysis involving the addition of a chemically identical form of the analyte(s)containing stable heavy isotopes (e.g., 2H, 13C, 15N, etc.) to the sample.
3.3. SELDI ProteinChip: SARS, HIV, and hepatitis
3.3.1. Description
SELDI-TOF is a proteomic technology that aims at the quantitative analysis ofprotein mixtures. This technique relies on the use of trapping surfaces that allowdifferential capture of proteins based on intrinsic properties of the proteins them-selves to identify proteins from crude samples without the need for an initialseparation step. A small amount of sample can be directly applied to a biochipcoated with specific chemical matrices (hydrophobic, cationic, or anionic) or spe-cific biochemical materials, including DNA fragments or purified proteins. Boundproteins can then be analyzed by MS to obtain either the protein fingerprints or theamino acid sequence when interfaced with a tandem MS.

Proteomics of viruses 329
3.3.2. Application for virus studies
The SELDI ProteinChip approach has been employed to study the protein pro-files of cells infected with viruses, including severe acute respiratory syndromecoronavirus (SARS-CoV), HIV-1, and chronic hepatitis B virus infection (CHB)[31]. SARS is a viral respiratory illness caused by SARS-CoV. SARS was rec-ognized as a global threat in March 2003, after first appearing in SouthernChina in November 2002 (http://www.cdc.gov; [20]). Current serological meth-ods used for laboratory diagnosis of SARS fail to guarantee early diagnosissince most are based on the detection of antibodies that are produced 17–20days after the onset of symptoms. ELISA-based antigen detection tests offerhigh specificity and reproducibility, but they lack sensitivity. On the contrary,PCR-based methods, including reverse transcription-PCR, lack sensitivity andspecificity [112]. For this reason, there is a need to develop a diagnosticmethodology that can detect SARS before the onset of the symptoms to allowfor specific prevention and treatment measures for SARS. According to recentstudies, SELDI-TOF seems to be a promising approach to study the protein pro-file unique for SARS. Sera from acute SARS patients or from healthy donorswere examined to identify serum marker that could distinguish SARS from non-SARS patients. In this study, analysis of spectra accurately classified 36 of 37(97.3%) SARS specimens and accurately classified 987 of 993 (99.4%) of thecontrols as non-SARS. In addition, the classification algorithm successfully dis-tinguished acute SARS from other type of infections with very high precision[22]. The same approach was also employed for the discovery of diagnostic pro-teomic signatures in the sera of patients with CHB having liver fibrosis andcirrhosis. Results show that 30 serum proteomic features formed a uniquefingerprint for fibrosis that correlated with the different stages of fibrosis fromminimal fibrosis to cirrhosis [66].
In another study that evaluated the protein fingerprints of HIV-1-infectedMDM, cell lysates were directly applied on two types of protein chips: weakcation exchange and reverse-phase hydrophobic interaction. After washing toremove the unbound proteins, bound proteins were ionized and their molecularmass/charge ratio was determined using TOF analysis. Analysis of the obtainedprofiles showed distinct patterns between uninfected and infected MDM [33].
3.3.3. Advantages
The SELDI ProteinChip approach allows for high-throughput protein analysis ofcrude protein mixtures without the need for a separation step. It is sensitive sinceit takes advantage of the analytical capacity of MS combined with novel surfacechemistry. It can provide a phenotypic fingerprint of complex mixtures. Samplerequirements are dramatically reduced, and because this approach employs MS

330 A. Pumfery et al.
for its readout, attomolar to femtomolar concentrations of proteins can bedetected. Additionally, reproducibility is greater than that of other techniquessuch as 2D gels; proteins at extreme pIs can be identified, a condition that isproblematic under normal 2D gel electrophoresis conditions; and finally there isa greater sensitivity and accuracy for low-molecular-weight proteins (�25 kDa)using SELDI, especially below 10 kDa, which is particularly troublesome for2D gels.
3.3.4. Drawbacks
This method needs a very robust algorithm to ensure specificity of the profile, inthat it can distinguish the pattern between disease and healthy individuals withhigh accuracy, taking into account variations in profiles between healthyindividuals as well as persons with a variety of different infections at different timeperiods in their course of illness. Two additional drawbacks of this approach arethe following: (i) The identity of the proteins cannot be discovered and (ii) as theabsolute intensity of the peaks is measured in relationship to the most abundantpeaks, peaks in low abundance will be masked by the more abundant ones. Inaddition, this method employs the direct analysis of tissues or biological fluids byMALDI. The main drawbacks of this approach are the preferential detection ofproteins with a lower molecular mass and the difficulty in determining the iden-tity of proteins owing to PTM obscuring the correspondence of measured andpredicted masses.
3.4. Protein microarray: vaccinia virus
3.4.1. Description
A protein microarray relies on high-throughput amplification of each predictedORF by using gene-specific primers, followed by in vivo homologous recombina-tion into a T7 expression vector. The proteins are expressed in an Escherichia coli-based cell-free in vitro transcription/translation system. The protein products fromthe unpurified reactions are printed directly onto nitrocellulose microarrays withoutfurther purification [113].
3.4.2. Application for virus studies
This approach was used to determine the complete antigen-specific humoralimmune-response profile from infected humans and animals. The vaccinia virusproteome containing 185 individual viral proteins was printed on a chip aftercloning and expression. The chips were then used to determine the antibody pro-file in serum from vaccinia-virus-immunized humans, primates, and mice [113].

Proteomics of viruses 331
3.4.3. Advantages
Once it has been developed and produced, a protein microarray can be a very rapidmethod (3 days for most of the genes) to comprehensively scan the humoralimmune response of vaccinated or infected individuals.
3.4.4. Drawbacks
The generation of a complete proteome is technically challenging. One problem isthe amplification of long genes. Furthermore, expression of some proteins in het-erologous systems is not efficient. This technique also does not take into accountPTM of viral proteins that are expressed in bacteria. Lastly, expression in E. colimight lead to folding problems of the protein.
4. Discussion
Proteomic analysis of cellular protein samples began with the development ofPAGE [114] and later with the development of two-dimensional gel electrophore-sis (2D-PAGE) [115]. These techniques allowed for the separation of proteinsbased on size (PAGE) or charge and size (2D-PAGE). These methods, however, didnot allow for direct identification of these protein bands. Indirect methods such asWestern blotting with specific antibodies were required for identification—a slowand laborious process. However, by combining a variety of mass spectrometricmethods with PAGE, identification of a larger number of proteins has become pos-sible. These methods have proven invaluable in furthering various avenues of viralresearch. Proteomic analysis of viruses has included identification of proteins invirus particles, characterization of virus–host protein–protein interactions, andanalysis of serum proteins for biomarkers of disease.
One aspect of viral proteomics has been the characterization of virus particlesand virally infected cells. Characterization of purified virions has led to the iden-tification of viral proteins that were not originally identified with the virion as wellas the identification of cellular proteins associated with the purified virus. Forexample, analysis of HCMV viral particles identified 12 additional ORFs not pre-viously known to reside in virions as well as the identification of 71 cellular pro-teins [6]. The importance of these cellular and viral proteins in viral replication orpathogenesis awaits further analysis. Additionally, 12 unique polypeptides wereidentified that did not correspond to previously identified ORFs [6], illustratingthe fact that despite intensive sequence analysis, sequence characteristics of viralpromoters and ORFs are still not entirely understood. Analysis of virally infectedcells has also led to the characterization of events leading to EBV-induced trans-formation [9,10,47], identification of cellular proteins induced in HIV-infected

332 A. Pumfery et al.
macrophages [31], and identification of cellular proteins that may be involved inAIDS-associated dementia [66].
The characterization of virus–host protein–protein interactions has been intenselystudied. Originally most studies have relied on the analysis of the interaction of twoproteins or used the yeast two-hybrid system to identify new protein partners of aprotein of interest. These studies, however, are quite labor intensive. Furthermore,the yeast two-hybrid system is susceptible to false-positive identifications, cannotbe used to identify multiprotein complexes, and typically does not take into accountpossible PTM that may influence protein binding. Proteomic analysis, however, canbe used to identify multiprotein complexes and, when used in the analysis of in-fected cells, will take into account any PTM that occur in infected cells. Proteomicanalysis of infected cells has resulted in the identification of cellular proteins thatmay mediate HSV IC27-induced repression of cellular protein synthesis [18], andthe identification of over 50 cellular and viral proteins in HSV DNA replication[19]. Furthermore, analysis of the HIV Tat and HTLV Tax proteomes identifiedmembers of chromatin remodeling complexes as components of these viral trans-activator multiprotein complexes [60,73]. Many of these studies will allow forfurther understanding of virus transcription, replication, and transformation.Additionally, these studies may lead to the identification of unique drug targets. Forexample, the p-TEFb complex has been shown to be critical for HIV gene expres-sion [56,60,116] and HIV-infected cells are uniquely sensitive to the transcriptionsuppressing effects of the p-TEFb inhibitor flavopiridol [116–118].
A number of viruses are the causative agents of cancer, including EBV, hepati-tis B virus, and hepatitis C virus (HCV). HCV is a major cause of the increasingincidence of liver cancer in developed countries [80], though events leading totransformation are not well understood. Until recently [86,87], an infectious cellculture model of HCV has not been available. The lack of a cell culture model hasprevented the systematic analysis of changes induced by HCV infection.Alternative approaches to studying HCV transformation have been the comparisonof liver tissue and hepatoma-derived cell lines [82–84] and analysis of a singlevirus (NS5a)–host (HSP27) protein–protein interaction [26]. Further analysis ofadditional HCV proteins and infected cells will provide additional insights into thenature of this virus and its ability to cause cancer.
One aspect of viral proteomics that is of interest to physicians is the analysis ofserum for protein biomarkers of disease. Studies have been performed on patientsinfected with SARS-CoV, HIV, HCV, HBV, and HIV-1 using a variety ofapproaches. Some of the methods that have been used are 2D-PAGE followed byMS, LC/MS/MS, SELDI ProteinChips, and protein microarrays. These methodshave their advantages and disadvantages. 2D gel electrophoresis allows for reso-lution of greater than 1000 protein species, can be used for quantitative analysisof expression, and reflects changes in PTM and the identification of isoforms.However, several issues with 2D gel electrophoresis are its lack of reproducibility,the difficulty in detecting hydrophobic proteins, low sensitivity, and the inability

Proteomics of viruses 333
to use a high-throughput method to analyze a large number of samples. LC–MShas the advantages of solubilization of the majority of proteins, automation, abilityto switch columns, and sensitivity; however, the ability to quantify changes inprotein levels is lost with LC–MS.
The SELDI ProteinChip is unique in that it allows for differential separation ofcomplex protein mixtures based on chemical characteristics such as hydrophobic-ity or charge, resulting in a decrease in the complexity of the sample analyzed.However, SELDI is considered a soft-ionization method and the results obtainedare patterns of protein peaks and not the identification of peptide masses. Toensure the specificity of peak profile for a particular disease state, a robust algo-rithm is needed. Lastly, protein microarrays have been developed to determine theimmune response to a viral infection. The method requires the expression andprinting of all ORFs of a pathogen and cross-linking them to a solid support.Protein microarrays would allow for the rapid diagnosis of a particular viral infec-tion. However, expression of a complete proteome is a challenging task. As theproteins are expressed in bacteria, potentially important PTM are lost and proteinsmay not be properly folded.
Serum is a complex mixture of proteins that is dominated by two proteins—albumin and immunoglobulin (Ig) [119]. The abundance of these proteins meansthat analysis of serum for potential biomarkers of disease requires either verysensitive methods or separation of albumin and Ig from serum. Several albuminand/or Ig depletion methods have been developed to resolve this issue. Pieper et al.[120] developed a series of chromatographic columns to separate immunoglob-ulins based on their affinity for proteins A and G as well as columns containingantibodies with specificities for individual proteins such as albumin, fibrinogen,and transferrin. The columns were successful in depleting serum samples of theirrespective proteins, and use of several columns significantly decreased thecomplexity of the sample analyzed [120]. Additionally, a mixed-bed column wasdeveloped that allowed the simultaneous separation of several proteins, whichwould allow for automated processing of samples. A similar approach has beendeveloped by Bio-Rad (Affi-Gel Blue) to deplete samples of albumin, enhancingthe detection of other proteins in the sample [121]. Affi-Gel Blue has affinity forhydrophobic, aromatic, or sterically active binding sites of protein. Although thisproduct has high affinity for albumin, it may bind other proteins as well, limiting itsusefulness. Lastly, Baussant et al. [122] developed a peptide-based approach todeplete albumin. Their approach was based on the fact that although protein G hasaffinity for the Fc region of IgG, it can also bind albumin less specifically. Baussantet al. modified a peptide of protein G to have a much higher affinity for albumin,which significantly and specifically depleted the serum of albumin; however, otherhydrophobic proteins, i.e., apolipoproteins, were also captured [122].
Despite their relatively small size, viruses are fairly complex and encodebetween a dozen and more than 200 proteins. Many of these proteins are post-translationally modified and interact with other viral and host proteins to function.

334 A. Pumfery et al.
Identifying the proteins that are encoded by viruses and the proteins with whichthey interact will greatly further the understanding of viral replication and patho-genesis and proteomic approaches will greatly facilitate these studies. Lastly, theability to diagnose cancer or viral infections at early stages will allow for earlytreatment and reduce the morbidity and mortality associated with these diseases.Proteomic analysis of biological markers in serum should allow for the early non-invasive diagnosis of cancer. Although good reliable methods are available for theanalysis of the serum proteome, the abundance of a few proteins, i.e., albumin andIg, and the low abundance of many other proteins will require methods for sepa-rating out the high-abundance proteins and instruments and methods with enoughsensitivity to identify proteins at low concentration.
5. Future trends
It is becoming increasingly clear that the field of proteomics may require better andmore robust separation methods, sensitive instrumentation, and unbiased bioinfor-matic tools. 2DE has historically provided a rapid means for separating thousandsof proteins from cell and tissue samples in one run. Although this is a powerfulresearch tool and has been enthusiastically applied in many fields of biomedicalresearch, accurate analysis and interpretation of the data have provided manychallenges. Several analysis steps are needed to convert the large amount of noisydata obtained with 2DE into reliable and interpretable biological information. Thegoals of such analysis steps include accurate protein detection and quantification,consistent comparative visualization methods, as well as the identification of dif-ferentially expressed proteins between samples run on different gels. To achievethese goals, systematic errors such as geometric distortions between the gels mustbe corrected by using computer-assisted methods. A wide range of computersoftware has been developed, but no general consensus exists as a standard for2DE data analysis protocols.
In search for new diagnostic and therapeutic targets, 2DE has been used tostudy differential expression of peptides and proteins in various disease entities.However, 2DE usually requires large amounts of starting material, is time-consuming, and reveals only a fraction of the proteins present in a given sample.More recently, the ProteinChip technology coupled with bioinformatics hasgained considerable attention. This technique uses SELDI-TOF/MS to screenprotein sources for putative disease biomarkers in a spectrum from 2 to 20 kDa.Several studies have provided evidence that ProteinChip technology is capable ofdetecting early-stage cancer by its unique cancer-specific proteomic fingerprints,with sensitivities and specificities reaching far beyond well-established serum-based tumor markers [123]. However, as in most rapid diagnosis tests, SELDItechnology can still not detect the nature of the amino acid biomarkers or their

Proteomics of viruses 335
PTM in a consistent and reproducible manner. Clearly other technologies such asthe LC/MS/MS and the LC-FTICR are far more sensitive and better in definingthe composition of these biomarkers.
Finally, very recently, much effort has gone into the concept of “Lab-on-a-chip.”These chips involve micron-sized channels embedded in glass or silicon chips.Attempts have been made to carry out two-dimensional gel-based experiments onchips. Microchips that are able to carry out microfluidic experiments are beingdeveloped (e.g., Nanogen Inc., DiagnoSwiss, Caliper Technologies), which are fasterand more accurate than the conventional gel technology. If such technologies weremade 2DE compatible then it would offer immense research potential. Especiallypromising are advancements in detecting low-abundance proteins and PTM.
6. Conclusions
In this chapter, we have discussed the latest new proteomics findings that relate tosome of the most important viral infections known to humans. These includedHCMV, HSV, EBV, KSHV, HIV, HTLV, HBV, HCV, and SARS infections. Inmany instances we have seen a mere description of the viral or the infected hostcell proteome; however, most of the data to date are descriptive in nature and veryfew studies have correlated phenotype of the infection to the pathology or drugtreatment. Although in some cases investigators have found new enzyme targetsas markers (i.e., SARS-CoV), no serious attempts have been made to functionallyidentify their significance in the pathology of the virus. This is mainly because thefield of viral proteomics is at its early stages of development and much confirma-tory information would be required from animal or human model studies, whichare currently either in progress or will need to be developed in near future.Therefore, a new field of functional viral proteomics is developing in bothindustrial and academic settings to address issues related to functional biomarkers,drug-resistance viruses, and host/pathogen relations that pertain to disease prog-nosis, treatment decision, and monitoring response to therapy.
Another challenging consideration is the mixed infections seen in AIDS patientswho not only may have varying HIV-1 clade infections (more than seven clades,and close to 1500 genetically distinct HIV-1 genotypes) but also are coinfected withother viruses such as HCV or KSHV. The complication of identifying biomarkersin these patients, or in some instances animal models, has never been properlyaddressed in the current literature, nor is there enough awareness between variouscompartments of patient bench to bedside practices. Therefore, a better flow ofinformation using solid epidemiological data followed by better diagnostics for theviral etiology would allow a meaningful identification of the proteome biomarkersseen in these patients. These multiple biomarkers would serve as invaluable toolsfor multiple drug treatments and better control of mixed infections.

336 A. Pumfery et al.
Finally, the issue of frontend purification for the collected test material is per-haps the most important aspect of sample preparation. Currently there are variousmethods that utilize standard separation techniques to remove most abundant pro-teins prior to MS, i.e., removal of some 20 high-abundance proteins and bettervisualization of low-abundance proteins (Sigma-Aldrich kits). However, in mostcases the removal of these proteins may in fact compromise the detection ofbiomarkers or their partners, since in many instances, viral infection leads to over-expression of the most abundant proteins such as the actins, keratins, tubulins,cyclophilins, vimentin, and HSPs among others. Therefore, future attempts at theidentification of biomarkers would have to define not only the most high- and low-abundance proteins but also their partners and possible modifications.
Acknowledgments
This work was supported in part by grants from the George Washington UniversityREF funds to Drs. Fatah Kashanchi and Akos Vertes, and NIH grants AI44357,AI43894 and 13969 to Dr. Fatah Kashanchi. We would like to thank Cynthia de laFuente and Kylene Kehn for their contributions and review of the literature andLynne Mied for the development of figures.
References
1. Wilkins, M.R., Williams, K.L., Appel, R.D. and Hochstrasser, D.F., Proteome Research: NewFrontiers in Functional Genomics. Springer, Berlin, 1997.
2. Gandhi, M.K. and Khanna, R., Human cytomegalovirus: clinical aspects, immune regulation,and emerging treatments. Lancet Infect. Dis., 4, 725–738 (2004).
3. Moss, P. and Khan, N., CD8(�) T-cell immunity to cytomegalovirus. Hum. Immunol., 65,456–464 (2004).
4. Prichard, M.N., Penfold, M.E., Duke, G.M., Spaete, R.R. and Kemble, G.W., A review ofgenetic differences between limited and extensively passaged human cytomegalovirus strains.Rev. Med. Virol., 11, 191–200 (2001).
5. Britt, W.J. and Boppana, S., Human cytomegalovirus virion proteins. Hum. Immunol., 65,395–402 (2004).
6. Varnum, S.M., Streblow, D.N., Monroe, M.E., Smith, P., Auberry, K.J., Pasa-Tolic, L.,Wang, D., Camp, D.G., 2nd, Rodland, K., Wiley, S., Britt, W., Shenk, T., Smith, R.D. andNelson, J.A., Identification of proteins in human cytomegalovirus (HCMV) particles: theHCMV proteome. J. Virol., 78, 10960–10966 (2004).
7. Ambinder, R.F., Epstein–Barr virus-associated lymphoproliferative disorders. Rev. Clin. Exp.Hematol., 7, 362–374 (2003).
8. Cohen, J.I., The biology of Epstein–Barr virus: lessons learned from the virus and the host.Curr. Opin. Immunol., 11, 365–370 (1999).
9. Toda, T., Sugimoto, M., Omori, A., Matsuzaki, T., Furuichi, Y. and Kimura, N., Proteomicanalysis of Epstein–Barr virus-transformed human B-lymphoblastoid cell lines before andafter immortalization. Electrophoresis, 21, 1814–1822 (2000).

Proteomics of viruses 337
10. Schlee, M., Krug, T., Gires, O., Zeidler, R., Hammerschmidt, W., Mailhammer, R., Laux, G.,Sauer, G., Lovric, J. and Bornkamm, G.W., Identification of Epstein–Barr virus (EBV) nuclear antigen 2 (EBNA2) target proteins by proteome analysis: activation of EBNA2 inconditionally immortalized B cells reflects early events after infection of primary B cells byEBV. J. Virol., 78, 3941–3952 (2004).
11. Poirier, F., Pontet, M., Labas, V., le Caer, J.P., Sghiouar-Imam, N., Raphael, M., Caron, M. andJoubert-Caron, R., Two-dimensional database of a Burkitt lymphoma cell line (DG 75)proteins: protein pattern changes following treatment with 5�-azycytidine. Electrophoresis, 22,1867–1877 (2001).
12. Whitley, R.J. In: Howley, P.M. (Ed.), Fields Virology (Vol. 2, 4th edition). Lippincott Williams& Wilkins, Philadelphia, 2001, pp. 2461–2510.
13. Kimberlin, D.W. and Whitley, R.J., Neonatal herpes: what have we learned. Semin. Pediatr.Infect. Dis., 16, 7–16 (2005).
14. Kawaguchi, Y., Matsumura, T., Roizman, B. and Hirai, K., Cellular elongation factor 1delta ismodified in cells infected with representative alpha-, beta-, or gammaherpesviruses. J. Virol.,73, 4456–4460 (1999).
15. Kawaguchi, Y., Kato, K., Tanaka, M., Kanamori, M., Nishiyama, Y. and Yamanashi, Y.,Conserved protein kinases encoded by herpesviruses and cellular protein kinase cdc2 targetthe same phosphorylation site in eukaryotic elongation factor 1delta. J. Virol., 77, 2359–2368(2003).
16. Walsh, D. and Mohr, I., Phosphorylation of eIF4E by Mnk-1 enhances HSV-1 translation andreplication in quiescent cells. Genes. Dev., 18, 660–672 (2004).
17. Greco, A., Bienvenut, W., Sanchez, J.C., Kindbeiter, K., Hochstrasser, D., Madjar, J.J. andDiaz, J.J., Identification of ribosome-associated viral and cellular basic proteins during thecourse of infection with herpes simplex virus type 1. Proteomics., 1, 545–549 (2001).
18. Fontaine-Rodriguez, E.C., Taylor, T.J., Olesky, M. and Knipe, D.M., Proteomics of herpessimplex virus infected cell protein 27: association with translation initiation factors. Virology,330, 487–492 (2004).
19. Taylor, T.J. and Knipe, D.M., Proteomics of herpes simplex virus replication compartments:association of cellular DNA replication, repair, recombination, and chromatin remodelingproteins with ICP8. J. Virol., 78, 5856–5866 (2004).
20. Prevalence of IgG antibody to SARS-associated coronavirus in animal traders— GuangdongProvince, China, 2003. MMWR Morb Mortal Wkly Rep, 52, 986–987 (2003).
21. Berger, A., Drosten, C., Doerr, H.W., Sturmer, M. and Preiser, W., Severe acute respiratorysyndrome (SARS)—paradigm of an emerging viral infection. J. Clin. Virol., 29, 13–22(2004).
22. Kang, X., Xu, Y., Wu, X., Liang, Y., Wang, C., Guo, J., Wang, Y., Chen, M., Wu, D., Bi, S.,Qiu, Y., Lu, P., Cheng, J., Xiao, B., Hu, L., Gao, X., Liu, J., Song, Y., Zhang, L., Suo, F.,Chen, T., Huang, Z., Zhao, Y., Lu, H., Pan, C. and Tang, H., Proteomic fingerprints for poten-tial application to early diagnosis of severe acute respiratory syndrome. Clin. Chem., 51,56–64 (2005).
23. Chen, J.H., Chang, Y.W., Yao, C.W., Chiueh, T.S., Huang, S.C., Chien, K.Y., Chen, A., Chang,F.Y., Wong, C.H. and Chen, Y.J., Plasma proteome of severe acute respiratory syndromeanalyzed by two-dimensional gel electrophoresis and mass spectrometry. Proc. Natl. Acad.Sci. U.S.A., 101, 17039–17044 (2004).
24. Snijder, E.J., Bredenbeek, P.J., Dobbe, J.C., Thiel, V., Ziebuhr, J., Poon, L.L., Guan, Y.,Rozanov, M., Spaan, W.J. and Gorbalenya, A.E., Unique and conserved features of genomeand proteome of SARS-coronavirus, an early split-off from the coronavirus group 2 lineage.J. Mol. Biol., 331, 991–1004 (2003).
25. Dickson, R.C., Clinical manifestations of hepatitis C. Clin. Liver Dis., 1, 569–585 (1997).

338 A. Pumfery et al.
26. Choi, Y.W., Tan, Y.J., Lim, S.G., Hong, W. and Goh, P.Y., Proteomic approach identifiesHSP27 as an interacting partner of the hepatitis C virus NS5A protein. Biochem. Biophys. Res.Commun., 318, 514–519 (2004).
27. Block, T.M., Comunale, M.A., Lowman, M., Steel, L.F., Romano, P.R., Fimmel, C.,Tennant, B.C., London, W.T., Evans, A.A., Blumberg, B.S., Dwek, R.A., Mattu, T.S. andMehta, A.S., Use of targeted glycoproteomics to identify serum glycoproteins that corre-late with liver cancer in woodchucks and humans. Proc. Natl. Acad. Sci. U.S.A., 102,779–784 (2005).
28. Kim, W., Oe Lim, S., Kim, J.S., Ryu, Y.H., Byeon, J.Y., Kim, H.J., Kim, Y.I., Heo, J.S., Park,Y.M. and Jung, G., Comparison of proteome between hepatitis B virus- and hepatitis C virus-associated hepatocellular carcinoma. Clin. Cancer Res., 9, 5493–5500 (2003).
29. Tossing, G., Management of chronic hepatitis C in HIV-co-infected patients—results from theFirst International Workshop on HIV and Hepatitis Co-infection, 2nd–4th December 2004,Amsterdam, Netherlands. Eur. J. Med. Res., 10, 43–45 (2005).
30. Rockstroh, J.K. and Spengler, U., HIV and hepatitis C virus co-infection. Lancet. Infect. Dis.,4, 437–444 (2004).
31. Carlson, K.A., Ciborowski, P., Schellpeper, C.N., Biskup, T.M., Shen, R.F., Luo, X., Destache,C.J. and Gendelman, H.E., Proteomic fingerprinting of HIV-1-infected human monocyte-derived macrophages: a preliminary report. J. Neuroimmunol., 147, 35–42 (2004).
32. Yip, T.T., Chan, J.W., Cho, W.C., Wang, Z., Kwan, T.L., Law, S.C., Tsang, D.N., Chan, J.K.,Lee, K.C., Cheng, W.W., Ma, V.W., Yip, C., Lim, C.K., Ngan, R.K., Au, J.S., Chan, A. andLim, W.W., Protein chip array profiling analysis in patients with severe acute respiratorysyndrome identified serum amyloid a protein as a biomarker potentially useful in monitoringthe extent of pneumonia. Clin. Chem., 51, 47–55 (2005).
33. Wojna, V., Carlson, K.A., Luo, X., Mayo, R., Melendez, L.M., Kraiselburd, E. and Gendelman,H. E., Proteomic fingerprinting of human immunodeficiency virus type 1-associated dementiafrom patient monocyte-derived macrophages: a case study. J. Neurovirol., 10(Suppl. 1), 74–81(2004).
34. Luo, X., Carlson, K.A., Wojna, V., Mayo, R., Biskup, T.M., Stoner, J., Anderson, J.,Gendelman, H.E. and Melendez, L.M., Macrophage proteomic fingerprinting predictsHIV-1-associated cognitive impairment. Neurology, 60, 1931–1937 (2003).
35. Fuchigami, T., Misumi, S., Takamune, N., Takahashi, I., Takama, M. and Shoji, S., Acid-labileformylation of amino terminal proline of human immunodeficiency virus type 1 p24(gag) wasfound by proteomics using two-dimensional gel electrophoresis and matrix-assisted laserdesorption/ionization-time-of-flight mass spectrometry. Biochem. Biophys. Res. Commun., 293,1107–1113 (2002).
36. Chelius, D., Huhmer, A.F., Shieh, C.H., Lehmberg, E., Traina, J.A., Slattery, T.K. and Pungor,E., Jr., Analysis of the adenovirus type 5 proteome by liquid chromatography and tandem massspectrometry methods. J. Proteome. Res., 1, 501–513 (2002).
37. Yao, X., Freas, A., Ramirez, J., Demirev, P.A. and Fenselau, C., Proteolytic 18O labeling forcomparative proteomics: model studies with two serotypes of adenovirus. Anal. Chem., 73,2836–2842 (2001).
38. Yan, W., Lee, H., Deutsch, E.W., Lazaro, C.A., Tang, W., Chen, E., Fausto, N., Katze, M.G.and Aebersold, R., A dataset of human liver proteins identified by protein profiling via isotope-coded affinity tag (ICAT) and tandem mass spectrometry. Mol. Cell. Proteomics, 3,1039–1041 (2004).
39. Bao, Y., Federhen, S., Leipe, D., Pham, V., Resenchuk, S., Rozanov, M., Tatusov, R. andTatusova, T., National center for biotechnology information viral genomes project. J. Virol.,78, 7291–7298 (2004).

Proteomics of viruses 339
40. Bechtel, J.T., Winant, R.C. and Ganem, D., Host and viral proteins in the virion of Kaposi’ssarcoma-associated herpesvirus. J. Virol., 79, 4952–4964 (2005).
41. Nealon, K., Newcomb, W.W., Pray, T.R., Craik, C.S., Brown, J.C. and Kedes, D.H., Lyticreplication of Kaposi’s sarcoma-associated herpesvirus results in the formation of multiple cap-sid species: isolation and molecular characterization of A, B, and C capsids from a gammaher-pesvirus. J. Virol., 75, 2866–2878 (2001).
42. Roizman, B. and Pellett, P.E. In: Howley, P.M., (Ed.), Fields Virology (Vol. 2, 4th edition).Lippincott Williams & Wilkins, Philadelphia, 2001, pp. 2381–2398.
43. Triezenberg, S.J., Kingsbury, R.C. and McKnight, S.L., Functional dissection of VP16, thetrans-activator of herpes simplex virus immediate early gene expression. Genes. Dev., 2,718–729 (1988).
44. Russo, J.J., Bohenzky, R.A., Chien, M.C., Chen, J., Yan, M., Maddalena, D., Parry, J.P.,Peruzzi, D., Edelman, I.S., Chang, Y. and Moore, P.S., Nucleotide sequence of the Kaposisarcoma-associated herpesvirus (HHV8). Proc. Natl. Acad. Sci. U.S.A., 93, 14862–14867 (1996).
45. Zhu, F.X., Chong, J.M., Wu, L. and Yuan, Y., Virion proteins of Kaposi’s sarcoma-associatedherpesvirus. J. Virol., 79, 800–811 (2005).
46. Young, L.S. and Rickinson, A.B., Epstein–Barr virus: 40 years on. Nat. Rev. Cancer, 4,757–768 (2004).
47. Toda, T. and Sugimoto, M., Proteome analysis of Epstein–Barr virus-transformed B-lymphoblasts and the proteome database. J. Chromatogr. B Analyt. Technol. Biomed. LifeSci., 787, 197–206 (2003).
48. Sixbey, J.W., Shirley, P., Sloas, M., Raab-Traub, N. and Israele, V., A transformation-incompetent, nuclear antigen 2-deleted Epstein–Barr virus associated with replicative infec-tion. J. Infect. Dis., 163, 1008–1015 (1991).
49. Kempkes, B., Spitkovsky, D., Jansen-Durr, P., Ellwart, J.W., Kremmer, E., Delecluse, H.J.,Rottenberger, C., Bornkamm, G.W. and Hammerschmidt, W., B-cell proliferation and induc-tion of early G1-regulating proteins by Epstein–Barr virus mutants conditional for EBNA2.Embo. J., 14, 88–96 (1995).
50. Kaiser, C., Laux, G., Eick, D., Jochner, N., Bornkamm, G.W. and Kempkes, B., The proto-oncogene c-myc is a direct target gene of Epstein–Barr virus nuclear antigen 2. J. Virol., 73,4481–4484 (1999).
51. Polack, A., Hortnagel, K., Pajic, A., Christoph, B., Baier, B., Falk, M., Mautner, J., Geltinger,C., Bornkamm, G.W. and Kempkes, B., c-myc activation renders proliferation of Epstein–Barrvirus (EBV)-transformed cells independent of EBV nuclear antigen 2 and latent membraneprotein 1. Proc. Natl. Acad. Sci. U.S.A., 93, 10411–10416 (1996).
52. Leone, A., Flatow, U., King, C.R., Sandeen, M.A., Margulies, I.M., Liotta, L.A. and Steeg,P.S., Reduced tumor incidence, metastatic potential, and cytokine responsiveness of nm23-transfected melanoma cells. Cell., 65, 25–35 (1991).
53. Roizman, B. and Knipe, D.M., Herpes simplex viruses and their replication (4th edition).Howley, P.M., Philadelphia: Lippincott Williams and Wilkins, 2001.
54. Phelan, A., Dunlop, J., Patel, A.H., Stow, N.D. and Clements, J.B., Nuclear sites of herpes sim-plex virus type 1 DNA replication and transcription colocalize at early times postinfection andare largely distinct from RNA processing factors. J. Virol., 71, 1124–1132 (1997).
55. Liptak, L.M., Uprichard, S.L. and Knipe, D.M., Functional order of assembly of herpessimplex virus DNA replication proteins into prereplicative site structures. J. Virol., 70,1759–1767 (1996).
56. Mancebo, H.S., Lee, G., Flygare, J., Tomassini, J., Luu, P., Zhu, Y., Peng, J., Blau, C., Hazuda,D., Price, D. and Flores, O., P-TEFb kinase is required for HIV Tat transcriptional activationin vivo and in vitro. Genes Dev., 11, 2633–2644 (1997).

340 A. Pumfery et al.
57. Zhu, Y., Pe’ery, T., Peng, J., Ramanathan, Y., Marshall, N., Marshall, T., Amendt, B., Mathews,M.B. and Price, D.H., Transcription elongation factor P-TEFb is required for HIV-1 tat trans-activation in vitro. Genes Dev., 11, 2622–2632 (1997).
58. Van Lint, C., Emiliani, S., Ott, M. and Verdin, E., Transcriptional activation and chromatinremodeling of the HIV-1 promoter in response to histone acetylation. Embo. J., 15, 1112–1120(1996).
59. Verdin, E., Paras, P., Jr. and Van Lint, C., Chromatin disruption in the promoter of humanimmunodeficiency virus type 1 during transcriptional activation. Embo. J., 12, 3249–3259(1993).
60. Pumfery, A., Deng, L., Maddukuri, A., de la Fuente, C., Li, H., Wade, J.D., Lambert, P.,Kumar, A. and Kashanchi, F., Chromatin remodeling and modification during HIV-1 Tat-activated transcription. Current HIV Res., 1, 343–362 (2003).
61. Deng, L., de la Fuente, C., Fu, P., Wang, L., Donnelly, R., Wade, J.D., Lambert, P., Li, H.,Lee, C.G. and Kashanchi, F. Acetylation of HIV-1 Tat by CBP/P300 increases transcription ofintegrated HIV-1 genome and enhances binding to core histones. Virology, 277, 278–295 (2000).
62. Deng, L., Wang, D., de la Fuente, C., Wang, L., Li, H., Lee, C.G., Donnelly, R., Wade, J.D.,Lambert, P. and Kashanchi, F., Enhancement of the p300 HAT activity by HIV-1Tat on chromatin DNA. Virology, 289, 312–326 (2001).
63. Janssen, R.S., Nwanyanwu, O.C., Selik, R. M. and Stehr-Green, J.K., Epidemiology of humanimmunodeficiency virus encephalopathy in the United States. Neurology, 42, 1472–1476(1992).
64. Masliah, E., Ge, N. and Mucke, L. (1996). Pathogenesis of HIV-1 associated neurodegenera-tion. Crit. Rev. Neurobiol., 10, 57-67
65. Chauhan, A., Turchan, J., Pocernich, C., Bruce-Keller, A., Roth, S., Butterfield, D.A., Major,E.O. and Nath, A., Intracellular human immunodeficiency virus Tat expression in astrocytespromotes astrocyte survival but induces potent neurotoxicity at distant sites via axonal trans-port. J. Biol. Chem., 278, 13512–13519 (2003).
66. Pocernich, C.B., Boyd-Kimball, D., Poon, H.F., Thongboonkerd, V., Lynn, B.C., Klein, J.B.,Calebrese, V., Nath, A. and Butterfield, D.A., Proteomics analysis of human astrocytesexpressing the HIV protein Tat. Brain Res. Mol. Brain Res., 133, 307–316 (2005).
67. Adamson, D.C., McArthur, J.C., Dawson, T.M. and Dawson, V.L., Rate and severity ofHIV-associated dementia (HAD): correlations with Gp41 and iNOS. Mol. Med., 5, 98–109(1999).
68. Adamson, D.C., Wildemann, B., Sasaki, M., Glass, J.D., McArthur, J.C., Christov, V.I.,Dawson, T.M. and Dawson, V.L., Immunologic NO synthase: elevation in severe AIDSdementia and induction by HIV-1 gp41. Science, 274, 1917–1921 (1996).
69. Mahieux, R. and Gessain, A., HTLV-1 and associated adult T-cell leukemia/lymphoma.Rev. Clin. Exp. Hematol., 7, 336–361 (2003).
70. Kehn, K., Berro, R., de la Fuente, C., Strouss, K., Ghedin, E., Dadgar, S., Bottazzi, M.E.,Pumfery, A. and Kashanchi, F., Mechanisms of HTLV-1 transformation. Front Biosci., 9,2347–2372 (2004).
71. Suzuki, T., Fujisawa, J.I., Toita, M. and Yoshida, M., The trans-activator tax of human T-cellleukemia virus type 1 (HTLV-1) interacts with cAMP-responsive element (CRE) binding andCRE modulator proteins that bind to the 21-base-pair enhancer of HTLV-1. Proc. Natl. Acad.Sci. U.S.A., 90, 610–614 (1993).
72. Yoshida, M., Mechanism of transcriptional activation of viral and cellular genes by oncogenicprotein of HTLV-1. Leukemia, 8(Suppl. 1), S51–S53 (1994).
73. Wu, K., Bottazzi, M.E., de la Fuente, C., Deng, L., Gitlin, S.D., Maddukuri, A., Dadgar, S.,Li, H., Vertes, A., Pumfery, A. and Kashanchi, F., Protein profile of tax-associated complexes.J. Biol. Chem., 279, 495–508 (2004).

Proteomics of viruses 341
74. Oda, T., Watanabe, S., Sumii, H., Nakamura, T., Arakaki, Y. and Shimotohno, K.,Immunoelectron microscopic localization of the pX gene products in human T-cell leukemiavirus type 1-producing cells. Cancer Res., 47, 2077–2082 (1987).
75. Bosch, F.X., Ribes, J. and Borras, J., Epidemiology of primary liver cancer. Semin. Liver Dis.,19, 271–285 (1999).
76. Beasley, R.P., Hepatitis B virus. The major etiology of hepatocellular carcinoma. Cancer, 61,1942–1956 (1988).
77. el-Refaie, A., Savage, K., Bhattacharya, S., Khakoo, S., Harrison, T.J., el-Batanony, M.,Soliman el, S., Nasr, S., Mokhtar, N., Amer, K., Scheuer, P.J. and Dhillon, A.P., HCV-associated hepatocellular carcinoma without cirrhosis. J. Hepatol., 24, 277–285 (1996).
78. Colombo, M., Hepatitis C virus and hepatocellular carcinoma. Semin. Liver Dis., 19, 263–269(1999).
79. Lavanchy, D., Hepatitis B virus epidemiology, disease burden, treatment, and current andemerging prevention and control measures. J. Viral Hepat., 11, 97–107 (2004).
80. El-Serag, H.B. and Mason, A.C., Rising incidence of hepatocellular carcinoma in the UnitedStates. N. Engl. J. Med., 340, 745–750 (1999).
81. Steel, L.F., Mattu, T.S., Mehta, A., Hebestreit, H., Dwek, R., Evans, A.A., London, W.T. andBlock, T., A proteomic approach for the discovery of early detection markers of hepatocellularcarcinoma. Dis. Markers, 17, 179–189 (2001).
82. Wirth, P.J., Hoang, T.N. and Benjamin, T., Micropreparative immobilized pH gradient two-dimensional electrophoresis in combination with protein microsequencing for the analysis ofhuman liver proteins. Electrophoresis, 16, 1946–1960 (1995).
83. Seow, T.K., Ong, S.E., Liang, R.C., Ren, E.C., Chan, L., Ou, K. and Chung, M.C., Two-dimensional electrophoresis map of the human hepatocellular carcinoma cell line, HCC-M,and identification of the separated proteins by mass spectrometry. Electrophoresis, 21,1787–1813 (2000).
84. Yu, L.R., Zeng, R., Shao, X.X., Wang, N., Xu, Y.H. and Xia, Q.C., Identification of differ-entially expressed proteins between human hepatoma and normal liver cell lines by two-dimensional electrophoresis and liquid chromatography-ion trap mass spectrometry.Electrophoresis, 21, 3058–3068 (2000).
85. Hanash, S.M., Biomedical applications of two-dimensional electrophoresis using immobilizedpH gradients: current status. Electrophoresis, 21, 1202–1209 (2000).
86. Heller, T., Saito, S., Auerbach, J., Williams, T., Moreen, T.R., Jazwinski, A., Cruz, B., Jeurkar,N., Sapp, R., Luo, G. and Liang, T.J., An in vitro model of hepatitis C virion production. Proc.Natl. Acad. Sci. U.S.A., 102, 2579–2583 (2005).
87. Lindenbach, B.D., Evans, M.J., Syder, A.J., Wolk, B., Tellinghuisen, T.L., Liu, C.C.,Maruyama, T., Hynes, R.O., Burton, D.R., McKeating, J.A. and Rice, C.M., Complete repli-cation of hepatitis C virus in cell culture. Science, 5734, 623–626 (2005).
88. Major, M.E., Rehermann, B. and Feinstone, S.M., In: Howley, P.M. (Ed.), Fields Virology(Vol. 2, 4th edition). Lippincott Williams & Wilkins, Philadelphia, 2001, pp. 1127–1183.
89. Blight, K.J., Kolykhalov, A.A. and Rice, C.M., Efficient initiation of HCV RNA replication incell culture. Science, 290, 1972–1974 (2000).
90. Satoh, S., Hirota, M., Noguchi, T., Hijikata, M., Handa, H. and Shimotohno, K., Cleavage ofhepatitis C virus nonstructural protein 5A by a caspase-like protease(s) in mammalian cells.Virology, 270, 476–487 (2000).
91. Lan, K.H., Sheu, M.L., Hwang, S.J., Yen, S.H., Chen, S.Y., Wu, J.C., Wang, Y.J., Kato, N.,Omata, M., Chang, F.Y. and Lee, S.D., HCV NS5A interacts with p53 and inhibits p53-mediated apoptosis. Oncogene, 21, 4801–4811 (2002).
92. Concannon, C.G., Gorman, A.M. and Samali, A., On the role of Hsp27 in regulating apopto-sis. Apoptosis, 8, 61–70 (2003).

342 A. Pumfery et al.
93. Hanash, S., Disease proteomics. Nature, 422, 226–232 (2003).94. Boguski, M. and McIntosh, M., Biomedical informatics for proteomics. Nature, 422, 233–237
(2003).95. Gorg, A., Obermaier, C., Boguth, G., Harder, A., Scheibe, B., Wildgruber, R. and Weiss, W.,
The current state of two-dimensional electrophoresis with immobilized pH gradients.Electrophoresis, 21, 1037–1053 (2000).
96. Gorg, A., Weiss, W. and Dunn, M., Current two-dimensional electrophoresis technology forproteomics. Proteomics, 4, 3665–3685 (2004).
97. Chen, J., Ueda, K., Sakakibara, S., Okuno, T., Parravicini, C., Corbellino, M. and Yamanishi, K.,Activation of latent Kaposi’s sarcoma-associated herpesvirus by demethylation of the pro-moter of the lytic transactivator. Proc. Natl. Acad. Sci. U.S.A., 98, 4119–4124 (2001).
98. Lamerz, R., Runge, M., Stieber, P. and Meissner, E., Use of serum PIVKA-II (DCP) determi-nation for differentiation between benign and malignant liver diseases. Anticancer Res., 19,2489–2493 (1999).
99. Steel, L., Shumpert, D., Trotter, M., Seeholzer, S., Evans, A., London, W., Dwek, R. andBlock, T., A strategy for the comparative analysis of serum proteomes for the discovery of bio-markers for hepatocellular carcinoma. Proteomics, 3, 601–609 (2003).
100. Comunale, M.A., Mattu, T.S., Lowman, M.A., Evans, A.A., London, W.T., Semmes, O.J.,Ward, M., Drake, R., Romano, P.R., Steel, L.F., Block, T.M. and Mehta, A., Comparativeproteomic analysis of de-N-glycosylated serum from hepatitis B carriers reveals polypeptidesthat correlate with disease status. Proteomics, 4, 826–838 (2004).
101. Yokoyama, Y., Kuramitsu, Y., Takashima, M., Iizuka, N., Toda, T., Terai, S., Sakaida, I., Oka,M., Nakamura, K. and Okita, K., Proteomic profiling of proteins decreased in hepatocellularcarcinoma from patients infected with hepatitis C virus. Proteomics, 4, 2111–2116 (2004).
102. Parker, B.W., Kaur, G., Nieves-Neira, W., Taimi, M., Kohlhagen, G., Shimizu, T., Losiewicz,M.D., Pommier, Y., Sausville, E.A. and Senderowicz, A.M., Early induction of apoptosis inhematopoietic cell lines after exposure to flavopiridol. Blood, 91, 458–465 (1998).
103. Bonner, R., Emmert-Buck, M., Cole, K., Pohida, T., Chuaqui, R., Goldstein, S. and Liotta, L.,Laser capture microdissection: molecular analysis of tissue. Science, 278, 1481–1483 (1997).
104. Hunt, D.F., Yates, J.R., 3rd, Shabanowitz, J., Winston, S. and Hauer, C.R., Protein sequencingby tandem mass spectrometry. Proc. Natl. Acad. Sci. U.S.A., 83, 6233–6237 (1986).
105. Gygi, S.P., Corthals, G.L., Zhang, Y., Rochon, Y. and Aebersold, R., Evaluation of two-dimensional gel electrophoresis-based proteome analysis technology. Proc. Natl. Acad. Sci.U.S.A., 97, 9390–9395 (2000).
106. Lam, L.T., Pickeral, O.K., Peng, A.C., Rosenwald, A., Hurt, E.M., Giltnane, J.M., Averett, L.M.,Zhao, H., Davis, R.E., Sathyamoorthy, M., Wahl, L.M., Harris, E.D., Mikovits, J.A., Monks,A.P., Hollingshead, M.G., Sausville, E.A. and Staudt, L.M., Genomic-scale measurement ofmRNA turnover and the mechanisms of action of the anti-cancer drug flavopiridol. GenomeBiol, 2, RESEARCH0041.0041–RESEARCH00041.00011 (2001).
107. Wall, D.B., Kachman, M.T., Gong, S., Hinderer, R., Parus, S., Misek, D.E., Hanash, S.M. andLubman, D.M., Isoelectric focusing nonporous RP HPLC: a two-dimensional liquid-phaseseparation method for mapping of cellular proteins with identification using MALDI-TOFmass spectrometry. Anal. Chem., 72, 1099–1111 (2000).
108. Maurer, H.H., Multi-analyte procedures for screening for and quantification of drugs in blood,plasma, or serum by liquid chromatography-single stage or tandem mass spectrometry (LC-MSor LC-MS/MS) relevant to clinical and forensic toxicology. Clin. Biochem., 38, 310–318 (2005).
109. Wu, S.L., Amato, H., Biringer, R., Choudhary, G., Shieh, P. and Hancock, W.S., Targeted pro-teomics of low-level proteins in human plasma by LC/MSn: using human growth hormone asa model system. J. Proteome Res., 1, 459–465 (2002).

Proteomics of viruses 343
110. Nelson, R.E., Grebe, S.K., DJ, O.K. and Singh, R.J., Liquid chromatography-tandem massspectrometry assay for simultaneous measurement of estradiol and estrone in human plasma.Clin. Chem., 50, 373–384 (2004).
111. Tuthill, C.W., Rudolph, A., Li, Y., Tan, B., Fitzgerald, T.J., Beck, S.R. and Li, Y.X.,Quantitative analysis of thymosin alpha1 in human serum by LC-MS/MS. AAPS Pharm. Sci.Tech., 1, E11 (2000).
112. Poon, T.C., Chan, K.C., Ng, P.C., Chiu, R.W., Ang, I.L., Tong, Y.K., Ng, E.K., Cheng, F.W.,Li, A.M., Hon, E.K., Fok, T.F. and Lo, Y.M., Serial analysis of plasma proteomic signatures inpediatric patients with severe acute respiratory syndrome and correlation with viral load. Clin.Chem., 50, 1452–1455 (2004).
113. Davies, D.H., Liang, X., Hernandez, J.E., Randall, A., Hirst, S., Mu, Y., Romero, K.M.,Nguyen, T.T., Kalantari-Dehaghi, M., Crotty, S., Baldi, P., Villarreal, L.P. and Felgner, P.L.,Profiling the humoral immune response to infection by using proteome microarrays: high-throughput vaccine and diagnostic antigen discovery. Proc. Natl. Acad. Sci. U.S.A., 102,547–552 (2005).
114. Laemmli, U.K., Cleavage of structural proteins during the assembly of the head of bacterio-phage T4. Nature, 227, 680–685 (1970).
115. O’Farrell, P.H., High resolution two-dimensional electrophoresis of proteins. J. Biol. Chem.,250, 4007–4021 (1975).
116. Pumfery, A., de la Fuente, C.R. Berro, Nekhai, S.F. Kashanchi and Chao., S.H. Potential useof pharmacological cyclin dependent kinase inhibitors as anti HIV therapeutics. Curr. Pharm.Des. 12, 1949–1961 (2005).
117. de la Fuente, C., Maddukuri, A., Kehn, K., Baylor, S.Y., Deng, L., Pumfery, A. and Kashanchi, F.,Pharmacological cyclin-dependent kinase inhibitors as HIV-1 antiviral therapeutics. Curr.HIV Res., 1, 131–152 (2003).
118. Chao, S.H., Fujinaga, K., Marion, J.E., Taube, R., Sausville, E.A., Senderowicz, A.M.,Peterlin, B.M. and Price, D.H., Flavopiridol inhibits P-TEFb and blocks HIV-1 replication.J. Biol. Chem., 275, 28345–28348 (2000).
119. Georgiou, H.M., Rice, G.E. and Baker, M.S., Proteomic analysis of human plasma: failure ofcentrifugal ultrafiltration to remove albumin and other high molecular weight proteins.Proteomics, 1, 1503–1506 (2001).
120. Pieper, R., Su, Q., Gatlin, C.L., Huang, S.T., Anderson, N.L. and Steiner, S., Multi-componentimmunoaffinity subtraction chromatography: an innovative step towards a comprehensivesurvey of the human plasma proteome. Proteomics, 3, 422–432 (2003).
121. Ahmed, N., Barker, G., Oliva, K., Garfin, D., Talmadge, K., Georgiou, H., Quinn, M. andRice, G., An approach to remove albumin for the proteomic analysis of low abundancebiomarkers in human serum. Proteomics, 3, 1980–1987 (2003).
122. Baussant, T., Bougueleret, L., Johnson, A., Rogers, J., Menin, L., Hall, M., Aberg, P.M. andRose, K., Effective depletion of albumin using a new peptide-based affinity medium.Proteomics, 5, 973–977 (2005).
123. Petricoin, E.F. and Liotta, L.A., SELDI-TOF-based serum proteomic pattern diagnostics forearly detection of cancer. Curr. Opin. Biotechnol., 15, 24–30 (2004).

This page intentionally left blank

Medical Applications of Mass SpectrometryK. Vékey, A. Telekes and A. Vertes (editors)© 2008 Elsevier B.V. All rights reserved
345
Chapter 16
Neonatal research
BRUNO CASETTA*
Applied Biosystems, Monza, Italy
1. Introduction 3461.1. Essential medical concepts 3461.2. Basic concept of using LC–MS/MS technology in the clinical domain 347
2. Principle of the methodology 3483. Quick reference for practical implementation of the methodology 349
3.1. Extraction 3503.2. Butylation 3503.3. Analytical equipment 3513.4. Analytical measurement 3513.5. Expected performances 352
4. Key points of the methodology 3564.1. Quantitation assessment 3564.2. Derivatization 3564.3. FIA flow rate regime 3584.4. MS scanning strategies 3624.5. Data processing 364
5. Ongoing extensions of NBS 3665.1. Extended panel of amino acids 3665.2. Very long chain fatty acids 3695.3. Steroids 3695.4. Bile acids 371
6. Conclusions 374Acknowledgments 376References 376
*Tel.: �39-039-8389-1; Fax: �39-039-8389-497.E-mail: [email protected] (B. Casetta).

346 B. Casetta
1. Introduction
Generally speaking, and from the mass spectrometry perspective, “neonatal research”is viewed mainly as newborn screening (NBS) which can be defined as thepresymptomatic identification of the most commonly known inborn errors ofmetabolism (IEM).
Mass spectrometric techniques for the identification of metabolic disordershave been developed since the early 1970s. Before the recent advent of tandemmass spectrometry coupled to liquid chromatography (LC–MS/MS), thesemethodologies were based on mass spectrometry coupled to gas chromatography(GC–MS). They were time-consuming and unable to handle non-volatile com-pounds unless a chemical derivatization step was performed. Today GC–MStechniques are still used in the clinical laboratories but they are more devoted forconfirmation of diagnosis, now the LC–MS/MS unquestionably being recognizedas the “tool” for any NBS program.
A lot of papers have recently appeared either as reviews (a very exhaustive oneis in ref. [1]) or as chronicles [2] concerning the technical developments of NBSwith tandem mass spectrometry (LC–MS/MS).
If deeply interested in some specific details, the reader can refer to thosepapers. The present chapter would like to give the essential information to bothchemists and medical professionals and make them able to leverage this incon-trovertible opportunity in detecting metabolic disorders.
The largest part of the present work is devoted to the original format of NBSmethodology (centered on acyl-carnitine (AC) profile and most of the aminoacids (AA)) with particular attention to some practical issues. A second part willcover the characterization of very long chain fatty acids, steroids, bile acids (BA),and other markers which are gaining relevance in the NBS context.
1.1. Essential medical concepts
Mutations of genes encoding enzymes or transport proteins lead to IEM.Disruption of most of the enzyme functions causes in the body fluids an accumu-lation of the substrate of the affected enzyme reaction. This accumulation caneven trigger alternate biochemical reactions leading to some unusual metabolites.The aim of the NBS approach is to detect these metabolites (either as substrate ofthe affected specific enzyme activity or as unnatural metabolite secondarily pro-duced in the biochemical reaction chain).
In the original protocol (still the most used one in the large-scale programs),the investigated markers are the AA and the AC. Their detection enables the iden-tification of the involved inherited metabolic disorders (also termed IEM) in theneonatal period.

Neonatal research 347
Recent reports claim the ability to screen more than 30 metabolic disorders witha single analysis. Early medical intervention can avoid irreversible damages likephysical and mental retardation, if not death.
Most of the times, for the new adopters of LC–MS/MS in NBS, protocol isviewed in parallel with one of the most known screening tests for screening thephenylketonuria (PKU), introduced in 1963 by Guthrie and Susi [3]. It leveragesa bacterial growth inhibition assay for quantifying the phenylalanine in neonateblood. Despite being questionable about precision and accuracy, the test has beenwidely accepted because it is fast, easy in collecting and transferring the specimen(heel-blood of the infant is dried on a filter paper), and cheap.
NBS is sharing with LC–MS/MS the same sample collection (filter paper col-lection and handling is now referred as dried blood spot (DBS)) and sometimesthis creates some confusion in the terminology. For example, “Guthrie” card wasintended to be the filter paper where blood is collected and today, with the adop-tion of LC–MS/MS, this definition is still used, even if LC–MS/MS has nothingto do with the “Guthrie” test (bacterial growth inhibition assay).
1.2. Basic concept of using LC–MS/MS technology in the clinical domain
Historically NBS can be considered as the Trojan horse for making LC–MS/MStechnology accepted in the clinical domain, and for making it now widely considered.
LC–MS/MS technology introduces a new concept in the clinical laboratory, nomore one parameter per test, but more parameters per test. NBS with LC–MS/MS,as depicted in the original protocol, is not limited in characterizing, for example,the PKU metabolic disease, but some 30 different altered metabolic functions, allwith a running time of 2–3 min.
LC–MS/MS, as widely evidenced in other analytical domains like the phar-maceutical one, is characterized by high sensitivity and high linear range, fea-tures which are elective for any quantitation job, all associated with unsurpassedspecificity.
Mass spectrometry detects the mass of any required molecule through a “massanalyzer” and measures as well the “amount” of that specific molecule. Consideringthe huge number of any possible molecules existing around us, sometimes massspectrometry is not selective enough: a lot of “small” molecules have the samemass. For gaining the required selectivity, mass spectrometry implements two“mass analyzers” with a special interleaved cell where fragmentation of the ana-lyzed molecule is induced (now tandem mass spectrometry or MS/MS). Highspecificity is now provided by the two mass analyzers working in tandem andfiltering, one the mass of the analyzed molecule and the other the mass of thefragment generated by that molecule when its dissociation is performed in theinterposed collision cell (Fig. 1).

348 B. Casetta
Such a high specificity accounts for fast running tests (like NBS) since chro-matography separation can be skipped. The high specificity enables as well themulti-analyte acquisitions (more analytes measured within the same run).
Staying with the comparison with the classical “Guthrie” test, LC–MS/MSquantifies not only phenylalanine, but also several other “strategically important”AA (for example, tyrosine, and the AA involved in the urea cycle) and, in the samerun, the AC all with high precision and accuracy.
2. Principle of the methodology
As with the original definition, neonatal screening refers to a rapid mass spectro-metric measurement of all the most prominent AC and the most of the AA, all asmarkers of possible IEM (namely AA disorders, fatty acid oxidation disorders, andlysosomal disorders).
Chace and Millington [4–7] can be considered the pioneers of this methodology,proposed some 20 years ago. At the very beginning, fast atom bombardment(FAB) instrumentation was used. It is at the beginning of 1990s that methodol-ogy acquired the actual design (butylation of the sample extract plus electro-spray ionization (ESI) with a triple-quad instrument performing tandem massmeasurement through precursor ion scan and neutral loss scan). Besides theabove-mentioned pioneers, Rashed [8] must be cited as one of the prominentusers of this technology. He leveraged the protocol for characterizing therelative high incidence of cases in his country, acquiring a significant experienceon “positive” cases. Today more and more researchers must be accounted forhaving developed significant expertise in the collection of statistically relevantnumber of tested babies [9]. Some of them have also extended the study over theadult population [10].
Fig. 1. Schematic of a commercial tandem mass spectrometer.
Benchtop Triple-Quad MS Ion Path
RF-only Ion Guide Filt. QuadStubbies
8 mT Ion-Guide Region 2x10⁻⁵ Tor MS Region2 Tor Declust. Region
Curtain Gas
DeclusteringDeclustering
FocusingFocusing
ExtractionExtraction
1st MS-filtration1st MS-filtration
8 mT CAD Region 2x10⁻⁵ Tor MS Region
RF-only Coll. Cell
FragmentationFragmentation
2ndMS-filtration2ndMS-filtration
DetectionDetection
Filt. Quad
Clustered Ion Ion

Neonatal research 349
The actual format is still the most used one, even if more and more users arenow implementing some modifications, as described below.
Filter paper hosting the DBS is punched and extracted with methanol containinga cocktail of either AA or AC, all as isotopically labeled. The extract is butylatedand the resulting butylated esters are subjected to the mass spectrometric measure-ment without any prior chromatographic separation (flow-injection analysis (FIA))but implementing either a neutral loss scan for characterizing the AA profile, aprecursor ion scan for depicting the AC profile, or a multiple reaction monitoringfor quantifying some specific AA such as the “basic” ones (arginine, ornithine,citrulline, homocitrulline, etc.) (Fig. 2). Collected raw data are automatically pro-cessed for expressing the original concentration of all the desired analytes and forconveniently flagging the results falling out of the normal range as defined by themedical professionals (Fig. 3).
3. Quick reference for practical implementation of the methodology
As mentioned, the number of published analytical protocols is in the same order ofmagnitude as the number of papers that has appeared on this specific topic. Eachresearcher has slightly or deeply modified his own method and, for experience of
Fig. 2. Example of raw data generated by a NBS protocol measurement. (Upper left panel) TIC trace.(Upper right panel) Precursor ion scan for AC profile. (Lower right panel) Neutral loss scan for AA profile. (Lower left panel) MRM readings for glycine, ornithine, citrulline, arginine, andhomocitrulline.

350 B. Casetta
the author in dealing with several laboratories, no one is the clone of any other,either because of the different equipments, the different strategies (see below),and/or the different experimental parameters.
Hereby we present a trace, reflecting somehow the original format, which shouldbe a good starting point for any newcomer in this technology. Vessel types are pro-posed for beginners and for minute-scale assays: in routine they are swapped to96-well titer plates.
3.1. Extraction
A circle 3 mm in diameter (roughly corresponding to 3 �L of original blood) ispunched out from each spot by means of a standard hole puncher into 1.5 mLpolypropylene tube. Specimen is pricked-heel blood subsequently dried onSchleicher&Schuell filter paper (in Europe Grade 903 is used at the most).
The spot is treated at room temperature for 20 min with methanol (200 �L) con-taining known amounts of stable-isotope-labeled internal standards for AA and ACas commercially available in a cocktail. The supernatant liquid, containing the sam-ple extract, is transferred to glass autosampler vial (screw-capped).
3.2. Butylation
Solvent is evaporated at 55�C under a gentle stream of nitrogen. Once perfectlydried, sample is then redissolved in the derivatizing reagent (80 �L of 3N HCl inn-butanol). Vial is capped, rotated, and heated at 65�C for 20 min.
Fig. 3. Example of report produced for medical professionals. Abnormal data are convenientlyflagged.

Neonatal research 351
The resulting mixture is once again dried (at 55�C under a gentle stream ofnitrogen), reconstituted with 200 �L of solvent (80% acetonitrile, 20% water, and0.05% formic acid), and put in the autosampler, ready for mass spectrometricmeasurement.
3.3. Analytical equipment
A tandem mass spectrometer must be equipped with an electrospray source and isplumbed as in Fig. 4. LC-pump and an appropriate LC autosampler are used forsolvent delivery and automated sample introduction. The mobile phase is acetoni-trile:water mixture (80:20, v/v) with 0.05% formic acid at a flow rate of 60 �L/min.The autosampler is programmed to inject a volume of 40 �L of the sample.
3.4. Analytical measurement
Tandem mass spectrometric reading exploits some specific features of butylatedAC and AA. By fragmentation, the AC produce a prominent fragment ion at m/z 85,common to all of them (see scheme in Fig. 5). When fragmented, the butylatedAA produce a fragment which is in mass 102 Th less than the precursor ion, dueto a loss of the neutral moiety corresponding to butyl formiate (see schemein Fig. 5).
Consequently, for AC profiles, the precursor ion scan for the product ion atm/z 85 is performed in the range m/z 200–600 and with appropriate collision
Fig. 4. Example of plumbing for performing the NBS protocol.
•
FIA-solvent:80% ACN +0.05% Formic Acid
LC Pump
Tandem Mass spectrometerwith Electrospray Source
Flow 60µL/min
Neonatal Screening Analysis by LC-MSMS
Autosampler
•
FIA-solvent:80% ACN +0.05% Formic Acid
LC Pump
Tandem Mass spectrometerwith Electrospray Source
Flow 60µL/min
Neonatal Screening Analysis by LC-MSMS
Autosampler
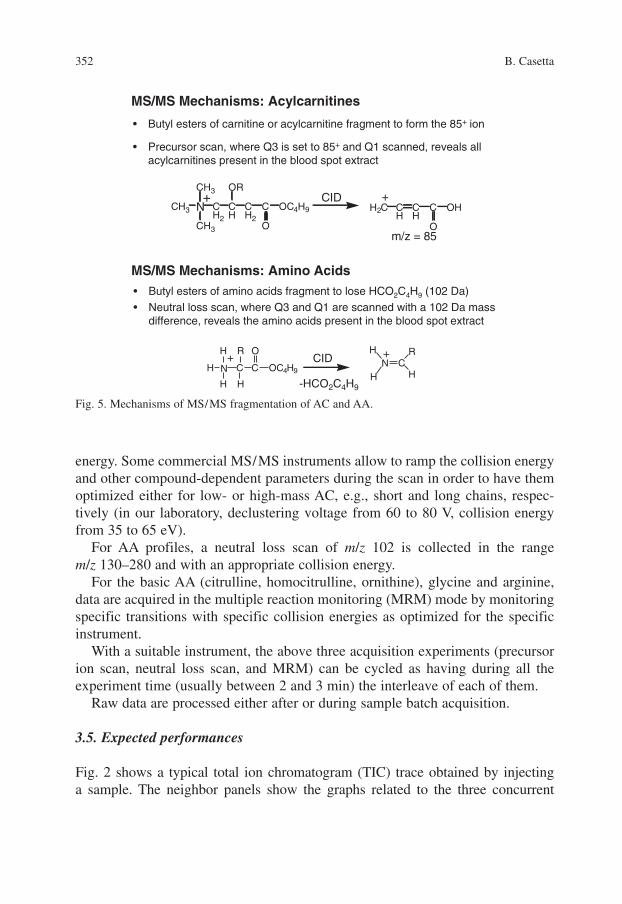
352 B. Casetta
energy. Some commercial MS/MS instruments allow to ramp the collision energyand other compound-dependent parameters during the scan in order to have themoptimized either for low- or high-mass AC, e.g., short and long chains, respec-tively (in our laboratory, declustering voltage from 60 to 80 V, collision energyfrom 35 to 65 eV).
For AA profiles, a neutral loss scan of m/z 102 is collected in the rangem/z 130–280 and with an appropriate collision energy.
For the basic AA (citrulline, homocitrulline, ornithine), glycine and arginine,data are acquired in the multiple reaction monitoring (MRM) mode by monitoringspecific transitions with specific collision energies as optimized for the specificinstrument.
With a suitable instrument, the above three acquisition experiments (precursorion scan, neutral loss scan, and MRM) can be cycled as having during all theexperiment time (usually between 2 and 3 min) the interleave of each of them.
Raw data are processed either after or during sample batch acquisition.
3.5. Expected performances
Fig. 2 shows a typical total ion chromatogram (TIC) trace obtained by injectinga sample. The neighbor panels show the graphs related to the three concurrent
Fig. 5. Mechanisms of MS/MS fragmentation of AC and AA.
MS/MS Mechanisms: Acylcarnitines
• Butyl esters of carnitine or acylcarnitine fragment to form the 85+ ion
• Precursor scan, where Q3 is set to 85+ and Q1 scanned, reveals all acylcarnitines present in the blood spot extract
NCH3
CH3
CH3
CH2
CH
OR
CH2
C OC4H9
O
+ CIDH2C C
HCH
C OH
O
+
m/z = 85
MS/MS Mechanisms: Amino Acids• Butyl esters of amino acids fragment to lose HCO2C4H9 (102 Da)• Neutral loss scan, where Q3 and Q1 are scanned with a 102 Da mass
difference, reveals the amino acids present in the blood spot extract
N
H
H
H
C
R
H
C
O
OC4H9
+ CID NH
HC
R
H
+
-HCO2C4H9

Neonatal research 353
experiments. Fig. 6 shows that TIC traces from several injections are essentiallysuperimposable graphically underscoring the high degree of precision of the methodand the apparatus despite the repeated injection of crude blood spot extracts.
Linearity test can be assessed by spiking analytes in a specimen and evaluatingthe resulting calibration curves. Two such curves are shown in Figs. 7 and 8 foroctanoyl-carnitine and methionine, respectively. The full set of results is found inthe table of Fig. 9. The linear correlations show slopes of between 0.91 and 1.1and correlation coefficients of between 0.994 and 1.000.
Fig. 10 documents the precision obtained by separately extracting and analyz-ing six sets of duplicate blood samples at normal concentration levels. ExhibitedCV’s are between 2.5% for free carnitine at a concentration of 26 �M and 12.6%for octanoyl-carnitine at a concentration of 0.087 �M. Generally, the higher theconcentration of the analyte, the better the precision.
Accuracy can be evaluated by a comparison of MS/MS and HPLC results madefor phenylalanine. The results are shown in Fig. 11, which demonstrates a linearcorrelation with a coefficient of 0.997.
Fig. 6. Overlay of different TIC collected in replicating the MS/MS readings.
TIC: from Sample1 (PoolEssai) of DataMai 18-32.wiff (Turbo Spray) Max.2.4e7 cps.
0.2 0.4 0.6 0.8 1.0 1.2 1.4 1.6 1.8 2.0 2.2 2.4 2.6 2.83 6 8 11 13 16 18 20 23 25 28 30 32 35
Time, min
0.0
1.0e6
2.0e6
3.0e64.0e6
5.0e6
6.0e6
7.0e6
8.0e6
9.0e6
1.0e7
1.1e7
1.2e7
1.3e7
1.4e7
1.5e71.6e7
1.7e7
1.8e7
1.9e7
2.0e7
2.1e7
2.2e7
2.3e7
2.4e7
2.5e7 0.69

354 B. Casetta
0.0
2.0
4.0
6.0
8.0
0.0 2.0 4.0 6.0 8.0
Octanoylcarnitine Added (µM)
335 340 345 350 355m/z, amu
5
15
25
% In
tens
ity
344.4
347.4
348.4
d3-C8carnitine 5µM
C8carnitine 1µM
0.0
2.0
4.0
6.0
8.0
Oct
anoy
lcar
nitin
e M
S/M
S O
bs'd
Con
c. (
µM)
Octanoylcarnitine Added (µM)
y = 1.017x + 0.017 r 2 = 1.000
335 340 345 350 355m/z, amu
5
15
25
% In
tens
ity
344.4
347.4
348.4
d3-C8carnitine 5µM
C8carnitine 1µM
Fig. 7. Linearity test on octanoyl-carnitine (see also table in Fig. 9).
0
200
400
600
800
0 200 400 600 800
y= 0.923x -3.310 r2 = 0.999
206.2
195 200 205 210 215m/z, amu
1.0
2.0
3.0
% In
tens
ity
209.2d3-Met 80µM
Met 65µM
0
200
400
600
800
Met
hion
ine
Con
c. b
y M
S/M
S (µ
M)
Met
hion
ine
Con
c. b
y M
S/M
S (µ
M)
0 200 400 600 800
Methionine Added (µM)Methionine Added (µM)
206.2
195 200 205 210 215m/z, amu
1.0
2.0
3.0
% In
tens
ity
209.2d3-Met 80µM
Met 65µM
Fig. 8. Linearity test on methionine (see also table in Fig. 9).

Neonatal research 355
Free Carnitine 1.097 1.000 2.7% at 23µM (n=6)
Acetylcarnitine 1.004 0.997 3.3% at 7.6µM (n=3)
Octanoylcarnitine 1.017 1.000 10.9% at 0.1µM (n=6)
Palmatoylcarnitine 0.914 0.994 6.6% at 0.4µM (n=6)
Phenylalanine 0.949 0.994
Tyrosine 0.933 0.995
Methionine 0.923 0.999
Xle 0.990 0.996
AnalyteAnalyte Fit (r2)SlopeSlope
Free Carnitine 1.097 1.000 2.7% at 23µM (n=6)
Acetylcarnitine 1.004 0.997 3.3% at 7.6µM (n=3)
Octanoylcarnitine 1.017 1.000 10.9% at 0.1µM (n=6)
Palmatoylcarnitine 0.914 0.994 6.6% at 0.4µM (n=6)
Phenylalanine 0.949 0.994
Tyrosine 0.933 0.995
Methionine 0.923 0.999
Xle 0.990 0.996
CV(%)
Fig. 9. Results on calibrations curves obtained by spiking a specimen for evaluating the linearity.
Analyte AverageConcentrationµM (n=12)
CV(n=6 pairs)
C0 26.025 2.5%C2 5.720 3.1%C3 0.412 4.9%C4 0.157 5.2%C6 0.064 11.6%C8 0.087 12.6%C10 0.049 2.9%C16 0.353 3.5%C18 0.178 10.2%C18:1 0.463 5.6%
Mean 6. 2%
Analyte AverageConcentrationµM (n=12)
CV(n=6 pairs)
C0 26.025 2.5%C2 5.720 3.1%C3 0.412 4.9%C4 0.157 5.2%C6 0.064 11.6%C8 0.087 12.6%C10 0.049 2.9%C16 0.353 3.5%C18 0.178 10.2%C18:1 0.463 5.6%
Mean 6. 2%
Analyte AverageConcentration
µM (n=12)
CV(n=6 pairs)
Tyr 59.14 5.4%Phe 444.34 3.0%Ala 142.74 2.3%Val 105.90 3.5%Xle 171.48 4.8%Met 19.25 6.3%Phe/Tyr 9.26 4.9%
Mean 4. 3%
Analyte AverageConcentration
µM (n=12)
CV(n=6 pairs)
Tyr 59.14 5.4%Phe 444.34 3.0%Ala 142.74 2.3%Val 105.90 3.5%Xle 171.48 4.8%Met 19.25 6.3%Phe/Tyr 9.26 4.9%
MeanMean 4. 3%
Analyte AverageConcentrationµM (n=12)
CV(n=6 pairs)
C0 26.025 2.5%C2 5.720 3.1%C3 0.412 4.9%C4 0.157 5.2%C6 0.064 11.6%C8 0.087 12.6%C10 0.049 2.9%C16 0.353 3.5%C18 0.178 10.2%C18:1 0.463 5.6%
Mean 6. 2%
Analyte AverageConcentrationµM (n=12)
CV(n=6 pairs)
C0 26.025 2.5%C2 5.720 3.1%C3 0.412 4.9%C4 0.157 5.2%C6 0.064 11.6%C8 0.087 12.6%C10 0.049 2.9%C16 0.353 3.5%C18 0.178 10.2%C18:1 0.463 5.6%
Mean 6. 2%
Analyte AverageConcentration
µM (n=12)
CV(n=6 pairs)
Tyr 59.14 5.4%Phe 444.34 3.0%Ala 142.74 2.3%Val 105.90 3.5%Xle 171.48 4.8%Met 19.25 6.3%Phe/Tyr 9.26 4.9%
Mean 4. 3%
Analyte AverageConcentration
µM (n=12)
CV(n=6 pairs)
Tyr 59.14 5.4%Phe 444.34 3.0%Ala 142.74 2.3%Val 105.90 3.5%Xle 171.48 4.8%Met 19.25 6.3%Phe/Tyr 9.26 4.9%
MeanMean 4. 3%
Fig. 10. Precision data on acyl-carnitines in replicate blood samples (normal concentration levels,left panel) and on amino acids in replicate blood samples (five out of six are PKU, right panel).
0 100 200 300 40000
100100
200200
300300
400400
Phe
(uM
; M
SMS)
Phe
(uM
; M
SMS)
0 100 200 300 400
Phe (uM; HPLC)Phe (uM; HPLC)
y = 0.864x + 8.756 r2 = 0.997
Fig. 11. Correlation between MS/MS and the more classical HPLC assay for phenylalanine.

356 B. Casetta
4. Key points of the methodology
4.1. Quantitation assessment
Measurement is done by simulating the isotope dilution (ID) strategy. For quantify-ing with good accuracy the endogenous analyte, same molecule but isotopicallylabeled is spiked at known concentration in the sample itself. Both endogenous andisotopically labeled compounds are characterized by the mass spectrometer, and thequantitation assessment is performed by comparing the two intensities and referringto the known concentration of the spiked standard (also called “internal standard”).Doing so, any error in the manipulation or loss in the subsequent analytical steps iscompensated for since any deficiency affects at the same extent either the endoge-nous analyte or the spiked standard (it is assumed that isotopically labeled moleculehas almost all the same physico-chemical properties of the unlabeled compound).
Indeed, in the specific case of NBS, ID strategy is just simulated, it being notpossible to spike the internal standards directly in the blood at the collection timebut only in the subsequent methanolic extract.
This is one of the most noticeable pitfalls of this analytical protocol. For mak-ing accountable the “concentration” of the spiked standards, the estimation of theamount of sample (blood volume) is derived from the diameter of spot originatedby drying the collected blood. Since the physical properties of the filter paper andthe hematocrit of the sampled blood are influencing the spot diameter of the DBS,it is of paramount importance for the laboratory analyst to correctly estimate theoriginal volume of blood corresponding to the sampled dried spot. Skipping thisstep leads to significant bias in the final concentration results.
Some guidelines and standardization suggestions are in the way for facilitatingthe task, such as to preventively select the appropriate vendor of the filter paperand the type of it (in Europe grade 903 from Schleicher&Schuell). A hematocritof 50% is assumed to be the one corresponding to the heel blood of a neonate andany sampled blood should refer to that value (in North America a hematocrit valueapproaching 55% is proposed as reference).
Besides this standardization guideline, it is very important that each laboratorymakes some tests for assessing the correspondence of sampled spot diameter to theoriginal blood volume.
4.2. Derivatization
More and more users (one example is given in ref. [11]) are proposing to omit thebutylation step, owing to the increased sensitivity displayed by the actual com-mercial instrumentation. Some users prefer as well to skip any spectrum acquisi-tion (precursor ion scan and neutral loss scan) and make all the quantitationmeasurements exclusively through MRM readings. As reported later, this strategyis enhancing the sensitivity further.

Neonatal research 357
Rationale behind derivatization relates to the chemistry of the analyzed com-pounds (AA and AC). Both have either a basic functional group (amine for theAA, tertiary amine for the carnitines—free or acylated forms) or an acidic group.Since the yield of the ESI process is related to the overall proton affinity of themolecule itself, by neutralizing the acidity of the carboxylic moiety with esterifi-cation, the resulting proton affinity increases and therefore sensitivity is enhanced.
The second and less evident benefit of the derivatization is an equalization ofthe specific sensitivity of each AC.
The cocktail of isotopically labeled standards is not covering any possible de-tectable AC. Therefore, for some of them, the internal standard to refer to is not theisotopic homolog but some other compound, very close in terms of structure andmass. For making the measurement free from a significant bias, it is desirable thatspecific sensitivities displayed by either the analyte or the used internal standardshould be as similar as possible. Failing in that, results are significantly biased.
A typical case is represented by the glutaryl-carnitine (C5DC) which cannotcount on the presence of its isotopically labeled homolog in the today commer-cially available internal standard cocktail. Due to the presence of two acidic moi-eties, its specific sensitivity is lower than any other mono-acidic AC and makesquestionable the use of any neighbor compound as internal standard. Butylation ismaking less exacerbated the difference in proton affinity between mono-acidic andbi-acidic compounds, and therefore it enables the use of a neighbor AC (namelythe d3-C8 or d9-C14) as internal standard.
In the case of any dicarboxylic-AC, it is worthy to note that derivatizationinvolves a double butylation reaction (the carnitine carboxylic moiety and the freesecond carboxylic moiety of the acyl group). Comparing a spectrum fromunbutylated specimen with that of a butylated one, shift on mass scale is not 56 Thas expected for the majority of the AC but twice that value (112 Th).
Fig. 12 shows that shift in mass between experiments with butylation and unbuty-lation is not 56 Th like for the rest of AC but 102 Th (388.4 Th vs. 276.3 Th).By zooming the pertinent spectrum area it is easy to realize the sensitivity difference(a factor of 3 with the instrument so far used), which affects the real detection limitfor positive GA-I cases. In the same figure, assuming to take octanoyl-carnitine (C8)as the internal standard for C5DC quantitation in both the experiments, it is inter-esting to note that in the experiment with butylation, intensity of C5DC is 3.8 timeslower than the chosen internal standard; meanwhile, in the experiment withoutderivatization, C5DC is 8.4 times lower. Therefore, in the case of experiment with-out butylation, glutary-carnitine result should be biased by underestimation.
In our experience, skipping the butylation step raises a special issue regardingthe final solvents used for the analytical measurement. Provided that the DBSextraction is made with methanol, it has been proved that in large-scale routineoperation the direct injection of a methanolic solution in the usual flow of ACN/H2O causes a distortion of the FIA-peak profile, making questionable a long-termstability (Fig. 13).

358 B. Casetta
Drying the methanolic extract and reconstituting it with an ACN/H2O mixturerestores the good FIA-peak profile.
However, especially for unbutylated AC, it is mandatory to keep the ACN con-centration of the reconstituting mixture quite high (ACN � 80%) for avoiding anysegregating loss of them during the storage in the well plate. We have evidencethat polystyrene well plates are prone to make unbutylated AC disappear on longterm if not conveniently dissolved (Fig. 14).
Another minor advantage of the butylation is that the chemical treatment of theextract with an acidic media is ending up with a cleaner solution. Repetitive in-jections of a cleaner solution account for a better long-term robustness.
4.3. FIA flow rate regime
As mentioned, NBS measurement is performed without any LC separation (FIA).The injected plug is moved to the ionization source of the instrument thanks to acarrier flow supplied by an LC-pump. The duty time for acquiring the measure-ment is dependent on the injected volume, the flow rate, and the dispersion in-duced by the tubing and the dead volumes downstream the injection valve.
Fig. 12. Comparison of AC profiles on the same sample characterized by a glutaric acidemia type I,with and without butylation. Arrows point where C5DC is nested in the full spectrum. Shift in massbetween butylation and unbutylation is not 56 Th like for the rest of AC but 102 Th (388.4 Th vs.276.3 Th). Assuming to take d3-octanoyl-carnitine (d3-C8) as the internal standard for its quantita-tion (star-labeled ion) in both the experiments, it is interesting to note that in the experiment withbutylation, intensity of C5DC is 3.8 times lower; meanwhile, in the experiment without derivatiza-tion, C5DC is 8.4 times lower than the chosen internal standard.

Neonatal research 359
For the analytical reading perspective, a long duration is preferable (morereadings on time scale lead to more stable analytical results). On top of that someelectrospray sources display higher sensitivity and less ion suppression effectwhen fed by very low flow rates. However, the big disadvantage is a significantcarryover in between the injected samples, which demands a remarkable delay be-fore the next injection, unless in implementing a flow programming in the LC-pump. Program includes: to keep a low-flow-rate regime while the injected plugis penetrating the source and afterwards to move to a high-flow-rate regime forspeeding up the washing in between the injections.
With some instruments this is good compromise for having a good yield at theionization source, while for some others the source is more consistent in the at-tained sensitivity regardless of the flow rate regime.
In the case of a flow rate programming, it is of paramount importance to haveconsistency in the appearance and duration times, e.g., starting and ending timesof the plug peaks should be reproducible. Lack of it should lead to corruptedresults especially in those cases where cycling between the different scanningacquisitions is performed in subsequent periods and not in simultaneous mode(see rationale in the caption of Fig. 15).
Fig. 13. Peak profiles obtained on the same underivatized sample. Naked methanolic extract, wheninjected in the ACN/H2O-mixture carrier, is producing a quite disrupted profile. The same extract,dried and reconstituted with the same ACN/H2O mixture, leads to a typical smooth FIA-peak profile.
0.2 0.4 0.6 0.8 1.0 1.2 1.4 1.6 1.8 2.0 2.2 2.4 2.6 2.84 7 10 13 1 19 22 25 28 31 34 37 40 43
Methanolic extract inj.
Extract reconst.in ACN/H2O inj.
16
Methanolic extract inj.
Extract reconst.in ACN/H2O inj.
9.8e69.5e6
9.0e6
8.5e6
8.0e6
7.0e6
7.5e6
6.5e6
6.0e6
5.5e6
5.0e6
4.5e6
4.0e6
3.5e6
3.0e6
2.5e6
2.0e6
1.5e6
1.0e6
5.0e6
0.0
TIC: from Sample 1 (050518-2) of UnBut 3.wiff (Turbo Spray) Max. 9.8e6 cps.
1.21
0.82
Time, min

360 B. Casetta
Fig. 14. Comparison of citrulline and AC profiles on the same sample characterized by a citrulline-mia, with and without butylation. Upper panel shows as the basic amino acid citrulline quantitation isnot dependent on derivatization, except for the absolute sensitivity (sevenfold better with butylation).Either the reconstitution mixture (mixtures of ACN 50% or ACN 80% in water) is not affecting theCIT/d2-CIT ratio. Lower panel shows as with butylation, AC profile is unaffected by the reconstitu-tion mixture composition (upper panes). Without butylation (lower panes) and storing the sample inthe well-plate for 1 h @ 4�C, some segregation is occurring at the high-mass AC (compare the ratiod9-C14/d3-C16) when methanolic extract has been dried and reconstituted with ACN 50%. WithACN 80%, ratio is restored and is very similar to the butylated profiles.

Neonatal research
361
0.3 0.6 0.9 1.2 1.5 1.8 2.1 2.4 2.7
5101520253035404550556065707580859095
Full Scan Acquisition of Acylcarnitines and Amino Acids
0.3 0.6 0.9 1.2 1.5 1.8 2.1 2.4 2.7
40
80
120
160200
240
280
320
360400
440
480
520560
600
640680720
760
% In
tens
ity
0.3 0.6 0.9 1.2 1.5 1.8 2.1 2.4 2.7
5101520253035404550556065707580859095
TOTAL ION ELUTION PROFILE OF A CONTROL BLOOD SPOTFull Scan Acquisition of Acylcarnitines and Amino Acids
PS 85 NL 102
No Split AcquisitionProtocol
% I
nten
sity
TOTAL ION ELUTION PROFILE OF A CONTROL BLOOD SPOTTOTAL ION ELUTION PROFILE OF A CONTROL BLOOD SPOTFull Scan Acquisition of Acylcarnitines and Amino Acids
Time, min Time, minTime, min
% I
nten
sity
% I
nten
sity
TOTAL ION ELUTION PROFILE OF A CONTROL BLOOD SPOTFull Scan Acquisition of Acylcarnitines and Amino Acids
PS 85 NL 102
No Split AcquisitionProtocol
“Split” Total Elution Profile
Time, min
Amino Acids (NTL 102)
Acylcarnitines (Precursor85)
Dual Metabolic Profiles Using MS/MS
Fig. 15. Different approaches for collecting the various scanning modes from the FIA experiment. For simplicity, just two scanning acquisitions aredepicted. Within the same FIA plug reading (upper panel), some instruments are able to cycle the multiple scanning acquisitions in simultaneous mode(lower panel, left). This feature is precluded to some other commercial instruments: in this case the different scanning acquisitions are performed insubsequent periods (lower panel, right). In this case it is of paramount importance to preserve the integrity of the peak shape, lack of it leading to aninformation degradation from one of the scanning acquisitions.

362 B. Casetta
As already mentioned, some instruments do not show big sensitivity changeswith the carrier flow regime (see Fig. 16). With constant-flow-rate regime repro-ducibility is much more preserved (Fig. 17).
4.4. MS scanning strategies
For improving the sensitivity, more and more authors [12] prefer to make all themeasurements concerning the NBS by MRM, owing to the dwell time per analytebeing longer than it should be when a real scanning is implemented.
MRM reading implies the setting of the two analyzers at predefined masses foreach attributable analyte, with the first mass representing its pseudo-molecular ionand the second mass the prominent ion resulting from the fragmentation of thatspecific analyte.
In this configuration the tandem mass spectrometer displays the best perform-ances in quantitation jobs. In fact, sensitivity and reproducibility are directly
2.28e6 cpsTIC: from NEO-well-41
1.0 2.0Time, min
% In
tens
ity2.02e6 cps
TIC: from NEO-well-41
% In
tens
ity
100 100
Single Flow Rate Flow RateProgram
2.28e6 cpsTIC: from NEO-well-41
1.0 2.0Time, min
1.0 2.0Time, min1.0 2.0Time, min
% In
tens
ity2.02e6 cps
TIC: from NEO-well-41
% In
tens
ity
100 100
Single Flow Rate Flow RateProgram
Fig. 16. TIC profiles from single vs. programmed flow experiments. In both experiments dataacquisition was over in ca. 2.3 min interval. The type of electrospray source did not display signif-icant differences sensitivity-wise between a constant FIA-flow (left-hand trace) and a programmedflow regime (right-hand trace). In the latter, trace showed a ca. 1 min wide flat-topped TIC peak,which reached baseline after 1.9 min. For both experiments, measured carryover was very little (typ-ically �1%). However, the data obtained using the flow-rate program exhibited about half the car-ryover of that of the single flow-rate experiment.

Neonatal research
363
Fig. 17. Evidence of long-term reproducibility of the FIA-peak profile in an NBS program.

364 B. Casetta
related to the time spent for any single analyte measurement. In collecting aspectrum, time is spent for any single-step unit of the spectrum, regardless ofwhether the bin represents a putative analyte ion or just a background in betweenother analytes.
In the original NBS protocol, two kinds of scanning are proposed: a precursorion scan over the fragment at 85 Th for characterizing the AC and a 102 Th-neutralloss scan for characterizing the main AA. For the latter, swapping from the neu-tral loss scan into a panel of the correspondent MRM does not affect the resultsquality: the selection of expected AA is predictable.
However, for the AC profile, skipping the scanning (in precursor ion) can havea severe impact on the final results’ interpretation by the medical professionals.
The number of discernable analytes in the AC profile is unpredictable: in addi-tion to the common ones (e.g., free �C0 and acetyl-carnitine �C2�, some longchain ones —�C16 –), there can be some generated by the known fatty acid oxida-tion disorders, some others from “external interferences” (several authors have re-ported the presence of some carnitines as generated by some specific patientregimen or by administered medication drugs), and some from very rare diseases.
All the above can be captured by a full scan reading (precursor ion scan); mean-while, just MRM readings can miss some of them if not preventively programmed.
In addition to that, a further benefit in inspecting a spectrum is to free the in-terpretation from aberrations. A case which has been recently experienced is aglutamate formimino-transferase deficiency characterized by a high concentra-tion of formimino glutamic acid (FIGLU) [13]. As documented by Fig. 18, ifreading was made by MRM, this rare disorder should be interpreted as a short-chain acyl-CoA dehydrogenase (SCAD) deficiency since a positive signal isproduced at the transition 288 � 85, usually assigned to the C4 carnitine. Bycoincidence FIGLU produces a fragment ion at 85 Th (same nominal fragmention mass as the signature fragment ion of AC) but its pseudo-molecular ion isat 287 Th.
By performing a full-scan acquisition in precursor ion mode it has been easyto realize that the prominent ion was at 287 Th and the 288 Th ion was just its C13-isotopomer, therefore avoiding to attribute the high level of the 288 Th ionerroneously to a C4 carnitine and consequently to an SCAD disorder.
4.5. Data processing
In order to make results quickly readable by the medical professionals, massspectrometric raw data are conveniently processed for relieving the final userfrom the burden to deal with the minute interpretation of any MS signal produced(see Fig. 2).
Different instrument vendors are supplying different application software forachieving the task, each of them with very different features and functionalities.

Neonatal research
365Fig. 18. AC profile from a case of glutamate formimino-transferase deficiency. Ion at 288 Th is not due to C4-carnitine but it is just the C13 isotopomerof FIGLU with main ion at 287 Th.

366 B. Casetta
For example, some applications are able to flag the final results according todifferent limit suites, each of them specific for a specimen type (e.g., premature,newborn, one year old, etc.).
Beyond the goodies provided by the different application packages, it is worthyto leverage two key features for guaranteeing good performances in large-scaleroutine programs and avoiding false positives: internal standard intensity moni-toring and graphical evidence.
The analytical result is calculated upon the ratio of the intensities of the targetedanalyte and its internal standard (isotopically labeled standard). Intensity ratio istrustable as long as the internal standard is not approaching a zero value, the lattercaused by some experimental errors in the measurement step or in the upstreamsample processing. A final reported result for any analyte is worthy as long as theinternal standard intensity is adequate (and not approaching zero, implying thatthe analyte value is getting mistakenly high). Some application packages are ableto flag the samples when the internal standard intensities are getting lower thanprefixed thresholds (experimentally and statistically found) for any reason andconsequently faith on the displayed final results is questionable (see Fig. 3).
Second key point is related to the full-spectrum acquisition for AC. In the casesome AC are evidenced as “abnormal,” it is mandatory that the final result reportis substantiated by the full spectrum in order to reveal any unpredictable profile(or single ion) which can reveal the source of the abnormal result. Fig. 19 docu-ments, for example, that the isotopically labeled internal standard itself can be asource of artifacts because of some degradation.
5. Ongoing extensions of NBS
5.1. Extended panel of amino acids
List of AA covered by the original NBS protocol is quite limited (roughly 20 AA).It should be appealing to encompass all the AA and the AA-like compounds asdone by the most commonly used IEX-ninhydrin-based method.
Several authors have proposed different approaches for enabling all the AAmeasured by LC–MS/MS, either through a derivatization step [14] or without[15]. In all the proposed protocols, a chromatographic separation is envisaged forresolving the isobaric AA (for example, HYP, allo-ILE, ILE, LEU, or �-ALA,ALA, SAR, or LYS, GLN), implying 15–30 min per analytical run.
Sensitivity, precision, and long-term robustness are getting comparable if notbetter than the traditional IEX-ninhydrin methodology.
Fig. 20 shows a typical tracing obtained in our laboratory on plasma serumanalyzed by LC–MS/MS without derivatization and exploiting, with somemodifications, the protocol recently proposed [15,16].

Neonatal research
3673.4e53.2e5
3.0e5
2.8e5
2.6e5
2.4e52.2e5
2.0e5
1.8e51.6e5
1.4e51.2e5
1.0e5
8.0e4
6.0e44.0e4
2.0e4
3.4e53.2e5
3.0e5
2.8e5
2.6e5
2.4e52.2e5
2.0e5
1.8e51.6e5
1.4e51.2e5
1.0e5
8.0e4
6.0e44.0e4
2.0e4
227.2
227.2
263.3
228.3 260.3221.2218.2 261.3264.3
222.2 262.3
263.3
260.3
261.3 264.3
262.3
263.3
260.3
261.3264.3
262.3
219.2
228.3
221.2
218.2
222.2219.2
221.2218.2
222.2219.2
endog. Acetyl Carnitine
d3-Acetyl Carnitine
endog. Free Carnitine
d9-Free Carnitine
?
endog. Acetyl Carnitine
d3-Acetyl Carnitine
endog. Free Carnitine
d9-Free Carnitine
???
215 220 225 230 235 240 245 250 255 260 265 215 220 225 230 235 240 245 250 255 260 265
227.2
endog. Free Carnitine
d9-Free Carnitine
d3-Free Carnitine
- 6 D + 6 H
m/z, amum/z, amu
215 220 225 230 235 240 245 250 255 260 265
m/z, amu
Inte
nsity
, cps
3.4e53.2e5
3.0e5
2.8e5
2.6e5
2.4e52.2e5
2.0e5
1.8e51.6e5
1.4e51.2e5
1.0e5
8.0e4
6.0e44.0e4
2.0e4
Inte
nsity
, cps
228.3
Free carnitine is very polar.
DnHmX+ 1/2H2 D(n-1)H(m+1)X+ 1/2D2
K
K4 >> K9-5, K3-1
The expected profile
Free carnitine is very polar.
DnHmX+ 1/2H D(n-1)H(m+1)X+ 1/2D
Kn
K4 >> K9-5, K3-1
.spc5e4.3.xaM
Acyl-carnitine profile of a blood sample
+Prec (85.10): Exp 1, 0.732 to 2.180 min from Sample 1 (Dil5XCamp2935) of Dil5XCamp2935-... Max. 3.4e5 cps. +Prec (85.10): Exp 1, 0.732 to 2.180 min from Sample 1 (Dil5XCamp2935) of Dil5XCamp2935-... Max. 3.4e5 cps.
Fig. 19. Speculation on the appearance of the 221 Th ion in the AC profile in some NBS samples. Due to partial degradation of the isotopicallylabeled d9-acetyl carnitine (d9-C2), 221 Th ion is a new artifact, the d3-acetyl carnitine (d3-C2), produced by a padial D/H back-exchange.

368B
. Casetta
.spc 6e7.2 .xaM...rpS obruT( ffiw.87315eS fo )87315eS( 3 elpmaS morf uma 0.48/1.741 :)sriap 13( MRM+ fo CIX
1.51
14.16
PRO
LEU
LYS
MET
HIS
HYL
PHE
HIS-ME
GLNI.S.
CAR(HCY)2
.spc 6e7.2 .xaM...rpS obruT( ffiw.87315eS fo )87315eS( 3 elpmaS morf uma 0.48/1.741 :)sriap 13( MRM+ fo CIX
1.51
14.16
PRO
LEU
MET
HYL
PHE
HIS-ME
GLNI.S.
(HCY)2
0.0
ALA
I.S.
ABU
SER
THR
ASN
ASP
GLU
CIT
ALA
I.S.
ABU
SER
THR
ASN
ASP
GLU
CIT
(CYS)2
TAU
SAR
HYP AAD
GLY
(CYS)2
TAU
SAR
HYP AAD
GLY
.spc 6e7.2 .xaM...rpS obruT( ffiw.87315eS fo )87315eS( 3 elpmaS morf uma 0.48/1.741 :)sriap 13( MRM+ fo CIX
1.51
14.16
LEU
MET
HYL
PHE
HIS-ME
(HCY)2
.spc 6e7.2 .xaM...rpS obruT( ffiw.87315eS fo )87315eS( 3 elpmaS morf uma 0.48/1.741 :)sriap 13( MRM+ fo CIX
1.51
14.16
AIB
VAL
LEU
ILE
aILE ORN
PHEARG
TYR
TRP
ALA
I.S.
ABU
SER
THR
ASN
ASP
GLU
CIT
9.0e58.5e58.0e57.5e57.0e56.5e56.0e55.5e55.0e54.5e54.0e53.5e53.0e52.5e52.0e51.5e51.0e55.0e4
0.5 1.0 1.5 2.0 2.5 3.0 3.5 4.0 4.5
ALA
I.S.
ABU
SER
THR
ASN
ASP
GLU
CIT
(CYS)2
TAU
SAR
HYP AAD
GLY
(CYS)2
TAU
SAR
HYP AAD
GLY
Inte
nsity
, cps
Inte
nsity
, cps
0.5 1.0 1.5 2.0 2.5 3.0 3.5 4.0 4.54.5 5.0 5.5
Time, min
Time, min
1.9e51.8e51.7e51.6e51.5e51.4e51.3e51.2e51.1e51.0e59.0e58.0e57.0e56.0e55.0e54.0e53.0e52.0e51.0e5
0.0
Time, min
2.6e6
2.4e6
2.2e6
2.0e6
1.8e6
1.6e6
1.4e6
1.2e6
1.0e6
8.0e5
6.0e5
4.0e5
2.0e5
0.01 2 3 4 5 6 7 8 9 10 11 12 13 14 15
ANS
Fig. 20. MRM trace obtained on a plasma sample for AA without derivatization. The two insets are magnifying some details in the starting part of thechromatographic run.

Neonatal research 369
So far, time scale is not compatible yet with the typical NBS throughput (2–3 min/sample), the analytical running time being roughly 1 order of magnitude longer.Quite promising is a very new strategy recently presented, where a special multi-plex derivatization is performed enabling the concurrent reading of four differentsamples simultaneously injected. It leverages the tagging of the AA with fourdifferent isotopic labels, each of them generating a different signature fragment.Consequently, four different AA mixtures can be tagged separately with one of thefour different labels and then pooled together before the injection in theLC–MS/MS. The time spent for the analytical run is shared by four samples.Therefore, the throughput is increased by a factor of 4.
5.2. Very long chain fatty acids
Peroxisomal disorders are characterized by impaired, reduced, or total absence ofperoxisomes in cells. These disorders imply an accumulation of very long chainfatty acids (VLCFA) such as tetracosanoic and hexacosanoic acids in plasma andred blood cells. Some variants of these disorders are characterized by an accumu-lation of phytanic acid.
Up to now quantification of VLCFAhas been done by GC or GC–MS. So far thesemethods are time-consuming and quite demanding in terms of sample preparation.
VLFAC measurements are accompanied by the calculation of some significantratios like C26:0/C22:0 and C24:0/C22:0.
Some authors are pursuing the VLCFA characterization through their AC pro-file [17]. Only 5% of the VLCFA are incorporated within AC, and therefore theresulting detectability is questionable.
Recently Johnson [18] has proposed an interesting procedure employingLC–MS/MS for a rapid screening.
This approach targets all the VLCFA (free, in-phospholipid incorporated andester forms). Due to the measurements made in flow-injection mode, the isobaricforms cannot be distinguished and the overall detection limits for some criticalcompounds like pristanic acid (at very low concentration when at normal levels)are not satisfactory.
Leveraging the sample preparation as proposed by Johnson, a methodology cen-tered on a simple and robust LC–MS/MS hardware configuration, involving a chro-matographic step and the use of a non-isotopically labeled internal standard, hasbeen presented [19]. Fig. 21 shows that quantitation is viable by LC–MS/MS withan external calibration and without any special isotopically labeled compound.
5.3. Steroids
It is now well recognized that LC–MS/MS is becoming a pivotal tool for thesteroid profiling in clinical research studies. Up to now steroids have beenanalyzed using immunoassay or GC–MS.

370 B. Casetta
XIC of +MRM (9 pairs): 370.5/325.5 amu from Sample 1 (St5.0) of n19-St5.0.wiff (Turbo Spray),...
1 2 3 4 5 6 7Time, min
Time, min
1.92PRISTANIC ACID
PHYTANIC ACID
C 22:0 ACIDC 26:0 ACID
1 2 3 5 7 8 9
PRISTANIC ACID
PHYTANIC ACID
C 22:0 ACIDC 26:0 ACID
PRISTANIC ACID
PHYTANIC ACID
C 22:0 ACID
C 24:0 ACID
C 26:0 ACID
Internal Standard (C 27:0)
5.86
1.3e6
1.6e61.5e6
1.4e6
1.3e6
1.2e6
1.1e6
1.0e6
9.0e5
8.0e5
7.0e5
6.0e5
5.0e5
4.0e5
3.0e5
2.0e5
1.0e5
0.0
1.2e6
1.1e6
1.0e6
9.0e5
8.0e5
7.0e5
6.0e5
5.0e5
4.0e5
3.0e5
2.0e5
1.0e5
0.0
Max.2.4e5 cps.
8 9
4 6
Inte
nsity
, cps
XIC of + MRM (11 pairs): 482.5/437.5 amu from Sample 7 (MC 05/07/98) of ACGras060105.wiff... Max. 7.4e5 cps.
Fig. 21. Chromatographic traces obtained by injecting a standard solution of derivatized pristanic,phytanic, docosanoic, tetracosanoic, and hexacosanoic acids, and the derivatized internal standard(upper panel). Lower panel depicts abnormal concentrations of pristanic and phytanic acids in a realsample (18.9 and 72.6 �M, respectively).

Neonatal research 371
Immunoassay is among the most sensitive analytical method. However, thistechnique shows a lack of specificity due to cross-reactivity and is particularlycostly due to the expense of reagents.
With immunoassay each steroid must be analyzed separately and with very lim-ited ranges, focusing on known levels of the drug of interest. Immunoassays alsotend to have high variances at low concentration levels that can lead to error andmisleading results.
GC–MS methods have also been used for steroid quantitation but these usuallyrequire extraction and purification steps along with derivatization of the steroidbefore measurement, which complicates the process and involves time.
LC–MS/MS is sensitive, specific, and allows an easier approach to samplepreparation without sample derivatization steps. It can encompass the analysis ofa virtually unlimited number of analytes in the same shot.
Up to now several papers leveraging LC–MS/MS have been published [20–25].For attaining the necessary sensitivity, some sample pretreatment is required,basically centered either on a liquid–liquid extraction (LLE) or on an off-linesolid-phase extraction (SPE).
Besides those options, Soldin’s group [26] has proposed a strategy implement-ing an on-line single-step solid-phase-like extraction step coupled to a sensitiveinstrumental set-up (LC–MS/MS with atmospheric pressure photoionization source(APPI)). APPI (called “PhotoSpray” by some manufacturers) has been recentlyshown to be more sensitive to certain compounds, especially non-polar and aromaticspecies in biological matrices such as some steroids.
Any of the above strategies is valuable for routine use as long as the usualperformance parameters (sensitivity and specificity) are associated to a goodrobustness and an easy sample preparation test.
Fig. 22 gives a flavor of what is attainable today with a tandem mass spectrometerfor the routine quantitation of aldosterone, cortisone, cortisol, 21-deoxycortisol,corticosterone, substance S (11-deoxycortisol), �-4-androstenedione, 21-hydroxy-progesterone, and 17-hydroxy-progesterone [27].
Fig. 23 shows the tracing obtained on a serum from a patient with 21-hydroxylasedeficiency. A high concentration of 17-hydroxy-progesterone has been calculatedat 28.9 ng/mL with the methodology. Value obtained using immunoassay was25 ng/mL. Normal value should be less than 5 ng/mL. Peaks corresponding tosubstance S, cortisol, cortisone, corticosterone, and aldosterone are stronglydecreased.
5.4. Bile acids
BA are a group of compounds characterized by the steroid scaffolding with a car-boxyl group located in the side chain. These compounds are the major catabolicproducts of cholesterol and facilitate either the excretion of bile lipids includingcholesterol or the absorption of dietary lipids.

372 B. Casetta
The most prominent BA present in human are cholic acid (C), chenodeoxy-cholic acid (CDC), deoxycholic acid (DC), lithocholic acid (LC), and ursodeoxy-cholic acid (UDC), as derivatives of 5�-cholan-24-oic acid. Primarily they arepresent as glycine and taurine conjugates, with the conjugation occurring atcarbon 24 of the structure. In addition to the above major BA, a wide array ofminor components has been identified.
Hepato-biliary and intestinal diseases are marked by their increased concentra-tion in plasma, urinary, and feces. Early diagnosis of many pathological conditionsis often possible through individual separation and quantitation of BA.
The analysis of BA has been always challenging due to their wide variety,lack of any volatility, very low concentration in biological samples, and the smallstructural differences between them, with several cases of isomeric forms.
Outcome is that up to now some labor-consuming steps are required for a suc-cessful and comprehensive analysis of the BA range.
GC either alone or coupled with mass spectrometry (GC–MS) has been used forBA analysis in normal serum or urine since they provide high sensitivity andspecificity. However, sample preparation represents the limiting factor: a prelimi-nary separation of BA by class is needed, followed by hydrolysis and derivatizationsteps.
Fig. 22. Chromatographic trace obtained on an albumin serum solution spiked with a steroid mixtureat 10 ng/mL.

Neonatal research
373
Fig. 23. Serum from a patient with 21-hydroxylase deficiency. A high concentration of 17-hydroxy-progesterone has been calculated at 28.9 ng/mLwith the described methodology (left panel). Value obtained using immunoassay is 25 ng/mL. Normal value should be less than 5 ng/mL. Peakscorresponding to substance S, cortisol, cortisone, corticosterone, and aldosterone are strongly decreased (right panel).

374 B. Casetta
Liquid chromatography coupled with UV detection has been widely applied inBA analysis. The main advantage over GC techniques is that the BA are deter-mined without any derivatization step. The main drawback is the limited sensitiv-ity, especially when applied to the dosage of BA in normal serum.
Due to the low volatility and the thermal instability of BA, and in order toaddress the persistent need for a rapid and sensitive means of BA screening inbiological fluids, electrospray ionization–tandem mass spectrometry (ESI–MS/MS)techniques have been proposed for the analysis of these compounds. These methodsallow direct analysis of the intact polar forms, either unconjugate or conjugate.
For differentiating BA isobaric forms, a prior chromatographic separation step isneeded. The resulting LC–MS/MS demonstrates to be sensitive, robust, specific,easy, and sufficiently rapid, such as suitable for routine studies involving highnumber of specimens [28]. Fig. 24 shows what is achievable today by usingLC–MS/MS in the BA analysis when chromatographic separation is implemented.By skipping the chromatography (just flow-injection analysis), analytical time isshortened to value compatible for a very-large-scale routine, as demonstrated bysome researchers [29], but either resolution on isobaric BA (quite several ones) orgood detectability for minor BA is lost.
6. Conclusions
The recent and continuing impact of LC–MSMS in NBS and other clinicalchemistry applications is unquestionable. The chapter has focused the classicalprotocol (AA and AC) for detecting in a screening program the metabolic disor-ders in neonates. Several other advancements are now engaged. Besides the onesdescribed above in the chapter and without the pretension to be exhaustive, it isworthy mentioning those related to purine and pyrimidine metabolism disorders[30], propionate metabolism disorder [31], some urea cycle disorders [32], galac-tose metabolism disorder [33], neuroendocrine disorders [34], folate and cobalamindeficiencies [35], and lysosomal storage disorders [36].
The excitement around this “quasi-universal” technology must be buffered bytwo important statements.
First, despite the efforts of the vendors in making the equipments simpler andeasier to use, still LC–MS/MS cannot be viewed as a fully automated “black-box”like the other usual routine clinical instruments. Practical details described in thechapter for NBS prove that the entire analytical procedure chain is still far awayfrom securing it in a blinded protocol.
Second important point is that classical NBS protocol has been a good examplefor having analytical speed married with a relevant number of provided informa-tion, the key point having been the FIA (no chromatography). Indeed, willing toextend the field to other clinical applications such as the ones mentioned in the

Neonatal research
375
Fig. 24. Traces concerning the BA analysis by LC–MS/MS. (Left panel) A trace from the injection of a mixture at 10 ng/mL of the listed BA.(Right panel) A trace coming from a child plasma sample (qualified as cirrhotic). Strategical TC, TDC, GC, and GCDC bile acids are used forcharacterizing the type of disease.

376 B. Casetta
whole chapter, the chromatographic separation becomes necessary for retrievinggood and exhaustive information. And chromatography is synonymous of time.
In literature, some papers are presenting approaches skipping the chromato-graphic separation but the collected information is usually limited, just for a first-screening purpose.
Provided that anyway LC–MS/MS is an analytical technology deploying multi-parameters per reading, any newcomer must realize that the more and detailed in-formation he is looking for, the more time must be paid for the analytical reading.
As for closing, bile acids could be a good example: their analysis is viable byFIA but the picture is very limited (no isobaric forms resolved low-abundanceones masked). Only with a chromatographic step (time demanding), all of themcan be monitored (conjugated, unconjugated, isobaric forms, high- and low-abundance ones).
Acknowledgments
Part of the presented figures has been produced by exploiting in-house experi-ments. A small part has been edited by relying on the high-profiled experimentsdone with Dr. H.V. Van Thi and Prof. P. Bourdoux in the Newborn ScreeningCenter, Laboratory of Pediatrics, Free University of Brussels (Belgium).
References
1. Chace, D.H., Kalas, T.A. and Naylor, W.N., Use of tandem mass spectrometry for multianalytescreening of dried blood specimens from newborns. Clin. Chem., 49, 1797–1817 (2003).
2. Bennett, M.J. and Rinaldo, P., The metabolic autopsy comes of age. Clin. Chem., 47,1145–1146 (2001).
3. Guthrie, R. and Susi, A., A simple phenylalanine method for detecting phenylketonuria in largepopulations of newborn infants. Pediatrics, 32, 338–343 (1963).
4. Chace, D.H., Millington, D.S., Terada, N., Kahler, S.G., Roe, C.R. and Hofman, L.F., Rapiddiagnosis of phenylketonuria by quantitative analysis for phenylalanine and tyrosine in neo-natal blood spots by tandem mass spectrometry. Clin. Chem., 39, 66–71 (1993).
5. Chace, D.H., Hilman, S.L., Millington, D.S., Kahler, S.G., Roe, C.R. and Naylor, E.W., Rapiddiagnosis of maple syrup urine disease in blood spots from newborns by tandem mass spec-trometry. Clin. Chem., 41, 62–68 (1995).
6. Chace, D.H., Hilman, S.L., Millington, D.S., Kahler, S.G., Adam, B.W. and Levy, H.L., Rapiddiagnosis of homocystinuria and other hypermethioninemias from newborns’ blood spots bytandem mass spectrometry. Clin. Chem., 42, 349–355 (1996).
7. Chace, D.H., Hilman, S.L., Van Hove, J.L.K. and Naylor, E.W., Rapid diagnosis of MCADdeficiency: quantitative analysis of octanoylcarnitine and other acylcarnitines in newbornblood spots by tandem mass spectrometry. Clin. Chem., 43, 2106–2113 (1997).
8. Rashed, M.S., Bucknall, M.P., Little, D., Awad, A., Jacob, M., Alamoudi, M., Alwattar, M. andOzand, P.T., Screening blood spots for inborn errors of metabolism by electrospray tandem

Neonatal research 377
mass spectrometry with a microplate batch process and a computer algorithm for automatedflagging of abnormal profiles. Clin. Chem., 43, 1129–1141 (1997).
9. Roscher, A.A., Fingerhut, R., Liebl, B. and Olgemoeller, B., Erweiterung des neugeborenen-screenings durch tandemmassenspektrometrie. Monatsschr. Kinderheilkd., 149, 1297–1303(2001).
10. Testa Cavedon, C., Bourdoux, P., Mertens, K., Van Thi, H.V., Herremans, N., De Laet, C. andGoyens, P., Age-related variations in acylcarnitine and free carnitine concentrations measuredby tandem mass spectrometry. Clin. Chem., 51, 745–752 (2005).
11. Nagy, K., Takàts, Z., Pollreisz, F., Szabò, T. and Vékey, K., Direct tandem mass spectrometricanalysis of amino acids in dried blood spots without chemical derivatization for neonatalscreening. Rapid Commun. Mass Spectrom., 17, 983–990 (2003).
12. Pitt, J.P., Eggington, M. and Kahler, S.G., Comprehensive screening of urine samples for in-born errors of metabolism by electrospray tandem mass spectrometry. Clin. Chem., 48,1970–1980 (2002).
13. Malvagia, S., la Marca, G., Casetta, B., Gasperini, S., Pasquini, E., Donati, M.A. andZammarchi, E., Falsely elevated C 4-carnitine as expression of glutamate formiminotrans-ferase deficiency in tandem mass spectrometry newborn screening. J. Mass Spectrom., 41(2),263–265 (2006).
14. Casetta, B., Tagliacozzi, D., Shushan, B. and Federici, G., Development of a method for rapidquantitation of amino acids by liquid chromatography-tandem mass spectrometry (LC-MSMS) in plasma. Clin. Chem. Lab. Med., 38, 391–401 (2000).
15. Piraud, M., Vianey-Saban, C., Petritis, K., Elfakir, C., Steghens, J.-P. and Bouchu, D., Ion-pairingreversed-phase liquid chromatography/electrospray ionization mass spectrometric analysis of76 underivatized amino acids of biological interest: a new tool for the diagnosis of inheriteddisorders of amino acid metabolism. Rapid Commun. Mass Spectrom., 19, 1587–1602 (2005).
16. Casetta, B., Gadras, C., Belva-Besnet, H., Tessier, L., Simard, G. and Malthiery, Y., Researchreport: testing a rapid protocol for the quantitation by LC-MS/MS of 33 amino acids in bio-logical fluids without derivatization. Proceedings of the 53rd ASMS Conference on MassSpectrometry and Allied topics. San Antonio, TX, USA.
17. Rizzo, C., Boenzi, S., Wanders, R.J.A., Durain, M., Caruso, U. and Dionisi-Vici, C.,Characteristic acylcarnitine profiles in inherited defects of peroxisome biogenesis: A noveltool for screening diagnosis using tandem mass spectrometry. Pediatr. Res., 53, 1013–1018(2003).
18. Johnson, D.W., A rapid screening procedure for the diagnosis of peroxisomal disorders:Quantification of very long-chain fatty acids, as dimethylaminoethyl esters, in plasma and bloodspots, by electrospray tandem mass spectrometry. J. Inherit. Metab. Dis., 23, 475–486 (2000).
19. Casetta, B., Gravier, M., Belva, H., Tavet, Y., Cuvelier, I. and Olichon, D., Quantitation byliquid chromatography-tandem mass spectrometry (LC-MSMS) of very long chain fatty acids(VLCFA) as a tool for the characterization of peroxisomal disorders. Poster D-130 at XIXInternational Congress of Clinical Chemistry/2005 AACC Annual Meeting.
20. Lacey, J.M., Minutti, C.Z., Magera, M.J., Tauscher, A.L., Casetta, B., McCann, M., Lymp, J.,Houn Hahn, S., Rinaldo, P. and Matern, D., Improved specificity of newborn screening forcongenital adrenal hyperplasia by second-tier steroid profiling using tandem mass spectrometry.Clin. Chem., 50, 621–625 (2004).
21. Taylor, R.L., Machacek, D. and Singh, R.J., Validation of a high-throughput liquidchromatography–tandem mass spectrometry method for urinary cortisol and cortisone. Clin.Chem., 48, 1511–1519 (2002).
22. Kushnir, M.M., Rockwood, A.L., Nelson, G.J., Terry, A.H. and Meikle, A.W., Liquidchromatography–tandem mass spectrometry analysis of urinary free cortisol. Clin. Chem., 49,965 (2003).

378 B. Casetta
23. Starcevic, B., DiStefano, E., Wang, C. and Catlin, D.H., J. Chromatogr. B, 792, 197–204(2003).
24. Reza Anari, M., Bakhtiar, R., Zhu, B., Huskey, S., Franklin, R.B. and Evans, D.C.,Derivatization of ethinylestradiol with dansyl chloride to enhance electrospray ionization:application in trace analysis of ethinylestradiol in rhesus monkey plasma. Anal. Chem., 74,4136–4144 (2002).
25. Nelson, R.E., Grebe, S.K., O’Kane, D.J. and Singh, R.J., Liquid chromatography–tandemmass spectrometry assay for simultaneous measurement of estradiol and estrone in humanplasma. Clin. Chem., 50, 373–384 (2004).
26. Guo, T., Chan, M. and Soldin, S.J., Steroid profiles using liquid chromatography–tandem massspectrometry with atmospheric pressure photoionization source. Arch. Pathol. Lab. Med., 128,469–475 (2004).
27. Casetta, B., Javoy, V., Belva-Besnet, H., Malthiery, Y. and Gallois, Y., Routine Use of aMethodology for dosing 9 steroids in clinical research samples by LC-MSMS. Proceedings ofthe 53rd ASMS Conference on Mass Spectrometry and Allied topics. San Antonio, TX, USA.
28. Tagliacozzi, D., Mozzi, A.F., Casetta, B., Bertucci, P., Bernardini, S., Di Ilio, C., Urbani, A.and Federici, G., Quantitative analysis of bile acids in human plasma by liquid chromatography-electrospray tandem mass spectrometry: A simple and rapid one-step method. Clin. Chem.Lab. Med., 41, 1633–1641 (2003).
29. Johnson, D.W., ten Brink, H.J., Schuit, R.C. and Jakobs, C., Rapid and quantitative analysisof unconjugated C27 bile acids in plasma and blood samples by tandem mass spectrometry.J. Lipid Res., 42, 9–16 (2001).
30. Ito, T., van Kuilenburg, A.B.B., Bootsma, A.H., Haasnoot, A.J., van Crutchen, A., Wada, Y.and van Gennip, A.H., Rapid Screening of High-Risk Patients for Disorders of Purine andPyrimidine Metabolism Using HPLC-Electrospray Tandem Mass Spectrometry of LiquidUrine or Urine-soaked Filter Paper Strips. Clin. Chem., 46, 445–452 (2000).
31. Magera, M.J., Helgeson, J.K., Matern, D. and Rinaldo, P., Methylmalonic acid measured inplasma and urine by stable-isotope dilution and electrospray tandem mass spectrometry.Clin. Chem., 46, 1804–1810 (2000).
32. la Marca, G., Casetta, B. and Zammarchi, E., Rapid determination of orotic acid in urine by afast liquid chromatography/tandem mass spectrometric method. Rapid Commun. Mass Spectrom.,17, 788–793 (2003).
33. Jensen, U.G., Brandt, N.J., Chistensen, E., Skovoby, F., Norgaard-Pedersen, B. and Simonsen, H.,Neonatal screening for galactosemia by quantitative analysis of hexose monophosphates usingtandem mass spectrometry: A retrospective study. Clin. Chem., 47, 1364–1372 (2001).
34. Kushnir, M.M., Urry, F.M., Frank, E.L., Roberts, W.L. and Shushan, B., Analysis ofCatecholamines in urine by positive-ion electrospray tandem mass spectrometry. Clin. Chem.,48, 323–331 (2002).
35. Gempel, K., Gerbitz, K.-D., Casetta, B. and Bauer, M.F., Rapid determination of total homo-cysteine in blood spots by liquid chromatography-electrospray ionization-tandem mass spec-trometry. Clin. Chem., 46, 122–123 (2000).
36. Wang, D., Eadala, B., Sadilek, M., Chamoles, N.A., Turecek, F., Scott, R. and Gelb, M.H.,Tandem mass spectrometric analysis of dried blood spots for screening of mucopolysacchari-dosis I in newborns. Clin. Chem., 51, 898–900 (2005).

Medical Applications of Mass SpectrometryK. Vékey, A. Telekes and A. Vertes (editors)© 2008 Elsevier B.V. All rights reserved
379
Chapter 17
Applications of mass spectrometry in oncology
JOHN ROBOZ*
Division of Hematology/Oncology, Department of Medicine, Mount Sinai School of Medicine,1 Gustave Levy Place, New York, NY 10029, USA
1. Introduction 3802. New methodology—SELDI–TOF–MS 381
2.1. Protein chips 3812.2. Identification 3822.3. Proteomic pattern diagnostics 3832.4. Problems and prospects 384
3. Other relevant methodological challenges 3843.1. Analysis of cells 3843.2. Direct tissue analysis and imaging MS 3843.3. The problem of dynamic ranges 3843.4. Low-abundance, low-molecular mass proteins or drugs in plasma/serum 3853.5. Quantification 385
4. Diagnostic oncoproteomics based on SELDI–TOF–MS 3864.1. Ovarian and endometrial cancer 3874.2. Breast cancer 3874.3. Prostate cancer 3894.4. Pancreatic cancer 3904.5. Bladder cancer 3904.6. Head and neck cancer 3914.7. Miscellaneous malignancies 3914.8. Other searches for biomarkers using SELDI–TOF–MS 393
5. Representative other applications 3935.1. Proteomic studies to uncover molecular mechanisms associated
with malignancies 393
*Tel.: 212-241-7382; Fax: 212-996-9801. E-mail: [email protected] (J. Roboz).

380 J. Roboz
5.2. Proteomic profiles to provide predictors of drug-modulated targets and responses 394
5.3. Profiles to identify proteins associated with disease progression 3945.4. Targeted biomarker detection via whole protein analysis 3955.5. Sphingolipids in cancer pathogenesis and treatment 3955.6. Quantification of antineoplastic drugs 3955.7. Helicobacter pylori 3955.8. Molecular epidemiology for chemoprevention 3975.9. Selenium 397
References 398
1. Introduction
Cancer results from the multistep accumulation of somatic, and occasionally inher-ited, mutations that lead to clonal neoplastic cell transformation [1]. The associatedgenetic lesions include the activation of dominant oncogenes and the inactivation oftumor suppressor genes through mutation and loss of heterozygosity. Some 191“cancer genes” have been reported, 90% of them exhibiting somatic mutations [2].
The current buzzword is “biomarkers,” defined “as endogenous or injected mol-ecules whose presence or metabolism correlates with important disease relatedphysiological processes and/or disease outcomes” [3–6]. We know that tumors arealways in a process of interaction with their immediate environment, resulting inthe release, acquisition, or exchange of proteins, the nature and quantity of whichis likely to change in the course of the growth of the tumor. The proteome cancontain thousands of proteins, depending on cell or tissue type, health or diseasestate, and other factors. There are several distinct aspects of proteomic studies [7].To decipher a proteome, the first objectives are the large-scale identification ofproteins and their posttranslational modifications within a cell, tissue, or otherbiological sample, followed by structural characterization and the elucidation of thespecific functions and interactions of targeted proteins, within and between cells.Although proteomics is undoubtedly the major area of ongoing cancer biomarkerresearch, the glycoprotein-related aspects of glycomics [8,9] and the cancer-relatedsphingolipid (ceramid) aspects of lipidomics [10,11] are also areas of rapidlyevolving importance in cancer research.
During the last decade, mass spectrometric techniques have been used success-fully in all aspects of cancer medicine and research. These include environmentalcarcinogenesis, cancer biochemistry and molecular biology, immunology, all stagesof chemotherapy from identification of natural products through all phases ofthe arduous drug development process (synthesis, cell culture experimentation,

Applications of mass spectrometry in oncology 381
treatment of experimental animals) and, increasingly, medical oncology, includingdiagnosis [12] and Phase I–IV clinical trials, and treatment monitoring (reviewed inref. [13]). Table 1 summarizes the scope of mass spectrometry in cancer medicine.
After a description of the surface enhanced laser desorption ionization(SELDI)–TOF technology, and a brief discussion of a few methodological chal-lenges, there is a review of the diagnostic oncoproteomics in several malignancies,summarizing results and discussing advantages and shortcomings. Next, there isa review of representative applications (in no order of importance) in a varietyof areas, aiming to illustrate the wide diversity of subjects of current interest incancer research where mass spectrometry has been used successfully.
2. New methodology—SELDI–TOF–MS
2.1. Protein chips
In contrast to the MALDI technique, where the surface of the probe does not havean active role in the analytical process beyond holding the sample, in SELDIthe probe surface plays an active role in a number of aspects of the processing ofthe analytes, e.g., extraction, structural modification, and amplification [14]. In the
Table 1
Scope of mass spectrometry in cancer medicine illustrating the range of applications from smallmolecules to biopolymers
Screening and diagnosis• Unique carcinogenic biomarkers and
biomarker profiles• Monitoring subjects at risk (dosimetry)• Detection of small genetic alterations in the
background of normal genes• Differentially expressed proteins in body
fluids and tissues: upregulated, downregu-lated, or unique
Medical oncology and treatment monitoring• Toxic concentrations of drugs and/or
metabolites in blood, urine, and tissues• Pharmacokinetics; concentration time
curves• Pharmacodynamics; metabolism, protein
binding, loading values• Pharmacogenetics• Protein expression in the development of
chemoresistance
• Opportunistic infections: detecting/quantifying circulating microbialmetabolites for diagnosis and monitoringantibacterial and antifungal chemotherapy
Biology• Elucidation of cellular or structural changes
leading to oncogenesis• Nature of relevant mutations and time of
their occurrence• Identification and quantification of
epitopes• Function-critical posttranslational
modifications• Changes in cellular proteins in apoptosis• Changes in cellular proteins in progression
of tumors• Identification of critical protein–protein
associationsChemoprevention

382 J. Roboz
ProteinChip™ technology [15] special array surfaces are used to selectively retainentire subsets of proteins directly, and in a single step from biological samples.Thus, in contrast to HPLC–MS, which combines elution chromatography withMS, SELDI–MS combines retention chromatography with MS.
The selectivity for the target protein(s) is based on biochemical characteristicsincluding surfaces based on normal phase silica, strong and weak anion exchange,immobilized metal affinity capture (IMAC), various reactive moieties [16], andaffinity technology [17]. Antibody-based chips have also been designed to “baitout” individual proteins from crude biological samples [18]. After a series of washprotocols, the captured proteins are mixed with appropriate matrices and releasedby MALDI for subsequent mass determinations by TOF–MS or MS/MS studies inQq-TOF analyzers. Chips are now available where the energy absorbing mole-cules are already incorporated into the surface chemistry of the array. Practicalaspects of the SELDI–TOF–MS have been reviewed [19,20].
2.2. Identification
Fig. 1 shows a typical SELDI mass spectrum, showing a number of peaks in boththe normal and the pathologic samples and also a potential marker differentiallyexpressed in the patient sample. Here it would be worthwhile to attempt identifica-tion, assuming that the unique expression is statistically significant. Often, however,
40
20
0
50
25
0
-25
40
20
0
m/z
6624 88969306
65479295
8939
8608
8872
8611
8939
Patient
Patient
Control
Control
Patient
Control
R
100005000
Fig. 1. Typical SELDI spectrum comparing serum samples from a patient and control. Upper twolines: conventional spectra. Middle: gel-form presentation. Lower lines: potential markers differen-tially expressed in the patient sample.

Applications of mass spectrometry in oncology 383
distinct markers are not found and one needs to use a proteomic pattern recognitionalgorithm to detect potentially important peaks within the protein profiles.
Putative biomarkers detected by SELDI may be characterized/identified bythe judicious selection of any of several available strategies of protein identifi-cation, including conventional 2-DE separation followed by enzymatic digestionand the “bottom-up” approach, the sophisticated “top-down” strategy, or highlyaccurate mass determination for direct identification. There are SELDI acces-sories available for high-resolution tandem mass spectrometers. It is possible toidentify proteins directly on the surface of protein chips with virtually no sam-ple loss [21,22]. When the database searching is negative, de novo sequencingis indicated [23].
Whatever analytical approach is used for the characterization of proteins, the com-mon last step is to use a computer algorithm for the evaluation of the data obtained[24]. The general role of bioinformatics in protein analysis, including databasesearches, sequence comparisons, and structural predictions, has been reviewed[25,26]. A concise review of the available software tools for database searching tointerpret mass spectrometric data lists relevant original references [25].
2.3. Proteomic pattern diagnostics
The importance of the need for full identification of potential protein markers iscontroversial. Most papers on SELDI–TOF–MS for cancer diagnosis have beenomitting the identification of potential markers beyond the determination of theirapproximate molecular mass. In the opinion of some investigators, one does notneed individual identified markers as long as consistent protein profiles can beobtained [20]. In other words, the diagnosis of a disease should be considered as aprediction and should not be concerned about etiology.
When there are no individual peaks or groups of peaks with intensities signifi-cantly different between normal vs. pathologic samples, a bioinformatics algo-rithm is needed for diagnosis. There still are major unresolved challenges to theinterpretation of SELDI data [27]. Most proposed algorithms use a supervisedapproach which is based on training datasets. Available programs are based ongeneric algorithms [28], classification and regression tree analysis [29–31], uni-fied maximum separability algorithm [32,33], artificial neural networks providingassociation with disease grade [34], and an algorithm/k-nearest neighbors method,which was successfully applied to the published original ovarian cancer dataset[35]. A comprehensive pattern recognition procedure was designed to detect cancer-specific markers amid massive sets of mass spectral data; when applied to apublished set of data on ovarian cancer, 100% specificity and 100% sensitivitywere achieved, including early stage disease [36]. A novel statistical method,called link test, is based on the association between a specific mass spectrummarker and a microassay marker; this cross-platform approach was applied forfinding prostate cancer (PC) biomarkers [37].
384 J. Roboz
2.4. Problems and prospects
The initial media “hype” following the publication of the “original” article onapplying SELDI–TOF–MS to ovarian cancer (see Section 4.1) was followed bysevere criticism of several aspects of the methodology and interpretation techniquesas well as applications to the diagnosis of ovarian and PCs. A number of remedieswere suggested, including proposals to use more sophisticated mass spectrometers(e.g., Qq-TOF), change sample handling and experimental procedures, and applyadvanced mass measurement, reproducibility, and validation approaches [38–42].There is significant ongoing progress to eliminate the initial shortcomings, rang-ing from advances in chip technology to improve batch-to-batch reproducibility,through the use of proper mass calibration and internal standard techniques, to thedesign and testing of relevant algorithms to improve data handling and interpreta-tion. There are efforts to adapt the entire process to robotic systems [43].The SELDI technique establishes protein profiles easily and rapidly in body flu-ids. Based on current progress, it is reasonable to believe that SELDI–MS willprosper [44–46].
3. Other relevant methodological challenges
3.1. Analysis of cells
A novel technique, laser capture microdissection (LCM), has been developed toobtain very small populations of well-defined normal epithelial and adjacenttumor cells for subsequent lysing. In contrast to the �50,000 LCM-procured cellsneeded for 2D-PAGE analysis, the SELDI process requires only 25–100 cells toobtain a usable protein profile [47,48]. The technique is also applicable to subse-quent imaging analysis [49].
3.2. Direct tissue analysis and imaging MS
The principles and instrumentation of this exciting new technology are describedin Chapter 23. This approach clearly has major potential in cancer research; indeed,several initial proofs of principle applications in tumor characterization, biomarkerdiagnosis for diagnosis, and even drug development have been described [50–52].
3.3. The problem of dynamic ranges
A well-known problem in the analysis of protein mixtures is the fact that thepresence of components with high abundance may prevent even the detection(let alone quantification) of low-abundance proteins (which could ordinarily be
Applications of mass spectrometry in oncology 385
analyzed easily). For example, the concentration of plasma albumin is �106-foldhigher than that of the tumor-derived cytokeratin. Ion suppression (“matrixeffect”) may occur when the quantitative response to an analyte is significantlyreduced (possibly even eliminated) by the presence of a large quantity of anotheranalyte or components of a buffer. This type of problems may often be handledeffectively by using nano-flow rate separations in ESI–MS [53]. A highly efficientapproach to improve dynamic range (by �10-fold, to zeptomole detection limits)in capillary separation–ESI–FTICR–MS involves the DREAMS technique wherethe acquisition of a normal mass spectrum is followed by another acquisition inwhich the most abundant ions detected in the first scan are not introduced into theFTCR trap because they are removed in a quadrupole accessory placed outside themagnetic field [53].
3.4. Low-abundance, low-molecular mass proteins or drugs in plasma/serum
Albumin, a major constituent in serum (60–80 mg/L), is known to act as a trans-port carrier for small proteins. Also, many antineoplastic drugs bind to albumin,often at the 80–95% level. Removal or depletion of albumin is a major problem:there are problems with ultrafiltration (e.g., membrane binding of small proteinsand drugs) and other approaches, e.g., Cibacron dye columns and immunoaffinity-based protein subtraction chromatography. Albumin removal using acetonitrilemay be a simple alternative [54]; however, there is no truly satisfying method atthis time.
3.5. Quantification
Whatever the objective of a proteomic analysis (e.g., discovering diagnostic/prognostic markers, detecting new therapeutic targets), the confirmation of thepresence (or absence) of a particular protein is not adequate. To carry out theirfunctions within cells, proteins are continually synthesized or degraded; thus,knowledge of the quantity (relative or absolute) of the protein analyte is essentialin most cases. It is ironic that, while mass spectrometry is often an excellent toolfor quantification, the technology to quantify individual proteins in mixtures hasbeen notoriously inadequate in both ESI and MALDI ionizations and in bothMS/MS and SIM or SRM techniques. Strategies for the quantification of pro-teomes and subproteomes (based on posttranslational modifications) have beenreviewed [55]. A novel strategy is based on “decomposing” spectra into peaks andbaseline using so-called statistical finite mixture models [56].
Several techniques have been developed for quantification using stable isotopedilution [57]. There are special considerations for the global addition of stable iso-tope labels before or after protein digestion, and the metabolic labeling of proteinsin vivo, e.g., growing cells or even whole animals in which all proteins have been

386 J. Roboz
labeled biosynthetically [58]. In an alternative, label-free, approach, a fully auto-mated technology has been developed for LC–MS/MS analysis of complexprotein mixtures, based on the quantification (over a 32-fold range) of peptidesdirectly after integrating ion current associated with each peptide peak [59].
Quantification using the intensities of protein peaks obtained by SELDI–TOF–MS is not yet a reliable approach; results should be used together withinformation from microassays which are more reliable [37].
4. Diagnostic oncoproteomics based on SELDI–TOF–MS
Oncoproteomics is the systematic application of proteomic technologies to oncol-ogy research [60]. Diagnostic proteomics concentrates on “differential display”comparisons of protein (peptide) concentrations in plasma or urine in health anddisease with the following objectives: (i) early, rapid, and reliable diagnosis of can-cer for timely therapeutic intervention based on identified specific markers; (ii) earlydiagnosis of relapse; (iii) early diagnosis for risk assessment to aid prevention.
Although in differential display proteomics one would hope to find unique pro-tein tumor markers, perhaps resulting from posttranslational modifications in theneoplastic cells, it is more practical to search for proteins that are significantly up- or downregulated in the tumors. However, focus is shifting from methods that cananalyze one marker at a time to pattern-matching approaches which allow thesimultaneous measurement of a range of putative disease markers without theidentification of specific tumor-associated proteins. A hybrid strategy has beensuggested to retain the desirable attributes of high-information content MS pat-terns without giving up the capability to obtain identity [61].
There are only a few protein tumor markers used in clinical practice for diagno-sis or prognosis (http://cis.nci.nih.gov/fact/5_18.htm). In 2002, the publication of anew, novel technology, SELDI–TOF–MS, for the early (Stage I) diagnosis of ovar-ian cancer was received with considerable enthusiasm by physicians, scientists, aswell as the international news media (see below). Testing the diagnostic potentialof SELDI–TOF–MS for cancer diagnosis has been burgeoning during the last fewyears [62]. There are a number of strategies to consider in clinical proteomics, fromthe definition of the clinical question, through data acquisition, pre- and postpro-cessing, to protein identification and method validation [63]. The importanceof biomarkers may be appreciated even more by considering the increasing role ofthe Food and Drug Administration to predicate the “safe” and “effective” use ofnewly developed analytical approaches and the marketing of such for clinical appli-cations [64]. It is noted that a number of tumor-related proteins have already beenidentified by various mass spectrometry techniques [13]. Here only representativeSELDI-related diagnostic applications are reviewed.

Applications of mass spectrometry in oncology 387
4.1. Ovarian and endometrial cancer
The methodology in the “original” work on ovarian cancer aimed to recognize sig-nature protein patterns. Thousands of peaks were analyzed by an iterative searchingartificial intelligence algorithm. Using the results of a training set (50 each of patho-logic and control sera), mass spectra were evaluated from 50 women with confirmedovarian cancer and 66 controls. Diagnostic sensitivity was 100% and specificitywas 95% [28]. The Lancet paper has been extensively criticized [65,66]. In aPoint–Counterpoint exchange, a number of shortcomings were detailed, with respectto design, experimental techniques, and interpretation techniques; suggestions weremade as to how to test and remedy the problems and validate the methods [67,68](see also Section 2.4). Application of a new methodology, based on combinatoricsand optimization-based logical analysis, to the original ovarian dataset provided sev-eral advantages leading to both sensitivity and specificity approaching 100% [69].
In a five-center, case–control study of hundreds of patients, three putative mark-ers were identified by MS/MS using high-resolution SELDI–MS: apolipoprotein(downregulated), a truncated form of transthyretin (upregulated), and a fragmentof inter-�-trypsin inhibitor heavy chain H4 (downregulated). With the combinationof these biomarkers with CA125, both specificity and sensitivity were significantlyimproved with respect to the CA125 antigen, the “gold” standard [70]. In a follow-up study, an attempt was made to use these posttranslationally modified proteins forthe classification of cancer types [71]. Another study compared low- and high-resolution platforms (Qq-TOF), both equipped with SELDI sources. As expected,the high-resolution platform yielded superior classification patterns [72].
A comparative study of malignant and normal endometrial tissues yielded apanel of proteins displaying differential expression in malignant tissues. A promi-nent putative marker was identified as chaperonin 10 by both MALDI–Qq-TOFand ESI–Qq-TOF–MS, confirmed by Western blot and immunohistochemistry [73].A comparison of sera of patients with endometrial cancer with those of healthyfemales using SELDI–TOF–MS (weak cation exchange chips) yielded a numberof putative biomarkers upon evaluations with three data mining tools (a tree clas-sifier, Biomarker Wizard, and Biomarker Patterns System). The diagnostic patterncombined with 13 putative markers made it possible to differentiate patients withendometrial cancer from healthy subjects with specificity of 100% and sensitivityof 92.5% [74].
4.2. Breast cancer
The principles and potential clinical applications of SELDI–TOF–MS and microar-ray techniques have been reviewed with respect to screening, diagnosis, predictionof aggressiveness, response to treatment, and toxicity [75].

388 J. Roboz
4.2.1. Serum
A 28.3 kDa protein, detected in 100% of invasive breast cancer samples, 80% withnoninvasive disease (n 46), and 4% of disease-free women (n 23), was iden-tified as belonging in the kallikrein protein family [76]. In a retrospective study(103 patients divided by staging, 25 patients with benign disease, 41 healthywomen), using a panel of three unidentified biomarkers (4.3, 8.1, and 8.9 kDa) andbootstrap cross-validation, sensitivity was 93% for patients, and specificity was91% for controls [32]. Comparable diagnostic results were found by otherinvestigators using a different panel of diagnostic proteins and more advancedalgorithms [77].
4.2.2. Nipple aspirate fluids (NAF)
Advantages of NAF include the noninvasive nature of sampling, an ability to sam-ple both the diseased and the healthy contralateral breasts, the fact that NAF maybe reflective of the microenvironment where the carcinoma originates, and thatNAF is usually more concentrated than serum (ductal lavage may provide an evenbetter account of the tumor as it represents the entire length of the duct). Variousexperimental aspects (including nipple aspiration, ductal lavage, endoscopy,cytopathology, as well as characterization of putative markers by SELDI–TOF–MS)of the intraductal approach to biomarker discovery have been reviewed [78].
In a prospective trial of 114 women, scheduled for diagnostic breast surgery,three putative markers (5200, 11,800, and 13,880 Da) were expressed differen-tially. Two other putative markers (5200 and 33,400 Da) differentiated betweenbenign disease, ductal carcinoma in situ, and malignant tumor. Best results wereobtained by combining clinical and proteomic data [79]. In another study, pairedNAF samples from cancerous and noncancerous breasts were compared (n 23)and 463 peaks were analyzed. Results included the recognition of two overex-pressed and one underexpressed putative protein markers in tumor bearing breastscompared to disease-free subjects. Phenotypic proteomic NAF profiles differen-tiated between patients with early stage cancer and healthy women [80].
In a study aiming to establish quality control for NAF analysis, rigidly con-trolled experimental conditions were repeated 36 times. Algorithms were devel-oped for the quantification of �700 analyte peaks (�18,000 time points) at lowmasses [81].
4.2.3. Breast tissues
A comparative study of tissues (obtained using LCM) from primary breast can-cer with and without axillary lymph node metastasis was carried out withSELDI–TOF–MS and analyzed using ANOVA and multivariate logistic regression.

Applications of mass spectrometry in oncology 389
Two metal-binding polypeptides (4871 and 8596 Da) were identified as significantrisk factors [82].
4.3. Prostate cancer
Testing for elevated levels of prostate-specific antigen (PSA) together with man-ual digital rectal examination is the accepted test for the early detection of PC.However, as benign prostatic hyperplasia (BPH) also causes elevated PSA, biopsyis still needed to confirm PC. SELDI–TOF–MS has been used to analyze free andcomplexed PSA, and prostate-specific membrane antigen (PSMA), in pure forms,cell lysates, sera, and seminal plasma samples. Analysis of cell lysates (�2000 cellsobtained by laser capture microdissection) revealed free PSA in both normaland cancerous tissues, but not in stroma. PSMA was present only in cancer cells[83]. The general applicability of biomarkers for early diagnosis, and potentialproblems of SELDI–TOF–MS have been reviewed [84,85].
In a study to test a pattern-matching algorithm, serum protein profiles wereobtained from 167 PC and 77 BPH patients, and 82 healthy men. Of some 63,000peaks detected, 9 peaks (masses in the 4.4–9.5 kDa range) with high discrimina-tory power were selected to develop and train a decision tree classification algo-rithm. On testing by stratified, randomly selected samples, sensitivity was 83%and specificity was 97%. The predictive value was 94% for the study populationand 91% for the general population [86]. In a similar study, using the boosteddecision tree analysis approach, one of the two classifiers developed achieved 100%sensitivity and specificity but required 74 peaks and 500 base classifiers. A differ-ent evaluation yielded only 97% sensitivity and specificity for the test set;however, it required only 21 peaks and a combination of only 21 base classifiers[30]. In a third study, a classifier algorithm was established using seven masses(2–18.2 kDa range). PC was correctly predicted in 36/38 patients, while 177/228subjects were correctly classified as BPH. The specificity for marginally elevatedPSA (4–10 ng/mL, n 137) was 71% [87]. With respect to methodologies, cor-relation and prediction confidence of the decision forest technique [88] andplatform reproducibility were evaluated [89].
A different approach to diagnosis involved searching for individual markers. Inone study, three potential markers were detected in PC but none in 12 controls.The 15.9 kDa marker appeared in 9/11 PC but was absent in 12 patients with BPH.The 15.2 kDa marker appeared in 9/11 PC and 4/12 BPH patients. The intensitiesof the 17.5 kDa marker were essentially the same in the PC and BPH groups.Because the 15.9 kDa protein was present in 82% of PC but was absent in all BPH,it was concluded that this protein may be a putative marker to differentiate PCfrom BPH [90].
In another study, a 50.8 kDa protein was detected in 96% of cancer patients (n 56) but not in 70–80% of subjects with various benign prostate diseases (n 22)

390 J. Roboz
and 96% of controls (n 48). Using the mass fingerprinting method, the proteinwas identified as being related to vitamin D-binding protein [91].
4.4. Pancreatic cancer
After using CA19-9 as the only accepted diagnostic marker for pancreatic cancer fortwo decades [92], a bewildering number of potential biomarkers are currently underevaluation [93]. A peak (3334.7 Da) found by SELDI–TOF–MS in 5/15 pancreaticadenocarcinoma cell lines was identified by Qq-TOF–MS/MS as the COOH-terminal fragment of DMBT1, a putative tumor suppression protein intracellularlygenerated by limited prior proteolysis. Analyses of other cell lines suggested thatthe marker may be unique to pancreatic adenocarcinoma [94]. In another study, adifferentially expressed peak (�16,570 Da) was detected in 10/15 samples from pan-creatic adenocarcinoma in contrast to only 1/7 with other pancreatic diseases. Thepeak was identified as hepatocarcinoma–intestine–pancreas/pancreatitis-associatedprotein I (HIP–PAP I) by SELDI immunoassay [95].
Subsequently, protein profiles were obtained, after fractionating sera into sixfractions, using various chips to remove albumin. A diagnostic algorithm revealedsignificant differences between patients with resectable adenocarcinoma, nonma-lignant pancreatic diseases, and healthy subjects. The most discriminating peaks(all downregulated) were 3146 and 12,861 Da (fraction 1) and 3473, 5903, 8563,and 16,008 Da (fraction 6). Combinations of the markers performed better than theCA19-9 marker. Interestingly, the HIP/PAP protein of the previous study was notdetected [33].
Another study of 245 plasma samples led to the selection of training cohort(n 71 for both cancer patients and controls) for a vector machine learning algo-rithm. Four putative markers were recognized (in the 8.7–14.8 kDa mass range)yielding sensitivity of 97% and specificity of 94% in the training cohort. Whenapplied to the entire validation cohort (in two institutions), both sensitivity andspecificity were 91%. When combined with CA 19-9 results, 100% of tumors werediagnosed (n 29) including early stages (Stages I and II) [96].
4.5. Bladder cancer
Aiming for a diagnostic urine test for transitional cell carcinoma (TCC, 95% oftotal cases), 94 samples and controls were analyzed. Of some 70 differentiallyexpressed proteins and polypeptides in the 2–150 kDa mass range, 5 were prefer-entially expressed in TCC, at 3353 Da, 9495, 44.6, 100.120, and 133.190 kDa. The3.3 kDa protein, also detected in microdissected bladder cells, was identified, bySELDI immunoassay and database search, as a member of the human defensinfamily. The diagnostic sensitivity of the combined markers was 78% compared to33% of cytologic approaches [97].
Applications of mass spectrometry in oncology 391
Attempts to differentiate TCC from benign urogenital diseases led to a trainingsample set for a decision tree classification algorithm which, in turn, yielded amass cluster pattern. In a blinded test set (n 38) sensitivity was 96.3% andspecificity was 87.0% [98]. In another study, a training set utilizing 5/187 masspeaks (from 104 urine samples) was used to establish a pattern for tree analysis.The pattern correctly predicted 49/68 test samples, 25/45 TCC samples, and 24/33noncancerous samples [99].
An investigation of several methodological aspects of obtaining urinary proteinprofiles by SELDI–TOF–MS revealed that among the extrinsic factors instrumentsettings and matrix composition critically influenced peak detection and reproducibil-ity, while freeze–thaw cycles had minimal effects. Intrinsic factors of significanceincluded blood in urine, dilution, and first-void vs. midstream urine [100].
4.6. Head and neck cancer
A comparison of protein profiles from cell lines, derived from a primary tumor anda metastatic lymph node, revealed four differentially expressed proteins in thelatter: two membrane-associated proteins (downregulated), annexin I and annexinII, glycolytic protein enolase-� (upregulated), and a calumenin precursor (down-regulated). The identification of the upregulated proteins was validated usingdigestion with endoproteinase lysine-C [101].
Aiming to use serum to screen for differentially expressed proteins, head andneck squamous cell cancer samples (n 99), “healthy” smokers (n 25), andhealthy controls (n 102) were analyzed. An expected known biomarker, metal-lopanstimulin-1 (10,068 Da) was identified by SELDI immunoassay (rabbit poly-clonal antibodies). A classification tree algorithm was used for the evaluation ofnumerous other protein peaks. The training set consisted of 75 samples from eachgroup, and the rest of the samples constituted the test set. Discrimination of squa-mous cell cancer from controls and healthy smokers was accomplished with asensitivity of 83.3% and specificity of 90% [102].
4.7. Miscellaneous malignancies
4.7.1. Colon and gastric cancer
The differential expression of a putative serum marker (8.9 kDa) was threefoldhigher in colon cancer patients (n 34) than in controls (n 14). The analyte wasseparated using C18-type Zip-Tip columns and, after a number of separation andpurification steps, was digested in-gel with trypsin. The resulting peptides wereanalyzed using IT-MS/MS. The MS/MS data were compared with a sequencedatabase and the protein identified as C3-desArg77, a hydrolyzed component ofhuman anaphylatoxin, complement component 3 precursor C3 [103].

392 J. Roboz
In a subsequent study of comparable design, a classification algorithm identifieda set of putative markers in the 4–8 kDa mass range. The model with the highestclassification accuracy included two masses, at m/z 8132 and 4002. For an inde-pendent set of sera, the pattern could differentiate patients (different stages ofcolorectal cancer) from healthy subjects with both sensitivity and specificity of95% [104].
Protein profiles were obtained using SELDI–TOF from patients with gastriccancer (n 127), healthy controls (n 100), and a small number of patientswith other malignancies. Three masses selected as “fingerprints” (m/z 1468,3935, and 7560) enabled a classifier algorithm to differentiate, in the trainingset, between cancer patients and controls with a sensitivity of 96% and speci-ficity of 92%. In a blinded test set, sensitivity was 85% and specificity was 88%.The performance of this approach yielded better results than those based on thecombined conventional carcinoembryonic antigen (CEA) and carbohydrateantigen (CA 19-9) tests [105].
4.7.2. Lung cancer
Cells (�3 104) were obtained from frozen sections of normal lung, atypical ade-nomatous hyperplasia, and malignant tumors using LCM. Six potential markerswere present in tumor cells with significantly higher intensity and three peaks withsignificantly lower intensities, compared to normal cells; one peak (17,250 Da)was not detected in normals. A “malignant lung protein profile” made it possibleto differentiate between tumor and premalignant pulmonary epithelium [106].
4.7.3. Melanoma
The concentrations of some putative markers in the 2.5–3.5 kDa range exhibitedsignificant variations related to the clinical stages in the protein profiles of sera ofpatients with malignant cutaneous melanoma. No identifications were made [107].Protein peak (3.3–30 kDa range) clustering and classification, followed by usingsupervised classification algorithm, generated a discriminating classification tree.Early stage melanoma recurrence was predicted with 72% sensitivity and 75%specificity [108].
4.7.4. Hepatocellular carcinoma
Aiming to develop a technique for the differentiation of carcinoma from chronicliver disease, serum protein profiles were obtained from 38 patients with carci-noma and 20 patients with chronic liver disease. Serum samples were fractionatedinto six fractions. Significant differences were observed in the 0.5–200 kDa massrange. Both two-way hierarchial clustering analysis and artificial neural network

Applications of mass spectrometry in oncology 393
algorithms were used to classify pooled serum samples. Specificity was 90% andsensitivity was 92% [109].
4.8. Other searches for biomarkers using SELDI–TOF–MS
Related investigations include: proteomic analysis of lymph [110], study of serumprotein profiles in hemodialysis patients [111], a variety of applications in hema-tology [112–115], detection of multiple variants of serum amyloid alpha in renalcancer [116], search for biomarkers expressed by human pluripotent stem cells[117], study of the involvement of tumor necrosis superfamily members and aproliferation-inducing ligand in the resistance to apoptosis of B-CLL leukemiccells through an autocrine pathway [115] and protein profiling in neuroblastoma[118], and brain cancer [119,120]. Putative biomarkers were found in 39 humancancer cell lines [121] and the 60 human cell line panel of the NCI [122].Development of SELDI affinity techniques is likely to be valuable for theproteomic evaluation of archival cytologic materials [123].
5. Representative other applications
5.1. Proteomic studies to uncover molecular mechanisms associatedwith malignancies
Most available MS technologies have been used to elucidate the proteomics ofbreast carcinoma. The degree of tissue heterogeneity of breast carcinomas, a seri-ous problem obscuring quantitative comparative experiments, may be overcomeby using LCM. Current emphasis is on infiltrating vs. in situ ductal carcinoma,aiming to uncover differential profiles for diagnosis as well as monitoring diseaseresponse to therapy [124]. The complexity of the breast cancer proteome may besimplified by concentrating on specific subcellular compartments. For example,MS-based approaches have been explored to study lysosomes, such as the aspar-tic protease cathepsin that has been shown to be involved in disease progression[125]. Despite the fact that removal of cells from their natural microenvironmentmay lead to gaining or losing certain characteristics, the in vitro study of cell cul-tures still has obvious advantages. Novel uses of MS include the measurement(GC/MS) of epithelial cell proliferation using 2H2O labeling for assessing theeffects of antiproliferation chemopreventive and chemotherapeutic agents [126],and the 2D LC/MS analysis of similarities and differences between hundreds ofmembrane proteins in MCF7 and BT474 cell lines [127].
Several studies have been carried out to obtain proteomic profiles in humanlung cancer cell lines. Proteomic signatures were obtained for different histologi-cal types of lung cancer. Hierarchial clustering analysis and principal component
394 J. Roboz
analysis of separated (2D-DIGE) proteins revealed 32 proteins that were used tocategorize cancer cell into distinct histological groups [128]. Investigations of theproteome of lung squamous carcinoma utilized MALDI–TOF–MS and severaldatabases to identify some 76 differentially expressed protein spots obtained byelectrophoresis [129].
Proteomic analyses of exosomes from malignant pleural effusions [130] andhuman mesothelioma cells [131] revealed several discrete sets of proteinsinvolved in antigen presentation, signal transduction, migration, and adhesion, sug-gesting interactions between tumor cells and their environment. A large number ofproteins were identified in a study of human pleural effusions including severalthat were suggested to play a role in the development and progression of thecancer phenotype [132].
A study of protein profiles in gastric adenocarcinoma revealed diverse alter-ations related to self-protection efforts of cells and changes during the malignanttransformation. An 18 kDa antrum mucosa protein was significantly underex-pressed in progressing tumors. It was concluded that the global consideration ofthe expressed profile alterations will provide insights into the pathogenesis of thetumor [133].
5.2. Proteomic profiles to provide predictors of drug-modulated targets andresponses
Individuals with inherited familial adenomatous polyposis (FAP) develop numer-ous polyps, the premalignant precursors to colorectal carcinoma. A remarkableheterogeneity in patient response was observed in a clinical trial with acyclooxygenase-2-inhibitor, celocoxib, which is known to be efficacious in FAP.SELDI proteomic profile revealed that a putative marker at 16,961.4 Da was astrong discriminator between response and nonresponse [134].
5.3. Profiles to identify proteins associated with disease progression
In cell line studies, an 11 kDa protein was identified by MALDI–MS anddatabase search as S100C (calgizzarin) which is significantly downregulated inbladder cancer and is associated with poor survival; loss of S100C which wasalso significantly associated with poor survival in patients [135]. Two downreg-ulated proteins, identified as isocitrate cytoplasmic and peroxiredoxin-II, wereidentified in both bladder cancer cell lines and human biopsies. Loss of these pro-teins marked the progression of malignancy [136]. In a study of tumor subsets inlung cancer, 15/1600 separated peaks provided a call-prediction model to distin-guish primary tumors from metastasis and to distinguish between patients withresected nonsmall-cell lung cancer and poor prognosis from those with goodprognosis [137].

Applications of mass spectrometry in oncology 395
5.4. Targeted biomarker detection via whole protein analysis
The developing technology of “top-down” protein identification does not rely onpeptide ions for identification; thus, it avoids the dilution effect for small proteinsassociated with digestion. Targeted characterized proteins may be analyzed by read-ily available ion trap mass spectrometers. The concept was demonstrated by usingtop-down MS/MS for the identification of N-terminally acetylated thymosin �4,that is expressed in certain lung adenocarcinoma cells, and is considered as a puta-tive biomarker. This work is of interest because of the methodological details [138].
5.5. Sphingolipids in cancer pathogenesis and treatment
Ceramide, a major component of sphingolipid metabolism, functions as a tumorsuppressor lipid, inducing antiproliferative and apoptotic responses in variousmalignant neoplastic cells. Conversely, sphingosine-1-phosphate (S1P) has beenshown to be a tumor promoting lipid. Various exogenously supplied ceramides arenow known to induce antiproliferative and other important cell function-relatedresponses and thus represent a target for cancer therapy [139,140]. The develop-ment of a series of protocols for the high-throughput, structure-specific, and quan-titative analysis of sphingolipids by HPLC–tandem MS (both triple quadrupoleand ion trap) permits the investigation of this large and chemically complex groupof compounds [141].
5.6. Quantification of antineoplastic drugs
There are literally hundreds of MS techniques described for the quantification ofantineoplastic drugs in body fluids [13]. A representative publication describes thesimultaneous determination of methotrexate and cyclophosphamide in urine by avalidated LC–ESI–MS/MS method. The impressive lower limits of detection were0.2 �g/L for methotrexate and 0.04 �g/L for cyclophosphamide [142]. The advan-tages of multiple reaction monitoring may be appreciated by reviewing a methoddeveloped for the quantification of the farnesyl transferase inhibitor lonafarnib inhuman plasma using HPLC coupled with tandem MS [143]. Attention is called to theincreasing inclusion of validation experiments, using FDA guidelines, a commonrequirement for techniques used to obtain data for pharmacokinetic studies, partic-ularly in Phase I clinical trials of new drugs (www.fda.gov/cder/guidance/4252fnl.html).
5.7. Helicobacter pylori
The stomachs of about half of the people in the world are colonized by H. pylori,a Gram-negative organism that is assigned as a Class 1 carcinogen. While most

396 J. Roboz
colonized individuals are asymptomatic, a subpopulation of 10–20% developspeptic ulcers that may in turn evolve into adenocarcinoma; 30–90% of gastric can-cers (a major health problem worldwide) are tied to this microorganism [144].There are significant clinical and economic aspects of screening for, and diagno-sis of, this infection [145].
5.7.1. Diagnosis
The “gold” standard of diagnosis is the 13C-urea breath test which is based onthe fact that while humans have no endogenous urease activity in the stomach,Helicobacter species have high urease activity. In the stomach H. pylori hydrolyzes13C-enriched urea to 13C and NH3; thus, the determination of the area ratios of the13CO2 to 12CO2 peaks in expired air is diagnostic. Being a stable, nonradioactiveisotope, 13C can be administered safely to children and pregnant women. Theexcess 13C in exhaled breath can be determined accurately with dual-inlet gasisotope-ratio mass spectrometers [146–148]. Bench-top GC/MS instruments(SIM mode) have also been evaluated for the determination of the 13CO2 to 12CO2
peak area ratios; both sensitivity and specificity values were in the 96–98% range[149].
5.7.2. Biomarkers of the bacterium
Lysates and extracts from six different H. pylori strains were analyzed byMALDI–TOF–MS. It was concluded that the strain-specific biomarkers identifiedmight be used in a fingerprinting technique for strain typing [150]. In anotherMALDI–TOF–MS investigation, a potential biomarker of 58,268 Da could distin-guish H. pylori from H. mustalae and Campylobacter species. It was concludedthat, together with three strain-nonspecific markers, the technique is adequate forthe rapid detection of these organisms in foods, beverages, or manufactured prod-ucts [151]. Utilizing predictive information from the H. pylori genome, some20 candidate proteins were identified by MALDI–TOF–MS in proteolytic digests ofH. pylori lysates from blood samples of infected patients. It was concluded that thisapproach has potential for vaccine development [152]. In another approach to rec-ognize antigenic proteins as candidates for vaccines, hundreds of proteins wereseparated by 2D electrophoresis and analyzed by MALDI–TOF–MS, revealingsome 960 mass spectra leading to the confirmation of the presence of 24 previouslyunidentified proteins [153]. Use of similar methodology to study subproteomes ofsoluble and structure-bound H. pylori proteins led to the identification of severalstructure-bound proteins that may be candidates for diagnostic and/or vaccineinvestigations [154].

Applications of mass spectrometry in oncology 397
5.8. Molecular epidemiology for chemoprevention
All definitions of cancer chemoprevention (and there are many) include the use ofchemical means for the inhibition, retardation, or reversal of the carcinogeneticprocess. In contrast to tumor biomarkers which are associated with establishedneoplasia or metastasis, there are two types of biomarkers relevant to cancerchemoprevention: risk biomarkers, referring to genetic predisposition, medicalhistory, lifestyle, exposure, and cellular abnormalities (no detectable premalignantor malignant disease), and biomarkers of chemopreventive intervention, referringto such biological alterations of early/intermediate carcinogenesis which may beeffected by chemopreventive agents [155].
An important group of relevant biomarkers are DNA adducts which originatefrom the chemical modification of bases in DNA or amino acids in proteins bytoxic chemicals. Advantages of LC–ESI–MS methods, compared to 35P-postlabeling(the “gold” standard) and GC–MS (with negative CI), include detection of highlypolar compounds without derivatization, direct analyte identification, and accuratequantification using internal standards (preferably stable isotope labeling); currentdetection limit is 1/108 nucleotides. Relevant applications include aflatoxin B1 andhepatocellular carcinoma, oxidative DNA adducts of prostate carcinoma, and M1Gadducts in a variety of malignancies and in the predisposition to gastric adenocar-cinoma resulting from infection by H. pylori [155].
5.9. Selenium
As a constituent of selenoproteins, selenium has several vital structural and enzy-matic roles. Increased intake of selenium-enriched food has been shown to yielddirect, inverse, or null associations with cancer risk [156,157]. Attempts have beenmade to correlate serum selenium levels with overall survival in non-Hodgkin’slymphoma [158], PC [159], and poor outcome in lung adenocarcinoma [160]. Themost important selenium-containing organic compounds are selenomethionine(present in plants) and selenocysteine (present in animal proteins). A coupledcapillary electrophoresis–inductively coupled mass spectrometry technique wasdeveloped for the speciation of two selenium species. The limits of detectionfor the two species studied in drinking water were 24 and 10 pg, respectively[161]. The predominant selenium species in both garlic (296 mg/(g Se)) and yeast(1922 mg/(g Se)) were �-glutamyl-methylselenocysteine and selenomethionine.In rats, selenium from garlic was significantly more effective than selenium fromyeast in suppressing the development of premalignant lesions and the formation ofbreast adenocarcinomas [162]. Several MS strategies for selenium speciation indietary sources have been reviewed, with emphasis on validation and cancerpreventive properties [163].
398 J. Roboz
References
1. Hanahan, D. and Weinberg, R.A., The hallmarks of cancer. Cell, 100, 57–70 (2000).2. Futreal, P.A., A census of human cancer genes. Nat. Rev. Cancer, 4, 177–183 (2005).3. Ilyin, S.E., Belkowski, S.M. and Plata-Salaman, C.R., Biomarker discovery and validation:
technologies and integrative approaches. Trends Biotechnol., 22, 411–416 (2004).4. Whiteley, G.R., Proteomic patterns for cancer diagnosis—promise and challenges. Mol.
Biosyst., 2, 358–363 (2006).5. Aebersold, R., Perspective: a program to improve protein biomarker discovery for cancer.
J. Proteome. Res., 4, 1104–1109 (2005).6. deVera, I.E., Katz, J.E. and Agus, D.B., Clinical proteomics: the promises and challenges of
mass spectrometry-based biomarker discovery. Clin. Adv. Hematol. Oncol., 4, 541–549(2006).
7. Graves, P.R. and Haystead, T.A., Molecular biologist’s guide to proteomics. Microbiol. Mol.Biol. Rev., 66, 39–63 (2002).
8. Hirabayashi, J. and Kasai, K., Separation technologies for glycomics. J. Chromatogr. B Anal.Technol. Biomed. Life Sci., 771, 67–87 (2002).
9. Sun, B., Ranish, J.A., Utleg, A.G., White, J.T., Yan, X., Lin, B. and Hood, L., Shotgun gly-copeptide capture approach coupled with mass spectrometry for comprehensive glycopro-teomics. Mol. Cell Proteomic., 6, 141–149 (2007).
10. Wenk, M.R., The emerging field of lipidomics. Nat. Rev. Drug Discov., 4, 594–610 (2005).11. Yoo, H.H., Son, J., and Kim, D.H., Liquid chromatography–tandem mass spectrometric deter-
mination of ceramides and related lipid species in cellular extracts. J. Chromatogr. B Anal.Technol. Biomed. Life Sci., 843, 327–333 (2006).
12. van der Merwe, D.E., Oikonomopoulou, K., Marshall, J. and Diamandis, E.P., Mass spec-trometry: uncovering the cancer proteome for diagnostics. Adv. Cancer Res., 96, 23–50 (2006).
13. Roboz, J., Mass Spectrometry in Cancer Research. CRC Press, Boca Raton, FL, 2002, pp. 1–554.14. Howard, J.C., Heinemann, C., Thatcher, B.J., Martin, B., Gan, B.S. and Reid, G., Identification
of collagen-binding proteins in Lactobacillus spp. with surface-enhanced laser desorption/ionization–time of flight ProteinChip technology. Appl. Environ. Microbiol., 66, 4396–4400(2002).
15. Merchant, M. and Weinberger, S.R., Recent advancements in surface-enhanced laser desorption/ionization–time of flight–mass spectrometry. Electrophoresis, 21, 1164–1177 (2000).
16. Fung, E.T., Thulasiraman, V., Weinberger, S.R., Delmasso, E.A., Protein biochips for differ-ential profiling. Current Opinion Biotechnol., 12, 65–69 (2001).
17. Tang, N., Tornatore, P. and Weinberg, S.R., Current developments in SELDI affinity technol-ogy. Mass Spectrom. Rev., 23, 34–44 (2004).
18. Rubin, R.B. and Merchant, M., A rapid protein profiling system that speeds study of cancerand other diseases. Am. Clin. Lab., 19, 28–29 (2000).
19. Wiesner, A., Detection of tumor markers with protein ProteinChip technology. Curr. Pharm.Biotechnol., 5, 45–67 (2004).
20. Xiao, Z., Prieto, D., Conrads, T.P., Veenstra, T.D. and Issaq, H.J., Proteomic patterns: their po-tential for disease diagnosis. Mol. Cell Endocrinol., 230, 95–106 (2005).
21. Caputo, E., Moharram, R. and Martin, B.M., Methods for on-chip protein analysis. Anal.Biochem., 321, 116–124 (2003).
22. Lin, S., Tornatore, P., King, D., Orlando, R. and Weinberger, S.R., Limited acid hydrolysis asa means of fragmenting proteins isolated upon proteinchip array surfaces. Proteomics, 1,1172–1184 (2001).
23. Aebersold, R. and Goodlett, D.R., Mass spectrometry in proteomics. Chem. Rev., 101,269–295 (2001).

Applications of mass spectrometry in oncology 399
24. Fenyo D., Identifying the proteome: software tools. Curr. Opin. Biotechnol., 11, 391–395 (2000).25. Persson, B., Bioinformatics in protein analysis. EXS, 88, 215–231 (2000).26. Boguski, M.S. and McIntosh, M.W., Biomedical informatics for proteomics. Nature, 42,
233–237 (2003).27. Rodland, K.D., Proteomics and cancer diagnosis: the potential of mass spectrometry. Clin.
Biochem., 37, 579–583 (2004).28. Petricoin, E.F., Ardekani, A.M., Hitt, B.A., Levine, P.J., Fusaro, V.A., Steinberg, S.M., Mills,
G.B., Simone, C., Fishman, D.A., Kohn, E.C. and Liotta, L.A., Use of proteomic patterns inserum to identify ovarian cancer. Lancet, 359, 572–577 (2002).
29. Fung, E.T. and Enderwick, C., ProteinChip@ clinical proteomics: computational challengesand solutions. Biotech. Suppl., 32, S34–S41 (2002).
30. Qu, Y., Adam, B.-L., Yasui, Y., Ward, M.D., Cazares, L.H., Schellhammer, P.F., Feng, Z.,Semmes, O.J. and Wright, G.L., Boosted decision tree analysis of surface-enhanced laserdesorption/ionization mass spectral serum profiles discriminates prostate cancer from non-cancer patients. Clin. Chem., 48, 1835–1843 (2002).
31. Whittal, R.M. and Li, L., Time-lag focusing MALDI–TOF mass spectrometry. Am. Lab., 24,30–36 (1997).
32. Li, J., Zhang, Z., Rosenzweig, J., Wang, Y.Y. and Chan, D.W., Proteomics and bioinformaticsapproach for identification of serum biomarkers to detect breast cancer. Clin. Chem., 48,1296–1304 (2002).
33. Koopmann, J., Zhang, Z., White, N., Rosenzweig, J., Fedarko, N., Jagannath, S., Canto, M.I.,Yeo, C.J., Chan, D.W. and Goggins, M., Serum diagnosis of pancreatic adenocarcinoma usingsurface-enhanced laser desorption and ionization mass spectrometry. Clin. Cancer Res., 10,860–868 (2004).
34. Ball, G., Mian, S., Holding, F., Allibone, R.O., Lowe, J., Ali, S., Li, G., McCardle, S., Ellis,I.O., Creaser, C. and Rees, R.C., An integrated approach utilizing artificial neural networksand SELDI mass spectrometry for the classification of human tumors and rapid identificationof potential biomarkers. Bioinformatics, 18, 395–404 (2002).
35. Li, L., Umbach, D.M., Terry, P. and Taylor, J.A., Application of the GA/KNN method toSELDI proteomics data. Bioinformatics, 20, 1638–1640 (2004).
36. Zhu, W., Wang, X., Ma, Y., Roa, M., Glimm, J. and Kovach, J.S., Detection of cancer-specificmarkers amid massive mass spectral data. PNAS, 100, 14666–14671 (2003).
37. Deng, X., Geng, H., Bastola, D.R. and Ali, H.H., Link test—a statistical method for findingprostate cancer biomarkers. Comput. Biol. Chem., 30, 425–433 (2006).
38. Pizzo, P., After empiric therapy: what to do until the granulocyte comes back. Rev. Infect. Dis.,9, 214–219 (1987).
39. Diamandis, E.P., Analysis of serum proteomic patterns for early cancer diagnosis: drawingattention to potential problems. J. Natl. Cancer Inst., 96, 353–356 (2004).
40. Diamandis, E.P., Mass spectrometry as a diagnostic and a cancer biomarker discovery tool:opportunities and potential limitations. Mol. Cell Proteomic., 3, 367–378 (2004).
41. Baggerly, K.A., Morris, J.S. and Coombes, K.R., Reproducibility of SELDI–TOF protein pat-terns in serum: comparing datasets from different experiments. Bioinformatics, 20, 777–785(2004).
42. Villanueva, J., Correcting common errors in identifying cancer-specific serum peptide signa-tures. J. Proteome Res., 4, 1060–1072 (2005).
43. Aivado, M., Spentzos, D., Alterovitz, G., Otu, H.H., Grall, F., Giagounidis, A.A., Wells, M.,Cho, J.Y., Germing, U., Czibere, A., Prall, W.C., Porter, C., Ramoni, M.F. and Libermann,T.A., Optimization and evaluation of surface-enhanced laser desorption/ionization time-of-flight mass spectrometry (SELDI–TOF MS) with reversed-phase protein arrays for proteinprofiling. Clin. Chem. Lab. Med., 43, 133–140 (2005).

400 J. Roboz
44. Dijkstra, M., Vonk, R.J. and Jansen, R.C., SELDI–TOF mass spectra: a view on sources ofvariation. J. Chromatogr. B Anal. Technol. Biomed. Life Sci., 847, 12–23 (2006).
45. Diamandis, E.P., Serum proteomic profiling by matrix-assisted laser desorption–ionization time-of-flight mass spectrometry for cancer diagnosis: next steps. Cancer Res., 66, 5540–5541 (2006).
46. Engwegen, J.Y., Gast, M.C., Schellens, J.H. and Beijnen, J.H., Clinical proteomics: searchingfor better tumour markers with SELDI–TOF mass spectrometry. Trends Pharmacol. Sci., 27,251–259 (2006).
47. Emmert-Buck, M.R., Bonner, R.F., Smith, P.D., Chuaqui, R.F., Zhuang, Z., Goldstein, S.R.,Weiss, R.A. and Liotta, L.A., Laser capture microdissection. Science, 274, 998–1001 (1996).
48. Craven, R.A. and Banks, R.E., Laser capture microdissection and proteomics: possibilities andlimitation. Proteomics, 1, 1200–1204 (2001).
49. Caldwell, R.L. and Caprioli, R.M., Tissue profiling by mass spectrometry: a review ofmethodology and applications. Mol. Cell Proteomic., 4, 394–401 (2005).
50. Reyzer, M.L., MALDI mass spectrometry for direct tissue analysis: a new tool for biomarkerdiscovery. J. Proteome Res., 4, 1138–1142 (2005).
51. Chaurand, P., Schwartz, S.A., Reyzer, M.L. and Caprioli, R.M., Imaging mass spectrometry:principles and potentials. Toxicol. Pathol., 33, 92–101 (2005).
52. Brunelle, A., Biological tissue imaging with time-of-flight secondary ion mass spectrometryand cluster ion sources. J. Mass Spectrom., 40, 985–999 (2005).
53. Smith, R.D., Shen, Y. and Tang, K., Ultrasensitive and quantitative analyses from combinedseparations-mass spectrometry for the characterization of proteomes. Acc. Chem. Res., 37,269–278 (2004).
54. Merrell, K., Southwick, K., Graves, S.W., Esplin, M.S., Lewis, N.E. and Thulin, C.D.,Analysis of low-abundance, low-molecular-weight serum proteins using mass spectrometry.J. Biomol. Tech., 15, 238–248 (2004).
55. Zhang, H., Yan, W. and Aebersold, R., Chemical probes and tandem mass spectrometry: astrategy for the quantitative analysis of proteomes and subproteomes. Curr. Opin. Chem. Biol.,8, 66–75 (2004).
56. Dijkstra, M., Roelofsen, H., Vonk, R.J. and Jansen, R.C., Peak quantification in surface-enhanced laser desorption/ionization by using mixture models. Proteomics, 6, 5106–5116(2006).
57. Aebersold, R. and Mann, M., Mass spectrometry-based proteomics. Nature, 422, 198–207(2003).
58. MacCoss, M.J. and Matthews, D.E., Quantitative MS for proteomics: teaching a new dog oldtricks. Anal. Chem., 77, 295A–302A (2005).
59. Higgs, R.E., Comprehensive label-free method for the relative quantification of proteins frombiological samples. J. Proteome Res., 4, 1442–1450 (2005).
60. Jain, K.K., Recent advances in oncoproteomics. Curr. Opin. Mol. Ther., 4, 203–209 (2002).61. Gillette, M., Place of pattern in proteomic biomarker discovery. J. Proteome Res., 4,
1143–1154 (2005).62. Roboz, J., Mass spectrometry in diagnostic oncoproteomics. Cancer Invest., 23, 465–478 (2005).63. Fung, E.T., Strategies in clinical proteomics: from discovery to assay. Preclinica, 2, 253–258
(2004).64. Hackett, J.L. and Gutman, S.I., Introduction to the food and drug administration (FDA) regu-
latory process. J. Proteome Nat., 4, 1110–1113 (2005).65. Pritzker, K.P., Cancer biomarkers: easier said than done. Clin. Chem., 48, 1147–1150 (2002).66. Diamandis, E.P., Proteomic patterns in serum and identification of ovarian cancer. Lancet,
360, 170 (2002).67. Diamandis, E.P., Point: proteomic patterns in biological fluids: do they represent the future of
cancer diagnostics? Clin. Chem., 49, 1272–1275 (2003).

Applications of mass spectrometry in oncology 401
68. Petricoin, E.F. and Liotta, L.A., Counterpoint: the vision for a new diagnostic paradigm. Clin.Chem., 49, 1276–1278 (2003).
69. Alexe, G., Alexe, S., Liotta, L.A., Petricoin, E.F., Reiss, M. and Hammer, P.L., Ovarian can-cer detection by logical analysis of proteomic data. Proteomics, 4, 766–783 (2004).
70. Zhang, Z., Bast, Jr., R.C., Yu, Y., Li, J., Sokoll, L.J., Rai, A.J., Rosenzweig, J.M., Cameron, B.,Wang, Y.Y., Meng, X.Y., Berchuck, A., Van Haaften-Day, C., Hacker, N.F., de Bruijn, H.W.,van der Zee, A.G., Jacobs, I.J., Fung, E.T. and Chan, D.W., Three biomarkers identifiedfrom serum proteomic analysis for the detection of early stage ovarian cancer. Cancer Res.,64, 5882–5890 (2004).
71. Fung, E.T., Yip, T.T., Lomas, L., Wang, Z., Yip, C., Meng, X.Y., Lin, S., Zhang, F., Zhang, Z.,Chan, D.W. and Weinberger, S.R., Classification of cancer types by measuring variants of hostresponse proteins using SELDI serum assays. Int. J. Cancer, 115, 783–789 (2005).
72. Conrads, T.P., Fusaro, V.A., Ross, S., Johann, D., Rajapakse, V., Hitt, B.A., Steinberg, S.M.,Kohn, E.C., Fishman, D.A., Whitely, G., Barrett, J.C., Liotta, L.A., Petricoin, E.F., III andVeenstra, T.D., High-resolution serum proteomic features for ovarian cancer detection.Endocr. Relat. Cancer, 11, 163–178 (2004).
73. Yang, E.C., Guo, J., Diehl, G., DeSouza, L., Rodrigues, M.J., Romaschin, A.D., Colgan, T.J.,Siu, K.W., Protein expression profiling of endometrial malignancies reveals a new tumormarker: chaperonin 10. J. Proteome Res., 3, 636–643 (2004).
74. Zhu, L.R., Zhang, W.Y., Yu, L., Zheng, Y.H., Zhang, J.Z. and Liao, Q.P., Serum proteomic fea-tures for detection of endometrial cancer. Int. J. Gynecol. Cancer, 16, 1374–1378 (2006).
75. Bertucci, F., Birnbaum, D. and Goncalves, A., Proteomics of breast cancer: principles andpotential clinical applications. Mol. Cell Proteomic., 5, 1772–1786 (2006).
76. Liotta, L. and Petricoin, E.F., Molecular profiling of human cancer. Nat. Rev. Genet., 1, 48–56(2000).
77. Hu, Y., SELDI–TOF–MS: the proteomics and bioinformatics approaches in the diagnosis ofbreast cancer. Breast, 14, 250–255 (2005).
78. Dua, R.S., Isacke, C.M. and Gui, G.P., The intraductal approach to breast cancer biomarkerdiscovery. J. Clin. Oncol., 24, 1209–1216 (2006).
79. Sauter, E.R., Shan, S., Hewett, J.E., Speckman, P., and Du Bois, G.C., Proteomic analysis ofnipple aspirate fluid using SELDI–TOF–MS. Int. J. Cancer, 114, 791–796 (2005).
80. Pawlik, T.M., Fritsche, H., Coombes, K.R., Xiao, L., Krishnamurthy, S., Hunt, K.K., Pusztai, L.,Chen, J.N., Clarke, C.H., Arun, B., Hung, M.C., and Kuerer, H.M., Significant differences in nip-ple aspirate fluid protein expression between healthy women and those with breast cancer demon-strated by time-of-flight mass spectrometry. Breast Cancer Res. Treat., 89, 149–157 (2005).
81. Coombes, K.R., Fritsche, H.A., Clarke, C., Chen, J., Baggerly, K.A., Morris, J.S., Xiao, L.,Hung, M. and Kuerer, H.M., Quality control and peak finding for proteomics data collectedfrom nipple aspirate fluid by surface-enhanced laser desorption and ionization. Clin. Chem.,49, 1615–1623 (2003).
82. Nakagawa, T., Huang, S.K., Martinez, S.R., Tran, A.N., Elashoff, D., Ye, X., Turner, R.R.,Giuliano, A.E. and Hoon, D.S., Proteomic profiling of primary breast cancer predicts axillarylymph node metastasis. Cancer Res., 66, 11825–11830 (2006).
83. Wright, G.L., Cazares, L.H., Leung, S.-M., Nasim, S.,Adam, B.-L., Yip, T.-T., Schellhammer, P.F.,Gong, L. and Vlahou, A., Proteinchip surface enhanced laser desorption/ionization (SELDI)mass spectrometry: a novel biochip technology for detection of prostate cancer biomarkers incomplex protein mixtures. Prostate Cancer Prostatic Dis., 2, 264–276 (1999).
84. Hessels, D., Verhaegh, G.W., Schalken, J.A. and Witjes, J.A., Applicability of biomarkers inthe early diagnosis of prostate cancer. Exp. Rev. Mol. Diagn., 4, 513–526 (2004).
85. Diamandis, E.P., Re: diagnostic potential of serum proteomic patterns in prostate cancer.J. Urol., 171, 1244–1245 (2004).

402 J. Roboz
86. Wagner, M., Naik, D.N., Pothen, A., Kasukurti, S., Devineni, R.R., Adam, B.L.,Semmes, O.J. and Wright, Jr., G.L., Computational protein biomarker prediction: a case studyfor prostate cancer. BMC Bioinformatics, 5 (26) (2004).
87. Petricoin, E.F., Ornstein, K., Paweletz, C.P., Ardekani, A., Hackett, P.S., Hitt, B.A., Velassco, A.,Trucco, C., Wiegand, L., Wood, K., Simone, C.B., Levine, P.J., Lienhan, W.M., Emmert-Buck, M.R., Steinberg, S.M., Kohn, E.C. and Liotta, L.A., Serum proteomic patterns for de-tection of prostate cancer. J. Natl. Cancer Inst., 95, 489–490 (2003).
88. Tong, W., Xie, Q., Hong, H., Shi, L., Fang, H., Perkins, R. and Petricoin, E.F., Using decisionforest to classify prostate cancer samples on the basis of SELDI–TOF MS data: assessingchance correlation and prediction confidence. Environ. Health Perspect., 112, 1622–1627(2004).
89. Semmes, O.J., Feng, Z., Adam, B.L., Banez, L.L., Bigbee, W.L., Campos, D., Cazares, L.H.,Chan, D.W., Grizzle, W.E., Izbicka, E., Kagan, J., Malik, G., McLerran, D., Moul, J.W., Partin, A.,Prasanna, P., Rosenzweig, J., Sokoll, L.J., Srivastava, S., Srivastava, S., Thompson, I., Welsh, M.J.,White, N., Winget, M., Yasui, Y., Zhang, Z. and Zhu, L., Evaluation of serum protein profil-ing by surface-enhanced laser desorption/ionization time-of-flight mass spectrometry forthe detection of prostate cancer: I. Assessment of platform reproducibility. Clin. Chem., 51,102–112 (2005).
90. Lehrer, S., Roboz, J., Ding, H., Zhao, S., Diamond, E.J., Holland, J.F., Stone, N.N., Droller, M.J.and Stock, R.G., Putative protein markers in the sera of men with prostatic neoplasms.Br. J. Urol. Int., 92, 223–225 (2003).
91. Hlavaty, J.J., Partin, A.W., Shue, M.J., Mangold, L.A., Derby, J., Javier, T., Kelley, S., Stieg, A.,Briggman, J.V., Hass, G.M. and Wu, Y., Identification and preliminary clinical evaluation ofa 50.8-kDa serum marker for prostate cancer. Urology, 61, 1261–1265 (2003).
92. Okusaka, T., Yamada, T. and Maekawa, M., Serum tumor markers for pancreatic cancer: thedawn of new era? JOP, 7, 332–336 (2006).
93. Garcea, G., Neal, C.P., Pattenden, C.J., Steward, W.P. and Berry, D.P., Molecular prognosticmarkers in pancreatic cancer: a systematic review. Eur. J. Cancer, 41, 2213–2236 (2005).
94. Sasaki, K., Sato, K., Akiyama, Y., Yanagihara, K., Masaaki, O. and Yamauchi, K., Peptidomics-based approach reveals the secretion of the 29-residue COOH-terminal fragment of the puta-tive tumor suppressor protein DMBT1 from pancreatic adenocarcinoma cell lines. CancerRes., 62, 4894–4898 (2002).
95. Rosty, C., Christa, L., Kuzdzal, S., Baldwin, W.M., Zahurak, M.L., Carnot, F., Chan, D.W.,Canto, M., Lillemoe, K.D., Cameron, J.L., Yeo, C.J., Hruban, R.H. and Goggins, M.,Identification of hepatocarcinoma–intestine–pancreas/pancreatitis-associated protein I as abiomarker for pancreatic ductal adenocarcinoma by protein biochip technology. Cancer Res.,62, 1868–1875 (2002).
96. Honda, K., Hayashida, Y., Umaki, T., Okusaka, T., Kosuge, T., Kikuchi, S., Endo, M.,Tsuchida, A., Aoki, T., Itoi, T., Moriyasu, F., Hirohashi, S. and Yamada, T., Possible detectionof pancreatic cancer by plasma protein profiling. Cancer Res., 65, 10613–10622 (2005).
97. Vlahou, A., Schellhammer, P.F., Mendrinos, S., Patel, K., Kondylis, F.I., Gong, L., Nasim, S. and Wright, G.L.J., Development of a novel proteomic approach for the detectionof transitional cell carcinoma of the bladder in urine. Am. J. Pathol., 158, 1491–1502 (2001).
98. Zhang, Y.F., Wu, D.L., Guan, M., Liu, W.W., Wu, Z., Chen, Y.M., Zhang, W.Z. and Lu, Y.,Tree analysis of mass spectral urine profiles discriminates transitional cell carcinoma of thebladder from noncancer patient. Clin. Biochem., 37, 772–779 (2004).
99. Liu, W., Guan, M., Wu, D., Zhang, Y., Wu, Z., Xu, M. and Lu, Y., Using tree analysis patternand SELDI–TOF–MS to discriminate transitional cell carcinoma of the bladder cancer fromnoncancer patients. Eur. Urol., 47, 456–462 (2005).

Applications of mass spectrometry in oncology 403
100. Schaub, S., Wilkins, J., Weiler, T., Sangster, K., Rush, D. and Nickerson, P., Urine protein pro-filing with surface-enhanced laser-desorption/ionization time-of-flight mass spectrometry.Kidney Int., 65, 323–332 (2004).
101. Wu, W., Tang, X., Hu, W., Lotan, R., Hong, W.K. and Mao, L., Identification and validationof metastasis-associated proteins in head and neck cancer cell lines by two-dimensional ele-ctrophoresis and mass spectrometry. Clin. Exp. Metastasis, 19, 319–326 (2002).
102. Wadsworth, J.T., Somers, K.D., Stack, B.C.J., Cazares, L., Malik, G., Adam, B.L., Wright, G.L.and Semmes, O.J., Identification of patients with head and neck cancer using serum proteinprofiles. Arch. Otolaryngol. Head Neck Surg., 130, 98–104 (2004).
103. Dolios, G., Roboz, J. and Wang, R., Identification of Colon Cancer associating Protein inPlasma using MALDI–TOF Mass Spectrometry. 51st Annual Conference on MassSpectrometry, Montereal, Quebec, Canada, 2003.
104. Liu, X.P., Shen, J., Li, Z.F., Yan, L. and Gu, J., A serum proteomic pattern for the detection ofcolorectal adenocarcinoma using surface enhanced laser desorption and ionization mass spec-trometry. Cancer Invest., 24, 747–753 (2006).
105. Su, Y., Shen, J., Qian, H., Ma, H., Ji, J., Ma, H., Ma, L., Zhang, W., Meng, L., Li, Z., Wu, J.,Jin, G., Zhang, J. and Shou, C., Diagnosis of gastric cancer using decision tree classificationof mass spectral data. Cancer Sci., 98, 37–43 (2006).
106. Zhukov, T.A., Johanson, R.A., Cantor, A.B., Clark, R.A. and Tockman, M.S., Discovery of dis-tinct protein profiles specific for lung tumors and premalignant lung lesions by SELDI massspectrometry. Lung Cancer, 40, 267–279 (2003).
107. Ferrari, L., Seraglia, R., Rossi, C.R., Bertazzo, A., Lise, M., Allegri, G. and Traldi, P., Proteinprofiles in sera of patients with malignant cutaneous melanoma. Rapid Commun. MassSpectrom., 14, 1149–1154 (2000).
108. Wilson, L.L., Tran, L., Morton, D.L. and Hoon, D.S., Detection of differentially expressedproteins in early-stage melanoma patients using SELDI–TOF mass spectrometry. Ann. N. Y.Acad. Sci., 1022, 317–322 (2004).
109. Poon, T.C.W., Yip, T., Chan, A.T.C., Yip, C., Yip, V., Mok, T.S.K., Lee, C.C.Y., Leung, T.W.T.,Ho, S.K.W. and Johnson, P.J., Comprehensive proteomic profiling identifies serum proteomicsignatures for detection of hepatocellular carcinoma and its subtypes. Clin. Chem., 49,752–760 (2003).
110. Leak, L.V., Liotta, L.A., Krutzsch, H., Jones, M., Fusaroa, V.A., Ross, S.J., Zhao, Y. andPetricoin, E.F.3., Proteomic analysis of lymph. Proteomics, 4, 753–765 (2004).
111. Langlois, R.G., Trebes, J.E., Dalmasso, E.A., Ying, Y., Davies, R.W., Curzi, M.P., Colston,B.W., Turteltaub, K.W., Perkins, J., Chromy, B.A., Choi, M.W., Murphy, G.A., Fitch, J.P. andMcCutchen-Maloney, S.L., Serum protein profile alterations in hemodialysis patients. Am. J.Nephrol., 24, 268–274 (2004).
112. Miguet, L., Bogumil, R., Decloquement, P. et al., Discovery and identification of potential bio-markers in a prospective study of chronic lymphoid malignancies using SELDI–TOF–MS. J. Proteome Res., 5, 2258–2269 (2006).
113. Rees-Unwin, K.S., Morgan, G.J. and Davies, F.E., Proteomics and the haematologist. Clin.Lab. Haematol., 26, 77–86 (2004).
114. Albitar, M., Potts, S.J., Giles, F.J., O’Brien, S., Keating, M., Thomas, D., Clarke, C., Jilani, I.,Aguilar, C., Estey, E. and Kantarjian, H., Proteomic-based prediction of clinical behavior inadult acute lymphoblastic leukemia. Cancer, 106, 1587–1594 (2006).
115. Kern, C., Cornuel, J.F., Billard, C., Tang, R., Rouillard, D., Stenou, V., Defrance, T., Ajchembaum-Cymbalista, F., Simonin, P.Y., Feldblum, S. and Kolb, J.P., Involvement of BAFF and APRIL inthe resistance to apoptosis of B-CLL through an autocrine pathway. Blood, 103, 679–688 (2004).
116. Tolson, J., Bogumil, R., Brunst, E., Beck, H., Elsner, R., Humeny, A., Kratzin, H., Deeg, M.,Kuczyk, M., Mueller, G.A., Mueller, C.A. and Flad, T., Serum protein profiling by SELDI
404 J. Roboz
mass spectrometry: detection of multiple variants of serum amyloid alpha in renal cancer pa-tients. Lab. Invest., 84, 845–856 (2004).
117. Hayman, M.W. and Przyborski, S.A., Proteomic identification of biomarkers expressed byhuman pluripotent stem cells. Biochem. Biophys. Res. Commun., 316, 918–923 (2004).
118. Combaret, V., Bergeron, C., Brejon, S., Iacono, I., Perol, D., Negrier, S. and Puisieux, A.,Protein chip array profiling analysis of sera from neuroblastoma patients. Cancer Lett., 228,91–96 (2005).
119. Schwartz, S.A., Weil, R.J., Johnson, M.D., Toms, S.A. and Caprioli, R.M., Protein profiling inbrain tumors using mass spectrometry: feasibility of a new technique for the analysis of pro-tein expression. Clin. Cancer Res., 10, 981–987 (2004).
120. Liu, J., Zheng, S., Yu, J.K., Zhang, J.M. and Chen, Z., Serum protein fingerprinting coupledwith artificial neural network distinguishes glioma from healthy population or brain benigntumor. J. Zhejiang Univ. Sci. B, 6, 4–10 (2005).
121. Shiwa, M., Nishimura, Y., Wakatabe, R., Fukawa, A., Arikuni, H., Ota, H., Kato, Y. andYamori, T., Rapid discovery and identification of a tissue-specific tumor biomarker from 39human cancer cell lines using the SELDI proteinchip platform. Biochem. Biophys. Res.Commun., 309, 18–25 (2003).
122. Nishizuka, S., Charboneau, L., Young, L., Major, S., Reinhold, W.C., Waltham, M., Kouros-Mehr, H., Bussey, K.J., Lee, J.K., Espina, V., Munson, P.J., Petricoin, E.F.3., Liotta, L.A. andWeinstein, J.N., Proteomic profiling of the NCI-60 cancer cell lines using new high-density re-verse-phase lysate microarrays. Proc. Natl. Acad. Sci. U.S.A., 100, 14229–14234 (2003).
123. Fetsch, P.A., Simone, N.L., Bryand-Greenwood, P.K., Marincola, F.M., Filie, A.C., Petricoin,E.F., Liotta, L.A. and Abati, A., Proteomics evaluation of archival cytologic material usingSELDI affinity mass spectrometry. Am. J. Clin. Pathol., 118, 870–876 (2002).
124. Somiari, R.I., Somiari, S., Russell, S. and Shriver, C.D., Proteomics of breast carcinoma. J.Chromatogr. B Anal. Technol. Biomed. Life Sci., 815, 215–225 (2005).
125. Journet, A. and Ferro, M., The potentials of MS-based subproteomic approaches in medicalscience: the case of lysosomes and breast cancer. Mass Spectrom. Rev., 23, 393–442 (2004).
126. Misell, L.M., Hwang, E.S., Au, A., Esserman, L. and Hellerstein, M.K., Development of anovel method for measuring in vivo breast epithelial cell proliferation in humans. BreastCancer Res. Treat., 89, 257–264 (2005).
127. Xiang, R., Shi, Y., Dillon, D.A., Negin, B., Horvath, C. and Wilkins, J.A., 2D LC/MS analy-sis of membrane proteins from breast cancer cell lines MCF7 and BT474. J. Proteome Res., 3,1278–1283 (2004).
128. Seike, M., Kondo, T., Fujii, K., Okano, T., Yamada, T., Matsuno, Y., Gemma, A., Kudoh, S.and Hirohashi, S., Proteomic signatures for histological types of lung cancer. Proteomics, 5,2939–2948 (2005).
129. Li, C., Xiao, Z., Chen, Z., Zhang, X., Li, J., Wu, X., Li, X., Yi, H., Li, M., Zhu, G. and Liang, S.,Proteome analysis of human lung squamous carcinoma. Proteomics, 6, 547–558 (2006).
130. Bard, M.P., Hegmans, J.P., Hemmes, A., Luider, T.M., Willemsen, R., Severijnen, L.A., vanMeerbeeck, J.P., Burgers, S.A., Hoogsteden, H.C. and Lambrecht, B.N., Proteomic analysis ofexosomes isolated from human malignant pleural effusions. Am. J. Respir. Cell Mol. Biol., 31,114–121 (2004).
131. Hegmans, J.P., Bard, M.P., Hemmes, A., Luider, T.M., Kleijmeer, M.J., Prins, J.B., Zitvogel, L.,Burgers, S.A., Hoogsteden, H.C. and Lambrecht, B.N., Proteomic analysis of exosomes se-creted by human mesothelioma cells. Am. J. Pathol., 164, 1807–1815 (2004).
132. Tyan, Y.C., Proteomic profiling of human pleural effusion using two-dimensional nano liquidchromatography tandem mass spectrometry. J. Proteome Res., 4, 1274–1286 (2005).
133. He, Q.Y., Cheung, Y.H., Leung, S.Y., Yuen, S.T., Chu, K.M. and Chiu, J.F., Diverse proteomicalterations in gastric adenocarcinoma. Proteomics, 4, 3276–3287 (2004).

Applications of mass spectrometry in oncology 405
134. Xiao, Z., Serum proteomic profiles suggest celecoxib-modulated targets and response predic-tors. Cancer Res., 64, 2904–2909 (2005).
135. Memon, A.A., Sorensen, B.S., Meldgaard, P., Fokdal, L., Thykjaer, T. and Nexo, E., Down-regulation of S100C is associated with bladder cancer progression and poor survival. Clin.Cancer Res., 11, 606–611 (2005).
136. Memon, A.A., Chang, J.W., Oh, B.R. and Yoo, Y.J., Identification of differentially expressedproteins during human urinary bladder cancer progression. Cancer Detect. Prev., 29, 249–255(2005).
137. Yanagisawa, K., Shyr, Y., Xu, B.J., Massion, P.P., Larsen, P.H., White, B.C., Roberts, J.R.,Edgerton, M., Gonzalez, A., Nadaf, S., Moore, J.H., Caprioli, R.M. and Carbone, D.P.,Proteomic patterns of tumour subsets in non-small-cell lung cancer. Lancet, 362, 433–439(2003).
138. Yan, F., He, M., Hogan, J.M., Rossie, S.S. and McLuckey, S.A., Targeted biomarker detectionvia whole protein ion trap tandem mass spectrometry: thymosin beta(4) in a human lung can-cer cell line. J. Mass Spectrom., 40, 444–451 (2005).
139. Reynolds, C.P., Ceramide synthesis and metabolism as a target for cancer therapy. CancerLett., 206, 169–180 (2004).
140. Ogretmen, B., Biologically active sphingolipids in cancer pathogenesis and treatment. Nat.Rev. Cancer, 4, 604–616 (2005).
141. Merrill Jr., A.H., Sullards, M.C., Allegood, J.C., Kelly, S. and Wang, E., Sphingolipidomics:high-throughput, structure-specific, and quantitative analysis of sphingolipids by liquid chro-matography tandem mass spectrometry. Methods, 36, 207–224 (2005).
142. Barbieri, A., Sabatini, L., Accorsi, A., Roda, A. and Violante, F.S., Simultaneous determina-tion of t,t-muconic, S-phenylmercapturic and S-benzylmercapturic acids in urine by a rapidand sensitive liquid chromatography/electrospray tandem mass spectrometry method. RapidCommun. Mass Spectrom., 18, 1983–1988 (2004).
143. Appels, N.M., Quantitative analysis of the farnesyl transferase inhibitor lonafarnib (Sarasar,SCH66336) in human plasma using high-performance liquid chromatography coupled withtandem mass spectrometry. Rapid Commun. Mass Spectrom., 19, 2187–2192 (2005).
144. Crowe, S.E., Helicobacter infection, chronic inflammation, and the development of malig-nancy. Curr. Opin. Gastroenterol., 21, 32–38 (2005).
145. Fendrick, A.M., Chernew, M.E., Hirth, R.A., Bloom, B.S., Bandekar, R.R. and Scheiman, J.M.,Clinical and economic effects of population-based Helicobacter pylori screening to preventgastric cancer. Arch. Intern. Med., 159, 142–148 (1999).
146. Lotterer, E., Ludtke, F.E., Tegeler, R., Lepsien, G. and Bauer, F.E., The 13C-urea breath test—detection of Helicobacter pylori infection in patients with partial gastrectomy. Z.Gastroenterol., 31, 115–119 (1993).
147. Cutler, A.F. and Toskes, P., Comparison of 13C-urea blood test to 13C-urea breath test for thediagnosis of Helicobacter pylori. Am. J. Gastroenterol., 94, 959–961 (1999).
148. Chey, W.D., Murthy, U., Toskes, P., Carpenter, S. and Laine, L., The 13C-urea blood testaccurately detects active Helicobacter pylori infection: a United States, multicenter trial. Am.J. Gastroenterol., 94, 1522–1524 (1999).
149. Lee, H.S., Gwee, K.A., Teng, L.Y., Kang, J.Y., Yeoh, K.G., Wee, A. and Chua, B.C., Validationof 13C-urea breath test for Helicobacter pylori using a simple gas chromatograph-mass selec-tive detector. Eur. J. Gastroenterol. Hepatol., 10, 569–572 (1998).
150. Nilsson, C.L., Fingerprinting of Helicobacter pylori strains by matrix-assisted laser desorption/ionization mass spectrometric analysis. Rapid Commun. Mass Spectrom., 13, 1067–1071 (1999).
151. Winkler, M.A., Uher, J. and Cepa, S., Direct analysis and identification of Helicobacter andCampylobacter species by MALDI–TOF mass spectrometry. Anal. Chem., 71, 3416–3419(1999).

406 J. Roboz
152. McAtee, C.P., Fry, K.E. and Berg, D.E., Identification of potential diagnostic and vaccine can-didates of Helicobacter pylori by “proteome” technologies. Helicobacter, 3, 163–169 (1998).
153. Krah, A., Schmidt, F., Becher, D., Schmid, M., Albrecht, D., Rack, A., Buttner, K. andJungblut, P.R., Analysis of automatically generated peptide mass fingerprints of cellularproteins and antigens from Helicobacter pylori 26695 separated by two-dimensionalelectrophoresis. Mol. Cell Proteomic., 2, 1271–1283 (2003).
154. Backert, S., Kwok, T., Schmid, M., Selbach, M., Moese, S., Peek, Jr., R.M., Konig, W., Meyer, T.F.and Jungblut, P.R., Subproteomes of soluble and structure-bound Helicobacter pylori proteinsanalyzed by two-dimensional gel electrophoresis and mass spectrometry. Proteomics, 5,1331–1345 (2005).
155. Sharma, R.A. and Farmer, P.B., Biological relevance of adduct detection to the chemopreven-tion of cancer. Clin. Cancer Res., 10, 4901–4912 (2004).
156. Rayman, M.P., The importance of selenium to human health. Lancet, 356, 233–241 (2001).157. Alaejos, M.S., Diaz Romero, F.J. and Diaz, R.C., Selenium and cancer: some nutritional
aspects. Nutrition, 16, 376–383 (2001).158. Last, K.W., Cornelius, V., Delves, T., Sieniawska, C., Fitzgibbon, J., Norton, A., Amess, J.,
Wilson, A., Rohatiner, A.Z. and Lister, T.A., Presentation serum selenium predicts for overallsurvival, dose delivery, and first treatment response in aggressive non-Hodgkin’s lymphoma.J. Clin. Oncol., 21, 2335–2341 (2003).
159. Lipsky, K., Zigeuner, R., Zischka, M., Schips, L., Pummer, K., Rehak, P. and Hubmer, G.,Selenium levels of patients with newly diagnosed prostate cancer compared with controlgroup. Urology, 63, 912–916 (2004).
160. Chen, G., Wang, H., Miller, C.T., Thomas, D.G., Gharib, T.G., Misek, D.E., Giordano, T.J.,Orringer, M.B. Hanash, S.M. and Beer, D.G., Reduced selenium-binding protein 1 expressionis associated with poor outcome in lung adenocarcinomas. J. Pathol., 202, 321–329 (2004).
161. Magnuson, M.L., Creed, J.T. and Brockhoff, C.A., Speciation of selenium and arsenic com-pounds by capillary electrophoresis with hydrodynamically modified electroosmotic flow andon-line reduction of selenium(VI) to selenium(IV) with hydride generation inductively cou-pled plasma mass spectrometric detection. Analyst, 122, 1057–1061 (1997).
162. Ip, C., Birringer, M., Block, E., Kotrebai, M., Tyson, J.F., Uden, P.C. and Lisk, D.J., Chemicalspeciation influences comparative activity of selenium-enriched garlic and yeast in mammarycancer prevention. J. Agric. Food Chem., 48, 2062–2070 (2001).
163. Infante, H.G., Hearn, R. and Catterick, T., Current mass spectrometry strategies for seleniumspeciation in dietary sources of high-selenium. Anal. Bioanal. Chem., 382, 957–967 (2005).

Medical Applications of Mass SpectrometryK. Vékey, A. Telekes and A. Vertes (editors)© 2008 Elsevier B.V. All rights reserved
407
Chapter 18
Application of mass spectrometry in brain research: neurotransmitters,neuropeptides, and brain proteins
LASZLO PROKAI*
Department of Molecular Biology & Immunology, University of North Texas Health ScienceCenter, Fort Worth, TX 76107, USA
1. Introduction 4072. Methodology 408
2.1. Neurotransmitters 4082.2. Neuropeptides 4092.3. Brain proteins (neuroproteomics) 411
3. Discussion 4173.1. Neurotransmitters 4173.2. Neuropeptides 4173.3. Neuroproteomics 419
4. Future trends 4205. Conclusions 421Acknowledgments 421References 421
1. Introduction
The anatomical and cellular complexity of the mammalian central nervous system(CNS) with its vast number of synapses and associated intricate biochemicalprocesses often presents technical challenges to the application of mass spectro-metry. The neurotransmitter acetylcholine, for example, is rapidly inactivated by the
*Tel.: �1 (817) 735-2206; Fax: �1 (817) 735-2118. E-mail: [email protected] (L. Prokai).

408 L. Prokai
enzyme acetylcholinesterase, and therefore an appropriate sampling method is nec-essary to determine its brain concentration in different neurophysiologic states orupon different treatments. Neuropeptides that fulfill many important functions inthe CNS also present obstacles to their exploration by mass spectrometry becauseof their low tissue levels, limited biostability, and degradation background frombrain proteins, when their detection is pursued. Potential solutions briefly discussedhere range from sophisticated in vivo sampling techniques such as microdialysis tomicrowave tissue irradiation to inhibit or minimize postmortem enzymatic degra-dation for the practice of neuropeptidomics. An additional subject discussed in thischapter is mass spectrometry-based neuroproteomics. Critical issues that requireattention to realize the enormous potential of neuroproteomics include appropriatetissue preparation methods to focus on a relevant subproteome, combination withseparation techniques to simplify complex mixtures and enrich desired brain pro-teins or peptides obtained through their proteolytic degradation, and developmentof methods that allow for quantification. Expression profiling of synaptic plasma-membrane proteins and potential exploitation of a quantitative proteomics approachto study neurodegenerative conditions are discussed as representative examples toshow the power of mass spectrometry-based methods in this field.
Although the brain is considered to be a single organ, its internal structure andorganization is extraordinarily complex. The human (mammalian) brain containsabout 1011 neurons, each neuron contains an axon (a long process leading from thecell body to another cell to propagate the action potential, an electrical activitycommon to all neurons), and most axons make functional connections with otherneurons at junctions called synapses [1]. Synapses are means of interneuronal com-munication by making direct electrical contacts and, through converting actionpotential to chemical signals, by the movement of molecules such as neurotrans-mitters between cells. Neurons are arranged in many groupings, called nuclei, relatedby function. In addition, there are large numbers of other cells called glia (astrocytes,oligodendrocytes, and microglia) in the brain. Anatomical, cellular, and biochemicalcomplexities of the CNS often present challenges for analytical methods to ade-quately reflect constituents and processes associated with its biochemistry, phys-iology, pathology, and pharmacotherapy. This chapter focuses on selected areas ofbrain research that exemplify these challenges, and discusses potential solutionsto address them with the power of mass spectrometry.
2. Methodology
2.1. Neurotransmitters
Many neurochemicals are stored usually in synaptic vesicles of the synapses.They may be released into the so-called synaptic clefts by an action potential [2].In the synaptic cleft, transmitter molecules diffuse across the extracellular space

Application of mass spectrometry in brain research 409
into the postsynaptic membrane to interact with their specific receptors to effectcellular changes that are specific for these receptors in the postsynaptic cell.Neurotransmitters may be small molecules such as amino acid transmitters, bio-genic amines, and acetylcholine, or they may also be various neuropeptides.
Small-molecule neurotransmitters are usually found in large concentration in thebrain, and numerous methods that do not utilize mass spectrometric detection have beendeveloped to analyze them [3–5]. Acetylcholine [ACh, (CH3)3N
�CH2CH2OCOCH3]has, however, presented a challenge. The extracellular concentration of ACh in themammalian brain is typically very low due to the rapid hydrolysis of ACh tocholine [(CH3)3N
�CH2CH2OH] by acetylcholinesterase. In addition, postmortemdegradation of ACh has been an additional issue in studies that relied on the re-moval of the brain of animals sacrificed for the determination of this neurotrans-mitter. Early in vivo experiments, such as those using push–pull cannulae [6], alsosuffered from degradation of ACh in the sample prior to its detection. The intro-duction of microdialysis as the least invasive way of monitoring transmitter releasein vivo [7] has provided a solution to this problem.
2.1.1. In vivo microdialysis
Microdialysis employs a semipermeable hollow-fiber membrane implanted in thetissue. It allows for the sampling of chemicals from the extracellular space of thebrain, when the implanted probe is perfused at low flow rates and usually with asolution mimicking the composition of the cerebrospinal fluid (CSF). Collectiontimes of about 5–30 min are typically used depending on the time resolutiondesired, concentration of the analyte, and detection limit of the assay. The schemeof a typical experimental setup to perform in vivo microdialysis from conscious,freely moving animals (usually rats) is shown in Fig. 1. Upon using membraneswith appropriately sized pores, microdialysis will exclude proteins from the sam-ple while allowing smaller molecules such as neurotransmitters to pass through.The protein-free samples are then analyzed. Although low limits of detection canbe achieved for most small-molecule neurotransmitters without the use of massspectrometry [8,9], determination of basal ACh levels in rat brain has often beena challenge for neurochemists. However, reversed-phase ion-pair liquid chro-matography (LC) coupled with positive-ion electrospray ionization (ESI) tandemmass spectrometry (MS�MS) has been shown to detect ACh with low limit of de-tection (1.4 fmol) and, thus, to measure this neurotransmitter and related endogenouscompounds in rat brain microdialysates [10]. Further improvements in assayperformance have been reported recently [11,12].
2.2. Neuropeptides
Numerous challenges have emerged when analyzing samples from brain tissue bychromatographic fractionation followed by ESI-MS/MS and matrix-assisted laserdesorption/ionization (MALDI) mass spectrometry [13]. The principal challenge

410 L. Prokai
has been the low levels of neuropeptides in the brain relative to the high levels ofpeptides that result from postmortem protein degradation. To block such proteindegradation, rats and mice can be sacrificed by focused microwave irradiation,which inactivates enzymes in the tissue within seconds and permits the detectionof numerous neuropeptides by mass spectrometry [14]. Because microwave devicescapable of focused irradiation are not widely available due to their high price,postmortem degradation of proteins can also be reduced very substantially bysacrificing the animals using the standard decapitation method followed by animmediate irradiation of the head in a conventional microwave oven [15].
Alternatively, in vivo microdialysis sampling similar to the method shown sche-matically in Fig. 1 and described in Section 2.1.1 can also be used for neuropeptidediscovery or screening. This technique essentially circumvents protein degradationassociated with the methods discussed in the previous section. Neuropeptidescollected by microdialysis can be preconcentrated and desalted by reversed-phaseLC [16], and subsequently supplied directly onto a micro- or nanoflow-LC columnfor gradient elution and ESI-MS as well as MS/MS analysis [17]. Microdialysisis suitable not only for an in vivo sampling of the extracellular space of the brainbut also to simultaneously introduce exogenous agents such as neuropeptidesinto the tissue (which is often called “retrodialysis”) to investigate the effect orfate of these agents in the brain. As an example, Fig. 2 demonstrates the com-bined use of in vivo microdialysis and LC/ESI-MS to study kyotorphin-inducedMet-enkephalin release in the brain [18]. Briefly, the animals were stereotaxicallyimplanted with guide cannulae that reached the globus pallidus of the brain—a sitewith high enkephalin-like immunoreactivity. After their recovery from surgery, amicrodialysis probe (CMA/12, CMA/Microdialysis, Acton, MA, USA) was in-serted into the guide cannula, and the dipeptide Tyr-Arg (kyotorphin) was deliveredby “retrodialysis” while microdialysates were collected simultaneously. (The term
Syringe pump
Fractioncollector(Refrigerated)
Fromsyringepump
Tofractioncollector
Microdialysisprobe
Semi-permeablemembrane
Fig. 1. System to collect microdialysates from the brain of experimental animals (rats).

Application of mass spectrometry in brain research 411
retrodialysis refers to the technique where an agent is dissolved in the perfusion fluidfor delivery into the tissue during a microdialysis experiment.) In the control exper-iment, the probe was only perfused with artificial CSF. The collected microdialysateswere analyzed by gradient reversed-phase capillary LC/ESI-MS (conditions givenin ref. [19]). On the basis of selected ion monitoring (SIM) chromatograms forprotonated Met-enkephalin, m/z 574, and external calibration with solutions ofknown concentration of the peptide, microdialysates collected from the animal thatreceived kyotorphin showed more than sevenfold increase in the concentration ofMet-enkephalin compared to that of the control animal.
2.3. Brain proteins (neuroproteomics)
Proteins of the mammalian brain are also of great interest to neuroscientists. Alarge number of proteins and their complex networks covering diverse biologicalfunctions can be studied via the emerging methods of neuroproteomics. Althoughmapping of all proteins and their intricate interplay in prototype unicellulareukaryotes are being pursued extensively by various techniques, analysis of proteinconstituents in organelles and specifically isolated subcellular fractions or proteincomplexes appears to be a viable (“subproteome”) approach that reduces com-plexity and allows for a meaningful application of the technique to brain research[21]. For example, Fig. 3 shows the scheme of a routine procedure to obtainsynaptosomes (isolated synapses) and synaptic plasma-membrane fraction by sub-cellular fractionation of brain tissue [22,23]. Methods to obtain synaptic junctionsand, with their further fractionation, presynaptic active zone and postsynaptic den-sity fractions from synaptosomes have been developed [24].
Nevertheless, large numbers of proteins are present in brain-derived samplesand they need to be separated for identification and quantification. The separation
Fig. 2. LC/ESI-MS analysis of the opioid peptide Met-enkephalin (Tyr-Gly-Gly-Phe-Met YGGFM;SIM, m/z 574) in microdialysates collected from the globus pallidus region of the rat brain after theperfusion of the probe (CMA/12) at 2 �L/min with artificial CSF (black trace/area) and with5 nmol/�L of kyotorphin (Tyr-Arg) in artificial CSF (gray trace/area).

412 L. Prokai
and visualization of complex protein mixtures are commonly performed by two-dimensional polyacrylamide gel electrophoresis (2D-PAGE). 2D-PAGE followedby in-gel protease (trypsin) digestion, MALDI/time-of-flight (TOF) mass spectrom-etry, and sequence database searching is the technique most frequently used intoday’s neuroproteomics studies [25,26]. Although sensitivity and robustness ofMALDI-TOF/MS generally allow for the rapid identification of proteins, imple-mentation of ESI is advantageous because ionization selectivity changes may beexploited for peptides present in a proteolytic digest sample [27]. Moreover,detection of a large proportion of the peptide ions can be accomplished by nanoflow-ESI in combination with online LC techniques when signal suppression wouldhave otherwise occurred in MALDI analysis of the peptide mixture. MS/MS usedin combination with LC/ESI-MS can also provide sequence tags that greatlyreduce the amount of information necessary for an unambiguous match to proteinswhen using protein database-searching tools. To overcome limitations of the 2D-PAGE (not applicable to hydrophobic proteins, proteins with extreme isoelectricpoint and low-abundance proteins), one-dimensional sodium dodecylsulfate(SDS)-PAGE may be employed. However, given the complexity of protein sam-ples usually subjected to neuroproteomics studies, comigration of multiple pro-teins may still result in complex peptide mixtures after the gel is cut and in-gelproteolytic digestions are performed to permit peptide-based protein identification.Therefore, the addition of reverse-phase LC, as a second dimension of separation,combined with online ESI-MS/MS analyses has become popular, when SDS-PAGE is employed. Fig. 4 shows the application of this gel-enhanced LC/MS/MS
Fig. 3. A scheme of a procedure to obtain synaptosomes [22] (isolated synapses) and synaptic plasmamembrane fraction [23] by subcellular fractionation of brain tissue via sucrose gradient.

Application of mass spectrometry in brain research 413
Fig. 4. Illustration of proteomic analysis of the rat synaptic plasma-membrane fraction by combinationof SDS-PAGE and gradient reversed-phase LC/ESI-MS/MS (GeLC/MS/MS) on a quadrupoleion-trap instrument [21]. (A) The developed gel is cut into bands and the bands are (i) destained,digested (trypsin), and the sample is desalted for injection into the column. (B) Base-peak chro-matogram obtained from the tryptic digest of the 98–120 kDa. Data-dependent acquisition isemployed, where in one acquisition cycle (ii) a full-scan mass spectrum is acquired (C), followedby (iii) CID-MS/MS of the most intense ion (m/z 915.5) in this mass spectrum (D). (However,MS/MS is not initiated, when ion intensity in the full-scan mass spectrum is below a presetthreshold.) Database search (iv) matches the MS/MS to the protein(s) (Table 1, major sequenceions of the peptide are indicated in chart D).
6 kDa
16 kDa22 kDa
36 kDa
50 kDa
64 kDa98 kDa
148 kDa250 kDa
100
(i)
(A) (B)
(C)
100
0500
300 500 700 900 1100 1300 1500 1700
600 700 800 900 1000m/z
m/z
100
0
(b4)327 (a5)
412(y5)545
(y6)674
(y7)773
(y8)875
(y9)1004 (y10)
1117
(y11)1175
(y13)1391
(iv)
(y12)1304 (y14)
1504
Tabl
e 1
(b16)1585
1100 1200 1300 1400
Rel
ativ
e ab
unda
nce
Rel
ativ
e ab
unda
nce
025
915.5
(iii)
D
(D)
50 75tR (min)
100
29.4
52.0
60.3
65.7
79.3
(ii)
CRel
ativ
e ab
unda
nce

414 L. Prokai
(GeLC/MS/MS) strategy to neuroproteomic analysis—using the synaptic plasma-membrane fraction isolated from rat forebrain according to the procedure in Fig. 3as an example [21]. The particular tryptic peptide (GVGIISEGNETVEDIAAR;amino acid residues abbreviated with one-letter codes) identified based on thepresented MS/MS (Fig. 4D) and the proteins (isoforms of the �-subunit ofNa��K�-transporting ATPase in the rat species Rattus norvegicus) matched to thisparticular sequence by database search are listed in Table 1. By conducting a data-base search based on the entire set of mass spectra and tandem mass spectrarecorded from the in-gel tryptic digest of the 98–120 kDa band in the SDS-PAGE(Fig. 4A–B), additional peptide sequences that belonged to these proteins werealso found (Table 2). Three out of the six peptides matched specifically to the�3-isoform of Na��K�-transporting ATPase.
Fractionation of the digested sample by strong cation-exchange chromatographyprior to reversed-phase LC/ESI-MS/MS analysis can also be employed, whichaffords 2D separation without the use of gel electrophoresis [21].AmultidimensionalLC technique that integrates strong cation-exchange resin and reversed-phase resinin a biphasic column for coupling with online ESI/MS/MS is also available andserves as the basis of an automated “shotgun” proteomics method called multidi-mensional protein identification technology (MudPIT) [28].
In quantitative neuroproteomics based on 2D-PAGE, intact proteins are separatedand the abundance of a protein is determined by measuring stain intensity of the
Table 1
Peptide identified from CID-MS/MS shown in Fig. 4D (major sequence-related ions of the peptideare indicated in the spectrum) by BioWorks (version 3.2, Thermo Fisher, San Jose, CA, USA) usingthe National Center for Biotechnology Information (NCBI) nonredundant (nr) protein database withrat (R. norvegicus) selected in the species option of the program
Peptidea Proteinb Mproteinc Peptide
positionsd
GVGIISEGNETVEDIAAR ATPase, Na��K� 113055 630–647transporting, �1
polypeptide (6978543)GVGIISEGNETVEDIAAR ATPase, Na��K� 112218 627–644
transporting, �2
polypeptide (6978545)GVGIISEGNETVEDIAAR Na��K� ATPase 111737 620–637
�3-subunit (6978547)
a Amino acid residues are abbreviated with one-letter codes.b NCBI accession number given in parentheses.c Molecular mass (Da).d Starting and end points in protein’s listed sequence (numbering from 1 to n in the amino- to
carboxy-terminal direction).

Application of mass spectrometry in brain research 415
protein spot on the gel [29]. The alternative LC–MS/MS-based approach often usesstable-isotope labeling techniques, e.g., long-term metabolic labeling of animalswith a diet enriched in heavy nitrogen (15N) [30], or labeling and fractionating theprotein sample with isotope-coded affinity tag (ICAT) methodology [31]. The lattertechniques afford relative quantification (see description of the ICAT and relatedmethods earlier in this book [32]). For example, ICAT-labeled tryptic peptides ofproteins present in the cerebral cortex synaptic plasma-membrane fraction ofmorphine-naïve and 7-day morphine-treated rats were successfully identified usingcapillary LC-ESI/MS/MS in conjunction with protein database searching [33]. Fig. 5shows a pair of ions at m/z 737.3 and 741.2 with a significant difference in ion in-tensities, when averaged over the 40- to 42-min retention-time window of the gra-dient reversed-phase LC separation. The � 4 Th difference indicated that they
Table 2
Tryptic peptides matched by BioWorks (version 3.2) to the Na��K�-transporting ATPase �-subunitin the 98–120 kDa SDS-PAGE band of the rat synaptic plasma-membrane fraction (BioWorksversion 3.2) after in-gel digestion and data-dependent LC/ESI-MS/MS
Peptide Precursor ion Pa Protein (NCBI(m/z) number)
VDNSSLTGESEPQTR [M�2H]2� (810.3) 1.14 10�4 ATPase, Na��K�
transporting, �b
EAFQNAYLELGGLGER [M�2H]2� (883.9) 3.21 10�7 Na��K�-transportingATPase �3-subunit(6978547)
QGAIVAVTGDGVNDSPALK [M�2H]2� (906.5) 2.16 10�9 ATPase, Na��K�
transporting, �b
GVGIISEGNETVEDIAAR [M�2H]2� (915.5) 4.11 10�8 ATPase, Na��K�
transporting, �b
YQLSIHETEDPNDNR [M�2H]2� (915.9) 1.19 10�7 Na��K�-transportingATPase �3-subunit(6978547)
IISAHGCKVDNSSLTGESEPQTR [M�3H]3� (810.4) 2.58 10�4 Na��K�-transportingATPase �3-subunit(6978547)
The NCBI nr protein database was used with R. norvegicus selected in the species option of theprogram.a Probability of an incorrect match (false positive).b Tryptic fragment shared by multiple isoforms of the protein.

416 L. Prokai
were doubly charged ([M�2H]2�) ions showing the attributes of a successfullabeling with the light (nondeuterated, d0) and heavy (octadeuterated, d8) affinitylabels. Upon profiling these molecular ions by selected-ion retrieval, the area underthe peaks showed a decrease of 43% in the abundance of the corresponding proteinin the cortical synaptic membrane of one animal that received chronic subcuta-neous morphine administration. Again, MS/MS product-ion spectra obtained
Fig. 5. ICAT-labeled tryptic peptides [m/z 737.3 and 741.2 (doubly charged positive ions)] fromsynaptic plasma-membrane fraction detected by gradient reversed-phase LC/ESI-MS and MS/MSdata-dependent acquisition in the retention-time range of 40–42 min. Following protein databasesearch, the sequence was determined to be LIIVEGC*QR, an ICAT-labeled tryptic peptide ofNa��K�-transporting ATPase �-subunit (asterisk indicates the ICAT label on cysteine, C). Thematched tryptic peptide of the protein is not isoform specific (refer to text in this chapter explain-ing results from experiments summarized in Fig. 4 and Tables 1 and 2). Upon calculation of the peakarea ratios (d8/d0) obtained from the selected ion chromatograms, this particular protein was foundto be present in 42% lower abundance in the rat subjected to chronic morphine exposure (d8 label),compared to its morphine-naïve control (d0 label). An additional ICAT pair [m/z 893.9 and 898.0(doubly charged positive ions)] in this retention-time range belongs to the tryptic peptideYQVDPDAC*FSAK of the voltage-dependent anion channel 1 (NCBI accession number 6755963),which did not show difference in protein abundance between the morphine-treated and morphine-naïve animals. (Reproduced with permission from: Prokai, L., Zharikova, A.D. and Stevens Jr., S.M.,J. Mass Spectrom., 40, 169–175 (2005). ©2005 Copyright John Wiley & Sons Limited.)

Application of mass spectrometry in brain research 417
through collision-induced dissociation (CID) and data-dependent acquisition methodin conjunction with LC/ESI-MS provided sequence tag for the positive proteinidentification. Tryptic fragment LIIVEGCQR (with the appropriate modificationby the biotin-carrying tag at Cys, C; amino acid residues were abbreviated with theone-letter symbols) matched unequivocally to the Na��K� ATPase �-subunit of therat. After performing the ICAT experiment in triplicate, the abundance of this inte-gral membrane protein was found to decrease by 39 2% after exposure of the ratto morphine for 7 days.
3. Discussion
3.1. Neurotransmitters
The measurement of neurotransmitters in brain tissue and extracellular fluid hasbeen used to develop diagnosis and effective treatment strategies for neuropsychi-atric and neurodegenerative diseases. For example, ACh is associated with learningand memory [34], and its involvement is well recognized in several dysfunc-tions of the brain such as Alzheimer’s disease [35], Parkinson’s disease [36], anddementia [37]. The measurement of ACh in the brain is important in animal mod-els of these conditions that either disrupt the production of ACh or stimulates theoverproduction of acetylcholinesterase, an enzyme that catalyzes the rapid hydrol-ysis of ACh to choline once it has performed its function. Because of this rapidhydrolysis, ACh levels become meaningless when the animal is killed and decapi-tated, and then the brain is removed for the extraction of the analyte. Therefore,in vivo microdialysis [7] has been the method of choice for obtaining samples toreflect the extracellular ACh concentrations in the brain. Because of the low phys-iological ACh levels, many investigators have had to use an appropriate enzymeinhibitor (e.g., neostigmine added to the perfusion medium of the probe) to limitdegradation of the neurotransmitter by acetylcholinesterase. ACh could then bedetermined from the collected microdialysates by, e.g., LC with electrochemicaldetection [38]. Esterase inhibitors may, however, affect physiology of the systemand, thus, may interfere with data interpretation [39]. The use of LC/ESI-MS/MSfurnishes low limits of detection and is therefore suitable for the measurement ofACh in rat brain microdialysates without the use of an acetylcholinesteraseinhibitor [10].
3.2. Neuropeptides
Peptides perform many important functions in the CNS as neurotransmitters, neuro-modulators, or neurohormones [40]. Neuropeptides are involved in a wide variety

418 L. Prokai
of systems including pain, memory, reproduction, reward mechanisms, food andwater intake, circadian rhythms, and many others. The extent of those systems thatare crucially affected by neuropeptides is vast and their interactions are oftenvery complex. Over 100 mammalian neuropeptides have been found and manyhave been postulated but remained to be isolated and identified. The etiology ofnumerous brain maladies involves neuropeptides through their hypo- or hyper-secretion, alterations in storage, release, catabolism, and modifications byposttranslational processing. For example, the release of dynorphin A may be asso-ciated with spontaneous pain according to a recent study in a mouse model forneuropathic cancer pain [41]. Beyond their role in CNS physiology, neuropeptidesare therefore considered key sources of drug discovery, diagnostics, and therapeu-tics. The construction of a neuropeptidome, a fact database for endogenousneuropeptides, has been proposed to aid these efforts [13]. However, low tissuelevels of neuropeptides, their limited biostability, and degradation background frombrain proteins are obstacles for the practice of neuropeptidomics. Therefore, appro-priate measures, such as the use of microwave irradiation that inactivates enzymesin the tissue within seconds, are required before one obtains neuropeptide fractionsfor mass spectrometric analysis [14,15]. Alternatively, microdialysis can be usedfor in vivo sampling of neuropeptides from the extracellular fluid of the brain,which removes the target analytes from the tissue and, thus, they escape enzymaticdegradation by neuropeptidases. In addition to the exploration of the neuropep-tidome, in vivo microdialysis combined with mass spectrometry can be used forprobing the effect of various compounds (conveniently introduced by retrodialysis)on the secretion of selected neuropeptides [18], to study neuropeptide metabolism[42,43], and for other related in vivo experiments involving neuropeptides [44] tohelp neuroscientists understand brain physiology or pathology and propose newmethods of medical diagnosis, prognosis, and treatment. For example, kyotorphinis a neuropeptide physiologically synthesized in the brain by a specific enzyme,kyotorphin synthetase [45], from L-Tyr, L-Arg, and ATP in the presence of Mg2�.In a clinical trial, administration of L-Arg solution has shown potential benefits fortreating various pain conditions due to the presumed kyotorphin synthesis in thebrain and spinal cord [46]. Kyotorphin produces opioid analgesia indirectly viathe release of Met-enkephalin—based on in vitro studies [47]. The use of excisedtissue and analytical techniques with poor molecular specificity may be of concernregarding the validity of findings in these experiments in vivo. Through thecombined use of brain microdialysis in a living animal and LC/ESI-MS as a high-specificity assay method, the study summarized in Fig. 2 has provided unequivocalevidence that kyotorphin functions as a Met-enkephalin releaser. This in vivo test-ing method should also be very valuable, e.g., during the development of novel,brain-targeted kyotorphin analogs [48] intended to overcome shortcomings of theendogenous neuropeptide as a drug candidate such as poor blood–brain barrierpenetration and inadequate biostability [49].

Application of mass spectrometry in brain research 419
3.3. Neuroproteomics
Exploration of the brain by the methods of proteomics has apparent advantages.Simply identifying the presence of proteins in key compartments within neuronsand glia will provide an essential framework for understanding their function [20].One of the distinct features of neuroproteomic analysis, which is not attainable withRNA expression data, is the ability to fractionate brain proteins into various sub-populations [29]. Nearly one-third of the proteome is believed to consist of integralmembrane proteins of biological membrane bilayers that compartmentalize livingcells and have been identified as important drug targets [50]. Because by far themost attention has been historically focused on the electrical properties of neuronsand their connections at synapses, focus on synaptic membrane-protein fractions(Fig. 3) is well justified. By using multidimensional proteomics approaches thatemploy complementary ionization and mass spectrometric methods in combinationwith orthogonal separation techniques, synaptic plasma-membrane proteins fromrat forebrain can be successfully identified [21]. Given the complexity of the sam-ple, the number of proteins identified is affected by the number of gel-based orchromatographic separation stages performed before mass spectrometric analysis.The advantages of SDS-PAGE as the first dimension of separation have been thatthe method is simple and widely used by neuroscientists, it can be applied to mem-brane proteins, and samples can be separated side-by-side and stained/destainedsimultaneously in order to increase the amount of low-abundance proteins availablefor subsequent analysis. Routine MALDI-TOF/MS is limited to less complexdigest mixtures due to ion suppression effects, and reliable protein identificationrequires the detection of several tryptic peptides from each protein with the moder-ate mass accuracy of the method (�20 ppm). However, the use of GeLC/MS/MShas allowed for unambiguous identification of tryptic peptides and correspondingproteins via fragment-ion tag database searching, as demonstrated in Fig. 4.
Proteomes of cells are dynamic and are directly affected by environmental factorssuch as stress, aging, diseases, and drug treatment. Many changes in synaptic activ-ity following physiological variations induced by such factors can be explained bydetermining protein-expression-level differences between control (“healthy”) andperturbed physiological states. Since protein expression analysis allows us to identifythose protein(s) actively involved, for example, in the progression of a particulardisease, strategies for molecular intervention can now be formulated with furtherknowledge of the biological pathways associated with the disease. Similarly, byemploying quantitative protein analysis methods, the effect(s) of existing drugs orpotential drug candidates can be thoroughly characterized and compared to allowfor a detailed interrogation of the mechanism of action. Conventional protein expre-ssion methods involving immunohistochemical techniques are generally limited toproteins specific to a particular antibody. Quantitation by 2D-PAGE is usually in-adequate for low-abundance and/or membrane proteins present in the sample of

420 L. Prokai
interest. Therefore, the method of choice in proteomics has been shifting to stable-isotope labeling or tagging followed by mass spectrometry, when accurate quan-tification is desired [51]. The value of these methods for neuroproteomics has beenparticularly well demonstrated by the study focusing on the effect of chronic morphineexposure on the proteins of the synaptic plasma-membrane fraction in rats, where theICAT strategy coupled with nanoflow reversed-phase LC/ESI-MS and MS/MS wasemployed [33]. Out of the 80 proteins covered simultaneously by the method in asingle assay without protein-specific antibodies, the expression of several importantsynaptic plasma-membrane proteins has been shown to change significantly as aresult of chronic morphine exposure in vivo. The underlying mechanisms and theirbiological significance are yet to be elucidated for the majority of such changesmeasured. However, the downregulation of Na��K� ATPase pumps (Fig. 5) can beimplicated in the neurobiology of opioid tolerance and dependence. These veryimportant synaptic membrane proteins maintain an ionic concentration difference(electric potential) across the membrane that allows for the propagation of electricalimpulses along nerve cells and across synaptic clefts between nerve cells [52]. Theirdownregulation causes a decrease in electrogenic Na��K� pumping, which wouldexplain the observed subsensitivity of neurons to opiates upon developing non-specific (heterologous) tolerance to these drugs [53]. Therefore, continued appli-cations of neuroproteomics are likely to contribute to a better understanding of themechanisms involved in maladies affecting the CNS such as morphine with-drawal, dependence, and tolerance. The results of the studies may also lead to thedevelopment of new strategies for the management of neurological diseases.
4. Future trends
Studies reported on the application of in vivo microdialysis and mass spectrometryto brain research have employed rats as experimental animals. Although LC/MS/MS methods provide adequate sensitivity, selectivity, and precision to allowfor measurements of small-molecule neurotransmitters in brain tissue and micro-dialysis samples, there is an increasing demand to minimize sample volume andimprove throughput and robustness. The driving force of this demand is in part theproliferation of genetically altered (mutant, overexpressed, and knockout) micemodels created to understand the CNS and model its diseases. Over the last severalyears, cerebral microdialysis has also become one of the new methods establishedin state-of-the-art brain monitoring upon neurointensive care [54]. Further refine-ment of sampling and assay technologies both at the preclinical level and inneurointensive medicine will provide enormous potential for revealing the role ofsmall-molecule neurotransmitters in normal and pathological processes [3].
Neuropeptidomics and neuroproteomics are in their infancy. Improved meth-ods to obtain neuropeptide-rich fractions from the brain for subsequent interro-gations by mass spectrometry are needed [55], along with the development of

Application of mass spectrometry in brain research 421
neuropeptide-directed analytical separation, mass spectrometric data acquisition,and processing methods. In the field of neuroproteomics, one of the disadvantagesof gel-based approaches has been that they are difficult to automate. Therefore,other multidimensional separation methods [28] are expected to gain increasedacceptance for the identification of membrane and/or important but low-abundanceproteins in complex samples from the mammalian brain. Information on the pres-ence of proteins in various subcellular fractions allows for the design of studiesprobing their specific functions in health and disease. Explorations of posttransla-tional modifications in the brain proteome, which was not covered in this chapter,have also been promising [56,57]. Quantitative proteomics studies are likely to con-tribute to a better understanding of diseases affecting the CNS. There are vast areasof translational investigations expected to reveal potential biomarkers for and cor-relate proteins with brain disorders [29], which may also lead to the developmentof new strategies to manage these conditions in humans.
5. Conclusions
This chapter covered selected applications of mass spectrometry and highlighted itspower to support diverse studies focused on the mammalian brain. Much remainsto be developed in methodology before mass spectrometry becomes a widelyaccepted and a routinely employed technique in the neurosciences and impacts thediagnosis, prognosis, and therapy of neurodegenerative/neuropsychiatric diseases.However, progress has been steady, which clearly warrants continued explorationand development of methods for these applications.
Acknowledgments
The author thanks Drs. Alevtina D. Zharikova, Stanley M. Stevens, Jr., and Ho-Seung Kim for contributing to the work described in this chapter, and Drs. JerryW. Simecka and Katalin Prokai-Tatrai for their helpful comments on the manu-script. The studies on neuropeptides benefited from the author’s collaboration withDrs. John Roboz and William J. Simonsick, Jr. The research presented here has beensupported by grants (MH59360, NS44765, AG025384 and RR12023) from theNational Institutes of Health (Bethesda, MD, USA) and the University of FloridaResearch Foundation. Laszlo Prokai is currently the Robert A. Welch Professor at theUniversity of North Texas Health Science Center.
References
1. Wild, G.C. and Benzel, E.C., Central nervous system cell types. In: Essentials ofNeurochemistry. Jones and Bartlett, Boston, 1994, pp. 3–15 (Chapter 1, ISBN: 0-86720-862-7).
2. Wild, G.C. and Benzel, E.C., The synapse. In: Essentials of Neurochemistry. Jones andBartlett, Boston, 1994, pp. 33–43 (Chapter 3, ISBN: 0-86720-862-7).

422 L. Prokai
3. Shah, A.J., Crespi, F. and Heidbreder, C., Amino acid neurotransmitters: separation approachesand diagnostic value. J. Chromatogr. B, 781, 151–163 (2002).
4. Cheng, F.C. and Kuo, J.S., High-performance liquid-chromatographic analysis with electro-chemical detection of biogenic-amines using microbore columns. J. Chromatogr. B, 665, 1–13(1995).
5. Powell, P.R. and Ewing, A.G., Recent advances in the application of capillary electrophoresisto neuroscience. Anal. Bioanal. Chem., 382, 581–591 (2005).
6. Bartholini, G., Stadler, H., Ciria, M.G. and Lloyd, K.G., Use of push-pull cannula to estimatedynamics of acetylcholine and catecholamines within various brain areas. Neuropharmacology,15, 515–519 (1976).
7. Ungerstedt, U., Herrera-Marschitz, M., Jungnelius, U., Ståhle, L., Tossman, U. andZetterström, T., Dopamine synaptic mechanisms reflected in studies combining behavioralrecordings and brain dialysis. Adv. Biosci., 37, 219–231 (1982).
8. Smolders, I., Sarre, S., Michotte, Y. and Ebinger, G., The analysis of excitatory, inhibitoryand other amino-acids in rat-brain microdialysates using microbore liquid-chromatography.J. Neurosci. Meth., 57, 47–53 (1995).
9. Parrot, S., Bert, L., Mouly-Badina, L., Sauvinet, V., Colussi-Mas, J., Lambas-Senas, L.,Robert, F., Bouilloux, J.P., Suaud-Chagny, M.F., Denoroy, L. and Renaud B., Microdialysismonitoring of catecholamines and excitatory amino acids in the rat and mouse brain: recentdevelopments based on capillary electrophoresis with laser-induced fluorescence detection—a mini-review. Mol. Cell. Neurobiol., 23, 793–804 (2003).
10. Zhu, J., Wong, P.S.H., Cregor, M., Gitzen, J.F., Coury, L.A. and Kissinger, P.T., In vivomicrodialysis and reverse phase ion pair liquid chromatography/tandem mass spectrometry forthe determination and identification of acetylcholine and related compounds in rat brain.Rapid Commun. Mass Spectrom., 14, 1695–1700 (2000).
11. Guo, Y., Analysis of quaternary amine compounds by hydrophilic interaction chromatography/mass spectrometry (HILIC/MS). J. Liq. Chromatogr. Rel. Tech., 28, 497–512 (2005).
12. Uutela, P., Reinila, R., Piepponen, P., Ketola, R.A. and Kostiainen, R., Analysis of acetylcholineand choline in microdialysis samples by liquid chromatography/tandem mass spectrometry.Rapid Commun. Mass Spectrom., 19, 2950–2956 (2005).
13. Minamino, N., Tanaka, J., Kuwahara, H., Kihara, T., Satomi, Y., Matsubae, M. and Takao, T.,Determination of endogenous peptides in the porcine brain: possible construction ofPeptidome, a fact database for endogenous peptides. J. Chromatogr. B, 792, 33–48 (2003).
14. Svensson, M., Skold, K., Svenningsson, P. and Andrén, P.E., Peptidomic-based discovery ofnovel neuropeptides. J. Proteome Res., 2, 213–219 (2003).
15. Che, F.Y., Lim, J., Pan, H., Biswas, R. and Fricker, L.D., Quantitative neuropeptidomics ofmicrowave-irradiated mouse brain and pituitary. Mol. Cell. Proteomics, 4, 1391–1405 (2005).
16. Emmett, M.R., Andren, P.E. and Caprioli, R.M., Specific molecular mass detection of en-dogenously released neuropeptides using in vivo microdialysis mass spectrometry. J. Neurosci.Meth., 62, 141–147 (1995).
17. Haskins, W.E., Watson, C.J., Cellar, N.A., Powell, D.H. and Kennedy, R.T., Discovery andneurochemical screening of peptides in brain extracellular fluid by chemical analysis of in vivomicrodialysis samples. Anal. Chem., 76, 5523–5533 (2004).
18. Prokai, L., Roboz, J., Kim, H.-S., Ma, L. and Wang, T., In vivo microdialysis and LC/ESI-MSstudies on kyotorphin-induced Met-enkephalin release in the brain. Proceedings of the 44thASMS Conference on Mass Spectrometry and Allied Topics, Santa Fe. American Society forMass Spectrometry, 1996, p. 945.
19. Roboz, J., Yo, Q., Mang, A. and Van Soest, R., On-line buffer removal and fraction selectionin gradient capillary high-performance liquid-chromatography prior to electrospray mass-spectrometry of peptides and proteins. Rapid Commun. Mass Spectrom., 8, 621–626 (1994).

Application of mass spectrometry in brain research 423
20. Grant, S.G.N. and Blackstock, W.P., Proteomics in neuroscience: from protein to network.J. Neurosci., 21, 8315–8318 (2001).
21. Stevens Jr., S.M., Zharikova, A.D. and Prokai, L., Proteomic analysis of the synaptic plasmamembrane fraction isolated from rat forebrain. Mol. Brain Res., 117, 116–128 (2003).
22. Hajos, F., Improved method for preparation of synaptosomal fractions of high purity. BrainRes., 93, 485–489 (1975).
23. Kanner, B.I., Active-transport of �-aminobutyric acid by membrane-vesicles isolated from ratbrain. Biochemistry, 17, 1207–1211 (1978).
24. Phillips, G.R., Huang, J.K., Wang, Y., Tanaka, H., Shapiro, L., Zhang, W.D., Shan, W.S.,Arndt, K., Frank, M., Gordon, R.E., Gawinovicz, M.A., Zhao, Y.M. and Colman, D.R., Thepresynaptic particle web: ultrastructure, composition, dissolution, and reconstitution. Neuron,32, 63–77 (2001).
25. Fountoulakis, M., Schuller, E., Hardmeier, R., Berndt, P. and Lubec, G., Rat brain proteins:two-dimensional protein database and variations in the expression level. Electrophoresis, 20,3572–3579 (1999).
26. Yuan, X.L., Russell, T. and Wood, G., Analysis of the human lumbar cerebrospinal fluidproteome. Electrophoresis, 23, 1185–1196 (2002).
27. Stevens Jr., S.M., Kem, W.R. and Prokai, L., Investigation of cytolysin variants by peptidemapping: enhanced protein characterization using complementary ionization and mass spec-trometric techniques. Rapid Commun. Mass Spectrom., 16, 2094–2101 (2002).
28. Wolters, D.A., Washburn, M.P. and Yates, J.R. III, An automated multidimensional proteinidentification technology for shotgun proteomics. Anal. Chem., 73, 5683–5690 (2001).
29. Kim, S.I., Voshol, H., van Oostrum, J., Hastings, T.G., Cascio, M. and Glucksman, M.J.,Neuroproteomics: expression profiling of the brain’s proteomes in health and disease.Neurochem. Res., 29, 1317–1331 (2004).
30. Wu, C.C., MacCoss, M.J., Howell, K.E., Mathews, D.E. and Yates, J.R. III, Metabolic label-ing of mammalian organisms with stable isotopes for quantitative proteomic analysis. Anal.Chem., 76, 4951–4959 (2005).
31. Gygi, S.P., Rist, B., Gerber, S.A., Turecek, F., Gelb, M.H. and Aebersold, R., Quantitativeanalysis of complex protein mixtures using isotope-coded affinity tags. Nat. Biotech., 17,994–999 (1999).
32. Vertes, A., Mass spectrometry in proteomics. In: Vékey, K., Telekes, A. and Vertes, A. (Eds.),Medical Applications of Mass Spectrometry. Elsevier, Amsterdam, 2008 (Chapter 8, section 2.6,this book).
33. Prokai, L., Zharikova, A.D. and Stevens Jr., S.M., Effect of chronic morphine exposure on thesynaptic plasma-membrane subproteome of rats: a quantitative protein profiling study basedon isotope-coded affinity tags and liquid chromatography/mass spectrometry. J. Mass Spectrom.,40, 169–175 (2005).
34. Hasselmo, M.E. and Bower, J.M., Acetylcholine and memory. Trends Neurosci., 16, 218–222(1993).
35. Giacobini, E., Cholinergic function and Alzheimer’s disease. Int. J. Geriatr. Psychiatry, 18,S1–S5 (2003).
36. Bosboom, J.L.W., Stoffers, D. and Wolters, E.C., The role of acetylcholine and dopaminein dementia and psychosis in Parkinson’s disease. J. Neur. Transm., Suppl., 65, 185–195(2003).
37. Lane, R.M., Potkin, S.G. and Enz, A., Targeting acetylcholinesterase and butyryl-cholinesterase in dementia. Int. J. Neurophsychopharm., 9, 101–124 (2006).
38. Prokai, L. and Zharikova, A.D., Neuropharmacodynamic evaluation of a centrally activethyrotropin-releasing hormone analogue [Leu2]TRH and its chemical brain-targeting system.Brain Res., 952, 268–274 (2002).
424 L. Prokai
39. Ichikawa, J., Dai, J. and Meltzer, H.Y., Acetylcholinesterase inhibitors are neither necessarynor desirable for microdialysis studies of brain acetylcholine. Curr. Sep., 19, 37–43 (2000).
40. Strand, F.L., Neuropeptides: general characteristics and neuropharmaceutical potential intreating CNS disorders. In: Prokai, L. and Prokai-Tatrai, K. (Eds.), Peptide Transport andDelivery into the Central Nervous System, Progress of Drug Research (Vol. 61). Birkhäuser,Basel, 2003, pp. 1–37 (Chapter 1, ISBN 3-7643-6716-4).
41. Shimoyama, M., Tatsuoka, H., Ohtori, S., Tanaka, K. and Shimoyama, N., Change of dorsalhorn neurochemistry in a mouse model of neuropathic cancer pain. Pain, 114, 221–230 (2005).
42. Andrén, P.E. and Caprioli, R.M., In vivo metabolism of substance-P in rat striatum utilizingin vivo microdialysis liquid chromatography—micro-electrospray mass spectrometry. J. MassSpectrom., 30, 814–824 (1995).
43. Prokai, L., Kim, H.-S., Zharikova, A., Roboz, J., Ma, L., Deng, L. and Simonsick Jr., W.J.,Electrospray ionization mass spectrometric and LC/MS studies on the metabolism of syntheticdynorphin A peptides in brain tissue in vitro and in vivo. J. Chromatogr. A, 800, 59–68 (1998).
44. Klintenberg, R. and Andrén, P.E., Altered extracellular striatal in vivo biotransformation of theopioid neuropeptide dynorphin A(1–17) in the unilateral 6-OHDA rat model of Parkinson’sdisease. J. Mass Spectrom., 40, 261–270 (2005).
45. Ueda, H., Yoshihara, Y., Fukushima, N., Shiomi, H., Nakamura, A. and Takagi, H., Kyotorphin(tyrosine-arginine) synthetase in rat-brain synaptosomes. J. Biol. Chem., 262, 8165–8173 (1987).
46. Takagi, H., Harima, A. and Shimizu, H., A novel clinical treatment of persistent pain with L-arginine. Eur. J. Pharmacol., 183, 1443–1443 (1990).
47. Takagi, H., Shiomi, H., Ueda, H. and Amano, H., Novel analgesic dipeptide from bovine brainis a possible Met-enkephalin releaser. Nature, 282, 410–412 (1979).
48. Chen, P., Bodor, N., Wu, W.-M. and Prokai, L., Strategies to target kyotorphin analogues tothe brain. J. Med. Chem., 41, 3773–3781 (1998).
49. Prokai, L., Peptide drug delivery into the central nervous system. In: Jucker, E.M. (Ed.),Progress in Drug Research (Vol. 51). Birkhäuser, Basel, 1998, pp. 95–131 (ISBN376435822X).
50. Cascio, M. and Rapaka, R.S., Structural biology and structural genomics/proteomics. J. Pept.Res., 60, 307–311 (2002).
51. Abersold, R. and Mann, M., Mass spectrometry-based proteomics. Nature, 422, 198–207 (2003).52. Boyer, R.F., 2006 www.wiley.com/legacy/college/boyer/0470003790/animations/membrane_
transport/membrane_transport.swf.53. Biser, P.S., Thayne, K.A., Fleming, W.W. and Taylor, D.A., Na�, K� ATPase alpha-subunit
isoform distribution and abundance in guinea-pig longitudinal muscle/myenteric plexus afterexposure to morphine. Brain Res., 931, 186–193 (2002).
54. Ungerstedt, U. and Rostami, E., Microdialysis in neurointensive care. Curr. Pharm. Des., 10,2145–2152 (2004).
55. Pettersson, A., Amirkhani, A., Arvidsson, B., Markides, K. and Bergquist, J., A feasibilitystudy of solid supported enhanced microdialysis. Anal. Chem., 76, 1678–1682 (2004).
56. Kim, S.Y., Chudapongse, N., Lee, S.M., Levin, M.C., Oh, J.T., Park, H.J. and Ho, I.K.,Proteomic analysis of phosphotyrosyl proteins in morphine-dependent rat brains. Mol. BrainRes., 113, 58–70 (2005).
57. Choi, J., Forster, M.J., McDonald, S.R., Weintraub, S.T., Carroll, C.A. and Gracy, R.W.,Proteomic identification of specific oxidized proteins in ApoE-knockout mice: relevance toAlzheimer’s disease. Free Rad. Biol. Med., 36, 1155–1162 (2004).

Medical Applications of Mass SpectrometryK. Vékey, A. Telekes and A. Vertes (editors)© 2008 Elsevier B.V. All rights reserved
425
Chapter 19
The human pituitary proteome:clinical applications
XIANQUAN ZHANa,b, HAROLD SACKSc, and DOMINIC M. DESIDERIOa,b,*
aCharles B. Stout Neuroscience Mass Spectrometry Laboratory, University of Tennessee HealthScience Center, 847 Monroe Avenue, Memphis, TN 38163, USAbDepartment of Neurology, University of Tennessee Health Science Center, 847 Monroe Avenue,Memphis, TN 38163, USAcDivision of Endocrinology, University of Tennessee Health Science Center, 847 Monroe Avenue,Memphis, TN 38163, USA
1. Introduction 4261.1. Proteomics, functional proteomics, and comparative proteomics 4261.2. The pathophysiological basis of pituitary adenoma comparative
proteomics 4281.3. Basic techniques used for studying proteomics 428
2. The pituitary gland and mass spectrometry: an endocrinologist’s perspective 4303. Methodology 432
3.1. Gel-based comparative proteomics of human pituitary adenoma tissues 4333.2. The proteomics of PTM proteins in human pituitary adenomas 4413.3. Challenge of comparative proteomics in the study of human
pituitary adenomas 4454. Discussion 446
4.1. Insights into the basic molecular mechanisms of pituitarytumor formation 446
4.2. Discovery of potential biomarkers related to pituitary adenomas 4494.3. Pituitary hormone isoforms in human pituitary adenomas 449
5. Future trends 4525.1. Combination of gel-proteomics and non-gel quantitative proteomics 4525.2. Comparative proteomics studies of PTM proteins in human
pituitary adenomas 4525.3. Integration of proteomics and transcriptomics to study human
pituitary adenomas 453
*Corresponding author. Tel.: 901-448-5488; Fax: 901-448-7842. E-mail: [email protected](D.M. Desiderio).

426 X. Zhan et al.
5.4. Protein chips coupled with mass spectrometry to study humanpituitary adenomas 453
6. Conclusions 454Acknowledgments 455References 455
1. Introduction
The pituitary is the master regulatory gland, is the most protected organ in thebody, and secretes several different pituitary hormones that regulate importanthypothalamic–pituitary–target organ axes in the body. Any defect in those regula-tory systems has an associated pathology. A pituitary adenoma is a common patho-logical change of the pituitary, and is a common and critical endocrine tumor. Thealteration of protein composition is a crucial factor in the pathogenesis of pituitaryadenomas. Mass spectrometry (MS)-based proteomics plays an important role toclarify those protein alterations, to elucidate the basic molecular mechanisms inthe formation of a pituitary adenoma, and to detect tumor-specific proteins andpotential biomarkers.
1.1. Proteomics, functional proteomics, and comparative proteomics
Proteomics is an important component of functional genomics. In contrast tostructural genomics, which studies the human genome sequence [1], functionalgenomics focuses on two levels—mRNA and protein, which play important rolesin an understanding of the regulation of biological systems. The genome, tran-scriptome, and proteome are highly complementary systems, and correspond,respectively, to the DNA, mRNA, and protein in a cell, tissue, or organ. Fig. 1demonstrates the relationships among a gene, the genome, and genomics; mRNA,the transcriptome, and transcriptomics; and a protein, the proteome, andproteomics. For a given organism, organ, tissue, or cell, the genome is relativelystable, whereas the transcriptome and proteome are dynamic, and change withtime and conditions (for example, different psychological stages, disease states,and experimental conditions) [2,3]. Because the proteome is much more complexthan the transcriptome due to the diversity in the efficiencies of translation, a verywide array exists for post-translation modifications (PTMs), protein transloca-tions, protein interactions (with DNA, ligands, and other proteins), protein regu-lation, etc., in the processes that lead from mRNA to protein [4,5]. Proteomicsdirectly reveals those important protein compositions and modifications that areassociated with a given condition.

The human pituitary proteome: clinical applications 427
The theoretical objective of proteomics is to array and study “all” proteins in aproteome (the full complement of proteins produced by a particular genome), andto provide a systematic and detailed analysis of the protein population in a wholeorganism, organ, tissue, cell, or subcellular compartment. Actually, that goal isvirtually impossible to achieve because of the many different experimental factorsand the complex physicochemical nature of proteins. The current experimentalsystems probably access only ca. 10% of the proteome. An important goal of pro-teomics is to understand the cellular function at the protein level by means of thedynamic proteome under any given condition; that goal is functional proteomics[6,7]. Functional proteomics will focus only on those proteins that are associatedwith a unique condition—for example, a disease, different development stages,different pathology stages, different drug-treated conditions, etc. The bulk of thedifferentially expressed proteins (DEPs) that are associated with a unique conditionare usually detected by comparative proteomics. The technology employed incomparative proteomics includes gel-based comparative proteomics and stableisotope-labeling quantitative proteomics. Gel-based comparative proteomicscommonly includes two-dimensional gel electrophoresis (2DGE), 2D gel imageanalysis, MS characterization of proteins, and bioinformatics. Stable isotope-labelingquantitative proteomics usually includes the stable isotope [for example, isotope-coded affinity tag (ICAT)] labeling of a sample, liquid chromatography (LC),tandem mass spectrometry (MS �MS), quantification of the separated peptides, andbioinformatics.
Fig. 1. A flowchart to demonstrate the relationship among the genome, transcriptome, and proteome.An intron is a nucleic acid sequence that does not code any protein, and an exon is a nucleic acidsequence that codes protein. mRNA is “reverse-transcripted” by the enzyme reverse transcriptaseinto complementary DNA (cDNA). An mRNA sequence has a one-to-one correspondence to acDNA sequence. cDNA only includes the sequence of exons, and not introns. Reproduced fromZhan and Desiderio [14], with permission from Wiley-VCH, copyright 2005.

428 X. Zhan et al.
1.2. The pathophysiological basis of pituitary adenoma comparativeproteomics
The human pituitary anterior gland includes five highly differentiated cell types thatoriginate from the neural epithelium—a primordial cell in early embryogenesis. Eachcell type produces a specific hormone that participates in multiple regulatoryhypothalamic–anterior pituitary–target organ axes (Fig. 2) [8]. Those five systemsperform a range of very important physiological functions in the human body. Thosefive types of cells that constitute the anterior lobe of the pituitary gland are thecorticotrophs (secrete ACTH), somatotrophs (secrete growth hormone (GH)),lactotrophs (secrete PRL), thyrotrophs (secrete TSH), and gonadotrophs (secrete FSHand LH).
Pituitary tumors could arise from any one of those different cell types, and thetumor’s secretion products depend on the cell of origin (Fig. 2). Mixed tumors (theco-secretion of GH with PRL, TSH, or ACTH) may also arise from a single celltype. Molecular genetic studies have also indicated that a pituitary adenoma ismonoclonal in origin [9,10]. ACTH oversecretion results in Cushing’s disease,with features of hypercortisolism; GH hypersecretion leads to acral overgrowthand a metabolic dysfunction associated with acromegaly; and PRL oversecretionleads to gonadal failure, secondary infertility, and galactorrhea. More rarely, TSHhypersecretion leads to hyperthyroxinemia and goiter, and hypersecreted GH (orits respective protein subunits) leads to gonadal dysfunction. In contrast, tumorsthat arise from gonadotroph cells do not efficiently secrete their gene products,and they are usually clinically silent [8].
The formation of a pituitary adenoma is thought to be due to either a constantsupply of hypothalamic-releasing hormones within those adenomas or a geneticdefect within the pituitary [11], which involves different proteins or protein systems.Each type of pituitary adenoma may involve the corresponding tumor-related andspecific proteins. Comparative proteomics is an excellent method to provide asystems-level approach to detect and identify those DEPs between pituitaryadenomas and normal cells. Those data could: clarify the basic molecular mecha-nisms of pituitary tumorigenesis; classify tumors on a molecular level; identifycancer biomarkers and detect novel drug-targets; and provide an “early stage” diag-nosis, potential therapy, and accurate prognosis. In turn, a pituitary adenoma is anexcellent biomodel to be studied by comparative proteomics.
1.3. Basic techniques used for studying proteomics
The state-of-the-art biological mass spectrometric “soft-ionization” technologies(matrix-assisted laser desorption/ionization (MALDI); electrospray ionization (ESI))facilitate the routine characterization of proteins. Those two ionization methods areintegratedwithseveraldifferent ionanalyzers to formavarietyofmassspectrometers,

The hum
an pituitary proteome: clinical applications
429
Fig. 2. A scheme of the hypothalamic–anterior pituitary–target organ axis systems and pituitary adenoma pathogenesis (Melmed [8]). (�) Stimulatoryregulation; (�) inhibitory regulation. Reproduced from Zhan and Desiderio [14], with permission from Wiley-VCH, copyright 2005, and modifiedfrom Melmed [8], with permission from Copyright Clearance Center Inc. (Re: Journal of Clinical Investigation), copyright 2003.

430 X. Zhan et al.
including MALDI–time of flight (MALDI�TOF), ESI–quadrupole ion trap(ESI�qIT), MALDI/ESI–linear ion trap (MALDI/ESI�LTQ), MALDI/ESI�quadrupole-TOF (MALDI/ESI�Q-TOF), and MALDI�TOF�TOF instruments.MALDI–TOF is commonly used to produce peptide mass fingerprinting (PMF) data;qIT, LTQ, and Q-TOF produce MS/MS, or amino acid sequence-determining data[12]. PMF and MS/MS data can be obtained with a TOF–TOF instrument [13].
Genome sequences [1] and bioinformatics. Generate protein databases that areused to characterize proteins and peptides in a biological sample. Proteomics is aglobal experimental approach to analyze a proteome, which includes all of the pro-teins in a tissue, cell, or body fluid at any given time [14]. Protein-separation tech-nology includes 2DGE and multiple-dimensional LC coupled with different stableisotope-labeling strategies, and protein databases include Swiss-Prot and NCBInr.Proteins are characterized with PMF and MS�MS data [12].
Search engines have been developed to compare PMF and MS/MS data to theprotein databases [14]. PMF data search engines include PeptIdent (http://us.expasy.org/tools/peptident.html), Mascot (http://www.matrixscience.com/search_form_select.html), MS-Fit (http://prospector.ucsf.edu/ucsfhtml4.0/msfit.htm),and Pro-Found (http://129.85.19.192/ profound_bin/WebProFound.exe). MS/MSdata search engines include SEQUEST for the ESI–qIT, PROTEINLYNX 3.5 soft-ware for the Q-TOF, Mascot software (http://www.matrixscience.com/search_form_select.html), and the Global Proteome Machine (GPM) software (http://h003.thegpm.org/ tandem/thegpm_tandem.html).
MS has been used to characterize 2DGE- and LC-separated human pituitaryproteins and DEPs that are related to human pituitary adenomas [2,12,15–17].PTMs of proteins are also important to study. MS/MS effectively characterizes thePTMs and determines the modified sites. LC–ESI–qIT MS/MS has been used toidentify the phosphorylation [18] and nitration sites [19–21] of proteins in thehuman pituitary proteome. A human pituitary proteome reference database hasbeen established in our laboratory [12,15], many tumor-related proteins wereidentified [2,17]. And the primary structure and PTMs of pituitary proteins wereMS-characterized [2,12,15–21]. Those data could contribute to the basic andclinical research studies of human pituitary tumors. Moreover, novel protein chip-based MS technology [22] might eventually be used for the screening, diagnostics,and therapeutics of human pituitary diseases.
2. The pituitary gland and mass spectrometry: an endocrinologist’sperspective
In 1970, Guillemin and co-workers used MS to determine the amino acid sequenceof the ovine thyrotrophin-releasing hormone (TRH), the first of the hypothala-mic hypophysiotrophic peptides to be discovered [23]. Ten years earlier, the

The human pituitary proteome: clinical applications 431
development of the insulin immunoassay by Yalow and Berson [24] and its appli-cation to the measurement of other peptides [25], including pituitary hormones,triggered a rapid expansion of knowledge in pituitary physiology and disease.Before that time, pituitary hormones were measured by insensitive, laborious, andtime-consuming bioassays. Significant developments and improvements in MSinstrumentation, ionization methods, and computer methods now permit theseparation, structural identification, and study of a large number of known and newproteins (proteomics) in the pituitary. Proteomics, genomics (the study of DNA),and transcriptomics (the study of messenger RNA and its transcription) are com-plementary methodologies of the modern era that are likely to increase and propelour understanding of pituitary physiology, pathophysiology, and therapeutics tonew vistas.
Physiologically, an example of this new methodology is the recent identificationby MS of several forms of phosphorylated GH in normal (cadaveric) pituitary glands[18]. Phosphorylation of tyrosine, serine, and threonine residues in cellular proteinssuch as receptors, receptor substrates, and kinases is a critical step in the signalingpathways that connect the extracellular hormones or cytokines with the ultimatebiological response of cells. These data suggest the hypothesis that phosphorylatedGH might function as a signaling protein within the somatotroph (an intracrineeffect) in contradistinction to the GH that is secreted into blood (an endocrine effect).Other questions arise. Is the phosphorylation specific for GH, or does that PTMalso occur in the other pituitary cell types? What happens to GH phosphorylation inGH-secreting pituitary adenomas?
There are other examples of PTMs in normal and adenomatous pituitary tissue,such as the nitration and nitrosylation of proteins [19–21]. Experimentally, nitricoxide (NO), an intracellular messenger molecule, activates the release of severalanterior pituitary hormones. NO can combine with superoxide (O2
�) to form peroxy-nitrite (OONO�), which is a highly reactive anion that nitrates tyrosine residues.Likewise, NO can combine with thiol (�SH) groups to lead to the nitrosylation ofcysteine residues. The role and significance of nitration and nitrosylation in pituicytesignaling and growth under physiological and pathological conditions requirefurther investigation; e.g., what might be the effects of nitration and nitrosylationoverproduction, or of their pharmacologic blockade?
From a pathological perspective, the detailed MS study of pituitary tumors canbe used to determine whether proteins that regulate cell growth or hormonesecretion are over- or under-expressed in neoplastic tissue, and whether they canbe used as blood biomarkers of tumor mass and activity. For example, secreta-gogin, which is important for pancreatic �-cell insulin secretion, is a newlydiscovered protein in the normal adenohypophysis; it and its mRNA are under-expressed in null cell/gonadotroph pituitary adenomas [17]. Further studies areneeded to determine whether secretagogin plays a physiological role in pituitaryhormone secretion.

432 X. Zhan et al.
MS technology, coupled with a variety of powerful separation techniques, canexamine the expression of more than 1000 proteins [26]. Likewise, of the thousandsof genes in the human genome, the technique of gene-expression microarray canidentify those genes whose functions are altered by neoplastic transformation. Thismethod has become an important investigative tool in pituitary oncology [8,27] andother areas of clinical oncology [28]. A thumb-nail size photolithography chip isprepared that contains thousands of short DNA sequence probes of known genesthat are arrayed and bound to glass surfaces. Messenger RNA is extracted fromtumor samples, labeled with a fluorescent dye, and applied to the chip. The excesslabeled mRNA is washed off. Spots remain only where the tumor mRNA and com-plementary gene-specific DNA probes have hybridized. Multiple gene analysis forup- and down-regulation is performed with Prediction Analysis of Microarrays(PAM) software, and the data are compared to normal tissue samples [28].
From a therapeutic viewpoint, new drugs are needed to treat patients—especiallythose patients whose pituitary tumors have not been cured by surgical extirpationand radiotherapeutic ablation, and in whom ongoing tumor growth and/or hormonehypersecretion cannot be controlled by any of the current treatment modalities.Hopefully, genomic and proteomic advances in pituitary oncology, driven in largepart by MS, will lead to the realization of that clinically important goal.
3. Methodology
Proteomics is a multidisciplinary study that includes protein chemistry, MS, chro-matography, bioinformatics, etc. The basic proteomics techniques are grouped intotwo types: protein separation and protein identification. 2DGE and LC are the mainprotein- and peptide-separation techniques, respectively. MS coupled with bioinfor-matics analysis identifies proteins. Two types of proteomics systems (LC, gel) areused to analyze human pituitary tissues to obtain tumor-related proteins and PTMs.
A brief procedure of gel-based comparative proteomics [2] is: the extractedpituitary proteins are separated with 2DGE and visualized (for example, silver-stained); digitized 2DGE images are compared to obtain differential spots betweenpituitary adenomas and controls; the protein in each differential spot is digestedin-gel with trypsin; the purified tryptic peptides are analyzed with mass spectrometry(PMF; or MS/MS); and the MS data are used to search a protein database forprotein identification. 2DGE coupled with Western blotting [19,21] is often used todetect PTMs (for example, phosphorylation and nitration) and protein isoforms.The LC procedure of stable isotope-labeling quantitative proteomics [18] is: theextracted proteins are digested with trypsin; the tryptic peptides from samples andcontrols are labeled with a different isotope, respectively; the labeled samples aremixed (1:1) and analyzed with LC�MS/MS; the area under the curve (AUC) of the

The human pituitary proteome: clinical applications 433
LC-separated peptides is used to determine the DEPs; and the MS/MS data are usedto search a protein database for protein identification.
3.1. Gel-based comparative proteomics of human pituitary adenoma tissues
3.1.1. Pituitary protein preparation
Sample preparation is a very critical step for the efficient separation of proteins with2DGE and for their subsequent MS-characterization. Moreover, good sample prepa-ration must maximize the number of proteins that are extracted from a pituitarytissue, extract all proteins in a quantitative manner, and avoid any proteolytic proteindegradation. Actually, the key to good sample preparation is an efficient proteinsolubilization with a minimum of handling. For pituitary protein preparation, a com-bination of chemical and physical methods is a very effective strategy to extractproteins from pituitary tissues by homogenization, lyophilization, chemical resolv-ing, repeated sonication, and centrifugation [12,15].
Several critical features for the efficient extraction of proteins from a pituitaryinclude: (i) the pituitary control and adenoma tissues should be washed thoroughlywith sodium chloride (0.9%) to remove any blood on the surface of the tissue;(ii) due to the limited amount of the pituitary tissue (control and tumor; ca. 0.5 gcontrol; ca. 15–80 mg adenoma), homogenization and lyophilization minimize anyprotein loss; (iii) the pharmalyte in the protein solubilization buffer improved pro-tein solubilization, stabilized the pI of proteins, and improved isoelectric focusing(IEF) with an IPG strip; (iv) a combination of urea and thiourea improved proteinsolubilization and IEF [29]; (v) repeated sonication improved protein solubilization;(vi) any tube or pipette tip that contacts a protein sample must be siliconized;(vii) sufficient centrifugation (20 min, 13,000 g) removed any undissolved mate-rial before IEF; (viii) high concentrations of acetic acid (2 M) and urea inhibited theactivity of endogenous proteases (thus, protein inhibitors are not needed); and(ix) keratin from skin and hair was avoided by wearing latex gloves and cap.
3.1.2. Between-gel reproducibility and protein-loading capacity
For gel-based comparative proteomics, the levels of between-gel and between-sample reproducibility [30], and the protein-loading capacity [31] are the crucialexperimental factors to accurately discover any DEPs. 2DGE and 2DGE-analysissoftware were used to optimize the quality and reproducibility of the 2D gelsobtained from human pituitary tissues. First-dimension IEF was performed with animmobilized pH-gradient dry gel-strip (IPG strip). Two second-dimensionSDS–PAGE systems were used: the horizontal single-gel system (Multiphor II)that can analyze 1 gel at a time on a pre-cast gradient gel and the vertical multigel

434 X. Zhan et al.
system (Dodeca) that can analyze up to 12 gels at a time. The spatial and quantita-tive reproducibilities of protein spots on gels obtained with those two systems wereevaluated for the separation of the complex human pituitary tissue proteome. Ourbetween-gel reproducibility was �98%. For the Dodeca gel system, the between-gel reproducibility and the linear separation capability were both superior comparedto the Multiphor II gel system.
3.1.3. Principle of gel-based comparative proteomics
2DGE-based comparative proteomics was established in our laboratory to analyzehuman pituitary adenomas [2]. The proteomes from one human pituitarymacroadenoma tissue and one control tissue were compared [2]. Four different typesof differential protein spots were found, and the representative differential spotsbetween pituitary adenomas and controls are shown in Fig. 3. An “increased” spotmeant that the spot must exist in each adenoma-gel and in at least one control-gel, andthat the ratio was �3 of the average normalized spot volume in the adenoma-gelsto the average normalized spot volume in the control-gels. A “decreased” spot meantthat the spot must exist in each control-gel and in at least one adenoma-gel, and thatthe ratio was �3 of the average normalized spot volume in the control-gels to theaverage normalized spot volume in the adenoma-gels. A “new” spot meant thatthe spot must exist in each adenoma-gel, but not in any control-gel. A “lost” spotmeant that the spot must exist in each control-gel, but not in any adenoma-gel. Withan improvement in the 2DGE sensitivity, the “lost” spot might turn into a “decreased”spot, and the “new” spot might turn into “increased” spot. Strictly speaking, the“increased” and “new” spots should belong to an expression-up-regulated protein,and the “decreased” and “lost” spots should belong to a down-regulated protein.Mass spectrometry [PMF (Fig. 4) and MS �MS (Fig. 5)] and bioinformatics havebeen extensively used to characterize the 2DGE-seperated pituitary proteins.
3.1.4. Heterogeneity of human pituitary proteomes
The heterogeneity of human pituitary proteomes is a crucial factor that must be stud-ied in order to accurately validate DEPs between pituitary adenomas and controlsbecause the pituitary adenoma and control tissues are not from the same patient;those different sources result in some uncontrolled experimental factors (gender,age, race) that occur within any comparative proteomics study of human pituitaryadenomas. Therefore, the heterogeneity of a human pituitary proteome was studiedas a function of three important factors—gender, age, and race [16].
A total of 30 high-resolution 2DGE gels from eight pituitary control tissues wereused for a comparative analysis. A total of ca. 1000 protein spots were detected ineach 2DGE map. Fifty-one differential spots (7 spots due to gender, 17 to age, 15to race, and 12 to the co-effects of age and race) were found when pituitary
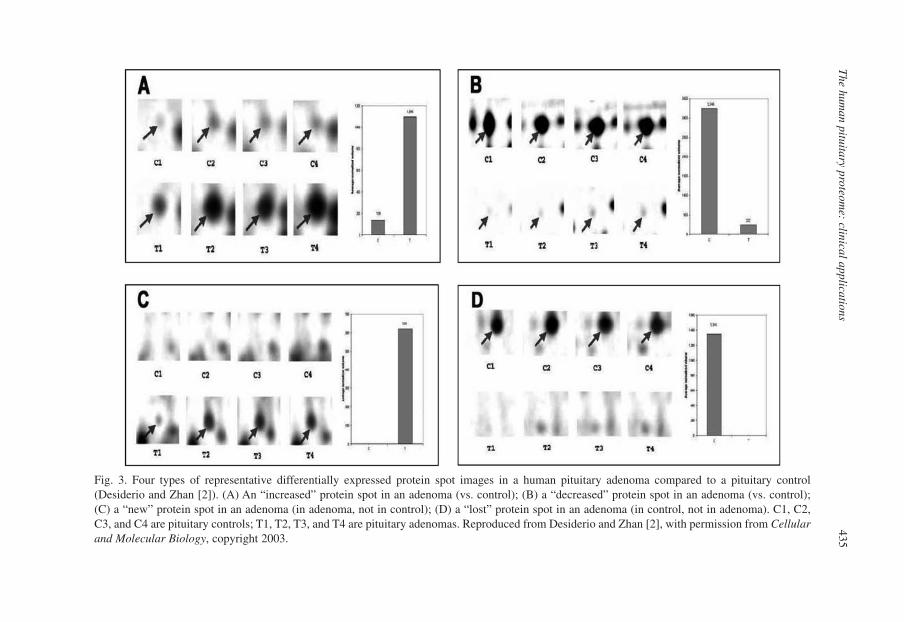
The hum
an pituitary proteome: clinical applications
435
Fig. 3. Four types of representative differentially expressed protein spot images in a human pituitary adenoma compared to a pituitary control(Desiderio and Zhan [2]). (A) An “increased” protein spot in an adenoma (vs. control); (B) a “decreased” protein spot in an adenoma (vs. control);(C) a “new” protein spot in an adenoma (in adenoma, not in control); (D) a “lost” protein spot in an adenoma (in control, not in adenoma). C1, C2,C3, and C4 are pituitary controls; T1, T2, T3, and T4 are pituitary adenomas. Reproduced from Desiderio and Zhan [2], with permission from Cellularand Molecular Biology, copyright 2003.

436 X. Zhan et al.
Fig. 4. A representative MALDI–TOF mass spectrum (Desiderio and Zhan [2]). T: a trypsin auto-digestion fragment. The gel spots were cut from a silver-stained 2D gel, digested in-gel with trypsin(37�C, ca. 18 h). The tryptic peptides were purified with a ZipTip C18 tip (Millipore), and eluteddirectly from the microcolumn onto the MALDI plate with 2 �l of an �-cyano-4-hydroxycinnamicacid (CHCA) solution (12.5 mg/ml in 50%, v/v, acetonitrile/0.1%, v/v, TFA). The matrix was driedin ambient air. The mass spectrum was obtained in the delayed extraction, reflectron, positive-ionmode on a Perseptive Biosystems MALDI–TOF Voyager DE-RP mass spectrometer (Framingham,MA, USA). The mass spectrum was internally mass-calibrated with two fragment-ion masses of thetrypsin auto-digestion products ([M�H]� 842.509 and 2211.104 Da). Those masses that resultfrom trypsin, matrix, keratins from skin and hair, and other unknown contaminants were removedmanually from the mass spectrum. The corrected list was the PMF data that were used to searchthose protein databases. The protein was identified as fibrinogen gamma chain (Swiss-Prot No.P02679). Reproduced from Desiderio and Zhan [2], with permission from Cellular and MolecularBiology, copyright 2003.
proteomes were compared according to gender, age, and race. For those 51differential spots, 33 DEPs (6 spots due to gender, 9 to age, 8 to race, and 10 to theco-effect of age and race) were MS-characterized. A functional analysis of thoseDEPs showed that prolactin was expressed higher in the female than in the male,and that somatotropin was related to gender, age, and race. Some proteins associ-ated with hormone regulation (for example, follistatin, thyroid hormone receptorbeta-2, adenylate cyclase-inhibiting G alpha protein) were related to age and race.The DEPs that were related to age were mainly those proteins that are associatedwith cell growth, proliferation, differentiation, apoptosis, and death; those proteinsdid not show any difference with gender and race. Those differential spots were not

The hum
an pituitary proteome: clinical applications
437XZ02172004spot2002 #2180 RT: 52.30 AV: 1 NL: 4.44E6 T: + cd Full ms 2 [email protected] [175.00-1385.00]
GQC[57.0]KDALEIY[45.0]K Calculated [M + H]+ = 1370.49 Calculated [M + 2H]2+ = 685.75 Experimental [M + 2H]2+ = 686.12
100
95
90
85
80
75
70
65
60
55
50
45
40
35
30
25
20
15
10
5
0200 300 400 500 600 700 800 900 1000 1100 1200 1300
Y(+45)
K
L EAD
E
K
KY(+45) L,A,D
m/z
218.1
281.2
328.3
327.0
346.2423.2
422.1
456.3
y3
y4
b5
b6
b9
b10
b4(-H2O)
b8(-NH3)
b10(-NH3)
y8
b7
y7
b8
b3
475.2
468.0
y2
355.1b4
474.3
356.1
597.2
658.2
598.1
580.3
579.2
476.2 562.2599.2629.2
694.2
712.1
784.1
774.3
773.3
903.3
897.1
896.1
785.1
885.3
879.0786.3
904.31016.3
1015.2
922.0 1000.3
1152.11130.3
1114.4
1153.1
1341.91257.5
1225.11223.2
1207.1
1224.2
587.3
659.3
SeqG QC#
KDALEI
K
b(+1) 58.1
186.2 346.3 474.5 589.6 660.7 773.8 902.9
1016.1 1224.3 1352.5
y(+1) 1370.5 1313.4 1185.3 1025.1
897.0 781.9 710.8 597.6 468.5 355.4 147.2
Rel
ativ
e A
bund
ance
*Y
Fig. 5. SEQUEST (top right) and de novo (bottom) analysis of an MS2 spectrum of the precursor ion ([M�2H]2�, at m/z 686.12, RT 52.30 min,and scan number 2180) for a nitrotyrosyl peptide (Tyr-237) 228GQC#KDALEI*YK238 that contained 11 amino acids, and that was derived fromsynaptosomal-associated protein (spot 1). *Y: nitrotyrosine. C#: carbamidomethyl-Cys. Reproduced from Zhan and Desiderio [19], with permissionfrom Elsevier Science (USA), copyright 2004.

438 X. Zhan et al.
found in our subsequent large-scale comparison from pituitary adenoma tissuesand pituitary control tissues [17].
3.1.5. Proteomic profiles of human pituitary adenomas
3.1.5.1. Reference 2DGE map. One control pituitary and one adenoma tissue wereanalyzed with 2DGE and MS. For the control pituitary proteome [15], the 2D mapcontained 1094 protein spots; a total of 62 spots, corresponding to 38 differentproteins, were MS-characterized. For the pituitary adenoma tissue proteome [12],the 2D map contained ca. 1000 protein spots; 135 protein spots that represented 111proteins were MS-characterized. Those proteins correlated to different functionalgroups. The protein identification data were used to construct a Web-based refer-ence database of the human pituitary (www.utmem.edu/proteomics).
3.1.5.2. Differentially expressed proteins. A large-scale comparative proteomicsstudy was performed on a set of human pituitary samples: controls (n 8,gels 30) vs. several different cell types of non-functional (NF) pituitary adeno-mas (NF�, n 3, gels 9; LH�, n 3, gels 9; FSH�, n 3, gels 9;FSH� � LH�, n 3, gels 9; unknown cell type, n 3, gels 3) [32] andprolactinomas (n 4, gels 12) (Evans et al., in preparation). A total of 251 dif-ferential spots were found, among which 93 differential protein spots (65 de-creased spot volumes, 28 increased) were subjected to in-gel trypsin digestion andMS-characterization. Seventy-two spots (50 decreased, 22 increased), represent-ing 56 DEPs (34 down-regulated, 22 up-regulated), were characterized with MSand database analysis. The functional roles that are involved in those multipleprotein systems are summarized in Fig. 6.
Results indicated that: (i) neuroendocrine-related proteins (somatotropin, secret-agogin, and �-crystallin homolog) were down-regulated in NF pituitary adenomasand the prolactinomas; (ii) prolactin existed in six isoforms that were down-regulatedin NF adenomas, and were not changed in the prolactinomas; (iii) somatotropinexisted in at least 17 isoforms that were down-regulated in NF adenomas and theprolactinomas; (iv) cell proliferation, differentiation, and apoptosis-related proteinswere down-regulated in the NF adenomas and the prolactinomas; (v) immunologicregulation proteins and tumor-related antigen (immunoglobulin, tumor rejectionantigen-1) were down-regulated in NF adenomas; (vi) some cell-defense and stress-resistance proteins (phospholipid hydroperoxide glutathione peroxidase, CD59glycoprotein, and heat shock 27 kDa protein) were down-regulated in the pituitaryadenomas; (vii) some metabolic enzyme-related proteins (for example, isocitratedehydrogenase [NADP] cytoplasmic, tryptophan 5-hydroxylase 2, matrixmetalloproteinase-9, aldose reductase, lactoylglutathione lyase, acyl-CoA-bindingprotein, etc.) were up-regulated in the pituitary adenomas; and (viii) for cell-signalproteins, some were down-regulated and some were up-regulated in adenomas;

The human pituitary proteome: clinical applications 439
those cell signals are involved in the complex biological roles in the cell growth,proliferation, differentiation, apoptosis, and death cycles.
3.1.5.3. Comparative proteomics data vs. comparative transcriptomics data. Thosesame pituitary tumor samples [NF adenomas (NF�, n 3; LH�, n 3; FSH�,n 3; FSH� � LH�, n 3; unknown cell type, n 3) and prolactinomas(n 4)] were also analyzed with a GeneChip microarray to detect the differentiallyexpressed genes (DEGs) at the mRNA level in those human pituitary adenomascompared to controls. A total of 374 DEGs were found (215 down-regulated,159 up-regulated) in NF adenomas with a change-fold of �2, and 213 genes(153 down-regulated, 60 up-regulated) in the prolactinomas with a change-foldof �2. Those comparative proteomics data (56 DEPs derived from 72 differentialspots) were compared to those comparative transcriptomics data to determine anyconsistent or similar results at the protein and mRNA expression levels ([32],Evans et al., in preparation). Nine genes—somatotropin, prolactin, secretagogin,tissue transglutaminase, isocitrate dehydrogenase [NADP] cytoplasmic, cellularretinoic acid-binding protein II, G-protein beta, calreticulin, and hemoglobin betachain—indicated a consistent change in the protein and mRNA expression levels inadenomas relative to controls (Table 1).
I 14%
II 15%
III 9%
IV 3%V
3%VI 6%
VII 15%
VIII 17%
IX 6%
X 12%
I 35%
II 5%
III 14%
IV 9%
V 9%
VI 5%
VII 23%
A B
Fig. 6. Functional categories of the 56 MS-characterized differentially expressed proteins. (A) Down-regulated proteins in pituitary adenoma (n 34): (I) neuro-endocrine and hormones; (II) cytokineand cellular signal-related proteins; (III) cellular defense and stress resistance; (IV) mRNA splicing,transport or translation-related enzyme; (V) DNA-binding proteins; (VI) metabolic enzymes;(VII) immunologic regulation proteins and tumor-related antigen; (VIII) transport proteins; (IX) cellproliferation, differentiation, apoptosis-related proteins; (X) others. (B) Up-regulated proteins inpituitary adenomas (n 22): (I) metabolic enzyme-related proteins; (II) energy metabolism;(III) cellular signal proteins; (IV) cell cycle, cell growth and proliferation proteins; (V) cellulardefense response; (VI) protein folding-related protein; (VII) others. Reproduced from Zhan andDesiderio [14], with permission from Wiley-VCH, copyright 2005.

440X
. Zhan et al.
Table 1
Comparative proteomics vs. comparative transcriptomics in human pituitary adenomas
Differentially expressed proteins Differentially expressed genes
Swiss-Prot Protein name NF PRL GenBank Gene name NF PRL
P01241 Somatotropin (GH1) � � NM_000515 GH1: growth hormone 1 � �NM_002059 GH2: growth hormone 2 � �NM_000823 GHRHR: growth � �
hormone-releasinghormone receptor
P01236 Prolactin (PRL) � ��� NM_000948 PRL: prolactin � ���O76038 Secretagogin (SCGN) � � (weak) NM_006998 SCGN: secretagogin �P21980 Tissue � � NM_004613 TGM2: transglutaminase 2 � �
transglutaminase (TGM2)O75874 Isocitrate � � (weak) NM_005896 IDH1: isocitrate dehydrogenase �
dehydrogenase [NADP] (NADP�), solublecytoplasmic (IDH1)
P29373 Cellular retinoic � M97815 Cellular retinoic acid-binding �acid-binding protein II protein 2
P16520 Guanine nucleotide- � M31328 Guanine nucleotide- �binding protein binding protein G(I) �G(S) �G(T) (G protein), betabeta subunit 3 polypeptide
P27797 Calreticulin precursor � AI807225 KDEL endoplasmic �reticulum (ER) protein
gi1066765 Hemoglobin, � � NM_000518 HBB: hemoglobin, beta � �beta chain (HBB)
NM_000519 HBD: hemoglobin, delta �
NF: non-functional pituitary adenoma; PRL: hyperprolactinoma. The bracket after the protein name refers to its corresponding gene name. (�) Up-regulated in pituitary adenomas relative to controls; (�) down-regulated in pituitary adenomas relative to controls. Reproduced from Zhan andDesiderio [14], with permission from Wiley-VCH, copyright 2005.
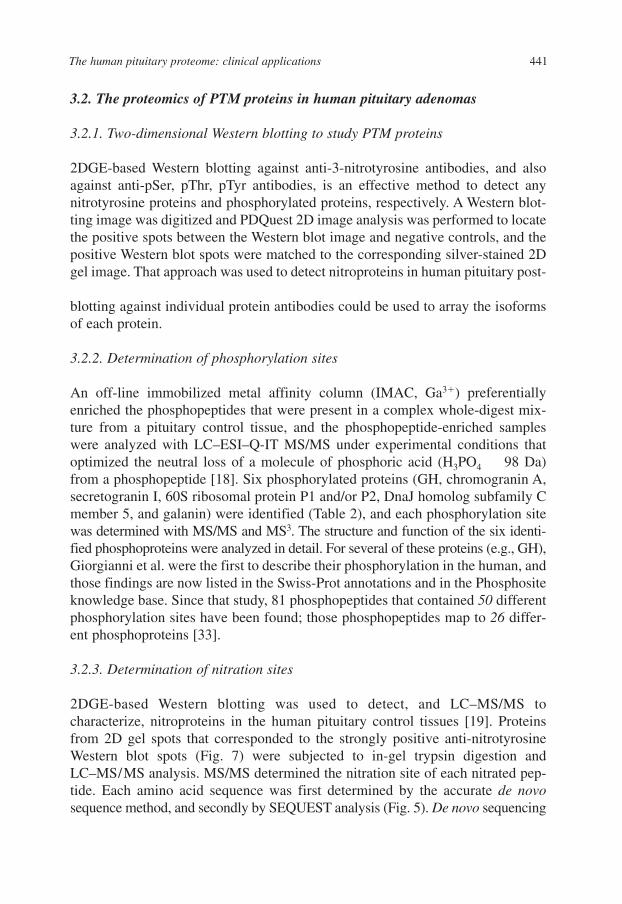
The human pituitary proteome: clinical applications 441
3.2. The proteomics of PTM proteins in human pituitary adenomas
3.2.1. Two-dimensional Western blotting to study PTM proteins
2DGE-based Western blotting against anti-3-nitrotyrosine antibodies, and alsoagainst anti-pSer, pThr, pTyr antibodies, is an effective method to detect anynitrotyrosine proteins and phosphorylated proteins, respectively. A Western blot-ting image was digitized and PDQuest 2D image analysis was performed to locatethe positive spots between the Western blot image and negative controls, and thepositive Western blot spots were matched to the corresponding silver-stained 2Dgel image. That approach was used to detect nitroproteins in human pituitary post-mortem tissues (Fig. 7; see below) [19,21]. Moreover, two-dimensional Westernblotting against individual protein antibodies could be used to array the isoformsof each protein.
3.2.2. Determination of phosphorylation sites
An off-line immobilized metal affinity column (IMAC, Ga3�) preferentiallyenriched the phosphopeptides that were present in a complex whole-digest mix-ture from a pituitary control tissue, and the phosphopeptide-enriched sampleswere analyzed with LC–ESI–Q-IT MS/MS under experimental conditions thatoptimized the neutral loss of a molecule of phosphoric acid (H3PO4 98 Da)from a phosphopeptide [18]. Six phosphorylated proteins (GH, chromogranin A,secretogranin I, 60S ribosomal protein P1 and/or P2, DnaJ homolog subfamily Cmember 5, and galanin) were identified (Table 2), and each phosphorylation sitewas determined with MS/MS and MS3. The structure and function of the six identi-fied phosphoproteins were analyzed in detail. For several of these proteins (e.g., GH),Giorgianni et al. were the first to describe their phosphorylation in the human, andthose findings are now listed in the Swiss-Prot annotations and in the Phosphositeknowledge base. Since that study, 81 phosphopeptides that contained 50 differentphosphorylation sites have been found; those phosphopeptides map to 26 differ-ent phosphoproteins [33].
3.2.3. Determination of nitration sites
2DGE-based Western blotting was used to detect, and LC–MS/MS tocharacterize, nitroproteins in the human pituitary control tissues [19]. Proteinsfrom 2D gel spots that corresponded to the strongly positive anti-nitrotyrosineWestern blot spots (Fig. 7) were subjected to in-gel trypsin digestion andLC–MS/MS analysis. MS/MS determined the nitration site of each nitrated pep-tide. Each amino acid sequence was first determined by the accurate de novosequence method, and secondly by SEQUEST analysis (Fig. 5). De novo sequencing

442 X. Zhan et al.
60
50
40
30
20
18
60
50
40
30
20
186.05.65.24.36.05.65.24.3
6.05.65.24.36.05.65.24.3
60
50
40
30
20
18
60
50
40
30
20
18
34 2
11
2
6
8
7
5
9
3 4
10
1311
12
15
1614
3
8
1
2
4
9
14
15
IEF (pl )
SD
S-PA
GE
(Mr , kD
a)
A B
DC
Fig. 7. Two-dimensional Western blot analysis of anti-3-nitrotyrosine proteins in a human pituitary(70 �g protein per 2D gel). (A) Silver-stained image on a 2D gel before transfer of proteins to aPVDF membrane. (B) Silver-stained image on a 2D gel after transfer of proteins to a PVDF mem-brane. (C) Western blot image of anti-3-nitrotyrosine proteins (anti-3-nitrotyrosine antibodies �secondary antibody). (D) Negative control of Western blot to show the cross-reaction of the sec-ondary antibody (only the secondary antibody; no anti-3-nitrotyrosine antibody). Reproduced fromZhan and Desiderio [19], with permission from Elsevier Science (USA), copyright 2004.

The human pituitary proteome: clinical applications 443
independently and accurately determined each amino acid sequence beforeSEQUEST analysis. Four different nitrated peptides were characterized, and werematched to four different nitroproteins (Table 3).
3.2.4. Analysis of protein isoforms
Protein isoforms result from PTMs, splicing variants, etc. Each protein isoformhas its own pI and Mr values; 2DGE, or 2DGE coupled with corresponding proteinantibodies, is an effective method to array those different isoforms of each protein.MS, especially MS �MS, plays an important role in the characterization of eachPTM and splicing variant. We found that prolactin had multiple isoforms in humanpituitary control tissues—six 2D gel spots that contained prolactin were identified[32; Evans et al., in preparation]. Further experiments are needed to determinewhether the ratio of each prolactin isoform changes in NF pituitary adenomas andprolactinomas.
Twenty-four 2D gel spots that contained human GH were found in human pitu-itary control tissues [34]. Those hGHs in the 24 2D gel spots were classified intothe four types of hGH splicing isoforms, 1–4. The expression proportion of those
Table 2
Phosphoproteins from human pituitary digests identified by LC–MS/MS
Protein(Swiss- Peptide identified Phosphorylation SEQUEST MASCOTProt number) site scores (Xcorr) scores
Human growth 121SVFANSLVYGA Ser 132 3.47 48hormone (P01241) SDSNVYDLLK141
172FDTNSHNDDALLK184 Ser 176 3.63 32Chromogranin A 319GGKSGELEQEEER331 Ser 322 3.61 44(P10645)Secretogranin I 134ADEPQWSLYP Ser 149 3.26 58(P05060) SDSQVSEEVK153
397MAHGYGEESEEER409 Ser 405 2.67 2460S acidic ribosomal 98KEESEESDDD Ser 101 4.84 35protein P1 (P05386) MGFGLFD114
and/or 60S acidicribosomal protein P2(P05387)
99KEESEESDDDM Ser 102 4.84 35GFGLFD115
DnaJ homolog 8SLSTSGESLY Ser 10 4.24 62subfamily C HVLGLDK24
member 5 (Q9H3Z4)Galanin (P22466) 108LLDLPAAASSEDIERS123 Ser 117 5.06 41
Reproduced from Giorgianni et al. [18], with permission from Wiley-VCH, copyright 2004.

444 X. Zhan et al.
four isoforms was isoform 1 (87.5%) � isoform 2 (8.1%) � isoform 3 (3.3%) �isoform 4 (1.1%); a significant statistical difference was found among thoseisoforms. PTM analysis demonstrated that, among those 24 GH spots, some spotshad a measurably different pI, but the same Mr; that result could be due to thedeamidation of asparagine to aspartate that was identified with MALDI–TOF MS.That deamidation caused a change in charge. Other spots had a measurably dif-ferent Mr, but the same apparent pI; that result could be due to N-glycosylation,polymer formation, or proteolysis. MS/MS data demonstrated that the hGH in 1 ofthe 24 2D-gel spots was a phosphoprotein with three phosphate groups (Ser-77,
Table 3
Human pituitary nitroproteins determined by amino acid sequencing (SEQUEST; de novo) fromLC–MS/MS
Spot Protein Swiss-Prot Nitrotyrosyl Tyr SEQ- Interpretationnumber name number peptide nitration UEST
site (Xcorr)
1 Synaptosomal- O60641 228(K)GQC#KD 237 3.44 SEQUESTassociated ALEI*YK238
protein231KDALEI*YK238 237 de novo
2 Immunoglo- P24071 223(D)*YTTQNLIR230 223 1.87 SEQUESTbulin alphaFc receptor
223*YTTQNLIR230 223 de novo4 Immunoglo P24071 223(D)*YTTQNLIR230 223 1.95 SEQUEST
bulin alphaFc receptor
223*YTTQNLIR230 223 de novo14 Actin P03996 or 294(K)DL*YANNV 296 3.25 SEQUEST
P12718 or LSGGTTMYPGIP04270 ADR314
293(K)DL*YANNV 295LSGGTTMYPGIADR313
294(K)DL*YAN 296NVLSGGTTMYPGIADR314
15 cGMP- Q13237 352(K)GE*YFGEK 354 1.96 SEQUESTdependent ALI361
proteinkinase 2
352GE*YFGEK358 354 de novo
*Y: nitrotryrosine. C#: Cys-CAM. The bracket refers to the amino acid residue that preceded theN-terminus of the nitrated peptide. Reproduced from Zhan and Desiderio [19], with permissionfrom Elsevier Science (USA), copyright 2004.

The human pituitary proteome: clinical applications 445
Ser-132, and Ser-176). Further study is required to determine whether the ratio ofGH isoform changes in human pituitary adenoma compared to controls.
3.3. Challenge of comparative proteomics in the study of humanpituitary adenomas
The gel comparative proteomics method is highly reproducible (�98%), and is themost direct method to elucidate the complexity of systems that cause human pituitaryadenomas [2,12,16,17,30,31]. However, that gel-based system is challenged in termsof its ability to locate and characterize “all” tumor-related proteins [8,12,14,16]:
(i) Pituitary adenomas and control tissues cannot be obtained from the samepatient. An adenoma tissue is commonly obtained from neurosurgery, where-as a control pituitary is obtained from a postmortem autopsy; e.g., a deathfrom another disease, a gun-shot wound, or an accident. Thus, in order toobtain the DEPs between pituitary adenoma and control tissues, an accurateevaluation of the heterogeneity of different control pituitary tissue proteomesis needed as a function of gender, age, and race. We analyzed the hetero-geneity of a human pituitary proteome with eight control pituitaries [16]. Anexpanded number of samples is still needed for the heterogeneity analysis.
(ii) Most of the currently identified proteins in the 2DGE map of a pituitary ade-noma or control tissue are cytoplasmic, which is only one “window” into thecomplete proteome of a pituitary adenoma or a control tissue. That windowoccurs because only one protein-extraction protocol cannot extract “all” ofthe proteins from a pituitary because there are different classes of proteins—especially the hydrophobic proteins that include most of the membrane andnuclear proteins.
(iii) In all reviewed documents, the total proteins extracted from pituitary con-trol tissues or adenoma tissues were separated with 2DGE, based on a IPGstrip pH 3–10 NL. Although the pH range of an IPG strip is 3–10, most ofwell-separated protein spots in the 2DGE maps from pituitary control andadenoma were distributed in the area of pH 4–8 and Mr 15–100 kDa. Theextremely acidic (pI � 3.5 or 4)/basic (pI � 7.5 or 8) proteins and theextremely high-mass (�150 kDa) or low-mass (�10 kDa) proteins wereeither not well separated or cannot be separated. Thus, any DEPs that occurwithin those areas on a 2D gel were not detected.
(iv) The detection of low-abundance DEPs was limited in the current methoddue to two factors: (a) some low-abundance DEPs cannot be visualized withthe silver-stain method; (b) some low-abundance DEPs have been detected,but cannot be MS-characterized—possibly due to the small amount ofprotein in the gel spot. Other high-abundance proteins (albumin, hemoglobin,somatotropin, prolactin [12]) possibly hindered the separation of other low-abundance proteins; pre-separation is needed.

446 X. Zhan et al.
(v) A pituitary adenoma is monoclonal in origin, and a pituitary adenoma tissuesample should be a pure cell type. However, due to the limitations imposedon any neurosurgical method to obtain tissue, mixed cell types are obtained.A control pituitary tissue is usually obtained from a postmortem sourceand includes multiple cell types. Therefore, any accurate comparison ofproteomes between adenoma and control tissues is compromised.
Moreover, gel-based comparative proteomics were only used to analyze NFpituitary adenomas and prolactinomas. However, pituitary adenomas include dif-ferent cell types: GH, ACTH, TSH, PRL, and LH �FSH. Theoretically, for thosedifferent cell types of adenomas, not only could a common mechanism occur intheir formation, but also some differences could exist among the different celltypes of an adenoma. It is necessary to expand gel-based comparative proteomicsto other cell types of pituitary adenomas.
4. Discussion
4.1. Insights into the basic molecular mechanisms of pituitarytumor formation
Proteomics provides a unique insight on a global protein-system level into thebasic molecular mechanisms that participate in the formation of a pituitary adenoma.Through our series of comparative proteomics, we have confirmed our initial hypoth-esis that the proteome differs between pituitary controls and adenomas—manyDEPs were found that correlated to the comparative transcriptomics data andto the corresponding biological systems. Those protein systems summarized inTable 4 provide a hint of the multiple protein systems that are involved in theformation of a pituitary adenoma. Those DEPs provide a basis to determine theactivities that are critical for the observed changes in expression—whether theyoccur either at the mRNA or protein level or by PTM, and whether they areinvolved in the formation of a human pituitary adenoma.
Several protein systems that are discussed below connect some of the criticalaspects of pituitary adenoma formation: (i) The alteration of signal transductionsystems is significantly involved in the pathophysiological processes of pituitaryadenomas. We found that multiple signal pathways were changed, includingG-proteins, cytokine-receptors (IFG, IL, EGF, TGF, and IFN), some signal system-regulated enzymes (MAPK4, phospholipase A2-IB, and cAMP-dependent proteinkinase), etc. Other studies also found that G-proteins played important roles inpituitary tumors [35], and that members of the FGF family are implicated in pitu-itary tumorigenesis [36]. FGF receptor genes mediate FGF signaling, those genesencode receptor tyrosine kinases, and our DEP data also include a Tyr-proteinkinase. Moreover, phosphorylation significantly participates in the regulation ofsignal pathways, and we found a Ser/Thr protein phosphatase 2A. (ii) The changes

The human pituitary proteome: clinical applications 447
Table 4
List of biological systems, DEPs (n 56, Moreno et al. [32], Evans et al., in preparation), andDEGs (n 128, Evans et al. [38])
Systems DEPs DEGs
(A) Signal transduction(1) G-proteinsa G0 subunits 1, 2** G-protein
G-binding proteinRegulator of G-proteinsignaling 16Regulator of G-proteinbind signaling 2, 5Rho GTPase activatingprotein 5
(2) Cytokine-receptors(a) IGF IGF-binding IGF
IGF-bindingIGF-binding 5IGF-binding 3Protease Ser 11 IGF-binding
(b) IL Splice isoform IL-15(c) EGF EGF-containing fibulin
ECM protein 1(d) TGF TGF� receptor III(e) IFN Interferon-induced protein 56
(3) Signal-system enzymes MAPK 4Phospholipase A2-IBProtein kinase cAMP-dependent �
(4) Retinoic acid Cellular retinoic acid-binding protein 2
(5) Phosphorylation Ser/Thr proteinphosphatase 2A
(6) Others Rab GDP dissociation SH3-domain GRB2-like 2inhibitor alpha
XIST nuclear receptor 1, 3(B) DNA/mRNA 6N-adenosine RNA-binding protein 2
methylationa methyltransferase**
U4/U6-associated RNAsplicing factorEukaryotic translationinitiation factor 3–5
(C) Tumor genes(1) Oncogenes Neuroblastoma
over-expressed gene(2) Protooncogenesa Protooncogene Tyr protein
kinase FYN**
L-myc-1 protooncogene protein(3) Tumor suppressor Tumor rejection antigen
genes (endoplasmin)
(continues)

448 X. Zhan et al.
of endocrine hormone levels are an important clinical feature of pituitaryadenomas. We found that multiple hormones were altered, including GH, PRL,FSH, LH, and TSH. The synthesis and secretion of each hormone is tightly regu-lated by multiple signaling and related factors. For example, cGMP-dependentprotein kinase and NO significantly regulate the signal process of water-solublehormones. Recently, we found [19] that the cGMP-dependent protein kinase 2 wasnitrated in human pituitary control tissues; those data hint that the nitration of acGMP-dependent protein kinase might mediate the signal processing of water-soluble hormones. (iii) Oxidative/nitrative stresses are involved in a variety of
(D) Hormones(1) PRL Prolactin PRL(2) GH Somatotropin GHRH receptor(3) FSH FSH, �(4) LH LH, �(5) TSH TSH, �
(E) Excitatory Secretagogin Reticulocalbin l, EF-hand(tachykinins) calcium-binding domain
Peptidylglycine �-amidatingmonooxygenase
(F) Reactive-oxygen species(1) HSP HSP27 HSP 105 kDa(2) Cytochrome P450 Cytochrome P450, III A(3) GST GST�-2(4) Peroxidase Phospholipid hydroperoxide
glutathione peroxidase(G) Energy ATP synthase, ATPase
mitochondrialATP-binding protein
(H) Immune system Ig �, � IgGCD58Pre-B cell leukemiatranscription factor 3MHC class 1
(I) Cell cycle (G1–S–G2–M) Death-associated proteinFolate receptor C1
(J) Transcription factors Pit 1Basic transcription factor 3
(K) Intermediate filaments Vimentin Vimentin
**The identified DEP was confirmed by publication data.a Publication data indicated that G-protein [35], methylation [37], c-myc [39], PTTG, gsp, ccnd1 [39],FGF [36], Men-1, Prop-1 [39], c-jun, Fos, and angiogenesis were related to pituitary adenomas.
Table 4
Continued
Systems DEPs DEGs

The human pituitary proteome: clinical applications 449
tumorigenesis mechanisms. Our studies demonstrated that many reactive-oxygenspecies (ROS)-related proteins were changed in human pituitary adenomas, includ-ing heat shock protein, cytochrome P450, GST, and phospholipid hydroperoxidegluta-thione peroxidase. (iv) DNA methylation has been studied in pituitary tumors[37]; we found a methylation-related DEP (Table 4), and a methylation-relatedDEG was published [32,38]. (v) Oncogene activation in pituitary tumors (such asc-Myc) was studied [39]; we found protooncogene-related DEPs (Table 4), andrelated DEGs were published [32,38].
Those data reveal an overview of multiple protein systems that could participatein human pituitary adenomas.
4.2. Discovery of potential biomarkers related to pituitary adenomas
Those DEPs (Table 1) that were identified by comparative proteomics andcomparative transcriptomics studies constitute our novel source of candidate bio-markers [2,32]—for example, secretagogin [17]. Secretagogin is a neuroendocrineand pancreatic islet of Langerhans-specific Ca2�-binding protein [40] that is alsoexpressed in a high quantity in the secretory neurons of the anterior pituitary [41].Secretagogin transfection lowered the growth rate of RIN-5F tumor cells [40] bydown-regulating the transcription of the excitatory amino acid substance P (SP).The latter finding is consistent with our working hypothesis [42–46] that animbalance between excitatory (tachykinin) and inhibitory (opioid) neuropeptidergicsystems could contribute to the formation of a human pituitary macroadenoma. Thecomparative proteomics and the comparative transcriptomics analyses [17] bothdemonstrated that secretagogin was significantly down-regulated in a set of humanNF pituitary adenomas with a statistically significant difference ( p � 0.05) (Figs. 8and 9). Moreover, the secretagogin protein expression correlated significantly withits mRNA expression. Further analyses will be needed to determine whethersecretagogin plays an important role in the formation of a pituitary adenoma and inpituitary hormone secretion.
4.3. Pituitary hormone isoforms in human pituitary adenomas
Protein isoforms result from protein PTMs, splicing, etc. Our comparative pro-teomics study of human pituitary adenomas demonstrated that human pituitaryhormones had multiple isoforms. The change of a neuroendocrine hormone levelis an important clinical feature in a human pituitary adenoma. Not all of theisoforms are related to pituitary adenomas [32].
Somatotropin was significantly down-regulated at the protein and the mRNAlevels in the NF pituitary adenoma [32] and in prolactinomas (Evans et al., inpreparation); that finding is consistent with their monoclonal composition inorigin [9,10]—a NF adenoma generated from gonadotrophs, and a prolactinoma

450 X. Zhan et al.
33
27
255.55.04.0
33
30
27
255.55.04.0
33
30
27
255.55.04.0
33
30
27
255.55.04.0
33
30
27
255.55.04.0
33
30
27
255.55.04.0
IEF (pl: pH)
IEF (pl: pH)
SD
S-P
AG
E(M
r : kDa)
SD
S-P
AG
E(M
r : kDa)
A B C
D E F
30
Fig. 8. Quantitative analysis of secretagogin that is contained in a differential protein spot (seearrow) in human non-functional pituitary adenoma 2D gels compared to control pituitary 2D gels(Zhan et al. [17]). (A) Control (C7-5); (B) NF� adenoma (T217-2); (C) LH� adenoma (T204-2);(D) FSH� adenoma (T57-3); (E) FSH� � LH� adenoma (T65-1); (F) unknown cell type adenoma(T2-1). The extracted total proteins from each human pituitary adenoma or each control samplewere 2DGE-separated. The first-dimension IEF was performed with 18 cm IPG strip pH 3–10 NL.The second-dimension SDS–PAGE was performed with 12% PAGE resolving gel. The silver-stained 2D gel was digitized, and analyzed with PDQuest 2D image analysis software. The totaldensity in a gel image was used to normalize each spot volume in the gel image to minimize theeffect of any experimental factors on spot volume. Reproduced from Zhan et al. [17], withpermission from Kluwer Academic Publishers, copyright 2003.
from lactotrophs; the GH receptor gene was unchanged. Those data showed thatGH hyposecretion in NF adenoma results from the hypoexpression of the GHgene. However, the more important finding is that the multiple GH isoforms (17spots contain somatotropin) were detected ([32], Evans et al., in preparation);those data cannot be interpreted by the transcriptomics method. The down-regu-lated ratio of the different GH isoforms was different in each cell type of pituitaryadenoma relative to the controls. Those data suggested that the proportion of thedifferent GH isoforms changed in each cell type adenoma compared to controls.Other researchers showed that the proportion of the circulating GH isoformsignificantly changed in pituitary adenomas and other pituitary diseases [47,48].The proportional change of the different GH isoforms might have an importantvalue in the clinical evaluation of human pituitary adenomas. Recently, we foundthat GH isoforms were derived from a variety of splicing variants and PTMs,including phosphorylation. The phosphorylation of endogenous GH in the humanpituitary [18,34] provided us with new insights into the mechanisms of growthhormone that participate in the neuroendocrine signal pathways.

The human pituitary proteome: clinical applications 451
Prolactin is another important pituitary hormone. We detected six prolactin iso-forms with our proteomics method ([32], Evans et al., in preparation). Similar toGH, each prolactin isoform was down-regulated in each cell type NF adenoma, witha different down-regulated ratio relative to controls. There was no significantexpression change of the prolactin gene at the protein and mRNA levels in theprolactinoma relative to controls; that finding is consistent with a prolactinoma’smonoclonal composition in origin. However, the proportion of six prolactin iso-forms changed in prolactinomas compared to controls. Other researchers showedthat glycosylation is an important prolactin modification [49] that produces differ-ent isoforms; glycosylation of human prolactin may down-regulate its hormonebioactivity and promote its metabolic clearance [50]. Other studies showed that themain variant of prolactin was the non-glycosylated form of PRL in humanprolactinomas [51]; that finding is consistent with our result that some prolactin iso-forms (Evans et al., in preparation) were down-regulated in prolactinomas comparedto controls. Thus, we speculated that the prolactin isoform in those down-regulatedspots is possibly a glycosylated prolactin.
Therefore, our detailed study of the different isoforms and PTMs of GH andprolactin could lead to new insights into the clinical importance of pituitary hor-mones in the formation of a pituitary adenoma (see Section 2). The ratio of thechange of each isoform in human pituitary tissue has value for clinical research.
Fig. 9. Statistical analysis of secretagogin that was differentially expressed in human non-functionalpituitary adenomas and controls (Zhan et al. [17]). The volume of each silver-stained 2D gel spotwas quantified with PDQuest 2D-image software. Each 2D gel spot volume was normalized withthe total density in a gel image. The normalized spot volume represented the content of each pro-tein in a pituitary adenoma or control. The normalized spot volume was used to analyze the differ-ential expression. The number of samples is labeled in the figure. (���) p � 0.001; (��) p �0.01; (�) p � 0.05. Reproduced from Zhan et al. [17], with permission from Kluwer AcademicPublishers, copyright 2003.

452 X. Zhan et al.
For example, could a change in the ratios of the prolactin isoforms be a potentialindex for diagnostics and prognostics of a prolactinoma patient? Could analteration of circulating GH isoforms be a potential index for diagnostics andprognostics of a GH adenoma patient?
5. Future trends
5.1. Combination of gel-proteomics and non-gel quantitative proteomics
Proteomics generally includes gel-based methods and non-gel-based methods.Each method has its unique set of advantages and disadvantages, including detec-tion sensitivity, the total separation of all proteins, dynamic range, and a limitedability to detect all proteins in a proteome. 2DGE is currently the only techniquethat can be routinely applied for the parallel quantitative expression profiling oflarge sets of complex protein mixtures from human tissues, and that can deliver amap of intact proteins that reflects any change in the protein expression level,isoforms, or PTMs. 2DGE is in contrast to LC–MS/MS methods, which analyzepeptides, where Mr and pI information is lost, and where stable isotope-labeling isrequired for quantitative analysis [52]. For human tissue comparative proteomicsanalysis, non-gel methods are not yet sufficiently reproducible; therefore, gel-basedmethods are imperative to study a complex human tissue proteome, and to archivethe proteome from precious human post-surgical pituitary adenoma tissue samples.However, LC–MS/MS quantitative proteomics systems might overcome some ofthe limitations of gel-based comparative proteomics such as the location, detection,and characterization of low-abundance, extremely acidic ( pI � 3.5)/basic ( pI � 8),and extremely high-mass (�150 kDa)/ low-mass (�10 kDa) proteins [14].Therefore, the combination of gel and non-gel-proteomics is needed to studyhuman pituitary proteomes.
5.2. Comparative proteomics studies of PTM proteins in humanpituitary adenomas
The PTM of a protein is an important factor in a cell and in proteomics [53], andcannot be detected with genomics or transcriptomics methods due to the manyfactors that are involved in the complex, multistep process DNA → mRNA →protein. A single gene could generate multiple gene products, PTM occurs in themajority of proteins, and the covalent alteration of a protein is not coded by thegene. A PTM is an important mechanism to maintain the structure of a protein, andto perform the wide range of functions of a protein. The number of documentedprotein PTMs is 351 (January 2005) in a database of protein PTM (http://www.abrf.org/index.cfm/dm.home?AvgMassall).

The human pituitary proteome: clinical applications 453
Because of the important roles of phosphorylation, glycosylation, and nitrationin the human body, phosphoproteomics [54], glycoproteomics [55,56], and nitropro-teomics [19–21] have all emerged as rapidly increasing fields in proteomics. Wehave qualitatively analyzed phosphoproteins [18] and nitroproteins [19–21] inhuman pituitary control or adenoma proteomes. However, global comparative phos-phoproteomics and comparative nitroproteomics are needed to discover any differ-entially expressed phosphoproteins and nitroproteins that might be related to humanpituitary adenomas.
5.3. Integration of proteomics and transcriptomics to study humanpituitary adenomas
Even though a proteome is much more complex than either a transcriptome or agenome due to a wide array of PTMs, protein translocations, protein–proteininteractions, protein regulations, etc., the proteome, transcriptome, and genome arehighly complementary systems. It is important to compare genomic, transcriptomic,and proteomic data to comprehensively clarify the basic molecular mechanisms thatparticipate in the formation of a pituitary adenoma, and to discover any specificbiomarkers for an early stage diagnosis, therapeutics, and prognosis of a humanpituitary adenoma. Also, the combination of those three diverse methodologies,which has been referred as “operomics” [57,58], is necessary because each methodhas its own unique advantages and disadvantages, and each method provides uniquemolecular information. Recently, a combined comparative proteomics and compar-ative transcriptomics study was performed in human pituitary NF adenomas andprolactinomas. Nine genes demonstrated consistent changes at the mRNA andprotein levels in human pituitary adenomas (Table 1). An expanded integrated“omics” study will be needed for the other types of pituitary adenomas.
5.4. Protein chips coupled with mass spectrometry to study humanpituitary adenomas
A protein biochip is the counterpart of the array technology in the genomics field.Currently, the Ciphergen’s ProteinChip® array surface-enhanced laser desorption-ionization (SELDI) MS system is available [59]. Chips with a broad range ofbinding properties, including immobilized metal affinity capture, and withbiochemically characterized surfaces, such as antibodies and receptors, form thecore of SELDI. Once the target proteins are captured on a SELDI protein biochiparray, the proteins are detected with MALDI–TOF MS. A retentate map (proteinsretained on the chip) is generated in which the individual protein is displayed as sep-arate peaks on the basis of their mass-to-charge ratio (m/z). ProteinChip SELDI–MScould possibly be used to identify known biomarkers in a cancer, and to discoverany potential markers that are either over- or under-expressed in a cancer. Protein

454 X. Zhan et al.
chip-based MS techniques could facilitate the screening, diagnostics, and prognos-tics of human pituitary adenomas. In order for SELDI to be an accurate method, itis crucial to rigorously and accurately regulate the physicochemistry that occurs ona SELDI probe surface. For example, one must calculate the ratio of the totalnumber of moles of ionizable groups in all of the proteins in a sample to the totalnumber of moles of interacting sites on the surface of a SELDI probe.
6. Conclusions
The elucidation of the molecular mechanisms that participate in the formation of apituitary adenoma, and the discovery of any specific biomarker, are critical goals inany human pituitary adenoma study. Proteomics is valuable in that type of studybecause the proteome reflects the intrinsic genetic program of the cell and the impactof its immediate environment; therefore, a proteome could be used to identifypotential biomarkers for adenoma early diagnosis, monitor disease progression, andidentify therapeutic targets. Human pituitary proteomics has made importantprogress in several different areas [14]. The 2DGE-based comparative proteomicsanalysis system has been optimized and established for a human pituitary adenomastudy.Somesignificantpituitaryproteomicsdatahavebeenobtained: a2Dgelproteinreference map [12,15], the heterogeneity of a human pituitary proteome [16], the DEPprofile associated with pituitary adenomas ([2,32], Evans et al., in preparation), apotential biomarker [17], the qualitative analysis of the phosphoproteome and nitro-proteome in the human pituitary [18–21], and the integration of proteomic andtranscriptomic data in human pituitary NF adenoma [2,32].
The overall progress of human pituitary proteomics is encouraging. In terms ofthe fact that the pituitary is the most well-protected tissue in the body, that thepituitary is the most critical neuroendocrine regulatory center, that pituitary pro-teomics is still in its infancy, and that proteomics is becoming an active field witha significant impact on neuroendocrinology, many issues of human pituitary pro-teomics remain to be improved and developed to their full potential for its clinicalapplication. The current 2DGE method will remain one of the most suitableapproaches to systematically characterize the differential proteome in the differentcell types of human pituitary adenomas because of its wide availability, excellentreproducibility, ease of use, effectiveness, and low cost. Non-gel quantitativeproteomics will complement gel-proteomics methods to expand the differentialproteome coverage in a human pituitary adenoma. The comparative proteomicsstudies of PTM proteins will directly provide functional DEPs related to humanpituitary adenomas. The integration of comparative proteomics and transcrip-tomics will provide global insights into the molecular processes of each DEP inhuman pituitary adenomas, and will provide important clues to the discovery ofpotential biomarkers for the clinical evaluation and accurate molecular treatmentof human pituitary tumors.

The human pituitary proteome: clinical applications 455
Acknowledgments
The authors gratefully acknowledge the financial assistance (to DMD) from theNational Institutes of Health (NS 42843, RR 10522, RR 14593, RR 016679, and DA)and the National Science Foundation (DBI 9604633). The scientific contributionsof Francesco Giorgianni, Sarka Beranova-Giorgianni, Haibao Wan, Xianglin Yuan,Nelson M. Oyesiku, and Chheng-Orn Evans are acknowledged.
References
1. Lander, E.S., Linton, L.M., Birren, B., Nusbaum, C., Zody, M.C., Baldwin, J., Devon, K.,Dewar, K., Doyle, M., FitzHugh, W., Funke, R., Gage, D., Harris, K., Heaford, A., Howland,J., Kann, L., Lehoczky, J., LeVine, R., McEwan, P., McKernan, K., Meldrim, J., Mesirov, J.P.,Miranda, C., Morris, W., Naylor, J., Raymond, C., Rosetti, M., Santos, R., Sheridan, A.,Sougnez, C., Stange-Thomann, N., Stojanovic, N., Subramanian, A., Wyman, D., Rogers, J.,Sulston, J., Ainscough, R., Beck, S., Bentley, D., Burton, J., Clee, C., Carter, N., Coulson, A.,Deadman, R., Deloukas, P., Dunham, A., Dunham, I., Durbin, R., French, L., Grafham, D.,Gregory, S., Hubbard, T., Humphray, S., Hunt, A., Jones, M., Lloyd, C., McMurray, A.,Matthews, L., Mercer, S., Milne, S., Mullikin, J.C., Mungall, A., Plumb, R., Ross, M.,Shownkeen, R., Sims, S., Waterston, R.H., Wilson, R.K., Hillier, L.W., McPherson, J.D.,Marra, M.A., Mardis, E.R., Fulton, L.A., Chinwalla, A.T., Pepin, K.H., Gish, W.R., Chissoe,S.L., Wendl, M.C., Delehaunty, K.D., Miner, T.L., Delehaunty, A., Kramer, J.B., Cook, L.L.,Fulton, R.S., Johnson, D.L., Minx, P.J., Clifton, S.W., Hawkins, T., Branscomb, E., Predki, P.,Richardson, P., Wenning, S., Slezak, T., Doggett, N., Cheng, J.F., Olsen, A., Lucas, S., Elkin, C.,Uberbacher, E., Frazier, M., Gibbs, R.A., Muzny, D.M., Scherer, S.E., Bouck, J.B.,Sodergren, E.J., Worley, K.C., Rives, C.M., Gorrell, J.H., Metzker, M.L., Naylor, S.L.,Kucherlapati, R.S., Nelson, D.L., Weinstock, G.M., Sakaki, Y., Fujiyama, A., Hattori, M.,Yada, T., Toyoda, A., Itoh, T., Kawagoe, C., Watanabe, H., Totoki, Y., Taylor, T., Weissenbach,J., Heilig, R., Saurin, W., Artiguenave, F., Brottier, P., Bruls, T., Pelletier, E., Robert, C.,Wincker, P., Smith, D.R., Doucette-Stamm, L., Rubenfield, M., Weinstock, K., Lee, H.M.,Dubois, J., Rosenthal, A., Platzer, M., Nyakatura, G., Taudien, S., Rump, A., Yang, H., Yu, J.,Wang, J., Huang, G., Gu, J., Hood, L., Rowen, L., Madan, A., Qin, S., Davis, R.W., Federspiel,N.A., Abola, A.P., Proctor, M.J., Myers, R.M., Schmutz, J., Dickson, M., Grimwood, J., Cox,D.R., Olson, M.V., Kaul, R., Raymond, C., Shimizu, N., Kawasaki, K., Minoshima, S., Evans,G.A., Athanasiou, M., Schultz, R., Roe, B.A., Chen, F., Pan, H., Ramser, J., Lehrach, H.,Reinhardt, R., McCombie, W.R., de la Bastide, M., Dedhia, N., Blocker, H., Hornischer, K.,Nordsiek, G., Agarwala, R., Aravind, L., Bailey, J.A., Bateman, A., Batzoglou, S., Birney, E.,Bork, P., Brown, D.G., Burge, C.B., Cerutti, L., Chen, H.C., Church, D., Clamp, M., Copley,R.R., Doerks, T., Eddy, S.R., Eichler, E.E., Furey, T.S., Galagan, J., Gilbert, J.G., Harmon, C.,Hayashizaki, Y., Haussler, D., Hermjakob, H., Hokamp, K., Jang, W., Johnson, L.S., Jones,T.A., Kasif, S., Kaspryzk, A., Kennedy, S., Kent, W.J., Kitts, P., Koonin, E.V., Korf, I., Kulp,D., Lancet, D., Lowe, T.M., McLysaght, A., Mikkelsen, T., Moran, J.V., Mulder, N., Pollara,V.J., Ponting, C.P., Schuler, G., Schultz, J., Slater, G., Smit, A.F., Stupka, E., Szustakowski, J.,Thierry-Mieg, D., Thierry-Mieg, J., Wagner, L., Wallis, J., Wheeler, R., Williams, A., Wolf,Y.I., Wolfe, K.H., Yang, S.P., Yeh, R.F., Collins, F., Guyer, M.S., Peterson, J., Felsenfeld, A.,Wetterstrand, K.A., Patrinos, A., Morgan, M.J., de Jong, P., Catanese, J.J., Osoegawa, K.,Shizuya, H., Choi, S., Chen, Y.J.; International Human Genome Sequencing Consortium.Initial sequencing and analysis of the human genome. Nature, 409, 860–921 (2001).

456 X. Zhan et al.
2. Desiderio, D.M. and Zhan, X., The human pituitary proteome: the characterization of differen-tially expressed proteins in an adenoma compared to a control. Cell. Mol. Biol., 49, 689–712(2003).
3. Wilkins, M.R., Sanchez, J.C., Golley, A.A., Appel, R.D. HumpherySmith, I., Hochstrasser, D.F.and Williams, K.L., Progress with proteome projects: why all proteins expressed by a genomeshould be identified and how to do it. Biotechnol. Genet. Eng. Rev., 13, 19–50 (1996).
4. Gygi, S.P., Rochon, Y., Franza, B.R. and Aebersold, R., Correlation between protein andmRNA abundance in yeast. Mol. Cell Biol., 19, 1720–1730 (1999).
5. Anderson, L. and Seilhamer, J., A comparison of selected mRNA and protein abundances inhuman liver. Electrophoresis, 18, 533–537 (1997).
6. Godovac-Zimmermann, J. and Brown, L.R., Perspectives for mass spectrometry and func-tional proteomics. Mass Spectrom. Rev., 20, 1–57 (2001).
7. Adam, G.C., Sorensen, E.J. and Cravatt, B.F., Chemical strategies for functional proteomics.Mol. Cell Proteomic., 1, 781–791 (2002).
8. Melmed, S., Mechanisms for pituitary tumorigenesis: the plastic pituitary. J. Clin. Invest., 112,1603–1618 (2003).
9. Alexander, J.M., Biller, B.M., Bikkal, H., Zervas, N.T., Amold, A. and Klibanski, A., Clinicallynonfunctioning pituitary tumors are monoclonal in origin. J. Clin. Invest., 86, 336–340 (1990).
10. Herman, V., Fagin, J., Gonsky, R., Kovacs, K. and Melmed, S., Clonal origin of pituitaryadenomas. J. Clin. Endocrinol. Metab., 71, 1427–1433 (1990).
11. Asa, S.L., The pathology of pituitary tumors. Endocrinol. Metab. Clin. North Am., 28, 13–43(1999).
12. Zhan, X. and Desiderio, D.M., A reference map of a human pituitary adenoma proteome.Proteomics, 3, 699–713 (2003).
13. Medzihradszky, K.F., Campbell, J.M., Baldwin, M.A., Falick, A.M., Jahasz. P., Vestal, M.L.and Burlingame, A.L., The characteristics of peptide collision-induced dissociation using ahigh-performance MALDI–TOF/TOF tandem mass spectrometer. Anal. Chem., 72, 552–558(2000).
14. Zhan, X. and Desiderio, D.M., Comparative proteomics analysis of human pituitary adeno-mas: current status and future perspectives. Mass Spectrom. Rev., 24, 783–813 (2005).
15. Beranova-Giorgianni, S., Giorgianni, F. and Desiderio, D.M., Analysis of the proteome in thehuman pituitary. Proteomics, 2, 534–542 (2002).
16. Zhan, X. and Desiderio, D.M., Heterogeneity analysis of the human pituitary proteome. Clin.Chem., 49, 1740–1751 (2003).
17. Zhan, X., Evans, C.O., Oyesiku, N.M. and Desiderio, D.M., Proteomics and transcriptomicsanalyses of secretagogin down-regulation in human non-functional pituitary adenoma.Pituitary, 6, 189–202 (2003).
18. Giorgianni, F., Beranova-Giorgianni, S. and Desiderio, D.M., Identification and characteriza-tion of phosphorylated proteins in human pituitary. Proteomics, 4, 587–598 (2004).
19. Zhan, X. and Desiderio, D.M., The human pituitary nitroproteome: detection of nitrotyrosyl-proteins with two-dimensional Western blotting, and amino acid sequence determination withmass spectrometry. Biochem. Biophys. Res. Commun., 325, 1180–1186 (2004).
20. Zhan, X. and Desiderio, D.M., Nitroproteins from a human pituitary adenoma tissue discov-ered with a nitrotyrosine affinity column and tandem mass spectrometry. Anal. Biochem., 354,279–289 (2006).
21. Zhan, X. and Desiderio, D.M., Linear ion-trap mass spectrometric characterization of humanpituitary nitrotyrosine-containing proteins. Int. J. Mass Spectrom., 259, 96–104 (2007).
22. Nelson, R.W., Nedelkov, D. and Tubbs, K.A., Biosensor chip-mass spectrometry: a chip-basedproteomics approach. Electrophoresis, 21, 1155–1163 (2000).

The human pituitary proteome: clinical applications 457
23. Burgus, R., Dunn, T.F., Desiderio, D.M., Ward, D.N., Vale, W. and Guillemin, R.,Characterization of ovine hypothalamic hypophysiotropic TSH-releasing factor. Nature, 226,321–325 (1970).
24. Yalow, R.S. and Berson, S., Immunoassay of endogenous plasma insulin in man. J. Clin.Invest., 39, 1157–1175 (1960).
25. Yalow, R.S., Radioimmunoassay: a probe for the fine structure of biologic systems. Science,200, 1236–1245 (1978).
26. Zhu, H., Bilgin, M. and Snyder, M., Proteomics. Annu. Rev. Biochem., 72, 783–812 (2003).27. Ezzat, S., Pituitary tumor pathogenesis—the hunt for novel candidate genes continues. J. Clin.
Endocrinol. Metab., 88, 5116–5118 (2003).28. Liu, E.T. and Karuturi, K.R., Microarrays and clinical investigations. N. Engl. J. Med., 350,
1597–1599 (2004).29. Herbert, B., Advances in protein solubilisation for two-dimensional electrophoresis.
Electrophoresis, 20, 660–663 (1999).30. Zhan, X. and Desiderio, D.M., Differences in the spatial and quantitative reproducibility
between two second-dimensional gel electrophoresis systems. Electrophoresis, 24, 1834–1846(2003).
31. Zhan, X. and Desiderio, D.M., Spot volume vs. amount of protein loaded onto a gel: a detailed,statistical comparison of two gel electrophoresis systems. Electrophoresis, 24, 1818–1833 (2003).
32. Moreno, C.S., Evans, C.O., Zhan, X., Okor, M., Desiderio, D.M. and Oyesiku, N.M., Novelmolecular signaling and classification of human clinically nonfunctional pituitary adenomasidentified by gene expression profiling and proteomic analyses. Cancer Res., 65, 10214–10222 (2005).
33. Beranova-Giorgianni, S., Zhao, Y., Desiderio, D.M. and Giorgianni, F., Phosphoproteomicanalysis of the human pituitary. Pituitary, 9, 109–120 (2006).
34. Zhan, X., Giorgianni, F. and Desiderio, D.M., The proteomics analysis of growth hormoneisoforms in human pituitary. Proteomics, 5, 1228–1241 (2005).
35. Lania, A., Montovani, G. and Spada, A., Genetics of pituitary tumors: focus on G-proteinmutations. Exp. Biol. Med., 228, 1004–1007 (2003).
36. Ezzat, S., Zheng, L., Zhu, X.F., Wu, G.E. and Asa, S.L., Targeted expression of a human pitu-itary tumor-derived isoform of FGF receptor-4 recapitulates pituitary tumorigenesis. J. Clin.Invest., 109, 69–78 (2002).
37. Alexander, J., Tumor suppressor loss in pituitary tumors. Brain Pathol., 11, 342–355 (2001).38. Evans, C.O., Young, A.N., Brown, M.R., Brat, D.J., Parks, J.S., Neish, A.S. and Oyesiku,
N.M., Novel patterns of gene expression in pituitary adenomas identified by complementarydeoxyribonucleic acid microarrays and quantitative reverse transcription-polymerase chainreaction. J. Clin. Endocrinol. Metab., 86, 3097–3107 (2001).
39. Yu, R. and Melmed, S., Oncogene activation in pituitary tumors. Brain Pathol., 11, 328–341(2001).
40. Wagner, L., Oliyarnyk, O., Gartner, W., Nowotny, P., Groeger, M., Kaserer, K., Waldhausl, W.and Pasternack, M.S., Cloning and expression of secretagogin, a novel neuroendocrine- andpancreatic islet of Langerhans-specific Ca2�-binding protein. J. Biol. Chem., 275,24740–24751 (2000).
41. Gartner, W., Lang, W., Leutmetzer, F., Domanovits, H., Waldhausl, W. and Wagner, L.,Cerebral expression and serum detectability of secretagogin, a recently cloned EF-hand Ca2�-binding protein. Cereb. Cortex, 11, 1161–1169 (2001).
42. Desiderio, D.M., Kusmierz, J.J., Zhu, X., Dass, C., Hilton, D., Robertson, J.T. and Sacks, H.S.,Mass spectrometric analysis of opioid and tachykinin neuropeptides in non-secreting andACTH-secreting adenomas. Biol. Mass Spectrom., 22, 89–97 (1993).

458 X. Zhan et al.
43. Zhu, X. and Desiderio, D.M., Methionine enkephalin-like immunoreactivity, substance P-likeimmunoreactivity and beta-endorphin-like immunoreactivity post-mortem stability in ratpituitary. J. Chromatogr., 616, 175–187 (1993).
44. Zhu, X. and Desiderio, D.M., Effects of space flight stress on proopiomelanocortin,proenkephalin A, and tachykinin neuropeptidergic systems in the rat posterior pituitary. LifeSci., 55, 347–350 (1994).
45. Zhu, X., Robertson, J.T., Sacks, H.S., Dohan Jr., C., Tseng, J.L. and Desiderio, D.M., Opioidand tachykinin neuropeptides in prolactin-secreting human pituitary adenomas. Peptides, 16,1097–1107 (1995).
46. Desiderio, D.M., Mass spectrometric analysis of neuropeptidergic systems in the human pitu-itary and cerebrospinal fluid. J. Chromatogr. B Biomed. Sci. Appl., 731, 3–22 (1999).
47. Boguszewski, C.L., Johannsson, G., Bengtsson, B.A., Johansson, A., Carlsson, B. andCarlsson, L.M., Circulating non-22-kilodalton growth hormone isoforms in acromegalic menbefore and after transsphenoidal surgery. J. Clin. Endocrinol. Metab., 82, 1516–1521 (1997).
48. Boguszewski, C.L., Jansson, C., Boguszewski, M.C., Rosberg, S., Carlsson, B., Albertsson-Wikland, K. and Carlsson, L.M., Increased proportion of circulating non-22-kilodalton growthhormone isoforms in short children: a possible mechanism for growth failure. J. Clin.Endocrinol. Metab., 82, 2944–2949 (1997).
49. Gambino, G.M., Beck-Peccoz, P., Borgato, S., Faglia, G., Spada, A. and Persani, L.,Bioactivity and glycosylation of circulating prolactin in various physiological and pathologi-cal conditions. Pituitary, 2, 225–231 (1999).
50. Hoffmann, T., Penel, C. and Ronin, C., Glycosylation of human prolactin regulates hormonebioactivity and metabolic clearance. J. Endocrinol. Invest., 16, 807–816 (1993).
51. Hoffmann, T., Gunz, G., Brue, T., Jaquet, P. and Ronin, C., Prolactin isoforms secreted byhuman prolactinomas. Horm. Res., 38, 164–170 (1992).
52. Görg, A., Weiss, W. and Dunn, M.J., Current two-dimensional electrophoresis technology forproteomics. Proteomics, 4, 3665–3685 (2004).
53. Mann, M. and Jensen, O.N., Proteomic analysis of post-translational modifications. Nat.Biotechnol., 21, 255–261 (2003).
54. Kalume, D.E., Molina, H. and Pandey, A., Tackling the phosphoproteome: tools and strategies.Curr. Opin. Chem. Biol., 7, 64–69 (2003).
55. Vosseller, K., Wells, L. and Hart G.W., Nucleocytoplasmic O-glycosylation: O-GlcNAc andfunctional proteomics. Biochimie, 83, 575–581 (2001).
56. Wells, L., Vosseller, K., Cole, R.N., Cronshaw, J.M., Matunis, M.J. and Hart, G.W., Mappingsites O-GlcNAc modification using affinity tags for serine and threonine post-translationalmodifications. Mol. Cell Proteomic., 1, 791–804 (2002).
57. Hanash, S.M., Operomics: molecular analysis of tissues from DNA to RNA to protein. Clin.Chem. Lab. Med., 38, 805–813 (2000).
58. Hanash, S.M., Bobek, M.P., Rickman, D.S., Williams, T., Rouillard, J.M., Kuick, R. andPuravs, E., Integrating cancer genomics and proteomics in the post-genome era. Proteomics,2, 69–75 (2002).
59. Merchant, M. and Weinberger, S.R., Recent advancements in surface-enhanced laserdesorption/ionization-time of flight-mass spectrometry. Electrophoresis, 21, 1164–1167 (2000).

Medical Applications of Mass SpectrometryK. Vékey, A. Telekes and A. Vertes (editors)© 2008 Elsevier B.V. All rights reserved
459
Chapter 20
Mass spectrometry of proteinousallergens inducing human diseases
MARTINA MARCHETTIa, JASMIN HIRSCHMANNa, ELISABETHFÖRSTER-WALDLb, and GÜNTER ALLMAIERa,*
aInstitute of Chemical Technologies and Analytics, Vienna University of Technology,Vienna, AustriabDepartment of Paediatrics and Juvenile Medicine, Medical University of Vienna,Vienna, Austria
1. Introduction 4591.1. Highlights for medical professionals 4621.2. Highlights for chemists 463
2. Methodology 4653. Mass spectrometric identification of proteinous allergens 4694. Future trends 4775. Conclusions 479References 480
1. Introduction
Allergies are unpleasant ailments and actually, in some cases, acute life-threateningdiseases. The term “allergy” (from Greek allos—other and ergon—reaction) wasfirst mentioned 100 years ago by an Austrian pediatrician named Clemens vonPirquet in 1906 [1]. He noticed that some of his vaccinated patients had moresevere reactions to ongoing treatment and followed this to be a response to outsideelicitors. Since this observation hypersensitivities were thought to result fromunpredictable actions of immunoglobulins and in 1963 Gell and Coombs [2]proposed a classification of hypersensitivity reactions dividing these reactions into
*Corresponding author. Tel.: �43 158801 15160; Fax: �43 158801 15199. E-mail: [email protected] (G. Allmaier).

460 M. Marchetti et al.
four subgroups (types I to IV) representing the main strategies a body uses tocombat different classes of infectious agents. These classes, extended by a fifth one(type V) introduced in 2003 by Rajan [3], are widely accepted today. To understandthe mechanisms of “allergic reactions” the corresponding elicitors have to beinvestigated more precisely. On this account great effort has already been put intothe understanding of hypersensitivities against natural rubber latex products sincethe number of affected people has increased dramatically after the first case wasreported in 1979 [4]. It was found that the most frequent triggers are accelerators,color pigments, preserving agents, or other organic components used during theproduction processes. Today, gas chromatography combined with mass spectrom-etry (GC–MS) is typically used for the determination and quantification of theseallergological relevant compounds in disposable gloves [5]. Nevertheless, it wasclear that not only these molecules but also proteins are responsible for immuneresponses. The principal proteinous allergy elicitor, a 14 kDa protein named rubberelongation factor (REF), was first described in 1993 on the amino acid sequencelevel after tryptic digestion and Edman degradation [6], and in 1989 fast-atombombardment (FAB) mass spectrometry was first applied to determine molecularweights of enzymatically obtained peptides from REF [7]. Only recently, matrix-assisted laser desorption/ionization (MALDI) and nanoelectrospray ionization(nano-ESI) mass spectrometry in combination with enzymatic digestion after gelelectrophoresis, a typical proteomics approach, were applied to show that REFbesides a truncated form is present in commercially available latex gloves [8].
The predominant elicitor in a latex protein fraction with proteins smaller than10 kDa is the so-called hevein, a 4.7 kDa polypeptide. Its IgE binding capacitywas first demonstrated by Alenius et al. [9] who also determined the average massof this allergen to be 4719 1.9 Da by applying mass spectrometry. Chen et al.[10] detected two more minor components indicating the existence of hevein vari-ations with additional Ser and Ser–Gly by MALDI-TOF-MS and ESI-MS. Thesefindings were in good agreement with previously published ESI–quadrupole MSdata reporting a ragged C-terminus of hevein and pseudohevein, a hevein analogwith six amino acid replacements and several additional Gly residues at theC-terminus [11].
Individuals with latex protein allergy often exhibit reactions to plant-derivedfood and fresh fruits, such as avocado or banana, too. N-terminal hevein-likedomains seem to be responsible for these mediated reactions in the so-called latex-fruit syndrome [12].
Besides these hevein-like domains, lipid transfer proteins (LTPs) play animportant role in food allergy [13–15] and they have therefore been suggested asmodel plant food allergens. Only recently, the first citric LTPs were isolated fromoranges and lemons with molecular masses of 9610 and 9618 Da, respectively,determined by MALDI-TOF-MS [16]. LTPs have also been identified as the majorapricot allergens [17]. The molecular masses of the intact proteins were deduced

Mass spectrometry of proteinous allergens inducing human diseases 461
by ESI-quadrupole ion trap (QIT)-MS and were found to be 9170.4 and 7238.0Da, respectively, which is in good agreement with the data published earlierdescribing the complete primary structure of a 9 kDa allergen in apricots [18]where liquid chromatography–mass spectrometry (LC–MS) analyses were used formass determination of the purified intact protein and some selected tryptic peptidesfor verification of the most probable amino acid sequence.
The cross-reactivity between various fruits and different pollen allergens is awell-known fact and has already been studied in the 80s of the last century [19,20]using radioallergosorbent tests (RASTs). One of the first pollen allergens character-ized by mass spectrometry is betv1, the major birch pollen allergen [21]. Plasma des-orption mass spectrometry (PD-MS) was used to confirm the primary structures ofthe intact purified protein, of all potential isoforms and some selected proteolyticpeptides and to investigate any possible posttranslational modifications.
Since mass spectrometry got applicable to larger biomolecules [22,23], a bigeffort has been put into the identification of further allergy elicitors and into thestructure elucidation of major allergens relevant for mankind. Special attention hasbeen drawn on plants responsible for summer hay fever such as birch, willow, elder,hazelnut, grass pollen, mugwort, or chrysanthemum. One of the most unstudiedtrees whose plant parts are widely used is the elderberry tree (Sambucus nigra).
Elderberry trees grow ubiquitously in regions of moderate climate, blossomduring May to August with the main season in June and July [24]. S. nigra has along-term history in folk medicine to treat influenza, common cold, or sinusitis[25–27] and its antiinfectious activity has already been proven in a double-blindplacebo-controlled clinical study [28]. A number of proteins, maybe related to thementioned medical applications, extracted from various parts of the tree, as bark,leaves, or fruits, have been intensively investigated and characterized. Certainattention has been drawn not only to their lectin activities [29] but also to theirapplication in medical diagnosis [30–32].
Up to now little is known about the frequency of allergic reactions to elderberrybecause its flowering season overlaps with the seasonal allergy to grass and weedpollen [33]. Furthermore, patients suffering from summer hay fever are often notsensitized to a single allergenic plant, but seem to be polysensitized. Even thoughtype I allergic reactions after inhalative contact with pollen of the elderberry planthave been suspected by clinicians during the last decade, the diagnosis of allergyagainst elderberry was disregarded.
In everyday life, allergic reactions may occur not only after inhalative contact butalso after ingestion since the fruits, flowers, or leaves of the elderberry tree are wide-ly used in nutrition (juices, sparkling wine, jam) or herbal medicine (teas). Althoughthe cDNA of a 17.6 kDa protein from elderberry tissue with high homologyto well-characterized food allergens of plants has been cloned and expressed, a5 kDa protein with sequence homology to hevein, a major latex allergen, wascloned and expressed too [34], verification of the existence of type I allergy

462 M. Marchetti et al.
against this plant has been achieved just once until now [35]. Detection and char-acterization of the allergens in the relevant plant materials have not been per-formed so far.
Along with other forms of allergic reactions, food allergy seems to be on a con-tinuous rise. Allergies are usually caused by the proteinous components in food,within which most of the protein triggers seem to belong to one of three struc-turally related superfamilies: the prolamin superfamily, the cysteine proteasessuperfamily, or the cupin superfamily [36,37]. The prolamin superfamily containsalcohol-soluble storage proteins of cereals, the cysteine proteases—also knownas the papain-like family—bear conserved glutamine, cysteine, histidine, andasparagine residues at the active site, and the cupin superfamily comprises pro-teins with one basic and one double-stranded �-helix domain. The most widelyinvestigated cupins are the 7S and 11S globulin storage proteins. Besides the allergy-relevant structural characteristics of the polypeptide chains, the 7S globulinsubunits are very often glycosylated. This is of special interest because carbohy-drates, containing core-fucose and core-xylose glycoepitopes, have been maderesponsible for IgE cross-reactions [38–41].
Besides these three major protein classes, plant lectins, also known as plantagglutinins, were shown to react with the carbohydrate moieties of IgE, inducinghistamine release and thus causing allergy-like symptoms [42,43]. One 31 kDapeanut agglutinin was already identified as a lectin binding specifically to the IgEepitope [44].
In this chapter we explore the role mass spectrometry plays in the identificationof particular allergens and of the reaction the human body stages to the flowersand other parts of the elderberry tree. The presented approach can be viewed as acase study for the use of mass spectrometry in these endeavors.
1.1. Highlights for medical professionals
Summer hay fever sounds harmless, but is a severe illness. The number of peoplesuffering from summer hay fever rises year after year. Up to 20% of the popula-tion in Europe and North America are estimated to suffer from hay fever thoughexact figures are hard to determine since many cases go unreported. Sneezing,wheezing, increased production of nasal mucosa and lachrymal fluid, pluggedears, and itching of the nose, throat, mouth, ear canal, eyes, and/or skin are ratherharmless though very unpleasant symptoms, whereas inflammation of the gas-trointestinal mucosa, sickness, asthma, and eczema can lead to severe problemsand people can sometimes no longer conduct their everyday life.
According to the classification of Gell and Coombs [2], summer hay fever is atype I allergy for which symptoms occur immediately or up to 1 h after contactwhen antigens, e.g., pollen, have entered the body and activated mast cells. Thesetypes of immune defense cells carry antibodies (IgEs) attached to their surfaces

Mass spectrometry of proteinous allergens inducing human diseases 463
and therefore antigens can bind to them, resulting in the release of histamine, caus-ing blood vessel dilation and/or narrowing of the respiratory tract.
Some patients suffering from allergy-mediated rhinoconjunctivitis and dyspneareported to reveal these symptoms after close contact with elderberry flowers.Other patients complained about wheezing after drinking juices prepared byextracting elderberry blossoms. Type I allergy triggered by different products ofthe elderberry tree has been suspected by clinical allergologists but has not beenfurther followed up. This is because, on one hand, many of the affected personsare polysensitized and, on the other hand, the flowering seasons of the trees andbushes completely overlap with more common elicitors for type I allergy such asmugwort, basswood, barley, wheat, pine, chestnut, acacia, birch, spruce, sorrel,rape, or willow [24,33]. Thus, type I allergy against elderberry can easily be over-seen or underestimated. Furthermore, one should consider that elderberry plantsbelong to the botanic family of Caprifoliaceae, endemic plants, which have neverbeen associated with allergies, such as the Betulaceae, Rosaceae, Poaceae, andCompositae. Therefore, the chance of a correct clinical diagnosis is reduced.
Recently, a study has shown that IgE from eight patient’s sera binds specificallyto proteins present in various elderberry tissues (pollen, berry extract, flowers)[35]. A protein with an apparent molecular weight of 33.2 kDa exhibited the pre-dominant reaction in serological experiments, using SDS-PAGE and Westernblots, in which the reaction of pollen extract exceeded the binding specificities ofthe flower and berry extract, respectively. Cross-reactivity studies showed onlypartial inhibition of specific IgE binding by birch and mugwort, representatives ofthe most important pollen allergen sources. Antibodies from mice immunized withelderberry flower extract exclusively gave positive results for elderberry but notfor birch, grass, or mugwort pollen. MALDI and nano-ESI mass spectrometricstudies showed that the amino acid sequence of the potential allergen has a veryhigh homology to type 2 ribosome-inactivating proteins (RIPs). Only recently, thegeneral antiinfectious activity of RIPs could be shown [45] and thus became ofspecial interest for the therapy of infectious diseases of plants [46,47] and fordiverse applications in human medicine such as abortification [48], immunotoxins[27,49], or antihuman immunodeficiency virus (HIV) agents [50–53]. Moreover,the antiproliferation activity of this very special class of proteins promotedresearch related to their application in therapy of malignancy [54–56].
1.2. Highlights for chemists
Only recently, a very interesting protein family, namely RIPs, has been isolatedfrom S. nigra [57–60]. RIPs are RNA N-glycosidases inactivating ribosomesthrough a site-specific deadenylation of the large ribosomal RNA [61]. In additionto this, some RIPs have been reported to have superoxide dismutase [62,63] andphospholipase [64] type of activities. It is supposed that RIPs are defense-related

464 M. Marchetti et al.
plant proteins that are also involved in the aging process [65]. Two major classescan be distinguished: holo-RIPs and chimero-RIPs (Fig. 1). Holo-RIPs, generallyreferred to as type I RIPs, consist of a single polypeptide chain of �30 kDa,although the promoter sequence sometimes is processed into two shorter sequencesheld together by noncovalent interactions (two-chain type 1 RIPs). Chimero-RIPscomprise one or more amino acid backbones containing a N-glycosidase domainand a structurally different and functionally unrelated lectin domain linked by adisulfide bridge (type 2 RIPs). Type 3 RIPs, members of the holo-RIP family,again consist of just one single polypeptide chain though consisting of twodifferent domains, a N-glycosidase domain and a domain whose function is not yetclarified.
Four years ago, only recently, it could be shown that products from the elderberrytree can be elicitors for type I allergy [35]. It could be demonstrated by inhibitionexperiments by means of denaturing SDS-PAGE and subsequent Western blottingthat the allergenic component is the major proteinous component of elderberryflower extract and has an apparent molecular weight of 33.2 kDa. Implementingpositive linear MALDI-TOF-MS experiments into the studies ascertained theproper molecular weight to be 66.6 kDa. Edman sequencing of the reduced 33.2 kDaallergen, after blotting onto polyvinylidene difluoride (PVDF) membranes fromone- and two-dimensional gels (1D and 2D PAGE) as well as from the purifiedprotein, yielded the first 13 N-terminal amino acids. Database search for homolo-gous sequences using BLAST (basic local alignment search tool) [66] revealedpartial sequence similarity to type 2 RIPs from Sambucus ebulus (dwarf elderberry)but not in the same high degree to RIPs of S. nigra. Therefore, in-gel tryptic
Fig. 1. Schematic representation of the structure of different types of ribosome-inactivating proteins(RIPs). Type 1 RIPs consist of one or two smaller polypeptide chains, held together by noncovalentinteractions, featuring N-glycosidase activity. Type 3 RIPs consist of a polypeptide chain harboringN-glycosidase activity and a second domain of unknown function. Both types belong to the super-family of holo-RIPs. Type 2 RIPs are representatives of chimero-RIPs consisting of two structurallyunrelated polypeptide chains linked by a disulfide bridge.
Mass spectrometry of proteinous allergens inducing human diseases 465
digestion after 1D gel electrophoresis of the 33.2 kDa and of the 66.6 kDa protein,the latter observable under nonreducing SDS-PAGE conditions, was performedand the resulting tryptic peptides were further sequenced by MS/MS experiments.Partial and complete sequences of 12 major peptides could be assigned by meansof a hybrid multistage MALDI-QIT/reflectron instrument in the low-energy CIDmode. These results could be corroborated by a multistage nano-ESI-QIT massspectrometry and provided high confidence in the obtained sequence data. Basedon these data, intensive bioinformatic data mining delivered the information thata high homology to RIPs from S. nigra is given. 2D PAGE showed that the pro-tein at 33.2 kDa consists of more than one isoform. Up to five distinguishableprotein spots could be detected and consecutive IgE binding experiments pointedout that not just one of these spots is responsible for the positive allergy testing butall of them bind IgE. In addition, protein bands at 28 kDa (pI 4.5–6) and 17 kDa(pI 6–6.5) gave positive serological response. The identification and final charac-terization of the allergen is a very crucial point for pinning down the elicitor fortype I allergy in elderberry plants.
2. Methodology
Flowers from the elderberry plant were collected in the Vienna Woods and inUpper Austria. For protein extraction the flowers were grinded and subsequentlyshaken overnight in a potassium phosphate buffer, pH 7.2, at 4ºC as describedpreviously [67]. Centrifugation at 40,000 g removed the insoluble particles andthe supernatant was further dialyzed against double-distilled water using a dialy-sis membrane with a molecular weight cutoff of 8 kDa. Samples obtained by thismeans were lyophilized and stored at �20ºC. Applying such a straightforward andeasy sample preparation should result in samples free of low-molecular-weightsubstances, such as mono- and oligosaccharides, lipids, or anthocyans whereuponthe protein composition should not be altered to a very high extent; however, theamount of low-molecular-weight proteins might be reduced. Molecular weightpattern of the samples was determined by 1D gel electrophoresis according to theprotocol from Laemmli [68]. Briefly, an aliquot of the elderberry extract was heatedin denaturing and nondenaturing Laemmli buffer before loading it to lanes ofSDS-PAGE gels (10 and 15%) run in vertical gel apparatus applying 200 V con-stantly. Protein molecular weights were estimated by comparing the protein bands,visualized by Coomassie Brilliant Blue staining, to prestained molecular weightmarkers. Gel electrophoresis is a very fast method for estimating the protein pro-file of a sample, but molecular weight determination is often hampered due to thelow accuracy ( 20%) of the method.
For subsequent IgE immunoblotting of proteins onto nitrocellulose or PVDFmembranes was performed. Unspecific binding of serum proteins to nitrocellulose

466 M. Marchetti et al.
strips was blocked by soaking the nitrocellulose strips in 50 mM sodium phos-phate buffer (pH 7.5) containing Tween and bovine serum albumin. Sera fromallergic patients were diluted 1:10 in blocking buffer and blot strips were preincu-bated. IgE binding was specifically detected by 125I-rabbit antihuman IgE. To checkfor cross-reactivity between elderberry pollen and pollen from other sources, suchas birch, grass, or mugwort, sera from elderberry immunized mice, containing anti-bodies directed against the antigens of interest, were pooled in equal parts andapplied in 1:100 dilutions. Bound murine antibodies were detected with 125I-labelledantimouse Ig antibodies using autoradiography.
For direct clinical tests, nine patients reporting rhinoconjunctivitis or dyspnea,disease pattern associated with type I allergy, after inhalative or dietary contactwith elderberry flowers were tested by skin prick tests (SPTs) and RAST in orderto diagnose specific allergy against elderberry. Histamine hydrochloride was usedas positive reference. SPT is the most common method to gain results within about20 min where several suspected allergens can be tested at the same time, whereasRAST is a laboratory test performed in vitro measuring specific IgE antibodies inblood. Although the blood test is less sensitive and more time-consuming thanskin testing, it is still very helpful in cases of extensive dermatitis, marked der-matographism, or in children younger than 4 years of age.
The patient’s sera were furthermore tested for their IgE-binding profiles of elec-trophoretically separated extracts from elderberry blossoms, pollen, and fruits toidentify the immunological-relevant allergen. To get information about the com-position of each single protein band in 1D SDS-PAGE, 2D gel electrophoresis wasapplied. 2D PAGE separates proteins due to their different isoelectric points relatedto possible posttranslational modifications like glycosylation, phosphorylation,or sulfatation. Cell metabolism causes a great variability of such protein modifi-cations, very often resulting in a great number of protein spots scattered in a quitenarrow pI range. On this account the combination of 2D PAGE with immunolog-ical studies opens the possibility to get hold of serological-relevant isoforms sincein many cases not only one protein species but also a pool of closely related struc-tures is responsible for a positive immune reaction. Admittedly, separating themultitude of isoforms has a drawback too. Very often immunologically interestingproteins are low-abundant proteins. Separating the isoforms of the same proteinlowers the protein concentration of each single isoform and hence the absoluteconcentration for protein detection. Sometimes to an extent that some isoformscannot be detected anymore by conventional staining protocols making consecu-tive protein identification impossible.
Since protein concentration of the serologically interesting protein in the elder-berry flower extract was high enough for further analysis, 2D PAGE was performedaccording to protocols from Görg et al. [69]. The first dimension, a 7 cm immobilizedlinear pH gradient (IPG) strip from pH 3–7, was rehydrated in an appropriate volumeof sample buffer containing urea and CHAPS besides IPG buffers, dithiothreitol,

Mass spectrometry of proteinous allergens inducing human diseases 467
and traces of bromophenol blue. Sample application was performed during therehydration step by dissolving a lyophilized sample aliquot in the rehydration solu-tion. Isoelectric focusing was run at room temperature for 11 h applying 63 kVh intotal. 10% bis–tris gel run with MES buffer was used for the second dimension andprotein visualization was again performed by Coomassie Brilliant Blue staining.Serological reactivity on 2D PAGE maps was tested after transferring the proteinsonto a nitrocellulose membrane and incubation with human serum IgE as describedfor 1D gels.
For protein identification of the allergen, 1D- and 2D-separated elderberry flowerextracts were blotted onto PVDF membranes and stained with 0.1% methanolicCoomassie Brilliant Blue solution. Bands known to bind IgE were cut from thenylon membrane and subjected to an automatic Edman degradation system, a wide-spread method for sequential protein and peptide degradation to get informationabout the N-terminus of a biomolecule. The chemistry of Edman reaction is wellunderstood and works with high yields (�90%). Nevertheless, amino acid sequenceanalysis still has some problems that make sequencing difficult or impossible,especially in the lower picomole range. The sample should ideally consist of onesingle protein that has to have a homogenous N-terminus for unambiguous proteinidentification, whose salt, free amino acid, and detergent content should also bekept very low. A fundamental problem for amino acid sequencing by Edman degra-dation is the N-terminal blockage of the protein since the chemical reactions needa free amine group at the N-terminus, but about 50% of the naturally occurring pro-teins are N-terminally modified. Besides this some amino acids are undetectable bythis method (nonderivatized cysteines) or the harsh chemical conditions of Edmandegradation partly destroy some residues (e.g., dehydration of serine and/or threo-nine, oxidation of lysine). Edman degradation is therefore a very useful automatedmethod but it cannot replace mass spectrometry in terms of an extensive amino acidsequence analysis. In the case of the elderberry extract it has been possible to detect13 N-terminal amino acids by this method.
The use of gel electrophoresis, immunoblots, and Edman degradation madethe localization of the protein within the very complex protein composition of theelderberry flower extract possible and gave first results for the N-terminus of theallergen. Therefore, emphasis could be shifted on identifying the allergen by a massspectrometric approach. The very high salt content of the original elderberry flowerextract was a drawback for analysis (e.g., mass spectrometry) and the protein ofinterest had to be further purified prior to manipulation. For this purpose theelderberry extract was loaded onto a Sephadex G50 chromatography column equil-ibrated in phosphate buffer (pH 7.4), containing glycerol, dithiotreitol, and sodiumazide. Protein concentrations of fractions collected in minute intervals were con-trolled online using a UV detector at 280 nm. An extinction coefficient of 0.785 for1 mg/mL solution was taken for calculations according to Gill and von Hippel [70].The sample containing the main allergen, controlled by SDS-PAGE, Coomassie

468 M. Marchetti et al.
staining, and IgE immunoblotting, was subsequently applied to a reversed-phasechromatographic system using a RP-C4 column. Aqueous trifluoroacetic acid(0.1% TFA) and isopropanol were applied as mobile phases. A UV detector con-trolled the protein elution at 280 nm whereupon the protein of interest eluted in asingle peak. For exact molecular mass determination, an aliquot of the fractiongained from reversed-phase liquid chromatography was lyophilized and reconsti-tuted in 0.1% TFA. MALDI-TOF-MS experiments were carried out on a linearTOF instrument equipped with a 337 nm N2 laser, a 0.7 m flight tube (MALDI IV,Shimadzu Biotech Kratos Analytical, Manchester, UK) in the positive-ion modewith the extraction voltage set to 24 kV. The purified sample was prepared withsinapic acid using the dried-droplet method [71]. Mass calibration was performedexternally using the doubly and singly charged molecular ions of bovine serumalbumin (prepared in the same manner as the samples) whereby a mass accuracy of 0.1% for the major allergenic component could be achieved.
To yield information about the amino acid sequence in-gel digestion applyingtrypsin and subsequent MALDI-TOF-MS, MALDI-MS/MS and nano-ESI-MS/MS experiments were performed. Enzymatic degradation was accomplishedaccording to protocols suitable for mass spectrometry [72]. The Coomassie-stained protein band of the interesting allergen was excised from the gel afterSDS-PAGE, cut into small cubes, and destained by consecutive washing stepsincluding double-distilled water and acetonitrile. Furthermore, disulfide bonds ofthe protein were reduced using dithiothreitol at 56ºC for 45 min and further deriva-tized by iodoacetamide for 30 min in the dark. Afterwards the gel bands weresoaked in an enzymatic solution containing 12.5 ng trypsin (sequencing gradefrom bovine pancreas) and digestion was carried out overnight at 37ºC. The verynext day the supernatant containing the first fraction of the tryptic peptides wascollected and the remaining peptides were extracted from the gel pieces byincubation with acetonitrile and 0.1% TFA. The extracts and the first removedsupernatant were pooled, lyophilized, reconstituted in a 0.1% TFA solution, anddirectly desalted using Zip-Tip technology [73]. Since only volatile buffers suchas ammonium hydrogen carbonate and solvents of high purity with only minimalcontaminations of inorganic salts (e.g., sodium, potassium) were used, thismicroscaled desalting step is highly efficient for gaining samples best suited forsubsequent mass spectrometry concerning their salt content.
One aliquot of the tryptic digest was submitted to peptide mass fingerprintanalysis. �-Cyano-4-hydroxy-cinnamic acid dissolved in acetone was used asmatrix using the thin-layer sample preparation method [71]. Mass spectra wereacquired on a linear MALDI-TOF-MS instrument (AXIMALNR, Shimadzu BiotechKratos Analytical, Manchester, UK) in the positive-ion mode, also equippedwith a nitrogen laser, but allowing 1.2 m flight path length. Extraction voltage of20 kV was applied and the delayed-extraction (DE) mode for enhanced mass res-olution was used [74]. Another aliquot of the desalted tryptic digest was used for

Mass spectrometry of proteinous allergens inducing human diseases 469
MALDI low-energy CID MS/MS experiments on an AXIMA-QIT instrument.This instrument is a first-generation hybrid-type mass spectrometer consisting ofa 3D-QIT where the selected precursor ions are extracted with 4 kV and can befurther fragmented by CID through an argon pulse in the QIT. The fragments aresubsequently separated in a high-resolution reflectron analyzer [75,76]. In somecases up to 5000 consecutive unselected laser shots were necessary to generatehigh-quality MS/MS spectra for amino acid sequencing. Therefore, sample prepa-ration had to be modified to produce a matrix layer which is not ablated too fast.0.2 M aqueous diammonium hydrogen citrate, the peptide solution, and a methanolicsolution of 2,4,6-trihydroxyacetophenone were mixed directly on the target in thegiven order and dried at room temperature in a gentle stream of air [77]. Externalmass calibration with fullerite was used on this instrument. To corroborate andsupplement the sequence results obtained with the hybrid instrument, another stillavailable aliquot of the desalted in-gel tryptic digest was submitted to a multistagenano-ESI-QIT mass spectrometer (Esquire 3000plus, Bruker Daltoniks, Bremen,Germany) in the off-line mode to generate low-energy CID spectra for obtainingsequence tags.
After generating the peptide mass fingerprint on the MALDI-TOF instrumentsthe m/z values of all relevant peptides, excluding autodigest products of recombi-nant trypsin, were analyzed using various on-line protein identification tools suchas Mascot [78], ProteinProspector [79], and ProFound. All these tools correlate thesubmitted m/z values to in silico generated peptides from proteins availablethrough publicly accessible databases such as SWISS-PROT/ TrEMBL or the com-prehensive, nonidentical protein database at NCBI [80] and list thereafter poten-tial candidates for the protein of interest in a score-based order. Some restrictionssuch as reasonable taxonomy (green plants), fixed and variable modifications (car-bamidomethylation, oxidation of methionines), or peptide molecular mass tolerancefor the average ( 1 Da) and/or monoisotopic data points ( 0.5 Da) were set con-sidering the specifications of every single experiment. Amino acid sequencesresulting from MS/MS experiments were submitted to database search throughBLAST, searching for short, nearly exact sequence matches of proteins originatingfrom Viridiplantae listed in the NCBI database.
3. Mass spectrometric identification of proteinous allergens
The list of elicitors of type I allergy is continuously increasing [81]. Studies aboutthe allergenic potential of products from S. nigra have just once been carried out[35] but not been scrutinized although allergologists have suspected the possibilityof elderberry trees triggering symptoms correlated to this kind of allergy. Especiallythe fact that these trees are intensively flowering over a period of approximately2 months in the early summer season, when other major allergenic plants such as

470 M. Marchetti et al.
grass or birch are blooming, may have resulted in underestimation or misjudgmentof the allergenic potential of elderberry products.
Nine patients with a long history in summer hay fever were tested for symp-toms after inhalative and dietary contact with elderberry products. All of themreported rhinoconjunctivitis; four of them even exhibited asthmatic symptoms. Aspatients may be exposed to the allergens hailing from S. nigra via the oral route—flowers and fruits have been used in plant remedies and food for centuries—it hasbeen of special interest that one patient developed upper-airway obstruction whendrinking elderberry juices. Four patients showed strong reactions after SPT, mediumresponse was observed in two cases, and negative results were received for threepersons including the patient exhibiting airway obstruction. IgE serum levelsmeasured by RAST also varied significantly. In some cases no serum IgE wasdetectable; in another case up to 4080 kU/L was measured.
It has been of interest to identify and characterize the molecules responsible fortype I allergy to elderberry. 1D gel electrophoresis of elderberry flowers, pollen andberry extracts showed a very complex protein composition (Fig. 2). Under nonre-ducing conditions clearly two dominant gel bands at 33 and 66 kDa were visibleafter Coomassie staining, which coincide at 33 kDa under reducing circumstances
E 2 31 B
Flower
E 2 3 B
Pollen
30
97220
66
E 2 B
Berry
kDa
Flower
nr
(A) (B)
1
Fig. 2. (A) Coomassie-stained SDS-PAGE gels of elderberry flower extract under denaturing(reducing condition, lane r) and nondenaturing (lane n) conditions exhibiting dominant proteinbands at 33 and 33 kDa plus 66 kDa, respectively. (B) IgE binding of representative patients’ serain immunoblotting experiments showing the particular binding of the 33 kDa protein band (lane E:Coomassie-stained gels of the corresponding extracts; lane B: serum of a nonallergic volunteer;lanes 1–3: allergic patients’ sera).

Mass spectrometry of proteinous allergens inducing human diseases 471
(Fig. 2A). Disrupting the disulfide bond(s) of the 66 kDa protein leads to the obser-vation of just one protein band at 33 kDa giving hint to the fact that the protein isconsisting of two subunits of identical molecular weight linked via one or moredisulfide bonds. However, out of these numerous proteins comprised in the flowerextract just one predominant protein at about 33 kDa under reducing conditionscould be defined as allergenic by testing patients’ sera for their IgE-binding profileusing immunoblots (Fig. 2B). This very same allergen could be determined withinall pollen, berry, and flower extracts whereby the concentration in pollen seems tobe highest compared to fruits and blossoms. Identity of the detected proteins at33 kDa in the plant materials was validated by testing a serum pool from mice immu-nized with elderberry pollen extract. It has to be mentioned that only a few numberof plants (e.g., birch) show a similar profile of containing just a single allergenrelevant for IgE binding [82]. Clinical records of the selected patients suggestedcross-reactivity to other well-known summer hay fever elicitors such as grass, mug-wort, or birch, but only partial cross-reactivity of specific IgE binding to an elder-berry blot at 33 kDa could be observed with birch (Betula verrucosa) and mugwort(Artemisia vulgaris). Although cross-reactivity between a large number of plantsand fruits has been verified in many cases [36,83–85], mostly explained by phylo-genetically conserved proteins in plant species, these previous findings could not beasserted for the S. nigra allergen. Inhibition, and therefore cross-reactivity, was notobservable using major allergens, such as Bet v 1, grass (P. pretense) pollen extract,or other recombinant predominant allergens such as Phl p1, Phl p2, or Phl p5, withthe result that the 33 kDa protein has to represent a novel type of allergen.
2D gel electrophoresis, carried out to further characterize the physicochemicalproperties of the allergen complex, clearly exhibited five spots (labeled a–e in Fig. 3A)
4938
28
17
53 5 7 9 3 7 9
kDa
(A) (B)
pI
a b c d e
f g h
d
i
Fig. 3. (A) Coomassie staining of the gel-separated elderberry flower extract exhibited five spots at33 kDa (marked a–e) and three spots at 28 kDa (marked f–g). (B) Subsequent immunoblottingpointed out that most distinct spot at 33 kDa has a pI of 7.1 and correlates very well with spot d onthe Coomassie-stained gel.

472 M. Marchetti et al.
at the same molecular weight of about 33 kDa. The pIs of these protein isoformsspan from pI 5.0 over pI 5.3, 5.9, 6.7 to pI 7.1. In addition, three spots at 28 kDaat pI 4.7, 5.1, and 5.5 (labeled f–h in Fig. 3A) could be detected after Coomassiestaining. Serological investigations pointed out that the most prominent binding ofhuman IgE occurred at 33 kDa/pI 7.1, which correlates very well with spot d in theCoomassie-stained gels, with diffuse smearing into the more acidic region (Fig. 3B).The most distinct IgE binding of the 28 kDa protein band was observed at pI 6.0.Interestingly, in the Coomassie-stained gel no protein spot could be clearly detectedat this position; just a faint smear was visible. Moreover, the more acidic spots at28 kDa did not show any immune reaction but gave distinct spots after colorimetricstaining. The scattering of the protein band at 33 kDa after 2D gel electrophoresiscan be explained by the fact that either this allergen is posttranslationally modified(e.g., glycosylated) or single amino acids are exchanged within the polypeptidechain (may be caused by point mutations on the DNA level). Alternatively, morethan one protein can be responsible for the allergic reactions against elderberryplants keeping in mind that the polypeptide chains have to be very similar sincethe molecular weights and pIs do not differ very much.
Subsequent Edman degradation after cutting out the relevant region of thePVDF membrane of the 33 kDa allergen at pI 7.1 yielded the N-terminal aminoacid sequence RDYPFTSRISGGD. Database search for short, in the majority ofcases, exact matches within nonredundant protein databases using BLAST butrestricting the search to green plants did not give any relevant plant-specificresults. A germane hit could not be generated until constraining the taxonomy tothe extreme narrow field of asterids whereby intrinsic homology to the N-terminus of the �-chain of Ebulin 1, a nontoxic type 2 RIP previously isolatedfrom bark and fruits of S. ebulus, could be determined [59]. Girbes et al. identi-fied 25 amino acids of the N-terminus of this protein by Edman degradation, andthe molecular weight of the �-chain was estimated to be 26 kDa (by means ofSDS-PAGE).
For exact molecular weight determination of the allergen from elderberryflowers, the protein was purified by size exclusion and reversed-phase liquidchromatography, whereupon the purity was controlled by SDS-PAGE, and sub-sequently submitted to MALDI-TOF-MS analysis. External calibration usingbovine serum albumin as calibrant revealed a molecular weight of 66.6 kDa forthe intact allergen (Fig. 4) with a mass accuracy of 0.1%. The observed signalat 33.2 kDa can either display the doubly charged molecular ion of the ion at m /z66,600 or represent the molecular weight of the subunit already observed in SDS-PAGE under nonreducing conditions. Anyway a small peak at the high mass sideof the asymmetric peak could be observed for the 33.2 kDa compound providingindications for present glycoheterogeneities.

Mass spectrometry of proteinous allergens inducing human diseases 473
[M+H]+
[M+2H]2+
or
[M+H]+ subunit
33214
66660
x10
100
50
25000 35000 45000 55000 65000 750000
m/z
% R
el. I
nt.
(A)
(B)
31000 33000 35000 37000m/z
0
50
100
% R
el. I
nt.
33214
*
Fig. 4. (A) Positive-ion MALDI mass spectrum in the linear TOF mode of the intact allergenpurified from elderberry flower extract. The peak at 33.2 kDa is either the doubly charged molecu-lar ion of the allergen or representing the [M�H]� ion of the subunit of the allergen. (B) Blowup ofthe asymmetric peak at m/z 33214 (gray line) exhibiting a small peak marked with an asterisk at thetrailing edge (�m �0.5 kDa).

474 M. Marchetti et al.
Breaking down the protein structure to the peptide level using trypsin for in-geldigestion of the 33.2 and 66.6 kDa protein gel band revealed peptide mass fingerprints exhibiting the very same peptide masses for the high- and the low-molecular-weight compounds (Fig. 5), indicating that this protein consists of two very similarsubunits. Submitting the peptide molecular masses revealed in multiple experimentsto publicly available databases using web portals such as Mascot, ProteinProspector,or ProFound did not give search results relevant for Sambucus species nor forproteins with homologies to RIPs to unambiguously identify the allergen. For thisreason peptides not resulting from trypsin autolysis were selected and subsequentlyfragmented on a MALDI-QIT/RTOF and a nano-ESI-QIT mass spectrometer to gaininformation on the amino acid sequences. Table 1 summarizes the CID results foreach selected tryptic peptide. Interestingly, both instruments delivered in some casesvery good results with long stretches of amino acid sequences (e.g., from the pre-cursor ions m /z 1717.15 and 1957.06), which resulted in useful data after BLASTsearch. It pointed out that the sequences IANNVQPIITSIV and EIIIYQPTGNPN-QQWR have a very high homology to the lectin chain of type 2 RIPs originatingfrom S. nigra and S. ebulus and therefore, due to the highly conserved domain oflectins, also to other lectins from the elderberry plant.
0
20
40
60
80
100
%In
t.
1000 1500 2000 2500 3000 3500m/z
1717.15
933.372163.37
2550.78
732.51
3878.06
*
*
*
*
1137.60
Fig. 5. Representative peptide mass fingerprint for the 33.2 and 66.6 kDa proteins resulting from anin-gel digestion of the 66.6 kDa gel band obtained by MALDI-TOF mass spectrometry. Peptidesmarked with an asterisk result from autodigestion products of recombinant trypsin. Peptides labeledwith a diamond were selected for MS/MS experiments carried out on a MALDI-QIT/RTOF and anano-ESI-QIT mass spectrometer.
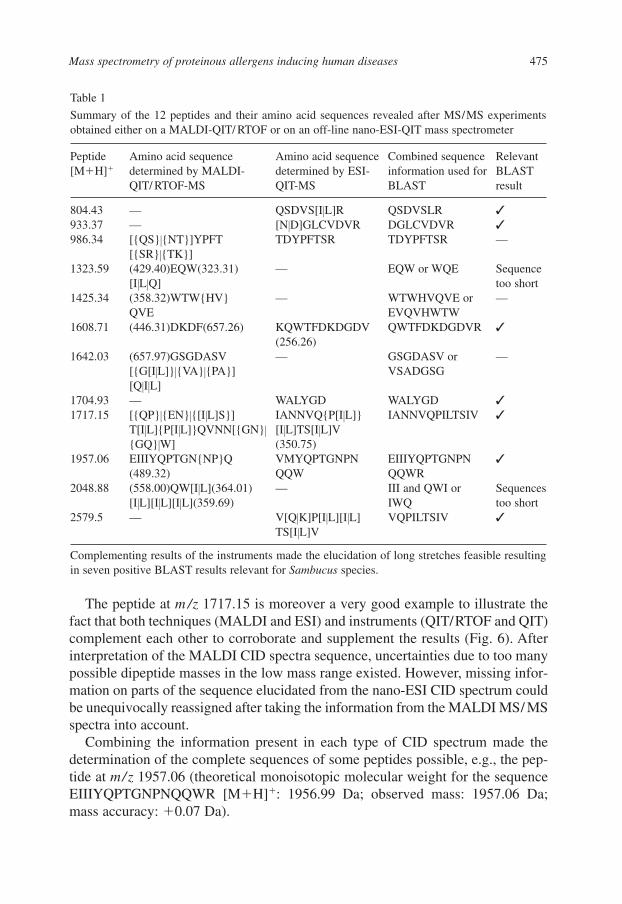
Mass spectrometry of proteinous allergens inducing human diseases 475
The peptide at m /z 1717.15 is moreover a very good example to illustrate thefact that both techniques (MALDI and ESI) and instruments (QIT/RTOF and QIT)complement each other to corroborate and supplement the results (Fig. 6). Afterinterpretation of the MALDI CID spectra sequence, uncertainties due to too manypossible dipeptide masses in the low mass range existed. However, missing infor-mation on parts of the sequence elucidated from the nano-ESI CID spectrum couldbe unequivocally reassigned after taking the information from the MALDI MS/ MSspectra into account.
Combining the information present in each type of CID spectrum made thedetermination of the complete sequences of some peptides possible, e.g., the pep-tide at m/z 1957.06 (theoretical monoisotopic molecular weight for the sequenceEIIIYQPTGNPNQQWR [M�H]�: 1956.99 Da; observed mass: 1957.06 Da;mass accuracy: �0.07 Da).
Table 1
Summary of the 12 peptides and their amino acid sequences revealed after MS/MS experimentsobtained either on a MALDI-QIT/ RTOF or on an off-line nano-ESI-QIT mass spectrometer
Peptide Amino acid sequence Amino acid sequence Combined sequence Relevant[M�H]� determined by MALDI- determined by ESI- information used for BLAST
QIT/ RTOF-MS QIT-MS BLAST result
804.43 — QSDVS[I�L]R QSDVSLR ✓
933.37 — [N�D]GLCVDVR DGLCVDVR ✓
986.34 [{QS}�{NT}]YPFT TDYPFTSR TDYPFTSR —[{SR}�{TK}]
1323.59 (429.40)EQW(323.31) — EQW or WQE Sequence[I�L�Q] too short
1425.34 (358.32)WTW{HV} — WTWHVQVE or —QVE EVQVHWTW
1608.71 (446.31)DKDF(657.26) KQWTFDKDGDV QWTFDKDGDVR ✓
(256.26)1642.03 (657.97)GSGDASV — GSGDASV or —
[{G[I�L]}�{VA}�{PA}] VSADGSG[Q�I�L]
1704.93 — WALYGD WALYGD ✓
1717.15 [{QP}�{EN}�{[I�L]S}] IANNVQ{P[I�L]} IANNVQPILTSIV ✓
T[I�L]{P[I�L]}QVNN[{GN}� [I�L]TS[I�L]V{GQ}�W] (350.75)
1957.06 EIIIYQPTGN{NP}Q VMYQPTGNPN EIIIYQPTGNPN ✓
(489.32) QQW QQWR2048.88 (558.00)QW[I�L](364.01) — III and QWI or Sequences
[I�L][I�L][I�L](359.69) IWQ too short2579.5 — V[Q�K]P[I�L][I�L] VQPILTSIV ✓
TS[I�L]V
Complementing results of the instruments made the elucidation of long stretches feasible resultingin seven positive BLAST results relevant for Sambucus species.

476 M. Marchetti et al.
In other cases, CID spectra could only be generated on one type of multistageinstrument. The peptides with the [M�H]� precursor ions of m/z 804.43, 933.37,1704.93, and 2579.5 could only be observed on the nano-ESI-QIT mass spectro-meter giving peptide sequences of QSDVSLR, DGLCVDVR, WALYGD, andVQPILTSLV where only L/ I and Q/K were questionable due to the low-energy CID
Fig. 6. (A) Low-energy CID spectrum (obtained by means of a nano-ESI-QIT instrument) ofthe doubly charged precursor ion (m/z 859.07) of the peptide with the amino acid sequenceIANNVQPILTSIV. (B) Low-energy CID spectrum (obtained by means of a MALDI-QIT/RTOFinstrument) of the singly charged precursor ion (m/z 1717.15) of the above-mentioned peptide.

Mass spectrometry of proteinous allergens inducing human diseases 477
characteristics of the QIT itself. All these peptides again were homologs to partialsequences of RIPs. After assignment of the complete sequence it additionallyturned out that the peptide at m /z 1717.15 (observed on both instruments) is alreadya fragment of the peptide at m /z 2579.5 (only observed in nano-ESI-QIT experi-ments). This observation can be explained by the amino acid sequence close to theN-terminus of the peptide. Amide bonds near consecutive multiple asparagines (N)are very labile and therefore can easily break during the energetic cooling processin the ion trap, generating a kind of an in-quadrupole ion trap artifact.
Tryptic peptides detected at m/z 1323.59 and 2048.88 were just observed on theMALDI-QIT/RTOF instrument and gave only short amino acid sequences uselessfor BLAST search. Two peptides (m/z 1642.03 and 1425.34) revealed the aminoacid sequences of GSGDASV/ VSADGSG and WTWHVQVE/EVQVHWTW,respectively. Unfortunately it was not possible to gain information on the N- andC-termini of these peptides (amino acid sequences) and therefore the readingdirection could not be unambiguously given. BLAST searches taking both possi-bilities into account gave homologies to proteins not descending from elderberrytrees. The peptide at m/z 986.34 revealed the amino acid sequence TDYPFTSRwhich is not homologous to proteins coming from elderberry plants at first sight,but was partially already found after Edman sequencing [35]. In contrary, thesequence QWTFDKDGDVR (m/z 1608.71) again showed homologies to RIPs.
By carrying out a gapped BLAST search taking all insights into account (massspectrometric and Edman sequencing data) and thereafter attaching the identifiedamino acid sequence tags in the most possible order the best alignment result wasobtained for a type 2 RIP from S. nigra first identified in 1997 [86]. Interestingly,type 2 RIPs have been reported to carry carbohydrate moieties, which might explainthe various protein spots (“spot train”) detected after 2D gel electrophoresis. Alreadyin 1997 Van Damme et al. showed that a type 2 RIP from elderberry bark containedabout 11 hexose units per native protein [87] using the phenol/H2SO4 method [88].Furthermore, recently the observation that type 2 RIPs are glycoproteins has beenverified by NMR experiments using isolated glycopeptides obtained from the�-chain of cinnamomin, a type 2 RIP from Cinnamomum camphora [89]. This iscorroborated by the extreme peak width in the MALDI-TOF mass spectrum of theintact molecule.
4. Future trends
During the last years more emphasis has been laid on clearing up problems con-cerning allergies. Great achievements have been made elucidating the metabolicpathway of histamine release, one of the most important representatives of theactual inflammatory mediators for allergic reactions. In the course of these stud-ies, great attention has been paid to food allergy in particular because just 7–10foodstuffs are responsible for the majority of allergies in the western world,

478 M. Marchetti et al.
including quite a number of plant origin. In this case study we could show thatproducts originating from elderberry trees can induce symptoms characteristic fortype I allergies such as sneezing, respiratory tract obstruction, or wheezing. Gelelectrophoretic experiments and intensive MALDI/ESI mass spectrometric inves-tigations showed that the predominant elicitor for these symptoms is a 66.6 kDaprotein consisting of two very similar/identical subunits, which exhibits isoelec-tric points scattered between pI 5 and 7. The fuzzy characteristic of the immuno-detected spots after 2D gel electrophoresis pointed out that the allergy elicitor maybe just one protein, posttranslationally modified, e.g., by carbohydrate moieties, orthat the immunological response results from highly homologous proteins withjust minor variation in their polypeptide sequence. Mass spectrometry was a verypowerful tool to identify this allergen as a homolog to type 2 RIPs. Althoughseveral long stretches of amino acid sequences could be identified by multistagelow-energy CID experiments on two different types of mass spectrometers, aunique identification and full characterization of the protein were not possibleuntil now.
Combining mass spectrometry with extremely selective sample preparation andprotein analytical separation techniques can be the future trend to clearly pin downthe primary structure of the type I elicitor in elderberry products. This can, forinstance, be done by affinity purification taking the possible carbohydrate moi-eties into account and therefore enriching the protein by specific sugar interac-tions. Alternatively, affinity chromatography based on immobilized monoclonalantibodies directed against the allergen itself can be used. Affinity chromatogra-phy is a well-known and successfully established analytical method that can becarried out in preparative or analytical scales and can be efficiently coupled tomass spectrometry in the off-line [90] or on-line mode [91,92]. Particularly, theoff-line mode has the enormous advantage that samples can be spotted onto mem-branes for ongoing serological investigations on the intact protein carried out inparallel to mass spectrometry investigating structural components by spotting theanalyte onto MALDI sample plates for analyses on high-resolution TOF instru-ments to detect the exact molecular weight of the intact protein.
Besides affinity chromatography, capillary zone electrophoresis can easily becoupled to an ESI high-performance RTOF mass spectrometer. The high accuracyachievable in molecular mass determination by newly developed reflectron massspectrometers makes the assignment of isomeric glycoproteins feasible [93] andcan furthermore be a powerful tool to discriminate between different serologicallyrelevant molecules.
Breaking down the protein into smaller fragments by enzymatic treatmentmakes the elucidation of the immunological-relevant epitope of the allergenapproachable. Enrichment of the possibly present glycopeptides by affinity-, ion-exchange, or straight-phase chromatography and subsequent clarification of thecarbohydrate moiety substructures by high- (tandem MS) and low-energy CID

Mass spectrometry of proteinous allergens inducing human diseases 479
(multistage MS) experiments may reveal new sugar structures responsible forimmune responses or confirm the latest published results of carbohydrate corestructures (core �1,3-fucose, core xylose) to be responsible for antibody binding[38,39,42].
5. Conclusions
Fruits and flowers of elderberry trees are widely used in herbal medicine as reme-dies for cold, influenza, and catarrhal inflammation. Type I allergy to this plant hasbeen suspected by clinicians over a long period of time but has never been furtherstudied.
Recently published data gave first evidence that S. nigra is a plant truly har-boring allergenic potential and that a 33.2 kDa protein, a subunit of the 66.6 kDaintact component, is the predominant elicitor for allergic reactions. Remarkably,initially suspected cross-reactivity of concerned individuals to major triggers ofsummer hay fever such as grass, mugwort, or birch could only partly be con-firmed. Partial cross-reactivity to birch and mugwort was observed but not to theother main actuators.
Gel electrophoretic techniques pointed out that the predominant human IgEbinding protein consists of two subunits having identical molecular weight andmore than one isoform with isoelectric points scattered between pI 5 and 7 where-upon the isoform at pI 7 showed the strongest immune response. N-terminal sequenc-ing of the dominant allergen resulted in 13 amino acids giving first indication for atype 2 RIP.
Mass spectrometry was a very powerful tool to substantiate these findings.In-gel digestions after 1D SDS-PAGE of the 33.2 and 66.6 kDa proteins were per-formed and the identical resulting tryptic peptides were further sequenced by mul-tistage low-energy CID experiments. Shorter and longer stretches of amino acidsequences of eight peptides could be assigned by means of a hybrid multistageMALDI-QIT/RTOF instrument in the low-energy CID mode. These results werecorroborated and supplemented by low-energy CID experiments with a nano-ESI-QIT mass spectrometer providing thereafter three complete and nine partial aminoacid sequences of tryptic peptides with very high confidence. Based on these data,intensive bioinformatic data mining delivered the information that a high homol-ogy to lectins, in particular to type 2 RIPs, from S. nigra is given. Considering thatdietary lectins can induce histamine release [42] this has been a notably interestingresult. Unfortunately, the various gel spots detected in 2D PAGE could not beclearly assigned to potential protein homologues or possible carbohydrate isoformsuntil now, but these investigations are in progress. Furthermore, the knowledge thatprotein sequence variation, protein conformations, and posttranslational modifica-tions, such as specific carbohydrate structures, are involved in the generation of

480 M. Marchetti et al.
IgE-reactive epitopes was not of assistance for clearing up the uncertainties ofprotein identification but complicated the situation for clarification.
Sophisticated purification steps to get hold of the highly purified allergen haveto be developed including, e.g., affinity purification by either immobilizing anti-bodies directed against the allergen itself or working with affinity ligands takingthe possible carbohydrate moieties of the allergen into account. Nevertheless, allthe observations until now indicate that the predominant elicitor for type I allergyinduced by elderberry flowers is a type 2 RIP. This is of particular interest forimmunology as the family of RIPs has recently gained importance in anticancerand antiviral therapy due to their antiproliferative and antimitogenic activities.
References
1. Turk, J.L., Von Pirquet, allergy and infectious diseases: a review. J. R. Soc. Med., 80, 31–33(1987).
2. Gell, P.G.H. and Coombs, R.R.A. (Eds.), The Classification of Allergic Reactions UnderlyingDisease. Blackwell, Oxford, 1963.
3. Rajan, T.V., The Gell-Coombs classification of hypersensitivity reactions: a re-interpretation.Trends Immunol., 24, 376–379 (2003).
4. Nutter, A.F., Contact urticaria to rubber. Br. J. Dermatol., 101, 597–598 (1979).5. European Commission, Determination of allergological relevant compounds in disposable
gloves. Correlation of chemical, allergological and immunological data. Final report MAT1—CT 940060. In: European Commission Directorate General XII. Science, Research andDevelopment. Directorate C: Industrial and material technologies programme measurementand testing. Brussels, Belgium, 1998.
6. Czuppon, A.B., Chen, Z., Rennert, S., Engelke, T., Meyer, H.E., Heber, M. and Baur, X., Therubber elongation factor of rubber trees (Hevea brasiliensis) is the major allergen in latex.J. Allergy Clin. Immunol., 92, 690–697 (1993).
7. Dennis, M., Henzel, W., Bell, J., Kohr, W. and Light, D., Amino acid sequence of rubber elon-gation factor protein associated with rubber particles in Hevea latex. J. Biol. Chem., 264,18618–18617 (1989).
8. Dürauer, A., Csaszar, E., Mechtler, K., Jungbauer, A. and Schmid, E., Characterisation of therubber elongation factor from ammoniated latex by electrophoresis and mass spectrometry.J. Chromatogr. A, 890, 145–158 (2000).
9. Alenius, H., Kalkkinen, N., Reunala, T., Turjanmaa, K. and Palosuo, T., The main IgE-bindingepitope of a major latex allergen, prohevein, is present in its N-terminal 43-amino acid fragment,hevein. J. Immunol., 156, 1618–1625 (1996).
10. Chen, Z., Posch, A., Lohaus, C., Raulf-Heimsoth, M., Meyer, H.E. and Baur, X., Isolation andidentification of hevein as a major IgE-binding polypeptide in Hevea latex. J. Allergy Clin.Immunol., 99, 402–409 (1997).
11. Soedjanaatmadja, U.M., Hofsteenge, J., Jeronimus-Stratingh, C.M., Bruins, A.P. andBeintema, J.J., Demonstration by mass spectrometry that pseudo-hevein and hevein haveragged C-terminal sequences. Biochim. Biophys. Acta, 1209, 144–148 (1994).
12. Karisola, P., Kotovuori, A., Poikonen, S., Niskanen, E., Kalkkinen, N., Turjanmaa, K.,Palosuo, T., Reunala, T., Alenius, H. and Kulomaa, M.S., Isolated hevein-like domains, but not31-kd endochitinases, are responsible for IgE-mediated in vitro and in vivo reactions in latex-fruit syndrome. J. Allergy Clin. Immunol., 115, 598–605 (2005).

Mass spectrometry of proteinous allergens inducing human diseases 481
13. Schad, S.G., Trcka, J., Vieths, S., Scheurer, S., Conti, A., Brocker, E.B. and Trautmann, A.,Wine anaphylaxis in a German patient: IgE-mediated allergy against a lipid transfer protein ofgrapes. Int. Arch. Allergy Immunol., 136, 159–164 (2005).
14. Fernandez-Rivas, M., Gonzalez-Mancebo, E., Rodriguez-Perez, R., Benito, C., Sanchez-Monge, R., Salcedo, G., Alonso, M.D., Rosado, A., Tejedor, M.A., Vila, C. and Casas, M.L.,Clinically relevant peach allergy is related to peach lipid transfer protein, Pru p 3, in theSpanish population. J. Allergy Clin. Immunol., 112, 789–795 (2003).
15. Pastorello, E.A., Pompei, C., Pravettoni, V., Farioli, L., Calamari, A.M., Scibilia, J., Robino, A.M.,Conti, A., Iametti, S., Fortunato, D., Bonomi, S. and Ortolani, C., Lipid-transfer protein isthe major maize allergen maintaining IgE-binding activity after cooking at 100 degrees C, asdemonstrated in anaphylactic patients and patients with positive double-blind, placebo-controlled food challenge results. J. Allergy Clin. Immunol., 112, 775–783 (2003).
16. Ahrazem, O., Ibanez, M.D., Lopez-Torrejon, G., Sanchez-Monge, R., Sastre, J., Lombardero, M.,Barber, D. and Salcedo, G., Lipid transfer proteins and allergy to oranges. Int. Arch. AllergyImmunol., 137, 201–210 (2005).
17. Conti, A., Fortunato, D., Ortolani, C., Giuffrida, M.G., Pravettoni, V., Napolitano, L., Farioli, L.,Perono Garoffo, L., Trambaioli, C. and Pastorello, E.A., Determination of the primary struc-ture of two lipid transfer proteins from apricot (Prunus armeniaca). J. Chromatogr. B Biomed.Sci. Appl., 756, 123–129 (2001).
18. Pastorello, E.A., Ortolani, C., Baroglio, C., Pravettoni, V., Ispano, M., Giuffrida, M.G.,Fortunato, D., Farioli, L., Monza, M., Napolitano, L., Sacco, M., Scibola, E. and Conti, A.,Complete amino acid sequence determination of the major allergen of peach (Prunus persica)Pru p 1. Biol. Chem., 380, 1315–1320 (1999).
19. Lahti, A., Bjorksten, F. and Hannuksela, M., Allergy to birch pollen and apple, and cross-reactivity of the allergens studied with the RAST. Allergy, 35, 297–300 (1980).
20. Halmepuro, L., Vuontela, K., Kalimo, K. and Bjorksten, F., Cross-reactivity of IgE antibodieswith allergens in birch pollen, fruits and vegetables. Int. Arch. Allergy Appl. Immunol., 74,235–240 (1984).
21. Swoboda, I., Jilek, A., Ferreira, F., Engel, E., Hoffmann-Sommergruber, K., Scheiner, O.,Kraft, D., Breiteneder, H., Pittenauer, E., Schmid, E., Vicente, O., Heberle-Bors, E., Ahorn, H.,and Breitenbach, M., Isoforms of Bet v 1, the major birch pollen allergen, analyzed by liquidchromatography, mass spectrometry, and cDNA cloning. J. Biol. Chem., 270, 2607–2613 (1995).
22. Fenn, J.B., Mann, M., Meng, C.K., Wong, S.F. and Whitehouse, C.M., Electrospray ionizationfor mass spectrometry of large biomolecules. Science, 246, 64–71 (1989).
23. Tanaka, K., Waki, H., Ido, Y., Akita, S., Yoshida, Y. and Yohida, T., Protein and polymer analy-ses up to m/z 1,00,000 by laser ionization time-of-flight mass spectrometry. Rapid Commun.Mass Spectrom., 2, 151–153 (1988).
24. Durham, S., ABC of allergies. Summer hay fever. Br. Med. J., 316, 843–845 (1998).25. Barak, V., Halperin, T. and Kalickman, I., The effect of Sambucol, a black elderberry-based,
natural product, on the production of human cytokines: I. Inflammatory cytokines. Eur.Cytokine Netw., 12, 290–296 (2001).
26. Moerman, D.E. and Estabrook, G.F., Native Americans’ choice of species for medicinal use isdependent on plant family: confirmation with meta-significance analysis. J. Ethnopharmacol.,87, 51–59 (2003).
27. Borchers, A.T., Keen, C.L., Stern, J.S. and Gershwin, M.E., Inflammation and NativeAmerican medicine: the role of botanicals. Am. J. Clin. Nutr., 72, 339–347 (2000).
28. Zakay-Rones, Z., Varsano, N., Zlotnik, M., Manor, O., Regev, L., Schlesinger, M. andMumcuoglu, M., Inhibition of several strains of influenza virus in vitro and reduction of symp-toms by an elderberry extract (Sambucus nigra L.) during an outbreak of influenza B Panama.J. Altern. Complement. Med., 1, 361–369 (1995).

482 M. Marchetti et al.
29. Peumans, W.J., Van Damme, E.J., Barre, A. and Rouge, P., Classification of plant lectins in fam-ilies of structurally and evolutionary related proteins. Adv. Exp. Med. Biol., 491, 27–54 (2001).
30. Baum, L.G., Derbin, K., Perillo, N.L., Wu, T., Pang, M. and Uittenbogaart, C. Characterizationof terminal sialic acid linkages on human thymocytes. Correlation between lectin-bindingphenotype and sialyltransferase expression. J. Biol. Chem., 271, 10793–10799 (1996).
31. Chintalacharuvu, S.R. and Emancipator, S.N., The glycosylation of IgA produced by murineB cells is altered by Th2 cytokines. J. Immunol., 159, 2327–2333 (1997).
32. Tong, H.H., James, M., Grants, I., Liu, X., Shi, G. and DeMaria, T.F., Comparison of struc-tural changes of cell surface carbohydrates in the eustachian tube epithelium of chinchillasinfected with a Streptococcus pneumoniae neuraminidase-deficient mutant or its isogenicparent strain. Microb. Pathog., 31, 309–317 (2001).
33. Pollenflugkalender URL http://www.die-seite.at/special/pollen/pollenkalender.php, February15, 2005.
34. Van Damme, E.J.M., Charels, D., Roy, S., Tierens, K., Barre, A., Martins, J.C., Rouge, P., VanLeuven, F., Does, M. and Peumans, W.J., A gene encoding a hevein-like protein from elder-berry fruits is homologous to PR-4 and class V chitinase genes. Plant Physiol., 119,1547–1556 (1999).
35. Förster-Waldl, E., Marchetti, M., Schöll, I., Focke, M., Radauer, C., Kinaciyan, T., Nentwich, I.,Jäger, S., Schmid, E.R., Boltz-Nitulescu, G., Scheiner, O. and Jensen-Jarolim, E., Type I allergyto elderberry is elicited by a 33.2 kDa allergen with significant homology to ribosomal inacti-vating proteins (RIPs). Clin. Exp. Allergy, 33, 1703–1710 (2003).
36. Breiteneder, H. and Ebner, C., Molecular and biochemical classification of plant-derived foodallergens. J. Allergy Clin. Immunol., 106, 27–36 (2000).
37. Mills, E.N.C., Madsen, C., Shewry, P.R. and Wichers, H.J., Food allergens of plant origin—their molecular and evolutionary relationships. Trends Food Sci. Technol., 14, 145–156 (2003).
38. Wilson, I.B., Harthill, J.E., Mullin, N.P., Ashford, D.A. and Altmann, F., Core alpha1,3-fucose is a key part of the epitope recognized by antibodies reacting against plant N-linkedoligosaccharides and is present in a wide variety of plant extracts. Glycobiology, 8, 651–661(1998).
39. Bardor, M., Faveeuw, C., Fitchette, A.C., Gilbert, D., Galas, L., Trottein, F., Faye, L. andLerouge, P., Immunoreactivity in mammals of two typical plant glyco-epitopes, corealpha(1,3)-fucose and core xylose. Glycobiology, 13, 427–434 (2003).
40. Corti, V., Cattaneo, A., Bachi, A., Rossi, R.E., Monasterolo, G., Paolucci, C., Burastero, S.E.and Alessio, M., Identification of grass pollen allergens by two-dimensional gel electrophore-sis and serological screening. Proteomics, 5, 729–736 (2005).
41. Leonard, R., Petersen, B.O., Himly, M., Kaar, W., Wopfner, N., Kolarich, D., van Ree, R.,Ebner, C., Duus, J.O., Ferreira, F. and Altmann, F., Two novel types of O-glycans on the mugwortpollen allergen art v 1 and their role in antibody binding. J. Biol. Chem., 280, 7932–7940 (2005).
42. Haas, H., Falcone, F.H., Schramm, G., Haisch, K., Gibbs, B.F., Klaucke, J., Poppelmann, M.,Becker, W.M., Gabius, H.J. and Schlaak, M., Dietary lectins can induce in vitro release of IL-4 and IL-13 from human basophils. Eur. J. Immunol., 29, 918–927 (1999).
43. Shibasaki, M., Sumazaki, R., Isoyama, S. and Takita, H., Interaction of lectins with humanIgE: IgE-binding property and histamine-releasing activity of twelve plant lectins. Int. Arch.Allergy Immunol., 98, 18–25 (1992).
44. Burks, A.W., Cockrell, G., Connaughton, C., Guin, J., Allen, W. and Helm, R.M. Identificationof peanut agglutinin and soybean trypsin inhibitor as minor legume allergens. Int. Arch.Allergy Immunol., 105, 143–149 (1994).
45. Barbieri, L., Ciani, M., Girbes, T., Liu, W.-Y., Van Damme, E.J.M., Peumans, W.J. and Stirpe, F.,Enzymatic activity of toxic and non-toxic type 2 ribosome-inactivating proteins. FEBS Lett.,563, 219–222 (2004).

Mass spectrometry of proteinous allergens inducing human diseases 483
46. Vandenbussche, F., Desmyter, S., Ciani, M., Proost, P., Peumans, W.J. and Van Damme, E.J.,Analysis of the in planta antiviral activity of elderberry ribosome-inactivating proteins. Eur. J.Biochem., 271, 1508–1515 (2004).
47. Chen, Y., Peumans, W.J. and Van Damme, E.J.M., The Sambucus nigra type-2 ribosome-inactivating protein SNA-I� exhibits in planta antiviral activity in transgenic tobacco. FEBSLett., 516, 27–30 (2002).
48. Chow, L.P., Chou, M.H., Ho, C.Y., Chuang, C.C., Pan, F.M., Wu, S.H. and Lin, J.Y., Purification,characterization and molecular cloning of trichoanguin, a novel type I ribosome-inactivatingprotein from the seeds of Trichosanthes anguina. Biochem. J., 338(Pt 1), 211–219 (1999).
49. Hartley, M.R. and Lord, J.M., Cytotoxic ribosome-inactivating lectins from plants. Biochim.Biophys. Acta, 1701, 1–14 (2004).
50. McGrath, M.S., Hwang, K.M., Caldwell, S.E., Gaston, I., Luk, K.C., Wu, P., Ng, V.L., Crowe, S.,Daniels, J., Marsh, J., Deinhart, T., Lekas, P.V., Vennari, J.C., Yeang, H.-W. and Lifson, J.D.,GLQ223: an inhibitor of human immunodeficiency virus replication in acutely and chronicallyinfected cells of lymphocyte and mononuclear phagocyte lineage. Proc. Natl. Acad. Sci.U.S.A., 86, 2844–2848 (1989).
51. Zarling, J.M., Moran, P.A., Haffar, O., Sias, J., Richman, D.D., Spina, C.A., Myers, D.E.,Kuebelbeck, V., Ledbetter, J.A. and Uckun, F.M., Inhibition of HIV replication by pokeweedantiviral protein targeted to CD4� cells by monoclonal antibodies. Nature, 347, 92–95 (1990).
52. Au, T.K., Collins, R.A., Lam, T.L., Ng, T.B., Fong, W.P. and Wan, D.C.C., The plant ribosomeinactivating proteins luffin and saporin are potent inhibitors of HIV-1 integrase. FEBS Lett.,471, 169–172 (2000).
53. Wang, Y.X., Jacob, J., Wingfield, P.T., Palmer, I., Stahl, S.J., Kaufman, J.D., Huang, P.L., Lee-Huang, S. and Torchia, D.A., Anti-HIV and anti-tumor protein MAP30, a 30 kDa single-strandtype-I RIP, shares similar secondary structure and beta-sheet topology with the A chain ofricin, a type-II RIP. Protein Sci., 9, 138–144 (2000).
54. Sandvig, K. and van Deurs, B., Entry of ricin and Shiga toxin into cells: molecular mecha-nisms and medical perspectives. Embo J., 19, 5943–5950 (2000).
55. Kodama, T., Doukas, A.G. and Hamblin, M.R., Delivery of ribosome-inactivating proteintoxin into cancer cells with shock waves. Cancer Lett., 189, 69–75 (2003).
56. Citores, L., Miguel Ferreras, J., Munoz, R., Benitez, J., Jimenez, P. and Girbes, T., Targetingcancer cells with transferrin conjugates containing the non-toxic type 2 ribosome-inactivatingproteins nigrin b or ebulin l. Cancer Lett., 184, 29–35 (2002).
57. Peumans, W.J., Hao, Q. and Van Damme, E.J., Ribosome-inactivating proteins from plants:more than RNA N-glycosidases? FASEB J., 15, 1493–1506 (2001).
58. Van Damme, E.J., Barre, A., Rouge, P., Van Leuven, F. and Peumans, W.J., The NeuAc(alpha-2,6)-Gal/GalNAc-binding lectin from elderberry (Sambucus nigra) bark, a type-2 ribosome-inactivating protein with an unusual specificity and structure. Eur. J. Biochem., 235, 128–137(1996).
59. Girbes, T., Citores, L., de Benito, F.M., Inglesias, R. and Ferreras, J.M., A non-toxic two-chainribosome-inactivating protein co-exists with a structure-related monomeric lectin (SNA III) inelder (Sambucus nigra) fruits. Biochem. J., 315, 343–344 (1996).
60. Battelli, M.G., Citores, L., Buonamici, L., Ferreras, J.M., de Benito, F.M., Stirpe, F., Girbes, T.,Inglesias, R., Van Damme, E.J., Barre, A., Rouge, P., Van Leuven, F., and Peumans, W.J.,Toxicity and cytotoxicity of nigrin b, a two-chain ribosome-inactivating protein fromSambucus nigra: comparison with ricin, a non-toxic two-chain ribosome-inactivating proteinco-exists with a structure-related monomeric lectin (SNA III) in elder (Sambucus nigra) fruits.The NeuAc(alpha-2,6)-Gal/GalNAc-binding lectin from elderberry (Sambucus nigra) bark, atype-2 ribosome-inactivating protein with an unusual specificity and structure. Arch. Toxicol.,71, 360–364 (1997).

484 M. Marchetti et al.
61. Endo, Y., Mitsui, K., Motizuki, M. and Tsurugi, K., The mechanism of action of ricin and relatedtoxic lectins on eukaryotic ribosomes. The site and the characteristics of the modification in28 S ribosomal RNA caused by the toxins. J. Biol. Chem., 262, 5908–5912 (1987).
62. Li, X.D., Chen, W.F., Liu, W.Y. and Wang, G.H., Large-scale preparation of two new ribosome-inactivating proteins—cinnamomin and camphorin from the seeds of Cinnamomum camphora.Protein Expr. Purif., 10, 27–31 (1997).
63. Sharma, N., Park, S.W., Vepachedu, R., Barbieri, L., Ciani, M., Stirpe, F., Savary, B. J. andVivanco, J.M., Isolation and characterization of an RIP (ribosome-inactivating protein)-likeprotein from tobacco with dual enzymatic activity. Plant Physiol., 134, 171–181 (2004).
64. Helmy, M., Lombard, S. and Pieroni, G., Ricin RCA60: evidence of its phospholipase activity.Biochem. Biophys. Res. Commun., 258, 252–255 (1999).
65. Park, S.W., Vepachedu, R., Sharma, N. and Vivanco, J.M., Ribosome-inactivating proteins inplant biology. Planta, 219, 1093–1096 (2004).
66. Altschul, S.F., Madden, T.L., Schaffer, A.A., Zhang, J., Zhang, Z., Miller, W. and Lipman, D.J.,Gapped BLAST and PSI-BLAST: a new generation of protein database search programs.Nucl. Acids Res., 25, 3389–3402 (1997).
67. Jensen-Jarolim, E., Gerstmayer, G., Kraft, D., Scheiner, O., Ebner, H. and Ebner, C., Serologicalcharacterization of allergens in poppy seeds. Clin. Exp. Allergy, 29, 1075–1079 (1999).
68. Laemmli, U.K., Cleavage of structural proteins during the assembly of the head of bacterio-phage T4. Nature, 227, 680–685 (1970).
69. Görg, A., Postel, W. and Gunther, S., The current state of two-dimensional electrophoresiswith immobilized pH gradients. Electrophoresis, 9, 531–546 (1988).
70. Gill, S.C. and von Hippel, P.H., Calculation of protein extinction coefficients from amino acidsequence data. Anal. Biochem., 182, 319–326 (1989).
71. Kussmann, M., Nordhoff, E., Rahbek-Nielsen, H., Haebel, S., Rossel-Larsen, M., Jakobsen, L.,Gobom, J., Mirgorodskaya, E., Kroll-Kristensen, A., Palm, L. and Roepstorff, P., Matrix-assisted laser desorption/ionization mass spectrometry sample preparation techniquesdesigned for various peptide and protein analytes. J. Mass Spectrom., 32, 593–601 (1997).
72. Shevchenko, A., Wilm, M., Vorm, O. and Mann, M., Mass spectrometric sequencing of pro-teins silver-stained polyacrylamide gels. Anal. Chem., 68, 850–858 (1996).
73. Pluskal, M.G., In the laboratory: microscale sample preparation. Nat. Biotechnol., 18,104–105 (2000).
74. Tsarbopoulos, A., Bahr, U., Pramanik, B.N. and Karas, M., Glycoprotein analysis by delayedextraction and post-source decay MALDI-TOF-MS. Int. J. Mass Spectrom. Ion Processes,169/170, 251–261 (1997).
75. Martin, R.L. and Brancia, F.L., Analysis of high mass peptides using a novel matrix-assistedlaser desorption/ionisation quadrupole ion trap time-of-flight mass spectrometer. Rapid Commun.Mass Spectrom., 17, 1358–1365 (2003).
76. Demelbauer, U.M., Zehl, M., Plematl, A., Allmaier, G. and Rizzi, A., Determination of gly-copeptide structures by multistage mass spectrometry with low-energy collision-induced dis-sociation: comparison of electrospray ionization quadrupole ion trap and matrix-assisted laserdesorption/ionization quadrupole ion trap reflectron time-of-flight approaches. Rapid Commun.Mass Spectrom., 18, 1575–1582 (2004).
77. Zehl, M. and Allmaier, G., Investigation of sample preparation and instrumental parameters inthe matrix-assisted laser desorption/ ionization time-of-flight mass spectrometry of noncova-lent peptide/peptide complexes. Rapid Commun. Mass Spectrom., 17, 1931–1940 (2003).
78. Perkins, D.N., Pappin, D.J.C., Creasy, D.M. and Cottrell, J.S., Probability-based protein iden-tification by searching sequence databases using mass spectrometry data. Electrophoresis, 20,3551–3567 (1999).
Mass spectrometry of proteinous allergens inducing human diseases 485
79. Clauser, K.R., Baker, P. and Burlingame, A.L., Role of accurate mass measurement ( 10 ppm)in protein identification strategies employing MS or MS/MS and database searching. Anal.Chem., 71, 2871–2882 (1999).
80. Wilkins, M.R., Williams, K.L., Appel, R.D. and Hochstrasser, D.F. (Eds.), Proteome Research:New Frontiers in Functional Genomics. Springer Verlag, Berlin Heidelberg, New York, 1997.
81. Gendel, S.M., Sequence databases for assessing the potential allergenicity of proteins used intransgenic foods. Adv. Food Nutr. Res., 42, 63–92 (1998).
82. Jarolim, E., Rumpold, H., Endler, A.T., Ebner, H., Breitenbach, M., Scheiner, O. and Kraft, D.,IgE and IgG antibodies of patients with allergy to birch pollen as tools to define the allergenprofile of Betula verrucosa. Allergy, 44, 385–395 (1989).
83. Valenta, R., Duchene, M., Ebner, C., Valent, P., Sillaber, C., Deviller, P., Ferreira, F., Tejkl, M.,Edelmann, H., Kraft, D. and Scheiner, O., Profilins constitute a novel family of functionalplant pan-allergens. J. Exp. Med., 175, 377–385 (1992).
84. Mikkola, J.H., Alenius, H., Kalkkinen, N., Turjanmaa, K., Palosuo, T. and Reunala, T.,Hevein-like protein domains as a possible cause for allergen cross-reactivity between latex andbanana. J. Allergy Clin. Immunol., 102, 1005–1012 (1998).
85. Barral, P., Batanero, E., Palomares, O., Quiralte, J., Villalba, M. and Rodriguez, R., A majorallergen from pollen defines a novel family of plant proteins and shows intra- and interspecies[correction of interspecie] cross-reactivity. J. Immunol., 172, 3644–3651 (2004).
86. Van Damme, E.J., Roy, S., Barre, A., Rouge, P., Van Leuven, F. and Peumans, W.J., The majorelderberry (Sambucus nigra) fruit protein is a lectin derived from a truncated type 2 ribosome-inactivating protein. Plant J., 12, 1251–1260 (1997).
87. Van Damme, E.J.M., Barre, A., Rouge, P., Van Leuven, F. and Penumans, W.J., Isolation andmolecular cloning of a novel type 2 ribosome-inactivating protein with an inactive B chainfrom elderberry (Sambucus nigra) bark. J. Biol. Chem., 272, 8353–8360 (1997).
88. Dubois, M., Gilles, K., Hamilton, J.K., Rebers, P.A. and Smith, F., A colorimetric method forthe determination of sugars. Nature, 168, 167 (1951).
89. Pu, Z., Li, Y., Hou, F.J., He, F., Zhang, N., Wu, H. and Liu, W.Y., Structural studies of theglycopeptides of B-chain of cinnamomin—a type II ribosome-inactivating protein by nuclearmagnetic resonance. Glycoconj. J., 17, 749–759 (2000).
90. Demelbauer, U.M., Plematl, A., Kremser, L., Allmaier, G., Josic, D. and Rizzi, A.,Characterization of glyco isoforms in plasma-derived human antithrombin by on-line capillaryzone electrophoresis-electrospray ionization-quadrupole ion trap-mass spectrometry of theintact glycoproteins. Electrophoresis, 25, 2026–2032 (2004).
91. Ng, E.S., Yang, F., Kameyama, A., Palcic, M.M., Hindsgaul, O. and Schriemer, D.C., High-throughput screening for enzyme inhibitors using frontal affinity chromatography with liquidchromatography and mass spectrometry. Anal. Chem., 77, 6125–6133 (2005).
92. Zhang, B., Palcic, M.M., Schriemer, D.C., Alvarez-Manilla, G., Pierce, M. and Hindsgaul, O.,Frontal affinity chromatography coupled to mass spectrometry for screening mixtures ofenzyme inhibitors. Anal. Biochem., 299, 173–182 (2001).
93. Neusüß, C., Demelbauer, U. and Pelzing, M., Glycoform characterization of intact erythro-poietin by capillary electrophoresis-electrospray-time-of-flight mass spectrometry.Electrophoresis, 26, 1442–1450 (2005).

This page intentionally left blank

Medical Applications of Mass SpectrometryK. Vékey, A. Telekes and A. Vertes (editors)© 2008 Elsevier B.V. All rights reserved
487
Chapter 21
Mass spectrometry in clinical treatment
ANDRÁS TELEKESa,1, MÁRTA HEGEDUSa,2, and ISTVÁN KISSb,3
aNational Institute of Oncology, Budapest, HungarybSt. Imre Government Teaching Hospital, Budapest, Hungary
1. Introduction 4872. Pediatrics 4903. Oncology 493References 499
1. Introduction
The first clinical applications of mass spectrometry (MS) date back to 1966, whenthe use of gas chromatography coupled to mass spectrometry (GC–MS) for identi-fication of organic acidurias in children was reported [1]. Twenty years later tandemmass spectrometry (MS/MS) was introduced into clinical laboratories, and firstapplied to the evaluation of children at risk of inborn errors of metabolism [2–4].Using stable-isotope-labeled (i.e., not radioactive) internal standards, the methodwas further enhanced. These standards are identical to the native analytes, exceptthat their molecular masses are slightly different. Addition of these isotopes atknown concentration to the sample before analysis serves as a positive control,helping identification and quantification of the analytes. The use of MS is, however,not yet routine in many fields where it could influence clinical decisions. Whilemedical research using MS is flourishing, few applications have become part of thestandard “bedside” practice. This is partly because the transition of MS from aresearch tool to a reliable clinical diagnostic platform requires rigorous standardiza-tion, spectral quality control and assurance, standard operating procedures for robotic
1Tel.: �36-204-119080; Fax: �36-139-52835. E-mail: [email protected] (A. Telekes).2E-mail: [email protected] (M. Hegedus).3E-mail: [email protected] (I. Kiss).

488 A. Telekes et al.
and automatic sample application, and standardized controls to ensure generationof highly reproducible spectra [5]. Reliable identification of protein expressionpatterns and associated protein biomarkers that differentiate disease from health orthat distinguish different stages of a disease has now started to become feasible.There are many MS-based techniques for identification of biomarkers and proteinexpression patterns; see, e.g., Chapters 6 and 8. Among these, surface-enhancedlaser desorption ionization (SELDI) has gained popularity in the clinical field,mainly due to its ease of use. Note that the same technique is often indicated asSELDI, SELDI–TOF, or SELDI TOF–MS. Recently, however, some results obtainedusing SELDI have been questioned, but this does not diminish the importance ofproteomics-based biomarkers.
In a recent study the systematic variability of SELDI experiments was evalu-ated using biological and technical replicates. Systematic biases on plates, chips,and spots were not found. Reproducibility of SELDI experiments was demon-strated by examining the resulting low coefficient of variances of five peakspresented in all 144 spectra from quality control samples that were loaded ran-domly on different spots in the chips of six bioprocessor plates. The authorsdeveloped a method to detect and discard low quality spectra prior to proteomicprofiling data analysis. This quality control tool involved a correlation matrix tomeasure the similarities among SELDI mass spectra obtained from similarbiological samples. The reproducibility of experiments was acceptable and theprofiling data for subsequent data analysis were reported to be reliable [6].
Valid biological information from SELDI-MS requires attention to experimen-tal design, sample handling, and data processing. In the literature information onthe biological aspects can be found and computer-learning algorithms have beenapplied to locate sets of biomarkers. Focus is needed on locating and measuringproteins across mass spectra, optimizing the trade-off between sensitivity andfalse discovery. Furthermore, the identified features must be biologically meaning-ful, representing identifiable chemical species for further investigation. Carlson et al.have developed an approach to address the deficiencies in reproducibility and com-parability that exist across published studies. This approach, simultaneous spectrumanalysis (SSA), was designed to locate proteins across spectra, measure theirabundance, subtract baselines, exclude irreproducible measurements, and computenormalization factors. Two key parameters are used for feature detection and oneparameter each for quality thresholds on spectra and peaks. Compared with otherapproaches, SSA improved the number and quality of between-group differencesamong lower signal peaks, and was less likely to introduce systematic bias withnormalized spectra [7].
By overcoming technical difficulties, it is predicted that the role of MS in clin-ical decision-making will substantially increase in the coming years. This is dueto not only the extreme sensitivity and high throughput of MS but also because ithelps answer clinically relevant questions. Completion of the human genome

Mass spectrometry in clinical treatment 489
project extends medical practice beyond the identification of genes involved in theappearance, progression, and treatment of a disease (genomics). It has nowbecome possible to investigate what these specific genes do and how they interactin communication networks (functional genomics), and the role played by the pro-tein products of those genes in molecular pathways (proteomics) [8]. The humangenome contains �30,000 genes, each creating several transcripts per gene.Generally, these transcripts are not yet functional, but are translated into functionalproteins by posttranslational modifications such as proteolysis, glycosylation,phosphorylation, etc., sometimes with great functional impact. The plasma pro-teome has an important position at the intersection between genes and diseases,and clinical laboratories must adapt to a new era of tests based on proteomics andgenomics. Plasma has the potential to come into contact with all cells in the body,and thus can offer pointers to the diagnosis and treatment of disease. With ourincreasing ability to detect and characterize trace proteins, the discovery of noveltherapeutics and biomarkers can be expected [9]. As biomarkers are typically lowin abundance, a crucial step of biomarker discovery is to separate clinically rele-vant sets of proteins that might define disease stages and/or predict disease devel-opment. It is anticipated that a multidimensional fractionation system (MDFS)will provide an efficient means of separating low abundance proteins from plasma,resulting in lowering detection limits. However, when using an MDFS to ana-lyze the plasma proteome it is important to consider how sample processing, yield,resolution, and throughput potential may influence the detection limit. In fact, therecent advances in MDFS research could be characterized according to “4RScriterion” (4R: resolution, reproducibility, recovery, and robustness; 4S: simplicity,speed, selectivity, and sensitivity) [10]. Obviously, measurement of a particular setof rigorously validated biomarkers results in a higher level of discriminatorypower than a single biomarker. This may be particularly relevant in the context ofheterogeneous patient populations and heterogeneous disease states.
MS can also play a major role in new therapeutic approaches. It can be used topredict therapeutic sensitivity to a given therapy, for monitoring drug treatments,or identifying pharmacological interactions. Research is now focusing on the dis-covery of highly sensitive and specific biomarkers to enable disease detection atthe earliest possible stage. We can also expect “tailor-made” individual therapiesfor the treatment of complex diseases such as cancer. The low molecular weight(LMW) range of the circulatory proteome is a promising source of information inthis regard. MS platforms can rapidly map the LMW proteome with high resolu-tion, and we can expect that developments in nanotechnology will enable theamplification and harvesting of these LMW biomarkers, thus laying the founda-tion for the discovery and characterization of molecules which will improvedisease detection and diagnostics [11].
The authors of this chapter are fully aware that methods published in the lastfew months cannot be considered as routine clinical recommendations. These

490 A. Telekes et al.
papers are pointing to the direction in which medicine (including diagnoses, ther-apeutic decision-making, or drug development) will change in near future. It maybe surprising that most examples of the clinical use of MS are found in pediatricsand oncology. Considering the vast amount of ongoing research, this will proba-bly change in the near future. It is our hope that the compilation of these data willillustrate that MS is likely to have an invaluable role in further development ofevidence-based medicine.
2. Pediatrics
Pediatrics has its own special viewpoint for diagnoses and therapy. One exampleis that pharmacokinetic parameters are age dependent. Thus, age is one of themain factors in selecting drug doses as well as determining sensitivity to drugeffects. Consequently, the treatment of the very young, as well as the elderly orpregnant, needs special considerations. Another aspect is that malignant tumors ofchildhood origin are greatly different from adult-onset malignancies, in terms ofclinical course and biological nature. Finally, there are diseases that may occurexclusively or almost 100% in childhood. The most common acidurias and fattyacid oxidation disorders belong to this group. They are already discussed in detailin Chapter 16 and partly also in Chapter 12.
MS is widely used for newborn screening. This information is, however, notsufficiently well known. In a study prenatal care providers were evaluated regard-ing their attitudes for providing information about newborn screening (which ismostly based on MS/MS). A survey of 6197 prenatal care providers in Californiaregarding their experience with newborn and prenatal screening services showedthat 80% of respondents believe newborn screening is very important, only 33%of them discuss it with all their patients. More than 50% believe that either pedi-atricians (38%) or hospital staff (36%) will do this. Despite state legislation thatrequires that all pregnant patients should receive the educational booklet, only61% of responders provided this. Communication about newborn screening tocare providers and the public needs to improve [12].
The newborn screening tests vary from country to country, and (within the US)from state to state. In some cases screening is mandatory for only 3 conditions whilein others places for as many as 43 diseases. In most cases MS/MS is used for screen-ing. There is still no universally accepted consensus in this issue. Two attempts hadbeen made previously in the US, one in 1975 by the National Academy of Sciencesreport [13] and the other one in 1988 by the United States Congress Office ofTechnology Assessment report [14]. Despite rapid developments in many areasincluding genetics, proteomics, and screening tools, etc., the next recommendationwas only published in 2006 [15]. All available data were exhaustively analyzed andevaluated to develop these recommendations. Experts in various areas of medicine

Mass spectrometry in clinical treatment 491
were asked to assess and rank conditions that require screening. Each candidate con-dition was evaluated according to three main categories: the availability and featuresof a screening test; availability and complexity of diagnostic tools and services; andpossible treatment options and their efficacy. In a two-step approach professionalsin the legal, health policy, and public health sectors as well as specialists in primarycare, neonatal screening, and pediatrics worked with a steering committee. In thefirst step a set of principles to guide analysis was developed by fixing the criteria toevaluate conditions. Then, supporting evidence and references from the scientificliterature were investigated and compared to the selected criteria by a large group ofexperts. Data collection and a survey allowed quantification of the expert opinions.This was particularly important since some of the criteria were subjective. Threescoring categories were developed (high scoring, moderately scoring, or lowscoring/absence of a newborn screening test) and based on the statistical analysis ofdata each disease was ranked. In the second step further analyses were carried outregarding the evidence associated with each disease. Detailed information was gath-ered from different sources (e.g., via systematic reviews of reference lists includingMedLine, PubMed, and others; books; Internet searches; professional guidelines;clinical evidence; and cost/economic evidence and modeling). For each condition afact sheet was prepared, reflecting the outcome of the overall analyses and this wasonce more reviewed by at least two highly respected experts. These expertsreassessed the data, checked the associated references related to each criterion, eval-uated the quality of the studies that established the evidence, and assigned a value tothe level of evidence. They also made corrections where appropriate (e.g., due tosignificant variances of the survey data). The information obtained from these twotiers of assessment was then refined by means of technology, condition-specific orcost-effectiveness driven recommendations. Finally each condition was assigned toone of the following categories regarding screening recommendation: (A) corepanel (newborn screening is unanimously recommended), (B) secondary targets(those diseases which should be separated from the core panel [differential diag-noses]), and (C) not appropriate for newborn screening (no screening test isavailable). As the final conclusion, 29 diseases were selected in the core panel, and25 into the secondary target category. Another 27 conditions were determined to beinappropriate for newborn screening at present. The 29 diseases for which screeningis recommended as well as the screening method suggested are seen in Table 1.
In diagnoses of some rare conditions, such as bile acid synthetic defects, MScan also be utilized. Nowadays it is possible to screen and rapidly diagnose poten-tial or real inborn errors in bile acid synthesis from urinary bile acid analysis bymeans of MS. Specific mutations in the genes that encode the enzymes responsi-ble for bile acid synthesis can be identified by molecular techniques. Of the sevenknown genetic defects that cause progressive cholestatic liver disease, syndromesof fat-soluble vitamin malabsorption, and neurological disease, six have beenproperly characterized [16].

492 A. Telekes et al.
Table 1
Childhood diseases primarily recommended for screening in ref. [15]
Disease Screening test
(1) Isovaleric acidemia MS/ MS(2) Glutaric acidemia type I MS/MS(3) 3-Hydroxy-3-methyl glutaric aciduria MS/MS(4) Multiple carboxylase deficiency MS/MS(5) Methylmalonic acidemia MS/MS(6) 3-Methylcrotonyl-CoA-carboxylase deficiency MS/MS(7) Methylmalonic acidemia (CblA, B) MS/MS(8) Propionic acidemia MS/MS(9) �-Ketothiolase deficiency MS/MS
(10) Medium-chain acyl-CoA dehydrogenase deficiency MS/MS(11) Very long-chain acyl-CoA dehydrogenase deficiency MS/MS(12) Long-chain 3-OH acyl-CoA dehydrogenase deficiency MS/MS(13) Trifunctional protein deficiency MS/MS(14) Carnitine uptake defect MS/MS(15) Phenylketonuria MS/MS, fluorometric,
enzyme(16) Maple syrup (urine) disease MS/MS(17) Homocystinuria MS/MS(18) Citrullinemia MS/MS(19) Argininosuccinic acidemia MS/MS(20) Tyrosinemia type I MS/MS(21) Hb SS disease (sickle cell anemia) HPLC, IEF(22) Hb S/�-thalassemia HPLC, IEF(23) Hb S/C disease HPLC, IEF(24) Congenital hypothyreoidism RIA, ELISA(25) Congenital adrenal hyperplasia RIA, ELISA, MS/MS(26) Biotinidase deficiency Colorimetric assay, MS/MS
(inconsistent)(27) Classic galactosemia Microbiological for G-1-P,
and galactose andfluorometric assays forGALT activity
(28) Hearing loss Audiometry(29) Cystic fibrosis Immunoreactive trypsinogen �
second tier DNA
Note: (1–9) Organic acid disorders, (10–14) fatty acid oxidation disorders, (15–20) amino aciddisorders, (21–23) hemoglobinopathies, (24 and 25) endocrinopathy, (26) other inborn error ofmetabolism, (27) carbohydrate disorders, (28) miscellaneous genetic conditions, and (29) infectiousdiseases. MS/MS: tandem mass spectrometry, HPLC: high pressure liquid chromatography, IEF:isoelectrofocusing, RIA: radioimmuno assay, and ELISA: enzyme-linked immunosorbent assay.
Mass spectrometry in clinical treatment 493
Inborn metabolic disorders of the pyrimidine degradation pathway were evalu-ated in children with unspecific neurological symptoms. Stable-isotope-labeledreference compounds were used as internal standards to determine uracil andthymine as well as their degradation products in urine by means of reversed-phaseHPLC coupled with electrospray ionization MS/MS. Data obtained from the con-trol group were used to develop age-related reference ranges of all pyrimidinedegradation products. The study was able to identify patients with ornithine tran-scarbamylase deficiency based on the elevated level of uracil, dihydrouracil and�-ureidopropionate, and dihydropyrimidine dehydrogenase (DPYD) deficiency.Treatment-related increase of �-alanine was detected in the urine of a number ofpatients. The authors conclude that in children with unexplained neurologicalsymptoms, especially epileptic seizures with or without psychomotor retardation,pyrimidine metabolites should be quantitatively investigated. The MS-basedmethod and the age-related reference ranges provide a useful tool for diagnosis inclinical practice to detect of partial enzyme deficiencies [17].
3. Oncology
Oncology is one of the most innovative fields of medicine. For effective cancerdrug therapy it is a prerequisite to thoroughly understand tumor biology, cell kinet-ics, pharmacology, and drug resistance. In many cases insufficient therapeuticresults are the main driving force for exploring new therapeutic possibilitiesor research tools. Thus, oncology participated at the birth of, among others, con-trolled clinical trials, immunotherapy, antiapoptotic therapy, antiangiogenic therapy,genomics (including pharmacogenomics), proteomics, bioinformatics, etc. Thekey issues for further progress of oncology are the assignment of new therapeutictargets, developing and evaluating novel treatment entities, and combining thesewith existing therapies. Rational drug treatment indicates that the selection oftherapy is based on considerations of mechanism of action, pharmacokinetics,interactions, and the side effect profile of the drug applied. In other words, with-out deep understanding of the drug used no rational drug treatment can be per-formed. A profound knowledge of drugs, however, is not sufficient for optimaloutcome. In addition, patients’expectations, their relation to the disease, their psychicstatus, cultural and educational background, family support as well as concomitantdiseases, physical performance status, etc., should be known and considered. In fact,modern oncology should combine the most advanced therapeutic innovations with aholistic approach.
Thanks to proteomic applications in diagnosis of cancer, several research groupshave identified proteomic patterns associated with ovarian, prostatic, colorectal,lung, and other cancers. While the sensitivity and specificity of these patterns are

494 A. Telekes et al.
highly satisfactory, there are still some open questions concerning standardization,reproducibility, and inter-laboratory agreement of these data.
Colorectal cancer (CRC) can be screened by detecting blood in the stool, butthis is not specific for gastro-intestinal cancer since many other diseases may yielda similar outcome. The low specificity and sensitivity of the presently used carci-noembryonic antigen test make it a not very good biomarker for detection of CRC.Various proteomic approaches have been developed and evaluated for distin-guishing individuals with CRC from healthy individuals, based on simultaneousdetection and analysis of multiple proteins. In one investigation serum sampleswere studied by SELDI–MS. In order to separate the healthy group from the CRCpatients a multilayer artificial neural network with a back propagation algorithmwas developed. The healthy samples were separated from the CRC samples witha specificity of 93% and sensitivity of 91%. The four top-scoring peaks in theSELDI spectra were selected as the potential detection “fingerprints.” This com-bination of SELDI–MS with artificial neural networks was shown to be anefficient technique for detection and diagnosis of CRC [18]. In another study tocharacterize the serum proteomic patterns of CRC and tumor staging, SELDI–MStechnology was coupled to a CM10 ProteinChip. Patients with different stages ofthe disease were investigated. Stage models were developed and validated. ModelI comprised six protein peaks and could distinguish local CRC patients (Stages Iand II) from regional CRC patients (Stage III) with 86.67% accuracy. Model IIcomprised three protein peaks and could distinguish locoregional CRC patients(Stages I–III) from metastatic CRC patients (Stage IV) with 75% accuracy.Further models were developed to distinguish Stages I and II; I and III; II and III;II and IV; III and IV. Different stage groups could also be distinguished by two-dimensional scatter-plots. This method is applied in the preoperative phase [19].
MS techniques in clinical treatment are used not only to diagnose or stage CRCpatients but also to predict the efficacy of chemotherapy. Oxaliplatin, for example,is a Pt-containing anticancer drug for treating advanced CRC.An association betweenthe levels of oxaliplatin–protein complexes in patients and treatment efficacy wasreported in a study using size-exclusion HPLC with ICP–MS and nano-ESI–MS.Blood samples from 19 CRC patients were collected at 1 and 48 h followinginfusion of oxaliplatin. HPLC/ICP–MS quantification of the oxaliplatin–proteincomplexes showed reduction in the levels of Pt–protein complexes in plasmasamples at 48 h of ca. 50% compared to those at 1 h, and no significant change inhemolysates. The concentrations of hemoglobin (Hb)–oxaliplatin complexes rangedfrom 3.1 to 8.7 �mol. Three distinct mass spectral profiles of the Hb–oxaliplatincomplexes were identified by nano-ESI–MS analysis of the hemolysates.Multivariate analysis of the potential predictors showed that Hb–oxaliplatincomplex concentration, performance status, baseline neutrophil count, andwhether the site of the primary cancer was the colon or rectum were the statisti-cally significant variables. The hazard ratio of 2.4 for the concentration of the

Mass spectrometry in clinical treatment 495
Hb–oxaliplatin complexes indicates that an increased amount of Hb–oxaliplatincomplexes in patients closely correlates with an enhanced risk of cancer progres-sion. The level of the Hb–oxaliplatin complexes in erythrocytes is therefore apotential biomarker for indicating inter-patient variations in the treatment efficacyof oxaliplatin [20].
The mechanism of action of anticancer agents can also be investigated by meansof MS. Interaction of intact human holo-transferrin (holo-Tf) with oxaliplatin wasreported; the complex comprised an intact holo-Tf and an oxaliplatin molecule andwas detected using nanospray ionization MS. The molecular weight of this com-plex was 80,077 Da, an increase of 397 mass units compared to the 79,680 Da pro-tein alone. This indicated that a parent drug molecule was bound to the intactprotein. Interaction between the intact protein and oxaliplatin was further examinedusing size-exclusion HPLC coupled to ICP–MS. HPLC was used to separate theprotein complex and free oxaliplatin, followed by quantitative determination bysimultaneous ICP–MS monitoring of 195Pt and 56Fe. Pt and Fe signals weredetected at the same retention time, identifying the protein–drug complex. The Fesignal was not affected by an increase in the incubation time of the reaction mix-ture containing holo-Tf and oxaliplatin, while the Pt signal increased over time, andthe authors concluded that formation of this complex does not affect the protein-bound Fe. The nanospray and ICP–MS results are evidence that holo-Tf and oxali-platin molecules form complexes through noncovalent binding; therefore, holo-Tfmay be a useful carrier for oxaliplatin delivery [21].
MS can also be used for optimizing cancer therapy. A method for the quantifi-cation of plasma 2�-deoxyuridine (UdR) has been developed and validated. Only1 ml plasma is required, which is subjected to a clean-up step with anion-exchangesolid-phase extraction followed by HPLC separation and atmospheric pressure CI-MS detection in a selected-ion monitoring mode. The method has the sensitivity,precision, accuracy, and selectivity required for routine analysis, the limit of quan-titation being 5 nmol/l, which is certainly sufficient for clinical studies. Cancerpatients treated with the fluoropyrimidine analog capecitabine (N4-pentoxycarbonyl-5�-5-fluorocytidine) have significantly elevated plasma UdR after 1 week of treat-ment, which is consistent with inhibition of thymidylate synthase (TS). Theauthors suggest that the mechanism of antiproliferative toxicity of capecitabine isat least partly due to TS inhibitory activity of its active metabolite 5-fluoro-2�-deoxyuridine monophosphate. Monitoring of plasma UdR concentrations can helpclinicians to optimize scheduling of capecitabine or other TS inhibitors in clinicaltrials. They also found marked differences of plasma UdR between humans androdents. This simple, selective, and sensitive method facilitates pharmacodynamicstudies of TS inhibitors [22].
Pancreatic adenocarcinoma is one of the most devastating and rapidly progres-sive forms of cancer. Currently, fewer than 5% of patients survive more than 5 yearsafter diagnosis, mainly because most patients present with advanced disease.

496 A. Telekes et al.
Consequently, early diagnosis may improve their prognosis. In a recent study inves-tigators aimed to identify unique, tissue-specific protein biomarkers capable of dif-ferentiating pancreatic adenocarcinoma (PC) from adjacent uninvolved pancreatictissue (AP), benign pancreatic disease (B), and nonmalignant tumor tissue (NM).Tissue samples were analyzed on hydrophobic protein chip arrays by SELDITOF–MS. They found that 13 protein peaks differentially expressed between PCand AP, 8 between PC and B, and 12 between PC and NM tissue. Using logisticregression and cross-validation they were able to identify overlapping panels ofpeaks to develop a training model that distinguished PC from AP (77.4% sensitiv-ity, 84.1% specificity), B (83.9% sensitivity, 78.9% specificity), and NM tissue(58.1% sensitivity, 90.5% specificity). The final panels selected correctly classified80.6% of PC and 88.6% of AP samples, 93.5% of PC and 89.5% of B samples, and71.0% of PC and 92.1% of NM samples. Identification of these proteins is impor-tant to understanding the biology of pancreatic cancer. The authors conclude thatthese protein panels could have important diagnostic implications [23]. In anotherattempt to improve serological diagnosis of pancreatic cancer, SELDI protein chipMS was used to analyze serum samples from patients with and without pancreaticcancer. Serum samples from patients with resectable pancreatic adenocarcinomawere compared with samples from age- and sex-matched patients with nonmalig-nant pancreatic diseases, as well as healthy controls. The number of proteins thatcould potentially be identified was increased by a fractionation process using anionexchange and profiling on two ProteinChip surfaces (metal affinity capture andweak cation exchange). A set of protein peaks could discriminate between patientgroups. The unified maximum separability algorithm compared the performance ofthe individual marker panels alone or in conjunction with CA19-9. The two mostdiscriminating protein peaks for distinguishing between patient groups, as identi-fied by SELDI profiling, could differentiate patients with pancreatic cancer fromhealthy controls with a sensitivity of 78% and specificity of 97%. They performedsignificantly better than the current standard serum marker, CA19-9. The investi-gators could further improve the diagnostic accuracy of the two markers by usingthem in combination with CA 19-9. A combination of three SELDI markers andCA19-9 was superior to CA19-9 alone. SELDI markers were superior to CA19-9in distinguishing pancreatic cancer from pancreatitis. The investigators concludedthat SELDI profiling of serum can be used to accurately differentiate individualswith pancreatic cancer from those with other pancreatic diseases and from healthycontrols [24].
Breast cancer is one of the main causes of cancer-related death for womanaffecting more than 1 million females annually throughout the world. To screen forand identify treatment-responsive proteins, the protein expression profile of serumfrom breast cancer patients was determined after 4, 8, 24, and 48 h after docetaxelinfusion using SELDI–MS. The relative expression levels of target proteins werecompared across time. Two representative proteins, kininogen and apolipoprotein

Mass spectrometry in clinical treatment 497
A-II, were identified. Protein expression profiles determined by MS are thus usefulfor identifying treatment-responsive proteins [25]. Toxicity can be severe in case ofchemotherapy. MS-based techniques may also be applied to reduce side effects. Astudy evaluated the association between exposure to unbound docetaxel and neu-tropenia in cancer patients and identified factors influencing unbound docetaxelclearance. Pharmacokinetic studies and toxicity assessments were performed dur-ing the first cycle of therapy. Total docetaxel concentrations were determined byHPLC–MS–MS. The authors conclude that as exposure to unbound docetaxel isclosely related to drug-induced hematologic toxicity, this needs to be considered infuture pharmacological investigations [26].
Ricolleau et al. have looked for novel prognostic biomarkers to help directtreatment decisions by typing subgroups of node-negative breast cancer patients.In a proteomic approach SELDI–MS was used to identify differentially expressedproteins with a prognostic impact in node-negative breast cancer patients with norelapse vs. patients with metastatic relapse. Ubiquitin and ferritin light chain(FLC) proved to be interesting in this regard. Their differential expression was fur-ther confirmed by Western blotting analyses and immunohistochemistry. The massspectrometric protein profiling in this study shows that a high level of cytosolicubiquitin and/or a low level of FLC indicate a good prognosis [27].
In another study SELDI–MS was employed in a comparative analysis of lobu-lar invasive vs. ductal invasive breast tumor tissue samples. The aim was to iden-tify differentially expressed proteins and peptides, and to validate the techniquefor biomarker identification. Mass signals corresponding to an estimated 140native peptides and proteins in each tumor were identified. Only 14% of the masssignals were present in more than six samples of either HMEC or MCF-7, show-ing a large degree of great heterogeneity. The authors conclude that the lowamount of identified peptides and proteins and the large heterogeneity suggest thatSELDI is not well suited for biomarker identification in complex samples [28].
Prognostic markers of the aggressive phenotype of HER-2/neu-positive breastcancer were also studied by MS. It is known that the tyrosine kinase receptorErbB2 (HER-2/neu) is overexpressed in up to 30% of breast cancers and is asso-ciated with poor prognosis and an increased likelihood of metastasis, especially innode-positive tumors. Differentially expressed proteins in two subsets of tumorcells from HER-2/neu-positive and HER-2/neu-negative tumors were identified by2D electrophoresis and MALDI–TOF/TOF MS/MS. Differential expression ofseveral key cell cycle modulators was found, which were linked with increasedproliferation of the HER-2/neu-overexpressing cells. The findings suggest thatHER-2/neu signaling may result in enhanced activation of various metabolic,stress-responsive, antioxidative, and detoxification processes within the breasttumor microenvironment. Thus, it was hypothesized that these identified changesin the cellular proteome are likely to drive cell proliferation and tissue invasion andthat the key cell cycle modulators might serve as useful targets for the development

498 A. Telekes et al.
of therapeutic strategies to negate the metastatic potential of HER-2/neu-positivebreast tumors [29].
One-third to half of early breast cancer (EBC) patients are considered to be athigh risk of developing metastatic recurrence. Work is being done to improvepredicting of clinical outcomes in order to optimize and tailor therapeutic strate-gies. Goncalves et al. identified a protein signature that correlates with metastaticrelapse, using SELDI profiling of early postoperative serum from high-risk EBCpatients. Several protein peaks were differentially expressed. Using chemometric(bioinformatics) tools, a multiprotein model was built that correctly predictedoutcome in 83% of patients. The multiprotein index was used to classify the“good prognosis” and “poor prognosis” patients whose 5-year metastasis-freesurvival rates were 83 and 22%, respectively. The authors conclude that thepostoperative serum protein pattern could have an important prognostic value inhigh-risk EBC [30].
Not all biomarkers are peptides or proteins. Various estrogens may also serveas diagnostic or treatment indicative tools. Also, individual patterns of estrogenmetabolism can influence an individual’s risk of developing breast cancer. AnHPLC–MS method to measure the concentrations of 15 endogenous estrogens andtheir metabolites in human urine has been developed and validated. The limit ofquantitation for each estrogen is 0.02 ng/0.5 ml urine sample, which is well withinclinical relevance. This method gives accurate, precise, and specific measure-ments of endogenous estrogen metabolites. It will be useful in future research onbreast cancer prevention, screening, and treatment [31].
Gene expression analysis is considered a promising tool for predicting the clin-ical course of malignant disease and the response to antineoplastic therapy. Verylittle information is available regarding the protein expression pattern of humantumors. Proteins of interest can now be identified by their expression and/or mod-ification pattern in 2-DE. Hudelist et al. identified a proteomic pattern that is char-acteristic for malignant breast epithelium by differential 2-DE analysis of sets ofmicrodissected malignant breast epithelia and corresponding adjacent normalbreast epithelia from patients with invasive breast carcinoma. They found that32 protein spots were selectively regulated in malignant epithelium. MALDI–TOFand/or immunoblotting for protein identification was then applied, and identified13 proteins that were not previously associated with breast cancer. This brings usa step further in understanding oncogenesis. In addition, this strategy can be used inthe characterization of the malignant phenotype of individual tumors, and therebyidentify novel targets for antineoplastic therapy [32].
Leptomeningeal metastasis (LM) occurs in 5% of patients with breast cancer.This complication can lead to neurological deterioration without early diagnosisand treatment. This is complicated by the fact that 25% of cerebrospinal fluid(CSF) samples produce false-negative results when examined cytologically.Dekker et al. have developed an MS-based method to investigate protein expression

Mass spectrometry in clinical treatment 499
patterns in the CSF from patients with breast cancer with and without LM. CSFsamples from these patients and controls were digested with trypsin, and theresulting peptides were quantified by MALDI–TOF MS. Mass spectral analysisand a comparison between patient groups with bioinformatics tools showed 895possible peak positions, of which 164 discriminated between the patient groups.On the basis of these discriminatory masses, a classifier was built to distinguishbreast cancer patients with and without LM, having a maximum accuracy of 77%with a sensitivity of 79% and a specificity of 76%. This is a step forward indiagnosing LM in patients with breast cancer. This method is transferable todiagnostic assays for other neurological disorders [33].
Currently, no satisfactory biomarkers are available to screen for lung cancer.Serum SELDI proteomic patterns have been applied to distinguish lung cancerpatients from healthy individuals. Serum samples from lung cancer patients andcontrols were randomly divided into a training set and a blinded test set, both ofwhich included sera from patients with Stages I/ II lung cancer, Stages III / IV lungcancer, and healthy controls. Five protein peaks were automatically chosen as abiomarker pattern in the training set. When the SELDI marker pattern was testedwith the blinded test set, sensitivity was 86.9%, and specificity 80.0%, with a pos-itive predictive value of 92.4%. The SELDI marker pattern showed a sensitivity of91.4% in the detection of nonsmall cell lung cancers. For lung cancers in Stages I/IIdetection sensitivity was 79.1%. SELDI–TOF–MS can thus be considered apotential tool for the screening of lung cancer [34].
References
1. Tanaka, K., Budd, M.A., Efron, M.L. and Isselbacher, K.J., Isovaleric acidemia: a new geneticdefect of leucine metabolism. Proc. Natl. Acad. Sci. U.S.A., 56, 236–242 (1966).
2. Gaskell, S.J., Guenat, C., Millington, D.S., Maltby, D.A. and Roe, C.R., Differentiation of iso-meric acylcarnitines using tandem mass spectrometry. Anal. Chem., 58, 2801–2805 (1986).
3. Millington, D.S., Maltby, D.A. and Roe, C.R., Rapid detection of argininosuccinic aciduriaand citrullinuria by fast atom bombardment and tandem mass spectrometry. Clin. Chim. Acta,155, 173–178 (1986).
4. Roe, C.R., Millington, D.S., Maltby, D.A. and Kinnebrew, P., Recognition of medium-chainacyl-o-dehydrogenase deficiency in asymptomatic siblings of children dying of sudden infantdeath or Reye-like syndromes. J. Pediatr., 108, 13–18 (1986).
5. Petricoin, E.F. and Liotta, L.A., Proteomic approaches in cancer risk and response assessment.Trends Mol. Med., 10(2), 59–64 (2004).
6. Hong, H., Dragan, Y., Epstein, J., Teitel, C., Chen, B., Xie, Q., Fang, H., Shi, L., Perkins, R.and Tong, W., Quality control and quality assessment of data from surface-enhanced laserdesorption/ionization (SELDI) time-of flight (TOF) mass spectrometry (MS). BMCBioinformatics, 6(Suppl. 2), S5 (2005).
7. Carlson, S.M., Najmi, A., Whitin, J.C. and Cohen, H.J., Improving feature detection andanalysis of surface-enhanced laser desorption/ionization–time of flight mass spectra.Proteomics, 5(11), 2778–2788 (2005).

500 A. Telekes et al.
8. Righetti, P.G., Castagna, A., Antonucci, F., Piubelli, C., Cecconi, D., Campostrini, M.,Rustichelli, C., Antonioli, P., Zanusso, G., Monaco, S., Lomas, L. and Boschetti, E., Proteomeanalysis in the clinical chemistry laboratory: myth or reality? Clin. Chim. Acta, 357(2),123–139 (2005).
9. Lathrop, J.T., Hayes, T.K., Carrick, K. and Hammond, D.J., Rarity gives a charm: evaluationof trace proteins in plasma and serum. Expert Rev. Proteomics, 2(3), 393–406 (2005).
10. Lee, H.J., Lee, E.Y., Kwon, M.S. and Paik, Y.K., Biomarker discovery from the plasmaproteome using multidimensional fractionation proteomics. Curr. Opin. Chem. Biol., 10(1),42–49 (2006).
11. Calve, K.R., Liotta, L.A. and Petricoin, E.F., Clinical proteomics: from biomarker discovery andcell signaling profiles to individualized personal therapy. Biosci. Rep., 25(1–2), 107–125 (2005).
12. Faulkner, L.A., Feuchtbaum, L.B., Graham, S., Bolstad, J.P. and Cunningham, G.C., The new-born screening educational gap: what prenatal care providers do compared with what isexpected. Am. J. Obstet. Gynecol., 194(1), 131–137 (2006).
13. National Research Council, Committee for the Study of Inborn Errors of Metabolism, GeneticScreening: Programs, Principles, and Research. National Academy of Sciences, Washington,DC, 1975.
14. U.S. Congress, Office of Technology Assessment, Healthy Children: Investing in the Future,Appendix 1: Data and Methods used in OTA’S Cost-Effectiveness Analysis of Strategies forNewborn Screening. Superintendent of Documents, U.S. Government Printing Office,Washington, DC 20402-9325, 1988, available at http://www.wws.princeton.edu/cgi-bin/byteserv.prl /ota/disk2/1988/8819/881919.PDF, accessed April 7, 2006.
15. Watson, M.S., Lloyd-Puryear, M.A., Mann, M.Y., Rinaldo, P. and Howell, R.R., Main report.Genet. Med., 8(Suppl. 5) 12S–252S (2006).
16. Setchell, K.D. and Heubi, J.E., Defects in bile acid biosynthesis—diagnosis and treatment.J. Pediatr. Gastroenterol. Nutr., 43(Suppl. 1), S17–S22 (2006).
17. Schmidt, C., Hofmann, U., Kohlmuller, D., Murdter, T., Zanger, U.M., Schwab, M. andHoffmann, G.F., Comprehensive analysis of pyrimidine metabolism in 450 children withunspecific neurological symptoms using high-pressure liquid chromatography–electrosprayionization tandem mass spectrometry. J. Inherit. Metab. Dis., 28(6), 1109–1122 (2005).
18. Chen, Y.D., Zheng, S., Yu, J.K. and Hu, X., Artificial neural networks analysis of surface-enhanced laser desorption/ ionization mass spectra of serum protein pattern distinguishescolorectal cancer from healthy population. Clin. Cancer Res., 10(24), 8380–8385 (2004).
19. Xu, W.H., Chen, Y.D., Hu, Y., Yu, J.K., Wu, X.G., Jiang, T.J., Zheng, S. and Zhang, S.Z.,Preoperatively molecular staging with CM10 ProteinChip and SELDI–TOF–MS for col-orectal cancer patients. J. Zhejiang Univ. Sci. B, 7(3), 235–240 (2006).
20. Mandal, R., Sawyer, M.B. and Li, X.F., Mass spectrometry study of hemoglobin–oxaliplatincomplexes in colorectal cancer patients and potential association with chemotherapeuticresponses. Rapid Commun. Mass Spectrom., 20(17), 2533–2538 (2006).
21. Zhao, Y.Y., Mandal, R. and Li, F.X., Intact human holo-transferrin interaction with oxaliplatin.Rapid Commun. Mass Spectrom., 19(14), 1956–1962 (2005).
22. Li, K.M., Rivory, L.P. and Clarke, S.J., Rapid quantitation of plasma 2�-deoxyuridine by high-performance liquid chromatography/atmospheric pressure chemical ionization mass spec-trometry and its application to pharmacodynamic studies in cancer patients. J. Chromatogr. BAnalyt. Technol. Biomed. Life Sci., 820(1), 121–130 (2005).
23. Scarlett, C.J., Smith, R.C., Saxby, A., Nielsen, A., Samra, J.S., Wilson, S.R. and Baxter, R.C.,Proteomic classification of pancreatic adenocarcinoma tissue using protein chip technology.Gastroenterology, 130(6), 1670–1678 (2006).
24. Koopmann, J., Zhang, Z., White, N., Rosencweig, J., Fedarko, N., Jagannath, S., Canto, M.I.,Yeo, C.J., Chan, D.W. and Goggins, M., Serum diagnosis of pancreatic adenocarcinoma using

Mass spectrometry in clinical treatment 501
surface-enhanced laser desorption and ionization mass spectrometry. Clin. Cancer Res., 10(3),860–868 (2004).
25. Heike, Y., Hosokawa, M., Osumi, S., Fujii, D., Aogi, K., Takigawa, N., Ida, M., Tajiri, H.,Eguchi, K., Shiwa, M., Wakatabe, R., Arikuni, H., Takaue, Y. and Takashima, S., Identificationof serum proteins related to adverse effects induced by docetaxel infusion from protein expres-sion profiles of serum using SELDI ProteinChip system. Anticancer Res., 25(2B), 1197–1203(2005).
26. Baker, S.D., Li, J., ten Tije, A.J., Figg, W.D., Graveland, W., Verweij, J. and Sparreboom, A.,Relationship of systemic exposure to unbound docetaxel and neutropenia. Clin. Pharmacol.Ther., 77(1), 43–53 (2005).
27. Ricolleau, G., Charbonnel, C., Lode, L., Loussouarn, D., Joalland, M.P., Bogumil, R.,Jourdain, S., Minvielle, S., Campone, M., Deporte-Fety, R., Campion, R. and Jezequel, P.,Surface-enhanced laser desorption/ ionization time of flight mass spectrometry protein profil-ing identifies ubiquitin and ferritin light chain as prognostic biomarkers in node-negativebreast cancer tumors. Proteomics, 6(6), 1963–1975 (2006).
28. Traub, F., Feist, H., Kreipe, H.H. and Pich, A., SELDI–MS-based expression profiling of duc-tal invasive and lobular invasive human breast carcinomas. Pathol. Res. Pract., 201(12),763–770 (2005).
29. Zhang, D., Tai, L.K., Wong, L.L., Chiu, L.L., Sethi, S.K. and Koay, E.S., Proteomic studyreveals that proteins involved in metabolic and detoxification pathways are highly expressedin HER-2/neu-positive breast cancer. Mol. Cell Proteomics, 4(11), 1686–1696 (2005).
30. Gonclaves, A., Esterni, B., Bertucci, F., Sauvan, R., Chabannon, C., Cubizolles, M., Bardou, V.J.,Houvenaegel, G., Jacquemier, J., Granjeaud, S., Meng, X.Y., Fung, E.T., Birnbaum, D.,Maranichi, D., Viens, P. and Borg, J.P., Postoperative serum proteomic profiles may predictmetastatic relapse in high-risk primary breast cancer patients receiving adjuvant chemotherapy.Oncogene, 25(7), 981–989 (2006).
31. Xu, X., Veenstra, T.D., Fox, S.D., Roman, J.M., Issaq, H.J., Falk, R., Saavedra, J.E., Keefer,L.K. and Ziegler, R.G., Measuring fifteen endogenous estrogens simultaneously in humanurine by high-performance liquid chromatography–mass spectrometry. Anal. Chem., 77(20),6646–6654 (2005).
32. Hudelist, G., Singer, C.F., Pischinger, K.I., Kaserer, K., Manavi, M., Kubista, E. andCzerwenka, K.F., Proteomic analysis in human breast cancer: identification of a characteristicprotein expression profile of malignant breast epithelium. Proteomics, 6(6), 1989–2002 (2006).
33. Dekker, L.J., Boogerd, W., Stockhammer, G., Dalebout, J.C., Ciccama, I., Zheng, P., Bonfrer, J.M.,Verschuuren, J.J., Jenster, G., Verbeek, M.M., Luider, T.M. and Smitt, P.A., MALDI–TOF mass spectrometry analysis of cerebrospinal fluid tryptic peptide profiles to diagnose lep-tomeningeal metastases in patients with breast cancer. Mol. Cell Proteomics, 4(9), 1341–1349(2005).
34. Yang, S.Y., Xiao, X.Y., Zhang, W.G., Zhang, L.J., Zhang, W., Zhou, B., Chen, G. and He, D.C.,Application of serum SELDI proteomic patterns in diagnosis of lung cancer. BMC Cancer, 5,83 (2005).

This page intentionally left blank

Part VEmerging Areas

This page intentionally left blank

Medical Applications of Mass SpectrometryK. Vékey, A. Telekes and A. Vertes (editors)© 2008 Elsevier B.V. All rights reserved
505
Chapter 22
Biomarker discovery
BRADLEY J. THATCHERa,* and EMILIA CAPUTOa,1
aInstitute of Genetics and Biophysics-IGB, CNR, Naples, Italy
1. Introduction 5061.1. Chemical background for medical doctors 5061.2. Basic medical aspects 5071.3. Basic concepts 507
2. Biomarkers in medicine 5083. Important definitions 5094. Biomarkers discovery and complexity of biological systems 5105. Biomarker discovery and “omics” 5126. The biomarker discovery project 512
6.1. The biomarker discovery group 5126.2. The biomarker discovery experiment 513
7. Challenges in the biomarker discovery pathway 5167.1. Asking the right question 5167.2. Sample availability 5187.3. Which sample should be used? 5197.4. Sample management 520
8. Technical issues in experimental design 5228.1. Sample preparation 5228.2. Separation technique 5248.3. Bioinformatics 5248.4. Methods 525
9. The discovery process overview 5269.1. Tools for biomarker discovery 5269.2. Biomarker identification and validation 527
10. Conclusions 530References 531
*Corresponding author. Address: C.da Forma, Villa Iris, 82034 Guardia, Sanframondi (BN), Italy;Tel.: 00 39335 7441346. E-mail: [email protected] (B.J. Thatcher). [email protected] (E. Caputo).

506 B.J. Thatcher and E. Caputo
1. Introduction
The interest in biomarker discovery has increased in the last several years. This isespecially true in the area of clinical research where biomarkers can be used toaffect patient care. Biomarkers are tools for the diagnosis, monitoring of therapy,and screening for a number of diseases. Biomarkers can also be used to detectdisease risk factors allowing the physician to recommend or prescribe more inten-sive monitoring or testing of a patient. Over the past 20 years we have seen theemergence of tests based on disease biomarkers in the clinic. Several moleculeshave been identified as markers, but only some of them are actually good enough[1] to be used as screening tests that have become standards of care in many coun-tries and thus are used to examine entire populations.
1.1. Chemical background for medical doctors
The primary issues of concern at the start of a biomarker discovery experimentare the clinical questions. It is worth the time to stop and think for a moment aboutthe biochemistry of disease and the chemistry of potential biomarkers associatedwith disease. There are very significant chemical differences between classes ofbiomolecules and this affects the design and experimental protocols that are usedto find, separate, identify, and assay each compound that may be of interest.
The majority of separation tools available to the biochemist for the simplificationof biological material are dependent on the physical and chemical properties of themolecules being studied. It is important to understand that it is not possible in mostcases to look at diverse classes of molecules at the same time and from the samesample preparation methods. Separation is required during the process of biomarkerdiscovery since most biological samples are much complex to allow direct analysis.Separation tools continue to be improved but are a long way from the level ofresolution required to separate even a few percent of the diversity of a single classof compound at one time. The logical extension of this is simply to say that we willuse multiple runs to separate all the components. This idea, although logical, doesnot work well in the real world since each separation causes significant sample loss;the use of three or four methods one after another will consume the majority of thesample and leave little to be analyzed. Thus, one should discuss the separationoptions for a discovery experiment before sample collection has started so that thequantity and type of sample collected will be of maximal utility. This does not pre-clude the use of archived samples for validation and biomarker purification andcharacterization, but it is best to collect the discovery samples for optimal analysis.
The tools used to detect biomarkers are also varied, and it might not be possibleto adapt instrumentation from one purpose to another. This is also something todiscuss with a biochemist, chemist before the research plan is decided. Even withthese limitations, well-designed and executed biomarker projects have been verysuccessful in the past and will continue to be more successful in the future.

Biomarker discovery 507
The key to this success is a multidisciplinary approach to biomarker discoverywhere the different members of a team communicate well and try to understandwhat will and will not work and what is and is not possible before planning andstarting the project.
1.2. Basic medical aspects
Medicine and disease pathology are immensely complicated issues. In either of thesecases there are often a lot of questions for which there are no clear answers.This is whythe medical field is devoting so much time, effort, and money in the search for bio-markers and the development of diagnostics. Disease pathology and the progression ofdiseases can vary from case to case, but there are often a number of similarities; this isin fact how diseases are classified. It is a good idea to have a discussion with a medicaldoctor about the disease, its symptoms, and progression to develop an understandingof some of the variables that might be observed in the samples. It is also noteworthythat in the process of biomarker discovery it is the consistency of potential biomarkersbetween disease samples that one is trying to identify and not the variability betweendisease samples. Bioinformatics will help in this process in two ways: by identifyingmolecules that are consistent in the disease and normal samples, and by focusing on themost significant changes between the control and disease samples.
From a chemical and biochemical point of view, biomarker discovery use arange of familiar techniques and tools that have been around for a long time suchas SDS-PAGE, HPLC, mass spectrometry, etc. What is new is the number of sam-ples and the data analysis that are often new and complicated. Biological systemsespecially involving human subjects are highly variable and lack a much of theconsistency that is seen in other experimental systems such as animal models.Thus, it is important to choose methods that can be applied to large numbers ofsamples in order to deal with the statistical requirements of human samples. In aclinical study it is not uncommon to think of hundreds or thousands of samples tovalidate a biomarker. This will require the use of bioinformatics to analyze andinterpret data and to keep track of the vast amount of data and information that willbe used in the process of biomarker discovery and validation.
1.3. Basic concepts
The search for biomarkers is not a simple task. There are several challenges in thepathway to a validated biomarker. These challenges include sample availability,the use of large numbers of samples for validation, technical issues in experimen-tal design, assay development, the necessity for bioinformatics, and asking theright question so that the results of the experiment will have meaning and be ofpractical use in the clinic.
The recent advancements in separation technology, mass spectrometry, andinformatics for the biological sciences have been very useful in accomplishing this

508 B.J. Thatcher and E. Caputo
task [2,3]. Mass spectrometry has improved the ability to detect, quantify, and iden-tify biomarkers with an increased speed and sensitivity. These technologies havebecome much more user-friendly and their availability to researchers has increased.These advancements have facilitated biomarker discovery on clinically relevantnumbers of samples [4–6].
However, biomarker discovery is one of the most difficult types of projects inbiology. This is partly due to the level of complexity and inherent inconsistenciesthat are present in biological systems [7]. In addition, the pathology of a diseaseis rarely simple and there can be closely related conditions that complicate thediagnosis and thus the search for biomarkers.
To this end it is important to take a multidisciplinary approach to biomarker dis-covery. There are a number of difficult tasks to be accomplished in the process ofbiomarker discovery, each requiring expertise in different fields, separation tech-nology, medicine, pathology of the disease, the chemistry of the type of moleculethat is the target of the study, and statistical analysis. The conclusion from thesefacts is that a multidisciplinary approach to biomarker discovery is necessary.Once the group is assembled, it is then vital that members of the group listen toeach other about the capabilities and weaknesses in each area of a project beforestarting the actual work.
This chapter will focus on assisting in providing some suggestions to minimizethese challenges and hopefully assist in the design of successful biomarker discoveryprojects. We will not cover detailed methodologies that are admirably covered byother contributors to this work. What we will concentrate on are the philosophy andpractical aspects of designing a successful biomarker discovery project; we willprovide some suggestions concerning ways to validate the prospective biomarkersto prepare for assay development and the use of biomarkers in the clinic. We will alsotry and identify and explain some of the biggest challenges faced by a researcherduring the development of a biomarker discovery experiment.
2. Biomarkers in medicine
The utility of biomarkers is the reason for the funding of projects based on newbiomarkers, which has increased in the last few years. Once a successful biomarkerdiagnostic is developed the cost for screening large populations is reduced and thisresults in lower health-care costs in the short term. In the long term, this will facilitatethe increased use of screening tests for a greater number of diseases. The increasedscreening of populations facilitates early diagnosis, better control of chronic condi-tions, and improved health in large populations, thereby improving patient care andreducing the cost of health care. Current screening tools can be resource intensive,expensive, and requiring expert examination of the data (mammograms, ultrasound,biopsy, etc.), and this causes their use to be limited. A biomarker test is generally less

Biomarker discovery 509
expensive and invasive than other forms of testing facilitating a more efficient use ofmedical resources while improving health care. This becomes clear when we look atthe use of diagnostic tests in the clinic. The measurement of cholesterol, for example,is so inexpensive and noninvasive that many people are tested twice a year in theirentire life. This results in early detection of a problem and early treatment reducingthe risk of disease resulting from high cholesterol.
The ultimate goal of biomarker discovery is the development of screening teststo detect diseases before they are symptomatic or at a stage where they are moreeffectively treated. This is an ambitious goal and will require many years ordecades of basic and medical research. Each discovered and validated biomarkeris a contribution toward this goal.
The short-term goal of many researchers in the field of medical biomarkerdiscovery is to achieve two things. The first is the discovery and validation of bio-markers for diagnostic/prognostic purposes and to improve patient care. The secondis to provide information that will assist in the understanding of the pathology of thedisease. Both of these goals are worked on together using the same data and thesame experiments.
The data generated from the discovery of diagnostic biomarkers are valuable infor-mation for basic science and research into disease pathology. Information aboutchanges in the concentration of a biomolecule, modified forms of a compound,changes in protein expression, and posttranslational modifications, just to name a few,provides clues to the changes in the cellular machinery and pathways. This infor-mation can be used to determine where one should look for the changes that con-tribute to the disease pathology. Biomarkers will not provide all of the information,but they are a good tool for sorting out where to start looking.
The real goal here is to improve the information that a test can provide thephysician in:
• Differentiating diseases that are currently difficult to separate or diagnose• Detecting a disease condition earlier when treatments are more effective• Understanding the pathology of a condition that is affecting a patient• Assisting in choosing the best course of treatment• Reducing the negative side effects of a treatment• Monitoring the course of treatment to determine effectivenessIn summary, the proposed role of the biomarkers in medicine is to facilitate
early diagnosis, the customization of treatment, and improved quality and quan-tity of life for the patient.
3. Important definitions
The terms used in this chapter must be understood in the context of their use. Tosimplify this we think that it is important that some of the terms that will be useda number of times are clearly defined.

510 B.J. Thatcher and E. Caputo
Disease sample—a sample that is obtained from a patient who has the condi-tion that one is looking for biomarkers. This should be confirmed by as completea diagnosis as possible.
Control sample—a sample from a person who does not have the condition/disease that one is looking for biomarkers, but may have a related condition, anotherdisease that has a similar diagnosis or pathology, or a healthy individual.
Matched samples—samples that are the same in as many parameters other thanthe disease as possible, factors such as age, sex, racial background, geographicallocation, etc. A perfect example of this would be samples from the same personbefore and after a successful treatment.
Biomarker discovery—an experiment designed to observe the maximum diver-sity of a particular class of molecule between disease and control samples to finddifferences resulting from a specific condition. This could include differences inquantity, structure, new molecules, modifications to common molecules, changesin structure, function, posttranslational modifications, etc. The number of samplesin this type of experiment is only large enough to permit reliable statistical analysisto be done. (6–15 samples).
Primary validation—the second part of discovery where a larger number of sam-ples are used to verify or eliminate potential biomarkers. This type of experimentis normally focused on the best (statistical) biomarkers observed in the discoveryor identified in the discovery experiment and may use different methodology tofacilitate a larger number of samples to be used to increase the statistical confidenceand eliminate weak or poor biomarkers from the discovery experiment. This is alsothe stage of the experiment where one starts using samples from related conditions,other geographical areas, etc. The goal of the validation experiment is to focus onthe potential biomarkers that are most likely to answer the research question, and toreduce the number of possible biomarkers from the discovery phase before furthertime, effort, and money are invested in purification, identification, and characteri-zation of the molecule (30–50 samples).
Validation—the running of a large number of samples to look at the performanceof the biomarkers in a population. This requires a sample set large and diverseenough to allow a statistical sampling of a population (hundreds to thousands ofsamples), in short a clinical trial.
4. Biomarkers discovery and complexity of biological systems
Biomarkers discovery is one of the most difficult tasks in biology partly due to thelevel of complexity of biological systems. To start with there are the problems of“normal biological variation” of 10–40%. This type of variation is impossible toreduce or eliminate from an experiment and thus must be accounted for in thestatistical analysis. This variation arises from the differences in individuals resulting

Biomarker discovery 511
from genetic background, environment, diet, age, sex, and an almost limitless set ofvariables. In well-controlled systems like animal models, a number of these vari-ables can be controlled and, as a result, we see that the normal biological variationcan be reduced and, to some degree, controlled. In a medical environment usinghumans for the study subjects this is not possible or practical. In fact for a numberof commonly used medical tests there is a normal range for the amount of an analyteand values outside this range are considered a problem. Well-established tests suchas cholesterol, blood glucose, triglycerides, etc., all have a normal range, not asingle normal value. The same turns out to be true for other biomarkers as well. Inthe process of discovery, validation, and assay development, it will be necessary touse statistical analysis to determine the normal and disease concentration ranges foreach biomarker.
The problem of biological variation can be minimized by good study design andcareful statistical analysis of data. By carefully selecting the patients for the discoveryphase of the experiment one can focus the search on biomarkers that are directlyrelated to the question of interest. To this end it is advisable during the biomarker dis-covery experiments to select samples where the diagnosis is clear and the patient dataare as uncomplicated as possible. Uncomplicated patient data indicate samples frompatients with as few medical complications as possible other than those resulting fromthe disease state under investigation. For example, selecting a sample from a personwith cancer as their only medical condition is preferable to a cancer patient with heartdisease, high blood pressure, or diabetes for use in the discovery experiment. Thistype of sample selection will reduce the number of variables that will have to beanalyzed, potential sources for biomarkers from other diseases, and the complexity ofthe data analysis. The initial discovery experiment can generally use a relatively smallnumber of samples; a set of 6–15 diseased persons and an equal number of matched(age, sex, race, etc.) controls is a good number to work with provided that thesesamples are well chosen. The goal of the discovery experiment is to find as manypotential markers as possible. The primary validation experiment should be larger:from 30 to 50 samples and matched controls. The goal of the primary validation ex-periment is to test the discovered markers and select the best of the discovery markerset to focus further efforts on.
The exact number of samples that you will need to work with in both the dis-covery and primary validation phases of the project depends on the techniques thatare used and the complexity of the disease and the patient samples that you areworking with.
The second issue the investigator will face is the immense number and diversityof biomolecules present in a biological system. These molecules can range fromsimple organic or inorganic compounds such as glucose and Na� to large complexbiopolymers such as lipids, proteins, and carbohydrates. To further complicate thepicture, biopolymers can be mixed with each other to form lipopolysaccharides,glycoproteins, lipoproteins, etc. From this complicated picture the investigator

512 B.J. Thatcher and E. Caputo
looking for a biomarker must find the differences that highlight a particular condi-tion from this complicated array of molecules. This might seem like an impossibletask, but it is not. Successful biomarker discovery has aided the advancementof medicine over the last century.
5. Biomarker discovery and “omics”
In the discussion of biomarker discovery a number of “omics” terms have been usedto divide the types of biomolecules into different fields: metabolomics, lipidomics,glycomics, proteomics, etc. This has some usefulness in defining what one is look-ing for, but unfortunately biology is not that simple. In many cases natural lines donot really exist between different types of biomolecules.
To highlight this point when we look in a textbook of biochemistry, we can easilyfind examples of lipopolysaccharides, glycoproteins, and lipoproteins. This compli-cation is not simplified in the literature; as a practical example when searching theliterature for glycomics one will quickly find cases of glycoproteins. With the ambi-guities that we see in trying to classify lipidomics, glycomics, and proteomics, it ismore important to think about the chemistry of the molecules that one is interested.The reason for this is that separation and identification tools are based on the physi-cal and chemical properties of a molecule and thus understanding their chemistry isthe key to working effectively with a class of compounds. One must keep in mind thatthere may (in rare cases) be some unexpected compounds in a sample preparation thatshould only contain one class of compound.
In this discussion of biomarker discovery, the arguments will be appropriate to allof the “omics” that have been coined. The fundamental differences between thesedifferent classes of biomolecules are the specific tools/techniques used for separa-tion, detection, and identification. The principles governing design and developmentof biomarker discovery experiments are not affected by the type of compound or thetools used for the experiments.
6. The biomarker discovery project
In order to design a successful biomarker discovery project it is necessary to puttogether the right people and a solid experimental plan. A brief description of thebiomarker discovery group and experiment are outlined in this section.
6.1. The biomarker discovery group
When putting together a group for biomarker discovery it is important to understandwhat type of expertise will be required to accomplish the goals of the project. This is

Biomarker discovery 513
best done before the grant (budget) for the project has been applied for since thewriting of the proposal will take care of most of the preliminary discussions andplanning of the project and will allow time to refine the research question, ideas,and project before starting the work.
The anatomy of a successful biomarker discovery group generally contains thefollowing skill sets:
• A biologist /biochemist who has research experience in the specific disease ofinterest
• A good understanding of separations, detection, and chemistry of the mole-cule type of interest
• A physician who has an active clinical practice and the ability to obtain theappropriate samples and an interest in research
• A mass spectroscopy expert with an understanding of the type of moleculesthat are to be studied and their identification and characterization
• A person with a good understanding of biological statistical analysis• A reliable technician/student to do the sample preparation and experimental
workThe research leader will need to put together as many people as necessary to
obtain at least the skills listed above to run a successful project. It is also importantthat each member of the group is interested and committed to the project. Whenthe group is assembled it is then time to develop a research question and anexperimental plan to answer the question.
6.2. The biomarker discovery experiment
There are two main points we have to keep in mind before starting a biomarkerdiscovery experiment.
6.2.1. Where do biomarkers come from?
There are several theories that try to explain the origin of biomarkers and why theyare found. The simple truth of the matter is that biomarkers are produced by changesin biological processes of anabolism and catabolism, i.e., changes in metabolism.All biological molecules are used in metabolic processes; the exception to this issome xenobiotics but we will not discuss those here since they are not biomarkers.Changes in metabolism can result in the simple buildup or reduction in concentra-tion of normal metabolites which can act as biomarkers. Furthermore, there is a pos-sibility of modifications to biomolecules; using proteins as an example, markers areobserved which are truncated, glutathionylated, and cystinilated, and with changesin the carbohydrate structure just to name a few. These types of modifications arecaused by changes in enzymes and the metabolic pathways responsible for theseposttranslational modifications. The results of these types of cellular changes are

514 B.J. Thatcher and E. Caputo
generally the most common type of biomarkers observed since a small change inenzyme concentration, function, or pathway efficiency can produce large changesin the concentration of products or substrates. This produces an amplification ofthe metabolic changes in the organism. The results of these changes are usuallyeasier to detect and quantify than the changes that produce them. Thus, the changein product concentration is observed and this becomes the surrogate biomarker forthis metabolic change. In the majority of cases the actual change in the enzyme canonly be detected/measured when it is looked for in a very specific way by usingantibodies or a highly purified preparation or a detailed examination of enzymeactivity/kinetics. Changes in metabolism can also cause the expression of proteins/enzymes not normally expressed in a tissue, the activation of enzymes that are nor-mally inhibited, and the modification of enzymes to alter their activity; all thesetypes of changes will produce products that can more easily be observed than theenzymatic change that produced them.
Example: Let us look at one example of this process currently used in medicine;the example that we will use is the control of diabetes in patients. For a number ofreasons glucose and not insulin concentration is used to monitor this disease. Theeffect of a small amount of the hormone insulin can cause a big change in the concen-tration of glucose in the blood, which is easily monitored and provides an effectivebiomarker for monitoring control of this condition for both types of the diabetes(types I and II) (Chart 1).
Notes: This is probably not the best example, but it does illustrate another pointabout biomarkers and disease. Diabetes is a disease where the causative agents areproteins/peptides, insulin, and insulin receptor, but a good marker for the disease isthe simple sugar glucose. This is not an isolated case. We can take examples from anumber of other metabolic diseases where the cause of the disease is a protein/peptide and the resulting effect is most evident in the change in concentration ofanother class of molecule (lipid, carbohydrate, etc.). The pathology of the disease isa good tool to use as a starting point concerning the type of biomarker (protein, lipid,carbohydrate) that one could/should search for.
6.2.2. How many biomarkers are necessary?
This is a complicated question but one that must be thought about. The number ofsingle biomarker assays that are failing in the market is high, and the FDA in theUnited States has not approved a single biomarker assay in the last year. The rea-son for this is that in most cases the single biomarker assay cannot show the levelof sensitivity and specificity necessary to be an effective diagnostic.
The examples of this in the market place are several. CA-125 for ovarian can-cer and CA15.3 for breast cancer cannot be used as screening tools only as a wayof monitoring treatment [8–11]. The PSA test that is used as a screening toolshows sensitivity and specificity of 66%, and thus about one third of the cancersare missed and one third of patients go for unnecessary prostate biopsies. When

Biomarker discovery 515
two or more of the current PSA tests (total PSA, bound PSA, and free PSA) aregiven together, the diagnostic performance improves significantly compared toany one of the single PSA tests alone [12–14]. The simple logic here is that themore information that is obtained the better the diagnosis. This also applies to bio-markers for the diagnosis of other conditions; the use of more than one marker canincrease the diagnostic performance and reduce errors. By developing panels ofmarkers (a combination of biomarkers) it is more likely that one will develop ahigh-quality clinical test. The logic behind this is that if one marker in a diagnos-tic panel fails in a patient, there are still other possibilities (other markers in thepanel) that can be used to diagnose the disease. The use of patterns of biomarkersfor diagnosis can reduce the problems for biomarkers assays resulting from diseaseheterogeneity, differences in disease pathology, and the effect of other medical con-ditions that occur in a population.
Disease pathology is probably a heterogeneous process; with some variationaspects of disease progression differently in different individuals, symptomologyof the disease can also vary from case to case. This suggests that the pathology of
Chart 1. This is a schematic of the way the diagnostic for diabetes functions moving from the causeof the disease to the use of the biomarker glucose.

516 B.J. Thatcher and E. Caputo
a disease is not necessarily the same from individual to individual and thus it isprobable that there are slightly different biochemical processes going on as the diseasedevelops. Therefore, ideally the markers should come from different pathways thathave been altered by the disease process. This type of diagnostics is less prone toerrors in diagnosis that are the result of different rates or types of disease progressionor subclasses of the same disease. A lot of promise is being seen from the use of mul-timarker panels of biomarkers for the diagnosis of cancer [15]. Researchers in thisfield have found it necessary to use three or more proteins to obtain the desired diag-nostic efficiency to make a useful test. The actual number of markers required todevelop an effective diagnostic may be only three or four, but the process of primaryvalidation will eliminate a large percentage of prospective markers that are found inthe discovery experiment. Thus, it is important to find as many prospective biomark-ers as possible so that there is the opportunity to evaluate and choose the very bestgroup of markers to develop further.
7. Challenges in the biomarker discovery pathway
The process for a biomarker discovery process is very similar regardless of the typeof molecule that one is looking for. Here, detailed descriptions of the challenges inthe biomarker discovery pathway, which have to be kept in mind, are outlined. Thissection will also provide some information about how these challenges can be metby the careful researcher.
7.1. Asking the right question
It is important to think about the question that you are asking in several waysbecause the formation of the right question is the key to a successful biomarkerdiscovery experiment. A good question has several qualities that help to direct thebiomarker discovery work and focus the research efforts in a clear and organizedmanner. Is the question reasonable with respect to what is known about the diseaseand the disease state? For example, a poor question is: I want to find a diagnosticfor cancer. This is a poor question for several reasons:
• Cancer is a very heterogeneous disease.• There are a number of different cancer pathologies and tumor types.• Each cancer has several stages that are different.• Different forms of cancer affect different tissues.• The number of samples required to represent all forms of cancer would be
unmanageable.A broad-ranging question may seem like a logical starting point, but one will
quickly find that once the experimental work is started the resulting data will becomplicated and virtually impossible to extract useful information from and thus
Biomarker discovery 517
the project will be impossible to complete. However, by reducing the scope of thequestion to some aspect of the disease, it is possible to focus the research betterand obtain useful results. Reducing the scope of the discovery experiment bydesign will allow all of the efforts to be focused on an achievable goal that can beaccomplished in a reasonable time frame.
Some much better questions in the same field could be:• Can I find markers that allow the differentiation between an aggressive and a
nonaggressive form of the same cancer?• Can I find markers that will predict which drugs may be most effective in
treating this form of the disease?• Can I find markers that facilitate determining the effectiveness of a course of
treatment?Answering these smaller questions will start on the road to answering much bigger
questions. But more importantly there is a lot of evidence that these types of experi-ments are more often successful in both discovering useful biomarkers and publish-ing the results. By posing a question with a narrow scope one will focus the researchefforts from sample collection to data analysis facilitating a more complete study withsmaller sample numbers, less complicated data analysis, and a more significant out-come; thus developing clinical utility quicker. The use of narrowly defined questionswill also provide time for the biomarker research group to develop the experience,techniques, and research tools that will be needed for projects of a larger scope.
Furthermore, the use of narrowly defined questions will also facilitate the build-ing of a knowledge base that can then be used as a starting point for broaderstudies that can be accomplished by combining datasets and reanalyzing the datato examine possibilities and determine feasibility of answering or posing a broaderquestion. Let us think for a moment as to how this could be accomplished. If aresearch group decides to look for biomarkers from different cancers of epitheliaorigin (for example) and does a number of very specific discovery experiments oncolon, skin, and breast cancer and develops biomarkers for these diseases, one hasa very successful biomarker discovery and validation program. The data obtainedduring this work can be combined and reanalyzed to look for markers that arecommon between these diseases and markers that differentiate these conditionsand this could be the starting point for and answer to a bigger question involvingseveral forms of cancer. This type of exploration will certainly elucidate the scopeof the work and the possibility of success, and give indications concerning thenumber of samples required to answer the new bigger question.
In summary, the difference between good and bad questions is the scope of thestudy and the chance of success in the project. A good question has the followingcharacteristics:
• The goal for the study is clearly defined.• The question takes into account what is known about the disease.• The study is possible with the samples available.

518 B.J. Thatcher and E. Caputo
• The study could provide the answer to an important clinical question.• The scope of the study is narrow enough to find clear answers.• The collection of further samples for primary validation is possible.There is a good review article covering this topic and it would be advisable to
read this publication during the process of formulating your biomarker discoveryexperiment [16].
At this point it is worth discussing the entire biomarker discovery and validationprocess from one aspect. Each step in this process is built on the results of the pre-vious steps. This means that errors and poor decisions will compound and amplifyas one progresses along the experimental plan. For example, a poor experimentalquestion will lead to a very large discovery experiment. This scope of the discoveryexperiment will require the use of a less than ideal set of discovery samples. Thisdiscovery experiment will produce a large volume of data that must be analyzed;this takes time and usually results in a large and confusing list of possible biomarkerssince the discovery sample set was less than optimal. These prospective biomarkerswill require a very large primary validation set of samples and a broad experimentalscope for the primary validation process generating another very large dataset, whichmay only serve to complicate the original discovery experiment. These types of com-pounding problems will continue as one progresses to the purification, identification,and assay development with too many possibilities and too much work to accom-plish. This will result in a failed biomarker discovery process and in not achievingthe goal of the project due to the volume of work that will be required as well as thetime involved and the experimental cost.
In contrast, a well-designed biomarker discovery process will result in increas-ing experimental focus because of a reduction of the number of prospective bio-markers as the number of samples increase. It is true that during the discoveryprocess it is important to find as many biomarkers as possible; the process of pri-mary validation should be used to reduce the number of markers that are beingconsidered to answer the original question by selecting the best markers from thediscovery pool. Thus, by generating data from more samples there are fewer mark-ers that are being analyzed and thus the experimental work remains focused andthe amount of data to be analyzed remains reasonable. This type of experimentwill allow diagnostic models to be developed using a number of biomarkers andthe data generated will facilitate the testing and refining of these models until adiagnostic group of biomarkers emerges. At this point, it is worth the work to iden-tify, characterize, and develop assays and validate this small group of diagnosticbiomarkers since there is a good chance that they will answer the initial question.
7.2. Sample availability
The definition of a good question also relies on the samples available, which is animportant component to the formulation of the best question. Sample availability

Biomarker discovery 519
is of primary concern; although discovery can be accomplished with relatively fewsamples, the process of primary validation and validation will require a large num-ber of samples. The exact number of samples required for a discovery experimentwill depend on the method used to find the marker. The statistics and errors thatare inherent to the method will allow the researcher to calculate the number ofsamples required to produce a significant result that will facilitate the selection ofprospective biomarkers. This process is also true for the validation phase of theexperiment. The statistics and the question will determine the number of samplesrequired to validate prospective biomarkers.
The availability of samples from different locations, such as cities, countries,and continents, is important. Samples from diverse locations are necessary to sortout markers that might be found in a particular group of people due to environ-mental, dietary, genetic, or race differences and are therefore not related to thecondition under investigation. It is not vital to have samples from multiple centersto do the discovery work, but it is a good idea to think about obtaining these typesof samples for primary validation and validation work.
7.3. Which sample should be used?
An important characteristic of the samples whether they are a biological fluid(sera, plasma, urine, etc.) or a tissue (muscle, liver, skin, etc.) is that they containthe type of molecules that one is looking for in concentrations that are above thedetection limits of the techniques available for examining the molecules of interest.This must be determined by a series of test experiments to determine the concen-tration of the analyte in the sample. At this stage it is not important to determine theconcentration of each analyte in the sample because there is enough of the class ofcompound (protein, lipid, carbohydrate, etc.) to make a study productive. This workis a simple optimization experiment to study the possible methods of sample prepa-ration looking at extraction, fraction, separation, and detection of the class of mol-ecules (lipids, metabolites, proteins, etc.) that one intends to examine, and then toput together the most promising methods to form the experimental protocol. Duringthis stage of experiment while developing the separation methodologies that will beused for discovery, one should take note of the level of diversity that is seen in thesamples. The reason for this is that the number of species that can be observed willprovide information on the chances of finding biomarkers. The discovery of bio-markers is a statistical process. The more different species are observed the morelikely that one will find changes in one or more of the species and therefore the betterthe possibility of finding a biomarker in the sample. For this work, one generallychooses a sample that is easy to obtain and is very similar to the samples of interest.For example, if one is planning to work with human liver samples from biopsy itwould be reasonable to optimize conditions with bovine liver samples and whenmethodologies have been worked out then move to the human samples. This will

520 B.J. Thatcher and E. Caputo
optimize the use of valuable clinical samples and provide information on the size ofthe sample necessary and how the sample needs to be obtained, stored, subdivided,and processed.
7.4. Sample management
Two rules have been kept in mind when thinking about samples for biomarker dis-covery and primary validation. These rules are designed to reduce the complexityof discovery experiments by reducing the number of artifact and false markers thatare the result of poor sample collection and handling processes, which often con-tribute to problems in statistical data analysis. These artifact markers can alsomask real biomarkers and cause them to be ignored or missed in the early stagesof the project.
Rule 1: All samples have been treated exactly the same. This means that a pro-tocol has been developed for the entire process of sample collection, storage, anduse. The defining of the sample collection protocol must be done with three mainpoints in mind:
• What is reasonable in the collection environment, hospital, clinic, etc.?• What can be done reproducibly?• The collection process needs to be documented at each step.In the development of the sample collection protocol, one must keep in mind
what is reasonable in the real world. If blood samples are being collected by anurse in a hospital (for example) it would be unreasonable to think that the sam-ples could be aliquoted and frozen 20 min after collection.
Example: Sera proteomic study. Here is an example of a sample collection pro-tocol that is being used for sera proteomics study in a hospital.
• Samples are collected three times in a 24 h period.• After drawing, the blood samples (in vacutainer tubes for sera tiger-top) must
be centrifuged a minimum of 2 h and a maximum of 2.5 h after collection withthe sera remaining at room temperature between collection and centrifugation.
• After centrifugation, the samples must be aliquoted into ten 30 �l and four200 �l fractions and frozen at �80�C within 30 min. Placing the samples indry ice after aliquoting is acceptable.
• Each aliquot is to be bar-coded and the collection data are to be recorded inthe patient database with cross-referencing to the clinical data.
• Five of the 30 �l and two of the 200 �l fractions are to be placed in freezer 7.• Five of the 30 �l and two of the 200 �l fractions are to be placed in freezer 5.• If the sample does not conform to this procedure, discrepancies must be noted
in the database and the sample must be placed in storage with other noncon-forming samples.
• Samples are only to be subjected to one freezing cycle. Any problems withthe freezing or thawing and refreezing of a sample will require it to be reclas-sified as nonconforming.
Biomarker discovery 521
Notes: Samples that do not fit this protocol are not to be used for discovery orprimary validation experiments. The reason for this is that the treatment of sam-ples can introduce artifacts into the sample: processes continue in biologicalsamples after the sample has been removed from the body. In fact, biologicalprocesses are not even completely stopped by freezing to �20�C; thus, samplesshould be stored at �80�C especially for long-term storage. Samples should bedivided into single-use portions and stored in different freezers for safety. A lot ofeffort and cost are associated with the collection and storage of samples and hencethey need to be protected. Furthermore, if the integrity of the samples has beencompromised, then all of the data resulting from these samples will also be com-promised and the effort, money, and work that went into the discovery experimentcould be wasted along with the sample. Compromised samples could have a useas bulk tissue for larger scale experiments of purification, characterization, andidentification of prospective biomarkers.
Rule 2: Time is an enemy. The longer the samples remain at less than optimalstorage conditions the more artifacts will be produced in the sample. A large num-ber of biomolecules are unstable chemical compounds to start with. They havelimited lifetimes in biological samples for several reasons. The first is chemicallyunstable biomolecules that are susceptible to oxidation, reduction, and hydrolysis,just to name a few of the many chemical reactions. The second issue is that thereare enzymes present in biological samples that can accelerate these processes bymany orders of magnitude by catalyzing these reactions. Thus to obtain a goodpicture of a biological system it is important to minimize these processes as soonas possible after the sample is obtained.
This is a problem for both the experimental process and data analysis. The primaryproblem is the degradation of the molecules of interest because at elevated tempera-tures (generally greater than �80�C) there are both enzymatic and chemical reac-tions that can occur in the sample resulting in the breakdown and/or modification ofbiomolecules. This can be compensated for in assays by using time courses todetermine the rate of destruction of a known compound over time in a specific sam-ple type. This is not the most desirable system to adopt since it is not perfect andintroduces an increase in the level of error in the results. On the contrary, this is nota possibility when one is looking for biomarkers in discovery experiments, sincetime courses involve knowing what the target of interest is and during a biomarkerdiscovery experiment by definition the target is not known.
The second issue is that some important biomarkers are present in low concen-trations and are near the limit of detection; the loss of even a small amount of thesemolecules may cause them not to be observed in the sample and thus the informationabout them will be lost.
Notes: The use of confounding or clinically similar conditions to test biomark-ers in the primary validation and validation process is vital to determining whichprospective biomarkers are directly related to the disease or whether they aremarkers of other factors (age, sex, diet, etc.). With many disease states, there are

522 B.J. Thatcher and E. Caputo
conditions that can make the diagnosis problematic or produce similar biomark-ers to the disease under investigation. A good example of this can be seen in thediagnosis of prostate cancer where benign hyperplasia, age of the patient, andprostate cancer all cause an increase in the levels of prostate-specific antigenwhich is used as a biomarker (and a screening tool) for this disease; thus, it is im-portant to include benign hyperplasia samples in the validation samples for anyprospective prostate cancer biomarkers. The result of this type of experimentaldesign is to find markers that can detect prostate cancer and distinguish it fromother medical conditions that have different treatments or are not in fact diseaseconditions.
8. Technical issues in experimental design
The sample preparation methods and the separation techniques have to be devel-oped carefully in order to facilitate the entire biomarker discovery process. Samplepreparation methods should be compatible with the subsequent steps in the sam-ple preparation process. The use of a sample preparation method that results in thesample being in a solution that is incompatible with the separation method to beused will cause problems such as increased experimental difficulty, sample loss,increased time, and experimental cost. A good sample preparation method will facil-itate quality results and the collection of good data. Good-quality results are easier toanalyze and less prone to experimental errors that require high numbers of repli-cates to control.
8.1. Sample preparation
It is important to make sure that the methods used for sample preparation arereproducible and robust. It is not important at this stage to develop a method thatwill be used during validation and any subsequent clinical method. The goal ofdiscovery work is to see as much of the sample diversity as possible. Remember thatbiomarker discovery is a statistical game where the more choices that you have thebetter the chance that you will find a marker that can be validated, so it is importantto see as much of the diversity in the chosen class of molecule as possible. Oneshould try and find a method that will eliminate classes of biomolecules that are notof interest, will interfere with the analysis of molecules that are of interest, compli-cate the separation/detection of the species of interest, and could cause confusionduring data analysis. Time and effort spent in the process of sample preparation willmake life much easier in subsequent experimental processes.
The preparation of samples should focus on the type of molecule that one isinterested in. Methods have been developed for the isolation of classes and sub-classes of biomolecules; these methods can be found in the literature and it is

Biomarker discovery 523
worth your time to look for a sample preparation method that is as specific aspossible for the type of molecules that you are interested in. It is much better tofocus your efforts on one class or subclass of molecule at a time, rather than to tryto see everything from the same samples. If you are looking for biomarkers thatare phospholipids, then select a sample preparation method that is specific for iso-lating phospholipids rather than complicate the situation by looking in a total lipidfraction for phospholipid biomarkers. The saving of time and effort in the earlystages of sample preparation will result in a much more complicated set of prob-lems during experimental design and especially during data analysis.
It is also worth some time to talk about the level of abundance of molecules. Ingeneral, the more abundant a molecule is in a system the less scientifically interest-ing the molecule tends to be. The reason for this is manifold, but one reason is thatthe tools for the analysis of compounds are all the same in one respect; it is easier tosee the most abundant species and thus they have been studied the most and a lot ofinformation is available. Thus, the rarer a species the more scientific interest itgenerates since less is known about the molecule. In the case of biomarkers for med-ical applications, it is the ability to detect and quantify a marker that should be ofprimary concern. This makes more common molecules of more interest since they areeasier to detect and quantify than compounds that are extremely rare. Furthermore,one can use a smaller sample size and simpler sample preparation procedures; thisbecomes important when a large number of samples must be run for validation of amarker.
It is also advisable to prepare tissue samples in a logical way based on thebiochemistry of the molecules of interest and use tools such as subcellular frac-tionation to assist in the separation of your molecules of interest. For example, ifyou are looking for changes that are occurring in the mitochondria, it is advisableto isolate these organelles and work with a pure mitochondrial sample rather than asample contaminated with cytosol and other organelles since the simpler the samplethe better your chances of seeing a wider spread of the diversity in the sample.
The simpler the sample the more you will be able to see in the sample; at firstit might seem like a bit of an oxymoron but the truth in this statement becomesevident when we think about this issue from the other direction. If you have a purecompound as a sample, then you will be able to see 100% of the diversity in thesample during analysis. If the complexity of the mixture is increased to 100 com-pounds and one sees only 75 different species using an analysis method, then 25%of the diversity of the mixture is lost regardless of the reason (compounds of thesame mass, overlapping peaks in chromatography, overlapping spots or bands ona gel, etc). This is a simple case compared to the levels of complexity of moleculesin a biological sample where the presence of hundred thousands of moleculeswould not be considered unusual. Thus, it makes good sense to start with as purea sample as possible and thus increases the possibility of seeing the maximumlevel of diversity in a class of molecules as possible.

524 B.J. Thatcher and E. Caputo
8.2. Separation technique
Separation technology is sometimes the biggest problem in biomarker discoveryexperimentation. The reason for this is the complexity of the mixtures found inbiological samples and the poor resolution of the separation tools that is available.If we use chromatography, for example, it is possible to see 150 peaks from anHPLC separation of a biological sample such as sera, which contains more than100,000 different molecules. This represents less than 0.15% of the availablediversity. To further aggravate the situation there is sample loss on all columns of30–50% of the sample. This is the material that is lost and cannot be analyzed.Many years ago there was a general rule for enzyme purification, which statedthat: “if you needed more that three columns to purify an enzyme then you wouldend up purifying the enzyme activity away from the protein” which means that theprotein could not be seen on a SDS-PAGE, but you could still measure the activityand thus you needed to rethink the purification process. This rule is also applicableto biomarker discovery; one simply cannot add unlimited dimensions of separationto increase the level of observed diversity because after four different columnsthere will not be enough material eluted from the last column to be of practical usebecause one will only observe the most abundant molecules and very little of thediversity in the sample. This problem can partly be overcome by using larger sam-ples but this quickly becomes limiting when dealing with clinical material (it is notpossible to ask a patient for 50, 100, or 1000 ml of sera).
Multiple separation methods might be necessary to adequately simplify thebiological sample to facilitate the identification of hundreds or thousands of com-ponents in a mixture. It is not unreasonable to think about two or three differentseparation methods used in sequence or in parallel to look at the diversity in abiological sample.
It is important to take the time to discuss the known problems that are associ-ated with a particular sample type and find methods that are likely to reduce oreliminate these situations, and then test the system you plan to use to optimize theprocess and test the protocols at each stage of method development. This processwill provide information on reproducibility at each step in the discovery processand could allow the prediction of the number of replicates that are necessary, thenumber of samples that are required, the amount of sample required, the type ofdata analysis that needs to be done, and the amount of data that will be generated.
8.3. Bioinformatics
The need for bioinformatics in the process of biomarker discovery becomes appar-ent when one starts to observe the amount of data that is produced by discovery andvalidation experiments. Bioinformatics really covers two areas of this work. The firstis the management of the raw data output from the instrumentation. It is preferable

Biomarker discovery 525
to use databases to manage this raw data so that it can be sorted, searched, and cross-referenced with other information about the sample. It is a wise idea to start this workearly in the experiment process before the amount of information makes this an almostimpossible task.
The second area of bioinformatics is the analysis of the data. This is where it isimportant to involve an expert in bioinformatics. Even if there are software pack-ages available for the analysis of your data, it is important that these tools are usedproperly and that you understand the manipulations and output of the software.The choice of the type of analysis that one should use is also something best leftto experts to decide since there are no right answers to the question of how datashould be analyzed and what is the best method of analysis; there are only answersto what is your preferred method and whether a type of analysis is valid. Some ofthe most frequently used analysis tools are [17–21]:
• Principal component analysis• Hierarchal clustering• p-Values• t-Test• Regression analysis• Decision tree analysis• CART analysisWe will not elaborate more on this topic since it is complicated and it is best to
interact with an expert in this area to find out what, how, and why certain types ofanalysis are best for the type of data that you will be producing.
8.4. Methods
The development of a biomarker discovery method is a process of putting togethermethods and processes that facilitate finding changes in a biological system thatindicate specific changes in that system. This generally involves the separation,detection, quantitation, and identification of molecules that are different betweenthe condition under study and a set of control samples. Each step in this processaffects each subsequent step in the experimental pathway. With the high degree ofcomplexity in biological samples, one must take the time to develop each step ofthe experimental pathway carefully. This involves looking at sample collection,sample preparation, sample separation, analyte detection, and identification asdescribed in the previous section.
The development of each step helps in defining the requirements of the subse-quent methods and the options that are possible to use. A mistake or a poor choicein the first steps can cause insurmountable problems at the end of the experiment.Thus, it is important to take the time and develop methods that will reduce as manyforeseeable complications as possible because there are enough unpredictablecomplications that will occur during this process.

526 B.J. Thatcher and E. Caputo
9. The discovery process overview
The steps in biomarker discovery are always the same. A summary of the processis as follows:
• Biomarker discovery• Primary validation of the markers from the discovery experiment• Purification of validated biomarkers• Identification of validated biomarkers• Characterization of validated biomarkers• Assay development for biomarkers with good diagnostic potential• Validation use of the biomarker assay that has been developed to test large
numbers of samplesThis process is simple and logical. Since the time, effort, and money required
increase with each step in the process, it is important to focus these efforts on thebiomarkers that have the best chance of success in completing the process. The analy-sis of the data at each step in this process will reduce the number of biomarkers thatwill be used in the final assay and allow the continuous refining of the diagnosticmodel, thus facilitating the development of the best possible diagnostic.
9.1. Tools for biomarker discovery
The improvement of tools for looking at biomolecules has accelerated over thepast few years as technology has advanced. One of the most recent advancementsin the detection and identification of biomarkers is the mass spectrometer. Fromthe prospective of biomarker discovery, this tool has been the most interesting todate. The mass spectrometer in all of the configurations discussed in this book hasplayed an increasingly important role in the detection and identification of bio-molecules. Regardless of the type of mass spectrometer that one uses, they havebeen adapted, designed, and optimized for a wide range of biomolecules.
The only point that we hope to make in this chapter about mass spectrometryinstrumentation is that this technology is rapidly becoming the method of choicefor the detection, characterization, and identification of biomolecules.
From the available mass spectrometry instrument configurations, there are oneor more instruments available to look at the type of molecule that you are interestedin. The tools for biomarker discovery can seem complicated and diverse, but theyaccomplish one of these three things: separation, detection, and identification.
The discovery of biomarkers will require each of these three steps to be done inorder to discover a biomarker from a biological sample. Biological samples arehighly complex mixtures of molecules many of which will interfere with eachother, and thus sample preparation methods are required to first isolate the class ofmolecule that one is interested in. The samples that have been optimized for aparticular class of biomolecule (optimized samples) can then be more efficiently

Biomarker discovery 527
separated and analyzed. It is much easier to work with a mixture of lipids from atissue than it is to work with the entire tissue homogenate.
We will not discuss in detail each of these technologies in this section.The lists pro-vided are not complete; since very specific separation, detection, and identificationtools exist; we will attempt to briefly mention the most general and often-used tools.
The development of mass spectrometry technology [22,23] including instru-ments, informatics, and methodologies has made this instrumentation the preferredtool for the detection and identification of biomolecules. The true power of massspectrometry in the field of biomarker discovery is the large amount of informationthat this technique provides as well as the speed at which answers can be generated.An example of this is in the sequencing and identification of proteins; Edman chem-istry requires 90 min to sequence a single amino acid, whereas an entire peptide canbe sequenced with a mass spectrometer in a few minutes. For the detection of elu-ents from chromatographic separations, mass spectrometry can provide detection aswell as identification with the additional benefit of separating each peak further bymass to determine if one or more components are eluting at once (Table 1).
In many cases a number of technologies are used together to produce biomarkerdata during the discovery process. Techniques are combined to overcome the weak-nesses and exploit the strengths of each technique. The most important methods inthe process of biomarker discovery are the design of the experiment and the analysisof the data; this is especially true in the medical field. As we have seen in the dis-cussion of the tool of biomarker discovery, it is simple to generate large quantitiesof data that become difficult or impossible to analyze. Thus, it is vitally importantthat the discovery experiments are designed to focus all aspects of the experimenton the initial clinical question. One must also design an experiment to produce quan-tities of data that one is able to analyze with the tools available. There is little valuein producing thousands of mass spectra without the informatics tools available tofacilitate the analysis of the data. This type of experiment consumes valuable sampleand does not produce results that can be used.
9.2. Biomarker identification and validation
Identification of prospective biomarkers after primary validation is an important stepin the process of doing a good discovery experiment. There are some researchers whobelieve that patterns of biomarkers are adequate and there is no need to know whatthese markers are to diagnose a condition. This theory is losing favor as problemswith this theory increase. First, these types of biomarker pattern diagnostics are fail-ing to be accepted by the literature and regulatory agencies. Second, without knowl-edge of the identity of the markers there are no options in assay development or theability to validate the biomarkers by a second methodology. Third, the identificationof biomarkers or patterns of biomarkers provides significant advantages for the re-searcher in the validation and assay development aspects of prospective biomarkers.

528 B.J. Thatcher and E. Caputo
Table 1
Most common techniques available for biomarker discovery, characterization, separation, andidentification
Method Strengths Weaknesses
Separation toolsSDS-PAGE Good for proteins, ease Low resolution, cannot be used for
of use, good analysis tools, small moleculesrapid, very robust, samplecan be recovered
2D gel High resolution, well- Time-consuming, large sample established method, good size, experience required,analysis tools, sample can problems with very basic/acidicbe recovered proteins, not good for small
molecules/peptidesCapillary electrophoresis High resolution, small Few methods, difficult to recover
sample size, rapid, not sample for further analysisaffected by size of theanalyte, reproducible
Liquid chromatography High resolution, possible Sample loss, large sample size,to combine column types separations can be time-to produce 2D separations, consumingnot affected by size of theanalyte, wide range ofseparation methodsavailable, very robust,reproducible, sample canbe recovered, can be coupledto a wide variety ofdetector types
Gas chromatography Very high resolution, can be Only good for volatilecoupled to mass spectrometry compounds, may requirefor detection and identification, derivatization, generally therobust, good for small volatile sample cannot be recoveredmolecules, reproducible, verysmall sample size, rapid
ProteinChip arrays Rapid, reproducible, 2D Designed for protein/peptides,separations standard, limited capacitywide range of separationtypes available, robust,small sample size
Detection toolsStaining Very sensitive, large Mostly used for SDS and 2D gels,
number of stains available, quantitation can be problematic,robust, simple, inexpensive, minimal information aboutpermits sample recovery, the samplevery widely used

Biomarker discovery 529
Absorbance Very sensitive, robust, Provides minimal informationreproducible, medium cost, about the analytepermits sample recovery,widely used, can be coupledto a number of separationtechniques
Mass spectrometry Sensitive, produces further Sample recovery not possible,information about the analyte, less sensitive than stains oradds a dimension of separation absorbance(by mass), reproducible,robust, sample identificationpossible
Identification toolsEdman chemistry The gold standard for protein/ Time-consuming, experience(N-terminal sequencing) peptide identification, moderate required, will only identify
cost, widely used, can identify proteins/peptides, large samplemodified amino acids size, requires purified proteins,
sample consumedMass spectrometry Can identify a wide range of High cost, expert required
molecules, can work withmixtures of samples
Biological interaction Very sensitive, can be Must have an antibody to the(antibodies) analytical, reproducible, molecule, cross-reactivity, will
widely used, low cost not identify modifications to aprotein, must know exactlywhat you are looking for
IR spectroscopy Sensitive, provides structural Not useful for protein IDinformation, good for smallmolecules, identifies organicfunctionality, use of thefingerprint region can providecompound ID for smallmolecules, moderate cost
NMR Provides structural Very expensive, expertiseinformation, identification, required, works best for smallgood for ID of small organic molecules, not generally usefulmolecules, sample recovery for proteins, generally requirespossible, can find and purified samples, large sampleidentify modifications size
Highlighted in this list are some of the strengths and weaknesses of each method.
Table 1
Continued
Method Strengths Weaknesses

530 B.J. Thatcher and E. Caputo
The identification of a prospective biomarker can provide a wealth of information.The following is a list of a few of the advantages of identifying the biomarkers thatare discovered:
• Provides a way to look into the literature to provide evidence that this markerhas been linked to some aspect of disease pathology
• Facilitates the use of other tools to validate a biomarker by an independentmethod(s)
• Points to an alteration in a biochemical pathway that will facilitate furtherdiscovery experiments and basic research
• Provides other research tools/methods to characterize the prospective bio-marker
• Increases confidence in the marker being a result of the disease and not anartifact
• Provides further understanding of the disease process/pathology
10. Conclusions
The important messages to remember from this chapter are to think carefullyabout the discovery experiment first. Put together a solid team with the skills nec-essary to accomplish the project. Think carefully about the question that is beingasked: Is it reasonable and achievable? Plan the project well and listen to poten-tial problems and challenges so that the question can be answered satisfactorily.Focus on the question being asked and do not get sidetracked until there is an an-swer to the initial question; there is always an opportunity to investigate the datafurther after the question has been answered. Simplify each step in the biomarkerdiscovery experiment as much as possible so that the data analysis results are asclear as possible.
The order of work for biomarker discovery is as follows:• Think carefully about the question that you would like to ask.• Check to make sure that you have the samples required by the question that
you are posing.• Do you have enough samples for validation? Can more samples be obtained?• Is there enough (quantity) of sample to facilitate purification and identification?• What method will be selected for separation and detection of the molecules
of interest?• Do the optimization experiments so that some sample data can be produced
and protocols worked out.• Work with a biostatistician to determine the number of samples that could be
required for discovery, primary validation, and validation of the biomarkerswith your proposed methodology.
• Perform the discovery experiment.

Biomarker discovery 531
• Carry out primary validation experiment.• Identify and characterize the potential biomarkers.• Develop a robust assay for the biomarkers.• Validate the biomarkers.
References
1. Srivastava, S. (Ed.), Cancer Biomarkers (Book Edition of Disease Markers), IOS Press,Amsterdam, The Netherlands, 2004, 94 pp.
2. Pusch, W., Flocco, M.T., Leung, S.M., Thiele, H. and Kostrzewa, M., Mass spectrometry-based clinical proteomics (review). Pharmacogenomics, 4(4), 463–476 (2003).
3. Chang, P.L., Clinical bioinformatics (review). Chang Gung Med. J., 28(4), 201–211 (2005).4. Seibert, V., Ebert, M.P. and Buschmann, T., Advances in clinical cancer proteomics: SELDI-
ToF-mass spectrometry and biomarker discovery (review). Brief Funct. Genomic Proteomic,4(1), 16–26 (2005).
5. Righetti, P.G., Castagna, A., Antonucci, F., Piubelli, C., Cecconi, D., Campostrini, N.,Rustichelli, C., Antonioli, P., Zanusso, G., Monaco, S., Lomas, L. and Boschetti, E., Proteomeanalysis in the clinical chemistry laboratory: myth or reality? Clin. Chim. Acta, 357(2),123–139 (2005).
6. Alaiya, A., Al-Mohanna, M. and Linder, S., Clinical cancer proteomics: promises and pitfalls.J. Proteome Res., 4(4), 1213–1222 (2005).
7. Weiss, J.N., Qu, Z. and Garfinkel, A., Understanding biological complexity: lessons from thepast (review). FASEB J., 17(1), 1–6 (2003).
8. Jotti, G.S. and Bombardieri, E., Circulating tumor markers in breast cancer (review).Anticancer Res., 10(1), 253–258 (1990).
9. Herbst, A.L., The epidemiology of ovarian carcinoma and the current status of tumor markers todetect disease (review). Am. J. Obstet. Gynecol., 170(4), 1099–1105 (1994) (discussion 1105-7).
10. Bischof, P., What do we know about the origin of CA 125? (review). Eur. J. Obstet. Gynecol.Reprod. Biol., 49(1–2), 93–98 (1993).
11. Sevinc, A., Camci, C., Turk, H.M. and Buyukberber, S., How to interpret serum CA 125 levelsin patients with serosal involvement? A clinical dilemma (review). Oncology., 65(1), 1–6 (2003).
12. Albertsen, P.C., Prostate-specific antigen: how to advise patients as the screening debatecontinues (review). Cleve. Clin. J. Med., 72(6), 521–527 (2005).
13. Berlin, B., Prostate cancer: is the PSA test the answer? (review). N. J. Med., 95(3), 53–55 (1998).14. Pfister, C. and Basuyau, J.P., Current usefulness of free/total PSA ratio in the diagnosis of
prostate cancer at an early stage. World J. Urol., 23(4), 236–242 (2005).15. Mitas, M., Almeida, J.S., Mikhitarian, K., Gillanders, W.E., Lewin, D.N., Spyropoulos, D.D.,
Hoover, L., Graham, A., Glenn, T., King, P., Cole, D.J., Hawes, R., Reed, C.E. and Hoffman, B.J.,Accurate discrimination of Barrett’s esophagus and esophageal adenocarcinoma using aquantitative three-tiered algorithm and multimarker real-time reverse transcription-PCR. Clin.Cancer Res., 11(6), 2205–2214 (2005).
16. Eric, T., Fung strategies in clinical proteomics: from discovery to assay. Preclinica, 4,253–258 (2004).
17. Coste, J., Bouee, S., Ecosse, E., Leplege, A. and Pouchot, J., Methodological issues in deter-mining the dimensionality of composite health measures using principal component analysis:case illustration and suggestions for practice (review). Qual. Life Res., 14(3), 641–654 (2005).
18. McLachlan, G.J., Cluster analysis and related techniques in medical research (review). Stat.Methods Med. Res., 1(1), 27–48 (1992).

532 B.J. Thatcher and E. Caputo
19. Livingston, E.H. and Cassidy, L., Statistical power and estimation of the number of requiredsubjects for a study based on the t-test: a surgeon’s primer. J. Surg. Res., 126(2), 149–159(2005).
20. Ludwig, D.A., Use and misuse of p-values in designed and observational studies: guide forresearchers and reviewers. Aviat. Space Environ. Med., 76(7), 675–680 (2005).
21. Huland, H., Graefen, M., Haese, A., Hammerer, P.G., Palisaar, J., Pichlmeier, U., Henke, R.P.,Erbersdobler, A., Huland, E. and Lilja, H., Prediction of tumor heterogeneity in localizedprostate cancer (review). Urol. Clin. N. Am., 29(1), 213–222 (2002).
22. Merchant, M. and Weinberger, S.R., Recent advancements in surface-enhanced laser desorption/ionization-time of flight-mass spectrometry (review). Electrophoresis, 21(6), 1164–1177(2000).
23. Chaurand, P., Schwartz, S.A., Reyzer, M.L. and Caprioli, R.M., Imaging mass spectrometry:principles and potentials (review). Toxicol. Pathol., 33(1), 92–101 (2005).

Medical Applications of Mass SpectrometryK. Vékey, A. Telekes and A. Vertes (editors)© 2008 Elsevier B.V. All rights reserved
533
Chapter 23
Molecular imaging by mass spectrometry
SARAH A. SCHWARTZa and RICHARD M. CAPRIOLIb,*
aMidwest Research Institute, Kansas City, MO 64110-2241, USAbDepartment of Biochemistry and the Mass Spectrometry Research Center, Vanderbilt UniversitySchool of Medicine, Nashville, TN 37232-8575, USA
1. Introduction 5332. Methods 535
2.1. Sample preparation 5352.2. Biological applications 540
3. Discussion 5474. Future trends 5495. Conclusion 550Acknowledgments 551References 551
1. Introduction
The potential windfall of information for molecular-based clinical diagnostics fromgenomic and proteomic studies involves discovery of disease-specific biomarkers.With respect to proteomics, mass spectrometry (MS) improvements in instrumen-tation and ionization techniques have dramatically impacted protein biomarkeridentification. Specifically, the introduction of matrix-assisted laser desorption/ionization (MALDI) [1,2] and instrumental improvements in time-of-flight (TOF)mass spectrometers [3,4] have greatly enhanced signal resolution and mass accuracyfor intact high mass molecules. Using this technology, protein detection at femto-mole to attomole levels and low parts-per-million mass accuracies have beenachieved [5]. The development of tandem MALDI TOF mass spectrometers also
*Corresponding author. Tel.: �1-615-322-4336; Fax: �1-615-343-8372.E-mail: [email protected] (R.M. Caprioli).

534 S.A. Schwartz and R.M. Caprioli
allows for rapid and accurate peptide identification from �96 samples on a singleinstrument target plate. As a result, MALDI TOF technology has become a majortool for peptide and protein detection, identification, and characterization [6,7].
Over the past 10 years, methods have been optimized for the direct analysisof individual cells, groups of cells, and small tissue sections [8–27]. Peptideprofiling of complex mixtures by MALDI TOF MS has been performed withoutprevious molecular separation to show differences between cell types and physi-ological conditions, identify novel peptides, assess post-translational processing,and demonstrate peptide localization within the tissues. Additional experimentshave demonstrated sub-cellular protein localization within intact cells [23,28].Efforts have also been made to characterize bacterial strains based on intact pep-tide and protein profiles [12,15,18]. Most of this early work involved analysis ofpeptides and low-molecular-weight proteins, typically from established cell lines.
Several MALDI TOF MS peptide and protein profiling studies have focusedon the direct analysis of tissue sections [9,10,20,22,24–26,29–32]. This workaimed to retain protein spatial information with validation by histology. MALDITOF MS technology has been used to characterize human disease based on theprotein patterns from biopsy tissue, localize specific biomarkers within the tissuesamples, and monitor proteomic changes due to disease progression or drugtherapy. Several studies have demonstrated that protein profiles can be obtaineddirectly from pre-specified regions on a tissue sample and that these profiles canpotentially be used for human disease diagnosis and patient prognosis [30,31].Protein localization within thin tissue sections has also been demonstratedthrough MS imaging [9,24,25]. In this approach, spectra are collected across thetissue section in an array of spots or pixels. Molecular ion images are thenreconstructed from this high-resolution analysis by plotting the intensity of one(or more) signals relative to other pixels in the array, yielding localization infor-mation on hundreds of protein signals in two-dimensional space. The relativeprotein abundance can then be displayed in terms of the x, y coordinates of theoriginal tissue section.
These techniques serve as a valuable discovery tool since no prior knowledgeof the proteins of interest is required and no target-specific reagents (e.g., anti-bodies) are required. Comparison of the protein patterns derived from massspectrometric analyses of different tissues has identified potential disease-specificmolecular biomarkers and possible drug targets. Imaging experiments have beenperformed to monitor protein changes across both normal and diseased organs,monitor drug localization within treated tissues, and determine protein changes asa response to a given treatment. This technology has wide applications includingthe areas of chemistry, biochemistry, biology, and clinical research. The purposeof this chapter is to summarize the current state of profiling and imagingMALDI–MS as applied to tissue analysis, focusing on sample preparation, andillustrating the technological capabilities with several applications.

Molecular imaging by mass spectrometry 535
2. Methods
2.1. Sample preparation
Two general modes of data acquisition are used for direct tissue analysis, termedprofiling and imaging, as shown in Fig. 1. Profiling proteins in a tissue sectioninvolves depositing matrix droplets (typically between 50 nL and 0.5 �L) onselected areas of a tissue (Fig. 1A). Each of the droplets is independently analyzed,yielding a protein profile for a relatively large, discrete region within the tissue.Typically, between 5 and 10 droplets are deposited on a given tissue section. Thisapproach is commonly performed to quickly determine the protein content from aspecific morphological region within a tissue section. Using these data, proteinprofile comparisons between tissues (i.e., disease and normal or treated anduntreated) can be performed to determine specific molecular changes. Profilingexperiments can be accomplished using most commercially available MALDITOF instruments without additional software.
Imaging involves collecting MS data in a regular pattern or array across amatrix-coated tissue section (Fig. 1B). This approach typically provides a higherresolution molecular picture of the tissue from data collected from hundreds orthousands of pixels across the tissue surface. An image displaying the distribution
A) Profiling Tissues
B) Imaging Tissues
coating
droplet1
12 2
Fig. 1. Direct tissue sample analysis by mass spectrometry. Tissue samples are sectioned and mountedonto MALDI target plates. Matrix solution is applied to the tissue surface by (A) manually depositingdroplets in specific regions on the tissue or (B) coating the entire tissue section with either a thinmatrix film or small (pL) matrix droplets. The resulting spectra demonstrate the protein expressioncomplexity from discrete tissue regions. (A) Spectra collected by profiling experiments can be com-pared to determining region- or morphology-specific biomarkers. (B) Data collected by imaging canbe interrogated to produce an ion density map, or image, for each m/z signal detected.

536 S.A. Schwartz and R.M. Caprioli
of a specific m/z signal within the tissue can then be reconstructed. High-resolutionimages are automatically acquired using custom imaging software that controlsthe data acquisition parameters [33,34] or through an automated acquisition usingcommercially available software supplied with the instrument. During imageacquisition, a virtual grid is created over the tissue and the MS instrument isdirected to move the sample stage and trigger the laser at each point on the grid.While the distance between acquisition points is determined by the user, the imageresolution is limited by the laser beam diameter at the target and, for very high-resolution images (�20–30 �m), by the matrix crystal size. An ion density map,or image, is created by integrating the signal intensity for a selected m/z windowat each acquisition point across the grid. An image can be generated for each ionsignal detected within the section; therefore, the localization of several hundredproteins can be monitored using this approach.
Applications presented in this chapter have employed a Voyager DE-STRMALDI TOF mass spectrometer and a QStar Pulsar i QqTOF mass spectrometer(Applied Biosystems, Foster City, CA). The Voyager instrument utilizes a 337 nmnitrogen laser with a 2.5 ns pulse and a repetition rate of 2 Hz. The instrument wasoperated in linear mode under delayed extraction conditions. The laser spot sizeon target is �50 �m in diameter. The QStar Pulsar instrument is equipped with aMALDI source and a 337 nm nitrogen laser operating at a 20 Hz repetition rate.The laser spot size is �200 �m in diameter on target.
2.1.1. Tissue treatment
Careful sample preparation is important in order to obtain high quality protein andpeptide data from intact tissue samples [35]. Surgically removed tissues are looselywrapped in aluminum foil, frozen in liquid nitrogen, and stored at �80ºC. Frozentissues are cut into 5–20 �m thick sections with a cryostat at below freezingtemperatures (Fig. 1). Commonly used histological sectioning procedures involveembedding the tissue in cutting polymers such as optimal cutting temperature(OCT) polymer, wax, or agar in order to stabilize the tissue and hold it in place.These procedures are not optimal for MS analysis since, during sectioning, thepolymer is spread over the surface of the tissue and can suppress desorption of sur-face compounds. However, small amounts of polymer can be used at the base ofthe sample, away from the surface to be cut. This protects the sample from con-tamination while attaching the tissue to the cryostat probe. Sections are thenmounted onto MALDI target plates. Additional sections can be collected forimmunohistochemical staining and histology to define regions of interested identi-fied by the cellular morphology. Prior to analysis, sections are dried in a vacuumdesiccator for at least 1 h to remove excess water from the sample. This step can beperformed either before or after matrix deposition with minor protein signal dif-ferences. Washing protocols, typically as an ethanol gradient for 15–30s at each

Molecular imaging by mass spectrometry 537
step, have also been used to remove salts and other contaminants from the sectionsbefore matrix deposition [35,36]. This procedure enhances the protein profilequality by increasing the signal-to-noise ratio for many ions, but it should be usedwith caution as some molecules may be removed during this process.
Several types of MALDI plates are available for sample analysis. Stainlesssteel or gold-coated target plates manufactured for the instrument are traditionallyused for tissue analysis. We have found that the gold-coated surface is preferredover stainless steel since the contrast from the gold enhances visualization of thetissue on the target plate as well as morphology changes within the tissue [35].Conductive glass slides can also be cut to the dimensions of the manufacturedplates and serve as an alternative to the traditional target plate. Using this medium,the same section can be stained with MALDI-compatible tissue stains and analyzed[36]. This allows for the direct selection of morphological regions of interest foranalysis without the uncertainty of alignment accuracy between a stained sectionand the section to be analyzed. Several nuclear-specific stains have been demon-strated to yield quality protein profiles with minimal stain-specific distortions,while maintaining visualization of the cell nucleus for cell identification and cancerdiagnosis.
2.1.2. Matrix deposition
Perhaps the most important aspect of sample preparation is matrix application.Matrix and matrix solvent selection for tissue section analysis is key to obtainingquality protein profiles [35]. Sinapinic acid (SA, 3,5-dimethoxy-4-hydroxycinnamicacid) is routinely used in most tissue profiling and imaging experiments, althoughother matrices can be used, such as �-cyano-4-hydroxycinnamic acid (HCCA)[37], 2,5-dihydroxybenzoic acid (DHB), or combinations of these. SA matrixconcentrations typically range from 20 mg/mL to a saturated matrix solution.Comparative studies have shown that a 50:50:0.1 organic:water:trifluoroacetic acid(TFA) matrix solution, where the organic component is ethanol or acetonitrile,yields the best general protein profile. TFA concentrations ranging from 0.3 to1% have been used to enhance the maximum number of proteins analyzed.For improved sensitivity, these solvent parameters should be optimized for eachexperimental tissue.
Depending on the experimental goal, different methods for matrix depositionmay be applied including depositing discrete large (nL) droplets regionally andcoating the entire tissue section with matrix. Fig. 2 presents a visual comparisonof three matrix deposition methods (described below in more detail).
For regional profiling experiments, relatively large matrix spots can be depositeddirectly on the sample by the use of either a low volume automatic pipette or anautomatic syringe pump attached to a small capillary (Fig. 2B). Matrix solution istypically deposited in volumes ranging from 50 nL to 1 �L. Stained histology

538 S.A. Schwartz and R.M. Caprioli
slides of adjacent tissue sections can be used to guide matrix deposition. Matrixdroplets deposited in this fashion incorporate proteins from a fairly large cellpopulation. A 100 nL droplet produces a matrix spot �1 mm in diameter on thesurface of the tissue section, incorporating proteins from thousands of cells. MSanalysis is then performed on each individual droplet. Data collected across thedroplet surface from 100 or more laser shots can be averaged to yield a profilereflecting the protein content from cells within the droplet surface.
For high-resolution images, tissues may be coated with matrix. Two primaryapproaches have been applied to tissue coating: applying a homogenous layer ofmatrix crystals using spray deposition techniques (Fig. 2C) and coating the tissuewith an array of small (pL) matrix droplets (Fig. 2D). The goal of coating the tissueis to achieve a homogeneous field of small matrix crystals at the resolution limitof the instrument. A critical step in this process is to ensure that the tissue remainswet with the matrix solution so that proteins can be incorporated during crystal-lization, while minimizing protein delocalization. Matrix crystal concentration isalso important. A matrix coating that is too light will produce too few crystals,resulting in poor incorporation of peptides and proteins, low intensity MS signals,and poor image resolution.
4x20x
B) Large volume (nL)
droplet
C) Monolayer matrix
coating
D) Small volume (pL)
droplet
A)
2mm
1mm 150µm
Fig. 2. Approaches to matrix deposition. (A) Photomicrograph of a mouse brain section, 12 �m thick,prior to matrix deposition. The yellow rectangle represents the tissue region coated with matrix andexpanded in the 4 panel. Three serial mouse brain sections were collected for matrix deposition.(B) Matrix droplet created by depositing two sequential 0.1 �L droplets of matrix onto the sameregion of the tissue surface. (C) Thin film of matrix created by 10 spray cycles using a glass nebu-lizer. (D) Array of pL droplets deposited using a robotic ejector. Panels from a 4 and a 20 mag-nification are shown for each example.

Molecular imaging by mass spectrometry 539
Various mechanisms have been applied to deposit matrix uniformly onto thetissue surface. One technique utilizes a deactivated glass spray venturi nebulizer(VWR Scientific Products, USA) to spray a fine matrix mist over the sample(Fig. 2C) [35]. In this approach, the solvent mixture is only in contact with deacti-vated glass, thus eliminating any corrosive reaction found in other metal-basedtechnologies. For complete coverage of the tissue, a cycle of matrix spray coatingsis performed. Typically, small volumes of matrix are sprayed over the plate surfaceuntil the entire tissue surface is damp. Care is taken to not overwet the tissue as pro-teins can delocalize. The sample plate is usually held vertically �20–30 cm fromthe sprayer. During matrix application, the sprayer is moved back and forth, parallelto the target, to evenly apply matrix over the entire sample surface. Following eachcoating cycle, the sample may be allowed to dry briefly before the next coatingcycle is performed. Typically, 8–10 cycles of coating and drying are applied toachieve an even, dense homogeneous crystal field. Since different tissue types canexhibit different surface properties, the number of coating cycles can vary. Surfaceproperties may also affect the final crystal size. Another technique applied inseveral of the examples discussed in this chapter requires immersing the tissue inmatrix solution containing a high percentage (70–95%) of organic solvent for ashort period of time (several minutes) and allowing it to dry. Following immersion,several spray-coating cycles of matrix may also be applied to the tissue surface toincrease the crystal coverage and protein incorporation. This technique can resultin a thin homogeneous field of small matrix crystals. However, this approach maybe sensitive to temperature, humidity, or other environmental factors.
Another approach to tissue coating utilizes robotics to deposit an array of smallmatrix droplets across the surface of the tissue (Fig. 2D) [38]. Matrix droplets,ranging from 0.1 pL to 10 �L, can be ejected onto the surface to coat the sample;droplets less than 100 �m in diameter have been generated with this technology.The deposition of multiple droplets onto the same position on the tissue enhancesprotein incorporation while increasing the total number of matrix moleculesdeposited. Protein delocalization is minimized to within the droplet area. Since theintroduction of this technology, several matrix deposition systems have becomecommercially available. Precisely targeting regions of interest by direct integra-tion of histology with tissue profiling has advanced these capabilities for seamlessprofiling analysis [39]. In this approach, a pathologist selects tissue regions ofinterest on a digitally scanned, stained tissue section image. These selected regionsare transferred to the robotic spotter for matrix deposition on the target tissuesection. Digital images of the prepared MALDI plates are then analyzed to auto-matically locate all MALDI spots. This information is transferred to generate acustom plate geometry file for automated MS analysis of each matrix droplet.
Robotic droplet ejection holds several advantages over spray coating for matrixdeposition including quality sample preparation and data reproducibility for massspectrometric imaging. The small discrete droplets can be sampled hundreds of

540 S.A. Schwartz and R.M. Caprioli
times with the laser, improving signal quality compared to a thin matrix layer inwhich the crystalline layer is quickly depleted. However, image resolution forrobotic deposition is limited to droplet size. Generally, �200 �m resolution isobtained with this device. Image resolution for thin matrix layer deposition is lim-ited by the laser diameter at the target surface (30–100 �m or more) and crystalsize, which can be 1–50 �m in diameter depending on the application method.
During experimental design, the type of information desired should help guidethe choice of the method of matrix application. As mentioned above, depositionof relatively large matrix droplets for tissue profiling should be used when thegoal is to simply compare large regions of tissue. Data files resulting from theseexperiments are relatively small, 4–5 MB for 30 profiles. Such experiments canbe analyzed without complex computer programs and the entire procedure can beperformed in less than 1 h. High-resolution images yield data files on the orderof 1–2 GB and can take several hours for acquisition, depending on the imageresolution (distance between pixels) and instrument spot-to-spot speed.Additionally, image analysis requires additional software viewing programs.However, the data collected through imaging results in a more detailed molecularpicture of protein distribution and have been used in many applications includingdrug distribution within a tissue and protein changes due to tumor infiltration.
2.1.3. Protein identification
Identification of molecular weight markers of interest has been performed inmany studies. Tissues are homogenized and proteins separated by one or moredimensions of liquid chromatography, such as ion exchange or reverse-phasechromatography. Collected fractions are screened by MALDI–MS and the frac-tions containing the intact molecular weight of interest are digested with trypsinor another suitable protease. The resulting peptides are analyzed by peptide massmapping and sequenced by tandem MS. The data collected are compared tocurrent protein databases for protein identification. This approach has led to theidentification of many tumor or tumor-stage-specific markers determined inprofiling or imaging experiments [29,40,41].
2.2. Biological applications
2.2.1. Glioma profiling and imaging
The molecular protein patterns present within defined histological regions can beobtained by direct mass spectrometric profiling of tissue sections for biomarkerdiscovery applications. Comparison of the protein profiles collected from differentdisease stages, such as tumor and non-tumor tissues, can reveal stage-specific pro-teins based on signal expression changes between groups. These results providepotential diagnostic biomarkers or therapeutic targets. Mass spectrometric protein

Molecular imaging by mass spectrometry 541
profiling has been used to determine diagnostic markers for several disease statesincluding brain tumors [41], lung cancer [31], colon cancer [29], prostate cancer,and breast cancer.
As an example, gliomas, representing �25,000 new cases per year, are the mostcommon primary brain tumors and one of the more fatal human malignancies.Accurate clinical diagnosis for these tumors is critical since diagnosis and treat-ment decisions are based almost exclusively on tissue histology. Research thereforehas focused on developing a protein profiling tool for accurate glioma diagnosis. Inthis work, samples from over 120 patients were collected and analyzed by directtissue protein profiling. Spectra from these samples were acquired in the m/z rangeof 2000–70,000 to avoid detector saturation from matrix signals. Typically,between 200 and 500 ion signals were detected in each spectrum. For example,analysis of a matrix droplet (100 nL) deposited directly on a 12 �m thick sectionof a human glioma resulted in the complex spectrum shown in Fig. 3. The m/z rangefrom 4300 to 12,500 is shown in expanded intensity to emphasize low intensity
Inte
nsity
Inte
nsity
Mass (m/z)
Mass (m/z)
4300 5940 7580 9220 10860 12500
4300 4500 4700 4900 5100 5300
Fig. 3. Protein profile generated from direct MS analysis of a matrix droplet deposited on a 12 �mhuman glioma section. The intensity scale has been expanded to display low intensity ion signals.The inset, displaying the m/z range 4300–5300, demonstrates the complexity of the data collectedfrom tissue samples. Over 50 ion signals can be recognized in the inset alone; over 500 signals wereobserved across the entire spectrum.

542 S.A. Schwartz and R.M. Caprioli
signals in the spectrum. Additionally, the range from 4300 to 5300 Da has beenexpanded on the m/z scale to show the complexity of the signal pattern. Over 500signals were detected across the entire mass range recorded for this sample.
Profiles collected from different tissue regions yield information on the cellularcontent within the tissue. Spectra from morphologically similar tissue regionsdemonstrate the general reproducibility of this technique for complex biologicalsamples. For example, in Fig. 4, two mass spectra (1 and 2) collected from ahigh-grade, aggressive glioma region, and two (3 and 4) from the surroundingnon-tumor tissue are presented. The original tissue section (Fig. 4A) and corre-sponding spectra (Fig. 4B) are shown. The spectra collected from similar cellularregions are comparable, reflecting the similarity in protein content within thistumor sample and the reproducibility of the mass spectrometric analysis fromtissue sections. On the other hand, spectra collected from different histologicalregions of the tissue highlight the changes in protein expression between tumorand non-tumor areas. Statistical analysis of the protein patterns collected fromthese samples has identified a suite of signals that could distinguish tumor fromnon-tumor tissues as well as stages of tumor progression (grade 2, 3, and 4gliomas). These data allow one to segregate disease stages based on the proteinpattern themselves. Additional analysis suggests that specific mass spectrometric
B)
1
4
3
2
Non-Tumor (4)
Non-Tumor (3)
Tumor (2)
Tumor (1)
Inte
nsity
80004000 m/z
A)
Fig. 4. Protein profiles generated from direct MS analysis of a human glioma biopsy. (A) Histologyidentified two distinct regions within the presented tissue, a region of high-grade glioma tissue (out-lined by two dashed, - - -, lines) surrounded by non-tumor tissue. (B) Two mass spectra (1 and 2)from the tumor region and two (3 and 4) from the surrounding non-tumor tissue are presented.Spectra collected from similar cellular regions are comparable, reflecting the similarity in proteincontent within this tumor sample. Spectra collected from different histological regions of the tissueare markedly dissimilar, indicating the changes in protein expression between the tumor and thenon-tumor areas.

Molecular imaging by mass spectrometry 543
protein patterns can be used to accurately indicate patient prognosis. Such studiessuggest that these tools, in combination with current techniques, may be useful fora more accurate molecular diagnosis of disease states.
MS imaging has also been performed on many of these tissues to serve as avisual comparative analysis of differential protein expression. For example, Fig. 5
2000 25000m/z
LG
HG
5239 5813 6387 6961
C)
A) HG
B) LG3 mmF) m/z 5826
D) m/z 7380 G) m/z 10092
E) m/z 10625 H) m/z 11068
100%
0
Fig. 5. Imaging MS analysis of a high- and low-grade glioma. (A and B) Initial tumor sections,thaw-mounted on the MALDI sample plate prior to matrix deposition. Samples were coated withmatrix by robotic ejection and imaged at 250 �m resolution. (C) Averaged protein profiles obtainedfor each section after image analysis. Stars indicate signals with differential signal intensityobserved between the two profiles. (D–H) Ion density maps selected from different m/z values. Themaps are depicted as gray scale images with white representing the highest signal intensity and blackthe lowest. (Reprinted with permission from Toxicologic Pathology, Volume 33:1, pp. 97, 2005.)

544 S.A. Schwartz and R.M. Caprioli
presents a simultaneous analysis of two glioma biopsies, a low-grade, grade II,tumor and a high-grade, grade IV, tumor. The tumor sections analyzed are shownin Fig. 5A and B. A robotic instrument was used to deposit matrix droplets acrossthe tissue surface, which was then imaged with a resolution of 250 �m. Fig. 5Cpresents averaged protein profiles obtained from the low- and high-grade gliomasamples. Many signals expressed with differing intensities between the low- andhigh-grade tumors as described above. Fig. 5D–H presents ion images for severalof these signals. The mass signals shown were found to be statistically significantin distinguishing these disease states.
2.2.2. Brain and brain tumor imaging
Discrete, unique features exist within the brain, many of which have complex func-tions. This complexity is shown in the mouse brain imaged by MALDI–MS in the toppanel of Fig. 6. A flash frozen mouse brain was sectioned (12 �m) on a cryostat andmounted onto a gold-coated stainless-steel sample plate. A sequential section wascollected on a glass slide and stained with hematoxylin and eosin for feature recog-nition (Fig. 6A). The tissue section was immersed in matrix solution (20 mg/mL SAin 90/10/0.1 ethanol/water/TFA), dried, and coated with several spray cycles ofmatrix solution (20 mg/mL SA in 50/50/0.1 acetonitrile/water/TFA) as describedabove. The tissue section was then imaged with a 50 �m spot-to-spot resolution; eachspectrum per spot was an average of 40 laser shots. Several of the hundreds of masssignals observed were selected and an ion density map for each signal was constructed(Fig. 6B–F). These images show the distinct localization of proteins within the tissuesection as measured by MS. For example, m/z 18,412 is localized primarily to thecorpus callosum while m/z 6720 is abundant in the striatum.
Tumor models serve as useful tools in measuring protein differences distinctivefor growing tumors as well as studying protein changes across tumor margins. Asan example, a tumor, resulting from the injection of GL261 brain cancer cells intoa mouse brain, and the surrounding brain tissue were imaged by MS (bottom panelof Fig. 6). The tumor developed in the left lateral ventricle of the brain withevidence of tumor migration distinguishable in the right lateral ventricle. Themouse brain was sectioned and coated with matrix. A photomicrograph of the sec-tion prior to imaging is presented in Fig. 6G. The sample was imaged with 20 lasershots per spectrum at an imaging resolution of 110 �m. Fig. 6H–R presents sev-eral ion images reconstructed following sample analysis. Some of the presentedpatterns reflect proteins specific to the growing tumor including those at m/z 6924and 11,307 while others are localized to non-tumor regions such as m/z 18,412.
2.2.3. Drug imaging and drug response profiling
Imaging MS can also be used to map the location of administered drugs fromvarious organs and monitor protein changes as a response to drug treatment. One

Fig. 6. Imaging MS of a healthy and a diseased mouse brain section. Top panel: (A) Photomicrographof a 12 �m hematoxylin and eosin stained brain tissue section at bregma �0.75 mm. Differences inanatomic brain substructures can be distinguished including (1) cerebral cortex, (2) corpus callo-sum, and (3) striatum. A sequential section was collected, coated with matrix, and imaged at 50 �m.(B–F) Ion density maps obtained at different m/z ratios are displayed. Bottom panel: (G)Photomicrograph of a brain section containing a tumor, 12 �m thick, prior to matrix coating. Thetissue region containing the tumor is outlined in gray. The sample was coated with matrix andimaged at 110 �m. (H–R) Ion density maps obtained at different m/z ratios are displayed. The iondensity maps are depicted as pseudo-color images with white representing the highest proteinconcentration and black the lowest. Images represented in the top and bottom panels were inde-pendently normalized by intensity. (Reprinted with permission from the authors: Richard Caprioli,Pierre Chaurand and Sarah Schwartz, Anal Chem 76: 87A–93A, 2004.)

546 S.A. Schwartz and R.M. Caprioli
advantage to this approach over other methods, such as the use of radiolabeledcompounds or fluorescent markers, is that both intact drug as well as drug metabo-lites can be simultaneously analyzed. Additionally, drug-induced protein changesthat are dose and time dependent can be determined. These results yield a potentialtool for predicting clinical efficacy. Tentative studies also suggest that MALDI–MSanalysis of tissue samples prior to drug treatment can predict drug resistance.
Fig. 7. OSI-774 localization in mouse mammary tumors and dose-dependent therapy-induced pro-teomic changes. (A) Two (approximately) 1 mm3 pellets from an MMTV/HER2 mammary tumorwere implanted via small surgical incisions in the s.c. space of the right and left dorsum of wild-typefemale FVB mice, respectively. Once they reached a volume of �250 mm3, treatment with OSI-774at the indicated doses p.o. was started. Twenty hours after the first dose, all right-sided tumors wereharvested, and the mice continued on daily therapy for the next 9 days. Left-sided tumor volumes areshown; bars, 3 SD. (B) Mass spectral analysis of MMTV/HER2 sections from tumors harvested20 h after a variable single dose of OSI-774 reveals several proteomic changes induced from the100 mg/kg dose. (C) Wild-type FVB mice bearing MMTV/HER2 tumors measuring �200 mm3 weretreated with 100 mg/kg OSI-774 p.o. and harvested after 16 h. Two serial sections of the treated tumorand one section of the untreated tumor were analyzed by imaging MS. A mass spectral image ofOSI-774 performed on the first treated section demonstrates that OSI-774 is distributed throughoutthe tumor section, but is less evident in the necrotic center. Selected protein images for ubiquitin,performed on the second treated tumor section and the untreated tumor section, demonstrate thatubiquitin is markedly down-regulated in the treated tumor. (Reprinted with permission from theAmerican Association for Cancer Research from Cancer Research 64: 9093–9100, 2004.)

Molecular imaging by mass spectrometry 547
An example of this work focused on analyzing proteomic changes followingtumor treatment with the therapeutic agent, OSI-774 [22]. OSI-774 suppressestumor growth by inhibiting the EGFR tyrosine kinase. Dose-dependent studieson mouse models bearing mammary tumors demonstrated that treatments of100 mg/kg were necessary for tumor growth arrest (Fig. 7A). MS profiling of tis-sues treated with increasing OSI-774 doses (10, 30, and 100 mg/kg) demonstratedthat specific protein pattern changes were dose dependent. For example, the T�4(m/z 4965) and ubiquitin (m/z 8565) ion signals were significantly decreased whilea signal corresponding to an E-cadherin fragment (m/z 4794) was increased in thetissue samples treated with 100 mg/kg OSI-774 (Fig. 7B). Imaging experimentswere also used to confirm these protein changes and correlate the protein localiza-tion with the presence of OSI-774. As shown in Fig. 7C, OSI-774, as measuredthrough selected reaction monitoring (described previously in ref. [22]) of the tran-sition m/z 394.2 → 278.1, is distributed throughout the tumor section but is less pre-dominant in the necrotic center. Imaging experiments performed on a sequentialsection demonstrate that m/z 8565, corresponding to ubiquitin, is expressed atlower levels in the treated sample when compared to a control, untreated tumor.
Further studies were used to demonstrate that profiles generated byMALDI–MS analysis of tumor samples may be indicative of drug resistance. Twotypes of tumors, originating from the same transgenic founder cell line, werefound to have a differing response to Herceptin, a therapeutic agent that binds theHER2 receptor and inhibits tumor growth. The growth of F2-1282 tumors is inhib-ited by Herceptin while Fo5 tumors are resistant (Fig. 8A), even though the tumorcells express similar levels of HER2. Analysis of these tumor lines followingHerceptin treatment showed differential protein expression including an increasein m/z 9212 in the Herceptin sensitive tumors that was not present in the resistanttumors (Fig. 8B). These studies suggest that biomarker changes specific for tumorresponse to treatment can be monitored.
3. Discussion
There are many potential clinical applications for direct molecular analysis of tissuesamples. Profiling and imaging technologies using MALDI–MS have the advan-tage of providing molecular weight-specific protein profiles and high-resolution(30–50 �m resolution) protein images. Results from these experiments detail themolecular complexities of the samples as well as precise protein localization withina tissue. Cellular processes occurring within healthy and diseased states cantherefore be mapped with high sensitivity and specificity. In this approach, tissueanalysis by MS serves as an extraordinary discovery tool since many hundreds ofproteins, the identities of which do not need to be known in advance, can bemonitored in a comparative study. The relative concentrations of the markers can

(B)
(A)
0
100
200
300
400
500
600
Tum
or v
olum
e (m
m3 ) 700
800
900
1000
0 1 2 3 4 5 6 7
Day of treatment
8 9 10 11 12 13 14 15
Fo5 tumors
1282 tumors
9,212
8880 8984 9088 9192 9296 9400m/z
Inte
nsity
900
900
Inte
nsity
1282 tumors
Fo5 tumors
9,212
Fig. 8. Drug-induced proteome changes predict for therapeutic resistance. (A) Mice bearing estab-lished �300 mm3 Fo5 (Herceptin-resistant) and 1282 (Herceptin-sensitive) tumors were treated withHerceptin 30 mg/kg i.p. twice a week. Each data point represents mean tumor volume SD (Fo5,n 3; 1282, n 6). (B) Fo5 and 1282 tumors of equivalent size were harvested 24 and 48 h after asingle dose of Herceptin i.p. and subjected to mass spectral proteomic profiling analysis. An exampleof a statistically significant change observed after Herceptin treatment in the 1282 tumors notobserved in the Fo5 tumors is shown. The solid line trace (—) represents control, untreated tumorswhile the dotted line trace (. . .) represents Herceptin-treated tumors. (Reprinted with permission fromthe American Association for Cancer Research from Cancer Research 64: 9093–9100, 2004.)

Molecular imaging by mass spectrometry 549
be assessed either across a tissue section or between sample groups. Once a poten-tial biomarker is identified, its sub-cellular localization, concentration, regulationmechanism, and function can be further investigated to increase the understandingof a specific disease or disease state at the molecular level. It is also important tonote that the biomarker changes discussed here were detected in unfixed, frozentissues that did not require additional preparation before analysis. Therefore, tissueanalysis can be performed in a high-throughput, accurate manner.
Clinically, profiling and imaging MS may provide a molecular assessment ofdisease states, including tumor diagnosis and progression, and aid in patientprognosis and designing treatment strategies. These tools can work in concert withclassifying disease based on pathology to augment clinical diagnosis and ulti-mately, patient treatment and outcome. Furthermore, predicting therapeutic responsethrough biomarker discovery is of increasing importance. The assessment of drugtreatment efficacy and identification of early signs of treatment resistance throughmass spectrometric proteomic studies can serve as an invaluable tool to eventuallyimprove the clinical outcome of patients. Studies correlating protein expressionchanges with drug distribution illustrate the ability to evaluate the effects of targetedtherapeutics within the disease microenvironment. In combination with other tradi-tional assays, an improved understanding of the effects of new therapeutics can beattained, thereby enhancing drug development and the success of clinical trials.
4. Future trends
One of the features of profiling and imaging MS is its potential as a discovery toolin research areas involving biomarker identification as well as protein or druglocalization without the use of antibodies or fluorescent markers. Little a prioriinformation is necessary for differences in protein expression patterns to be iden-tified. Future developments are required to make this technology more useful androutinely accessible including increasing the number of proteins detected, improv-ing detection sensitivity at higher masses, decreasing the analysis time for proteinidentification, and instrumental improvements to allow for faster data acquisitionand processing and higher resolution images.
Currently, mass spectrometric analysis directly off tissue detects hundreds ofproteins in the mass range of 2000–100,000 Da, although beyond about m/z 30,000ion detection efficiency and resolution decrease. Improved instrumentation suggeststhe potential for ion detection at higher molecular weight analysis with enhancedsignal resolution. In addition, since matrix application is necessary for protein ion-ization, detection is limited to primarily hydrophilic proteins or proteins boundthrough non-covalent interactions. Methods to increase hydrophobic protein solubi-lization under MS-compatible conditions should increase the number of biologicalmolecules analyzed by MALDI–MS. Membrane-bound proteins are for the most

550 S.A. Schwartz and R.M. Caprioli
part inaccessible to the matrix solvent and, as a result, are not incorporated into thematrix crystals. Recent efforts have therefore focused on applying MS-compatiblesurfactants to disrupt cell membranes and solubilize membrane-bound proteins [42].
Efforts have also focused on developing faster and higher throughput methodsfor protein identification. Although MALDI–MS profiling and imaging approachesprecisely determine molecular weights for specific ions, these data are usually notsufficient for protein identification. Many existing protein databases do not takeinto account protein post-translational modifications in molecular weight calcula-tions, thus limiting the utility of database searches for proteins based solely onmolecular weight. Other approaches to identify proteins of interest, such as usingHPLC coupled to tandem mass spectrometers, are more robust and better utilizeprotein database search engines, but the process can be very time consuming.Exploring avenues including on-tissue digestions, soft landing approaches[43–45], and high energy CID [46,47] may lead to faster protein identificationwhile utilizing existing protein databases.
Finally, in order for tissue analysis by MS to become a routine technology,instrumental modifications and software development are important. Tissue imag-ing requires optimization of the laser repetition rate as well as data downloadingand processing times. Lasers with faster repetition rates (�1 kHz) and improvedelectronics should reduce profile and image acquisition times. Acquisition algorithmsthat can record high-throughput data are also being developed. Data processingand mining tools are being designed that enhance biomarker selection and accuracy.Although the MS techniques discussed here do not allow for sub-cellular analysis,new developments may allow for this application in the future. Demands for higherresolution images have also led to the development of smaller laser spot diameters(on the order of 1–10 �m). Improved matrix application to generate smaller crys-tals will aid these studies.
5. Conclusion
Utilizing MS to profile and image tissue samples combines the advantages ofidentifying molecular differences between tissue samples and maintaining analytespatial information. Protein changes measured with this technology suggest theapplication of MALDI–MS to identify molecular mechanisms associated withtumor development or tumor response to therapeutic treatments. Protein patterns,protein localization, and protein–protein co-localization can be monitored as wellas how these patterns change in compromised tissues. A single acquisition yieldshundreds of signals with relatively high mass accuracy measurements. This largequantity of data not only produces information related to tissue morphology, butalso identifies potential molecular biomarkers for diseased cells or targets for drugdevelopment. The discovery aspect of this research combined with the quantity of

Molecular imaging by mass spectrometry 551
information obtained for each tissue sample provides a new, innovative tool foruse in biological research.
Acknowledgments
The authors would like to acknowledge Pierre Chaurand, Michelle Reyzer, Hans-Rudolf Aerni, and Malin Andersson (Mass Spectrometry Research Center,Vanderbilt University) for generating some of the data presented here. We wouldalso like to thank Robert Weil, Steven Toms (Cleveland Clinic Foundation), andReid Thompson (Vanderbilt University) for providing the brain tumors, MahlonJohnson (Department of Pathology, Vanderbilt University) for histological analysisof the brain tumors, Claudine Laurent and Pat Levitt (Department of Pharmacology,Vanderbilt University) for providing the normal mouse brains, and Dennis Hallahan(Department of Radiation Oncology, Vanderbilt University) for providing the mousebrain containing the tumor. We would also like to acknowledge funding by theNational Institutes of Health (grant GM 58008) and the National Cancer Institute(grant CA86243-02).
References
1. Hillenkamp, F., Karas, M., Beavis, R.C. and Chait, B.T., Matrix-assisted laser desorptionionization mass-spectrometry of biopolymers. Anal. Chem., 63, A1193–A1202 (1991).
2. Karas, M. and Hillenkamp, F., Laser desorption ionization of proteins with molecular massesexceeding 10000 Daltons. Anal. Chem., 60, 2299–2301 (1988).
3. Bahr, U., StahlZeng, J., Gleitsmann, E. and Karas, M., Delayed extraction time-of-flight MALDImass spectrometry of proteins above 25,000 Da. J. Mass Spectrom., 32, 1111–1116 (1997).
4. Brown, R.S. and Lennon, J.J., Mass resolution improvement by incorporation of pulsed ionextraction in a matrix-assisted laser-desorption ionization linear time-of-flight mass-spectrometer. Anal. Chem., 67, 1998–2003 (1995).
5. Guilhaus, M., Mlynski, V. and Selby, D., Perfect timing: time-of-flight mass spectrometry.Rapid Commun. Mass Spectrom., 11, 951–962 (1997).
6. Aebersold, R. and Goodlett, D.R., Mass spectrometry in proteomics. Chem. Rev., 101,269–295 (2001).
7. Pandey, A. and Mann, M., Proteomics to study genes and genomes. Nature, 405, 837–846 (2000).8. Bergquist, J., Cells on the target—matrix-assisted laser-desorption/ionization time-of-flight
mass-spectrometric analysis of mammalian cells grown on the target. Chromatographia, 49,S41–S48 (1999).
9. Caprioli, R.M., Farmer, T.B. and Gile, J., Molecular imaging of biological samples: localiza-tion of peptides and proteins using MALDI–TOF MS. Anal. Chem., 69, 4751–4760 (1997).
10. Chaurand, P., Stoeckli, M. and Caprioli, R.M., Direct profiling of proteins in biological tissuesections by MALDI mass spectrometry. Anal. Chem., 71, 5263–5270 (1999).
11. Garden, R.W., Moroz, L.L., Moroz, T.P., Shippy, S.A. and Sweedler, J.V., Excess salt removalwith matrix rinsing: direct peptide profiling of neurons from marine invertebrates using

552 S.A. Schwartz and R.M. Caprioli
matrix-assisted laser desorption ionization time-of-flight mass spectrometry. J. MassSpectrom., 31, 1126–1130 (1996).
12. Holland, R.D., Wilkes, J.G., Rafii, F., Sutherland, J.B., Persons, C.C., Voorhees, K.J. and LayJr. J.O., Rapid identification of intact whole bacteria based on spectral patterns using matrix-assisted laser desorption/ionization with time-of-flight mass spectrometry. Rapid Commun.Mass Spectrom., 10, 1227–1232 (1996).
13. Jimenez, C.R. and Burlingame, A.L., Ultramicroanalysis of peptide profiles in biologicalsamples using MALDI mass spectrometry. Exp. Nephrol., 6, 421–428 (1998).
14. Jiménez, C.R., Li, K.W., Dreisewerd, K., Spijker, S., Kingston, R., Bateman, R.H.,Burlingame, A.L., Smit, A.B., van Minnen, J. and Geraerts, W.P.M., Direct mass spectromet-ric peptide profiling and sequencing of single neurons reveals differential peptide patterns ina small neuronal network. Biochemistry, 37, 2070–2076 (1998).
15. Krishnamurthy, T. and Ross, P.L., Rapid identification of bacteria by direct matrix-assistedlaser desorption/ionization mass spectrometric analysis of whole cells. Rapid Commun. MassSpectrom., 10, 1992–1996 (1996).
16. Li, K.W., Hoek, R.M., Smith, F., Jimenez, C.R., van der Schors, R.C., van Veelen, P.A.,Chen, S., van der Greef, J., Parish, D.C. and Benjamin, P.R., Direct peptide profiling by mass-spectrometry of single identified neurons reveals complex neuropeptide-processing pattern. J. Biol. Chem., 269, 30288–30292 (1994).
17. Li, L.J., Garden, R.W. and Sweedler, J.V., Single-cell MALDI: a new tool for direct peptideprofiling. Trends Biotechnol., 18, 151–160 (2000).
18. Lynn, E.C., Chung, M.C., Tsai, W.C. and Han, C.C., Identification of Enterobacteriaceaebacteria by direct matrix-assisted laser desorption/ionization mass spectrometric analysis ofwhole cells. Rapid Commun. Mass Spectrom., 13, 2022–2027 (1999).
19. Moroz, L.L., Gillette, R. and Sweedler, J.V., Single-cell analyses of nitrergic neurons in simplenervous systems. J. Exp. Biol., 202, 333–341 (1999).
20. Palmer-Toy, D.E., Sarracino, D.A., Sgroi, D., LeVangie, R. and Leopold, P.E., Direct acquisi-tion of matrix-assisted laser desorption/ionization time-of-flight mass spectra from lasercapture microdissected tissues. Clin. Chem., 46, 1513–1516 (2000).
21. Redeker, V., Toullec, J.Y., Vinh, J., Rossier, J. and Soyez, D., Combination of peptide profil-ing by matrix-assisted laser desorption/ionization time of flight mass spectrometry andimmunodetection on single glands or cells. Anal. Chem., 70, 1805–1811 (1998).
22. Reyzer, M.L., Hsieh, Y.S., Ng, K., Korfmacher, W.A. and Caprioli, R.M., Direct analysis ofdrug candidates in tissue by matrix-assisted laser desorption/ionization mass spectrometry.J. Mass Spectrom., 38, 1081–1092 (2003).
23. Rubakhin, S.S., Garden, R.W., Fuller, R.R. and Sweedler, J.V., Measuring the peptides inindividual organelles with mass spectrometry. Nat. Biotechnol., 18, 172–175 (2000).
24. Stoeckli, M., Chaurand, P., Hallahan, D.E. and Caprioli, R.M., Imaging mass spectrometry: anew technology for the analysis of protein expression in mammalian tissues. Nat. Med., 7,493–496 (2001).
25. Todd, P.J., Schaaff, T.G., Chaurand, P. and Caprioli, R.M., Organic ion imaging of biologicaltissue with secondary ion mass spectrometry and matrix-assisted laser desorption/ionization.J. Mass Spectrom., 36, 355–369 (2001).
26. Troendle, F.J., Reddick, C.D. and Yost, R.A., Detection of pharmaceutical compounds in tissue bymatrix-assisted laser desorption/ionization and laser desorption/chemical ionization tandem massspectrometry with a quadrupole ion trap. J. Am. Soc. Mass Spectrom., 10, 1315–1321 (1999).
27. van Veelen, P.A., Jimenez, C.R., Li, K.W., Wildering, W.C., Geraerts, W.P.M., Tjaden, U.R.and van der Greef, J., Direct peptide profiling of single neurons by matrix-assisted laser-desorption ionization mass-spectrometry. Org. Mass Spectrom., 28, 1542–1546 (1993).

Molecular imaging by mass spectrometry 553
28. Dreisewerd, K., Kingston, R., Geraerts, W.P.M. and Li, K.W., Direct mass spectrometricpeptide profiling and sequencing of nervous tissues to identify peptides involved in male cop-ulatory behavior in Lymnaea stagnalis. Int. J. Mass Spectrom., 169, 291–299 (1997).
29. Chaurand, P., DaGue, B.B., Pearsall, R.S., Threadgill, D.W. and Caprioli, R.M., Profilingproteins from azoxymethane-induced colon tumors at the molecular level by matrix-assistedlaser desorption/ionization mass spectrometry. Proteomics, 1, 1320–1326 (2001).
30. Schwartz, S.A., Weil, R.J., Johnson, M.D., Toms, S.A. and Caprioli, R.M., Protein profiling inbrain tumors using mass spectrometry: feasibility of a new technique for the analysis ofprotein expression. Clin. Cancer Res., 10, 981–987 (2004).
31. Yanagisawa, K., Shyr, Y., Xu, B.J., Massion, P.P., Larsen, P.H., White, B.C., Roberts, J.R.,Edgerton, M., Gonzalez, A., Nadaf, S., Moore, J.H., Caprioli, R.M. and Carbone, D.P., Proteomicpatterns of tumour subsets in non-small-cell lung cancer. Lancet, 362, 433–439 (2003).
32. Pierson, J., Norris, J.L., Aerni, H.-R., Svenningsson, P., Caprioli, R.M. and Andrén, P.E.,Molecular profiling of experimental Parkinson’s disease: direct analysis of peptides and pro-teins on brain tissue sections by MALDI mass spectrometry. J. Proteome Res., 3, 289–295(2004).
33. Spengler, B. and Hubert, M., Scanning microprobe matrix-assisted laser desorption ionization(SMALDI) mass spectrometry: instrumentation for sub-micrometer resolved LDI and MALDIsurface analysis. J. Am. Soc. Mass Spectrom., 13, 735–748 (2002).
34. Stoeckli, M., Farmer, T.B. and Caprioli, R.M., Automated mass spectrometry imaging with amatrix-assisted laser desorption ionization time-of-flight instrument. J. Am. Soc. MassSpectrom., 10, 67–71 (1999).
35. Schwartz, S., Reyzer, M. and Caprioli, R., Direct tissue analysis using matrix-assisted laserdesorption/ionization mass spectrometry: practical aspects of sample preparation. J. MassSpectrom., 38, 699–708 (2003).
36. Chaurand, P., Schwartz, S.A., Billheimer, D., Xu, B.J., Crecelius, A. and Caprioli, R.M.,Integrating histology and imaging mass spectrometry. Anal. Chem., 76, 1145–1155 (2004).
37. Kruse, R. and Sweedler, J.V., Spatial profiling invertebrate ganglia using MALDI MS. J. Am.Soc. Mass Spectrom., 14, 752–759 (2003).
38. Aerni, H.R., Cornett, D.S. and Caprioli, R.M., Automated acoustic matrix deposition forMALDI sample preparation. Anal. Chem., 78, 827–834 (2006).
39. Cornett, D.S., Mobley, J.A., Dias, E.C., Andersson, M., Arteaga, C.L., Sanders, M.E. and Caprioli,R.M., A novel histology directed strategy for MALDI–MS tissue profiling that improves through-put and cellular specificity in human breast cancer. Mol. Cell. Proteomics, 5, 1975–1983 (2006).
40. Xu, J., Stolk, J.A., Zhang, X., Silva, S.J., Houghton, R.L., Matsumura, M., Vedvick, T.S.,Leslie, K.B., Badaro, R. and Reed, S.G., Identification of differentially expressed genes inhuman prostate cancer using subtraction and microarray. Cancer Res., 60, 1677–1682 (2000).
41. Schwartz, S.A., Weil, R.J., Thompson, R.C., Shyr, Y., Moore, J.H., Toms, S.A., Johnson, M.D.and Caprioli, R.M., Proteomic-based prognosis of brain tumor patients using direct-tissue matrix-assisted laser desorption ionization mass spectrometry. Cancer Res., 65, 7674–7681 (2005).
42. Norris, J.L., Porter, N.A. and Caprioli, R.M., Mass spectrometry of intracellular and mem-brane proteins using cleavable detergents. Anal. Chem., 75, 6642–6647 (2003).
43. Gologan, B., Takáts, Z., Alvarez, J., Wiseman, J.M., Talaty, N., Ouyang, Z. and Cooks, R.G.,Ion soft-landing into liquids: protein identification, separation, and purification with retentionof biological activity. J. Am. Soc. Mass Spectrom., 15, 1874–1884 (2004).
44. Ouyang, Z., Takáts, Z., Blake, T.A., Gologan, B., Guymon, A.J., Wiseman, J.M., Oliver, J.C.,Davisson, V.J. and Cooks, R.G., Preparing protein microarrays by soft-landing of mass-selectedions. Science, 301, 1351–1354 (2003).
45. Washburn, M.P., Soft landing for protein chips. Nat. Biotechnol., 21, 1156–1157 (2003).

554 S.A. Schwartz and R.M. Caprioli
46. Lin, M., Campbell, J.M., Mueller, D.R. and Wirth, U., Intact protein analysis by matrix-assistedlaser desorption/ionization tandem time-of-flight mass spectrometry. Rapid Commun. MassSpectrom., 17, 1809–1814 (2003).
47. Medzihradszky, K.F., Campbell, J.M., Baldwin, M.A., Falick, A.M., Juhasz, P., Vestal, M.L.and Burlingame, A.L., The characteristics of peptide collision-induced dissociation using ahigh-performance MALDI–TOF/TOF tandem mass spectrometer. Anal. Chem., 72, 552–558(2000).
48. Chaurand, P., Schwartz, S.A., Reyzer, M.L. and Caprioli, R.M., Imaging mass spectrometry:principles and potentials. Toxicol. Pathol., 33, 92–101 (2005).
49. Chaurand, P., Schwartz, S.A. and Caprioli, R.M., Profiling and imaging proteins in tissuesections by MS. Anal. Chem., 76, 87A–93A (2004).
50. Reyzer, M.L., Caldwell, R.L., Dugger, T.C., Forbes, J.T., Ritter, C.A., Guix, M., Arteaga, C.L.and Caprioli, R.M., Early changes in protein expression detected by mass spectrometry predicttumor response to molecular therapeutics. Cancer Res., 64, 9093–9100 (2004).

Medical Applications of Mass SpectrometryK. Vékey, A. Telekes and A. Vertes (editors)© 2008 Elsevier B.V. All rights reserved
555
Chapter 24
Brief outlook
KÁROLY VÉKEYa,*, ANDRÁS TELEKESb,1, and AKOS VERTESc,2
aChemical Research Center, Hungarian Academy of Sciences, Budapest, HungarybNational Institute of Oncology, Budapest, HungarycW.M. Keck Institute for Proteomics Technology and Applications, Department of Chemistry,The George Washington University, Washington, DC, USA
1. Trends in instrumentation 5562. Emerging systems approach 5583. Mass spectrometry in translational medicine 559
Mass spectrometry is widely used in analytical chemistry and biochemistry, and isjust making a spectacular entry into the biomedical and clinical fields. Togetherwith genetic techniques, it signals a new era in medical treatment: the arrival ofadvanced instrumentation to the bedside, the characterization of the human organismat the molecular level, and the use of this information to improve healthcare.
Mass spectrometry has proven itself in biomedical research; several chapters inthis book are a testament to its applications in various disciplines. It is also accu-rate and robust enough to be widely used, e.g., in the pharmaceutical industry, andit is well adapted to routine applications. These features allow mass spectrometryto enter into the clinical field, where its potential is enormous. It can be used fora variety of purposes, from diagnosis to prognosis and to help selecting the opti-mal treatment for a patient. It is suitable for high-throughput analysis, requires asmall amount of sample (e.g., a drop of blood suffices), produces accurate results,and can be used according to good clinical practice. In spite of these advantages,mass spectrometry is just emerging as a tool for clinical work. To some degreethis may be the consequence of a communication barrier between physicians and
*Corresponding author. Tel.: �361-438-1158; Fax: �261-438-1157. E-mail: [email protected](K. Vékey).1E-mail: [email protected] (A. Telekes).2E-mail: [email protected] (A. Vertes).

556 K. Vékey et al.
analytical chemists. The complex technical nature of mass spectrometry and thedata analysis involved makes it difficult to enter the field without formal training.The primary purpose of this book is to break down this communication barrier,and to illustrate to medical professionals the powerful contribution mass spec-trometry can provide to various aspects of medicine.
Looking into the near future, i.e., the coming 5–10 years, several trends can bepredicted. The availability of mass spectrometric techniques is beginning toreframe our thinking about the medical questions that can be addressed. This mightpave the way for the emergence of new disciplines and widen the horizon of med-ical science. Evidence-based medicine clearly requires all available, objective data,which helps to select the best possible treatment for a given patient. Modern ana-lytical instrumentation is increasingly well suited for high-throughput samplehandling and straightforward operation. The capabilities of mass spectrometry andthe needs of clinical research and clinical laboratories are converging. For thesereasons, the editors firmly believe that we are at the beginning of a new revolution,when mass spectrometry will have an important role in clinics and in everydaymedical laboratory practice. We hope this book will help to facilitate this revolu-tion, by surmounting the communication barrier between analytical chemists andmedical professionals.
1. Trends in instrumentation
The figures of merit for modern mass spectrometry are so excellent that listingthem here might give the impression we are citing a promotional brochure. Thistechnique provides structural information (e.g., the molecular mass and proteinsequence); it can be used for quantitation; inorganics, small organics, and macro-molecules can all be studied; and it can identify trace impurities and a given classof target compounds in the presence of a complex matrix (e.g., plasma). Massspectrometry is very sensitive; in some cases even a few molecules (zeptomoles,i.e., 10�21 mol) might be detected. It can be integrated with separation techniques(e.g., GC and HPLC), it can be automated, and it is well suited for high-throughputapplications (typically needed for screening). The less favorable aspects of massspectrometry include operational complexity (although in recent years the humaninterface of the instrumentation has been significantly simplified) and the need forhighly qualified personnel. Sample preparation can be time consuming (similar tomost other analytical methods), results are not always straightforward to interpret,and mass spectrometers are quite expensive.
There are major efforts underway in instrument development to overcomethese disadvantages and to lower the cost of ownership for mass spectrometers.We foresee major improvements during the next decade in the following areas:
(a) Robotics, automation, and high throughput. These technologies are aimed atdramatically increasing the efficiency of sample manipulation and analysis.
Brief outlook 557
They are currently available but, as yet, overpriced and underutilized. Fractioncollectors, sample spotters, and gel cutters are prime examples of the robotsavailable today. Other aspects of sample preparation can also be performedby dedicated robots. These may involve simple dilution of plasma, addingsolvents, reagents, or standards, or taking on the complex series of samplepreparation steps and integrating them with mass spectrometry. Proteomics isprobably the first area where robots will become widespread. There are sys-tems to manipulate and digest samples but there are also specialized onesdesigned primarily for mass spectrometry. The operation of most commercialmass spectrometers can be automated. Following sample preparation, samplesare often loaded onto standardized well-plates, introduced into and measuredby the mass spectrometer automatically.
Throughput depends significantly on the type of service required and whetherchromatography is needed. Typical research laboratories might run �10 samples/dayon an instrument. In contrast, service laboratories might average �100 samples/dayand those equipped for high throughput can reach �1000 samples/day. When work-ing with high throughput, simple and accurate sample labeling (represented by bar-codes) and documentation are essential. The typical time requirement for obtaininga mass spectrum is less than a second; therefore, samples can be introduced intothe mass spectrometer every minute or so. Chromatography, however, requires10–100 min. Not surprisingly, therefore, major efforts are directed to eliminating orspeeding up chromatographic separation. As chromatography is extremely powerful,leaving it out to gain time involves a significant compromise. This may be alleviatedby using more advanced mass spectrometry, such as tandem instrumentation. Asdescribed in Chapter 6, the separating power of the first mass spectrometer stage cansubstitute chromatography, whereas the second stage provides identification/quantitation. This can be considered a main reason for the success of tandem massspectrometry-based neonatal screening methods (see Chapters 12 and 16). A recentlyemerging different approach is ion mobility separation in combination with massspectrometry. The sample components can be sorted based on their molecular sizeby ion mobility in less than a second. This can be rapidly followed by MS or tandemMS providing a total analysis time of a few seconds.
(b) Integration with bioinformatics, automated workflow, and documentation.Mass spectrometry has the disadvantage that it produces an intimidatingamount of data that is difficult to interpret. Usually the services of a spe-cialist are needed but humans do not perform well in a high-throughputsetting. There are advanced bioinformatics tools to help interpreting massspectral data, especially in proteomics (see Chapter 8). In fact, it is practi-cally impossible to manually evaluate the gigabytes of data generated byproteomics instrumentation each day without using bioinformatics. However,using these tools also requires expertise. We foresee a fast development inautomatic data evaluation, especially, but not exclusively, in proteomics. Massspectrometers, data evaluation, bioinformatics, and documentation need to

558 K. Vékey et al.
be (and will be) much better integrated in the near future. Mass spectrometry-based “total solutions” are needed for particular medical applications probablyintegrated into expert systems. These are likely to involve artificial intelli-gence to improve diagnostic accuracy. The development of such expert systemsis a prerequisite to make mass spectrometry ubiquitous in the clinical field.
(c) Placing of mass spectrometers in hospitals. Presently, mass spectrometersworking in the biomedical field are usually located in chemistry, biochem-istry, or pharmaceutical departments, core facilities, or research institutes,rarely in hospitals or clinics. This is mostly the consequence of the rela-tively complex nature of the instrumentation and of the required expertise.In the coming decade this is likely to change, and more hospitals willacquire mass spectrometers for their own use, i.e., for “routine” analysis orscreening. For this to become reality, the streamlining of the analyticalprocess should progress to the point of “black box” operation. Ideally, thesample (e.g., 100 �L of plasma) is loaded into the sample holder of theinstrument (that comprises both mass spectrometry and data evaluation),and in a few minutes a report is generated. Current trends of the instru-mentation market support the notion of such systems emerging within thenext decade.
(d) Advanced sampling interfaces and imaging. New developments in imagingmass spectrometry can provide molecular distributions from biomedicalsamples in the form of 2D images (see, for example, Chapter 23). The com-bination of these advances with the traditional methods of histology mightbe among the first areas of direct medical applications. Tissue sections,biopsies, and even in vivo studies of, e.g., skin or tissue exposed in surgeryare amenable for this technology. Special probes or sampling interfaces ofthe mass spectrometer can be inserted into body cavities to collect the mostrelevant sample for in situ investigations.
2. Emerging systems approach
A few decades ago, most of our knowledge on biological systems was based onstudying small organic molecules, mostly metabolites. Due to advances in analyt-ical capabilities and high-throughput technologies, our understanding of genomics,and later proteomics, tremendously expanded during the last decade. Many chap-ters in the present book illustrate this growing understanding and the significanceof proteomics in the biomedical field. At present, it is common to consider theinformation gathered by genetics, proteomics, metabolomics, etc., separately.However, our rapidly expanding knowledge of biomedical systems is ready forintegration. This integration in the field of biology is termed systems biology, andit is rapidly being embraced by the scientific community. Related institutes are

Brief outlook 559
spawned around the world and leading universities establish systems biologydepartments (e.g., Harvard Medical School). The premise of this new disciplineis that we need to look at the organism as a whole, understand how it works, and(in the clinical context) base interventions on this knowledge.
Mass spectrometry will provide key information in the field of systems biology.It is well suited for high-throughput studies and is equally well adapted for studyingsmall organics (e.g., metabolomics and metabonomics), proteins (proteomics andpeptidomics), and various other macromolecules (lipidomics, etc.). Analyticalinstrumentation will be integrated with bioinformatics tools, to a higher degree thanit is at present, to extract useful information from the plethora of data obtained.
3. Mass spectrometry in translational medicine
Various chapters in this book illustrate active research in the biomedical fieldusing mass spectrometry, but as yet there are few clinical applications. This islikely to change in the near future. It is being recognized that additional efforts areneeded to translate basic research results to bedside practice. As outlined above,further development of instrumentation is also needed to realize the full potentialof mass spectrometry in a clinical environment.
In the long term we expect the appearance of expert systems, which utilize var-ious types of analytical tools (mass spectrometry being a prime component), basetheir assessment on utilizing the systems biology approach, and give advice to theclinician about the state of patient and possible courses of treatment. In the shortand medium terms a diversity of trends can be discerned where mass spectrometryhas an impact on translational medicine.
(a) Collaboration between mass spectrometry facilities and clinics will furtherimprove. Integration of mass spectrometry equipment with other types ofclinical laboratory techniques will eventually be common, but this is likelyto require more time.
(b) Improved diagnostics will be the primary entry point for mass spectrometryinto the clinical field. This is already in place in pediatrics, oncology seemsto be the next main target and other fields (e.g., infectious and autoimmunediseases) are likely to follow. Diagnostics is closely related to finding (andvalidating) new biomarkers, which is (and likely to remain) a very activefield. However, the use of biomarkers is not limited to diagnostics.
(c) Selecting optimal treatment is also important. There are very few examplesas yet, but early studies indicate that mass spectrometry will have a sig-nificant contribution. It can be used to monitor the course of a disease(e.g., the progression of cancer), which may help to select if, when, andwhich treatment is necessary. Clinically the same disease may or may notrespond to a given treatment. Mass spectrometry (with the help of appropriate

560 K. Vékey et al.
biomarkers) may define subgroups of a disease. These subgroups could betreated differently (e.g., by using different drugs or deciding what othertreatment option is the best course of action). The early distinction of sub-groups (e.g., the identification of responders for a given treatment) may belife saving. For example, if cancer is treated by an inefficient drug, thepatient might be weakened due to the side effects, while the cancer con-tinues to advance. Less importantly, more accurate targeting may reducehospital expenses as well by eliminating an expensive, but for the givenpurpose inefficient, drug. Mass spectrometry may also help to identifynovel therapeutic targets.
(d) Prognostic application of mass spectrometry is also a possibility.Preliminary research indicates that biomarkers may be found that correlatewith the likely disease progression.
(e) Personalized medicine means taking into account genetic and proteomicinformation for a given patient in medical decision making. Ongoing effortsin pharmacogenomics to tailor medication to the genetic makeup of anindividual are in the exploratory phase. Corresponding advances are under-way based on proteomic information for an individual gathered by massspectrometry. Optimal treatment may be decided in light of the level of agiven biomarker for a particular patient. This approach is not yet in place,but it is expected to become a reality in the medium term. Therapeutic drugmonitoring is an early version of this concept (see Chapter 13). It is alreadyused at various medical centers, but currently it is far from being wide-spread. Here the idea is to determine and control optimum drug dosage fora given patient, based on the measurement of drug concentrations, e.g., inthe blood or urine. These approaches are likely to become more and morecommon and complex in the near future.
The promise of translating the results of research with the aid of mass spec-trometry into clinical reality is exciting. In our view, this prospect hinges on twobasic conditions. First, as we have explained above (p. 557–558), the humaninterface of these devices has to become user friendly to the point where a nursecan walk up to them, insert a sample, and collect the results. Reading and inter-preting the results still might require a specialist, but this is also the case with othersophisticated equipment in, e.g., imaging radiology. Second, for mass spectrome-ters to become ubiquitous in medicine, the cost of ownership of the instrumentationhas to drop to levels comparable to separation equipment. With current advances ininstrumentation both of these objectives might fast become a reality.

Index
“omics” 512 17-hydroxy-progesterone 3712,5-dihydroxybenzoic acid (DHB) 537 2�-Fluoro-5-methyl beta-l-arabinofuranosyl
uracil triphosphate (L-FMAU-TP) 27721-deoxycortisol 37121-hydroxylase deficiency 37121-hydroxyprogesterone 3712D chromatography 842D gel electrophoresis 87, 88, 466, 472, 4792DGE 4272D-PAGE see two-dimensional gel
electrophoresis3D QIT see three-dimensional quadrupole
ion trap3-way analysis 1444RS criterion 4895�-azacytidine (AZC) 3115-azacitidine 276
�1-receptor antagonists 274�2-receptor antagonists 274�-cyano-4-hydroxycinnamic acid (HCCA) 537 �-fetoprotein (AFP) 326�-alanine 493�-blockers 273�-sitosterol 14�-ureidopropionate 493�-4-androstenedione 371
AC see acyl-carnitineaccuracy 10accurate mass 135ACE inhibitors 273acetaminophen 283acetylcholine 271, 409acetylcholinesterase 409, 417
acquired immunodeficiency syndrome(AIDS) 319
acromegaly 428actinomycin-D 276acute heart failure 273acute phase proteins 312acyl-carnitine (AC) 346adefovir 269adenovirus 311administrative procedures 33adult T-cell leukemia (ATL) 323affinity chromatography 478AFP see �-fetoproteinaggressive periodontal tissue damage 239aging 419AIDS patients 335AIDS see acquired immunodeficiency
syndromeajulemic acid 280albumin 333, 334aldosterone 371aliskiren 274alkylating agents 276all possible regressions 164allergen posttranslationally modified 472, 477allergy 459alpha-1,6-linked fucose 313Alzheimer’s disease 239amalgamation 146, 165amantadine 269amide hydrogens 188amino acid sequences Sambucus 475amino acid transmitters 409amitriptyline 272amlodipine 274amorphous proteinaceous structure 318amoxapine 271

562 Index
amphotericin B 270amprenavir 269anabolism 513 analgesics 280analysis 13, 38analysis of lysosomal enzyme activities 258analysis of oligosaccharides 257–258analysis of organic acids 257analytical chemistry 7analytical techniques 9, 253angina 273angiotensin II receptor antagonists 274ANN see artificial neural networksANNs see artificial neural networksANPS see atrial natriuretic peptide substrateanthracyclins 276anthranilic acid 280antiangiogenic therapy 493antiapoptotic therapy 493antibiotic treatment 265antibody recognition 293anticancer agents 276anticoagulants 27, 39antiinfection drugs 267antimetabolites 276antimicrotubule agents 276antineoplastic drugs 395antiretroviral drugs 265antisera 324antitumor antibiotics 276antiviral therapies 310AP see atmospheric pressureAPCI see atmospheric pressure chemical
ionizationapolipoprotein 496apomorphine 280apoptosis 237, 322, 436APPI see atmospheric pressure photoionizationapplications of chemometrics 162arginine 256arrangement of data 144arrhythmia 273arteriosclerosis 238artifact markers 520 artifacts 366artificial intelligence 558artificial neural networks (ANN) 146, 147,
156–158, 494assay development 507 asthma 265
astrocytes 408atazanavir 269atherosclerosis 239ATL see adult T-cell leukemiaatmospheric pressure (AP) 292atmospheric pressure chemical ionization
(APCI) 98, 115, 223atmospheric pressure photoionization (APPI)
225, 367atrial natriuretic peptide substrate (ANPS) 185atypical pneumonia 312autoantibodies 313automatic data evaluation 557 automatic pipette 537 automatic syringe pump 537 automation 556 autosampler 351AZC see 5'-azacytidine
BA see bile acidsBacillus anthracis 292, 305Bacillus atrophaeus 304Bacillus cereus 300backward elimination 152, 164bacteria 291bacterial strains 534 bacteriophage 304BAMS see bioaerosol mass spectrometrybarbiturates 283Barth syndrome 238betaine-homocysteine methyltransferase
deficiency 256Betv 1 (major birch pollen allergen) 461bile acid synthetic defects 491bile acids (BA) 346, 371, 372, 374bioaerosol mass spectrometry (BAMS) 304bioengineered microorganisms 293biogenic amines 409bioinformatics 175, 203–207, 210–212, 214,
219, 332, 427, 430, 493, 507, 524biological matrices 39biological safety level (BSL) 23biological sample 523, 526 biological variation 511 biomarker 253, 449biomarker discovery 506 biomarker discovery group 512, 513 biomarker molecules 294biomarkers 253, 310, 314, 325, 334biomarkers, targeted, cancer 395

Index 563
biomedical relevance 14biopolymers 511 biopsy tissue 534 bioreactor 299BioThesaurus 215, 217biotin 322biotin-carrying tag 417biotinidase deficiency 257birch and mugwort 479BIRD see blackbody irradiative dissociationbit-mapping algorithm 200blackbody irradiative dissociation (BIRD) 132bladder cancer 390blank samples 38BLAST 464, 469, 477BLAST sequence 301bleeding of a column 74block scaling 145blood 39blood glucose 511 blood–brain barrier 418bottom-up approach 176, 205, 297bound PSA 514 Box and Whisker plots 160bradykinin 181brain tumors 541 branched diagram 164branched-chain organic acidemias 257breast cancer 387, 496, 514, 541 bromvalerylurea 283BSL see biological safety levelbuffy coat 39Burkitt’s lymphoma 319busulfan 278butylation 350
C see cholic acidCA see Cluster AnalysisCA-125 514 CA15.3 514 CA19-9, 496Ca2- antagonists 273caBIG 204, 214–215, 220CAD see collision-activated dissociationcalculated exact mass 135calibration curve 69calibration data set 164cancer 516 cancer cell analysis 384cancer tissue analysis 384
cancer, genesis 380Canonical Correlation Analysis (CCA) 146,
147, 152canonical variate 164Canonical Variate Analysis (CVA) 146, 147,
152–154capecitabine 495capillaries 73capillary column 76capillary gel electrophoresis (CGE) 86capillary isoelectric focusing 86capillary zone electrophoresis (CZE) 85, 86capillary zone electrophoresis 478Caprifoliaceae 463carbovir 269carcinoembryonic antigen (CEA) 494cardiac arrhythmias 265cardiolipin (CL) 233cardiovascular drugs 273carrier flow regime 362CART analysis 524 CART see Classification and Regression Treescarvedilol 274catabolism 513 categorical scale, variable 143, 156CCA see Canonical Correlation AnalysisCDC see chenodeoxycholic acidCEA see carcinoembryonic antigencefaclor 268cefdinir 267cefixime 267cell cycle modulators 497cell kinetics 493cell lysis 295cell viability 312cellular machinery 509 cellular morphology 536 centering 145, 146centifugation 41ceramides 236, 395cerebrospinal fluid 498CGE see capillary gel electrophoresischaperones 311charge state distributions 188charge transfer dissociation (CTD) 134chemical ionization (CI) 99, 108chemical perturbation 188chemical safety levels (CSL) 23chemical waste 25chemometric approach 142

564 Index
chemometrics 14, 142chenodeoxycholic acid (CDC) 362cholestanol 14cholestatic liver disease 491cholesterol 14, 237, 509, 511cholic acid (C) 372chromatographic methods 63chronic infection 313, 324chylomicron 239CI see chemical ionizationCID see collision-induced dissociationcirrhosis 313citalopram 272city block distance 164CL see cardiolipinclass membership information 164classical approach 142 Classification and Regression Trees (CART)
146, 147, 156clinical laboratories 556 clinical pharmacology 264clinical research 556 clinical trials 28clomipramine 272clozapine 273clumped cells 304Cluster Analysis (CA) 146, 147, 149–151clustering algorithms 150clustering methods 150c-myc 311, 320coeluting components 102coelution 85, 95, 130cohort study 32coinfection 311, 314collaboration 559 Collection of Molecular Biology Databases 205collective ethics 21Collinearity 154, 155collision energy 352collision-activated dissociation (CAD)
179–182, 227collision-induced dissociation (CID) 102,
179, 411colon cancer 391, 541colorectal cancer (CRC) 494column chromatography 77column temperature 79column vector 144combining datasets 517 combustion 259
communication barrier 555, 556 community 204–206, 212, 214, 220comparative proteomics 426 comparative transcriptomics 449compartments of the body 264compensatory heart failure 273complete linkage 164Complete Proteomes Tool 212complex mixtures 95, 97, 526complexity of molecules 523 computerized expert systems 183concentration 9concentration–response relationships 265concomitant anti-microbial therapy 293conditioning 49conductive glass slides 537 confidence intervals 164congestive heart failure 273constant-flow-rate regime 362consumables 11control group 30, 31, 493control sample 510 controlled clinical trials 493Core/Unique Protein Identification
(CUPID) 212coronavirus 311coronavirus RNA synthesis 313corpus callosum 544 correlation coefficient 152, 159, 161, 162correlation matrix 145, 161corticosterone 371corticotrophs 428cortisol 371cortisone 371cost of analysis 11cost-effectiveness 491Coulombic explosion 112Coulombic repulsion 112course of a disease 559 covariance matrix 145, 153CRC see colorectal cancerCREB 323critical transcriptional activator 322cross-reactivity 461, 471cross-validation (CV) 158, 162, 164cryoglobulinemia 313cryostat 536 cryostat probe 536 CTD see charge transfer dissociationCUPID see Core/Unique Protein Identification

Index 565
curved-field ion reflectron 300Cushing’s disease 428cutoff value 43CV see cross-validationCVA see Canonical Variate Analysiscyclic peptide antibiotics 292cyclosporine 283cystic fibrosis 239cytoskeletal structures 312CZE see capillary zone electrophoresisCSL see chemical safety levels
DART see direct analysis in real timedata analysis 227data evaluation 14, 15, 38data pretreatment 143, 145data processing 364data standards 204, 214, 215, 218, 220data types 143DBS see dried blood spotDC see deoxycholic acidDCP see Des gamma carboxyprothrombinde novo sequence 432de novo sequencing 183, 184,
195–198, 200DE see deleayed extractiondeactivated glass 539 deamidation 428decision tree analysis 524 decision tree classification algorithm 312Declaration of Helsinki 19, 21decontamination 25definition of bioinformatics 125delayed extraction technique 122deleayed extraction (DE) 468dendrogram diagram 164dense bodies 318densitometry 13density ultacentrifugation gradients 318deoxycholic acid (DC) 372DEP see differentially expressed proteindependent variables (Y) 144, 146, 154,
157–160, 165depression 265, 271derivatization 41, 45, 356Des gamma carboxyprothrombin (DCP) 326desalting 43, 44descriptors 144DESI see desorption electrospray ionizationdesipramine 272
desmethyl mianserin 272desmethylclomipramine 272desmosterol 14desorption electrospray ionization (DESI)
99, 115desorption/ionization on silicon (DIOS)
119, 178detection 13detector types 80, 99deuterium 188–190dextran 284DHB see 2,5-dihydroxybenzoic acid DI see direct immersiondiabetes 514 diabetic cardiomyopathy 239diacylglycerols 235diagnostic biomarkers 509 diagnostic models 518 diagnostic oncoproteomics 386dialysis 41, 43, 44diarrhea 291diclofenac 282differences between EI and CI spectra 109differentially expressed protein (DEP)
427–428, 430diffusion 43digest samples 557 digitalis 273dihydropyrimidine dehydrogenase (DPYD) 493dihydrouracil 493dimension reduction 164DIOS see desorption/ionization on silicondirect analysis in real time (DART) 99, 115direct bond cleavage 107direct immersion (DI) 54direct vasodilators 274discovery experiment 518 discriminatory classifiers 314disease pathology 507 disease progression 534 disease sample 510 disease-specific biomarkers 533 disorders of energy metabolism 257distance between pixels 540 distance measure 150diuretics 273docetaxel 496dopamine 271doping 283dose–response relationships 265

566 Index
dothiepin 272double blind 31down-regulation 432doxepin 272DPYD see dihydropyrimidine dehydrogenasedried blood spot (DBS) 45, 258, 347,
349, 357dried-droplet method 468drug development 265drug distribution 549drug resistance 493, 546, 547 drug targets 534 drug therapy 534 drug-induced protein changes 546 dummy variable 146dynorphin A 418
early breast cancer (EBC) 498early detection trials 28, 32EBC see early breast cancerEBI see European Bioinformatics InstituteEBNA 311, 320EBV nuclear antigens 320EBV see Epstein–Barr virusEBV-induced transformation 331E-cadherin 547 ECD see electron capture detectionECD see electron capture dissociationEdman degradation 320, 460, 467EDTA 27, 39efavirenz 269efficiency 66EGFR tyrosine kinase 547 EI ionization see electron impact ionizationEI mass spectra 105, 106EI see electron impacteIF3 see eukaryotic initiation factor 3eIF4G see eukaryotic initiation factor 4Gelderberry 463elderberry flowers 465elderberry fruits 479electric sector analyzer (ESA) 99electrodyalisis 43, 44electromagnetic force 96electron capture detection (ECD) 62, 68, 73electron capture dissociation (ECD) 132,
182, 183electron impact (EI) 98electron impact (EI) ionization 104, 108
electron transfer dissociation (ETD) 132, 180,182–184
electrophoretic techniques 62, 85electrospray ionization (ESI) 98, 111, 112,
292, 403, 428electrospray ionization mass spectrometry
(ESI-MS) 224electrospray-tandem mass spectrometry
(ESI-MS/MS) 253, 256–257electrostatic analyzer (ESA) 120electrostatic attraction 52electrostatic interactions 78electroweak force 96elemental formula 16eligibility checklist 32ELISA see enzyme-linked immunosorbent assayelution technique 66embryogenesis 428emergency equipments 25emerging pathogens 292endocarditis 267endocrine 426, 431, 448endocrine therapy 276endocrine tumor 426energy metabolism 312envelope glycoprotein 318envelope proteins 324enzyme activity 8enzyme targets 312enzyme-linked immunosorbent assay
(ELISA) 254epilepsy 265, 270epileptic fit 271epileptic patients 264epileptic seizures 493epitope 189Epstein–Barr virus (EBV) 311, 319, 332, 335ErbB2, 497errors caused by sampling 38ESA see electric sector analyzerESA see electrostatic analyzerEscherichia coli 296, 329, 330ESI see electrospray ionizationESI–MS see electrospray ionization mass
spectrometryESI–MS/MS see electrospray tandem mass
spectrometryestrogen metabolism 497ETD see electron transfer dissociation

Index 567
ethical aspect 20ethical committees 21ethical decision making 20ethical dilemma of medical research 21ethical guidelines 21ethical paradox 21euclidian distance 164eukaryotic initiation factor 3 (eIF3) 312eukaryotic initiation factor 4G (eIF4G) 312European Bioinformatics Institute (EBI) 214even-electron 107evidence based medicine 29, 556exhaustive heart failure 273experimental errors 522 expert systems 558, 559 extrachromosomal episome 320extraction techniques 46
FAB 460FAB see fast-atom bombardmentFabry disease 239factors 144familial adenomatous polyposis (FAP) 394FAP see familial adenomatous polyposisfast-atom bombardment (FAB) 98, 110,
111, 342fatty acid oxidation defects 257fatty acids 45Fc region 333FD see field desorptionfenofibric acid 275ferritin light chain (FLC) 497FIA see flow-injection analysisFID see flame ionization detectionfield desorption (FD) 99FIGLU see formimino glutamic acidfilter membranes 42filtration 42fingerprint signature 294Fisher statisti 164flame ionization detection (FID) 62, 68, 73flash chromatography 77FLC see ferritin light chainflow rate programming 359flow-injection analysis (FIA) 349, 357,
358, 374flunixin 282fluorescent markers 546 fluorescent-tag spectroscopy 95
fluoxetine 272folate and cobalamin deficiencies 374food allergy 462forces in nature 96formimino glutamic acid (FIGLU) 364forward selection 152–153, 164Fourier transform ion cyclotron resonance
(FT-ICR) 99, 125, 126, 296Fourier transform mass spectrometry 200fraction collectors 557 fragment databases 177fragmentation efficiency 108fragmentation techniques 176fragmentation-derived sequence tags 301free PSA 514 frequency factors 107fresh sample 39FT-ICR see Fourier transform ion cyclotron
resonancefucosidosis 258function analysis through epitope mapping 174functional lipidomics 224functional proteomics 426fungal infections 267fungi 291
GA see genetic algorithmGABA 271galactorrhea 428galactose metabolism disorder 374galactosialidosis 258galactosyceramides (GalCer) 236GalCer see galactosyceramidesgangliosides 237gas chromatography (GC) 12, 62, 66, 67,
72–75, 101, 224gas chromatography-mass spectrometry
(GC-MS) 253–254, 256–258Gaucher diseases 258GC injector 54, 55, 75, 76GC see gas chromatographyGC-MS 77, 101, 249, 460GCP see Good Clinical practiceGDP dissociation inhibitor 323gefitinib 278gel based separation 3gel cutters 557 gel permeation chromatography (GPC) 84gene 426

568 Index
gene expression machineries 312Gene Ontology 208gene silencing 181gene-expression microarraygeneralized pairwise correlation method
(GPCM) 147, 159, 160generating data 518 genetic algorithm (GA) 147, 158, 159genetic defects 491genome 426genome databases 292, 295genomics 173, 426, 430, 493geometric distortions 334GH see growth hormoneGlcCer see glucosylceramidesglia 408gliomas 541, 544 globus pallidus 410glomerulonephritis 313GLP see Good Laboratory practiceglucosylceramides (GlcCer ) 236glutaric aciduria type I 257glycine 256glycomics 6glycoproteins 313glycosphingolipid disorders 239GM1 gangliosidosis 258GM2 gangliosidosis 258goiter 428Golay equation 74golgi protein 73 (GP73) 313gonadal failure 428gonadotrophs 428Good Clinical Practice (GCP) 20, 33, 555Good Laboratory Practice (GLP) 10GP73 see golgi protein 73GPC see gel permeation chromatographyGPCM see generalized pairwise correlation
methodgradient elution 79, 80gravitational force 96grouping variable 146, 156, 164growth factor receptor inhibitors 276growth hormone (GH) 428, 450guanidinoacetate 256
HAART see highly active antiretroviral therapy
HAD see HIV-associated dementiaHaemophilus influenzae 305
hair 40 HAM see HTLV-1-associated myelopathyHBV see hepatitis B virusHCC see hepatocellular carcinomaHCCA see �-cyano-4-hydroxycinnamic acid HCMV see human cytomegalovirusHCMV viral particles 331HCMV-encoded proteins 315HCV see hepatitis C virushead and neck cancer 391headspace analysis 53, 56 heat shock protein 27 (HSP27) 313, 324heavy water 188Helicobacter pylori 395helminths 291heme 301, 303hemozoin 301heparin 27, 39hepatitis B 22hepatitis B virus (HBV) 311, 323, 332, 335hepatitis C virus (HCV) 311, 324, 332hepatocarcinogenesis 313hepatocellular carcinoma (HCC) 313,
324, 392hepatotoxicity 313HER2 receptor 547 HER-2/neu 497Herceptin 547 herpes simplex virus (HSV) 311, 312, 321,
332, 335Hevein 460HFH see human fetal hepatocyteshierarchical clustering 164, 524high pressure liquid chromatography-mass
spectrometry (HPLC-MS) 253–254high throughput (HT) 57, 58, 89, 556high-abundance proteins 186higher order structures 187high-flow-rate regime 359highly active antiretroviral therapy (HAART)
313, 314high-performance liquid chromatography
(HPLC) 62, 66, 68, 73, 77–80high-resolution images 536 historical control 32HIV replication 265HIV see Human immunodeficiency virusHIV virion 315HIV-1, 313–315, 317, 325,
327–329, 335

Index 569
HIV-associated dementia (HAD) 314, 323HIV-infected astrocytes 323holistic approach 493holocarboxylase synthetase deficiency 257holo-Tf 495homocysteine 255–257homogeneity of samples 38hormone 428housekeeping functions 296HPLC see high-performance liquid
chromatographyHPLC–MS see liquid chromatography–mass
spectrometryHS 53, 54, 56HSP27 see heat shock protein 27HSV see herpes simplex virusHSV-mediated translational control 321HT see high throughputHTLV see human T-lymphotropic virusHTLV-1, 323HTLV-1-associated myelopathy
(HAM) 323human B lymphocytes 311human cytomegalovirus (HCMV ) 311,
331, 335human fetal hepatocytes (HFH) 317human genome 164human hemoglobin �-chain 177–179human holo-transferrin 495human immunodeficiency virus (HIV) 291,
311, 323, 332, 335human milk 40Human Proteome Organization (HUPO)
190, 204human specimens 22human T-lymphotropic virus (HTLV) 318,
332, 335Huntington chorea 271HUPO PSI 195, 214HUPO see Human Proteome Organizationhydrocodone 281hydrogen/deuterium exchange 134hydromorphone 281hypercortisolism 428hyperhomocysteinemia 256hyperkinetic movements 271hypersensitivity Classification 459hypersensitivity Subgroups (types I to V) 460hypertension 273hyperthyroxinemia 428
hypokinetic movements 271hypothalamic-releasing hormones 428
ibuprofen 282ICAT see isotope-coded affinity tagI-cell disease 258ICP-MS see inductively coupled plasma mass
spectrometryICR see ion cyclotron resonance analyzersID see isotope dilutionidentical masses 184IE see ion exchangeIEF see isoelectric focusingIE-LC see ion-exchange liquid chromatographyIEM see inborn errors of metabolismIEM see inherited metabolic disordersIgE cross-reactions 462IMAC see immobilized metal affinity
columnimage acquisition 536 imatinib 278imbalance between groups 31imipramine 272immobilized metal affinity column
(IMAC) 441immortalization 311immortalization of B cells 319immune reconstitution 313immune response 311immunity 311immunization 22immunoassay 431immunoblotting 465, 471immunocompetent 311immunocompromised hosts 312Immunohistochemistry 497immunoprecipitation 321immunotherapy 493improper sample handling 38improved diagnostics 559 improving signal quality 540 impurity profile 17in silico digestion 177in situ investigations 558 in vivo metabolism 258in vivo microdialysis 417Inborn errors of homocysteine metabolism
255–257inborn errors of metabolism (IEM)
253–258, 346, 487

570 Index
independent variables (X) 144, 146, 157–159indinavir 269individual ethics 21individual metabolism 265individual viral proteins 8, 330individualized drug therapy 265indoleacetic acids 280indomethacin 282inducible nitric oxide synthase (iNOS) 323inductively coupled plasma mass spectrometry
(ICP-MS) 259infected cells 312infectious diseases 292, 310infectious virions 318infertility 428infrared multiphoton dissociation (IRMPD) 132infrared spectroscopy (IR) 13In-gel tryptic digestion 464, 474inherited metabolic disorders (IEM) 346inhibitors of tumor angiogenesis 276iNOS see inducible nitric oxide synthasein-source decay (ISD) 179, 182instrument configurations 526 instrument time 11insulin 514 insulin receptor 514 intact non-volatile biomolecules 292interactome 205interim analysis 32internal standards 350, 356International Organization for Standardization
(ISO) 254interpatient variability 264InterPro 205, 208, 210intracrine 431ion channels 273ion cyclotron resonance analyzers (ICR)
120, 125ion density map 536 ion exchange (IE) SPE 50, 52ion mirror 122ion mobility separation 557 ion mobility spectrometry 175ion separation 96ion sources 3ion trap MS 319ion-exchange liquid chromatography
(IE-LC) 83ionization 96, 98
ionization chamber 104ionization process 98, 99ion–molecule reaction 108ion-pair SPE 51iProClass 204–206, 210–211, 213, 217, 220iProClass database 210IProExpress 204, 215, 217–220IProExpress functional analysis 218IProExpress gene to protein mapping 217IProExpress Pathway Discovery 219iProlink 204, 206, 215iProLINK 215iProXpress 217, 219IR see infrared spectroscopyIRMPD see infrared multiphoton dissociationIRMS see isotope-ratio mass spectrometeriron protoporphyrin 301ISD see in-source decayISO see International Organization for
Standardizationisobars 184isocratic elution 79isoelectric focusing (IEF) 325, 327, 433isoform 438, 441, 443, 444, 449, 451, 452, 465isosorbide 274isotope dilution (ID) 356isotope-coded affinity tag (ICAT) 186, 187,
313, 326, 411, 423, 427isotopelabeled lipids 227isotope-ratio mass spectrometer (IRMS) 259
journey of a drug 264
Kaposi’s sarcoma-associatedherpesvirus/human herpesvirus 8(KSHV/HHV-8) 318
ketoprofen 282kidney proteins 3Kinases 431, 446kinetic-energy-to-charge ratio 123kinetic-to-internal-energy transfer 132kininogen 496KSHV/HHV-8 see Kaposi’s sarcoma-
associated herpesvirus/human herpesvirus 8kyotorphin 410, 418kyotorphin synthetase 418
labeling 33LacCer see lactosylceramides

Index 571
lactosylceramides (LacCer) 236lactotrophs 428lamivudine 269large biomolecules 4laser beam diameter 536 laser capture microdissection 384laser desorption (LD) 99laser induced silicon microcolumn arrays
(LISMA) 180latent variable 165latex protein allergy 460latex-fruit sindrome 460lathosterol 10, 14LBPA see lysobisphosphatidic acidLC see liquid chromatographyLC see lithocholic acidLC/MS/MS 315LC-FTICR 335LCLs see lymphoblastoid cell linesLC-MS 461LC–MS see liquid chromatography–mass
spectrometryLC–MS/MS 346, 369, 374LD see laser desorptionLDA see Linear Discriminant Analysislectin activitities 461legal issues 22leptomeningeal metastasis 498level of hazard 23L-FMAU-TP see 2'-Fluoro-5-methyl
beta-l-arabinofuranosyl uracil triphosphatelight degradation 28limit of detection (LOD) 10, 521limit of quantitation (LOQ) 10, 69Linear Discriminant Analysis (LDA) 15, 146,
147, 152, 153linear ion-trap (LTQ) 120, 129linear ion-trap quadrupole mass analyzers 128linkage rules 150, 165lipid envelope 318lipid extraction 226lipid transfer proteins (LTP) 460lipidomics 559 liquid chromatography (LC) 13, 66, 67,
409, 427liquid chromatography-mass spectrometry
(LC-MS) 253liquid chromatography-tandem mass
spectrometry (LC-MS/MS) 256
liquid junction 327liquid secondary ion mass spectrometry
(LSIMS) 99, 110, 111liquid-liquid extraction (LLE) 41, 46,
47, 58, 371liquid-phase microextraction 47LISMA see laser induced silicon microcolumn
arraysLiterature Mining 204, 206, 210, 214–215, 217lithocholic acid (LC) 372LLE see liquid-liquid extractionLMP 311loadings 148, 165local–global approach 200LOD see limit of detectionlogistic regression 496lonafarnib 279lopinavir 269LOQ see limit of quantitationLorenzian force 124low energy CID 69, 465, 476, 479low molecular weight proteome 489low resolution mass spectrometers 5low-abundance 445, 452Lowe syndrome 239low-energy electrons 184lower respiratory infections 291low-flow-rate regime 359LSIMS see liquid secondary ion mass
spectrometryLTP see lipid transfer proteinsLTQ see linear ion-traplumiracoxib 281lung cancer 392, 499, 541 lung failure 273lymphoblastoid cell lines (LCLs) 311, 319lymphomas 311lymphoproliferative diseases 311lyophilization 45lysobisphosphatidic acid (LBPA) 233lysosomal enzyme activities 258lysosomal enzymes 258lysosomal storage disorders 374
m/z see mass-to-charge ratioMahalanobis distance 165malaria 291MALDI 460, 533 MALDI QIT/RTOF 465, 469

572 Index
MALDI see matrix-assisted laserdesorption/ionization
MALDI TOF MS 534 MALDI-TOF MS see matrix-assisted laser
desorption/ionization time-of-flight massspectrometry
malignant breast epithelium 498MAO see monoamino oxidasemaprotiline 272mass accuracy 533 mass analyzers 96, 119mass defect 199mass spectrometers 96, 526mass spectrometry (MS) 68, 426–427, 430,
432, 434, 453mass spectrometry in cancer 381mass spectrum 16mass-selected ion kinetic energy spectra
(MIKES) 123mass-to-charge ratio (m/z) 97, 130matched samples 510 matrices 144matrix 144–148, 150–153,161, 165matrix application 537 matrix crystal concentration 538 matrix crystal size 536 matrix droplets 535, 538, 539matrix mist 539 matrix solution 538 matrix solvent 537 matrix-assisted laser desorption/ionization
(MALDI) 116, 117, 288, 326, 403, 428, 533matrix-assisted laser desorption/ionization
time-of-flight mass spectrometry (MALDI-TOF MS) 95, 119, 121, 311
matrix-coated tissue section 535 MDFS see multidimensional fractionation
systemMDMs see monocyte-derived macrophagesmeasles 291measured accurate mass 135measurement of drug concentration 263medical decision making 20, 560mefenamic acid 282melanoma 392melanosome 219membrane proteins 418meropenem 268meta databases 205
metabolic processes 513 metabolites 264metabolome 175, 205metabolomics 6, 18, 559metabonomics 559 met-enkephalin 410, 418methicillin-resistant Staphylococcus aureus 296methionine 256methotrexate 276methylation 45methylmalonic aciduria (MMA) 257metronidazole 268MGED see Microarray Gene Expression DataMGED Society 204, 214mianserin 272MIAPE see Minimum Information about a
Proteomics ExperimentMicroarray Gene Expression Data
(MGED) 204microdialysis 408, 409microglia 408micro-HPLC 78microorganism detection 292microorganism growth 293microorganism identification 292microwave tissue irradiation 408midazolam 272MIKES see mass-selected ion kinetic energy
spectraminiaturization 89Minimum Information about a Proteomics
Experiment (MIAPE) 214missing data 146 mitochondria 523 mitotic spindle 311mixed-bed column 333mixture of ions 113mjadol 284MLR see Multiple Linear RegressionMMA see methylmalonic aciduriamobile phases 78model validation 161 molecular assessment of disease states 549 Molecular Biology Database Collection 205Molecular Biology Databases 205, 212molecular imaging 9molecular ion images 534 molecular mass (MW) 113, 114molecular weight 97

Index 573
momentum-to-charge ratio 124monoacylglycerols 235monoamino oxidase (MAO) 271monocyte/macrophage lineage 322monocyte-derived macrophages (MDMs) 314monodesmethyl citalopram 272monolayer crystal field 539 morphine 420movement disorders 271Mr 443–445, 452MRM see multiple reaction monitoringmRNA 426, 431, 432, 439, 441–443,
446, 449MS imaging 534 MS see mass spectrometryMS/MS 427, 465, 475MS/MS see tandem mass spectrometryMS-based lipidomics 225multicenter trial 33multidimensional fractionation system
(MDFS) 489multimarker panels 515 multinational trial 33multiple carboxylase deficiency 257multiple linear regression (MLR) 147,
151, 152Multiple Linear Regression (MLR) 147,
151, 164multiple protein systems 446, 449multiple reaction monitoring (MRM) 95, 223,
346, 356–358multiply charged ions 113multiply charged peptide ions 184multivariate methods 142, 146MW see molecular massMycobacterium smegmatis 304Mycobacterium tuberculosis 304myelin sheaths 236
nalmefene 282nano-ESI 460nano-ESI-QIT 465, 469nanoflow-ESI 412nano-HPLC 78nanosecond laser pulses 292nanospray ionization 112nanotechnology 489naphthylalkanone 280naproxen 282
narrow therapeutic index 264nasopharyngeal carcinoma 319National Cancer Institute (NCI) 214National Institute of Allergy and Infectious
Diseases (NIAID) 212NBS see newborn screeningNCI see National Cancer InstituteN-desmethyl sertraline 272necrotic center 547 Neisseria meningitidis 305nelfinavir 269neonatal screening 18, 254neonates 312nephrotoxicity 267neural epithelium 428neurochemicals 408neuroendocrine 438, 449, 450, 454neuroendocrine disorders 374neurological disease 491neurological disorder 271neuronal-ceroid lipofuscinosis 239neuropeptidases 418neuropeptides 409, 417neuropeptidomics 418neuroproteomics 408, 411, 412, 419neurosurgery 445neutral glycosphingolipids 236neutral loss scan 398neutral loss scanning 225nevirapine 269new disciplines 5newborn screening (NBS) 346, 356, 362,
366, 374, 490NF-�B 323NIAID see National Institute of Allergy and
Infectious Diseasesnipple aspirates in breast 388nitrates 273nitration 430–432, 441, 448, 453nitric oxide (NO) 431nitrogen rule 109nitroprotein 441, 443, 453 nitrosylation 431NMDA receptors 271NMR see nuclear magnetic resonanceNMR see nuclear magnetic resonance
spectroscopyNO see nitric oxidenoise 9
574 Index
nominal mass 135nominal scales 143noncompliance 265non-covalent interactions 549 nondeuterated affinity label 416nonhierarchical clustering 165noninfectious enveloped particles 318nonsteroidal antiinflammatory drugs
(NSAIDs) 280nonstructural proteins 324non-viable cultures 293nonvolatile fraction 76noradrenaline 271norfluoxetine 272normal biological variation 510normal metabolites 513 normal phase (NP) SPE 50, 51normal range 511 normalization 145normal-phase liquid chromatography
(NP-HPLC) 80, 81nortriptyline 272NP see normal phaseNP-HPLC see normal-phase liquid
chromatographyNSAIDs see nonsteroidal antiinflammatory
drugsnuclear magnetic resonance (NMR)
13, 292nuclear magnetic resonance spectroscopy
(NMR) 94nuclear proteins included components 323nuclear-specific stains 537nucleotide diphosphate kinase 321number of linkage 150numerical scale 144numerical scale 144, 147, 156nutrition 239
observational studies 32obtaining human samples 26OCT see optimal cutting temperature octadeuterated affinity label 416odd-electron 107oligodendrocytes 408oligosaccharides 257–258oncology 493oncology, applications in 379ontologies 204, 214–215, 220
open reading frames (ORFs) 311, 313,317–319, 328, 330, 331
operation manual 29operational complexity 556 operomics 453opioids 280optic nerve hypoplasia 239optimal cutting temperature (OCT) 536 optimization of GC 75orbitrap (OT) 120, 123ordinal scale 143ordinal scales 143ORFs see open reading framesorganellar proteome 219organic acidemias 257organic acids 257oritavancin 268ornithine 256ornithine transcarbamylase deficiency 493orotic acid 257OT see orbitrapototoxicity 267ovarian cancer 387, 514overinterpretation 5overlapping signals 227overlapping spots 523 oxaliplatin 494, 495oxicam 280oxidized cholesterol 238oxyphenbutazone 282
p16 tumor suppressor gene 311PABP see poly A binding proteinpain 418palitoxin 295pancreatic adenocarcinoma 495, 496pancreatic cancer 390pandemics 292parasitic protozoa 293parent compounds 264Parkinson’s disease 271paroxetine 272partial least squares (PLS) 147, 154, 155Partial Least Squares Projection of Latent
Structures (PLS) 147, 154, 165 partial pressure of the analyte 108partial pressure of the reagent gas 108partitional clustering 165pathogen diagnosis 293

Index 575
pathogen species 291pathway and network discovery 219patient compliance 32patient recruitment 33patient withdrawal 33patients’ eligibility criterias 32pattern recognition 142, 143,
146–148, 157PC see phosphatidylcholinePCA see Principal Component AnalysisPCR amplification 293PCR see Principal Component RegressionPE see phosphoethanolaminepeak area 66peak height 66peak intensities 16peak widths 88pediatrics 490pegylated interferon 313peptide backbone 188peptide fragmentation 179–181peptide mapping 177, 179peptide mass fingerprinting (PMF) 195,
426, 430peptide mass mapping 540 peptidomics 559 pergolide 273permethylated molecules 237peroxisomal disorders 239persistent infection 322persistent state 311personalized medicine 560 personnel contamination 23pFam 207–210PG see phosphatidylglycerolpH 46, 50, 82 pharmacodynamic profiles 263pharmacodynamics 264pharmacokinetic studies 18, 263pharmacology 493pharmocokinetics 95phase I-III trials 29phenazopyridine 282phenylacetic acid 280phenylalanine 353phenylbutazone 282phenylketonuria (PKU) 347phenytoin 264phosphatidylcholine (PC) 230
phosphatidylglycerol (PG) 233phosphatidylinositol (PI) 234phosphatidylserine (PS) 232phosphodiesterase inhibitors 273phosphoethanolamine (PE) 232phospholipid biomarkers 523 phospholipids 230phosphorylation 430–432, 441, 446,
450, 453 photomicrograph 544 photon–matrix molecule interactions 294PhotoSpray 371physical performance status 493physiome 205pI 433, 443–445, 452PI see phosphatidylinositolpilot study 29PIR see Protein Information Resourcepiroxicam 282Pirquet 459PIRSF 204, 206–210PIRSF classification 206–209pituicyte signaling 431pituitary 426pituitary adenoma 426PKU see phenylketonuriaplacebo 31plasma peroxiredoxin II 312Plasmodium falciparum 292PLS see partial least squaresPLS see Partial Least Squares Projection
of Latent StructuresPMF see peptide mass fingerprintingpolarity parameters 149polarity variables 152pollen 461poly A binding protein (PABP) 312polyphosphoinositides 234Pompe diseases 258poor experimental question 518 pore size 79portrait matrix 165postmortem enzymatic degradation 408postsource decay (PSD) 179, 182, 313postsynaptic membrane 409posttranslational modifications (PTM) 45, 172,
179, 187, 318, 319, 426, 430, 489, 509, 510, 513, 550
potassium channel activators 274

576 Index
pravastatin 275precipitation 41, 42precision 10preclinical data 20precolumn flow splitter 327precursor ion scan 348prediction 142, 143, 146, 147, 155, 157, 158,
162, 163, 165prediction 143prediction set 165predictors 144preferential breakage 184prefiltering 200preplication compartments 322prevention trials 28pricked-heel blood 350primary validation 510, 511 primordial cell 428Principal Component Analysis (PCA)
144–149, 153, 165, 524principal component regression (PCR) 147principal components 164–165procarbazine 279prognostic biomarkers 497prognostic markers 497projection method 148projection methods 165properties of mass analyzers 120propionate metabolism disorder 374propionic acid 280prospective biomarkers 518, 527, 530 prospective trial 29prostate biopsies 514 prostate cancer 389, 522, 541 protease inhibitors 28proteases 27protein databases 550 protein family 205, 207, 218protein identification 432, 433, 438, 540 protein identification tools 469Protein Information Resource (PIR) 204, 206,
212, 215, 220Protein Prospector 182protein separation 432 Protein Sequence 204, 206, 207protein signals 534 Protein Standards Initiative (PSI) 204protein toxin 294ProteinChip arrays 314
ProteinChip Reader 314proteolytic cleavage 315proteolytic stable isotope labeling 315proteome 310, 426proteomic patterns 493proteomic profiles in cancer 394proteomics 18, 174, 426, 430, 493, 559proteomics approach 460proteomics in cancer 393proteosome inhibitors 276protocol deviation 33protocol violation 33proton affinity 109protonated molecule 110proton-transfer process 109protozoa 291PS see phosphatidylserinePSA 514, 515 PSD see postsource decayPSI see Protein Standards Initiativepsychomotor retardation 493PTM see posttranslational modificationspurine and pyrimidine metabolism
disorders 374p-values 524 pyrazolone 280pyrimidine degradation pathway 493pyrolysis mass spectrometry 163pyrrole acetic acid 280
QET see quasi equilibrium theoriesquadrupole ion trap 430quadrupole mass analyzer 127, 128quality assurance 33quality control 33Quality Handbook 254–255quality management 254–255quality of life 28quality of life trials 28quantification 427quantitation 68, 556quantitation of impurities 17quantitation of protein expression levels 174quantitative proteomics 186, 427, 432, 452, 454quasi equilibrium theories (QET) 105
radicals 107radioactive materials 24radio-immuno assay (RIA) 254

Index 577
radiolabeled compounds 546random allocation 31random permuted blocks 31randomization 31range scaling 145RAST 466, 470rate of destruction 521 reagent gas 108reanalyzing the data 517 rearrangement processes 107receiver phase 48, 50receptors 431, 446, 453REF see rubber elongation factorreflectron 122regression analysis 524 relative abundance 97relative laser intensity 181relative quantitation 186relative radiotoxicity 23reliability 10reliability of identification 8repeatability 10, 69repetition rates 550 replication 311representative sample, 38reproducibility 10, 69, 433, 434, 454resistance 310resolution 65, 136resolution limit 538 response–concentration curve 230restricted randomization 31retention time 13, 64retrieval 33retrodialysis 410, 411, 418retrospective control 32reverse phase SPE 49–51reversed-phase chromatography 468, 472reverse-phase chip 323reverse-phase HPLC 15reverse-phase LC 412reverse-phase liquid chromatography
(RP-HPLC) 81, 82RIA see radio-immuno assayribavirin 313ribosomal proteins 312ribosome-inactivating protein (RIP) 463, 464,
472, 474, 477, 480Rickettsia 291RIP see ribosome-inactivating protein
ritonavir 269RLIMS-P 215robotic droplet ejection 539 robotics 539, 556 robotization 89robustness 11roots 165rosuvastatin 275rotary pumps 99row vector 144RP-HPLC see reverse-phase liquid
chromatographyrubber elongation factor (REF) 460
SA see sinapinic acid S-adenosyl homocysteine hydrolase
deficiency 256safety gloves 24salicylic acid 280, 282, 283saliva 39Sambucus ebulus 464Sambucus nigra 464, 469sample collection 26, 38sample collection protocol 520 sample deterioration 27sample digestion 44sample flow 26, 33sample handling 25sample injection 75, 76sample labeling 557 sample preparation 11, 38, 40, 41, 522sample size 6, 33sample spotters 557 sample stability 27sample storage 27sample throughput 11sampling 11, 37SARS see severe acute respiratory syndromeSARS virus 292SARS-CoV 312, 313, 326, 329, 332, 335SASPs see small acid-soluble spore proteinsSAX see strong anion exchangesaxitoxin 295SCAD see shortchain acyl-CoA dehydrogenasescaffolding proteins 319scalar 144scaling-up processes 220scientific uncertainty 20scores 148, 155, 165

578 Index
scoring categories 491screening 508 SCX see strong cation exchangeSDS see sodium dodecyl sulfateSDS-PAGE 463, 524SDS-PAGE see sodium dodecyl sulfate
polyacrylamide gel electrophoresissearch algorithm 177secretagogin 431, 438, 439, 449 seizure control 264SELDI 488, 494SELDI biomarker detection 382, 383SELDI identification 382SELDI pattern diagnostics 383SELDI problems, prospects 384SELDI protein chips 381, 382SELDI ProteinChip 328SELDI see surface-enhanced laser desorption
ionizationSELDI-TOF 329selected ion monitoring (SIM) 411selecting optimal treatment 559 selectivity 10, 65Selenium 397semi-permeable membrane 43sensitivity 9separating the sample 41 separation 11separation techniques 100separation technology 507, 524 sequence tags 182SEQUEST 430, 433, 450sera proteomic study 520 seronegative subjects 315seropositive 311serotonine 271sertraline 272serum 39severe acute respiratory syndrome (SARS) 311,
312, 329, 335SFC see supercritical fluid chromatographyshortchain acyl-CoA dehydrogenase
(SCAD) 364shotgun proteomics 414sialic acid storage disorder 258sialidase/neuraminidase deficiency 258SID see surface-induced dissociationside effect profile 493signal intensity 13, 536
signal resolution 533 signal transduction 319signal-to-noise ratio 199, 293, 537significance 165significance limit 165silenced genes 311silver-stain 441, 445 silylation 45SIM see selected ion monitoringSIMCA see soft independent modeling of class
analogysimple linkage 165simultaneous spectrum analysis (SSA) 488sinapinic acid (SA) 537 single liquid drop- technique 47single-sranded DNA binding protein
312, 322size exclusion chromatography 84skin prick tests (SPTs) 466SM see sphingomyelinsmall acid-soluble spore proteins
(SASPs) 296smallpox virus 305smart drugs 4sodium dodecyl sulfate (SDS) 86sodium dodecyl sulfate polyacrylamide gel
electrophoresis (SDS-PAGE) 87, 321, 413soft independent modeling of class analogy
(SIMCA) 163soft ionization techniques 292soft-ionization technologies 428solid-phase extraction (SPE) 14, 41, 46, 48–53,
58, 371solid-phase microextraction (SPME) 46,
53–56somatotrophs 428SOP see Standard Operating procedureSORI see sustained off- resonance
irradiationspatial information 9spatial variations of proteins 174SPE cartridge 48, 49SPE sample size 48SPE see solid-phase extractionspecial injectors 76specificity 10spectral subtraction protocol 231spectrophotometry 13spectroscopy 8

Index 579
sphinganine 235sphingolipids 235, 395sphingomyelin (SM) 230sphingosine 235spiked standard 356spill kits 25spiramycin 268splash hazard 24splice variants 195split injection 76splitless injection 76SPME see solid-phase microextractionspores 293spot volume 434, 438spray deposition techniques 538 SPTs see skin prick testssquinavir 269SSA see simultaneous spectrum analysisstable isotope 427, 430, 432, 442stable isotope labeling 186stable isotope techniques 258stable isotopes 258–259stain-specific distortions 537 standard deviation 11Standard Operating procedure (SOP) 26, 254Standard Operation Procedure (SOP) 254–255standardization 145, 146, 150, 163standards 39stathmin 311statin treatment 15stationary phase 73statistical data analysis 520 sterically active binding sites 333steroid hormones 238steroids 369sterols 225steryl esters 238stratification 31Streptococcus pyogenes 305stress 419striatum 544 strong anion exchange (SAX) 52strong cation exchange (SCX) 52, 53strong force 96structural information 95, 556structural studies 8structure analysis of known proteins 174studies on metabolism 17study design 29, 30
study nurse 26study protocol 29, 30studying mixtures 17sub-cellular protein localization 534 subclass of molecule 523 subgroups of a disease 560 subproteome 411substance S (11-deoxycortisol) 371subviral proteomes 310sulfatides 236summer hay fever 461, 462superconducting magnet 305supercritical fluid chromatography (SFC) 100superoxide 431supervised 146, 153, 165surface-enhanced laser desorption ionization
(SELDI) 99, 488surface-induced dissociation (SID) 132surrogate biomarker 514 sustained off- resonance irradiation (SORI) 131SwissProt database 182symptom management trials 28synapses 408synaptic cleft 408synaptic vesicles 408synaptosomes 411synthetic insulins 284systematic errors 334systems biology 558
TAGs see triacylglycerolstamoxifen 279tandem mass spectrometry (MS/MS) 130,
131, 403tandem mass spectrometry 427target organ 264Tat 322, 332Tax 323, 332taxonomic distinctions 293taxonomy 165TDM see therapeutic drug monitoringtegument 318tenofovi 269tensors 144terms in chromatography 69test of normality 160TFA see trifluoroacetic acid theophylline 283theoretical plate number 66

580 Index
therapeutic drug monitoring (TDM) 18,264, 560
therapeutic efficacy 264thermal ionization mass spectrometry
(TIMS) 259thin-layer chromatography (TLC) 224thin-layer sample preparation method 468three-dimensional quadrupole ion trap (3D
QIT) 120, 129three-dimensional quadrupole ion trap mass
analyzers 129three-way analysis 144, 163thymidylate synthase (TS) 495thyrotrophin-releasing hormone (TRH) 430thyrotrophs 428TIC see total ion chromatogramTIGER see Triangulation Identification for the
Genetic Evaluation of Riskstime delay 11time dependence of molecular concentrations 9time-of-flight (TOF) 533 time-of-flight analyzers 120timing blood withdrawal 265TIMS see thermal ionization mass spectrometrytissue penetration 267TLC see thin-layer chromatographyTOF see time-of-flight tolmetin 282top-down approach 176, 297topoisomerase targeting drugs 276total ion chromatogram (TIC) 352total ion intensity 107total lipid fraction 523 total protein content 8total PSA 514 toxic blood concentrations 264tracee 258tracer 258, 259training (or learning) data sets 146, 162, 165training data set 165Transactivator 323transcriptome 174, 205, 426transcriptomics 173, 430transcripts 489translation initiation factors 321translational apparatus 312transmitter molecules 408transportation time 27treatment group 30
treatment trials 28TRH see thyrotrophin-releasing hormonetriacylglycerols (TAG) 234Triangulation Identification for the Genetic
Evaluation of Risks (TIGER) 304trifluoroacetic acid (TFA) 537 triglycerides 511 trimetazidine 275trimipramine 272tropical spastic paraparesis (TSP) 323tryptic digestion 44tryptic peptides 323TS see thymidylate synthaseTSP see tropical spastic paraparesist-test 524 tuberculosis 267, 291tumor biology 493tumor migration 544 tumor response 547 tumor suppressor genes 312tumor-stage-specific markers 540 two-dimensional gel electrophoresis
(2D-PAGE) 331two-dimensional gel electrophoresis 427type 2 diabetes 239types of clinical trials 28tyrosine kinase receptor 497
ubiquitin 497, 547ubiquitous viruses 312UDC see ursodeoxycholic acidulcerative colitis 239ultra performance liquid chromatography
(UPLC) 88ultracentrifuges 42ultrafiltration 41–43ultraviolet visible wavelength spectroscopy
(UV-VIS) 62, 68underlying components 148, 165 unethical study 20UniParc 204, 206UniParc see UniProt ArchiveUniProt Archive (UniParc) 204UniProt Consortium 206UniProt Knowledgebase (UniProtKB) 204UniProt Reference Clusters (UniRef) 204UniProt see Universal Protein ResourceUniProtKB 204, 206–208, 212, 215, 217UniProtKB see UniProt Knowledgebase

Index 581
UniRef 204, 206UniRef see UniProt Reference ClustersUniversal Protein Resource (UniProt) 204unlabeled compound 356unmodified residues 181unsupervised 146, 157, 165UPLC see ultra performance liquid
chromatographyuracil 493urea cycle disorders 374urine 39ursodeoxycholic acid (UDC) 372UV detection 13UV detector 95UV spectrum 13UV–VIS see ultraviolet visible wavelength
spectroscopy
vaccines 292vaccinia virus 330vacuum 48, 49, 99vacuum centrifuges 42vacuum dessicator 536 vacuum pressure 49, 50vacuum range 96validated biomarker 507 validation 11, 510validation data set 166validation of model building 161validation program 517 van Deemter equation 78, 79variability of drug action 264variables 144vectors 144, 145, 147, 159ventricle of the brain 544 very long chain fatty acids (VLCFA) 369vhs see virion host shutoff
vincristine 276viral capsid 315Viral Genomes Project 317viral infections 310viral proteins 311viral shedding 311viral transactivator 321virion host shutoff (vhs) protein 321virion preparations 311virtual grid 536 viruses 291, 310virus-specific enzymes 270viscosity 79viscous samples 50Vitamin B12 metabolism 256–257vitamin B5, 284vitamin D 285vitamin K 285vitamin malabsorption 491VLCFA see very long chain fatty acidsvolatilization 45voriconazole 269
Ward’s method 166WCX see weak cation exchangeweak cation exchange (WCX) 52Western blot 432, 441, 463 Western blotting 497Wilk’s lambda 153, 166working in biomedical laboratories 24
xenobiotics 264X-ray crystallography 94
Zellweger syndrome 239zidovudine 269ZipTip sampling 53

This page intentionally left blank


