Medical Research and Health Care Financing: Academic Medical Centers Following the 1997 Medicare...
28
Medical Research and Health Care Financing: Academic Medical Centers Following the 1997 Medicare Cuts Pierre Azoulay [email protected] Columbia University Graduate School of Business Wharton School, University of Pennsylvania Leonard Davis Institute of Health Economics February 6 th , 2004 Abigail Tay [email protected] Columbia University Department of Economics
-
date post
20-Dec-2015 -
Category
Documents
-
view
216 -
download
2
Transcript of Medical Research and Health Care Financing: Academic Medical Centers Following the 1997 Medicare...

Medical Research and Health Care Financing: Academic Medical Centers Following the 1997 Medicare Cuts
Pierre [email protected] UniversityGraduate School of Business
Wharton School, University of PennsylvaniaLeonard Davis Institute of Health Economics
February 6th, 2004
Abigail [email protected] UniversityDepartment of Economics

Research Agenda
Academic Medical Centers (AMCs) play a crucial role in the American system of biomedical innovation
Research within AMCs comes from 4 sources:– Public sources — mostly NIH, about 65%– Foundations — ignored in this paper, about 10% – Industry — mostly clinical trials, about 15%– “Institutional Funds” — X-subsidies from patient-care activities, about 10%
Cross-subsidies have been a traditional source of seed-research funds, especially for physician-scientists
What have been the effects of changes in health care financing on the level and composition of research in AMCs?
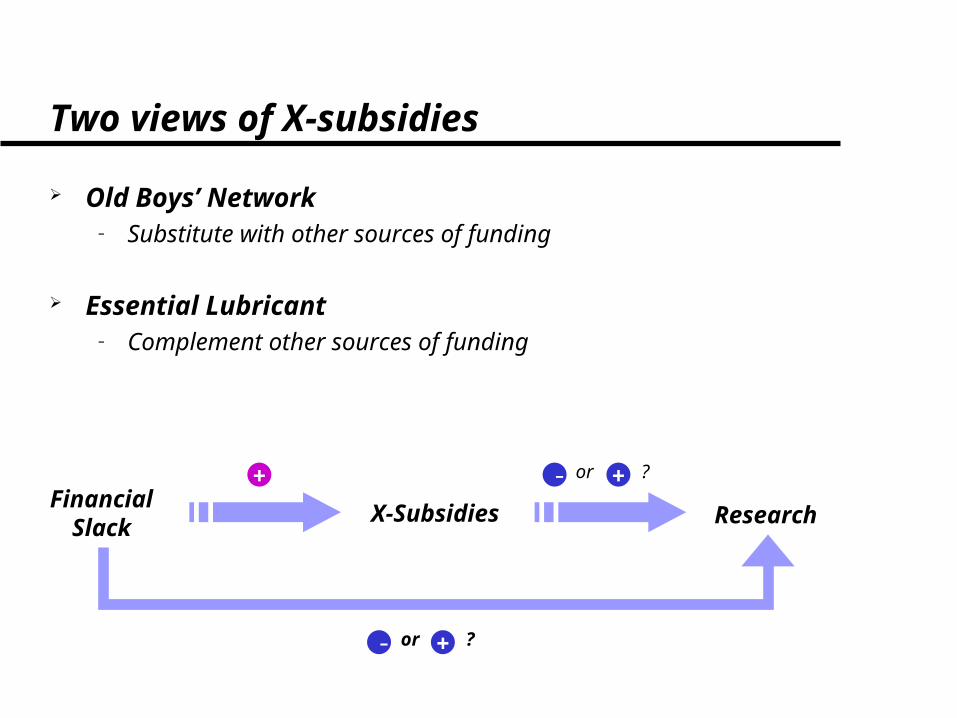
Two views of X-subsidies
Old Boys’ Network– Substitute with other sources of funding
Essential Lubricant– Complement other sources of funding
FinancialSlack
X-Subsidies Research
+ +- or ?
+- or ?

Evolution of Extramural NIH Funds, by Degree of Investigator, 1970-2002

Research Strategy
Pure time series analysis will be contaminated by secular trends such as the massive expansion of the NIH budget during the 1990s
Cross-sectional comparisons across disease areas or research institutions will suffer from omitted variable bias (scientific opportunities, etc.)
We focus on the impact of a discrete shock to hospital finances:Cuts in the Medicare Indirect Medical Education (IME) subsidy following the Balanced Budget Act of 1997
Compare grant awards, before and after 1997, between hospitals that faced a potential large decrease in the level of Medicare reimbursements with those that faced merely a modest decrease

Preview of Results Elasticity of NIH grant awards with respect to health care reimbursements: About .15
– Endowments cushion the effect of the reform– Only very weak evidence that effect is driven by substitution of residents by full-time faculty– Results consistent with the view that hospital X-subsidies complement external sources of funding
Effect shows up “too soon”– One would have expected a 1-2 year lag– Suggests that the reform was anticipated
No response of industry-funded research activity– But more affected hospitals see a rebalancing of their research portfolio towards
clinical trials away from NIH-funded research
Important differences in the magnitude of the response across types of investigators– MDs & MD/PhDs are more affected than PhDs– Human-subjects research is more affected than lab-based research– Young investigators are more affected than experienced faculty members
(the result is not consistent across measures of experience)– No difference between competing and noncompeting grants; only noncompeting funds appear to be affected
(very counterintuitive)

A Primer on the Medicare PPS System
Since 1984, Medicare reimburses inpatient care prospectively, based on the following formula:
$ Reimbursed = Std. Amount × DRG weight × (1+ Teaching Adjustment + Medicaid Adjustment)
%IME %DSH
%IME = × [(1+ #Residents/#Beds).405– 1]<1997 = 1.89
1998 = 1.72
>1999 = 1.60

Data
NIH Consolidated Grant Applicant File
Clinical trial grant data from FastTrack Systems, Inc.
American Hospital Association Survey
AAMC Faculty Roster
HCFA/CMS Cost Reports and IMPACT Files
Area Resource File
HMO penetration variable

Data Issues: JHU and Affiliated Hospitals
Johns Hopkins Hospital
Franklin Square Hospital
Howard County General Hospital
Johns Hopkins Bayview Med. Center
Good Samaritan Hospital
Greater Baltimore Med. Center
Sinai Hospital of Baltimore
Johns Hopkins School of Medicine
Basic Science Departments(Anatomy, Microbiology…)
Clinical Departments (Medicine, Surgery…)
Johns Hopkins Bayview Med. Center
Good Samaritan Hospital
Greater Baltimore Med. Center
Sinai Hospital of Baltimore
Kennedy Krieger Children's Hospital
1
2
3
5
4

Descriptive Statistics:163 Hospitals/“Hospital Aggregates”
# Obs. Mean Std. Dev. Min. Max.
NIH Grant Awards, Total 1,301 $20,221,863 $30,200,380 $0 $186,525,440
NIH Grant Awards, MDs only 1,301 $11,275,818 $17,139,616 $0 $105,685,576
NIH Grant Awards, PhDs only 1,301 $5,906,290 $8,673,354 $0 $53,164,632
NIH Grant Awards, MD/PhDs only 1,301 $2,990,594 $5,713,233 $0 $43,639,076
NIH Grant Awards, clinical only 1,301 $10,058,137 $15,589,789 $0 $100,212,728
NIH Grant Awards, nonclinical only 1,301 $10,114,564 $15,157,144 $0 $94,685,632
NIH Grant Awards, Career Age < 5 1,301 $2,238,714 $5,008,235 $0 $64,818,416
NIH Grant Awards, Career Age > 5 1,301 $14,237,951 $22,118,375 $0 $156,667,904
NIH Grant Awards, Compet. Funds 1,301 $ 5,297,328 $ 8,167,470 $0 $ 55,544,696
NIH Grant Awards, Noncompet. Funds 1,301 $ 13,935,713 $ 21,261,604 $0 $ 135,425,456
Industry Grant Awards 1,301 $1,580,419 $1,591,144 $0 $10,156,377
Counterfactual Medicare Payments 1,301 $73,951,984 $56,429,525 $2,223,885 $362,655,768
Hospital Employment 1,301 4,626 3,384 135 28,643
Hospital Employment in the HSA 1,301 36,550 31,228 1,831 104,031
Population in HSA 1,301 2,502,211 2,461,715 166,977 12,527,938
Fraction of the pop. 65+ in HSA 1,301 12.30% 2.00% 7.04% 21.00%
Per-capita income in HSA 1,301 $27,223 $6,725 $15,567 $53,340
HMO penetration in HSA 1,301 26.60% 12.70% 1.00% 77.80%

Distribution of Average Yearly NIH Awards,1994-2001
0
10
20
30
40
50
Nb.
of A
MC
s
0 50 100 150Amounts ($ Millions)
Note: Amounts are Def lated by the Biomedical R&D Price Index

Distribution of Average Yearly Industry Awards, 1994-2001
0
5
10
15
Nb.
of A
MC
s
0 2 4 6 8Amounts ($ Millions)
Note: Amounts are Def lated by the Biomedical R&D Price Index
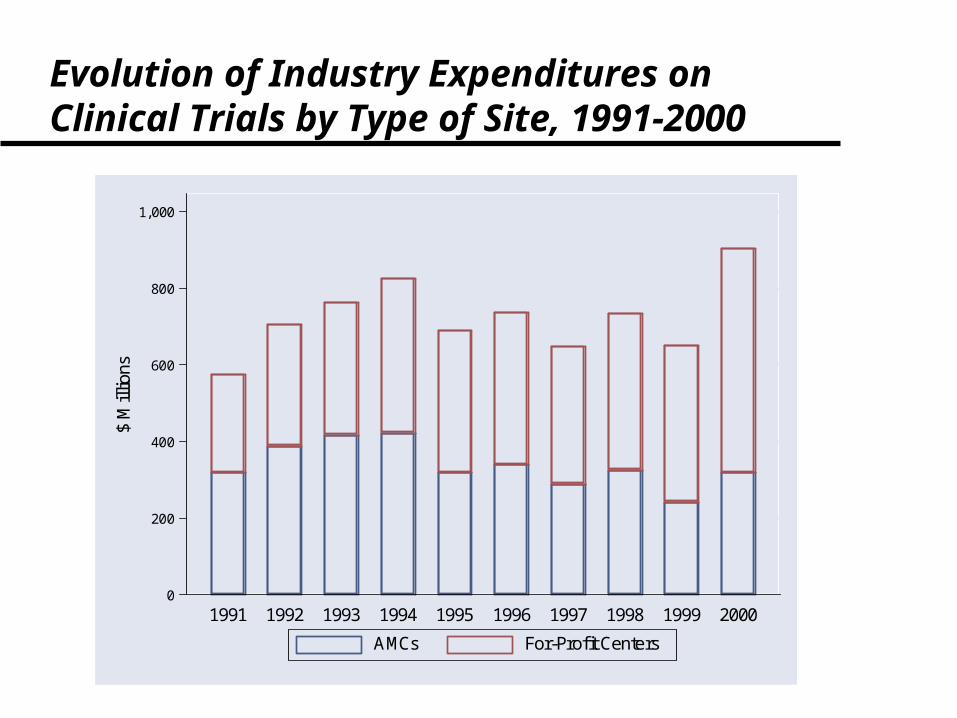
Evolution of Industry Expenditures on Clinical Trials by Type of Site, 1991-2000
0
200
400
600
800
1,000
$ M
illio
ns
1991 1992 1993 1994 1995 1996 1997 1998 1999 2000
AMCs For-Profit Centers

“Parameterizing” the Reform
Regressing research outputs on actual Medicare reimbursements is problematic, because hospitals can change behavior in response to the reform
We create a measure of “Counterfactual” Medicare Payments
– Before the Act, Counterfactual = Actual
– After the Act, CMP corresponds to the payments that would have accrued to the hospital based on the new formula if the underlying determinants of reimbursement levels (patient mix, #residents, #beds, #Medicare discharges) had remained at their average pre-reform level
The CMP variable is defined entirely as of the before period: nothing that the hospital does after the passage of the act (e.g., close beds, DRG “upcoding”...) will affect it

Mean Counterfactual Medicare Payments(Balanced PPS Sample, 1994 Real $ ×106)
65
68
70
73
75
78
80
$ M
illio
ns
1994 1995 1996 1997 1998 1999 2000 2001

Impact of BBA Reform [1]
0
20
40
60
80
Num
ber
of O
bser
vatio
ns (
NT
=1,
301)
0 100 200 300 400
Counterfactual Medicare Payments, 1994-2001 ($ Millions)

Impact of BBA Reform [2]
0
5
10
15
Num
ber
of A
MC
s (N
=16
3)
-60 -40 -20 0 20
Change in Counterfactual Medicare Payments Between 1996 and 2000 ($ Millions)

Impact of BBA Reform [3]
0
5
10
15
20
Num
ber
of O
bser
vatio
ns (
N=
163)
-0.10 -0.05 0.00 0.05
Change in Counterfactual Medicare Payments Between 1996 and 2000 as a Fraction of Average Yearly Total Inpatient Revenues

Regression Analyses
2 < 0 or > 0 ?
– Regression weighted by average grant amounts in the pre-period (unweighted residuals exhibit extreme form of heteroskedasticity)
– Standard errors clustered by medical schools– Equations estimated jointly by SUR to account for
contemporaneous correlations of the residuals

Scatterplot of Unweighted Residuals Against Chosen Weights
-15
-10
-5
0
5
10
Unw
eigh
ted
Res
idua
l
0 50 100 150
Average NIH Grant Amounts, 1994-1997 ($ Millions)

Table 3: “After” Dummy Summarizes the Passage of the Reform
NIH Grants
Industry Grants
Industry Grants/
Total Grants to MDs
MDsOnly
PhDsOnly
MD/PhDs Only
Clinical Research
Non-clinical
Research
Ln(CMP)-0.077 -0.295 -0.164 0.068 -0.592 0.348 0.049 -0.142
[0.219] [0.386] [0.327] [0.277] [0.394] [0.643] [0.369] [0.317]
Ln(CMP)×After0.147** 0.076 -0.109† 0.224** 0.125* 0.322** 0.247** 0.097†
[0.035] [0.062] [0.056] [0.045] [0.063] [0.103] [0.059] [0.051]
Ln(#Employees)0.220* 0.090 -0.050 0.194 0.284 0.098 0.210 0.167
[0.100] [0.176] [0.172] [0.127] [0.180] [0.293] [0.169] [0.145]
Observations 1,301 1,301 1,158 1,301 1,301 1,301 1,301 1,301
R2 0.89 0.79 0.82 0.92 0.84 0.84 0.88 0.87

Table 4: Robustness Checks
Basic Specification
State-specific
Time Trends
Hospital Employment/
Year Interactions
Total Inpatient Revenue Control
Ln(CMP)-0.077 -0.065 -0.051 -0.115
[0.219] [0.111] [0.089] [0.094]
Ln(CMP)×After0.147** 0.210** 0.093† 0.151**
[0.035] [0.080] [0.049] [0.042]
Ln(#Employees)0.220** 0.212* 0.157† 0.203*
[0.100] [0.103] [0.080] [0.079]
Ln(Total Inpatient Revenue)
0.094
[1.059]
R2 0.89 0.90 0.89 0.89

Table 5: Year-specific Slopes for the Impact of the Reform
NIH Grants
Industry Grants
MDsOnly
PhDsOnly
MD/PhDs Only
Clinical Research
Non-clinical Research
Ln(CMP)×19950.007 0.125 0.018 -0.195 0.216 0.048 -0.090
[0.067] [0.118] [0.085] [0.120] [0.196] [0.113] [0.097]
Ln(CMP)×19960.030 0.131 0.077 -0.237* 0.327† 0.078 -0.075
[0.067] [0.119] [0.085] [0.121] [0.197] [0.113] [0.097]
Ln(CMP)×19970.046 0.103 0.097 -0.174 0.466* 0.035 -0.054
[0.068] [0.120] [0.086] [0.122] [0.199] [0.115] [0.099]
Ln(CMP)×19980.114† 0.118 0.261** -0.094 0.523** 0.222† -0.004
[0.068] [0.121] [0.087] [0.123] [0.200] [0.116] [0.099]
Ln(CMP)×19990.138* 0.250* 0.289** -0.022 0.764** 0.278* 0.049
[0.068] [0.120] [0.086] [0.123] [0.200] [0.115] [0.099]
Ln(CMP)×20000.153* 0.202† 0.301** -0.043 0.676** 0.288* 0.056
[0.069] [0.122] [0.087] [0.124] [0.202] [0.116] [0.100]
Ln(CMP)×20010.280** 0.093 0.245** 0.047 0.349† 0.371** 0.069
[0.070] [0.123] [0.088] [0.125] [0.203] [0.117] [0.101]
Ln(#Employees)0.229* 0.084 0.180 0.303† 0.035 0.222 0.173
[0.101] [0.178] [0.128] [0.181] [0.294] [0.170] [0.146]
R2 0.89 0.79 0.92 0.84 0.84 0.88 0.87

Are X-subsidies Driving the Effect? [1]
Endowment Below Median
Endowment Above Median
Ln(CMP)-0.120 -0.061
[0.197] [0.103]
Ln(CMP)×After0.182* 0.096**
[0.072] [0.031]
Ln(#Employees)0.420 0.122*
[0.266] [0.056]
Observations 656 645
R2 0.83 0.99
Note: Endowment Measure is the sum of investment income and contributions, bequests and gifts during the 4 years before the reform.

Are X-subsidies Driving the Effect? [2]
All Hospitals
Hospitals Above the BBA Cap in the Pre-Reform
Period
Hospitals Below the BBA Cap inthe Pre-Reform
Period
Ln(CMP)0.250† 0.158 0.381
[0.134] [0.136] [0.237]
Ln(CMP)×After-0.005 -0.038† 0.022
[0.018] [0.023] [0.022]
Ln(Beds)0.559** 0.574** 0.427**
[0.158] [0.189] [0.117]
Observations 1301 640 661
R2 0.98 0.99 0.98
Dep. Variable: Log of number of FTE Residents

Concluding Thoughts
Our results do not suggest that cutting the IME subsidy was a bad idea; rather, we highlight unintended consequences of the reform
Health economists have examined how insurance type, for profit/not-for-profit care, etc. influence current health outcomes
– Meta-analysis of this literature: health care financing does not seem to explain much once selection issues are dealt with adequately
– Our results suggest that financing may affect future health outcomes through its effect on the pace of medical progress
Congress, NIH, academics often focus on the efficiency of the horizontal allocation of public research funds across diseases (Lichtenberg, 2001)
– But the imbalances along the vertical chain of biomedical innovation may ultimately be of greater importance

Youngsters vs. Old-timers:Contradictory Results
First Grantees
Repeat Grantees
Career Age < 5 years
Career Age > 5 years
NoR01Yet
At least One R01
< $500K cum.
funding
> $500k cum.
funding
Ln(CMP)-0.968 -0.086 -0.843 0.865* -0.179 -0.057 -0.285 -0.339
[0.858] [0.239] [0.777] [0.398] [0.394] [0.325] [0.404] [0.367]
Ln(CMP)×After0.016 0.158** 0.446** 0.034 0.188** 0.206** 0.182** 0.413**
[0.138] [0.038] [0.125] [0.064] [0.063] [0.052] [0.065] [0.059]
Ln(#Employees)0.062 0.226* -0.488 0.274 0.102 0.307* 0.149 0.422*
[0.392] [0.109] [0.355] [0.182] [0.180] [0.149] [0.184] [0.168]
R2 0.66 0.88 0.80 0.90 0.77 0.87 0.83 0.99

Competing vs. Noncompeting Funds:Counterintuitive Results
Competing Funds Noncompeting Funds
Ln(CMP)-0.137 0.012
[0.436] [0.259]
Ln(CMP)×After0.088 0.125**
[0.070] [0.042]
Ln(#Employees)0.066 0.290*
[0.199] [0.118]
R2 0.83 0.92