Medicaid Provider Reimbursement: Recent Changes to ... · Medicaid Provider Reimbursement: Recent...
22
Connecticut Voices for Children 1 Medicaid Provider Reimbursement: Recent Changes to Pediatric, Obstetric, and Other Selected Fees Joachim O. Hero, M.P.H. Mary Alice Lee, Ph.D. April 2008
Transcript of Medicaid Provider Reimbursement: Recent Changes to ... · Medicaid Provider Reimbursement: Recent...

Connecticut Voices for Children 1
Medicaid Provider Reimbursement:Recent Changes to Pediatric, Obstetric, and Other Selected Fees Joachim O. Hero, M.P.H. Mary Alice Lee, Ph.D. April 2008

Connecticut Voices for Children 2
Medicaid Provider Reimbursement: Recent Changes to Pediatric, Obstetric, and Other Selected Fees
April 2008
KEY FINDINGS o For each state fiscal year 2008 and 2009, $27.3 million was appropriated for increasing
physician fees in the Medicaid program. o The new physician fee schedule went into effect January 1, 2008. Pending approval from
the Centers for Medicare and Medicaid Services, providers may also receive supplemental payment for some procedures performed between July 1, 2007 and January 1, 2008.
o The Medicaid fee-for-service physician fee schedule was revised by individual procedure,
rather than across-the-board, by taking into account Medicare allowables, historical and expected distribution of services by service type, and other factors.
o Changes to the fee schedule (unadjusted for medical inflation) varied by type of service and
patient: o Pediatric fees for well-child visits did not change, but a new policy permitting
providers to bill for developmental screening in addition to well or sick visits would increase reimbursement by 6%1 for treating clients in their first three years of life. Fees for office visits increased on average 6 percent and on average over 25 percent for vaccines and immunization administration.
o Obstetrical fees did not change in 2008. o Fees for office visits for adults and pediatric specialty care increased on average
over 34 percent o More commonly billed codes for child and adult office visits received larger fee
increases. The most commonly billed code (99213) for adult visits received an increase of 54%, and the first and second most commonly billed code for child primary care sick visits received increases of 23% and 19%, respectively.
o Medicaid fees improved in comparison to Medicare fees for Connecticut.
o Overall, pediatric rates in 2008 are at 85% of Medicare rates, up from 82% in 2006. o Obstetric fees currently exceed Medicare rates and pay at a higher rate than other
physician fees. o Fees for office visits for adults and pediatric specialty care are at 57% of Medicare
rates in 2008, up from 45% on average. o The Request for Proposals for the HUSKY Program procurement July 1, 2008 sets the
Medicaid fee schedule as the minimum for provider reimbursement under managed care.
1 This percentage increase is estimated by the Department of Social Services.

Connecticut Voices for Children 3
INTRODUCTION Federal law requires that:
A State plan for medical assistance must … provide such methods and procedures relating to the utilization of and the payment for, care and services available under the plan … to assure that payments are consistent with efficiency, economy and quality of care and are sufficient to enlist enough providers so that care and services are available under the plan at least to the extent that such care and services are available to the general population in the geographic area.2
Physician willingness to participate in the Medicaid program is largely dependent on reimbursement.3 Historically, Medicaid fees have been low when compared to reimbursement under Medicare or private health insurance. Though it is evident that many factors affect physician’s willingness to provide care for Medicaid enrollees, fee increases have been shown to be associated with increased provider participation.4, 5 If private providers are unwilling to provide care, Medicaid enrollees are largely dependent on institutional and safety net providers that depend in turn on other sources of public funding to make up for costs associated with care for the uninsured and those with Medicaid coverage. Reduced access to care, especially pediatric subspecialty care, hinders a state’s ability to provide children’s health benefits under Medicaid’s Early and Period Screening, Diagnostic, and Treatment (EPSDT) program. Like most other states, Connecticut has struggled over the years to balance access to care for persons dependent on Medicaid with state budget constraints on program growth and improvement. In the past legislative session, the Connecticut General Assembly adopted a budget that included appropriations for the first broad Medicaid provider fee increases in recent years. The legislature approved $96.3 million for FY 2008 and $122.7 million in FY 2009 for provider rate increases, including $27.3 million for physician fee increases in fiscal years 2008 and 2009. This action was a direct result of widespread and growing concern about provider participation and access to care for children in the Medicaid program.
2 42 U.S.C. § 1396a(a)(30)(A). 3 Rosenberg M, Cohen F. Medicaid and physician reimbursement (commentary). Pediatrics, 2006; 118(2): 808-809. 4 Zuckerman S, McFeeters J, Cunningham P, Nichols L. Changes in Medicaid physician fees, 1998-2003: implications for physician participation. Health Affairs, 2004; W4: 374-384. 5 Cunningham PJ, Nichols LM. The effects of Medicaid reimbursement on the access to care of Medicaid enrollees: a community perspective. Medical Care Research and Review, 2005; 62(6): 676-696. Skaggs DL, et al. Access to orthopaedic care for children with Medicaid versus private insurance: results of a national survey. Journal of Pediatric Orthopedics, 2006; 26(3): 400-404. Greene J, Blustein J, Remler D. The impact of Medicaid managed care on primary care physician participation in Medicaid. Medical Care, 2005; 43(9): 911-920. Berman S, Dolins J, Tang S, Yudlowsky B. Factors that influence the willingness of private primary care pediatricians to accept more Medicaid patients. Pediatrics, 2002; 110(2): 239-248.

Connecticut Voices for Children 4
BACKGROUND Physician participation in the HUSKY Program Children, parents and pregnant women who are eligible for Medicaid coverage are enrolled in Connecticut’s HUSKY Program (Medicaid managed care). Under contracts with the Connecticut Department of Social Services (“Department”), managed care plans that provide services for children, parents, and pregnant women in the HUSKY Program are responsible for maintaining “a provider network capable of delivering or arranging for the delivery of all covered health goods and services to all Members.”6 The managed care plans are required to serve members statewide, with access to primary care providers and certain other providers within specified distances from the members. The managed care plans must establish a provider network with consideration for enrollment, utilization and needs of the population, numbers and types of providers by specialty, number of providers not accepting new patients, geographic distribution of providers with respect to members, and access for members with disabilities. Once a month, participating managed care plans are required to submit their most current listing for the provider network to the Department. The Department evaluates network adequacy quarterly, using ratios of members to specific types of providers, and can audit the list at random for accuracy and completeness. The Department may “freeze” enrollment if the provider network is lacking. For its upcoming contracts, the Department proposes additional steps to monitor network adequacy, including review and investigation of complaints. Under their contracts with the Department of Social Services, participating managed care plans are free to negotiate fee-for-service or capitated payments to providers for care of HUSKY members. In practice, reimbursement should be at a level high enough to ensure the participation of an adequate number and mix of providers by type to serve the plan’s members. Factors that influence negotiations for provider reimbursement include the Medical Assistance Policy Fee Schedule for physicians, commercial rates paid by the same companies for their privately insured members, contractual obligations to ensure provider network adequacy in relatively underserved parts of the state, medical inflation, and Medicare fees for the same services. For its upcoming contracts, the Department proposes requiring managed care plans to reimburse all providers by “no less than the Department’s Medicaid fee schedule.”7 Under these new contracts, any changes to the Medical Assistance Policy Fee Schedule will have a direct effect on provider reimbursement rates in Medicaid managed care by setting the minimum allowable reimbursement rate. Previous Medicaid contracts between the Department for Social Services and managed care organizations had no such requirement. Ensuring physician participation is a challenge for all state Medicaid agencies nationwide, and Connecticut has had greater trouble elevating provider participation rates than average. To determine the extent of physician participation in Medicaid, the American Academy of Pediatrics conducted a survey in 2000 of pediatricians in each of the fifty states and the District of Columbia.8 The survey found that 88 percent of direct care pediatricians in Connecticut were involved in
6 DSS-MCO contract part II sections 3.07, 3.09, 3.10. RFP Section IV Part 3 3.08-3.10. 7 RFP Section 3.47 (g), p. 106. http://www.das.state.ct.us/rfpdoc/DSS03/bids/010308dss_husky_co_rfp.pdf 8 American Academy of Pediatrics Division of Health Policy Research. Pediatrician Participation in Medicaid/SCHIP: Survey of Fellows of the American Academy of Pediatrics, Connecticut. Elk Grove Village, IL: American Academy of Pediatrics, 2000.

Connecticut Voices for Children 5
Medicaid, but only 67 percent accepted all Medicaid patients and only 58 percent accepted all SCHIP patients.9 These participation rates are slightly below the national average, and far below the rates for states in the region. In New England (Maine, New Hampshire, Vermont, Massachusetts, Rhode Island and Connecticut), 95 percent of direct care pediatricians said they are involved in Medicaid, 84 percent said they accept all Medicaid patients, and 83 percent said they accept all SCHIP patients. The primary reason given by surveyed physicians for limiting their participation in Medicaid was low reimbursement levels, followed by unpredictable payments. Appointment Availability In November 2006, the Connecticut Department of Social Services released the results of their “Mystery Shopper Project.” 10 The purpose of this study was to determine whether appointments for pediatric care were available in the HUSKY Program under “real life” conditions. Mystery shoppers posing as parents of newly enrolled children made 1,851 calls for preventive care and non-urgent specialty care appointments with pediatricians, dentists, dermatologists, neurologists, and orthopedic surgeons. If appointments with a provider could not be scheduled, HUSKY managed care plans were contacted for appointment scheduling assistance. The findings confirmed what agency staff, policy makers and advocates had long feared, that many families with children in Connecticut’s HUSKY Program find it difficult to get timely appointments for pediatric care. Only 26 percent of all calls resulted in appointments, including just 34 percent of calls to pediatricians and 27 percent of calls to dentists for preventive care. Appointments for specialty care were scheduled for just 30 percent of calls to dermatologists, 16 percent of calls to neurologists, and 17 percent of calls to orthopedic surgeons. The leading reasons that appointments could not be scheduled were that the provider (who was listed in the managed care plan’s on-line network directory) was not participating with the plan (23%) or not accepting new patients (9%). Overall, appointment availability was about the same for members of each of the four health plans.11 Just 17 percent of 60 calls made by Spanish-speaking “families” resulted in appointments. Although customer service representatives of the managed care plans were generally polite and helpful, few callers were offered additional assistance with appointment scheduling. The Mystery Shopper Project findings are clearly troubling, but it should be noted that the experimental design was imperfect. The number of attempts to schedule appointments (1,851) was relatively small, compared with the overall size of the program (300,000 adults and children enrolled in HUSKY A and B as of July 2006) and the number of appointments that are successfully scheduled every day. Had appointments been requested with clinics rather than individual providers within clinics, the success rate might have been higher. In the absence of a privately insured control group, it is difficult to know whether access to care in the HUSKY Program is any worse or better than access for privately insured children. The results may not be representative of appointment availability for children who are currently (v. newly) enrolled in the program. Nevertheless, the
9 The survey also found that just 56% of primary care pediatricians in private office-based settings accept all new Medicaid patients. 10 Connecticut Department of Social Services. Mystery shopper project. Hartford, CT: DSS, November 17, 2006. The study was commissioned by the Department of Social Services and conducted by staff of Phoenix-based Mercer Government Human Services Consulting, under the direction of Nan Jeannero and Kerry McGuire. 11 Appointments scheduled by managed care plan: 27% for BlueCare, 25% for CHNCT, 23% for Health Net, and 29% for WellCare/Preferred One. Source: DSS report on mystery shopper project.

Connecticut Voices for Children 6
findings indicated that there is a program-wide problem too great to ignore. The Department immediately began working with managed care plans on corrective actions. Legislative action By the time the Connecticut General Assembly convened in January 2007, key legislators had been briefed on these study findings. They were also aware that a request for data on provider reimbursement rates, filed by a Yale University professor and Greater New Haven Legal Assistance attorney on behalf of two HUSKY enrollees, was pending before the commission that handles requests under the Freedom of Information (FOI) Act.12 This FOIA request was filed in order to determine whether low reimbursement levels could be responsible for the difficulty Medicaid clients were having seeing certain medical specialists. The managed care plans resisted release of what they viewed as proprietary information.13 These events injected the issue of Medicaid access and its link to physician reimbursement into legislative debate. Amid the FOIA controversy, Connecticut’s legislature increased Medicaid provider reimbursement rates. After difficult negotiations on all aspects of the FY 2008-09 budget, the Connecticut General Assembly re-convened in special session in late June 2007 and adopted a budget that included appropriations for Medicaid provider fee increases.14 The legislature provided $96.3 million for FY 2008 and $122.7 million in FY 2009 for provider rate increases, including $27.3 million for physician fee increases in 2008. The new rates in Medicaid fee-for-service were put into effect on the first of January 2008, and, pending approval from the Centers for Medicare and Medicaid Services, providers may also receive supplemental payment for some procedures performed between July 1, 2007 and December 31, 2007. New Medicaid fee schedule The Department of Social Services issued a new Medicaid fee schedule effective January 1, 2008, for reimbursement for services provided for fee-for-service (not managed care) Medicaid beneficiaries.15 According to David Parrella, Director, Medical Care Administration, the fee schedule was adjusted with the following considerations in mind: usual distribution of services by service type, Medicare allowables for the procedures, and additional factors for some procedures.16 Mr. Parrella reported 12 Sorrel AL. “Connecticut groups sue to find out Medicaid HMO physician pay rates.” Amednews. Sept. 18 2006. http://www.ama-assn.org/amednews/2006/09/18/gvsb0918.htm 13 Later that year, the FOI Commission found that under Connecticut law, the managed care plans were performing a government function, subject to FOI requirements. Hartwig v. Commissioner of DSS, Freedom of Information Commission, Docket No. FIC 2005-025 (December 14, 2005); Hunt et al. v. Commissioner of DSS, Freedom of information Commission, Docket No. FIC 2005-284 (April 12, 2006). A superior court agreed. Health Net of Connecticut v. FOIC, et al., 2006 WL 3691796, 42 Conn. L. Rptr. 441 (Conn. Super., November 29, 2006) (Levine, J.). On November 19, 2007, Governor M. Jodi Rell announced the end to any further contract negotiations with the four participating HUSKY managed care plans, citing the fact that two of the four had refused to comply with a contractual requirement for full disclosure of rates and rate setting methodology. See: The Office of Governor Jodi Rell (November 19, 2007) “Governor Rell Orders Termination of HUSKY Contractors’ Managed Care Role over Failure to Accept Public Oversight.” Press Release. http://www.ct.gov/governorrell/cwp/view.asp?A=2791&Q=399666 14 Connecticut State Budget 2007-2009. Section V, Department of Social Services. p. 314 15Fee schedules for multiple years can be found here: https://www.ctdssmap.com/CTPortal/Provider/Provider Fee Schedule Download/tabId/52/Default.aspx 16 Parrella D. Presentation to Medicaid Managed Care Council, January 11, 2008.

Connecticut Voices for Children 7
that the adjustments raised Medicaid fees to about 57 percent of Medicare allowables, compared to about 45 percent in previous years. PURPOSE This report examines the Medicaid fee-for-service rate changes effective January 1, 2008, by looking at selected medical procedure codes and comparing the rates to those in effect since 2006. Specifically, it focuses on two main objectives: • To provide detailed analysis of recent changes in the Medicaid physician fee schedule for
pediatric, obstetrical, and other selected services. • To compare Medicaid physician fees to Medicare fees for the same procedures. METHODS Study design This report is a descriptive study of the effect of new funding on selected physician fees in the Medicaid program. New fees in effect in 2008 were compared with fees in effect since 2006 (unadjusted and adjusted for medical inflation) and with 2008 Medicare fees for Connecticut. Data The physician reimbursement rates for Medicaid fee-for-service are published by the Connecticut Department of Social Services. 17 New fees in effect as of January 1, 2008, were compared to rates in effect since May 1, 2006, to identify changes (increases and decreases) for services delivered to eligible non-managed care clients. Reimbursement rates for all pediatric procedures, all obstetrical procedures, and selected medical procedures were examined. Medicare reimbursement rates for Connecticut providers in 2008 and 2006 are published by the federal Center for Medicare and Medicaid Services (CMS) in its Provider Fee Schedule Carrier Specific Files.18 Medicare reimbursement rates are determined using a complex determination of the combined costs of physician work, cost of insurance coverage, and practice cost. These rates are then adjusted to reflect the variation in each of these costs from geographic area to geographic area. This adjustment uses a geographic practice cost index (GPCI) that accounts for the cost of delivering medical services in a payment locality (e.g. Connecticut). Due to this adjustment, reimbursement rates in Connecticut are higher than they are nationally because of the high cost of medical services in this state. Every year, Medicare reimbursement rates are adjusted by a complex formula to reflect the changing cost of providing care, although Congress can decrease rates or hold rates constant, as was the case in 2002 and just recently between 2005 and 2006. Descriptions corresponding to each procedure code were obtained from the American Medical Association’s Current Procedural Terminology (CPT) guidelines for reporting medical services and
17 https://www.ctdssmap.com/CTPortal/Provider/Provider Fee Schedule Download/tabId/52/Default.aspx 18 http://www.cms.hhs.gov/PhysicianFeeSched/PFSCSF/list.asp - TopOfPage
Connecticut Voices for Children 8
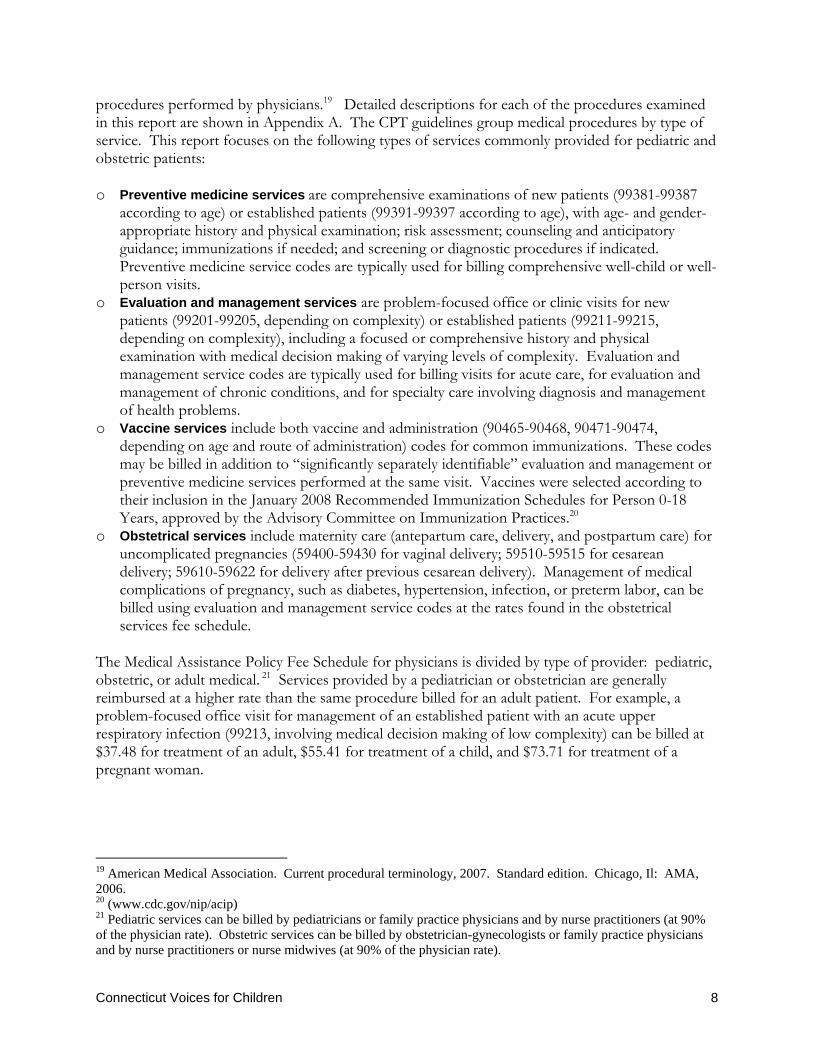
procedures performed by physicians.19 Detailed descriptions for each of the procedures examined in this report are shown in Appendix A. The CPT guidelines group medical procedures by type of service. This report focuses on the following types of services commonly provided for pediatric and obstetric patients: o Preventive medicine services are comprehensive examinations of new patients (99381-99387
according to age) or established patients (99391-99397 according to age), with age- and gender-appropriate history and physical examination; risk assessment; counseling and anticipatory guidance; immunizations if needed; and screening or diagnostic procedures if indicated. Preventive medicine service codes are typically used for billing comprehensive well-child or well-person visits.
o Evaluation and management services are problem-focused office or clinic visits for new patients (99201-99205, depending on complexity) or established patients (99211-99215, depending on complexity), including a focused or comprehensive history and physical examination with medical decision making of varying levels of complexity. Evaluation and management service codes are typically used for billing visits for acute care, for evaluation and management of chronic conditions, and for specialty care involving diagnosis and management of health problems.
o Vaccine services include both vaccine and administration (90465-90468, 90471-90474, depending on age and route of administration) codes for common immunizations. These codes may be billed in addition to “significantly separately identifiable” evaluation and management or preventive medicine services performed at the same visit. Vaccines were selected according to their inclusion in the January 2008 Recommended Immunization Schedules for Person 0-18 Years, approved by the Advisory Committee on Immunization Practices.20
o Obstetrical services include maternity care (antepartum care, delivery, and postpartum care) for uncomplicated pregnancies (59400-59430 for vaginal delivery; 59510-59515 for cesarean delivery; 59610-59622 for delivery after previous cesarean delivery). Management of medical complications of pregnancy, such as diabetes, hypertension, infection, or preterm labor, can be billed using evaluation and management service codes at the rates found in the obstetrical services fee schedule.
The Medical Assistance Policy Fee Schedule for physicians is divided by type of provider: pediatric, obstetric, or adult medical. 21 Services provided by a pediatrician or obstetrician are generally reimbursed at a higher rate than the same procedure billed for an adult patient. For example, a problem-focused office visit for management of an established patient with an acute upper respiratory infection (99213, involving medical decision making of low complexity) can be billed at $37.48 for treatment of an adult, $55.41 for treatment of a child, and $73.71 for treatment of a pregnant woman.
19 American Medical Association. Current procedural terminology, 2007. Standard edition. Chicago, Il: AMA, 2006. 20 (www.cdc.gov/nip/acip) 21 Pediatric services can be billed by pediatricians or family practice physicians and by nurse practitioners (at 90% of the physician rate). Obstetric services can be billed by obstetrician-gynecologists or family practice physicians and by nurse practitioners or nurse midwives (at 90% of the physician rate).

Connecticut Voices for Children 9
Analysis Reimbursement rates for pediatric, obstetrical, and selected medical procedures were compared in terms of the direction (increase, decrease) and percentage change from actual 2006 to 2008 rates and the direction and percentage change from inflation-adjusted 2006 rates to 2008. The 2008 Medicaid fee-for-service rates are shown as a percent of Medicare reimbursement rates for the same year. Comparisons were done at the individual procedure level, procedure group level, and for overall categories. To determine rate changes over time for individual procedures, simple ratios of fees in 2008 to fees in 2006 were calculated and subtracted from one to arrive at a percent increase or decrease. For example, the 2008 reimbursement rate for evaluation and management of a self-limited or minor problem experienced by a new pediatric patient (CPT code 99201; $33.48) was compared to the 2006 rate ($36.08); the rate change is described as a simple percentage change (2.8% decrease). To determine rate changes over time for a procedure group or for overall categories of services, an average of all individual rate changes in that category was calculated. For example, to calculate the change in reimbursement for the full range of minor to complex evaluation and management procedures for new and established patients (99201-99205, 99211-99215), an average of the rate changes of all the procedures in this category is reported (6.2% increase). Similarly, to calculate the changes over time of all pediatric services, an average of all rate changes of procedures in that category was determined.22 In order to increase the validity of year-to-year comparisons, reimbursement rates from 2006 were inflation-adjusted to current dollar values, using indices that track the change in price for a variety of goods and services and are published monthly by the U.S. Bureau of Labor Statistics.23 The inflation-adjusted rates in this report were calculated by dividing the 2007 consumer price index of medical care for urban consumers in the northeast with the same index from 2006 and then multiplying the 2006 reimbursement rates by that ratio. All fees reported here are the rates that would be paid to physicians for performing specific procedures on clients in Medicaid fee-for-service. When a procedure is performed by a nurse practitioner or nurse midwife, the reimbursement rate is reduced by 10%.
22 When taking a simple average of all procedures to determine overall rate changes, undue weight is given to rate changes that occur in procedures that are rarely performed and less weight is given to rate changes that occur for commonly performed procedures. In order to determine the effect of rate changes on physician incomes, a weighted average of fees based on historical or expected distribution of procedures would be needed. 23 http://www.bls.gov/cpi/home.htm
Connecticut Voices for Children 10
RESULTS For FY 2008, Connecticut allocated $27 million new dollars to be used towards increasing physician reimbursement rates in the Medicaid program; however, the increases were not applied equally across all procedures to raise reimbursement rates by a uniform dollar or percentage amount. Effective January 1, 2008, mid-way through the fiscal year, reimbursement for some procedures were increased while others remained the same or were cut from rates in effect since May 1, 2006. For the purposes of this study, changes in reimbursement for pediatric, obstetrical, and selected medical procedures were examined by comparing new 2008 rates to 2006 rates (unadjusted and adjusted for medical inflation). The effect of new rates on each type of service varied considerably: some but not all pediatric fees were changed, depending on the type of service; none of the obstetrical fees were changed; and adult medical fees were increased, but not uniformly. Comparisons with Medicare rates show an increase generally, although at least part of that increase is due to Medicare rates having fallen between 2006 and 2008. Medicaid rates for pediatric services and obstetrical services are generally at or above Medicare rates for the same procedure codes. The following sections summarize the rate changes shown in Tables 1-6. Pediatric Services Overall, physician reimbursement rates for pediatric services did not change significantly between 2006 and 2008. However, modest changes did occur by category of pediatric procedure. For example, reimbursement rates for well child visits did not change, whereas rates for pediatric office or other outpatient visits increased by roughly 6 percent. Compared to Medicare rates, pediatric reimbursement rates in Medicaid in 2008 were at 85 percent of Medicare rates in 2008, up from 82 percent in 2006. Preventive care: New reimbursement rates for well-child care (preventive medicine service codes 99381-99385, 99391-99395) are largely unchanged from rates in effect since 2006 (Table 1). Reimbursement for individual counseling (preventive medicine services codes 99401-4) were changed, on average, less that 1.0 percent up or down from 2006 rates. Group counseling services (preventive medicine service codes 99411, 99412) experienced a 4 percent decline, which equals more than 8 percent after accounting for inflation. Most other procedure rates did not change. Including the effects of inflation, overall reimbursement rates for pediatric preventive counseling services in 2008 are equivalent to about 95 percent what they were in 2006. According to the Department, reimbursement rates for preventive medicine services were kept the same because a new policy currently under review will allow pediatricians to bill for developmental screening in addition to well or sick visits. This policy change will increase reimbursement for these types of services by about 19 percent per visit when routine screening is performed at a well-child visit and about 6 percent overall for the program.

Connecticut Voices for Children 11
Table 1: Preventive Medicine Services: Well-child care and counseling
Code Procedure Description2008
2006 Inflation-
Adj.
2006 (unadj)
Change 08 vs. 06
(unadj)
Change 08 vs. 06 (adjusted)
99381 Initial prev. medicine eval., infant $93.60 $98.06 $93.60 0.0% -4.6%99382 Initial prev. medicine eval., 1-4 $93.60 $98.06 $93.60 0.0% -4.6%99383 Initial prev. medicine eval., 5-11 $93.60 $98.06 $93.60 0.0% -4.6%99384 Initial prev. medicine eval., 12-17 $93.60 $98.06 $93.60 0.0% -4.6%99385 Initial prev. medicine eval., 18-39 $93.60 $98.06 $93.60 0.0% -4.6%99391 Periodic prev. med. reeval., infant $93.60 $98.06 $93.60 0.0% -4.6%99392 Periodic prev. med. reeval., 1-4 $93.60 $98.06 $93.60 0.0% -4.6%99393 Periodic prev. med. reeval., 5-11 $93.60 $98.06 $93.60 0.0% -4.6%99394 Periodic prev. med. reeval., 12-17 $93.60 $98.06 $93.60 0.0% -4.6%99395 Periodic prev. med. reeval., 18-39 $93.60 $98.06 $93.60 0.0% -4.6%99401 Prev. med. counseling 15m $36.46 $37.73 $36.01 1.2% -3.4%99402 Prev. med. counseling 30m $60.86 $63.23 $60.35 0.8% -3.7%99403 Prev. med. counseling 45m $83.88 $88.05 $84.04 -0.2% -4.7%99404 Prev. med. counseling 60m $107.28 $113.54 $108.37 -1.0% -5.5%99411 Prev. med. counseling. Group, 30m $11.11 $12.12 $11.57 -4.0% -8.3%99412 Prev. med. counseling. Group, 60m $16.63 $18.18 $17.35 -4.1% -8.5%96110 Developmental Screening $18.00 $81.86 $78.13 -77.0% -78.0%96111 Developmental Screening, extended $80.92 $81.86 $78.13 -4.1% -8.5%
Average % change for pediatric preventive services: -4.9% -9.2%
Pediatric Reimbursement Rates
Outpatient visits for evaluation and management of a health problem: Reimbursement rates for outpatient office visits increased overall by 6.2 percent, though the increase is just 1.3 percent after adjusting for inflation (Table 2). More complicated outpatient visits (e.g. visits that resulted in 60 minutes of face-to-face time with a pediatrician or other specialist providing pediatric care) generally received rate increases, while office visits for management of relatively simple problems saw rate cuts. The rates for outpatient visits for new patients were increased by 5.1 percent on average, which is slightly less than the 7.2 percent increase in rates for outpatient visits by established patients. The Department has indicated that fees for pediatric evaluation and management office visits were changed with attention to utilization and cost. High-volume procedures received the largest rate increases, which, according to the Department, are expected to bring an 18 percent increase in program expenditures for these procedures.

Connecticut Voices for Children 12
Table 2: Pediatric Office or Other Outpatient Visits
Code Procedure Description2008
2006 Inflation-
Adj.
2006 (unadj)
Change 08 vs. 06
(unadj)
Change 08 vs. 06 (adjusted)
99201
Office or other outpatient visit for the evaluation and management of a new patient. 10m $33.48 $36.08 $34.44 -2.8% -7.2%
99202 (same as above) 20m $58.05 $57.79 $55.16 5.2% 0.4%99203 (same as above) 30m $85.69 $86.35 $82.42 4.0% -0.8%99204 (same as above) 45m $129.27 $122.72 $117.13 10.4% 5.3%99205 (same as above) 60m $161.76 $156.03 $148.93 8.6% 3.7%
99211
Office or other outpatient visit for the evaluation and management of an established patient. 10m $19.27 $23.56 $22.49 -14.3% -18.2%
99212 (same as above) 20m $34.62 $36.20 $34.55 0.2% -4.4%99213 (same as above) 30m $55.41 $47.25 $45.10 22.9% 17.3%99214 (same as above) 45m $83.87 $74.11 $70.74 18.6% 13.2%99215 (same as above) 60m $113.06 $108.78 $103.83 8.9% 3.9%
Average % change for pediatric outpatient services: 6.2% 1.3%
Pediatric Reimbursement Rates
Vaccinations: Common pediatric vaccination services received an overall increase of 32.6 percent (26.5 percent increase after accounting for inflation) (Table 3). The rates for some vaccines were increased substantially (e.g. Pneumococcal, Meningococcal, Diptheria vaccines) while others received large cuts (e.g. Hepatitis B). Immunization administration fees were increased by an average of 25 percent.

Connecticut Voices for Children 13
Table 3: Vaccinations
Code Procedure Description2008
2006 Inflation-
Adj.
2006 (unadj)
Change 08 vs. 06
(unadj)
Change 08 vs. 06 (adjusted)
90633 Hepatitis A, 2-dose $24.27 $23.92 $22.83 6.3% 1.5%90634 Hepatitis A, 3-dose $24.28 $27.89 $26.62 -8.8% -12.9%90645 Hemophilus (Hib) $22.45 $25.63 $24.46 -8.2% -12.4%90646 Hemophilus (Hib) booster $17.82 $108.96 $104.00 -82.9% -83.6%90647 Hemophilus (Hib) 3-dose $22.45 $22.25 $21.24 5.7% 0.9%90648 Hemophilus (Hib) 4-dose $21.78 $10.95 $10.45 108.4% 98.9%90649 Human Papilloma Virus (HPV) $99.06 M.P.90655 Influenza, preservative free 6-35m $15.38 $13.93 $13.30 15.6% 10.4%90656 Influenza, preservative free >3yrs $16.57 M.P.90658 Influenza, >3yrs $12.62 $11.00 $10.50 20.2% 14.7%90669 Pneumococcal conjugate <5yrs $57.16 $11.05 $10.55 441.8% 417.1%90680 Rotavirus $52.20 M.P.90702 Diptheria and tetanus toxoids <7yrs $15.56 $10.90 $10.40 49.6% 42.8%90707 MMR vaccine $41.72 $39.18 $37.40 11.6% 6.5%90713 Poliovirus, inactivated $25.79 $23.59 $22.52 14.5% 9.3%90716 Varicella virus $72.75 $68.90 $65.76 10.6% 5.6%90732 Pneumococcal polysaccharide $27.03 $25.36 $24.21 11.6% 6.6%90733 Meningococcal conjugate $84.46 $60.16 $57.42 47.1% 40.4%90744 Hepatitis B $30.08 $74.51 $71.12 -57.7% -59.6%90465 Immunization Administration $12.52 $9.62 $9.18 36.4% 30.2%90466 Immunization Administration $6.45 $5.55 $5.30 21.7% 16.2%90467 Immunization Administration $7.93 $6.74 $6.43 23.3% 17.7%90468 Immunization Administration $5.95 $5.14 $4.91 21.2% 15.7%90471 Immunization Administration $12.52 $9.62 $9.18 36.4% 30.2%90472 Immunization Administration $6.45 $5.55 $5.30 21.7% 16.2%90473 Immunization Administration $8.18 $7.15 $6.82 19.9% 14.5%90474 Immunization Administration $5.43 $4.93 $4.71 15.3% 10.0%
Average % Change: 32.6% 26.5%
Pediatric Reimbursement Rates

Connecticut Voices for Children 14
Obstetrical Services Medicaid fee-for-service rates for obstetrical services were not changed between 2006 and 2008 (selected procedures are shown in Table 4). When accounting for medical inflation, leaving fees the same amounts to a rate cut of 4.6 percent across procedures; however, reimbursement rates for procedures appearing in obstetrical services are still generally higher than reimbursement rates for the same procedures appearing in pediatric services or in the medical procedures list. For example, a provider who performs a preventive medicine evaluation (99384) for a 12 to 17 year old pregnant woman would receive $187, compared with the $93 a pediatrician or other specialist would receive for seeing a child or the $69 reimbursement for an internist or a general practitioner providing care for a non-pregnant adult.
Table 4: Obstetrical Services
Other Selected Services Outpatient visits for evaluation and management of a health problem (adult and specialty care for pediatric patients): Reimbursement rates for outpatient visits for acute care rose an average of 34.4 percent between 2006 and 2008 (28.3% after accounting for inflation) (Table 5). The increases ranged from 23.9 percent for an outpatient visit of moderate complexity for a new patient (99203) to 55.1 percent for an outpatient visit of moderate complexity for an established patient (99213). As with fee schedule changes for pediatric outpatient visits, fees for adult outpatient visits were changed according to utilization. The most commonly billed code (99213), for example, received the highest fee increase. Therefore, estimated expenditure increases are even higher than increases in the fees.
2008 2006 Inflation-Adj. 2006 (unadj)
Change 08 vs. 06
(unadj)
Change 08 vs. 06
(adjusted)
57170Diaphragm or cervical cap fitting with instructions $167.51 $175.50 $167.51 0.0% -4.6%
57410Pelvic Examination under anesthesia $312.49 $327.40 $312.49 0.0% -4.6%
57420Colposcopy of the entire vagina, with cervix if present $222.08 $232.67 $222.08 0.0% -4.6%
57421Colposcopy of the entire vagina, with cervix if present, with biospy
58300 Insertion of an IUD $273.78 $286.84 $273.78 0.0% -4.6%58301 Removal of an IUD $205.72 $215.53 $205.72 0.0% -4.6%
59400
Routine obstetric care including antepartum care, vaginal delivery, and post partum care $2,972.89 $3,114.70 $2,972.89 0.0% -4.6%
59510
Routine obstetric care including antepartum care, cesarean, and post partum care $3,373.59 $3,534.51 $3,373.59 0.0% -4.6%Average % change for obstetrical services 0.0% -4.6%
Obstetrical Reimbursement Rates

Connecticut Voices for Children 15
Table 5: Outpatient Visits, Acute Care
Code Procedure Description2008
2006 Inflation-
Adj.
2006 (unadj)
Change 08 vs. 06
(unadj)
Change 08 vs. 06 (adjusted)
99201
Office or other outpatient visit for the evaluation an management of a new patient. 10m $22.65 $18.72 $17.87 26.7% 21.0%
99202 (same as above) 20m $39.27 $31.16 $29.74 32.0% 26.0%99203 (same as above) 30m $57.97 $49.00 $46.77 23.9% 18.3%99204 (same as above) 45m $87.45 $65.23 $62.26 40.5% 34.1%99205 (same as above) 60m $109.43 $87.49 $83.51 31.0% 25.1%
99211
Office or other outpatient visit for the evaluation an management of an established patient. 10m $13.04 $10.60 $10.12 28.9% 23.0%
99212 (same as above) 20m $23.42 $19.74 $18.84 24.3% 18.7%99213 (same as above) 30m $37.48 $25.31 $24.16 55.1% 48.1%99214 (same as above) 45m $56.74 $41.94 $40.03 41.7% 35.3%99215 (same as above) 60m $76.48 $57.19 $54.59 40.1% 33.7%
Average % change for non-pediatric outpatient visits: 34.4% 28.3%
Outpatient Visit Reimbursement Rates
Comparison to Medicare Rates One common way for determining the adequacy of provider reimbursement in Medicaid is to compare those rates to the rates paid by the Medicare program. A 2003 report in Health Affairs found the overall Medicaid to Medicare ratio in the United States was $0.69 for every $1.00 paid by Medicare.24 The same report showed Connecticut with a ratio of $0.83 for every $1.00 of Medicare reimbursement. The report in Health Affairs, however, focused mainly on primary care and obstetrical services, two types of services for which Connecticut reimbursement rates are favorable compared with other states. Our independent comparison of Medicare and Medicaid physician reimbursement rates finds a ratio that is much lower than that reported in Health Affairs and is in agreement with the Medicaid to Medicare ratios reported by the Department. Generally, the 2008 Medicaid reimbursement rates for non-specialty medical procedures in Connecticut are about 57 percent of Medicare rates, an increase from in 2006 when Medicaid rates were about 45 percent of Medicaid rates. This comparison is much better in some specialties. Reimbursement rates for pediatric services in Medicaid are generally 85 percent of the rates in Medicare, and for obstetrical services Medicaid rates range from 112 percent to over 200 percent of Medicare rates. The Medicare standard, while considered by the Department to be the most fair and defensible method to set Medicaid rates, is not perfect. To the credit of the Medicare standard, a sophisticated formula is used in order to develop a schedule of fees in Medicare that adequately compensates physicians for care delivery and maintains an acceptable provider network. On the other hand, rates
24 Zuckerman S, et al. “Changes in Medicaid Physician Fees, 1998-2003: Implications for Physician Participation” Health Affairs (Web Exclusive). June, 2004. http://content.healthaffairs.org/cgi/reprint/hlthaff.w4.374v1

Connecticut Voices for Children 16
in Medicare are developed for a unique population and are subject to constraints (budget cuts, etc.) that may cause rates to fall short of ideal levels. Between 2006 and 2008, the Medicare rates for the procedures studied in this report declined by an average of 2%, which has been a factor in the improvement of Medicaid to Medicare rate ratios. The improvement in the Medicare to Medicaid ratio for pediatric fees, for example, can be attributed entirely to lower Medicare fees, rather than higher Medicaid fees. Therefore, relying on Medicaid to Medicare ratios alone to determine the adequacy of provider payments can provide incomplete information. Another problem with the Medicare standard is that Medicaid and Medicare serve two very different populations. Reimbursement rates paid to pediatricians delivering outpatient visits (codes 99201-99215) to children in Medicaid are compared to the reimbursement rates paid for billing the same procedures under Medicare for elderly and disabled patients. An outpatient visit for a child or pregnant woman will have different costs and challenges than an outpatient visit for the elderly or disabled, so it would be wrong to assume that Medicare-Medicaid fee parity is the ideal goal for all procedure categories. Parity is nonetheless an important, if imperfect, goal when Medicaid rates are still less than half Medicare rates in many states. The following tables compare Connecticut Medicaid rates to Medicare rates for outpatient visits. Pediatric, obstetrical, and general procedure rates for Medicaid are included alongside the Medicare fee in Connecticut. Three columns on the right show Medicaid rates presented as a percentage of Medicare rates. Table 6a displays 2008 rates and Table 6b displays 2006 rates for comparison.
Table 6a: 2008 Comparison of Connecticut Medicaid and Medicare Rates for Outpatient Visits
2008 HUSKY Fee Pediatric
2008 HUSKY Fee
Obstetrical
2008 HUSKY Fee Med.
Proc.
2008 Medicare
Fee
HUSKY Pediatric
fees as % of Medicare
HUSKY OB Fees as % of
Medicare
HUSKY Med. Proc as a % of Medicare
Office or other outpatient visit for the evaluation and management of new patient. 10m (99201) $33.48 $50.05 $22.65 $40.23 83.2% 124.4% 56.3%(as above) 20m (99202) $58.05 $89.06 $39.27 $68.59 84.6% 129.8% 57.3%(as above) 30m (99203) $85.69 $131.79 $57.97 $100.15 85.6% 131.6% 57.9%(as above) 45m (99204) $129.27 $187.80 $87.45 $151.43 85.4% 124.0% 57.7%(as above) 60m (99205) $161.76 $238.56 $109.43 $189.64 85.3% 125.8% 57.7%Office or other outpatient visit for the evaluation and management of new estab. Pat. 10m (99211) $19.27 $30.00 $13.04 $22.45 85.8% 133.6% 58.1%(as above) 20m (99212) $34.62 $52.26 $23.42 $41.58 83.3% 125.7% 56.3%(as above) 30m (99213) $55.41 $73.17 $37.48 $65.87 84.1% 111.1% 56.9%(as above) 45m (99214) $83.87 $114.02 $56.74 $98.80 84.9% 115.4% 57.4%(as above) 60m (99215) $113.06 $166.19 $76.48 $133.05 85.0% 124.9% 57.5%Average % change: 84.7% 124.6% 57.3%

Connecticut Voices for Children 17
Table 6b: 2006 Comparison of Connecticut Medicaid and Medicare Rates for Outpatient Visits
DISCUSSION In Connecticut, 75 percent of Medicaid enrollees are children and parents who are almost without exception enrolled in managed care (the HUSKY Program). Medicaid payments for their care amount to about 23 percent of total program spending at an average of $2,127 annually per child and $2,421 annually per adult. 25 In contrast, the elderly and disabled individuals who have Medicaid coverage make up 24 percent of enrollees, but account for 77 percent of Medicaid expenditures. Their care is paid fee-for-service and averages $21,522 annually per older adult and $23,221 annually per disabled adult. Clearly, adjustments to the Medicaid fee schedule are likely to have a greater impact on services and providers who care for the elderly and disabled individuals in the program. A large factor in the failure of Medicaid programs to solve access problems for eligible enrollees is that physicians are paid substantially less for treating Medicaid patients than they are for treating patients in Medicare or in the private market. The importance of provider reimbursement rates to Medicaid access both stands to reason and is supported by research. Physicians in states with the lowest reimbursement rates in the country are less willing to take on Medicaid patients than physicians in states where reimbursement rates are higher.26 Additionally, numerous studies have found that as reimbursement rates become more generous, more providers participate in Medicaid.27
25 Analysis of data from the Center for Medicare and Medicaid Services’ Medicaid Statistical Information System by the Urban Institute and Kaiser Commission on Medicaid and the Uninsured, reported at www.statehealthfacts.org. 26 Zuckerman S, et al. “Changes in Medicaid Physician Fees, 1998-2003: Implications for Physician Participation” Health Affairs (Web Exclusive). June, 2004. http://content.healthaffairs.org/cgi/reprint/hlthaff.w4.374v1 27 For example: Berman S, et al. “Factors that Influence the Willingness of Private Primary Care Pediatricians to Accept more Medicaid Patients.” Pediatrics (2002) 110 (2): 239 – 248. Adams EK, Herring B, “Medicaid HMO Penetration and Its Mix: Did Increased Penetration Affect Physician Participation in Urban Markets?” Health Service Research (2008) 43(1): 363-383.
2006 Husky Fee Pediatric
2006 HUSKY Fee
Obstetrical
2006 HUSKY Fee Med.
Proc.
2006 Medicare
Fee
HUSKY Pediatric
fees as % of Medicare
HUSKY OB Fees as % of
Medicare
HUSKY Med. Proc as a % of Medicare
Office or other outpatient visit for the evaluation and management of new patient. 10m (99201) $34.44 $50.05 $17.87 $40.45 85.1% 123.7% 44.2%(as above) 20m (99202) $55.16 $89.06 $29.74 $71.35 77.3% 124.8% 41.7%(as above) 30m (99203) $82.42 $131.79 $46.77 $105.89 77.8% 124.5% 44.2%(as above) 45m (99204) $117.13 $187.80 $62.26 $149.28 78.5% 125.8% 41.7%(as above) 60m (99205) $148.93 $238.56 $83.51 $189.07 78.8% 126.2% 44.2%Office or other outpatient visit for the evaluation and management of new estab. Pat. 10m (99211) $22.49 $30.00 $10.12 $24.32 92.5% 123.4% 41.6%(as above) 20m (99212) $34.55 $52.26 $18.84 $42.67 81.0% 122.5% 44.2%(as above) 30m (99213) $45.10 $73.17 $24.16 $57.97 77.8% 126.2% 41.7%(as above) 45m (99214) $70.74 $114.02 $40.03 $90.65 78.0% 125.8% 44.2%(as above) 60m (99215) $103.83 $166.19 $54.59 $130.89 79.3% 127.0% 41.7%Average % change: 80.6% 125.0% 42.9%

Connecticut Voices for Children 18
Studies have also found that physicians are willing to spend more time with Medicaid patients when they are better compensated.28 In 1991, a federal advisory commission charged with making recommendations to Congress regarding reimbursement levels said that Medicaid reimbursement rates should gradually be raised up to Medicare levels.29 At the time, 43 of 50 states reported in a survey commissioned by the National Governors’ Association that they had difficulty getting doctors to provide services to Medicaid patients, with low reimbursement rates cited as the leading barrier to participation. Experts believed that if reimbursement rates were brought up to Medicare levels that access difficulties in state Medicaid programs would be relieved. More than fifteen years after this recommendation, the goal of Medicaid-Medicare parity has been met by only a handful of states, not including Connecticut (In 2007, Alaska, Wyoming and Delaware all had Medicaid-to-Medicare fee ratios of greater than 1). While the 2008 and 2009 increases in Connecticut’s fee-for-service rates are welcome, physicians still get less than 60 percent of Medicare rates for many procedures performed for Medicaid patients. In addition to rates falling short of providing Medicare parity, the recent fee-for-service rate increase will have little effect on access to care for the majority of Medicaid clients without a legislative or contractual connection between fee-for-service rates and the rates negotiated under managed care. In 1995, low-income children and families in Connecticut were switched from Medicaid fee-for-service into Medicaid managed care. The elderly, blind, and disabled remained in Medicaid fee-for-service. Under these managed care contracts, reimbursement rates were negotiated between the managed care plans and network providers without any requirement that the negotiations be guided by the fee-for-service rates set by the Department. Therefore, changes in the Medicaid fee-for-service fee schedule would have had no direct bearing on the rates paid to physicians by managed care plans. Presently, the sudden termination of Medicaid managed care contracts in Connecticut has temporarily put many children, pregnant women, and parents back into Connecticut’s fee-for-service Medicaid program. However, the Department intends to move all low-income children and families back into managed care by July 1, 2008. Under provisions of the current request for proposals, managed care organizations participating in Medicaid will be required to reimburse physicians by at least the rates set for the fee-for-service program. This requirement, combined with the requirement that the rates they pay be available for independent verification, will greatly increase the importance of fee-for-service rates for rates in the HUSKY program.
28 Decker SL. “Medicaid Physician Fees and the Quality of Medical Care of Medicaid Patients in the US” Rev Econ Household (2007) 5:95-112. 29 Pear R. “Panel Says Medicaid Should increase Doctor Payments to Medicare Level.” The New York Times, July 2, 1991. http://query.nytimes.com/gst/fullpage.html?res=9D0CE6DC1F3EF931A35754C0A967958260. Commentary on report to Congress by the Physician Payment Review Commission, on July 2, 1991.

Connecticut Voices for Children 19
CONCLUSION o For each state fiscal year 2008 and 2009, $27.3 million was appropriated for increasing physician
fees in the Medicaid program. o The new physician fee schedule went into effect January 1, 2008. Pending approval from the
Centers for Medicare and Medicaid Services, providers may also receive supplemental payment for some procedures performed between July 1, 2007 and January 1, 2008.
o The Medicaid fee-for-service physician fee schedule was revised by individual procedure, rather
than across-the-board, by taking into account Medicare allowables, historical and expected distribution of services by service type, and other factors.
o Changes to the fee schedule (unadjusted for medical inflation) varied by type of service and
patient: o Pediatric fees for well-child visits did not change, but a new policy permitting providers
to bill for developmental screening in addition to well or sick visits would increase reimbursement by 6%30 for treating clients in their first three years of life. Fees for office visits increased on average 6 percent and on average over 25 percent for vaccines and immunization administration.
o Obstetrical fees did not change in 2008. o Fees for office visits for adults and pediatric specialty care increased on average over 34
percent. o More commonly billed codes for child and adult office visits received larger fee
increases. The most commonly billed code (99213) for adult visits received an increase of 54%, and the first and second most commonly billed code for child primary care sick visits received increases of 23% and 19%, respectively.
o Medicaid fees improved in comparison to Medicare fees for Connecticut.
o Overall, pediatric rates in 2008 are at 85% of Medicare rates, up from 82% in 2006. o Obstetric fees currently exceed Medicare rates and pay at a higher rate than other
physician fees. o Fees for office visits for adults and pediatric specialty care are at 57% of Medicare rates
in 2008, up from 45% on average. o The Request for Proposals for the HUSKY Program procurement, effective July 1, 2008, sets
the Medicaid fee schedule as the minimum for provider reimbursement under managed care.
30 This percentage increase is estimated by the Department of Social Services.
Connecticut Voices for Children 20
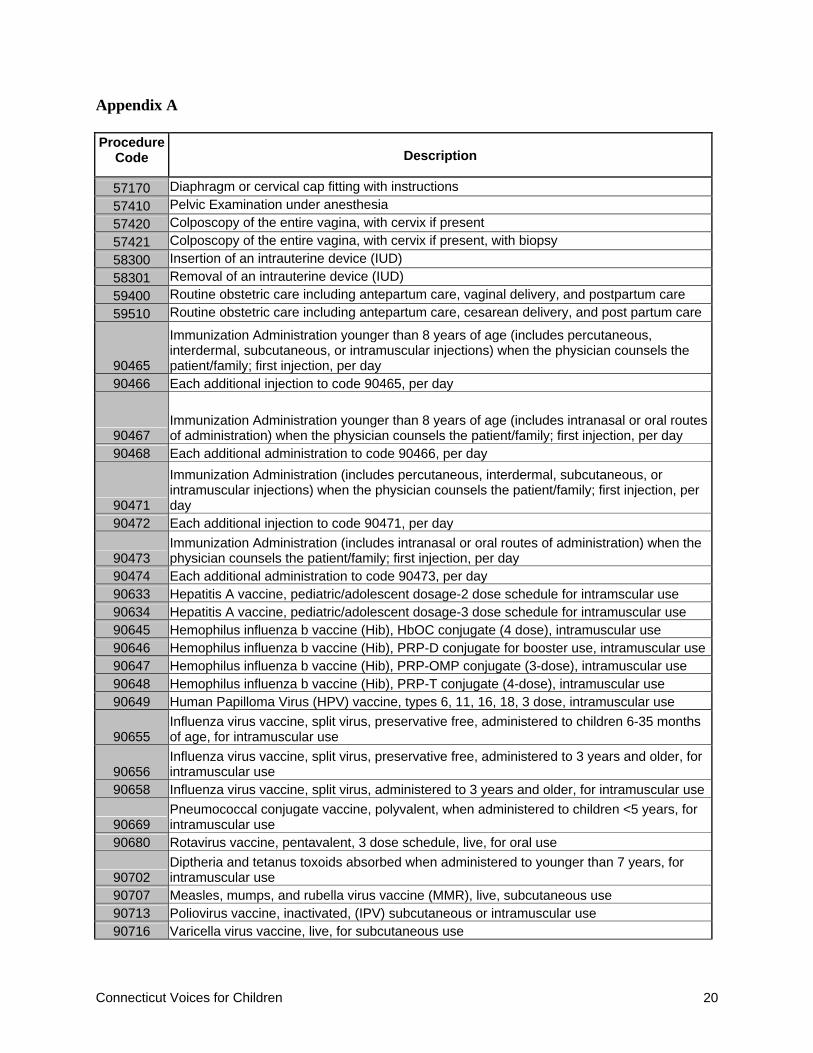
Appendix A Procedure
Code Description
57170 Diaphragm or cervical cap fitting with instructions 57410 Pelvic Examination under anesthesia 57420 Colposcopy of the entire vagina, with cervix if present 57421 Colposcopy of the entire vagina, with cervix if present, with biopsy 58300 Insertion of an intrauterine device (IUD) 58301 Removal of an intrauterine device (IUD) 59400 Routine obstetric care including antepartum care, vaginal delivery, and postpartum care 59510 Routine obstetric care including antepartum care, cesarean delivery, and post partum care
90465
Immunization Administration younger than 8 years of age (includes percutaneous, interdermal, subcutaneous, or intramuscular injections) when the physician counsels the patient/family; first injection, per day
90466 Each additional injection to code 90465, per day
90467 Immunization Administration younger than 8 years of age (includes intranasal or oral routes of administration) when the physician counsels the patient/family; first injection, per day
90468 Each additional administration to code 90466, per day
90471
Immunization Administration (includes percutaneous, interdermal, subcutaneous, or intramuscular injections) when the physician counsels the patient/family; first injection, per day
90472 Each additional injection to code 90471, per day
90473 Immunization Administration (includes intranasal or oral routes of administration) when the physician counsels the patient/family; first injection, per day
90474 Each additional administration to code 90473, per day 90633 Hepatitis A vaccine, pediatric/adolescent dosage-2 dose schedule for intramscular use 90634 Hepatitis A vaccine, pediatric/adolescent dosage-3 dose schedule for intramuscular use 90645 Hemophilus influenza b vaccine (Hib), HbOC conjugate (4 dose), intramuscular use 90646 Hemophilus influenza b vaccine (Hib), PRP-D conjugate for booster use, intramuscular use90647 Hemophilus influenza b vaccine (Hib), PRP-OMP conjugate (3-dose), intramuscular use 90648 Hemophilus influenza b vaccine (Hib), PRP-T conjugate (4-dose), intramuscular use 90649 Human Papilloma Virus (HPV) vaccine, types 6, 11, 16, 18, 3 dose, intramuscular use
90655 Influenza virus vaccine, split virus, preservative free, administered to children 6-35 months of age, for intramuscular use
90656 Influenza virus vaccine, split virus, preservative free, administered to 3 years and older, for intramuscular use
90658 Influenza virus vaccine, split virus, administered to 3 years and older, for intramuscular use
90669 Pneumococcal conjugate vaccine, polyvalent, when administered to children <5 years, for intramuscular use
90680 Rotavirus vaccine, pentavalent, 3 dose schedule, live, for oral use
90702 Diptheria and tetanus toxoids absorbed when administered to younger than 7 years, for intramuscular use
90707 Measles, mumps, and rubella virus vaccine (MMR), live, subcutaneous use 90713 Poliovirus vaccine, inactivated, (IPV) subcutaneous or intramuscular use 90716 Varicella virus vaccine, live, for subcutaneous use

Connecticut Voices for Children 21
90732 Pneumococcal polysaccharide vaccine, 23-valent, adult or immunosuppressed patient dosage, when administered to 2 years or older, for subcutaneous or intramuscular use
90733 Meningococcal polysaccharide vaccine (any group(s)), for subcutaneous use 90744 Hepatitis B vaccine, pediatric/adolescent dosage (3 dose schedule), for intramuscular use
99201
Office or other outpatient visit for the evaluation and management of new patient which requires three key components: 1) A problem focused history 2) a problem focused examination 3) straightforward medical decision making. Usually, the presenting problem(s) are self limited or minor. Usually 10 minutes face-to-face with the patient.
99202
Office or other outpatient visit for the evaluation and management of new patient which requires three key components: 1) A problem focused history 2) a problem focused examination 3) straightforward medical decision making. Usually, the presenting problem(s) are of low to moderate severity. Usually 20 minutes face-to-face with the patient.
99203
Office or other outpatient visit for the evaluation and management of new patient which requires three key components: 1) A problem focused history 2) a problem focused examination 3) straightforward medical decision making. Usually, the presenting problem(s) are of moderate severity. Usually 30 minutes face-to-face with the patient.
99204
Office or other outpatient visit for the evaluation and management of new patient which requires three key components: 1) A problem focused history 2) a problem focused examination 3) straightforward medical decision making. Usually, the presenting problem(s) are of moderate to high severity. Usually 45 minutes face-to-face with the patient.
99205
Office or other outpatient visit for the evaluation and management of new patient which requires three key components: 1) A problem focused history 2) a problem focused examination 3) straightforward medical decision making. Usually, the presenting problem(s) are of moderate to high severity. Usually 60 minutes face-to-face with the patient.
99211
Office or other outpatient visit for the evaluation and management of an established patient which requires three key components: 1) A problem focused history 2) a problem focused examination 3) straightforward medical decision making. Usually, the presenting problem(s) are of moderate severity. Usually 10 minutes face-to-face with the patient.
99212
Office or other outpatient visit for the evaluation and management of an established patient which requires three key components: 1) A problem focused history 2) a problem focused examination 3) straightforward medical decision making. Usually, the presenting problem(s) are of low to moderate severity. Usually 20 minutes face-to-face with the patient.
99213
Office or other outpatient visit for the evaluation and management of an established patient which requires three key components: 1) A problem focused history 2) a problem focused examination 3) straightforward medical decision making. Usually, the presenting problem(s) are of moderate severity. Usually 30 minutes face-to-face with the patient.
99214
Office or other outpatient visit for the evaluation and management of an established patient which requires three key components: 1) A problem focused history 2) a problem focused examination 3) straightforward medical decision making. Usually, the presenting problem(s) are of moderate to high severity. Usually 45 minutes face-to-face with the patient.
99215
Office or other outpatient visit for the evaluation and management of an established patient which requires three key components: 1) A problem focused history 2) a problem focused examination 3) straightforward medical decision making. Usually, the presenting problem(s) are of moderate to high severity. Usually 60 minutes face-to-face with the patient.

Connecticut Voices for Children 22
99381
Initial comprehensive preventive medicine evaluation and management of an individual including an age and gender appropriate history, examination, counseling/anticipatory guidance/risk factor reduction interventions, and the ordering of appropriate immunization(s) laboratory diagnostic procedures, new patient; infant (<1 year)
99382 (same as above) early childhood (1 - 4) 99383 (same as above) late childhood (5 - 11) 99384 (same as above) adolescent (12 - 17) 99385 (same as above) (18 - 39) 99386 (same as above) (40 - 64) 99387 (same as above) 65+
99391
Periodic comprehensive preventive medicine evaluation and management of an individual including an age and gender appropriate history, examination, counseling/anticipatory guidance/risk factor reduction interventions, and the ordering of appropriate immunization(s) laboratory diagnostic procedures, new patient; infant (<1 year)
99392 (same as above) early childhood (1 - 4) 99393 (same as above) late childhood (5 - 11) 99394 (same as above) adolescent (12 - 17) 99395 (same as above) (18 - 39) 99396 (same as above) (40 - 64) 99397 (same as above) 65+
99401 Preventive medicine counseling and/or risk factor reduction intervention(s) provided to an individual, approximately 15 minutes
99402 Preventive medicine counseling and/or risk factor reduction intervention(s) provided to an individual, approximately 30 minutes
99403 Preventive medicine counseling and/or risk factor reduction intervention(s) provided to an individual, approximately 45 minutes
99404 Preventive medicine counseling and/or risk factor reduction intervention(s) provided to an individual, approximately 60 minutes
99411 Preventive medicine counseling and/or risk factor reduction intervention(s) provided to individuals in a group setting, approximately 30 minutes
99412 Preventive medicine counseling and/or risk factor reduction intervention(s) provided to individuals in a group setting, approximately 60 minutes