Medicaid Eligibility Policy for Aged, Blind, and … · Medicaid Eligibility Policy for Aged,...
47
The AARP Public Policy Institute, formed in 1985, is part of the Policy and Strategy group at AARP. One of the missions of the Institute is to foster research and analysis on public issues of interest to older Americans. This publication represents part of that effort. The views expressed herein are for information, debate, and discussion, and do not necessarily represent formal policies of AARP. Copyright 2003 AARP. Reprinting with permission only AARP, 601 E Street, NW, Washington, DC 20049 www.aarp.org/ppi #2003-14 November 2003 Medicaid Eligibility Policy for Aged, Blind, and Disabled Beneficiaries by Brian K. Bruen Joshua M. Wiener Seema Thomas The Urban Institute
Transcript of Medicaid Eligibility Policy for Aged, Blind, and … · Medicaid Eligibility Policy for Aged,...

The AARP Public Policy Institute, formed in 1985, is part of the Policy and Strategy group at AARP. One of the missions of the Institute is to foster research and analysis on public issues of interest to older Americans. This publication represents part of that effort. The views expressed herein are for information, debate, and discussion, and do not necessarily represent formal policies of AARP.
Copyright 2003 AARP. Reprinting with permission only
AARP, 601 E Street, NW, Washington, DC 20049
www.aarp.org/ppi
#2003-14
November 2003
Medicaid Eligibility Policy for Aged, Blind, and Disabled Beneficiaries
by Brian K. Bruen
Joshua M. Wiener Seema Thomas
The Urban Institute
i
ACKNOWLEDGMENTS
The authors gratefully acknowledge the financial support for this research provided by AARP. Susan Raetzman and Lynda Flowers of AARP’s Public Policy Institute were the project officers and provided helpful comments throughout the research project. The authors also gratefully acknowledge Lee Partridge and Heidi Shaner of the American Public Human Services Association (APHSA)/National Association of State Medicaid Directors (NASMD) for making available to us data from the APHSA/NASMD survey of Medicaid eligibility for the aged, blind, and disabled, and for working with us to clarify and verify states’ responses to this survey. Enid Kassner, Andy Schneider, Bob Mollica, and Roy Trudel made helpful comments on an earlier draft. The opinions expressed in this paper are those of the authors and do not necessarily express the viewpoints of the Urban Institute or AARP.

ii
FOREWORD
In 2001, the Medicaid program provided critical access to health services for as
many as 12.2 million low-income aged and disabled persons. Federal law requires states to provide Medicaid for certain aged and disabled persons, primarily those who qualify for cash assistance through the Supplemental Security Income (SSI) program. However, the law also gives states a variety of options—at least seven—that may be used to provide Medicaid coverage for these populations.
This study provides a description of Medicaid eligibility policies for aged and disabled persons in 50 states and the District of Columbia. The authors’ analysis of 2001 data (compared with 1998 data) reveals a modest trend among states to exceed federal mandates by taking advantage of options to increase access to Medicaid for their most vulnerable residents. It is noteworthy that, in 2001, 18 states provided optional coverage for residents with income up to 100 percent of the federal poverty level—11 more states than in 1998—and no state reported a retrenchment from 1998 policies on those options where a comparison was possible.
Despite the higher costs associated with providing Medicaid for aged and disabled persons than younger persons on average, this study documents a strong state commitment to Medicaid access for low-income aged and disabled persons in 2001. With almost all states facing severe fiscal stress and growing Medicaid costs in 2003, it is unclear whether this trend will continue. This study provides policymakers, advocates, researchers, and state officials with an important baseline on state Medicaid eligibility policies against which future state actions should be measured.
Lynda Flowers, JD, MSN, RN Senior Policy Advisor AARP Public Policy Institute
iii
TABLE OF CONTENTS
EXECUTIVE SUMMARY ...............................................................................v
INTRODUCTION............................................................................................... 1
PURPOSE AND METHODOLOGY................................................................... 1
OVERVIEW OF MEDICAID............................................................................. 2 BASIC FEATURES OF MEDICAID ..................................................................................... 2 INCOME AND RESOURCES, STANDARDS AND METHODOLOGIES ................................... 3 A BIRD’S- EYE VIEW OF ELIGIBILITY POLICY FOR AGED, BLIND AND DISABLED PEOPLE.................................................................................................. 5
PRIMARY PATHWAYS FOR MANDATORY COVERAGE CATEGORIES................................................................................................. 7 SSI-RELATED COVERAGE .............................................................................................. 7 SECTION 209(B) OPTION ................................................................................................ 8 OTHER MANDATORY COVERAGE GROUPS .................................................................. 10
PRIMARY PATHWAYS FOR OPTIONAL COVERAGE CATEGORIES............................................................................................... 11 STATE SUPPLEMENTAL PAYMENTS.............................................................................. 12 POVERTY-RELATED COVERAGE .................................................................................. 13 MEDICALLY NEEDY PROGRAMS .................................................................................. 18
ELIGIBILITY FOR WORKING PEOPLE WITH DISABILITIES ................. 22 MANDATORY ELIGIBILITY ........................................................................................... 22 OPTIONAL ELIGIBILITY ................................................................................................ 23
ELIGIBILITY PATHWAYS FOR LONG-TERM CARE SERVICES ............. 24 ELIGIBILITY FOR INSTITUTIONAL CARE....................................................................... 24 HOME AND COMMUNITY-BASED SERVICES................................................................. 26 TRANSFER OF ASSETS AND ESTATE RECOVERY .......................................................... 30
ASSISTANCE WITH MEDICARE PREMIUMS AND COST SHARING ........................................................................................... 31
DISCUSSION.................................................................................................... 32 WHY DON’T STATES USE MORE ELIGIBILITY OPTIONS TO EXPAND COVERAGE?.................................................................................................................. 34 WHAT ACCOUNTS FOR THE COMPLEXITY OF ELIGIBILITY PATHWAYS? ..................... 35 IMPLICATIONS FOR THE FUTURE .................................................................................. 37
iv
LIST OF TABLES
TABLE 1: OVERVIEW OF COMMON MEDICAID ELIGIBILITY PATHWAYS
FOR AGED, BLIND, AND DISABLED PERSONS IN 2001 ............................. 6
TABLE 2: SUPPLEMENTAL SECURITY INCOME RELATED MEDICAID
ELIGIBILITY STANDARDS, 2001................................................................ 9
TABLE 3: MEDICAID INCOME STANDARDS IN STATES USING THE
SECTION 209(b) OPTION, 2001 ................................................................. 11
TABLE 4: MEDICAID RESOURCE STANDARDS IN STATES USING THE
SECTION 209(B) OPTION, 2001 ................................................................. 12
TABLE 5: SSP-RELATED MEDICAID COVERAGE OF AGED, BLIND,
AND DISABLED PERSONS, 2001 ................................................................ 14
TABLE 6: STATES USING THE OBRA '86 OPTION TO OFFER POVERTY-RELATED
COVERAGE TO AGED, BLIND, AND DISABLED PERSONS, 2001 ................ 16
TABLE 7: MEDICALLY NEEDY INCOME LEVELS (MNIL) AND RESOURCE
LIMITS FOR AGED, BLIND, AND DISABLED PERSONS, 2001 ..................... 19
TABLE 8: MEDICAID ELIGIBILITY STANDARDS, PERSONAL NEEDS
ALLOWANCE, AND SPOUSAL IMPOVERISHMENT RESOURCE
LIMITS FOR INSTITUTIONALIZED INDIVIDUALS, 2001 .............................. 27
TABLE 9: HOME AND COMMUNITY-BASED SERVICES WAIVERS, 2001 ................... 29
TABLE 10: LESS RESTRICTIVE INCOME AND RESOURCE METHODOLOGIES
FOR QUALIFIED MEDICARE BENEFICIARIES AND SPECIFIED
LOW-INCOME MEDICARE BENEFICIARIES, 2001 ...................................... 33
TABLE 11: MEDICAID ELIGIBILITY PATHWAYS IN MINNESOTA,
OCTOBER 2001.......................................................................................... 37
FIGURE
FIGURE 1: STANDARDS AND METHODOLOGIES: AN EXAMPLE ................................ 4
v
Executive Summary
Background Medicaid was an important source of health insurance for 12.2 million aged,
blind, and disabled people in 2001. Medicaid provides different levels of coverage based on income and assets, but in general, it is restricted to people with low incomes and limited resources. The types and amounts of income and resources that are counted make a big difference in how generous or restrictive the nominal eligibility standards are. Although federal law requires Medicaid programs to cover certain low-income aged, blind, and disabled people, states also have a variety of options that allow them to extend such coverage to aged, blind, and disabled people who do not qualify under mandatory coverage categories. The flexibility to use optional coverage categories, coupled with the ability to use flexible methods for determining the countable value of income and resources, results in Medicaid eligibility policies for aged, blind, and disabled persons that vary substantially from state to state.
Purpose The purpose of this study is to describe Medicaid eligibility policies for aged,
blind, and disabled people and to document state policy choices regarding Medicaid coverage for these populations. The primary focus is on income and resource standards and the methodologies that states use to count them.
Methods Data on state Medicaid eligibility policies for aged, blind, and disabled persons
come primarily from a survey conducted by the National Association of State Medicaid Directors between October 2001 and March 2002. All states and the District of Columbia responded to the survey. In some cases, survey responses were verified by contacting Medicaid agency personnel by telephone or e-mail. Where possible, comparisons are made to eligibility policy in 1998.
Principal Findings
• Between 1998 and 2001, states had modestly liberalized their rules to cover more of the low-income aged, blind, and disabled population.
• In most states, Supplemental Security Income (SSI) beneficiaries are automatically eligible for Medicaid. However in 2001, 11 states used the “209(b)” option, which allows them to use more restrictive income and resource standards and methodologies and definitions of disability and blindness. The same number of states used the 209(b) option in 1998.
• In 2001, 36 states and the District of Columbia provided Medicaid eligibility to some people who receive State Supplemental Payments, which are cash payments to certain SSI beneficiaries and other people with incomes too high to quality for SSI. The same number of states used this option in 1998.
• In 2001, 18 states and the District of Columbia provided Medicaid coverage to aged and disabled persons under an option that allows states to cover persons with incomes up to 100 percent of the federal poverty level. Only 11 states used this option in 1998.

vi
• In 2001, 33 states and the District of Columbia used the medically needy option to provide Medicaid coverage for aged, blind, and disabled persons. This option offers coverage to persons with incomes slightly higher than allowed under the Aid to Families with Dependent Children program or who have high medical expenses. The same number of states used this option in 1998.
• In part because long-term care is so expensive, almost all states offer Medicaid eligibility to institutionalized persons with higher incomes than are typically allowed for persons living in the community. This more liberal eligibility is accomplished primarily through use of the medically needy option or the “special needs cap,” which provides Medicaid coverage to persons with incomes up to 300 percent of the federal SSI payment level. In 2001, 39 states used the special needs cap, and 25 of these also had medically needy programs. In 38 states, the institutional eligibility rules also applied to Medicaid home and community-based services waivers.
• When one member of a married couple is institutionalized, Medicaid has special rules establishing minimum and maximum income and resource levels to protect the spouse still living in the community. These rules are designed to ensure that the community spouse is not impoverished. In 2001, 23 states allowed the community spouse to keep the maximum amount of resources permitted under federal law.
• On a mandatory basis, Medicaid provides limited benefits—for example, assistance paying the Medicare Part A and Part B premiums and Medicare cost sharing—to several categories of low-income aged, blind, and disabled people with incomes and resources too high to qualify for full Medicaid benefits. In 2001, 19 states and the District of Columbia used less restrictive definitions of income, and 20 states and the District used less restrictive definitions of resources for eligibility under some of these categories.
Conclusions Federal law gives states substantial flexibility in providing Medicaid coverage for
aged, blind, and disabled people, which results in great variation in eligibility rules across states. Medicaid coverage rules are complex, and even within a single state there can be many pathways to coverage. This complexity reflects the piecemeal evolution of Medicaid and the different roles that it plays in providing coverage to this population.
Despite cost and other barriers, as of 2001, states had expanded Medicaid coverage to a larger number of aged, blind, and disabled people than in 1998. Many states now use less restrictive income and resource methodologies, effectively lowering eligibility thresholds. In addition, in 2001, seven more states than in 1998 used the option to provide eligibility to older people with incomes up to the federal poverty level. By extending Medicaid coverage to more aged, blind, and disabled people, states can provide additional security to people who often have considerable unmet needs. Most states have numerous Medicaid coverage options that they do not use. At the same time, the current state fiscal crisis makes additional eligibility expansion unlikely in the near term and may lead to eligibility reductions in some states.

1
Introduction Medicaid is an important source of health insurance for many low-income aged,
blind, and disabled people, enrolling an estimated 12.2 million individuals in these groups in federal fiscal year 2001 (Congressional Budget Office, 2002). Although federal law requires Medicaid programs to cover certain low-income aged, blind, and disabled people—primarily recipients of the cash assistance program for the poor, the Supplemental Security Income (SSI) program—the law also gives states a variety of options that they may use to provide Medicaid assistance to populations not mandated for coverage. As a result, Medicaid eligibility policies vary substantially from state to state.
In making Medicaid eligibility decisions about whom to cover, states have to balance the needs of some of their most needy citizens with their fiscal concerns about costs and the need to raise the money necessary to finance the program. Eligibility choices are consequential for low-income aged, blind, and disabled people because they often have serious medical and disabling conditions requiring medical services that they cannot easily afford. High premiums and preexisting condition exclusions are significant barriers to private insurance coverage for persons in these groups. Lack of Medicaid coverage is also associated with substantial financial out-of-pocket burdens for low-income aged, blind, and disabled people (Gross and Brangan, 1999; Maxwell, Moon and Segal, 2001).
Medicaid eligibility choices are also consequential for states because low-income aged, blind, and disabled people are relatively expensive to cover due to their high medical needs. The Congressional Budget Office estimates that, while just 27 percent of Medicaid enrollees in 2001 were aged, blind, or disabled, these individuals accounted for 72 percent of expenditures for medical services (Congressional Budget Office, 2002). Long-term care services, particularly nursing facilities, are significant contributors to these expenditures. Medicaid programs spent $82.9 billion on long-term care in 2001 (almost all of which is provided to aged, blind, and disabled beneficiaries), including $53.3 billion paid to nursing facilities and intermediate care facilities for the mentally retarded (ICF/MRs) for services provided to beneficiaries of all ages.1 Other significant expenditures for aged, blind, and disabled enrollees include inpatient hospital care and prescribed drugs.2 One way in which states limit their Medicaid financial exposure for these services is by limiting Medicaid eligibility for aged, blind, and disabled people.
Purpose and Methodology The purpose of this study is to clarify current Medicaid eligibility policy for aged,
blind, and disabled people by documenting the features of individual state programs in 2001 and identifying potential implications for state policy. The primary focus is on income and resource standards for the most common ways that aged, blind, and disabled
1 Unpublished Urban Institute estimates based on data from Centers for Medicare and Medicaid Services (Form 64) and state reports. 2 Inpatient hospital services account for a relatively large share of spending for blind and disabled enrollees. Aged Medicaid beneficiaries do not account for a large proportion of hospital expenditures because most of these beneficiaries have Medicare coverage.

2
people qualify for Medicaid, and on the relative restrictiveness of states’ methodologies used to count income and resources. The study also identifies changes in Medicaid eligibility for these populations by comparing its results, where possible, with those of a similar study conducted in 1998 (Bruen, et al., 1999).
The vast majority of the eligibility information in this study comes from state summary documents on aged, blind, and disabled Medicaid eligibility policies made available by the National Association of State Medicaid Directors (NASMD), an affiliate of the American Public Human Services Association (APHSA). The summaries are based on a state survey conducted by NASMD between October 2001 and March 2002 to identify the various eligibility choices made by states for these populations as of October 2001.3 All state responses were verified.
The state health policy landscape has changed as a result of the recent economic downturn. The data presented here reflect state Medicaid eligibility policies before the full impact of the economic downturn and the resultant fiscal crisis was fully realized in most states, and a few states may have reduced Medicaid eligibility since the survey.
Overview of Medicaid Basic Features of Medicaid
Medicaid is a federal-state health and long-term care financing program for low- income populations. It is a means-tested, open-ended entitlement program, jointly financed by federal and state governments and administered by the states. While the federal government sets minimum standards, states have a number of options for implementing the program. Consequently, Medicaid actually encompasses 56 separate programs (one in each state, the District of Columbia, four U.S. territories, and the Commonwealth of Puerto Rico).4 Federal financial assistance is provided to states for coverage of specific categories of people and services through federal matching payments that are based on each state’s per capita income. States with lower per capita income have higher federal matching rates. In 2001, Medicaid enrolled an estimated 44.5 million people—more than one in seven Americans—and spent a total of $227.6 billion in state and federal funds.5
Medicaid covers a very broad range of services with nominal cost sharing, which reflects the low income of the covered population. Mandatory services include inpatient and outpatient hospital services; physician, midwife, and certified nurse practitioner services; laboratory and x-ray services; nursing home and home health care; early and periodic screening, diagnosis, and treatment (EPSDT) for children under age 21; family
3 The individual state summaries are available on the NASMD Web site: http://www.nasmd.org. All 50 states and the District of Columbia responded to the survey. In addition to verifying all responses, in cases where the summary documents were unclear or were missing information, either the individual in the state Medicaid agency who responded to the NASMD survey or other eligibility experts in the state were contacted. 4 The U.S. territories (American Samoa, Guam, Northern Mariana Islands, and U.S. Virgin Islands) and the Commonwealth of Puerto Rico are not included in this analysis. 5 Enrollment estimates from Congressional Budget Office; expenditure estimates from the Urban Institute (unpublished) are based on data from the Centers for Medicare and Medicaid Services (Form 64).
3
planning; and rural health clinics and qualified health centers. In addition, states have the option to cover a very wide range of optional services, including prescription drugs, clinic services, prosthetic devices, hearing aids, dental care, intermediate care facilities for the mentally retarded (ICF/MRs), and numerous nonmedical home and community-based services. Unlike Medicare, Medicaid is a major source of financing for long-term care.
Medicaid provides coverage only to certain categories of low-income people, such as children, parents, pregnant women, older people, people with disabilities, and people who are blind. In general, nondisabled, childless adults are not eligible for Medicaid, regardless of their income and asset levels or their medical needs. Especially since the welfare reforms of 1996, Medicaid coverage is no longer automatic for families who receive cash assistance.
Even if they meet all other eligibility requirements, individuals may be barred from Medicaid coverage based on their immigration status. Illegal immigrants cannot qualify for regular Medicaid benefits, although they are eligible for coverage of emergency services. Most immigrants entering the country legally on or after August 22, 1996, are ineligible for nonemergency Medicaid eligibility for five years after their date of entry. An exception to this five-year bar is persons who are receiving SSI on the basis of disability or age.6
Income and Resources, Standards and Methodologies
Medicaid is a means-tested program, under which people qualify for assistance on the basis of financial need. Eligibility is subject to an extensive set of requirements that include income and financial resource (i.e., asset) criteria. These tests consist of two parts: the standard and the methodology. The standard is the dollar amount below which an individual or family qualifies for coverage. For example, an income standard might be $716 per month (100 percent of the FPL for an individual in 2001), while the resource or asset standards for older and younger people with disabilities generally are $2,000 for individuals and $3,000 for couples.
The methodology is the way income or assets are counted for purposes of applying the standard. For example, states must disregard (that is, not count) some types or amounts of income—such as $20 of unearned income from any source or one-half of earned income—and they have the option to disregard additional amounts. They must also exclude some or all of the value of certain assets—for example, homes and vehicles up to a certain value—when calculating total resources. Under section 1902(r)(2) of the Social Security Act, states may use “less restrictive” income and resource methodologies than those used by SSI (Centers for Medicare and Medicaid Services, 2001). This section was added to the law to give states greater flexibility to liberalize their eligibility standards. Depending on the methodology used, the effective income and resource standards for Medicaid eligibility can be quite different from stated levels (Figure1).
6 There are various exceptions to these general observations concerning eligibility for immigrants. See Wendy Zimmerman and Karen C. Tumlin, Patchwork Policies: State Assistance for Immigrants under Welfare Reform, Assessing the New Federalism Occasional Paper Number 24 (Washington, D.C.: The Urban Institute, May 1999).

4
Figure 1
Standards and Methodologies: An Example The methodologies used to count income and resources for the purpose of determining Medicaid eligibility can result in effective income and resource limits that are noticeably different from statutory standards. For example, consider the standards and methodologies used in Mississippi. As required by federal law, Mississippi’s Medicaid program covers all SSI recipients and certain smaller, SSI-related groups. In addition, Mississippi uses an option that allows that state to cover certain aged or disabled adults who have incomes above those requiring mandatory coverage, but below the federal poverty level (FPL). This option is commonly called “poverty-related” eligibility.
Federal law limits poverty-related eligibility to people age 65 and older and younger people with disabilities who have incomes up to 100 percent of the FPL, with the same resource standards used in SSI. However, under section 1902(r)(2) of the Social Security Act, states are allowed to use “less restrictive” methodologies to determine income and resources.a Mississippi takes advantage of this flexibility to raise its income and resource standards for this group well above nominal statutory levels.
When determining eligibility for poverty-related Medicaid coverage, Mississippi disregards income between 100 and 135 percent of the FPL and also excludes $50 of income rather than the standard $20. This methodology effectively raises the state’s income standard for poverty-related coverage to 135 percent of the FPL.
Mississippi also uses the flexibility allowed in section 1902(r)(2) to set resource standards for poverty-related eligibility ($4,000 for an individual and $6,000 for a couple) that are twice the comparable resource standards used to determine eligibility for SSI ($2,000 and $3,000, respectively). In addition, Mississippi’s survey response noted that the state applies the following “less restrictive” resource methodologies for this group:b
• Income-producing property with a net annual return of 6 percent of equity value is not counted, with no maximum value applied. (SSI does not count the applicant’s home or the land it is on, or most other land or personal property that is owned and used for work. However, SSI may count other property—such as land, real estate, or equipment—that the applicant rents to someone else.)
• The unlimited value of up to two vehicles is excluded (SSI rules partially or totally exclude the value of only one vehicle.)
• Personal property that is worth up to $5,000 is excluded, and household goods are totally excluded (SSI rules allow the exclusion of household goods and personal property valued at $2,000 or less.)
• Revocable burial funds up to $6,000 are excluded and irrevocable burial funds are excluded with no limit on value (SSI rules allow the exclusion of burial funds up to $1,500.)
• Life insurance up to $10,000 in face value is excluded (SSI rules allow the exclusion of life insurance policies with a combined face value of $1,500 or less).
_____________________
a) 42 U.S.C. 1396(a)(r)(2)
b) The methodologies listed as “less restrictive” in Mississippi are those identified as such by the state in the APHSA/NASMD survey. The comparable SSI methodologies were obtained from the following source:
Social Security Administration (no date). “Understanding Supplemental Security Income.” Retrieved May 2, 2002 from the Social Security Online, SSA Program Rules Web site: http://www.ssa.gov/notices/supplemental-security-income/text-understanding-ssi.htm

5
A Bird’s-Eye View of Eligibility Policy for Aged, Blind, and Disabled People
The type of coverage that older people and people with disabilities receive from Medicaid varies, depending on their financial status and eligibility for Medicare. Low-income aged, blind, and disabled people, even those not eligible for Medicare, often receive a full range of acute and long-term care benefits through Medicaid. Low-income persons who are eligible for both programs may receive assistance from Medicaid with Medicare’s out-of-pocket expenses as well as coverage for some services that Medicare does not provide, including prescription drugs, nursing facility care beyond Medicare’s 100-day limit, and other long-term care services. Some low-income Medicare beneficiaries who are not eligible for full Medicaid benefits are eligible to receive Medicaid assistance with Medicare premiums and possibly cost-sharing expenses. Thus, Medicaid helps to fill in gaps left by Medicare and private insurance.
Although states must provide Medicaid coverage for certain groups of low-income aged, blind, and disabled people, states have numerous options to cover additional groups. Medicaid eligibility requirements and options are briefly summarized in Table 1.
Medicaid eligibility for older people and people with disabilities is tightly connected to eligibility for the SSI program, and many of the Medicaid eligibility rules pertaining to these populations are derived from rules for the SSI program. For example, except for aged, blind, and disabled people in 209(b) states,7 federal law requires Medicaid programs to cover elderly, blind, and disabled people receiving cash assistance from the SSI program, as well as certain persons who lose SSI payments because of earnings from work or increased Social Security benefits.8 Federal law also requires Medicaid programs to pay some or all of Medicare’s out-of-pocket expenses—including Medicare Part A or Part B premiums, deductibles and coinsurance—for Medicare beneficiaries with incomes up to 120 percent of the FPL; these provisions are known as “Medicare savings programs.”9
States can also receive federal matching funds for certain optional populations:
• Recipients of state supplemental payments to SSI.
• Certain aged, blind, or disabled adults who have incomes above those requiring mandatory coverage, but below the FPL. This pathway is often referred to as “poverty-level” coverage.
• Individuals who have incomes slightly above the SSI level or who have substantial medical expenses. This pathway is commonly referred to as “medically needy” coverage.
• Institutionalized people with income and resources below specified limits.
7 Federal law [42 U.S.C. 1396a(f)] gives states the option to use eligibility criteria that may be more restrictive than SSI, but only if those rules were in effect when SSI was enacted in 1972. 8 42 U.S.C. 1396a(a)(10)(A)(i)(II); 42 U.S.C. 1396v(a)(2). 9 42 U.S.C. 1396a(a)(10)(E)(i) and 1396a(a)(10)(E)(iii). States are required to pay only premiums (not deductibles and coinsurance) for individuals between 100 and 120 percent of the FPL.

6
Table 1 Overview of Common Medicaid Eligibility Pathways for Aged, Blind, and Disabled Persons in 2001
Eligibility Criteria
Mandatory Coverage Income Test Resource Test SSI Recipientsa ≤ $530/mo. for individual, ≤ $796/mo. for
couple; earnings may not exceed $740/mo. ≤ $2,000 for individual, ≤ $3,000 for couple
Individuals in 209(b) states State sets income standard; individuals may spend down to qualify by deducting incurred medical expenses from income.
State sets resource standard; individuals may not “spend down” (dispose of resources) to qualify.
Certain individuals who lose SSIb Would meet SSI standard but for increases in other public benefits.
Same as SSI.
Qualified severely impaired individuals But for earnings, income under SSI; earnings may not exceed state-specific thresholds.c
Same as SSI.
Eligibility Criteria Optional Coverage Income Test Resource Test Medically needyd State sets income standard; individuals may
spend down to qualify by deducting incurred medical expenses from income.
State sets resource standard no more restrictive than SSI test; individuals may not "spend down" to eligibility by deducting incurred medical expenses from resources.
Individuals receiving state supplemental paymentsd
State sets income standard. Same as SSI.
Poverty-level individuals age 65 or olderd
Up to 100% of FPL ($716/mo. for an individual, $968/mo. for a couple in 2001).
Same as SSI.
Institutionalized individuals under special income level
Income standard no higher than 300% of SSI benefit ($1,590/mo. in 2001).
Same as SSI.
Individuals receiving home and community-based services
Would be eligible if institutionalized (though not all states apply the special income rule to home and community-based services).
Would be eligible if institutionalized.
Working disabled under 250 percent of poverty, BBA rulesd
But for earnings, would be eligible as qualified severely impaired individuals; family income ≤ 250% of FPL ($1,790/mo. for an individual in 2001). All earned income from the beneficiary is disregarded.
Same as SSI.
Working disabled, TWWIIA rulesd But for earnings, would be eligible as qualified severely impaired individuals; The state sets the income standard.
Any resource level chosen by the state.
Eligibility Criteria Partial Coverage for Medicare Beneficiaries Income Test Resource Test Assistance with Medicare premiums and cost-sharing
Standards range from ≤ 100% of FPL to 135% of FPL for most beneficiaries; ≤ 200% of FPL for Qualified Disabled Working Individuals
≤ $4,000 for individual, ≤ $6,000 for couple
Source: Andy Schneider (July 2002). The Medicaid Source Book (Washington, D.C.: The Kaiser Commission on Medicaid and the Uninsured). Note: BBA = Balanced Budget Act of 1997; FPL = federal poverty level; SSI = Supplemental Security Income; TWWIIA = Ticket to Work and Work Incentives Improvement Act of 1999. a) Federal SSI income standard in 2001. Does not include $20 per month income disregard. b) This category includes individuals who lose SSI due to Social Security cost-of-living increases; disabled widows and widowers who lost SSI due to an increase in disability benefits from the Social Security Amendments of 1983 (P.L. 98-21); and individuals who would lose SSI as a result of receiving child’s, early widow’s, or early widower’s benefits under Social Security. c) The Social Security Administration publishes state-specific income thresholds above which these individuals are no longer eligible for Medicaid because it is assumed that they can buy “reasonably equivalent” coverage. These thresholds ranged from $14,690 in Arizona to $35,209 in Alaska in 2001. d) Section 1902(r)(2) of the Social Security Act allows states to use "less restrictive" income and resource methodologies for these pathways.
7
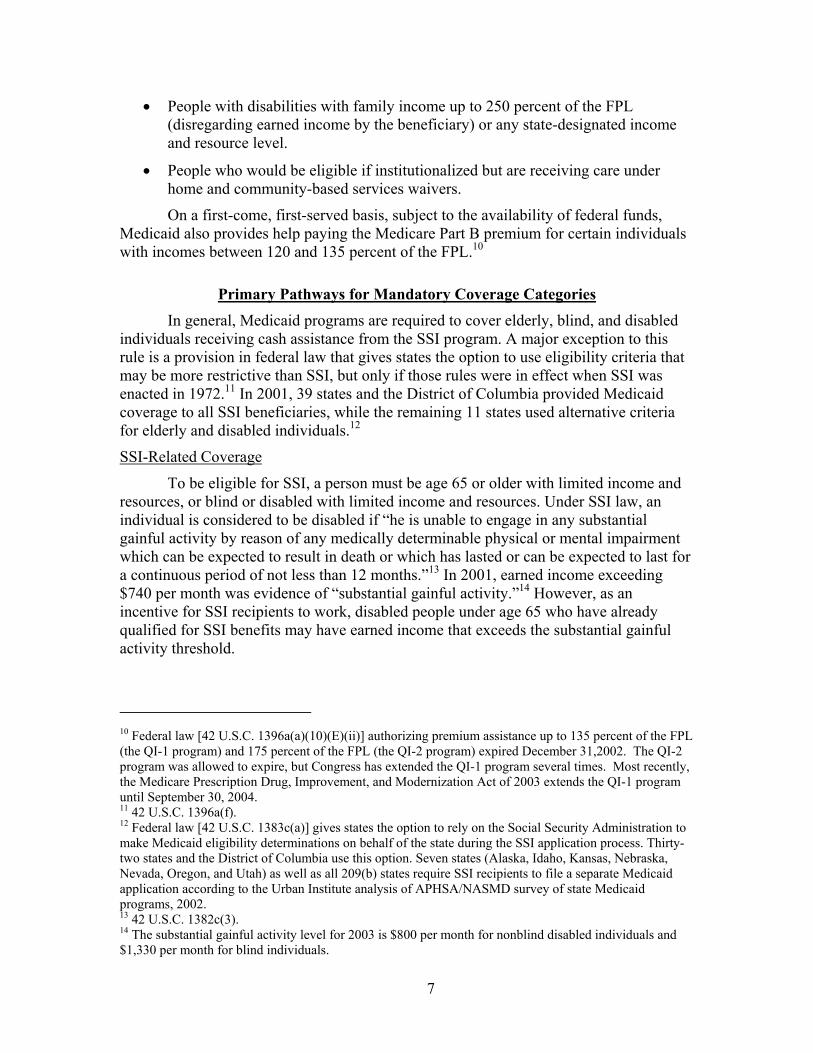
• People with disabilities with family income up to 250 percent of the FPL (disregarding earned income by the beneficiary) or any state-designated income and resource level.
• People who would be eligible if institutionalized but are receiving care under home and community-based services waivers.
On a first-come, first-served basis, subject to the availability of federal funds, Medicaid also provides help paying the Medicare Part B premium for certain individuals with incomes between 120 and 135 percent of the FPL.10
Primary Pathways for Mandatory Coverage Categories In general, Medicaid programs are required to cover elderly, blind, and disabled
individuals receiving cash assistance from the SSI program. A major exception to this rule is a provision in federal law that gives states the option to use eligibility criteria that may be more restrictive than SSI, but only if those rules were in effect when SSI was enacted in 1972.11 In 2001, 39 states and the District of Columbia provided Medicaid coverage to all SSI beneficiaries, while the remaining 11 states used alternative criteria for elderly and disabled individuals.12
SSI-Related Coverage
To be eligible for SSI, a person must be age 65 or older with limited income and resources, or blind or disabled with limited income and resources. Under SSI law, an individual is considered to be disabled if “he is unable to engage in any substantial gainful activity by reason of any medically determinable physical or mental impairment which can be expected to result in death or which has lasted or can be expected to last for a continuous period of not less than 12 months.”13 In 2001, earned income exceeding $740 per month was evidence of “substantial gainful activity.”14 However, as an incentive for SSI recipients to work, disabled people under age 65 who have already qualified for SSI benefits may have earned income that exceeds the substantial gainful activity threshold.
10 Federal law [42 U.S.C. 1396a(a)(10)(E)(ii)] authorizing premium assistance up to 135 percent of the FPL (the QI-1 program) and 175 percent of the FPL (the QI-2 program) expired December 31,2002. The QI-2 program was allowed to expire, but Congress has extended the QI-1 program several times. Most recently, the Medicare Prescription Drug, Improvement, and Modernization Act of 2003 extends the QI-1 program until September 30, 2004. 11 42 U.S.C. 1396a(f). 12 Federal law [42 U.S.C. 1383c(a)] gives states the option to rely on the Social Security Administration to make Medicaid eligibility determinations on behalf of the state during the SSI application process. Thirty-two states and the District of Columbia use this option. Seven states (Alaska, Idaho, Kansas, Nebraska, Nevada, Oregon, and Utah) as well as all 209(b) states require SSI recipients to file a separate Medicaid application according to the Urban Institute analysis of APHSA/NASMD survey of state Medicaid programs, 2002. 13 42 U.S.C. 1382c(3). 14 The substantial gainful activity level for 2003 is $800 per month for nonblind disabled individuals and $1,330 per month for blind individuals.

8
People who are age 65 and older, blind people, and younger people who meet the SSI disability requirements are eligible to receive SSI benefits if their “countable” income (which can include earned and unearned income) falls below maximum SSI benefit levels. In 2001, these benefit levels were $530 per month for individuals and $796 per month for couples.15 Actual income levels up to which people are eligible to receive SSI benefits are higher than the maximum benefit levels because some income is not “countable.” In determining eligibility for SSI, the Social Security Administration disregards $20 of income per month from any source, $65 per month of earned income plus one-half of remaining earnings, and certain other public benefits such as food stamps and home energy or housing assistance. As a result, the maximum monthly income levels at which people without earned income qualify to receive SSI are slightly higher than maximum benefit levels (Table 2).
SSI eligibility extends farther up the income scale for people with earned income. For people age 65 and older with wage earnings, income levels at which they are eligible to receive SSI benefits can be more than double the maximum benefit level.16 People under age 65 must have wage earnings below the substantial gainful activity level to be initially considered disabled for SSI purposes. However, once determined to be eligible, they may increase their earnings up to the amounts shown in the bottom row of Table 2 and still receive SSI benefits.
The SSI program also limits the amount of countable resources that beneficiaries may have in order to qualify. Resource limits for SSI eligibility, which have not increased since the mid-1980s, are $2,000 for individuals and $3,000 for couples. These limits generally apply to “liquid assets” such as stocks and bonds, mutual funds, and money in bank accounts; they exclude (in entirety or up to a limit) the value of assets such as homes, cars, burial plots or funds, personal effects, and the cash surrender value of life insurance.17
Section 209(b) Option
The Social Security Act Amendments of 1972 established an exception to the general rule that states must provide Medicaid coverage to all SSI beneficiaries.18 Section 209(b) of this law allows states to use their 1972 state assistance rules for the Aid to the Aged, Blind, and Disabled program to determine Medicaid eligibility for elderly, blind, and disabled people. The purpose of this option was to protect states from the costs associated with a potentially large increase in the number of aged, blind, and disabled medical assistance beneficiaries that might have occurred when the nationally uniform and more generous SSI program replaced state-run income support programs for these populations. States choosing the 209(b) option generally use at least one income standard,
15 The maximum monthly SSI benefit payment is $552 for individuals and $829 for couples in 2003. 16 Relatively few SSI recipients have other sources of income, especially earned. In 2000, 36 percent of SSI recipients also received Social Security, 12 percent had other unearned income, and less than 5 percent had earned income. Committee on Ways and Means, U.S. House of Representatives, 2000 Green Book (Washington, D.C.: U.S. Government Printing Office, October 2000): Table 3-15. 17 20 CFR 416.1201 to 416.1266 (Subpart L). 18 Section 209 (b) of P.L. 92-603.
9
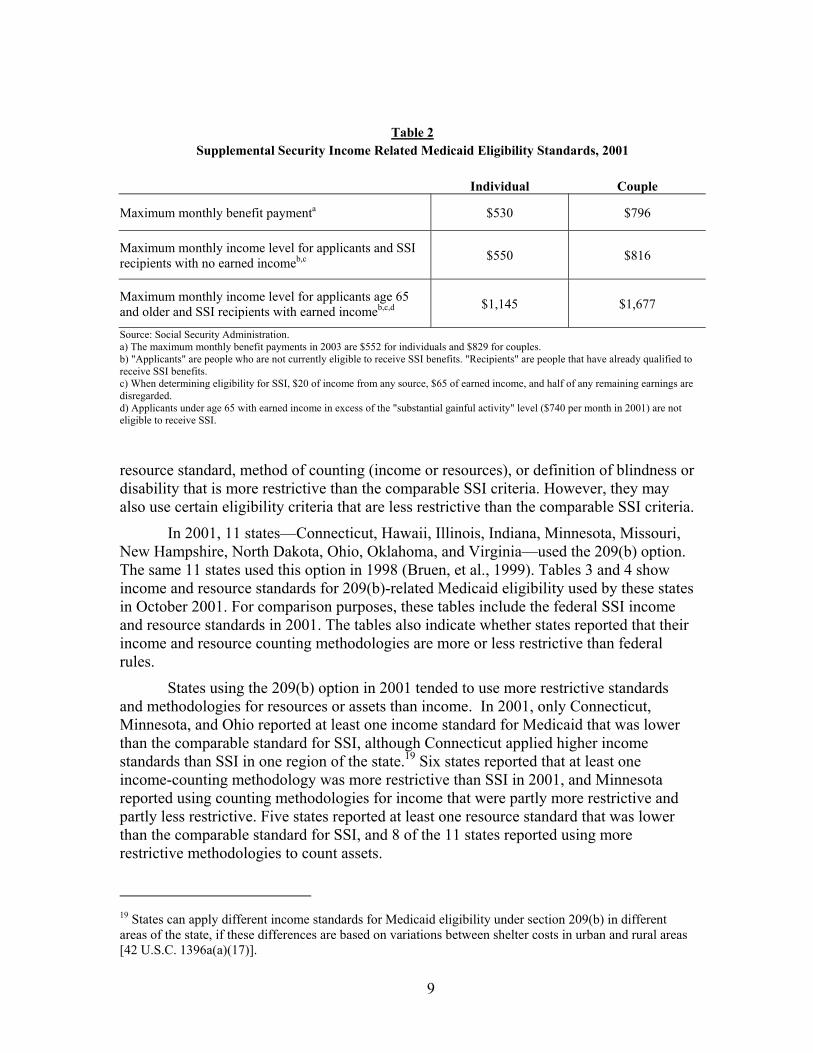
Table 2 Supplemental Security Income Related Medicaid Eligibility Standards, 2001
Individual Couple
Maximum monthly benefit paymenta $530 $796
Maximum monthly income level for applicants and SSI recipients with no earned incomeb,c $550 $816
Maximum monthly income level for applicants age 65 and older and SSI recipients with earned incomeb,c,d $1,145 $1,677
Source: Social Security Administration. a) The maximum monthly benefit payments in 2003 are $552 for individuals and $829 for couples. b) "Applicants" are people who are not currently eligible to receive SSI benefits. "Recipients" are people that have already qualified to receive SSI benefits. c) When determining eligibility for SSI, $20 of income from any source, $65 of earned income, and half of any remaining earnings are disregarded. d) Applicants under age 65 with earned income in excess of the "substantial gainful activity" level ($740 per month in 2001) are not eligible to receive SSI.
resource standard, method of counting (income or resources), or definition of blindness or disability that is more restrictive than the comparable SSI criteria. However, they may also use certain eligibility criteria that are less restrictive than the comparable SSI criteria.
In 2001, 11 states—Connecticut, Hawaii, Illinois, Indiana, Minnesota, Missouri, New Hampshire, North Dakota, Ohio, Oklahoma, and Virginia—used the 209(b) option. The same 11 states used this option in 1998 (Bruen, et al., 1999). Tables 3 and 4 show income and resource standards for 209(b)-related Medicaid eligibility used by these states in October 2001. For comparison purposes, these tables include the federal SSI income and resource standards in 2001. The tables also indicate whether states reported that their income and resource counting methodologies are more or less restrictive than federal rules.
States using the 209(b) option in 2001 tended to use more restrictive standards and methodologies for resources or assets than income. In 2001, only Connecticut, Minnesota, and Ohio reported at least one income standard for Medicaid that was lower than the comparable standard for SSI, although Connecticut applied higher income standards than SSI in one region of the state.19 Six states reported that at least one income-counting methodology was more restrictive than SSI in 2001, and Minnesota reported using counting methodologies for income that were partly more restrictive and partly less restrictive. Five states reported at least one resource standard that was lower than the comparable standard for SSI, and 8 of the 11 states reported using more restrictive methodologies to count assets.
19 States can apply different income standards for Medicaid eligibility under section 209(b) in different areas of the state, if these differences are based on variations between shelter costs in urban and rural areas [42 U.S.C. 1396a(a)(17)].

10
As a condition of electing to use more restrictive eligibility criteria, states using the section 209(b) option must allow applicants to qualify for Medicaid by “spending down” or depleting their incomes by paying for medical care.20 This requirement makes it possible for applicants with income that is too high to qualify for Medicaid, but who have significant medical expenses, to become eligible by deducting incurred medical expenses from their income. This process is sometimes referred to as “209(b) spend-down.” In 209(b) states that do not also offer a medically needy program—another option discussed later in this study—the income standards shown in Table 3 apply to all persons who met the section 209(b) eligibility criteria in 2001, with or without spend down.21 Spend down requirements are more complicated when a 209(b) state also offers medically needy coverage to the populations for which section 209(b) spend down is required. In these states, people who are receiving SSI or who are deemed to be receiving SSI can qualify for Medicaid by spending down to the 209(b) income standards shown in Table 3.22 Other people must spend down to the income and resource standards used in the state’s medically needy program. Medicaid resource standards in section 209(b) states are listed in Table 4.
Other Mandatory Coverage Groups
In addition to people who qualify through SSI or section 209(b) standards, states are required to extend Medicaid coverage to people who lose cash assistance but retain Medicaid eligibility because of special protections in federal law, including the following individuals:
• People who lose SSI (or coverage under section 209(b) in states using this option) because of increased Social Security benefits after a cost-of-living adjustment (COLA). This provision is sometimes referred to as the “Pickle Amendment.”23
• Disabled widows and widowers who lost SSI as a result of 1983 Social Security benefit increases. These people had to apply for Medicaid prior to July 1, 1988.24
• People who would qualify for SSI on the basis of disability or blindness but lose SSI due to receipt of early Social Security widow’s or widower’s benefits. These people are eligible for Medicaid until they qualify for Medicare.25
• Disabled adult children who lose SSI eligibility due to receipt (or increase) of Social Security children’s benefits.26
20 42 U.S.C. 1396a(f). 21 States choosing the medically needy option allow people to qualify for Medicaid by depleting their income and resources to specified levels; see “Medically Needy Programs” under “Optional Coverage” later in this paper. 22 42 U.S.C. 1396a(f). Persons deemed to be receiving SSI include those who are eligible for SSI but are not receiving payments, as well as certain people receiving state supplemental payments. 23 P.L. 94-566, section 503. 24 42 U.S.C. 1383c(b). 25 42 U.S.C. 1383c(d). 26 42 U.S.C. 1383c(c). “Disabled adult children” are people who are at least 18 years old who (1) began to receive SSI due to blindness or disability prior to age 22 and (2) are entitled to Social Security child’s benefits due to disability.
11
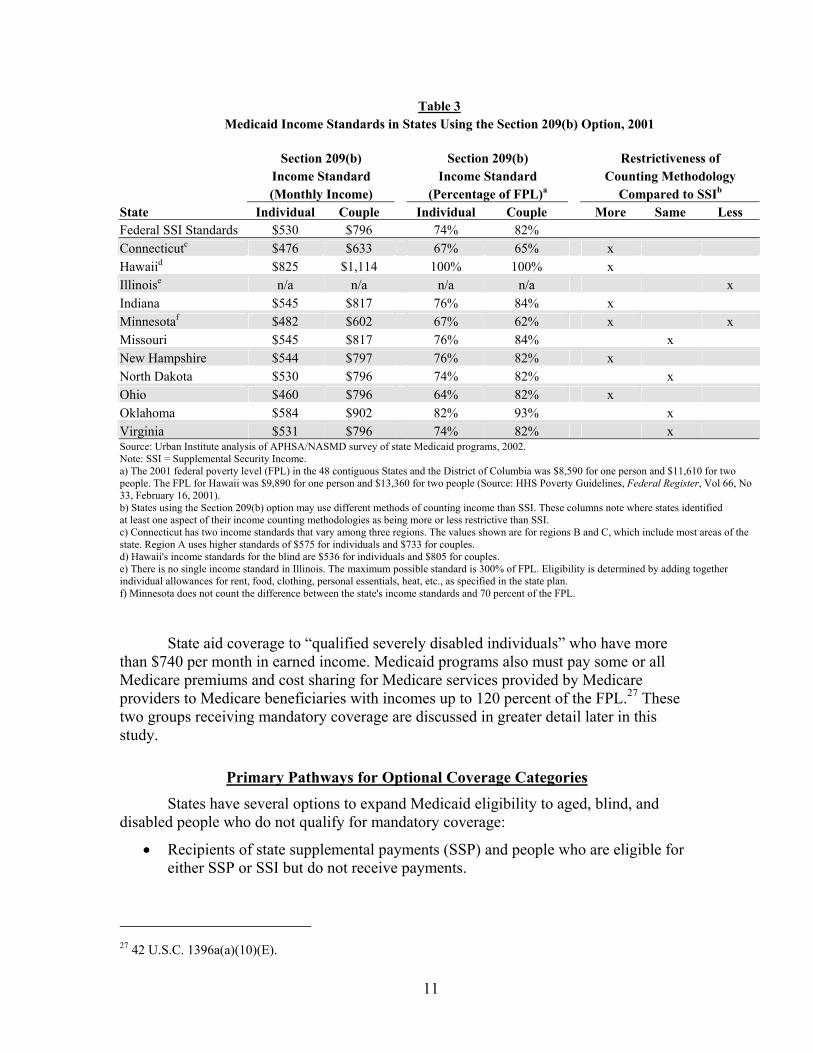
Table 3 Medicaid Income Standards in States Using the Section 209(b) Option, 2001
Section 209(b) Section 209(b) Restrictiveness of Income Standard Income Standard Counting Methodology (Monthly Income) (Percentage of FPL)a Compared to SSIb State Individual Couple Individual Couple More Same Less Federal SSI Standards $530 $796 74% 82% Connecticutc $476 $633 67% 65% x Hawaiid $825 $1,114 100% 100% x Illinoise n/a n/a n/a n/a x Indiana $545 $817 76% 84% x Minnesotaf $482 $602 67% 62% x x Missouri $545 $817 76% 84% x New Hampshire $544 $797 76% 82% x North Dakota $530 $796 74% 82% x Ohio $460 $796 64% 82% x Oklahoma $584 $902 82% 93% x Virginia $531 $796 74% 82% x Source: Urban Institute analysis of APHSA/NASMD survey of state Medicaid programs, 2002. Note: SSI = Supplemental Security Income. a) The 2001 federal poverty level (FPL) in the 48 contiguous States and the District of Columbia was $8,590 for one person and $11,610 for two people. The FPL for Hawaii was $9,890 for one person and $13,360 for two people (Source: HHS Poverty Guidelines, Federal Register, Vol 66, No 33, February 16, 2001). b) States using the Section 209(b) option may use different methods of counting income than SSI. These columns note where states identified at least one aspect of their income counting methodologies as being more or less restrictive than SSI. c) Connecticut has two income standards that vary among three regions. The values shown are for regions B and C, which include most areas of the state. Region A uses higher standards of $575 for individuals and $733 for couples. d) Hawaii's income standards for the blind are $536 for individuals and $805 for couples. e) There is no single income standard in Illinois. The maximum possible standard is 300% of FPL. Eligibility is determined by adding together individual allowances for rent, food, clothing, personal essentials, heat, etc., as specified in the state plan. f) Minnesota does not count the difference between the state's income standards and 70 percent of the FPL.
State aid coverage to “qualified severely disabled individuals” who have more than $740 per month in earned income. Medicaid programs also must pay some or all Medicare premiums and cost sharing for Medicare services provided by Medicare providers to Medicare beneficiaries with incomes up to 120 percent of the FPL.27 These two groups receiving mandatory coverage are discussed in greater detail later in this study.
Primary Pathways for Optional Coverage Categories States have several options to expand Medicaid eligibility to aged, blind, and
disabled people who do not qualify for mandatory coverage:
• Recipients of state supplemental payments (SSP) and people who are eligible for either SSP or SSI but do not receive payments.
27 42 U.S.C. 1396a(a)(10)(E).
12
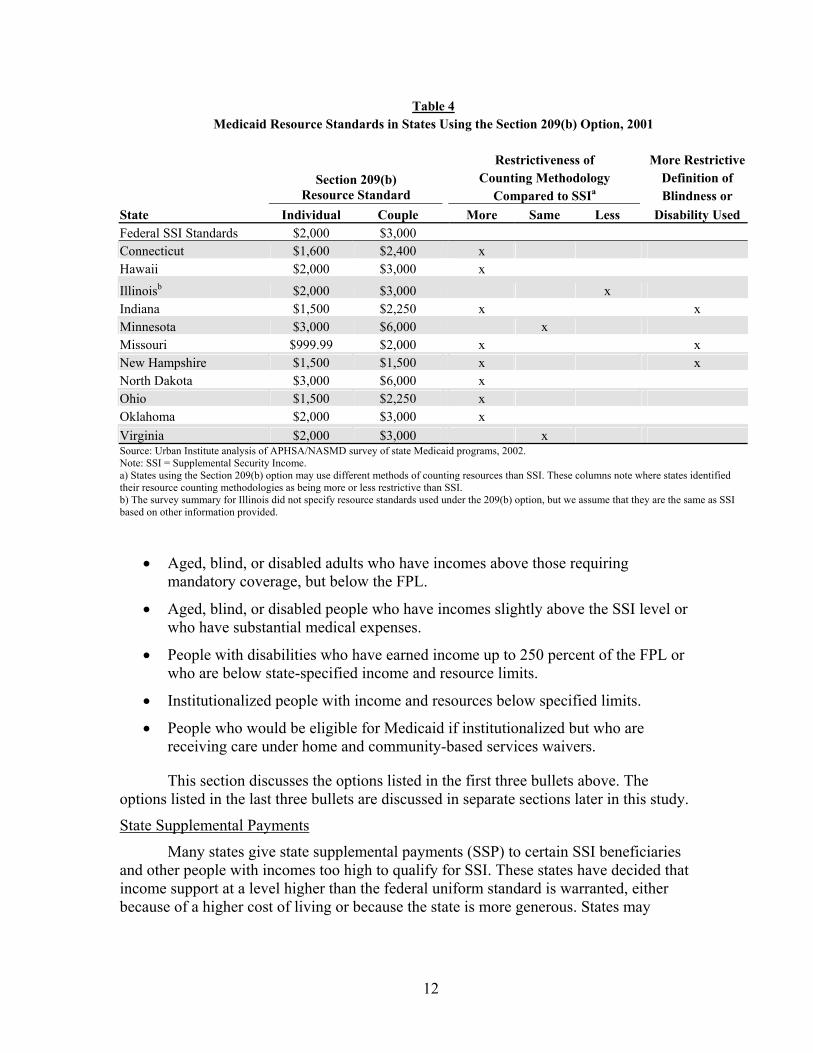
Table 4 Medicaid Resource Standards in States Using the Section 209(b) Option, 2001
Restrictiveness of More Restrictive Counting Methodology Definition of
Section 209(b) Resource Standard Compared to SSIa Blindness or
State Individual Couple More Same Less Disability Used Federal SSI Standards $2,000 $3,000 Connecticut $1,600 $2,400 x Hawaii $2,000 $3,000 x
Illinoisb $2,000 $3,000 x Indiana $1,500 $2,250 x x Minnesota $3,000 $6,000 x Missouri $999.99 $2,000 x x New Hampshire $1,500 $1,500 x x North Dakota $3,000 $6,000 x Ohio $1,500 $2,250 x Oklahoma $2,000 $3,000 x Virginia $2,000 $3,000 x Source: Urban Institute analysis of APHSA/NASMD survey of state Medicaid programs, 2002. Note: SSI = Supplemental Security Income. a) States using the Section 209(b) option may use different methods of counting resources than SSI. These columns note where states identified their resource counting methodologies as being more or less restrictive than SSI. b) The survey summary for Illinois did not specify resource standards used under the 209(b) option, but we assume that they are the same as SSI based on other information provided.
• Aged, blind, or disabled adults who have incomes above those requiring mandatory coverage, but below the FPL.
• Aged, blind, or disabled people who have incomes slightly above the SSI level or who have substantial medical expenses.
• People with disabilities who have earned income up to 250 percent of the FPL or who are below state-specified income and resource limits.
• Institutionalized people with income and resources below specified limits.
• People who would be eligible for Medicaid if institutionalized but who are receiving care under home and community-based services waivers.
This section discusses the options listed in the first three bullets above. The options listed in the last three bullets are discussed in separate sections later in this study.
State Supplemental Payments
Many states give state supplemental payments (SSP) to certain SSI beneficiaries and other people with incomes too high to qualify for SSI. These states have decided that income support at a level higher than the federal uniform standard is warranted, either because of a higher cost of living or because the state is more generous. States may
13
provide Medicaid coverage to people receiving SSP whether or not they also receive SSI. States also may extend Medicaid coverage to people eligible for either SSP or SSI who do not receive cash payments.
Unlike SSI, which is a federal program that applies the same eligibility criteria nationwide, states determine the income eligibility criteria for SSP. There is considerable variation among states in income standards for SSP eligibility. Even within a single state, eligibility for SSP may vary by living arrangement, reason for eligibility (e.g., aged, blind, or disabled), or cost of living in different geographic areas. All states, except for 209(b) states, must use the SSI resource standards.28
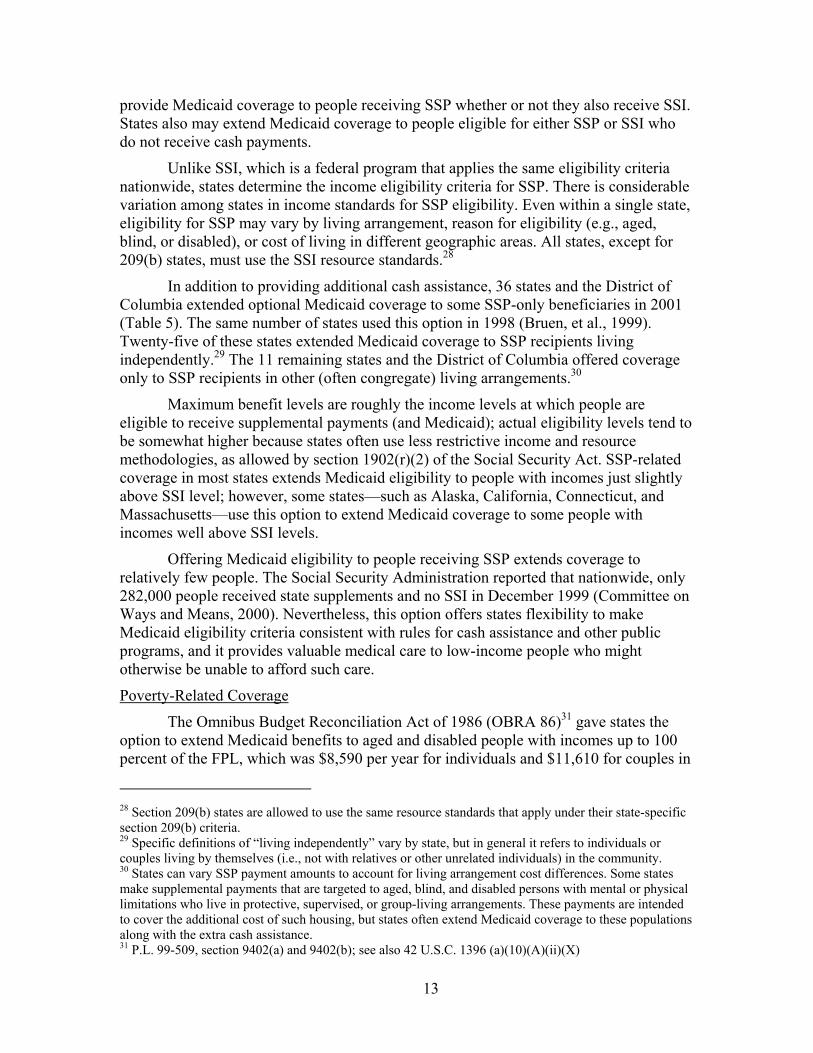
In addition to providing additional cash assistance, 36 states and the District of Columbia extended optional Medicaid coverage to some SSP-only beneficiaries in 2001 (Table 5). The same number of states used this option in 1998 (Bruen, et al., 1999). Twenty-five of these states extended Medicaid coverage to SSP recipients living independently.29 The 11 remaining states and the District of Columbia offered coverage only to SSP recipients in other (often congregate) living arrangements.30
Maximum benefit levels are roughly the income levels at which people are eligible to receive supplemental payments (and Medicaid); actual eligibility levels tend to be somewhat higher because states often use less restrictive income and resource methodologies, as allowed by section 1902(r)(2) of the Social Security Act. SSP-related coverage in most states extends Medicaid eligibility to people with incomes just slightly above SSI level; however, some states—such as Alaska, California, Connecticut, and Massachusetts—use this option to extend Medicaid coverage to some people with incomes well above SSI levels.
Offering Medicaid eligibility to people receiving SSP extends coverage to relatively few people. The Social Security Administration reported that nationwide, only 282,000 people received state supplements and no SSI in December 1999 (Committee on Ways and Means, 2000). Nevertheless, this option offers states flexibility to make Medicaid eligibility criteria consistent with rules for cash assistance and other public programs, and it provides valuable medical care to low-income people who might otherwise be unable to afford such care.
Poverty-Related Coverage
The Omnibus Budget Reconciliation Act of 1986 (OBRA 86)31 gave states the option to extend Medicaid benefits to aged and disabled people with incomes up to 100 percent of the FPL, which was $8,590 per year for individuals and $11,610 for couples in
28 Section 209(b) states are allowed to use the same resource standards that apply under their state-specific section 209(b) criteria. 29 Specific definitions of “living independently” vary by state, but in general it refers to individuals or couples living by themselves (i.e., not with relatives or other unrelated individuals) in the community. 30 States can vary SSP payment amounts to account for living arrangement cost differences. Some states make supplemental payments that are targeted to aged, blind, and disabled persons with mental or physical limitations who live in protective, supervised, or group-living arrangements. These payments are intended to cover the additional cost of such housing, but states often extend Medicaid coverage to these populations along with the extra cash assistance. 31 P.L. 99-509, section 9402(a) and 9402(b); see also 42 U.S.C. 1396 (a)(10)(A)(ii)(X)

14
Table 5 SSP-Related Medicaid Coverage of Aged, Blind, and Disabled Persons, 2001
Maximum SSI/SSP Maximum SSI/SSP State Offers Benefit for Persons Benefit for Persons Coverage for Living Independentlya Living Independentlya SSP Recipients (Monthly Payment) (Percentage of FPL) in Other Living
State Individual Couple Individual Couple Arrangements Alabama — — — — No Alaska $984 $1,459 110% 121% Yes Arizona — — — — No Arkansas — — — — No California - aged/disabled $712 $1,265 99% 131% Yes California - blind $771 $1,466 108% 152% Colorado $545 $817 76% 84% Yes Connecticut $747 $1,092 104% 113% Yes Delaware — — — — Yes District of Columbia — — — — Yes Florida — — — — No Georgia — — — — No Hawaii $536 $805 65% 72% Yes Idaho $583 $816 81% 84% Yes Illinoisb n/a n/a n/a n/a Yes Indiana — — — — Yes Iowa - aged/disabled — — — — Yes Iowa - blind $552 $840 77% 87% Kansas — — — — No Kentucky — — — — Yes Louisiana — — — — No Maine $540 $811 75% 84% Yes Maryland — — — — Yes Massachusetts - aged $660 $998 92% 103% Yes Massachusetts - blindc $645 $976 90% 101% Massachusetts - disabledc $681 $1,360 95% 141% Michigan $545 $824 76% 85% Yes Minnesota $592 $887 83% 92% Yes Mississippi — — — — No Missouri - aged/disabled — — — — Yes Missouri - blindd n/a n/a n/a n/a Montana — — — — Yes Nebraska $537 $791 75% 82% Yes Nevada - aged $581 $891 81% 92% Yes Nevada - blind $654 $1,192 91% 123% New Hampshire $544 $797 76% 82% Yes New Jersey — — — — Yes New Mexico — — — — No New York $618 $900 86% 93% Yes North Carolina — — — — Yes North Dakota — — — — No Ohio — — — — Yes

15
Maximum SSI/SSP Maximum SSI/SSP State Offers Benefit for Persons Benefit for Persons Coverage for Living Independentlya Living Independentlya SSP Recipients (Monthly Payment) (Percentage of FPL) in Other Living
State Individual Couple Individual Couple Arrangements Oklahoma — — — — No Oregon - aged/disabled $532 $796 74% 82% Yes Oregon - blind $557 $821 78% 85% Pennsylvania $558 $840 78% 87% Yes Rhode Island $595 $917 83% 95% Yes South Carolina — — — — Yes South Dakota $546 $811 76% 84% Yes Tennessee — — — — No Texas — — — — Yes Utah — $801 — 83% Yes Vermont $571 $880 80% 91% Yes Virginia — — — — Yes Washington $557 $816 78% 84% Yes West Virginia — — — — No Wisconsin $615 $928 86% 96% Yes Wyoming — — — — No Source: Urban Institute analysis of APHSA/NASMD survey of state Medicaid programs, 2002. Note: SSI = Supplemental Security Income. SSP = State Supplemental Payments. The 2001 federal poverty level (FPL) in the 48 contiguous States and the District of Columbia was $8,590 for one person and $11,610 for two people. The FPL for Alaska was $10,730 for one person and $14,510 for two people. The FPL for Hawaii was $9,890 for one person and $13,360 for two people (Source: HHS Poverty Guidelines, Federal Register, Vol. 66, No. 33, February 16, 2001). a) Payments are for persons living independently. In some cases, the state may offer optional SSP coverage to people in other living arrangements. Payment levels may be significantly higher (or lower) in these other arrangements. The actual income limits for eligibility may differ from the payment levels shown if states disregard income when determining eligibility. b) Illinois determines supplemental payment levels on a case-by-case basis. c) Massachusetts covers blind and disabled people with incomes up to 133% of the federal poverty level under its section 1115 research and demonstration project called MassHealth. d) Missouri's Aid to the Blind program pays a supplement of $423 for individuals and $846 for couples. Only people who receive less than $530 per month from SSI and $589 per month from other sources qualify for this supplement. The state supplement is reduced dollar-for-dollar by any SSI payment received. Recipients of Aid to the Blind are eligible for Medicaid.
2001.32 Under this option, states can cover only aged individuals, only disabled individuals, or both. The number of states offering this option, often referred to as “poverty-related” eligibility, has grown considerably in recent years. In 1998, 11 states and the District of Columbia offered coverage under poverty-related rules (Bruen, et al., 1999). As of October 2001, 18 states and the District of Columbia offered poverty-related eligibility for aged and/or disabled individuals. However, four of these 19 programs did not cover people all the way to 100% of the federal poverty level (Table 6).33
Medicaid officials in North Carolina, which implemented this option in 1999, noted that the two main factors behind the state’s choice to use this option were a strong push from advocates and state legislators to expand coverage for this population— in
32 The FPL is an estimate of the income level necessary to support basic needs, including housing, food, and clothing. Amounts vary by family size and type. The FPL is updated annually and used as a guideline for eligibility for numerous public assistance programs. 33 The survey data do not identify whether these states offer eligibility only to aged individuals, only to disabled individuals, or to both groups.

16
Table 6 States Using the OBRA '86 Option to Offer Poverty-Related Coverage to
Aged, Blind, and Disabled Persons, 2001
Less Restrictive Methodologies
Used to Count… State
Maximum Income
Level (as percentage
of FPL)
Resource Standard
Used Income Resource Alabama — — — — Alaska — — — — Arizona — — — — Arkansas — — — — Californiaa 100% SSI Yes No Colorado — — — — Connecticut — — — — Delaware — — — — District of Columbia 100% SSI No No Florida 90% MN Yes Yes Georgia — — — — Hawaii 100% SSI No Yes Idaho — — — — Illinois 85% SSI Yes No Indiana — — — — Iowa — — — — Kansas — — — — Kentucky — — — — Louisiana — — — — Maine 100% SSI Yes Yes Maryland — — — — Massachusettsb 100% SSI Yes Yes Michigan 100% SSI No No Minnesotac 95% MN Yes Yes Mississippid 100% SSI Yes Yes Missouri — — — — Montana — — — — Nebraska 100% MN No No Nevada — — — — New Hampshire — — — — New Jersey 100% SSI No No New Mexico — — — — New York — — — — North Carolina 100% SSI Yes Yes North Dakota — — — — Ohio — — — — Oklahoma 100% SSI No No Oregon — — — — Pennsylvania 100% MN No No Rhode Island 100% MN No Yes South Carolina 100% MN Yes Yes South Dakota — — — —
17
Less Restrictive Methodologies
Used to Count… State
Maximum Income
Level (as percentage
of FPL)
Resource Standard
Used Income Resource Tennessee — — — — Texas — — — — Utah 100% SSI No No Vermont — — — — Virginia 80% SSI No Yes Washington — — — — West Virginia — — — — Wisconsin — — — — Wyoming — — — — Source: Urban Institute analysis of APHSA/NASMD survey of state Medicaid programs, 2002. Note: OBRA '86 = Omnibus Budget Reconciliation Act of 1986. The 2001 federal poverty level (FPL) in the 48 contiguous States and the District of Columbia was $8,590 for one person and $11,610 for two people. The FPL for Alaska was $10,730 for one person and $14,510 for two people. The FPL for Hawaii was $9,890 for one person and $13,360 for two people (Source: HHS Poverty Guidelines, Federal Register, Vol. 66, No. 33, February 16, 2001). a) California disregards $230 of monthly income for individuals and $310 of monthly income for couples. b) Massachusetts covers blind and disabled people under age 65 with no income limit under its Section 1115 Demonstration called MassHealth. c) Minnesota disregards income between the 95% standard and 100% of FPL. d) Mississippi disregards income between 100% of FPL and 135% of FPL. The resource standards for poverty-related coverage are double the SSI resource standards.
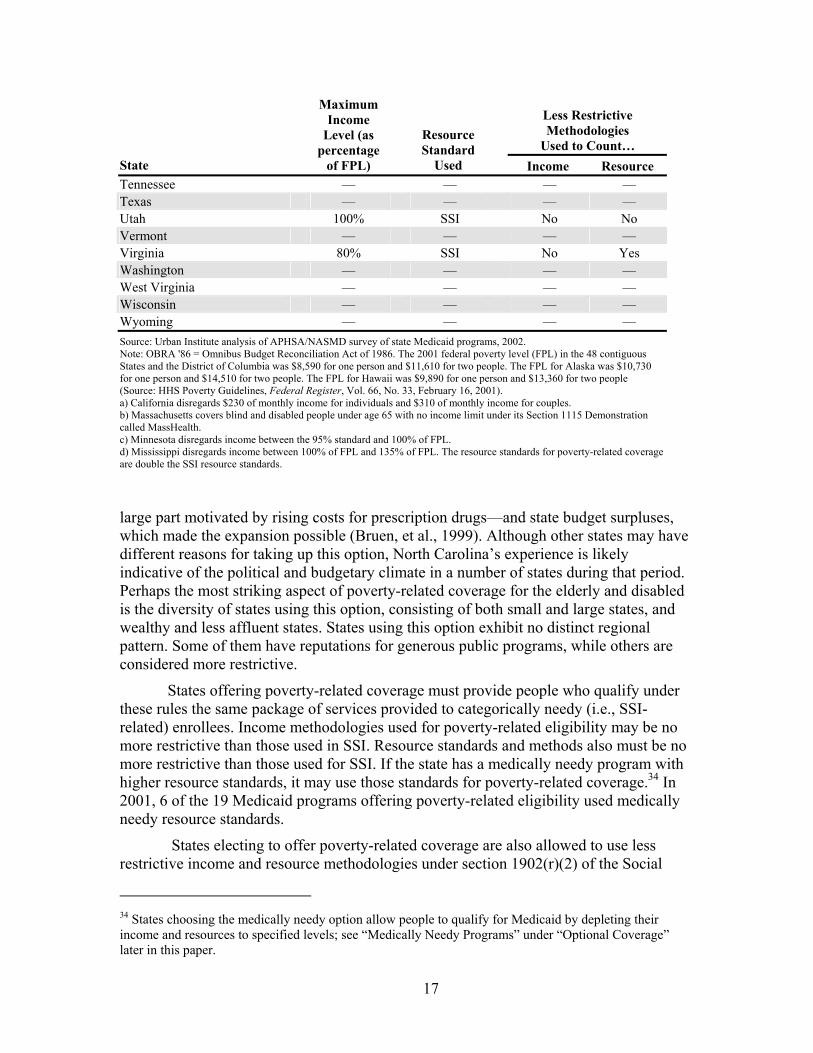
large part motivated by rising costs for prescription drugs—and state budget surpluses, which made the expansion possible (Bruen, et al., 1999). Although other states may have different reasons for taking up this option, North Carolina’s experience is likely indicative of the political and budgetary climate in a number of states during that period. Perhaps the most striking aspect of poverty-related coverage for the elderly and disabled is the diversity of states using this option, consisting of both small and large states, and wealthy and less affluent states. States using this option exhibit no distinct regional pattern. Some of them have reputations for generous public programs, while others are considered more restrictive.
States offering poverty-related coverage must provide people who qualify under these rules the same package of services provided to categorically needy (i.e., SSI-related) enrollees. Income methodologies used for poverty-related eligibility may be no more restrictive than those used in SSI. Resource standards and methods also must be no more restrictive than those used for SSI. If the state has a medically needy program with higher resource standards, it may use those standards for poverty-related coverage.34 In 2001, 6 of the 19 Medicaid programs offering poverty-related eligibility used medically needy resource standards.
States electing to offer poverty-related coverage are also allowed to use less restrictive income and resource methodologies under section 1902(r)(2) of the Social
34 States choosing the medically needy option allow people to qualify for Medicaid by depleting their income and resources to specified levels; see “Medically Needy Programs” under “Optional Coverage” later in this paper.
18
Security Act. Consequently, the effective income limit in several states offering this coverage is higher than 100 percent of FPL. The difference between the effective income and resource standards (the standards net of any relevant disregards or other allowances) and the formal standards (those listed in Table 6) can be quite substantial. For example, in 2001, California disregarded $230 of monthly income for individuals and $310 of monthly income for couples, effectively extending coverage to individuals and couples with incomes up to 132 percent of FPL. Mississippi disregarded income between 100 and 135 percent of FPL, and used effective resource standards that are double those used for SSI. These states illustrate that section 1902(r)(2) of the Social Security Act makes it possible for states to provide coverage to aged, blind, and disabled individuals far above initial statutory levels.
Medically Needy Programs
The medically needy option allows states to set slightly higher income limits—called the medically needy income level (MNIL)—than were allowed under the Aid to Families with Dependent Children (AFDC) program.35 People can qualify under the medically needy option if they have income that meets the MNIL standard or incur out-of-pocket medical expenses that, when subtracted from regular income, put them below the MNIL. This process is known as “spending down.” The medically needy option is an especially important source of Medicaid coverage for people in medical or long-term care institutions, because care is so expensive and many people do not have the income and assets to pay out of pocket for their care.
If a state elects to have a medically needy program, it must cover pregnant women and children, but coverage of aged, blind, and disabled people is optional. With the exception of Texas, all states that had medically needy programs in 2001 offered eligibility for older adults and younger people with disabilities. States must use resource standards that are at least equal to the appropriate cash assistance program standards for the population covered (e.g., SSI for elderly, blind, and disabled people), but they may elect to have higher standards if they wish.
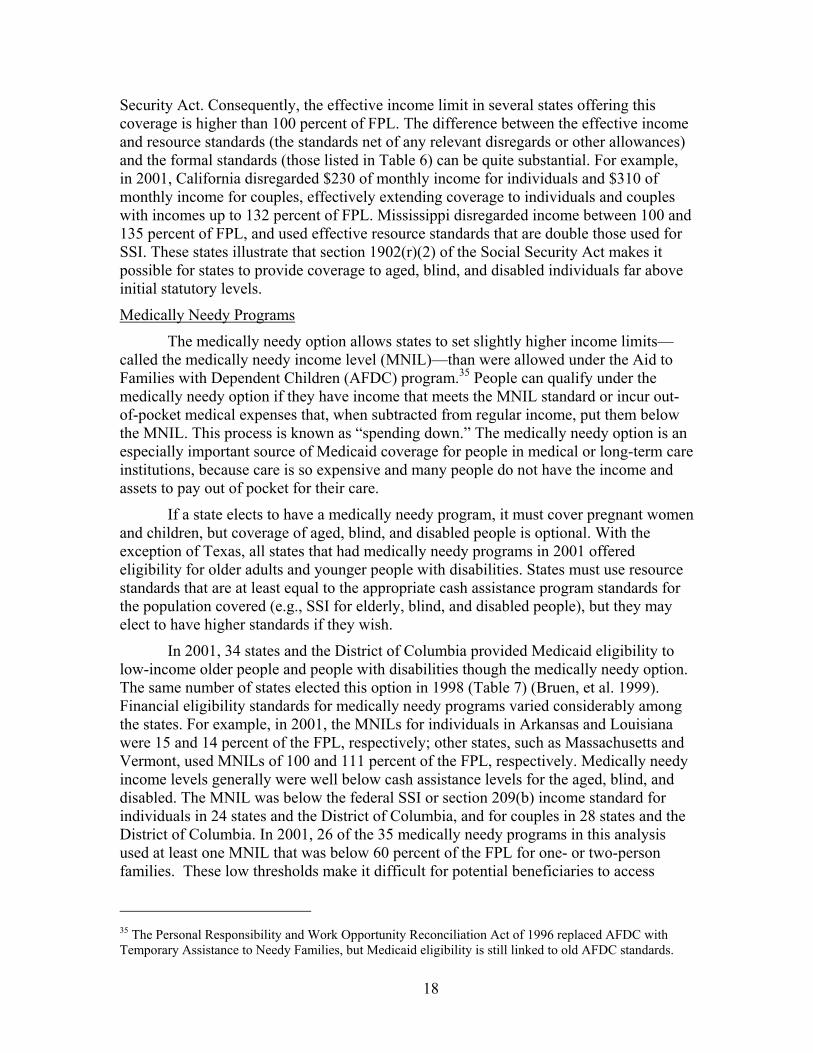
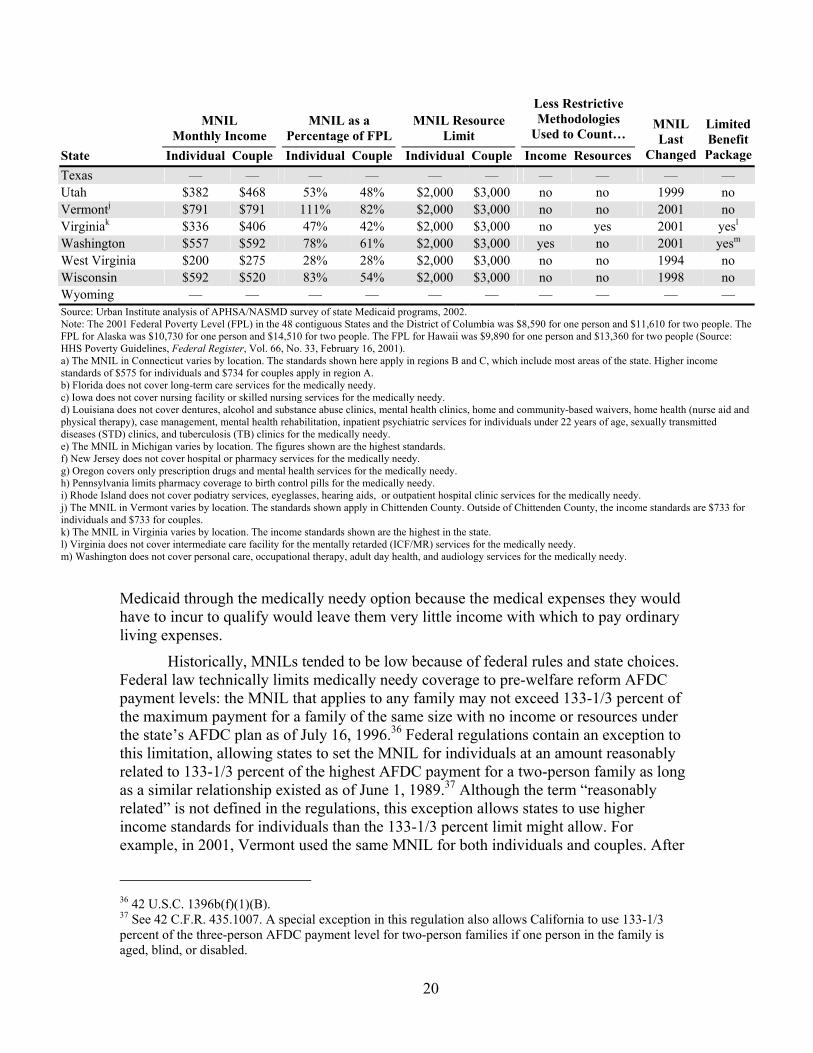
In 2001, 34 states and the District of Columbia provided Medicaid eligibility to low-income older people and people with disabilities though the medically needy option. The same number of states elected this option in 1998 (Table 7) (Bruen, et al. 1999). Financial eligibility standards for medically needy programs varied considerably among the states. For example, in 2001, the MNILs for individuals in Arkansas and Louisiana were 15 and 14 percent of the FPL, respectively; other states, such as Massachusetts and Vermont, used MNILs of 100 and 111 percent of the FPL, respectively. Medically needy income levels generally were well below cash assistance levels for the aged, blind, and disabled. The MNIL was below the federal SSI or section 209(b) income standard for individuals in 24 states and the District of Columbia, and for couples in 28 states and the District of Columbia. In 2001, 26 of the 35 medically needy programs in this analysis used at least one MNIL that was below 60 percent of the FPL for one- or two-person families. These low thresholds make it difficult for potential beneficiaries to access
35 The Personal Responsibility and Work Opportunity Reconciliation Act of 1996 replaced AFDC with Temporary Assistance to Needy Families, but Medicaid eligibility is still linked to old AFDC standards.

19
Table 7 Medically Needy Income Levels (MNIL) and Resource Limits for Aged, Blind, and Disabled Persons, 2001
MNIL Monthly Income
MNIL as a Percentage of FPL
MNIL Resource Limit
Less Restrictive Methodologies
Used to Count… State Individual Couple Individual Couple Individual Couple Income Resources
MNIL Last
Changed
LimitedBenefitPackage
Alabama — — — — — — — — — — Alaska — — — — — — — — — — Arizona — — — — — — — — — — Arkansas $108 $217 15% 22% $2,000 $3,000 no yes 1988 no California $600 $934 84% 97% $2,000 $3,000 no no 1989 no Colorado — — — — — — — — — — Connecticuta $476 $633 67% 65% $1,600 $2,400 yes yes 1991 no Delaware — — — — — — — — — — Dist. of Columbia $377 $397 53% 41% $2,600 $3,000 no no 1994 no Florida $180 $241 25% 25% $5,000 $6,000 yes yes 1992 yesb
Georgia $317 $375 44% 39% $2,000 $4,000 yes yes 1991 no Hawaii $418 $565 51% 51% $2,000 $3,000 no yes 1993 no Idaho — — — — — — — — — — Illinois $283 $375 40% 39% $2,000 $3,000 yes yes 1990 no Indiana — — — — — — — — — — Iowa $483 $483 67% 50% $10,000 $10,000 no no 1990 yesc
Kansas $475 $475 66% 49% $2,000 $3,000 yes yes 1997 no Kentucky $217 $267 30% 28% $2,000 $4,000 yes yes 1989 no Louisiana $100 $192 14% 20% $2,000 $3,000 no no 1985 yesd
Maine $315 $341 44% 35% $2,000 $3,000 yes yes 1991 no Maryland $350 $392 49% 41% $2,500 $3,000 no no 1994 no Massachusetts $716 $968 100% 100% $2,000 $3,000 yes yes 1998 no Michigane $408 $541 57% 56% $2,000 $3,000 no no 1992 no Minnesota $482 $602 67% 62% $3,000 $6,000 yes yes 2001 no Mississippi — — — — — — — — — — Missouri — — — — — — — — — — Montana $525 $525 73% 54% $2,000 $3,000 no yes 2001 no Nebraska $392 $392 55% 41% $4,000 $6,000 yes yes 1988 no Nevada — — — — — — — — — — New Hampshire $544 $675 76% 70% $2,500 $4,000 no no 2001 no New Jersey $367 $434 51% 45% $4,000 $6,000 no no n/a yesf
New Mexico — — — — — — — — — — New York $625 $900 87% 93% $3,750 $5,400 no yes 2001 no North Carolina $242 $317 34% 33% $3,000 yes yes 1990 no North Dakota $475 $491 66% 51% $3,000 $6,000 no no 2001 no Ohio — — — — — — — — — — Oklahoma $259 $325 36% 34% $2,000 $3,000 no no 2000 no Oregon $413 $526 58% 54% $2,000 $3,000 no no 1991 yesg
Pennsylvania $425 $442 59% 46% $2,400 $3,200 no no 1990 yesh
Rhode Island $625 $667 87% 69% $4,000 $6,000 no yes 2001 yesi
South Carolina — — — — — — — — — — South Dakota — — — — — — — — — — Tennessee $241 $258 34% 27% $2,000 $3,000 yes yes 1999 no
20
MNIL Monthly Income
MNIL as a Percentage of FPL
MNIL Resource Limit
Less Restrictive Methodologies
Used to Count… State Individual Couple Individual Couple Individual Couple Income Resources
MNIL Last
Changed
LimitedBenefitPackage
Texas — — — — — — — — — — Utah $382 $468 53% 48% $2,000 $3,000 no no 1999 no Vermontj $791 $791 111% 82% $2,000 $3,000 no no 2001 no Virginiak $336 $406 47% 42% $2,000 $3,000 no yes 2001 yesl
Washington $557 $592 78% 61% $2,000 $3,000 yes no 2001 yesm
West Virginia $200 $275 28% 28% $2,000 $3,000 no no 1994 no Wisconsin $592 $520 83% 54% $2,000 $3,000 no no 1998 no Wyoming — — — — — — — — — — Source: Urban Institute analysis of APHSA/NASMD survey of state Medicaid programs, 2002. Note: The 2001 Federal Poverty Level (FPL) in the 48 contiguous States and the District of Columbia was $8,590 for one person and $11,610 for two people. The FPL for Alaska was $10,730 for one person and $14,510 for two people. The FPL for Hawaii was $9,890 for one person and $13,360 for two people (Source: HHS Poverty Guidelines, Federal Register, Vol. 66, No. 33, February 16, 2001). a) The MNIL in Connecticut varies by location. The standards shown here apply in regions B and C, which include most areas of the state. Higher income standards of $575 for individuals and $734 for couples apply in region A. b) Florida does not cover long-term care services for the medically needy. c) Iowa does not cover nursing facility or skilled nursing services for the medically needy. d) Louisiana does not cover dentures, alcohol and substance abuse clinics, mental health clinics, home and community-based waivers, home health (nurse aid and physical therapy), case management, mental health rehabilitation, inpatient psychiatric services for individuals under 22 years of age, sexually transmitted diseases (STD) clinics, and tuberculosis (TB) clinics for the medically needy. e) The MNIL in Michigan varies by location. The figures shown are the highest standards. f) New Jersey does not cover hospital or pharmacy services for the medically needy. g) Oregon covers only prescription drugs and mental health services for the medically needy. h) Pennsylvania limits pharmacy coverage to birth control pills for the medically needy. i) Rhode Island does not cover podiatry services, eyeglasses, hearing aids, or outpatient hospital clinic services for the medically needy. j) The MNIL in Vermont varies by location. The standards shown apply in Chittenden County. Outside of Chittenden County, the income standards are $733 for individuals and $733 for couples. k) The MNIL in Virginia varies by location. The income standards shown are the highest in the state. l) Virginia does not cover intermediate care facility for the mentally retarded (ICF/MR) services for the medically needy. m) Washington does not cover personal care, occupational therapy, adult day health, and audiology services for the medically needy.
Medicaid through the medically needy option because the medical expenses they would have to incur to qualify would leave them very little income with which to pay ordinary living expenses.
Historically, MNILs tended to be low because of federal rules and state choices. Federal law technically limits medically needy coverage to pre-welfare reform AFDC payment levels: the MNIL that applies to any family may not exceed 133-1/3 percent of the maximum payment for a family of the same size with no income or resources under the state’s AFDC plan as of July 16, 1996.36 Federal regulations contain an exception to this limitation, allowing states to set the MNIL for individuals at an amount reasonably related to 133-1/3 percent of the highest AFDC payment for a two-person family as long as a similar relationship existed as of June 1, 1989.37 Although the term “reasonably related” is not defined in the regulations, this exception allows states to use higher income standards for individuals than the 133-1/3 percent limit might allow. For example, in 2001, Vermont used the same MNIL for both individuals and couples. After
36 42 U.S.C. 1396b(f)(1)(B). 37 See 42 C.F.R. 435.1007. A special exception in this regulation also allows California to use 133-1/3 percent of the three-person AFDC payment level for two-person families if one person in the family is aged, blind, or disabled.

21
July 16, 1996, federal law prohibits states from raising their MNIL standards more quickly than they raise income standards for low-income families with children, which in turn is limited to the annual percentage increase in the Consumer Price Index.38
Many states have low MNILs because their AFDC benefit levels were low—the median AFDC benefit level for a family of two was about 37 percent of the FPL in 1996.39 Many states also held AFDC benefit levels constant for several years leading up to welfare reform, further restricting their ability to raise their MNILs. For example, as of 2001, Arkansas, California, Kentucky, Louisiana, Massachusetts, and Nebraska had not raised their MNILs since the 1980s. Though federal rules played a role, 20 of the 35 medically needy programs had not changed their MNILs since 1994 or earlier; only 10 states changed their MNILs in 2000 or 2001. In the states that did not raise their MNILs over time, inflation has eroded the real purchasing power of these income levels.
Most medically needy programs apply resource limits for aged, blind, and disabled applicants that are close to those used by the SSI program. In 2001, 20 of the 35 medically needy programs used resource limits of $2,000 for individuals and $3,000 for couples, the same limits used by the SSI program. Relatively few states had resource limits for the medically needy that were more than double the comparable limits for SSI. Five states set the individual resource limit at $4,000 or more, and seven states set the two-person resource limit at $6,000 or more. Connecticut’s resource standards were lower than the comparable SSI limit, which is allowed because it is a 209(b) state. All of the remaining medically needy programs used resource limits that fell between the SSI limits and twice the SSI limits for each family size.
In counting income and resources for the elderly and persons with disabilities, a state must use methodologies that are no more restrictive than the SSI program (unless it is a 209(b) state). States can also use the flexibility granted by section 1902(r)(2) of the Social Security Act to apply less restrictive methodologies in determining countable income and assets for the medically needy. In 2001, 19 of the 35 states in this study that have medically needy programs took advantage of this flexibility to some degree. For example, when counting resources, Arkansas applied a $6,000 exclusion for income-producing property (excluding the home) that is not part of a business, and Connecticut disregarded assets protected under the Connecticut Partnership Act, which promotes the sale of private long-term care insurance.
In January 2001, the Centers for Medicare and Medicaid Services (CMS) issued revised Medicaid regulations that changed the way limits on federal financial participation apply to the medically needy. Prior to this change, federal regulations made it almost impossible for states to use less restrictive income methodologies for the medically needy (and other eligibility groups) because their use would typically violate the 133-1/3 percent limit, which was based on income levels before the state applied any less restrictive methodologies (Health Care Financing Administration, 2001). The 133-
38 P.L. 104-193 (Personal Responsibility and Work Opportunity Reconciliation Act of 1996). 39 The median monthly AFDC payment for a two-person family as a percentage of poverty is the authors’ calculation based on maximum AFDC payment levels from the Administration for Children and Families, U.S. Department of Health and Human Services (HHS), and HHS poverty guidelines for each state printed in the Federal Register 63(36): 9235–9238 (February 24, 1998).
22
1/3 percent limit is now imposed after a state applies any less restrictive income methodologies.40 As a result of this change, states may now revise their income methodologies to overcome the limitation of MNIL standards to 133-1/3 percent of AFDC standards. Therefore, as a practical matter, federal rules are no longer a constraint on the income and resource levels of medically needy beneficiaries, giving states additional flexibility in setting Medicaid eligibility requirements.
States are not required to provide the same benefit package to medically needy enrollees that they offer to other enrollees. Medicaid regulations allow states to exclude coverage of nursing facilities and some optional services from their medically needy programs.41 Despite this flexibility, most states provide the same benefit package to the medically needy that they provide to the categorically needy, including prescription drugs. Nonetheless, in 2001, nine states in this study—Florida, Iowa, Louisiana, New Jersey, Oregon, Pennsylvania, Rhode Island, Virginia, and Washington—offered a more restrictive benefit package to medically needy beneficiaries (Table 7). Florida, Iowa, Louisiana, Oregon, Virginia, and Washington did not cover some long-term care services under their medically needy programs. All these states used the special income rule to establish Medicaid eligibility for institutional care, so there would be other pathways that provided eligibility for nursing home care for people with incomes too high to receive SSI.42 Still, the exclusion of long-term care services, such as personal care, limits the choices available to medically needy people in these states. Other states excluded coverage of other optional services, such as eyeglasses and dental care. Consequently, people who spend down to medically needy levels may be eligible for fewer medical services than people whose incomes were originally low enough to qualify for Medicaid through other pathways.
Eligibility for Working People with Disabilities Mandatory Eligibility
There are both mandatory requirements and state options to provide Medicaid coverage to working people with disabilities under the age of 65. As a work incentive, states must provide Medicaid coverage to “qualified severely impaired individuals” who have already qualified for SSI and continue to have the disabling physical or mental impairment that qualified them, even when they subsequently had more than $740 a month in earnings (i.e., “substantial gainful activity”) in 2001.43 These people remain entitled to Medicaid as long as their gross earnings are determined to be less than the combined value of SSI, state supplemental payments, Medicaid benefits, and publicly funded attendant care that they would be eligible to receive in the absence of their wage earnings. To measure whether a person’s earnings are high enough to replace these
40 42 C.F.R. 435.1007. 41 42 C.F.R. 440.220. 42 The “special income rule” allows states to cover individuals living in nursing homes or other institutions for at least 30 consecutive days. The income standard for these beneficiaries can be as high as 300 percent of the federal SSI payment level ($1,590 per month for a single individual in 2001). See “Eligibility for Institutional Care” under “Eligibility Pathways for Long-Term Care” later in this paper. 43 42 U.S.C 1382h(b); 42 U.S.C. 1396d(q).

23
benefits, the Social Security Administration calculates state-specific thresholds, which ranged from $14,690 in Arizona to $36,750 in New Hampshire in 2001.44 In 2001, five states—California, Iowa, Massachusetts, Nevada, and Oregon—had higher thresholds for blind SSI beneficiaries than for other disabled SSI recipients. In all states, an individual who earned more than the threshold amount may request to be measured against an individualized threshold, which considers actual use of Medicaid and publicly funded attendant care and work expenses. Optional Eligibility
Three changes to federal law in the late 1990s gave states additional options to provide coverage for working people with disabilities. The dominant rationale for these options was to remove barriers to work for people not already receiving Medicaid through the SSI or medically needy programs.
The first change, authorized by the Balanced Budget Act of 1997 (BBA), gave states the option to provide Medicaid to working people with disabilities who have family incomes up to 250 percent of the FPL.45 SSI resource standards of $2,000 for an individual and $3,000 for a couple apply to this group. States may use more liberal income and resource methodologies as permitted by section 1902(r)(2) of the Social Security Act, and may choose to disregard all income and resources. States may also charge premiums and impose other cost sharing using a sliding scale based on income.
The second option, authorized by the Ticket to Work and Work Incentives Improvement Act of 1999 (TWWIIA), gave states additional flexibility to set Medicaid income and resource standards at any level they like for working disabled people, or even to have no income and resource limits at all.46 Under the third option, the TWWIIA also allows states to continue to cover working individuals who receive Medicaid but who subsequently lose eligibility because they are determined to be no longer disabled, as long as they continue to have conditions that constitute “a severe medically determinable impairment.” As with the BBA option, under the Ticket to Work options, states may require premiums and cost sharing on a sliding scale related to income. However, the TWWIIA options specify that states must charge full premiums to people with incomes in excess of $75,000.47 There is also a maintenance-of-effort requirement: states using the TWWIIA options must demonstrate that they are maintaining funding for programs (other than Medicaid) to assist disabled individuals who want to work.
As of December 2002, CMS identified 26 states extending eligibility to the working disabled under either the BBA or TWWIIA options (Centers for Medicare and Medicaid Services (a)). These states were almost evenly split between the two legislative authorizations, although it appears that states with more recent implementation dates primarily chose the TWWIIA options.
44 The 2003 thresholds range from $17,348 in Alabama to $41,514 in New Hampshire. 45 P.L. 105-33, section 4733. 46 P.L. 106-170. 47 This rule does not apply to the BBA option.

24
Eligibility Pathways for Long-Term Care Services Long-term care, such as nursing facility services and home care, is expensive. The
average cost of a year of nursing home care in 2000 was more than $49,000 (Centers for Medicare and Medicaid Services, 2002).48 Although it is generally thought to be less expensive than nursing facility services, home care can also cost thousands of dollars per month, depending on the needs of the individual receiving care. The high cost of long-term care services, the absence of Medicare coverage for long-term care services, and the unaffordability and inadequacy of coverage in the private long-term care insurance market force many older people and people with disabilities who have moderate incomes to depend on Medicaid to pay for needed long-term care services. In many cases, Medicaid coverage begins after these people have expended most of their non-housing personal assets to pay for their nursing home care (Wiener, et al., 1996).
Medicaid covers a range of long-term care services, including both institutional and community-based services. Covered institutional services include care in nursing facilities, intermediate care facilities for the mentally retarded (ICF/MRs), and mental hospitals. Medicaid community-based services include personal care, home health, targeted case management, adult day care, and a very broad range of services available through the home and community-based services waivers.49
Medicaid plays a vital role in financing long-term care services. In 1999–2000, Medicaid was the primary source of payment for 68 percent of nursing home residents (American Health Care Association, 2001). In 2001, Medicaid accounted for nearly half of total expenditures for nursing home care (Centers for Medicare and Medicaid Services (c)). Nursing home care was also the largest single expenditure within the Medicaid program, accounting for 21 percent of Medicaid spending for medical services in 2001 (Centers for Medicare and Medicaid Services (b)).
Eligibility for Institutional Care
To address the needs of individuals who have too much income to qualify for SSI but not enough income to pay for their medical institutional care, in 2001, almost all states offered Medicaid eligibility at higher income levels for people living in nursing homes and ICF/MRs than they normally provided for Medicaid beneficiaries living in the community. In some cases, states also used these higher income standards for Medicaid home and community-based service waivers to provide services to people in the community who required an institutional level of care.
The 300 Percent Rule
In addition to offering coverage through the medically needy option or through 209(b) spend-down provisions, federal law allows states to cover individuals who have lived in nursing homes or other medical institutions for at least 30 consecutive days under
48 In 2003, the average annual cost of nursing home care is $56,000. G.E. Financial Long Term Care Division, GE Long Term Care Insurance, Nursing Home Survey, August 2003. 49 Home and community-based waivers allow coverage for a broad range of services, including case management, homemaker/home health aide services, personal care services, adult day health, habilitation, respite care, nonmedical transportation, home modifications, adult day care, and other services approved by the Secretary of the U.S. Department of Health and Human Services.

25
the “special income rule,” also known as the “300 percent rule (or cap).”50 While beneficiaries must meet resource eligibility standards for SSI or other resource standards to which eligibility is linked, the income standard for this group can be as high as 300 percent of the federal SSI payment level ($1,590 per month for a single individual in 2001). In 2001, 39 states provided coverage through the special income rule; 14 of these states did not cover the medically needy (Table 8). All but four of the states providing coverage through this mechanism—Delaware, Missouri, New Hampshire, and Vermont—reported setting the standard at 300 percent of SSI.
Medicaid Qualified Income Trust In states that use the special income rule and do not have a medically needy
program or use the 209(b) option, individuals with income above the state-specified threshold are technically ineligible for Medicaid even if they lack sufficient income to pay the cost of institutional care. An exception to this general rule allows individuals to establish a "Miller Trust" (also called a “Medicaid Qualified Income Trust”). Under this arrangement, individuals can become Medicaid eligible by placing income in excess of the Medicaid eligibility standard into an irrevocable trust and designating the funds to be used to pay for medical care.
Personal Needs Allowance
Once eligible for Medicaid, institutionalized individuals must contribute all of their income toward the cost of their institutional care, except for out-of-pocket medical costs, certain other expenses, and a small personal needs allowance. In some cases, there are also deductions from income for other purposes as well, such as allowances for a spouse or children or an allowance for maintenance of the home. These allowances reduce the amount contributed to the cost of institutional care. The personal needs allowance is intended to cover all the needs of an individual that are not provided for by the institution.51 The size of this personal needs allowance for an individual in 2001 ranged from $30 per month to $77 per month; 27 states had personal needs allowances that were $40 per month or less. Married couples generally received twice the individual amount.
Spousal Impoverishment Protections
Most Medicaid nursing home residents are widowed, divorced, or never married (Jones, 2002). However, when one member of a married couple is institutionalized and the other remains in the community, Medicaid rules allow the community-based spouse to keep a significant portion of the couple’s income and assets.52 The goal of these special income and resource rules is to leave the community-based spouse with sufficient monthly income and resources to avoid hardship (Schneider, et al., 1999). The federal government establishes minimum and maximum income and the resource protections, which are automatically adjusted each year by changes in the Consumer Price Index to account for inflation.
50 42 U.S.C. 1396a. 51 42 U.S.C. 1396a(50) and 42 U.S.C. 1396a(q). 52 42 U.S.C. 1396r-5.

26
Spousal impoverishment methodologies are triggered when one spouse enters a nursing facility (or hospital) and is likely to remain there for at least 30 days, whether the spouse applies for Medicaid at the time of institutionalization or later. At the point of admission, the value of all of the couple’s countable resources is calculated, and the community-based spouse is allowed to keep one-half of the resources, subject to a minimum and maximum amount.53 In 2001, states were required to allow the community-based spouse to retain at least $17,400 but not more than $87,700 in countable assets.54
Nineteen states and the District of Columbia allowed the community-based spouse to retain the minimum amount, 23 states allowed the community-based spouse to retain the maximum amount, and 8 states established a level between the minimum and maximum (Table 8). If dividing the resources in half leaves the community-based spouse with insufficient assets to meet the minimum threshold, additional assets from the institutionalized spouse must be allocated to the community-based spouse.
With respect to income, the spousal impoverishment methodologies follow a somewhat different procedure than used for resources. Again, there is a minimum and maximum amount. However, each member of the couple retains the income in his or her name, and any joint income is divided in half. If the income in the community-based spouse’s name is not adequate to reach the minimum level, then income from the institutionalized spouse is transferred to the community-based spouse in the amount necessary to make up the shortfall. Any remaining income of the institutionalized spouse (other than the personal needs allowance) is applied toward the cost of care. In 2001, federal spousal impoverishment protections required that the community-based spouse be allowed to keep at least $1,406.25 but not more than $2,175.00 of the couple’s monthly income.55 In the case of both the income and resource protections, the law allows for hardship exceptions in individual cases through administrative and judicial procedures.
Home and Community-Based Services
People who would be eligible for Medicaid if they were institutionalized and needed nursing home, ICF/MR, or hospital level of care may also be eligible to receive services in the community through special optional eligibility categories. These groups include people receiving care through home and community-based services waiver programs and certain noninstitutionalized, severely disabled children age 18 or younger (e.g., through so-called “Katie Beckett” or “model” waivers).56 Under Medicaid home
53 Note that “countable” means that certain resources are excluded. 54 The 2003 minimum resource standard is $18,132; the 2003 maximum resource standard is $90,660. These levels are available at http://www.cms.gov/medicaid/eligibility/ssi0103.asp. 55 The 2003 minimum monthly income allowance is $1,492.50; the maximum income allowance is $2,266.50. See footnote 54 for World Wide Web citation. 56 Under the Katie Beckett option (42 U.S.C. 1396a(e)(3)), children under age 19 may qualify for Medicaid if they meet the SSI eligibility standard for disability, would be eligible for Medicaid if they were in an institution, and are receiving at-home medical care that would be provided in an institution. The state must determine that it is appropriate to provide care to the child outside an institution, and the estimated cost to Medicaid of caring for the child at home must be no higher than the estimated cost to Medicaid of placing the child in an institution. States that elect the Katie Becket option must offer coverage to all children who qualify. States that wish to limit the number of children they serve may use so-called “model” waivers for home and community-based services that cover no more than 200 children (42 CFR 441.305(b)).

27
State 209(b) State
Medically Needy
Special Income Standards
(Percentage of SSI)a
Personal Needs
Allowance ($)
Community Spouse Protected Resource
Allowance Alabama no no 300% 30 $25,000 Alaska no no 300% 75 $87,000 Arizona no no 300% 77 $17,400 Arkansas no yes 300% 40 $87,000 California no yes — 35 $87,000 Colorado no no 300% 50 $87,000 Connecticut yes yes 300% 54 $17,400 Delaware no no 250% 44 $87,000 District of Columbia no yes — 70 $17,400 Florida no yes 300% 35 $87,000 Georgia no yes 300% 30 $87,000 Hawaii yes yes — 30 $87,000 Idaho no no 300% 40 $17,400 Illinois yes yes 30 $87,000 Indiana yes no — 50 $17,400 Iowa no yes 300% 30 $24,000 Kansas no yes 300% 30 $17,400 Kentucky no yes 300% 40 $87,000 Louisiana no yes 300% 38 $87,000 Maine no yes 300% 40 $87,000 Maryland no yes 300% 40 $87,000 Massachusetts no yes — 60 $87,000 Michigan no yes 300% 60 $87,000 Minnesota yes yes 300% 69 $24,247 Mississippi no no 300% 44 $87,000 Missouri yes no 179% 30 $17,400 Montana no yes — 40 $17,400 Nebraska no yes — 50 $17,400 Nevada no no 300% 30 $87,000 New Hampshire yes yes 236% 50 $17,400 New Jersey no yes 300% 40 $17,400 New Mexico no no 300% 47 $31,290 New York no yes — 50 $74,820 North Carolina no yes — 30 $17,400 North Dakota yes yes — 40 $87,000 Ohio yes no — 40 $17,400 Oklahoma yes yes 300% 50 $17,400 Oregon no yes 300% 30 $17,400 Pennsylvania no yes 300% 30 $17,400 Rhode Island no yes 300% 50 $17,400 South Carolina no no 300% 30 $66,480 South Dakota no no 300% 30 $20,000 Tennessee no yes 300% 30 $17,400
Table 8 Medicaid Eligibility Standards, Personal Needs Allowance, and
Spousal Impoverishment Resource Limits for Institutionalized Individuals, 2001

28
State 209(b) State
Medically Needy
Special Income Standards
(Percentage of SSI)a
Personal Needs
Allowance ($)
Community Spouse Protected Resource
Allowance Texas no no 300% 60 $17,400 Utah no yes 300% 45 $17,400 Vermont no yes 270% 48 $87,000 Virginia yes yes 300% 30 $87,000 Washington no yes 300% 42 $87,000 West Virginia no yes 300% 50 $87,000 Wisconsin no yes 300% 45 $50,000 Wyoming no no 300% 50 $87,000 Source: Urban Institute analysis of APHSA/NASMD survey of state Medicaid programs, 2002. a) The federal Supplemental Security Income (SSI) payment level for an individual was $530 per month in 2001, so 300% of SSI would have been $1,590 per month (Source: Social Security Administration).
and community-based services waivers, states may provide a very wide range of services, some of which are not normally covered under the Medicaid program. Because the waivers are intended to substitute noninstitutional for institutional care, states must limit these waiver programs to beneficiaries with relatively severe disabilities—people meeting the state’s level of care criteria for nursing homes, ICF/MR, or hospital services.57 For the older population and younger adults with physical disabilities, the comparison institution is almost always a nursing home.
All states have at least one home and community-based services waiver. Waiver rules allow states to apply institutional eligibility standards to people living in the community, although not all states do so. Enhanced eligibility for home and community-based services is designed to reduce the bias toward institutional care that might otherwise occur because Medicaid eligibility is more liberal for people in institutions than in the community. In 2001, 46 states and the District of Columbia provided coverage to people above the SSI income level through home and community-based waivers for older adults (Table 9).
States have several additional options to extend more liberal eligibility rules to persons applying for waiver services. In 2001, 39 states applied nursing home spousal impoverishment protections; 23 states and the District of Columbia allowed individuals to spend down to Medicaid eligibility for their waivers; and 15 states allowed people to establish Miller trusts in order to gain eligibility. Because many states had more than one home and community-based services waiver, often targeting different groups (e.g., persons with developmental disabilities, the aged and physically disabled, and those with brain injury), income eligibility varied according to the waiver in 14 states.
57 States must limit in advance how many people they will serve during a year. In contrast to the regular Medicaid program, states may establish waiting lists for these waiver programs. Moreover, average Medicaid expenditures for waiver beneficiaries must be the same or less than they would have been without the waiver. States may also limit services to certain target populations (e.g., older people, younger people with disabilities, and people with developmental disabilities) and operate the waiver on less than a statewide basis.

29
Table 9 Home and Community-Based Services Waivers, 2001
State
Income Standards Vary
by Waiver Income Standard
for Waiversa Spend-down
Available
Nursing Home Spousal
Impoverishment Rules Apply
Miller Trust Available
Alabama x 100% of SSI Alaska 300% of SSI x x Arizona 300% of SSI x x Arkansas 300% of SSI x California x 133% of FPL x x Colorado x 300% of SSI x Connecticut x 300% of SSI x Delaware 250% of SSI x x District of Columbia 100% of FPL x Florida 300% of SSI x x Georgia 300% of SSI x Hawaii x 100% of FPL x x Idaho 300% of SSI x x Illinois 85% of FPL x x Indiana 300% of SSI x x Iowa x 300% of SSI x x Kansas x 300% of SSI x x Kentucky 300% of SSI x Louisiana 300% of SSI x Maine 300% of FPL x Maryland 300% of SSI x Massachusetts 100% of FPL x Michigan x 300% of SSI Minnesota x 300% of SSI x x Mississippi 300% of SSI x x Missouri x 179% of SSI x x Montana $525 x Nebraska 100% of FPL x Nevada 300% of SSI x New Hampshire 300% of SSI x New Jersey 300% of SSI x New Mexico 300% of SSI x x New York $625 x x North Carolina 100% of FPL x x North Dakota $475 x Ohio $460 x x Oklahoma 300% of SSI x x Oregon 300% of SSI x x Pennsylvania 300% of SSI Rhode Island x 300% of SSI x x South Carolina 300% of SSI x x South Dakota 300% of SSI x x Tennessee 300% of SSI x x Texas 300% of SSI x x Utah x 300% of SSI x x

30
State
Income Standards Vary
by Waiver Income Standard
for Waiversa Spend-down
Available
Nursing Home Spousal
Impoverishment Rules Apply
Miller Trust Available
Vermont x 300% of SSI x x Virginia x 300% of SSI x x Washington 300% of SSI x West Virginia 300% of SSI x Wisconsin 300% of SSI x x Wyoming 300% of SSI x x Source: Urban Institute analysis of APHSA/NASMD survey of state Medicaid programs, 2002. a) If income standards vary by type of waiver, the income standard listed pertains to the primary waiver serving the elderly population. The federal poverty level (FPL) for an individual in 2001 was $716 per month for one person in the 48 contiguous states and the District of Columbia, $894 per month in Alaska and $824 per month in Hawaii (Source: HHS Poverty Guidelines, Federal Register, Vol. 66, No. 33, February 16, 2001). The Supplemental Security Income (SSI) benefit for an individual in 2001 was $530 per month, so 300% of SSI would have been $1,590 per month (Source: Social Security Administration).
Transfer of Assets and Estate Recovery
Medicaid is designed for people who are poor or who have become poor because of the high cost of medical care. To enforce this concept of the program, federal Medicaid law restricts the transfer of assets by applicants for Medicaid and mandates the recovery of Medicaid long-term care expenses after the death of the beneficiary.
Transfer of Assets
Some people transfer their assets to adult children or others in order satisfy Medicaid’s resource requirements. In this way, they aim to avoid using personal assets to pay for nursing home care or home and community-based services and preserve an inheritance while obtaining Medicaid-financed long-term care services. Under federal law, people who transfer assets at less than fair market value within 36 months of applying for Medicaid (a length of time known as the “look-back” period) are ineligible for coverage of nursing home and home and community-based services for a period of time, as described below.58 The look-back period is 60 months in the case of transfers into certain types of trusts.59
When assets are transferred in order to acquire Medicaid eligibility, the exclusion period—or period of ineligibility—is linked to the value of the assets transferred and the cost of nursing home care in a state. For example, if the average cost of private-pay nursing home care in a state is $50,000 a year and $100,000 was transferred, then the exclusion period is two years. While generally an excluded asset for determining Medicaid eligibility, an individual’s home is considered a resource for this purpose, so transfer would incur the exclusion penalty.
58 42 U.S.C. 1396p(c). 59 The 60-month look-back period applies only to revocable trusts where a disbursement is made for the benefit of someone other than the trust beneficiary and to any portion of an irrevocable trust that cannot under any circumstances be made available to or for the benefit of the beneficiary. Otherwise, the standard 36-month look-back period applies.

31
Estate Recovery
Federal law requires states to recover the value of the care provided in a nursing facility, ICF/MR, or other medical institution from the estates of deceased Medicaid beneficiaries (Centers for Medicare and Medicaid Services (d)). For individuals age 55 or older, states are required to recover payments from the individual’s estate for nursing facility services, home and community-based services, and related hospital and prescription drug services. States have the option of recovering payments for all other Medicaid services or other benefits provided to these individuals.
Assistance with Medicare Premiums and Cost Sharing With the exception of the medically needy in some states, the groups discussed
above are eligible for the full range of Medicaid benefits. However, there are individuals who are eligible for more limited assistance, primarily to help them pay the out-of-pocket costs of the Medicare program. States are required to help finance Medicare Part A and Part B premiums, deductibles, and coinsurance for certain low-income elderly and disabled people eligible for Medicare who have incomes too high to qualify for full Medicaid benefits, but for whom Medicare’s out-of-pocket expenses pose a significant financial burden. For example, in 2001, the Medicare hospital deductible was $792 per benefit period and the Part B premium was $50 per month.60 These assistance programs are often collectively referred to as Medicare Savings Programs.
Currently, Medicaid programs must provide assistance with Medicare’s out-of pocket liabilities to four groups of individuals. Assistance to a fifth group ended in 2002.61 Income standards for eligibility, scope of assistance provided, and the entitlement status of participants vary for each group. However, for all four groups, resource standards are twice that of SSI ($4,000 for an individual, $6,000 for a couple). The four categories are:
• Qualified Medicare Beneficiaries (QMBs): These beneficiaries have incomes below 100 percent of the FPL ($715.83 per month for an individual in 2001). QMBs are legally entitled to Medicaid payment of all Medicare Part A and/or Part B premiums, deductibles, and coinsurance.62
• Specified Low-Income Medicare Beneficiaries (SLMBs): These beneficiaries have incomes between 100 and 120 percent ($859.00 per month for an individual in 2001) of the FPL. Qualified individuals are legally entitled to Medicaid payment of the Medicare Part B premium.
60 In 2003, the Medicare hospital deductible is $840 and the Part B premium is $58.70 per month. 61 The fifth category, Qualifying Individuals 2 (QI-2), covered persons with incomes between 135 and 175 percent of the FPL (less than $1,252.71 per month for an individual in 2001). Federal funding was limited, and there was no legal entitlement to benefits. Medicaid paid 2.5 percent of the Medicare Part B premium (which equaled $1.25 per month in 2001). Congress allowed the legal authority for the QI-2 program to expire in December 2002. 62 The vast majority of Medicare beneficiaries do not pay monthly Part A premiums because they or a spouse have 40 or more quarters of Medicare-covered employment. People with less than 30 quarters of Medicare-covered employment pay full Part A premiums ($316 per month in 2003). Those with 30-39 quarters pay reduced premiums ($174 per month in 2003).
32
• Qualified Disabled Working Individuals (QDWIs): These beneficiaries are eligible for Medicare Part A on the basis of disability and have incomes at or below 200 percent of the FPL ($1,431.66 per month for an individual in 2001). QDWIs are legally entitled to Medicaid payment of the Medicare Part A premium ($300 per month in 2001).63 States can require beneficiaries with incomes between 150 and 200 percent of the FPL to pay a share of the premium that is based on a sliding scale.
• Qualifying Individuals 1 (QI-1s): These beneficiaries have incomes between 120 and 135 percent ($966.38 per month for an individual in 2001) of the FPL. Federal funding is capped annually and there is no legal entitlement to the benefit. Medicaid pays the Medicare Part B premium. Initially legislated to expire on December 31, 2002, the QI-1 program was authorized to continue through September 30, 2004.64
Although the basic income and resource standards for these groups are established
by federal statute,65 other provisions in federal law allow states to apply less restrictive income and resource methodologies for determining income and resources for QMBs and SLMBs.66 In 2001, 19 states used less restrictive income-counting methodologies and 20 states used less restrictive resource methodologies when determining eligibility for these groups (Table 10).
Many individuals who qualify for Medicare Savings Programs—particularly
QMBs and, to a lesser extent, SLMBs—also qualify to receive full Medicaid benefits. For these individuals, Medicare is the primary payer for services covered both by Medicare and Medicaid, while Medicaid assists beneficiaries with Medicare’s out-of-pocket costs and pays for services typically not covered by Medicare, such as prescribed drugs and most long-term care services.
Lastly, while states must pay Part A premiums for QMBs (where necessary), they may also choose to “buy-in” other Medicare-eligible individuals who are required to pay Part A premiums (typically due to lack of sufficient work history).67 By paying the Part A premium for these other individuals, states hope to save money by shifting to Medicare most of the cost of inpatient hospital, physician, and other Medicare-covered services.
Discussion The federal government requires states to provide Medicaid coverage to certain
mandatory groups of aged, blind, and disabled people, but states have significant discretion over whether to adopt optional eligibility criteria. This review of Medicaid
63 These individuals pay Medicare Part A premiums because they have not worked enough quarters to qualify for Medicare without paying a premium; see footnote 62. 64 Congress extended the QI-1 program until September 30, 2004 as part of enacting the Medicare Prescription Drug, Improvement, and Modernization Act of 2003. 65 42 U.S.C. 1396a(a)(10)(E). 66 Section 1902(r)(2) of the Social Security Act [42 U.S.C. 1396a(r)(2)]. 67 See footnote 62.
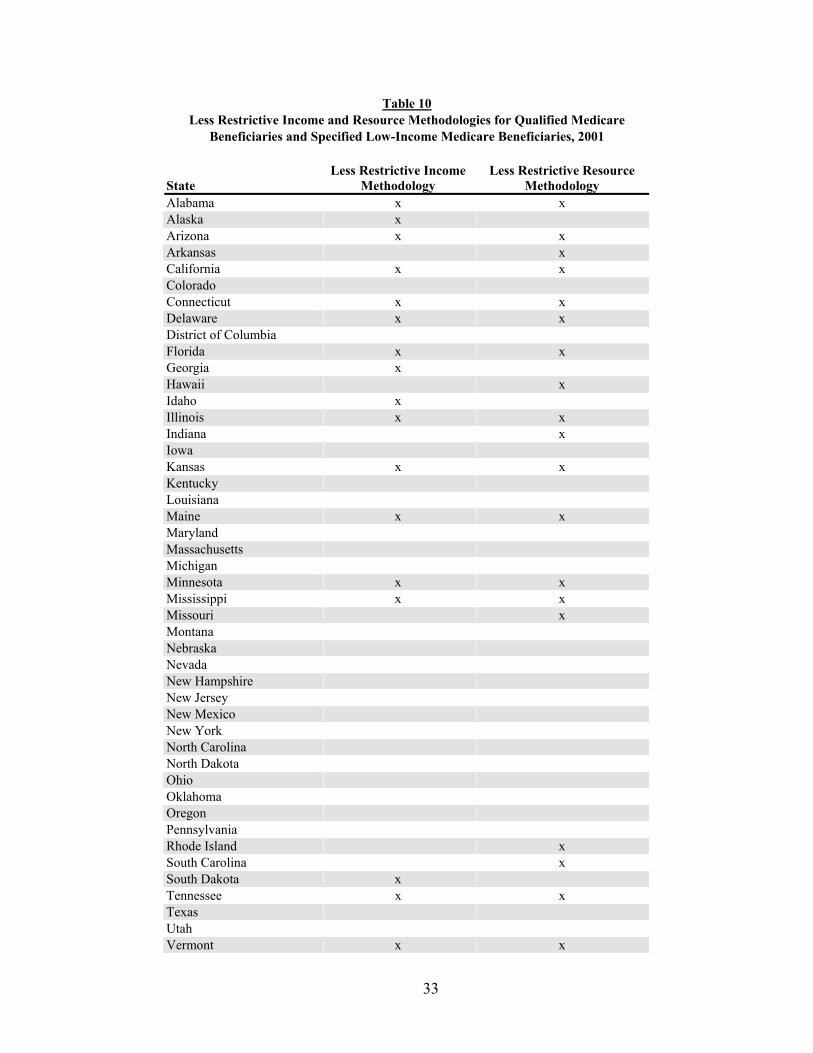
33
Table 10 Less Restrictive Income and Resource Methodologies for Qualified Medicare
Beneficiaries and Specified Low-Income Medicare Beneficiaries, 2001
State Less Restrictive Income
Methodology Less Restrictive Resource
Methodology Alabama x x Alaska x Arizona x x Arkansas x California x x Colorado Connecticut x x Delaware x x District of Columbia Florida x x Georgia x Hawaii x Idaho x Illinois x x Indiana x Iowa Kansas x x Kentucky Louisiana Maine x x Maryland Massachusetts Michigan Minnesota x x Mississippi x x Missouri x Montana Nebraska Nevada New Hampshire New Jersey New Mexico New York North Carolina North Dakota Ohio Oklahoma Oregon Pennsylvania Rhode Island x South Carolina x South Dakota x Tennessee x x Texas Utah Vermont x x
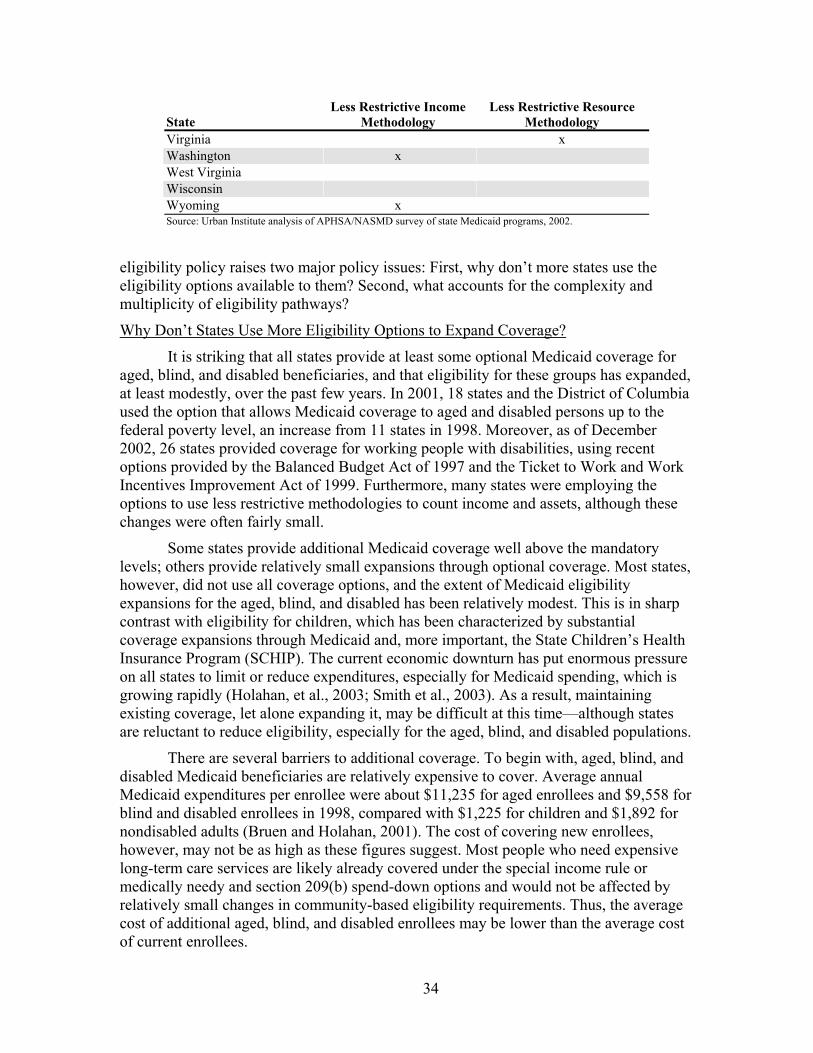
34
State Less Restrictive Income
Methodology Less Restrictive Resource
Methodology Virginia x Washington x West Virginia Wisconsin Wyoming x Source: Urban Institute analysis of APHSA/NASMD survey of state Medicaid programs, 2002.
eligibility policy raises two major policy issues: First, why don’t more states use the eligibility options available to them? Second, what accounts for the complexity and multiplicity of eligibility pathways?
Why Don’t States Use More Eligibility Options to Expand Coverage?
It is striking that all states provide at least some optional Medicaid coverage for aged, blind, and disabled beneficiaries, and that eligibility for these groups has expanded, at least modestly, over the past few years. In 2001, 18 states and the District of Columbia used the option that allows Medicaid coverage to aged and disabled persons up to the federal poverty level, an increase from 11 states in 1998. Moreover, as of December 2002, 26 states provided coverage for working people with disabilities, using recent options provided by the Balanced Budget Act of 1997 and the Ticket to Work and Work Incentives Improvement Act of 1999. Furthermore, many states were employing the options to use less restrictive methodologies to count income and assets, although these changes were often fairly small.
Some states provide additional Medicaid coverage well above the mandatory levels; others provide relatively small expansions through optional coverage. Most states, however, did not use all coverage options, and the extent of Medicaid eligibility expansions for the aged, blind, and disabled has been relatively modest. This is in sharp contrast with eligibility for children, which has been characterized by substantial coverage expansions through Medicaid and, more important, the State Children’s Health Insurance Program (SCHIP). The current economic downturn has put enormous pressure on all states to limit or reduce expenditures, especially for Medicaid spending, which is growing rapidly (Holahan, et al., 2003; Smith et al., 2003). As a result, maintaining existing coverage, let alone expanding it, may be difficult at this time—although states are reluctant to reduce eligibility, especially for the aged, blind, and disabled populations.
There are several barriers to additional coverage. To begin with, aged, blind, and disabled Medicaid beneficiaries are relatively expensive to cover. Average annual Medicaid expenditures per enrollee were about $11,235 for aged enrollees and $9,558 for blind and disabled enrollees in 1998, compared with $1,225 for children and $1,892 for nondisabled adults (Bruen and Holahan, 2001). The cost of covering new enrollees, however, may not be as high as these figures suggest. Most people who need expensive long-term care services are likely already covered under the special income rule or medically needy and section 209(b) spend-down options and would not be affected by relatively small changes in community-based eligibility requirements. Thus, the average cost of additional aged, blind, and disabled enrollees may be lower than the average cost of current enrollees.
35
In addition to the financial costs, states may give priority to providing additional coverage to other low-income groups, especially those that do not have access to Medicare or other insurance coverage. Some states may believe that Medicare provides at least some help to aged, blind, and disabled persons and that their first priority should be to help groups that have no other coverage. Even at their often low financial eligibility levels, Medicaid income limits for the SSI population are far higher than they are for adults receiving Temporary Assistance for Needy Families in most states.68 Older people and younger people with disabilities, however, are more likely than other adults to be in poor health and need expensive health and long-term care services.
A complicating factor is that, in some states, there is ideological opposition to expanding Medicaid coverage. Medicaid’s reputation has always been mixed, even among its strongest supporters. Some state and federal officials and policymakers believe that Medicaid is a fatally flawed, inefficient program that should not be expanded, while others view the program’s historical association with cash welfare as a reason not to use it to expand coverage. For example, until recently when federal Medicaid matching funds became available through research and demonstration waivers, states establishing pharmaceutical assistance programs for older people and people with disabilities worked hard to administratively separate the programs from Medicaid, largely because of the fear that an association with Medicaid would create a welfare stigma that would discourage enrollment (Tilly and Wiener, 2001). At another level, some officials simply may not like the idea of expanding government entitlement programs, especially those that are likely to grow substantially in the future with the aging of the population.
What Accounts for the Complexity of Eligibility Pathways?
Medicaid eligibility rules are often complex; even within a single state, there may be several pathways to Medicaid eligibility for aged, blind, and disabled people. This complexity stands in sharp contrast to recent efforts to simplify eligibility for children in Medicaid and SCHIP(Cohen-Ross and Cox, 2002). While the numerous eligibility options add to the complexity of the Medicaid program, they represent coverage possibilities for approaches that may never be required of states, such as coverage of the medically needy or poverty level coverage of older people.
Medicaid eligibility is complicated for several reasons. Multiple eligibility pathways reflect the piecemeal evolution of the Medicaid program, in which the federal government authorized additional coverage categories over time. Instead of replacing older, more restrictive coverage categories with newer, more generous options, the law and states simply added options. In addition, mandatory coverage requirements preclude eliminating some categories of coverage even though they may be subsumed by other categories. For example, because states must cover SSI beneficiaries (or people eligible under the 209(b) option), they cannot eliminate that coverage category even if they are using the option to cover all aged and disabled people up to the FPL.
Multiple eligibility pathways may also reflect state preferences for redundancy of coverage options in order to ensure that all the targeted populations are covered, rather
68 The Temporary Assistance for Needy Families (TANF) replaced the Aid to Families with Dependent Children (AFDC) program in 1996.

36
than risking that some individuals might fall through the cracks. Thus, the redundancy of eligibility policy may serve the goal of ensuring coverage. The complexity may also reflect a desire by states to retain the flexibility to provide fallback coverage if budget constraints force them to make eligibility cuts, or if they are dissatisfied with changes in federal regulations involving a particular option. Furthermore, while certain coverage options in particular states may appear to be redundant, they may not be duplicative for certain groups. Persons below specified income and resource limits may be covered by eligibility options with higher thresholds, but these options may provide an avenue for covering individuals with higher incomes who must spend down using the medically needy or 209(b) options.
As an example, consider the multiple pathways to Medicaid eligibility that Minnesota offered for aged, blind, and disabled people in October 2001 (Table 11). The poverty-related rules apply to most individuals who do not require long-term care. The highest income standard at which persons living independently in the community could qualify for Medicaid in Minnesota was 100 percent of the FPL in 2001, rendering section 209(b) and SSP-related criteria moot for persons with incomes below the poverty-related threshold. However, the medically needy and 209(b) options allow for coverage of persons with income greater than 100 percent of the FPL; both the medically needy income levels and 209(b) income thresholds medically needy income levels or 209(b) income thresholds are set at 70 percent of the FPL, lower than the standards for poverty-related coverage.
Individuals requiring care in a nursing home or other long-term care institution could qualify for Medicaid coverage in Minnesota with incomes as high as 300 percent of the federal SSI payment level ($1,590 for an individual in 2001), which is far higher than the medically needy income standard of 70 percent of the FPL. However, under the 300 percent of SSI coverage option, individuals with incomes above that threshold are ineligible for Medicaid regardless of their medical expenses unless they establish a Medicaid qualifying income trust. Thus, individuals with higher income must spend down to 70 percent of the FPL using either the medically needy or 209(b) option. Under these two options, aged, blind, and disabled persons receiving Medicaid-financed institutional care are required to contribute all of their income toward the cost of such care, except for a small personal needs allowance. As a result, qualifying income thresholds for institutional care do not provide a mechanism for protecting personal income.
At a state’s option, the 300 percent of SSI income limit can also be applied to individuals age 65 and older who are eligible to receive home and community-based waiver services in lieu of being institutionalized. Minnesota has adopted this option, which allows the state to offer a greater number of services than are normally provided to community-based individuals under its Medicaid plan. The result is a more level playing field between persons seeking institutional services and those who prefer to receive services in the community. Minnesota has chosen to establish a lower eligibility threshold for the nonelderly population than for the elderly population. Younger individuals with disabilities qualify for home and community-based long-term care services at 100 percent
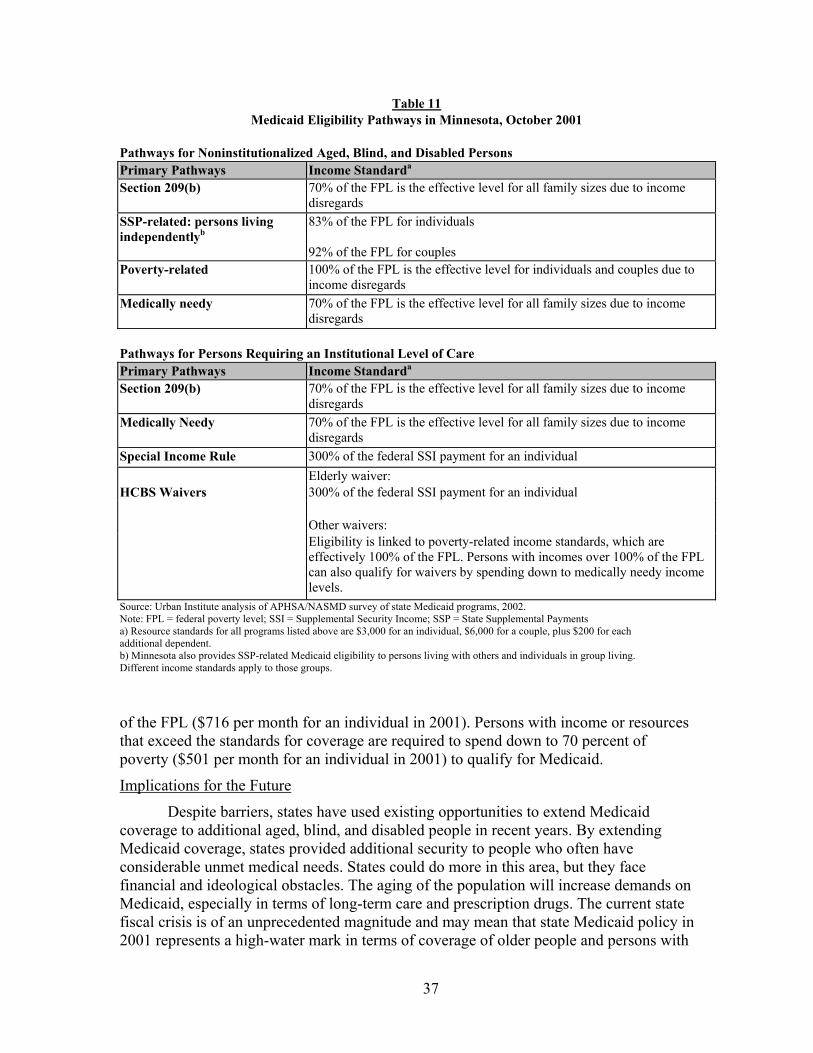
37
Table 11 Medicaid Eligibility Pathways in Minnesota, October 2001
Pathways for Noninstitutionalized Aged, Blind, and Disabled Persons Primary Pathways Income Standarda
Section 209(b) 70% of the FPL is the effective level for all family sizes due to income disregards
SSP-related: persons living independentlyb
83% of the FPL for individuals
92% of the FPL for couples Poverty-related 100% of the FPL is the effective level for individuals and couples due to
income disregards Medically needy 70% of the FPL is the effective level for all family sizes due to income
disregards
Pathways for Persons Requiring an Institutional Level of Care Primary Pathways Income Standarda
Section 209(b) 70% of the FPL is the effective level for all family sizes due to income disregards
Medically Needy 70% of the FPL is the effective level for all family sizes due to income disregards
Special Income Rule 300% of the federal SSI payment for an individual Elderly waiver:
HCBS Waivers 300% of the federal SSI payment for an individual Other waivers: Eligibility is linked to poverty-related income standards, which are effectively 100% of the FPL. Persons with incomes over 100% of the FPL can also qualify for waivers by spending down to medically needy income levels.
Source: Urban Institute analysis of APHSA/NASMD survey of state Medicaid programs, 2002. Note: FPL = federal poverty level; SSI = Supplemental Security Income; SSP = State Supplemental Payments a) Resource standards for all programs listed above are $3,000 for an individual, $6,000 for a couple, plus $200 for each additional dependent. b) Minnesota also provides SSP-related Medicaid eligibility to persons living with others and individuals in group living. Different income standards apply to those groups.
of the FPL ($716 per month for an individual in 2001). Persons with income or resources that exceed the standards for coverage are required to spend down to 70 percent of poverty ($501 per month for an individual in 2001) to qualify for Medicaid.
Implications for the Future
Despite barriers, states have used existing opportunities to extend Medicaid coverage to additional aged, blind, and disabled people in recent years. By extending Medicaid coverage, states provided additional security to people who often have considerable unmet medical needs. States could do more in this area, but they face financial and ideological obstacles. The aging of the population will increase demands on Medicaid, especially in terms of long-term care and prescription drugs. The current state fiscal crisis is of an unprecedented magnitude and may mean that state Medicaid policy in 2001 represents a high-water mark in terms of coverage of older people and persons with
38
disabilities. In general, states have sought to avoid cutting eligibility, but their fiscal problems are so great that they may resort to these strategies. It is critical to monitor future changes in Medicaid policy so that policymakers will know whether eligibility is expanding or contracting.

39
References American Health Care Association. 2001. Facts & Trends: The Nursing Facility Source Book Washington, D.C.: American Health Care Association. Bruen, Brian and John Holahan. 2001. Medicaid Spending Growth Remained Modest in 1998, But Likely Headed Upward. Washington, D.C.: The Kaiser Commission on Medicaid and the Uninsured. Bruen, Brian, Joshua M. Wiener, Johnny Kim, and Ossai Miazad. 1999. State Usage of Medicaid Coverage Options for Aged, Blind, and Disabled People, Assessing the New Federalism Discussion Paper 99-09. Washington, D.C.: The Urban Institute.
Centers for Medicare and Medicaid Services (a), no date. Work Incentives Eligibility Groups. Washington, D.C.: author. Available via internet at http://www.cms.hhs.gov/twwiia/statemap.asp (accessed December 3, 2002). Centers for Medicare and Medicaid Services (b), no date. Financial Management Report for FY2001. Washington, D.C.: author. Available via internet at http://cms.hhs.gov/medicaid/mbes/ofs-64.asp (accessed December 6, 2002). Centers for Medicare and Medicaid Services (c), no date. Nursing Home Care Expenditures Aggregate and Per Capita Amounts and Percent Distribution, by Source of Funds: Selected Calendar Years 1980–2000. Washington, D.C.: author. Available via internet at http://cms.hhs.gov/statistics/nhe/historical/t7.asp (accessed December 6, 2002). Centers for Medicare and Medicaid Services. 2001. Medicaid Eligibility Groups and Less Restrictive Methods of Determining Income and Resources: Questions and Answers. Washington, D.C.: author. Available via internet at http://cms.hhs.gov/medicaid/eligiblity/elig0501.pdf (accessed February 11, 2003). Centers for Medicare and Medicaid Services (d), no date. Estate Recovery Provision. Washington, D.C.: author. Available via internet at http://cms.hhs.gov/statistics/nhe/historical/t7.asp (accessed February 26, 2002). Centers for Medicare and Medicaid Services, National Health Statistics Group, Office of the Actuary. 2002. Estimated Spending for Freestanding Nursing Home Care, Calendar Years 1960–2000 (unpublished data). Baltimore, Md.: Centers for Medicare and Medicaid Services. Cohen-Ross, Donna and Laura Cox. Making it Simple: Medicaid for Children and CHIP Income Guidelines and Enrollment Procedures. 2000. Washington, D.C.: Center on Budget and Policy Priorities.
Cohen-Ross, Donna and Laura Cox. 2002. Enrolling Children and Families in Health Coverage Programs: The Promise of Doing More. Washington, D.C.: Center for Budget and Policy Priorities.
40
Committee on Ways and Means, U.S. House of Representatives. 2000. Green Book, Table 3-15. Washington, D.C.: U.S. Government Printing Office. Congressional Budget Office. 2002. March 2002 Baseline: Medicaid and the State Children’s Health Insurance Program: Fact Sheet. Washington, D.C.: author. Gross, David and Normandy Brangan. 1999. Out-of-Pocket Spending on Health Care by Medicare Beneficiaries Age 65 and Older: 1999 Projections. Washington, D.C.: AARP and the Lewin Group. Health Care Financing Administration. 2001. “Medicaid Program: Change in Application of Federal Financial Participation Limits.” Federal Register 66(8): 2316-2322. Holahan, John, Joshua M. Wiener, Randall R. Bovbjerg, Barbara A. Ormond, and Stephen Zuckerman. 2003. The State Fiscal Crisis and Medicaid: Will Health Programs Be Major Budget Targets? Washington, D.C.: Kaiser Family Foundation. Jones, Adrienne. 2002. “The National Nursing Home Survey: 1999 Summary.” Vital and Health Statistics 13: 152. Maxwell, Stephanie, Marilyn Moon, and Misha Segal. 2001. Growth in Medicare and Out-of-Pocket Spending: Impact on Vulnerable Beneficiaries. 2001. New York, NY: The Commonwealth Fund. Schneider, Andy, Kristen Fennel, and Patricia Keenan. 1999. Medicaid Eligibility for the Elderly. Washington, DC: Kaiser Family Foundation. Smith, Vernon, Kathy Gifford, Rekha Ramesh, and Victoria Wachino. 2003. Medicaid Spending Growth: A 50-State Update for Fiscal Year 2003. Washington, D.C.: The Kaiser Family Foundation. Social Security Administration (no date). Understanding Supplemental Security Income. Washington, D.C.: author. Available via internet at http://www.ssa.gov/notices/supplemental-security-income/text-understanding-ssi.htm. Accessed May 2, 2002. Tilly, Jane and Joshua M. Wiener. 2001. “State Pharmaceutical Assistance Programs for Older and Disabled Americans,” Health Affairs 20(5): 223–232. Wiener, Joshua M., Catherine M. Sullivan, and Jason Skaggs. 1996. Spending Down to Medicaid: New Data on the Role of Medicaid in Paying for Nursing Home Care. Washington, D.C.: AARP.