Medicaid: Current Challenges and Future Prospects · Medicaid: Current Challenges and Future...
34
Medicaid: Current Challenges and Future Prospects Diane Rowland, Sc.D. Executive Vice President, Henry J. Kaiser Family Foundation Executive Director, Kaiser Commission on Medicaid and the Uninsured The Future of Medicaid: Building a Sustainable Program through Innovation Muskie School of Public Service, University of Southern Maine Augusta, Maine November 22, 2013
Transcript of Medicaid: Current Challenges and Future Prospects · Medicaid: Current Challenges and Future...

Medicaid: Current Challenges and Future Prospects
Diane Rowland, Sc.D.
Executive Vice President, Henry J. Kaiser Family Foundation
Executive Director, Kaiser Commission on Medicaid and the Uninsured
The Future of Medicaid: Building a Sustainable Program through Innovation
Muskie School of Public Service, University of Southern Maine
Augusta, Maine
November 22, 2013

Figure 1
Uninsured16%
Medicaid16%
Medicare13%
Other Public1%
Private Non-Group
5%
Employer-Sponsored Insurance
49%
Health Coverage
NOTE: Health spending total does not include administrative spending. SOURCE: Health insurance coverage: KCMU/Urban Institute analysis of 2011 data from 2012 ASEC Supplement to the CPS. Health expenditures: KFF calculations using 2011 NHE data from CMS, Office of the Actuary
Consumer Out-of-Pocket
13%Medicaid
16%
Medicare24%
Other Government
Programs4%
Other Private Funds
8%
Private Health
Insurance35%
Health Spending
Medicaid is an integral part of the health system.
Total = 307.9 million Total = $2.3 trillion

Figure 2
Medicaid has many roles in our health care system.
Health Insurance Coverage
32 million children & 18 million adults in low-income families; 16 million elderly and persons
with disabilities
State Capacity for Health Coverage
For FY 2014, FMAPs range
from 50 – 73.1%
MEDICAID
Support for Health Care System and Safety-net
16% of national health spending;
40% of long-term care spending
Assistance to Medicare Beneficiaries
9.6 million aged and disabled — 20% of Medicare
beneficiaries
Long-Term Care Assistance
1.6 million institutional residents; 2.9 million
community-based residents

Figure 3
Mandatory State Option
Acute Care •Inpatient & outpatient hospital
services
•Laboratory and x-ray services
•Physician, nurse practitioner
services, nurse midwife, and
other advanced practice nursing
services
•Federally-qualified health
centers; rural health centers
•EPSDT for children
•Family planning services
•Transportation
•No cost sharing for children
•Care by other licensed practitioners (chiropractic, podiatry, etc.)
•Pharmacy
•Dental services
•Diagnostic, screening, preventive, and rehab services
•Clinic services
•Primary care case management
•Occupational & physical therapy
•Speech, hearing, and language disorder services
•Medical supplies and durable medical equipment, eyeglasses,
and orthotic and prosthetic devices
•Limited nominal cost sharing for adults
Long Term
Care
•Nursing facility for age 21 and up
•Home health (if entitled to NF
care)
•Inpatient psychiatric services–if age under 21 or over 65
•Intermediate care facilities for people with developmental
disabilities
•Home health
•Case management
•Community-based care (private duty nursing, personal care,
hospice, adult day health)
•Community-based care (licensed social worker protective
services, etc.)
Medicaid Benefits

Figure 4
Children49%
Children21%
Adults27%
Adults15%
Elderly22%
Disabled15%
Disabled42%
National MedicaidEnrollees
Total = 66.4 Million
National MedicaidExpenditures
Total = $369.3 Billion
Elderly 9%
SOURCE: KCMU/Urban Institute estimates based on data from FY 2010 MSIS and CMS-64. MSIS FY 2009 data were used for CO, ID, MO, NC, and WV, but adjusted to 2009 CMS-64.
Medicaid spending is mostly for the elderly and people with disabilities, especially in Maine.
Children34%
Children14%
Adults28%
Elderly18%
Elderly27%
Disabled20%
Disabled49%
MaineCare EnrolleesTotal = 375,943
MaineCareExpenditures
Total = $2.2 Billion
Adults 10%

Figure 5
$2,296 $3,012
$10,037
$3,615
$63 $12
$6,203
$9,344
$2,359 $3,025
Children Adults Individuals withDisabilities
Elderly
Acute Care Long-Term Care
$16,240
$12,958
SOURCE: Kaiser Commission on Medicaid and the Uninsured and Urban Institute estimates based on data from FY 2010 MSIS and CMS-64 reports. Because 2010 data were unavailable, 2009 MSIS data were used for CO, ID, MO, NC, and WV, and then adjusted to 2010 CMS-64 spending levels.
Disability and long-term care needs drive higher spending.
Medicaid Payments Per Enrollee by Acute and Long-Term Care, FY 2010

Figure 6
Connecting People to Coverage

Figure 7
0
10
20
30
40
50
60
70
1965 1968 1971 1974 1977 1980 1983 1986 1989 1992 1995 1998 2001 2004 2007 2010*
NOTE: * Projections based on CMS 2010 Actuarial Report. SOURCE: KCMU analysis of data from the Health Care Financing Administration and Centers for Medicare and Medicaid Services, 2011.
Medicaid Eligibility Milestones, 1965-2011
Millions of Medicaid Beneficiaries
Medicaid Eligibility Expanded to Women and Children (1984-1990)
AFDC Repealed(1996)
(67.3 Million Beneficiaries*)
ACAEnacted(2010)
Great Recession and State Fiscal Crisis
(2007)
Recession and State Fiscal Crisis
(2000)
CHIPRAEnacted(2004)
Medicaid Enacted (1965)
SSIEnacted (1972)
Section 1115 Waivers Expand Medicaid Eligibility (1991-1993)
SCHIPEnacted (1997)

Figure 8
63%
50%
16%
20%
0%
46%
40%
71%
36%
27%
45%
Nursing Home Residents
People with HIV in Regular Care
Nonelderly Adults with Functional Limits
Medicare Beneficiaries
Births (Pregnant Women)
Parents Below 100% FPL
Children Below 100% FPL
All Children
Nonelderly Between 100% and 199% FPL
Nonelderly Below 100% FPL
Percent with Medicaid Coverage
NOTE: FPL-- Federal Poverty Level. The FPL was $23,050 for a family of four in 2012. SOURCE: Kaiser Commission on Medicaid and the Uninsured (KCMU) and Urban Institute analysis of 2012 ASEC Supplement to the CPS; Birth data from Maternal and Child Health Update, National Governors Association, 2012; Medicare data from MCBS Cost and Use file, 2009; Functional Limitations from KCMU Analysis of 2012 NHIS data; Nursing Home Residents from 2011 OSCAR data.
Medicaid plays a critical role for selected populations.
Families
Elderly and People with Disabilities

Figure 9
Medicaid’s benefits reflect the needs of the population it serves.
Low-Income Families
•Pregnant Women: Pre-natal care and delivery costs
•Children: Routine and specialized care for childhood development (immunizations, dental, vision, speech therapy)
•Families: Affordable coverage to prepare for the unexpected (emergency dental, hospitalizations, antibiotics)
Individuals with
Disabilities
•Child with Autism: In-home therapy, speech/occupational therapy
•Cerebral Palsy: Assistance to gain independence (personal care, case management and assistive technology)
•HIV/AIDS: Physician services, prescription drugs
•Mental Illness: Prescription drugs, physicians services
Elderly Individuals
•Medicare beneficiary: help paying for Medicare premiums and cost sharing
•Community Waiver Participant: community based care and personal care
•Nursing Home Resident: care paid by Medicaid since Medicare does not cover institutional care

Figure 10
Medicaid is central for children’s coverage.
Data may not total 100% due to rounding .SOURCE: KCMU/Urban Institute analysis of 2013 ASEC supplement to the CPS.
13%
36%
73%
51%
14%
13%
Employer/Other Private Medicaid/Other Public Uninsured
Poor(<100% of Poverty)
Near-Poor(100%-199% of Poverty)
46%
16%
19%
43%
35%
41%
Near-Poor
Poor
40%
27%
24%
30%
36%
43%
Near-Poor
Poor
Children
Parents
Adults without Children

Figure 11
2% 2% 1%
11%6%
4%3% 2% 1%
12% 11% 9%
29%
18%
11%
55%
29%25%
No UsualSource of Care
PostponedSeeking CareDue to Cost
Went WithoutNeeded CareDue to Cost
No UsualSource of Care
PostponedSeeking CareDue to Cost
Went WithoutNeeded CareDue to Cost
Employer/Other Private Medicaid/Other Public Uninsured
NOTES: In past 12 months. Respondents who said usual source of care was the emergency room were included among those not having a usual source of care. All differences between the uninsured and the two insurance groups are statistically significant (p<0.05).SOURCE: KCMU analysis of 2013 NHIS data.
Medicaid provides access to care that is comparable to private insurance and better than access for the uninsured.
Children Nonelderly Adults

Figure 12
*Difference from Medicaid is significant at .01 level. SOURCE: Coughlin T et al., What Difference Does Medicaid Make: Assessing Cost Effectiveness, Access, and Financial Protection under Medicaid for Low-Income Adults, Kaiser Commission on Medicaid and the Uninsured, May 2013. Appendix Table 1, data from 2003-2009 MEPS.
Even though adults with Medicaid are both poorer and sicker than low-income adults with private health insurance.
57%*
11%*7%*
32%*
21%*
82%
36%
26%
48%53%
72%*
18%*12%*
19%*
29%*
< 100% FPL Fair/Poor Health Fair/Poor MentalHealth
>1 ChronicCondition
Any Limitation
ESI Medicaid Uninsured
Selected characteristics of adults <139% FPL:
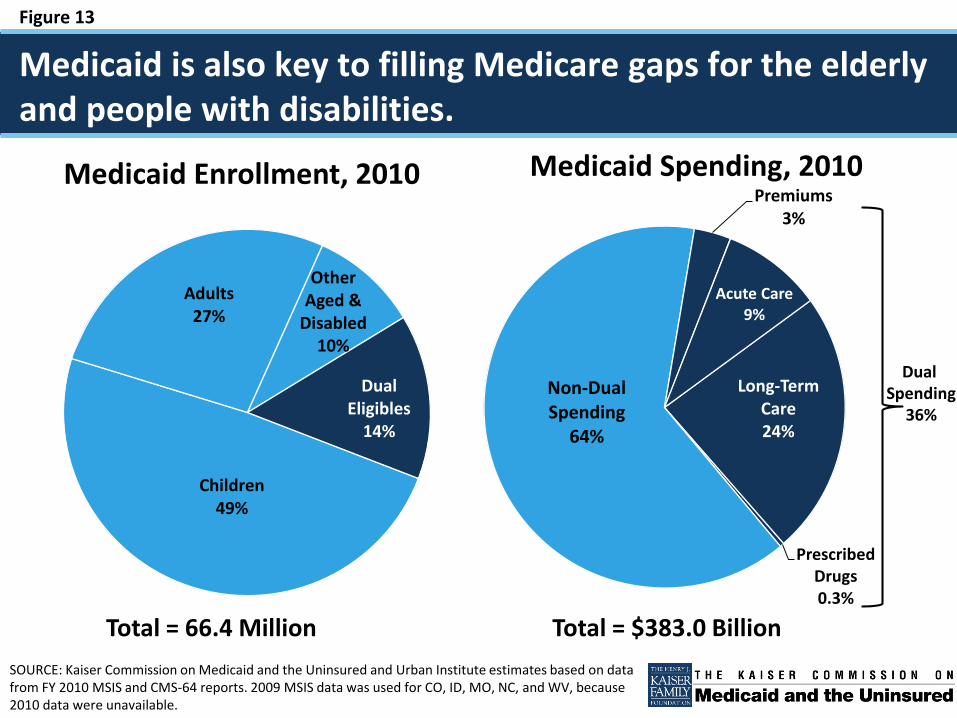
Figure 13
Children49%
Adults27%
Other Aged &
Disabled10%
Dual Eligibles
14%
Medicaid Enrollment, 2010
SOURCE: Kaiser Commission on Medicaid and the Uninsured and Urban Institute estimates based on data from FY 2010 MSIS and CMS-64 reports. 2009 MSIS data was used for CO, ID, MO, NC, and WV, because 2010 data were unavailable.
Long-Term Care24%
Prescribed Drugs0.3%
Non-Dual Spending
64%
Premiums3%
Acute Care9%
Medicaid Spending, 2010
Medicaid is also key to filling Medicare gaps for the elderly and people with disabilities.
Dual Spending
36%
Total = 66.4 Million Total = $383.0 Billion

Figure 14
Private Insurance,
7%
NOTE: Total long-term care expenditures include spending on residential care facilities, nursing homes, home health services, personal care services (government-owned and private home health agencies), and § 1915(c) home and community-based waiver services (including home health). Long-term care expenditures also include spending on ambulance providers. All home and community-based waiver services are attributed to Medicaid. SOURCE: KCMU estimates based on FY 2011 Centers for Medicare & Medicaid Services (CMS) National Health Expenditure Accounts data.
And Medicaid is a major financer of long-term care.
Medicaid, 40%
Medicare Post-Acute Care, 21%
Other Public and
Private, 18%
Out-of-Pocket,
15%
Total National LTSS Spending = $357 billion, 2010
2002 2006 2010
(in billions)
$93
$111
$123
68%
41%
59%
32%
55%
45%
Home and Community-Based Services
Institutional Services

Figure 15
Health Needs Drive Spending and Spending Drives Budget Concerns

Figure 16
NOTE: FMAP percentages are rounded to the nearest tenth of a percentage point. These rates are in effect Oct. 1, 2013-Sept. 30, 2014.SOURCE: Federal Register, November 30, 2012 (Vol. 77, No. 231), pp 71420-71423, at http://www.gpo.gov/fdsys/pkg/FR-2012-11-30/html/2012-29035.htm.
Federal and state governments share Medicaid costs.
WA
OR
WY
UT
TX
SD
OK
ND
NM
NVNE
MT
LA
KS
ID
HI
COCA
ARAZ
AK
WI
WV VA
TNSC
OH
NCMO
MS
MN
MI
KY
IA
INIL
GA
FL
AL
VT
PA
NY
NJ
NH
MA
ME
DC
CT
DE
RI
MD
50.1-59.9 percent (12 states)
50 percent (15 states)
60.0-66.9 percent (13 states)
67.0-73.1 percent (11 states, including DC)
FFY 2014 FMAP
Federal Medicaid Matching Rates, FFY 2014Maine FMAP: 61.55%

Figure 17
4.7%
6.8%
8.7%
10.4%
12.7%
8.5%7.7%
6.4%
1.3%
3.8%
5.8%7.6%
6.6%
9.7%
1.0%
3.8%
10.3%
-1.9%
0.4%
3.2%
7.5%
9.3%
5.6%
4.3%3.2%
0.2%-0.5%
3.1%
7.8%7.2%
4.4%3.2%
2.5%
8.8%
1998 1999 2000 2001 2002 2003 2004 2005 2006 2007 2008 2009 2010 2011 2012 2013 2014
Spending Growth Enrollment Growth
NOTE: Enrollment percentage changes from June to June of each year. Spending growth percentages in state fiscal year. SOURCE: Medicaid Enrollment June 2012 Data Snapshot, KCMU, August 2013. Spending Data from KCMU Analysis of CMS Form 64 Data for Historic Medicaid Growth Rates. FY 2012 - 2014 data based on KCMU survey of Medicaid officials in 50 states and DC conducted by Health Management Associates, October 2013.
For Medicaid, cost is always a challenge.
Adopted

Figure 18
2.3%
3.3%
5.3%
Medicaid Medical Services PerEnrollee
NHE Per Capita Private Health Insurance PerEnrollee
Spending Growth, FY 2007-2011
SOURCE: Medicaid estimates from Urban Institute analysis of data from the Medicaid Statistical Information System (MSIS), Medicaid Financial Management Reports (CMS Form 64), and Kaiser Commission on Medicaid and the Uninsured and Health Management Associates data. NHE and private health insurance data from Centers for Medicare & Medicaid Services Office of the Actuary, National Health Statistics Group.
Although Medicaid cost growth is slower than overall health care costs.

Figure 19
NOTE: Spending includes both state and federal payments to Medicaid. These figures represent the average (mean) level of payments across all Medicaid enrollees. Spending per enrollee does not include disproportionate share hospital payments (DSH). Some enrollees are only eligible for a limited set of benefits. A small fraction of elderly and disabled enrollees in every state qualify only for assistance with their Medicare premiums and coinsurance.SOURCE: Kaiser Commission on Medicaid and the Uninsured and Urban Institute estimates based on data from FY 2009 MSIS and CMS-64 reports, 2012.
Medicaid spending per enrollee varies across states. (FFY 2009)
WY
WI
WV
WA
VA
VT
UT
TX
TN
SD
SC
RI
PA
OR
OK
OH
ND
NC
NY
NM
NJ
NH
NVNE
MT
MO
MS
MN
MI
MA
MD
ME
LA
KYKS
IA
INIL
ID
HI
GA
FL
DC
DE
CT
COCA
ARAZ
AK
AL
$5000-$6000 (15 states)
Under $5000 (14 states)
$6000-$7000 (10 states)
Over $7000 (12 states including DC)
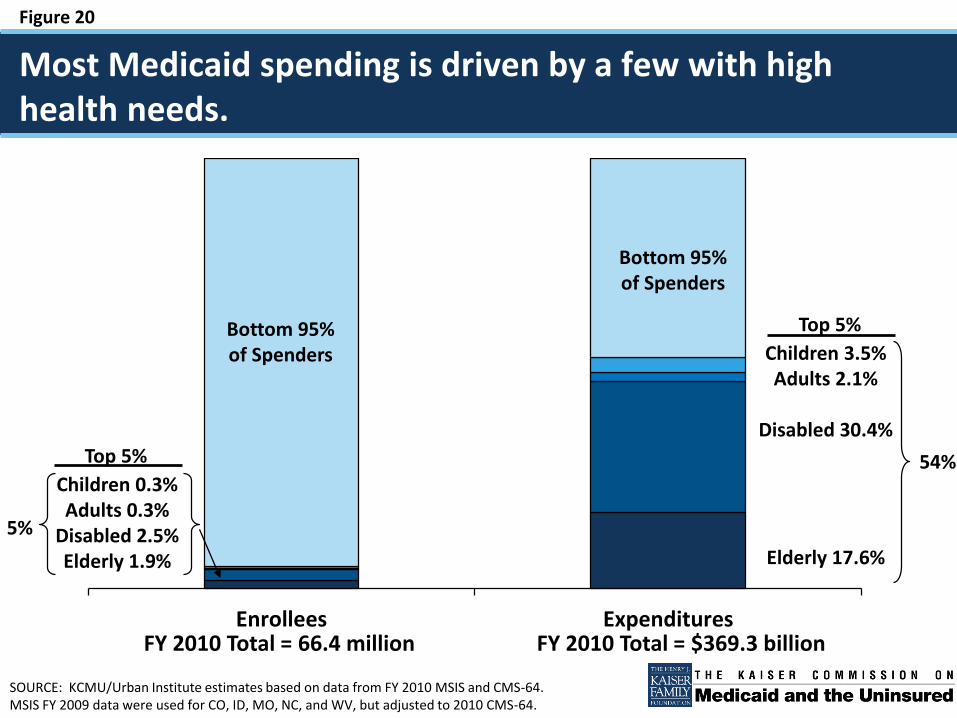
Figure 20
Enrollees Expenditures
SOURCE: KCMU/Urban Institute estimates based on data from FY 2010 MSIS and CMS-64.MSIS FY 2009 data were used for CO, ID, MO, NC, and WV, but adjusted to 2010 CMS-64.
Most Medicaid spending is driven by a few with high health needs.
FY 2010 Total = 66.4 million FY 2010 Total = $369.3 billion
Bottom 95% of Spenders
Top 5%
Top 5%
5%
54%
Bottom 95% of Spenders
Children 0.3%Adults 0.3%
Disabled 2.5%Elderly 1.9%
Children 3.5%Adults 2.1%
Disabled 30.4%
Elderly 17.6%

Figure 21
State Options and Opportunities

Figure 22
Core Requirements State Options
Eligibility and Enrollment
• Federal minimum coverage of certain low-income groups (pregnant women, children, elderly and disabled, parents)
• Maintenance of Eligibility (MOE)• Streamlined and simplified enrollment
procedures
• Coverage beyond federal minimum levels• ACA early expansion option for childless adults• ACA Medicaid Expansion to 138% FPL
(requirement with limited authority to enforce)• Additional enrollment simplifications (e.g., ELE,
12-month continuous eligibility)
Benefits and Cost Sharing
• Required benefits set in statute • Optional benefits• Cost sharing within federal rules
Care Delivery and Provider Payments
• Payments must be “consistent with efficiency, economy, quality and access”
• Some requirements for specific providers/services (FQHCSs, MCOs, etc.)
• Delivery systems (FFS, MCOs, PCCM, combination)
• New ACA options (CMMI, new grants)• Premium assistance options
Long-Term Services and Supports
• Nursing home coverage and quality standards
• Olmstead• Resource and asset tests
• Level of need determinations• Community-based care options (HCBS and new
ACA requirements)• Duals demos
Federal Core Requirements and State Options in Medicaid: Current Policies and Key Issues. Kaiser Commission on Medicaid and the Uninsured, April 2011
States have flexibility to administer core Medicaid programs.

Figure 23
Section 1115 waivers enable demonstrations.
• Section 1115 waiver authority provided for “experimental, pilot, or demonstration projects,” which are “likely to assist in promoting the objectives” of the program
• Secretary of HHS has authority to:
– Waive compliance with certain federal Medicaid requirements
– Provide federal matching funds for costs that would not otherwise be included as Medicaid expenditures
• Required to be budget neutral for the federal government
– Enforced through a cap on federal matching funds over the life of the waiver
• Approved through a series of negotiations between a state and HHS
– Generally approved for an initial five-year period
– Can be extended, typically for three years
– Can be amended, subject to federal approval

Figure 24
0 Days 15 Days 30 Days 45 Days 60 Days0 Days 15 Days 30 Days
State Posts Waiver Proposal
State Holds At Least 2 Public Hearings
Earliest End Date for State Notice and Comment Period
Latest Date for Federal Notice of Receipt to State
End of Federal Notice and Comment Period*
Earliest Date for Federal Approval*
State Submits Application to CMS
* If the federal government provides the notice of receipt to the state earlier than within 15 days of the state submission, the timelines for the end of the federal notice and comment period and earliest date for federal approval could be shorter.
Approval Process Requirements for Section 1115 Waivers, Effective April 27, 2012
Timeline of Minimum Public Comment and Approval Requirements for Section 1115 Waivers:

Figure 25
Other Waiver Authorities in Medicaid
• Section 1115A: Center for Medicare and Medicaid Innovation (ACA)
– Waiver authority to test, evaluate, and expand different service delivery and payment methodologies to foster patient-centered care, improve quality, and slow cost growth in Medicare, Medicaid, and CHIP
– $10 billion in funding over 10 years
• Section 1915(b): To enroll many Medicaid beneficiaries in mandatory managed care
• Section 1915(c): To provide home and community-based services to people who would otherwise need institutional care
• Section 1916(f): To approve higher cost-sharing than otherwise allowed if a demonstration meets specified requirements and criteria

Figure 26
States are expanding their use of managed care in Medicaid through a range of actions.
17
13
6 5 4
20
912
85
14
35
1514
10 10
23
Any of theseChanges
Expanded ServiceAreas
Added EligibilityGroups
Added MandatoryEnrollment
Managed Long-Term Care
Quality Initiativesor Major Contract
Changes
Number of states taking action:FY 2011 FY 2012 Adopted FY 2013
NOTE: States were asked to report new initiatives or expansions in these areas; the data do not reflect ongoing state efforts in these areas. While states have reported managed care quality initiatives in the past, there was not a comparable count available for FY 2011.SOURCE: KCMU survey of Medicaid officials in 50 states and DC conducted by Health Management Associates, October 2011 and 2012.

Figure 27
NOTE: Comprehensive risk-based managed care includes Health Insuring Organizations (HIOs), comprehensive commercial and Medicaidmanaged care organizations (MCOs), and Program of All-Inclusive Care for the Elderly (PACE).SOURCE: Medicaid Managed Care Enrollment Report, Summary Statistics as of July 1, 2011, CMS, 2012.
In 26 states, over half of Medicaid beneficiaries are enrolled in comprehensive risk-based plans.
WY
WI
WV
WA
VA
VT
UT
TX
TN
SD
SC
RI
PA
OR
OK
OH
ND
NC
NY
NM
NJ
NH
NVNE
MT
MO
MS
MN
MI
MA
MD
ME
LA
KYKS
IA
INIL
ID
HI
GA
FL
DC
DE
CT
COCA
ARAZ
AK
AL
1-50% (11 states)
0% (14 states)
51-65% (10 states)
66-80% (13 states, including DC)
>80% (3 states)
U.S. Overall = 51%
Penetration of comprehensive risk-based managed care, July 1, 2011:

Figure 28
Examples of Payment and Delivery System Changes
• Expanding managed care to high-need populations and more services, including long-term services and supports
• Supporting hospital delivery system improvements through safety-net care pools
• Delivery and payment system changes focused on coordinating care and changing financial incentives for plans and providers
• Many states are pursuing concurrent initiatives through the “health homes” state plan option and/or duals integration initiative under CMMI

Figure 29
Series 1 Series 2
People Who Did NotUse LTSS
People Who UsedInstitutional LTSS
People Who UsedCommunity-BasedLTSS
43%
NOTE: Individuals who used both institutional and community-based services in the same year are classified as using institutional services in this figure.SOURCE: KCMU and Urban Institute estimates based on data from FY 2010 Medicaid Statistical Information System (MSIS) and Centers for Medicare & Medicaid Services (CMS)-64 reports. Because the 2010 data were unavailable, 2009 data were used for CO, ID, MO, NC, and WV, and then adjusted to 2010 CMS-64 spending levels.
States are also focusing on long-term services and supports.
Total = 66.4 million Total = $369.3 billion
Enrollees Expenditures
94%
57%
2%4%
21%
22%

Figure 30
NOTE: The “Other” enrollment group includes waiver enrollees who are people with physical disabilities, children, people withHIV/AIDS, people with mental health needs, and people with traumatic brain and spinal cord injuries. Percentages may not sum to100% due to rounding. SOURCES: KCMU and UCSF analysis of CMS Form 372 data and program surveys.
53% 47% 45%
There are still waiting lists for Home and Community Based Services (HCBS).
64%
2002 2003 2004 2005 2006 2007 2008 2009 2010 2011 2012
Others Aged/Disabled I/DD
28%
53% 47% 45%53% 53%
68%43% 51%53%
41% 42%
26%
3% 1%1%
6%5%
6%
192,447 180,347 206,427 260,916 280,176 331,689
64%
393,096
6%
30%
61%
10%
29%
365,553
62%63%
29%
8%
9%
428,571Total: 511,174
58%
32%
10%
523,710
28%
Medicaid § 1915(c) HCBS Waiver Waiting Lists, by Enrollment Group, 2002-2012

Figure 31
New options are available to support community care.
46
29
1612
8 2
Money Followsthe Person
Demonstration
Health HomeState Plan
Option
BalancingIncentive Program
HCBS StatePlan Option
DualsDemonstrations
Community FirstChoice State Plan
Option
*Approved states actively participating
SOURCE: KCMU internal tracking based on federal and state websites, as of October 2013.

Figure 32
Medicaid in Perspective
• Medicaid is the primary health coverage program for low-income Americans with significant health needs.
• Medicaid increases access to care and limits financial burdens for its 63 million beneficiaries.
• Medicaid is a critical source of financing for our health care system and safety net facilities.
• Medicaid spending is concentrated among a small number of beneficiaries with complex health needs.
• Medicaid cost growth needs to be managed with delivery and payment system reforms to improve care coordination and quality.

Figure 33
Visit our new, improved site: www.kff.orgtwitter.com/kaiserfamfound | facebook.com/kaiserfamilyfoundation
Contact Information
Diane Rowland, Executive Vice President & Executive DirectorThe Henry J. Kaiser Family Foundation Kaiser Commission on Medicaid and the Uninsured1330 G Street, [email protected]