media.nature.com€¦ · Web viewHistopathological diagnosis of hepatocarcinoma was performed...
48
Autophagy-Dependent Generation of Axin2+ Cancer Stem-like Cells Promotes Hepatocarcinogenesis in Liver Cirrhosis Jun Li 1* , ShaoBo Hu 2* , LiYu Wang 2 , Xi Zhang 3 , Xing Zhou 2 , Bin Yang 4 , JiaHuan Li 5 , Jun Xiong 2 , Nan Liu 1 , Yuan Li 1 , YongZhong Wu 6 , QiChang Zheng 2 Supplementary Materials and Methods Materials and Methods Human Tissue Samples A total of 8 non-liver cirrhosis surgical samples and blood samples were collected from patients with hepatic hemangioma; 18 alcohol-related, 30 chronic hepatitis B- 1
Transcript of media.nature.com€¦ · Web viewHistopathological diagnosis of hepatocarcinoma was performed...

Autophagy-Dependent Generation of Axin2+ Cancer Stem-like Cells Promotes
Hepatocarcinogenesis in Liver Cirrhosis
Jun Li1*, ShaoBo Hu2*, LiYu Wang2, Xi Zhang3, Xing Zhou2, Bin Yang4, JiaHuan
Li5, Jun Xiong2, Nan Liu1, Yuan Li1, YongZhong Wu6, QiChang Zheng2
Supplementary Materials and Methods
Materials and Methods
Human Tissue Samples
A total of 8 non-liver cirrhosis surgical samples and blood samples were collected
from patients with hepatic hemangioma; 18 alcohol-related, 30 chronic hepatitis B-
related and 18 chronic hepatitis C-related liver cirrhosis biopsied samples and blood
samples were collected at Union Hospital, Tongji Medical College, Huazhong
University of Science and Technology from 09/2007. Those patients were followed-
up to 12/2015. Three surgical hepatocarcinoma samples from patients with alcohol-
related liver cirrhosis, eight hepatocarcinoma samples from those with hepatitis B-
related liver cirrhosis and four hepatocarcinoma samples from those with hepatitis C-
related liver cirrhosis were collected by surgery. These tissue samples were
immediately used for subsequent experiments or were fixed in paraformaldehyde and
paraffin-embedded after biopsy or surgical removal. Histopathological diagnosis of
hepatocarcinoma was performed according to World Health Organization criteria.
Fibrolamellarhepatocarcinoma, cholangiocarcinoma and combined
hepatocholangiocarcinoma were excluded. This study was approved by the Ethics
1

Committee of Union Hospital, Tongji Medical College, Huazhong University of
Science and Technology. Written informed consent was obtained from each patient.
Generation of Transgenic Rats
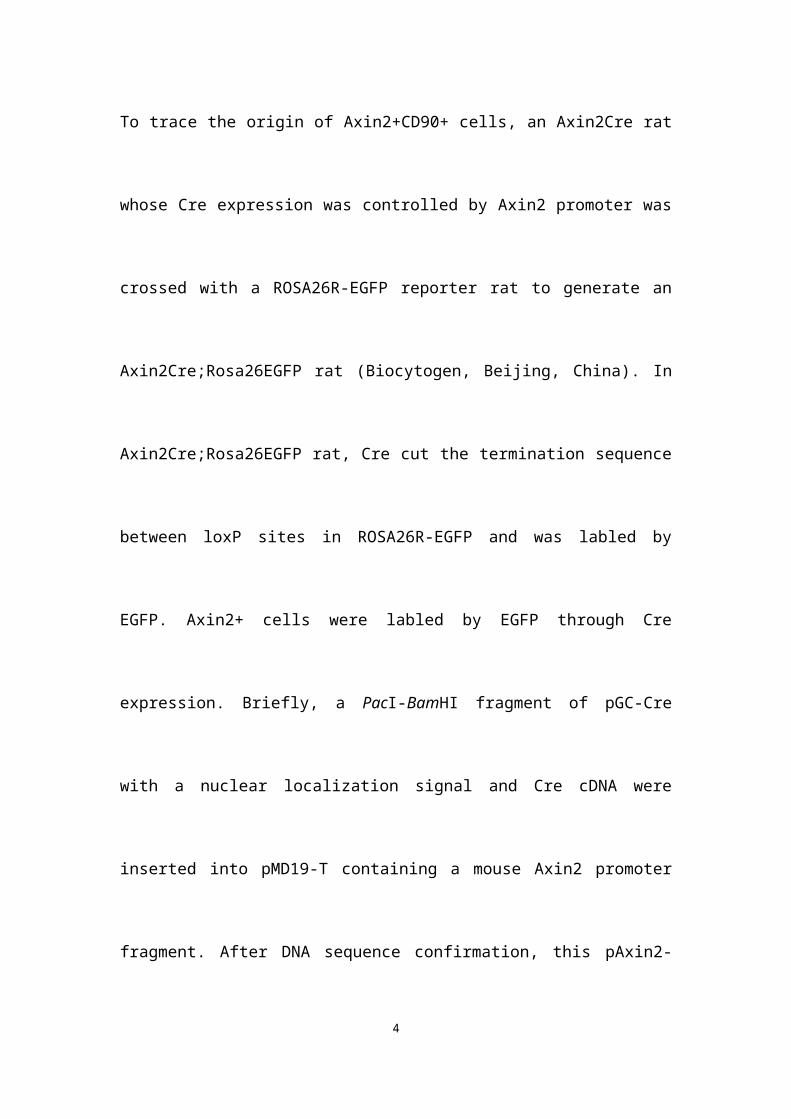
To trace the origin of Axin2+CD90+ cells, an Axin2Cre rat whose Cre expression was
controlled by Axin2 promoter was crossed with a ROSA26R-EGFP reporter rat to
generate an Axin2Cre;Rosa26EGFP rat (Biocytogen, Beijing, China). In
Axin2Cre;Rosa26EGFP rat, Cre cut the termination sequence between loxP sites in
ROSA26R-EGFP and was labled by EGFP. Axin2+ cells were labled by EGFP
through Cre expression. Briefly, a PacI-BamHI fragment of pGC-Cre with a nuclear
localization signal and Cre cDNA were inserted into pMD19-T containing a mouse
Axin2 promoter fragment. After DNA sequence confirmation, this pAxin2-Cre vector
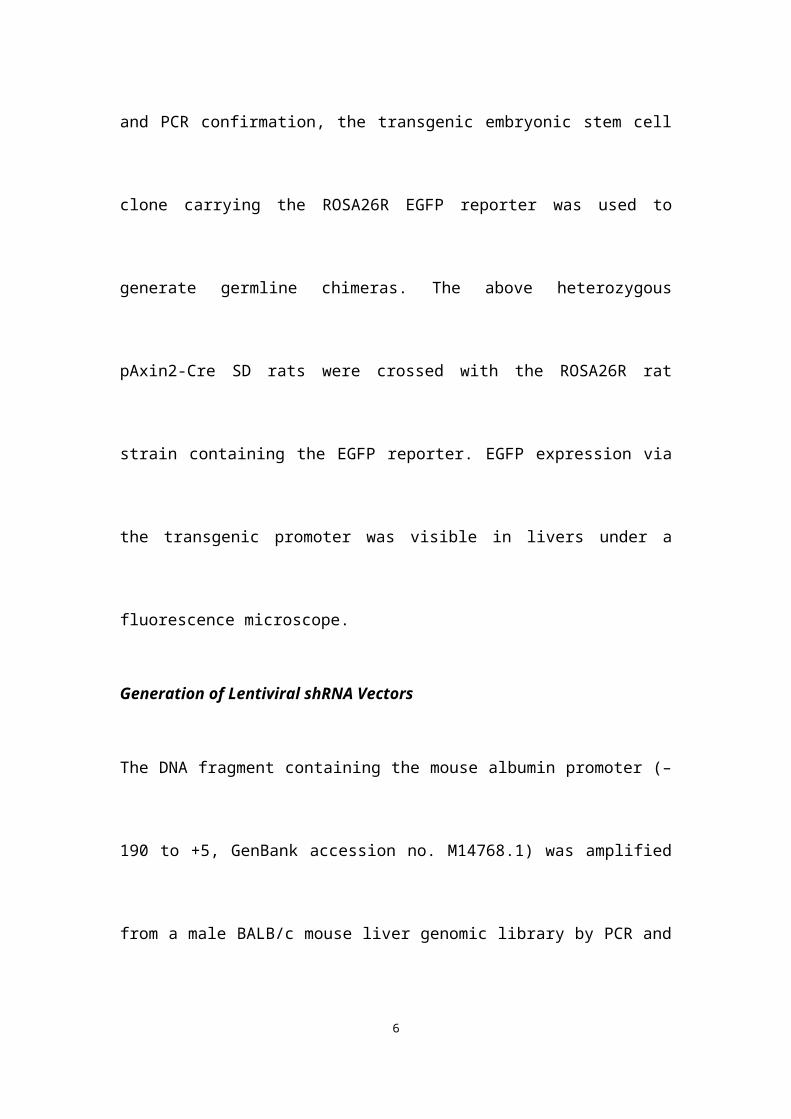
was electroporated into Sprague-Dawley rat embryonic stem cells. Following PCR
confirmation, the transgenic pAxin2-Cre embryonic stem cell clone was used to
generate germline chimeras. On the other hand, a polyadenylation signal and
neomycin resistance cassette flanked by 3’ loxP site was inserted into EcoRI and KpnI
restriction sites of pCAG-EGFP, and then the vector was inserted into fragment with
Rosa26 locus flanked by 5’ loxP site. After DNA sequence confirmation, this
expression vector was electroporated into Sprague-Dawley rat embryonic stem cells.
Following selection with G418 and PCR confirmation, the transgenic embryonic stem
cell clone carrying the ROSA26R EGFP reporter was used to generate germline
chimeras. The above heterozygous pAxin2-Cre SD rats were crossed with the
2

ROSA26R rat strain containing the EGFP reporter. EGFP expression via the
transgenic promoter was visible in livers under a fluorescence microscope.
Generation of Lentiviral shRNA Vectors
The DNA fragment containing the mouse albumin promoter (–190 to +5, GenBank
accession no. M14768.1) was amplified from a male BALB/c mouse liver genomic
library by PCR and cloned into plasmid pMD19-T. After sequencing, the DNA
fragment with the mouse albumin promoter replaced the ubiquitin promoter of the
lentiviral vector pGC-lentivirus (Ltv) to generate pAlbumin-Ltv.
The Atg3, Atg7 and HGF-specific shRNAs were designed and synthesized by
GenePharma (Shanghai, China), according to the cDNA sequences in GenBank
(NM_022488, NM_006395 and NM_017017.2). The shRNA sequences were as follows:
sense: 5’-GGGAAAGGCACUGGAAGUG-3’, loop –TTCAAGA-, antisense: 5’-
CACUUCCAGUGCCUUUCCC-3’ for Atg3; sense: 5’-
ACUAAAAGGGGCAAACUGC-3’, loop –AAGTTCTCT-, antisense: 5’-
GCAGUUUGCCCCUUUUAGUAG-3’ for Atg7; sense: 5’-
AUCCUUUCAAUAGUAUGUCAAGU-3’, loop –AAGTTCTCT-, antisense: 5’-
ACUUGACAUACUAUUGAAAGGAUGC-3’ for HGF; and sense: 5’-
UCAGACAUGCAACGUCAGCU-3’, loop –TTCAAGA-, antisense: 5’-
AGCUGACGUUGCAUGUCUGAUA-3’ for the control shRNA. The shRNAs were
linked to the HpaI and XhoI restriction sites at the 5’ and 3’-ends, respectively. After
digestion, the shRNA-Atg3, shRNA-Atg7, shRNA-HGF and shRNA-control
3
constructs were cloned into pAlbumin-Ltv to generate pAlbumin-Ltv-shRNA-Atg3,
pAlbumin-Ltv-shRNA-Atg7, pAlbumin-Ltv-shRNA-HGF and pAlbumin-Ltv-
shRNA-vector plasmids, respectively. Subsequently, individual recombinant lentiviral
plasmids were cotransfected with the packaging plasmids pHelper 1.0 and pHelper
2.0 into 293T cells using Lipofectamine 2000. The lentivirus virions were purified by
centrifugation and affinity chromatography. The functional viral titers of these
lentiviruses were determined by quantitative real-time PCR.
Animal Models
To establish a model of the progression of liver cirrhosis to hepatocarcinoma, 8-week-
old male Axin2Cre;Rosa26EGFP SD rats were injected intraperitoneally with 50
mg/kg diethylinitrosamine (N0258-1G, Sigma-Aldrich, Shanghai, China) twice per
week for 8 weeks. The rats were fed a regular diet for an additional 4 weeks. The rats
were biopsied to evaluate the presence of liver cirrhosis and autophagy status. Rats
with non-autophagic liver cirrhosis were intraperitoneally injected with rapamycin
(2mg/kg, S1039, Selleck, Shanghai, China) twice per week for 4 weeks. Rats with
aberrant autophagic liver cirrhosis were then number randomized and injected
intravenously with 1×10⁹ TU/mL shRNA-vector, shRNA-Atg3, shRNA-Atg7, and
shRNA-HGF lentiviruses in transduction enhancement reagent (EnvirusTM, Engreen
Biosystem, Beijing, China) twice per week for 4 weeks. In addition, the rats also
received chloroquine (50mg/kg, an inhibitor of the late stage of autophagy, Sigma-
Aldrich) weekly, with SP600125 (a JNK inhibitor, 15 mg/kg, S1460, Selleck) or
stattic (a STAT3 inhibitor, 2 mg/kg, S7024, Selleck) administered twice per week by
4

intraperitoneal injection for 4 weeks. Blood samples were then collected from each
group. A group of normal rats or rats with vehicle injection served as the control
where appropriate. The rats were sacrificed after an additional 4-week observation
after the final treatment. The entire experimental period was 20 weeks.
Liver samples from each group were collected at 4, 8 and 12 weeks after the last
diethylinitrosamine injection. The samples were immediately used for subsequent
experiments or were fixed in paraformaldehyde and paraffin-embedded for sectioning.
The animal experiments were conducted according to the guidelines for the Care and
Use of Laboratory Animals of the NIH, and the protocols were approved by the
Animal Care and Use Committee of Tongji Medical College.
Cytokine Detection
HGF, IL-2R, IL-6, IL-16, IL-18 and CXCL-12 levels in serum from individual
patients and rats were analyzed by ELISA using specific kits according to the
manufacturers’ instructions (Boster, Wuhan, China). Briefly, individual blood
samples were centrifuged at 14000 rpm for 10 min. The sera were then collected to
measure each cytokine in triplicate.
Flow Cytometry
At 4 weeks after the last diethylinitrosamine injection and 4 weeks after the last
treatment (8 weeks after the last diethylinitrosamine injection), rat liver samples were
collected. A part of each fresh human and rat liver tissue was cut into 1 mm3 pieces
and digested with collagenase IV (250 units/mL in phosphate-buffered saline [PBS]
5
with 10% fetal bovine serum [FBS]) for 30 min at 37℃. The suspension was filtered
through 300 nylon mesh and centrifuged at 400 g for 5 min. Rat cell samples were
resuspended and stained with phycoerythrin (PE)-conjugated anti-CD90 (0.3μg/107
cells, 205903, Biolegend, CA, USA), anti-CD133 (0.5μg/107 cells, 130-102-834,
Miltenyi Biotec, Germany) and anti-Epcam (0.5μg/107 cells, 130-102-967, Miltenyi
Biotec) for 30 min. Human cell samples were stained with PE-conjugated anti-CD90
(0.3μg/107 cells, 328110, Biolegend), anti-CD133 (0.5μg/107 cells, 130-080-801,
Miltenyi Biotec) and anti-Epcam (0.5μg/107 cells, 130-110-999, Miltenyi Biotec)
together with fluorescein isothiocyanate (FITC)-conjugated anti-Axin2 (1.0μg/107
cells, ABIN2207368, antibodies-online, China). Control cells were stained with
isotype-matched IgG. The percentages of human Axin2+CD90+, Axin2+CD133+ and
Axin2+Epcam+ cells or rat EGFP+CD90+, EGFP+CD133+ and EGFP+Epcam+ cells
were determined by flow cytometry using BD Accuri™ C6 (BD Biosciences, San
Jose, CA, USA). The sorting of Axin2+CD90+, Axin2+CD90- and Axin2-CD90-
cells and EGFP+CD90+, EGFP+CD90- and EGFP-CD90- cells, was performed using
a commercial sorter (FACSAria, BD Biosciences), which was also used to evaluate
sphere and tumor xenograft formation capabilities. Axin2+ and Axin2- cells from
each type of human cirrhotic liver, along with EGFP+ and EGFP- cells from rat
cirrhotic livers with or without treatment, were sorted and further analyzed in vitro.
Tumor Formation Assay
Six-week-old male nude mice were from the Center of Experimental Animals (Tongji
Medical College, Huazhong University of Science and Technology, China) and were
6

housed in a specific pathogen-free facility with free access to autocleaved water and
food. Individual nude mice were injected subcutaneously with 5×10⁵ human
Axin2+CD90+, Axin2+CD90- and Axin2-CD90- cells or rat EGFP+CD90+,
EGFP+CD90- and EGFP-CD90- cells, respectively. The formation and growth of
implanted tumors were monitored for 8 weeks. The mice were then sacrificed, and the
tumor xenografts were dissected and compared in volumes. The experimental
protocols were approved by the Animal Care and Use Committee of Tongji Medical
College.
Sphere Formation Assay
The sorted human Axin2+CD90+, Axin2+CD90- and Axin2-CD90- cells and the rat
EGFP+CD90+, EGFP+CD90- and EGFP-CD90- cells, were cultured a density of
1000 cells/well in DMEM/F12 medium (HyClone, Utah, USA) supplemented with
2% B27 (Invitrogen, MA, USA), 100 U/mL of penicillin and 100 µg/mL of
streptomycin, 20 ng/mL epidermal growth factor and 20 ng/ml basic fibroblast growth
factor (bFGF, PeproTech, Rocky Hill, NJ, USA) using ultra-low attachment 6-well
plates (Corning, NY, USA) for 2 weeks. The cells were exposed to fresh medium
every 3 days. The formed spheres with diameters of>75 μm were counted.
Western Blotting
LC3-I / LC3-II conversion, P62, DNMT1 and HGF expression were detected by
Western blotting in above sorted cells and in different human and rat liver samples
with or without treatment. Western blotting was also performed to detect the
7

expression of Sox2 and Oct4, β-catenin and CD90 and the phosphorylation of Met,
JNK and STAT3 in the sorted cells described above. The interference efficiencies of
Atg3 and Atg7 were confirmed by Western blot analysis in rat cirrhotic livers
transfected with shRNA-lentiviruses. Briefly, individual tissue sample or cells were
homogenized and lysed in radioimmunoprecipitation assay (RIPA) buffer
supplemented with protease inhibitor cocktail (Roche, Branford, CT, USA). The
tissue lysates (30 μg/lane) were separated by sodium dodecyl sulfate–polyacrylamide
gel electrophoresis on 12% gels and transferred to nitrocellulose membranes (Pierce,
Thermo Fisher Scientific, Waltham, MA, USA). After blocking with 5% fat-free dry
milk in Tris-buffered saline-Tween (TBST) buffer, the membranes were incubated
with primary antibodies against LC3 (1:1000; 4108, Cell Signaling Technology,
Beverly, MA, USA), p62 (1:1000; 5114, Cell Signaling Technology), p-Met
(Tyr1234/1235) (1:1000; 3077, Cell Signaling Technology), Met (1:1000; 3127, Cell
Signaling Technology), p-STAT3 (Tyr705) (1:1000; 9145, Cell Signaling
Technology), STAT3 (1:1000; 9319, Cell Signaling Technology), p-JNK (Tyr185)
(1:1000; 9255, Cell Signaling Technology), JNK (1:1000; 9252, Cell Signaling
Technology), DNMT1 (1:1000; ab188453, Abcam, MA, USA), HGF (1:1000;
ab83760, Abcam), β-catenin (1:2000; ab32572, Abcam), Atg3 (1:2000; ab108251,
Abcam), Atg7 (1:2000; ab133528, Abcam), Sox2 (1:1000; ab97959, Abcam), Oct4
(1:1000; ab18976, Abcam), CD90 (1:1000; ab92574, Abcam) and β-actin (1:2000;
ab8226, Abcam). After washing, the bound antibodies were detected with horseradish
peroxidase (HRP)-conjugated secondary antibodies (Abcam) and were visualized
8

using SuperSignal™ chemiluminescence reagent (Pierce). Protein expression levels
were normalized against β-actin or total signaling molecules. The relative levels of
target protein expression were analyzed by densitometric scanning using ImageJ
software.
Immunocytofluorescence
Immunocytofluorescence was performed using the sorted Axin2- and Axin2+ cells from
human cirrhotic livers and sorted EGFP- and EGFP+ cells from rat cirrhotic livers
described above. Briefly, the cells were fixed in 4% paraformaldehyde and
permeabilized with Triton-X-100. The cells were then treated with 3% hydrogen
peroxide to inactivate endogenous peroxidase. Non-specific binding was blocked in PBS
containing 10% species-appropriate normal serum for 1 hour at room temperature.
Primary Axin2 antibody (1:200; ab32197, Abcam) or CD90 antibody (1:500; ab92574,
Abcam) was incubated overnight at 4°C in a humidified chamber. The cells were
incubated with the appropriate secondary antibody and visualized by applying peroxidase
substrate in conjunction with FITC or Cy3 (Boster, Wuhan, China).
Immunohistofluorescence
The expression levels of HGF, Axin2 and CD90 in different human and rat liver
tissue samples were determined by immunofluorescence. Briefly, the paraffin sections
(4 µm) were deparaffinized and rehydrated through graded solutions of ethanol/water.
The sections were subjected to antigen retrieval using an antigen unmasking solution
(Vector) and were then blocked in PBS containing 10% species-appropriate normal
9

serum for 1 hour at room temperature. The sections were incubated with primary
antibodies against HGF (1:100; ab83760, Abcam), Axin2 (1:100; ab32197, Abcam)
and/or CD90 (1:200; ab92574, Abcam) overnight at 4°C in a humidified chamber.
The appropriate isotype-matched IgG (Vector) served as negative control. After
washing, the bound antibodies were detected with FITC- or Cy3-conjugated
secondary antibodies (1:200; Cell Signaling Technology), and images were acquired
using a fluorescence microscope. For quantitative comparison of HGF expression and
ratio of Axin2/EGFP+CD90+ cells, the ratios of positively or double positively
stained areas to total traced areas were determined by an independent pathologist
blinded to the experimental design and expressed as a percentage on high-power
(×200) images using color segmentation in Image-Pro Plus (Media Cybernetics).
Immunohistochemistry
The expression levels of α-fetoprotein (AFP) and cytokeratin 19 (CK19) in individual
tumor xenograft samples were detected by immunohistochemistry. Briefly, paraffin-
embedded sections (4 µm) were prepared as described above for
immunofluorescence, and incubated with primary antibodies against α-AFP (1:100;
ab46799, Abcam) and CK19 (1:100; ab52625, Abcam, USA) overnight at 4°C in a
humidified chamber using isotype-matched IgGs (Vector) as negative controls. The
bound antibodies were detected using biotinylated secondary antibodies and incubated
with HRP-Streptavidin (Boster, Wuhan, China) at 37°C for 20 min. After washing,
specific expression was visualized using a yellow diaminobenzidine reagent kit
10

(Boster) according to the manufacturer’s instructions, and specimens were
counterstained with hematoxylin.
Histology
At 4 weeks after the last treatment (12 weeks after the last diethylinitrosamine
injection), 4-μm-thick cross-sections of rat cirrhotic livers with different autophagy
status and different treatments were cut and transferred onto gelatin-coated glass
slides. Six cross-sections from each animal were selected at 250-μm intervals for
hematoxylin-eosin (HE) and Sirius staining. Briefly, the paraffin sections were
deparaffinized and rehydrated through graded solutions of ethanol/water. The sections
were then stained with hematoxylin followed by 0.5% alcoholic eosin-Y (Sigma-
Aldrich, Shanghai, China) or with Sirius followed by hematoxylin (Sigma-Aldrich,
Shanghai, China).
Statistical Analysis
Sample size was computed by using formulas for 2 proportions comparison available
on website: http://powerandsamplesize.com/Calculators/. All data are presented as the
means ± SEM. After demonstration of homogeneity of variance with the Bartlett test,
one-way ANOVA, followed by the Student-Newman-Keuls test where appropriate,
was used to evaluate statistical significance. Values of P<0.05 were considered
statistically significant. All experiments were performed in triplicate.
11

Supplementary Figures and Figure legends
Supplemental Figure I. Densitometric analysis of the Western blots shown in
Figure 1. (A) Densitometric analysis of LC3-II and P62 expression normalized to β-
actin in human normal livers and in alcohol- (n=6), HBV- (n=10) and HCV-related
cirrhotic liver tissues (n=6). (B) Densitometric analysis of LC3-II and P62 expression
normalized to β-actin in Axin2Cre;Rosa26EGFP rat normal livers and cirrhotic liver
tissues (n=4). Data are expressed as the means ± SEM of each group from three
separate experiments. *p<0.05 vs. the normal liver tissues.
12

Supplemental Figure II. Quantitation of the immunofluorescence staining shown
in Figure 1B. The percentages of double positive areas (yellow) to overall areas in
individual samples were calculated. (A) The percentages of Axin2 and CD90 double
positive hepatic cells in human normal livers and in alcohol- (n=6), HBV- (n=10) and
HCV-related cirrhotic liver tissues (n=6). (B) The percentages of EGFP and CD90
double-positive hepatic cells in Axin2Cre;Rosa26EGFP rat normal livers and cirrhotic
liver tissues (n=4). Data are expressed as the means ± SEM of each group from three
separate experiments. *p < 0.05 vs. normal liver tissues.
13

14

Supplemental Figure III. Flow cytometry analysis of hepatic Axin2+CD133+ and
Axin2+Epcam+ cells in human livers. Biopsied liver samples were obtained from
subjects with healthy livers (n=8) and with alcohol- (n=6), HBV- (n=10) and HCV-
related liver cirrhosis (n=6) and stratified according to autophagy status. (A)
Representative flow cytometry analysis of hepatic Axin2+CD133+ cells and (B)
Axin2+Epcam+ cells in individual liver samples. The percentages of double positive
cells are shown in the upper-right quadrants. Data are representative flow cytometry
graphs of each group from four experiments.
15

Supplemental Figure IV. Flow cytometry analysis of hepatic
EGFP(Axin2)+CD133+ and EGFP(Axin2)+Epcam+ cells in
Axin2Cre;Rosa26EGFP rat livers. The biopsied rat cirrhotic liver samples were
stratified according to autophagy status. The percentages of hepatic (A)
EGFP(Axin2)+CD133+ and (B) EGFP(Axin2)+Epcam+ cells in normal livers and
cirrhotic livers with or without autophagy were determined by flow cytometry. The
percentages of double-positive cells are shown in the upper-right quadrants. Data are
representative flow cytometry graphs of each group (n=8) from three separate
experiments.
16

Supplemental Figure V. Transfection with lentiviruses expressing Atg3/Atg7-
shRNAs effectively silences Atg3 and Atg7 expression in transgenic rat livers.
Axin2Cre;Rosa26EGFP rats with aberrant autophagic liver cirrhosis at 4 weeks after
induction were infected with shRNA-vector lentiviruses or lentiviruses carrying
Atg3/Atg7-shRNAs. Four weeks after transfection, Atg3 and Atg7 expression levels
in the cirrhotic liver tissues were determined by Western blot analysis. (A)
Representative Western blots for Atg3 and Atg7. (B) Densitometric analysis of Atg3
and Atg7 expression normalized to β-actin. Data are representative images or
expressed as the means ± SEM of each group (n=4) from three separate experiments.
*p < 0.05 vs. rats infected with shRNA-vector.
17

Supplemental Figure VI. Densitometric analysis of the Western blots shown in
Figure 4. (A) Densitometric analysis of HGF expression normalized to β-actin in
human normal livers and in alcohol- (n=6), HBV- (n=10) and HCV-related cirrhotic
liver tissues (n=6). (B) Densitometric analysis of LC3-II, P62, DNMT1 and HGF
expression normalized to β-actin in Axin2Cre;Rosa26EGFP rat normal livers, non-
autophagic cirrhotic livers with rapamycin and aberrant autophagic cirrhotic livers
transfected with a variety of shRNAs or chloroquine (n=4). Data are expressed as the
means ± SEM of each group from three separate experiments. *p < 0.05 vs. normal
liver tissues.
18

Supplemental Figure VII. Quantification of the HGF immunofluorescence
staining shown in Figure 4.
The percentages of positive HGF staining in comparison with the overall areas in
individual samples were calculated. (A) Quantitative analysis of HGF
immunofluorescence staining in human normal livers and in alcohol- (n=6), HBV-
(n=10) and HCV-related cirrhotic liver tissues (n=6). (B) Quantitative analysis of
HGF immunofluorescence staining in Axin2Cre;Rosa26EGFP rat normal livers, non-
autophagic cirrhotic livers with rapamycin and aberrant autophagic cirrhotic livers
transfected with a variety of shRNAs or chloroquine (n=4). Data are expressed as the
means ± SEM of each group from three separate experiments. *p < 0.05 vs. normal
liver tissues.
19

Supplementary Table 1.
Progression ratio of liver cirrhosis to hepatocarcinoma in human samples
Liver cirrhosis with low autophagy Liver cirrhosis with aberrant autophagy
Cause alcohol related HBV related HCV related alcohol related HBV related HCV related
Group cases 14 20 13 4 10 5
Axin2+CD90+ cases 0 0 0 4 10 5
Hepatocarcinogenesis 0 0 0 3 8 4
Hepatocarcinogenesis ratio 0/14 0/20 0/13 3/4 8/10 4/5
During the follow-up period from 09/2007 to 12/1015, the numbers of Axin2+CD90+
and hepatocarcinogenesis cases as well as hepatocarciogenesis ratio were calculated
from patients who were stratified according to autophagy status in different types of
liver cirrhosis.
20

Supplementary Table 2.
Progression rate of liver cirrhosis to hepatocarcinoma in Axin2Cre;Rosa26EGFP
rats
After 4 weeks of liver cirrhosis induction, the rats were stratified according to
autophagy status in liver cirrhosis. The rats were then administered with the indicated
reagents to induce or inhibit aberrant autophagy in cirrhotic livers. After 4 weeks of
treatment, the numbers of Axin2+CD90+ cases were calculated and the development
of hepatocarcinoma in individual group of rats were monitored up to 8 weeks after the
treatment.
21
Liver cirrhosis
low
autophagy
Liver cirrhosis
aberrant autophagy
Treatment - rapamyc
in
- shRNA:vector/
vehicle
shRNA:Atg3
/7
chloroqui
ne
shRNA:HG
F
SP60012
5
statti
c
Group cases
Axin2+CD90+
cases
Hepatocarcinogene
sis
12 5
0 4
0 4
4
4
3
4
4
2
4
0
0
4
0
0
4
0
0
4
0
0
4
0
0