Media Ownership, Concentration and Corruption in...
51
1 Media Ownership, Concentration and Corruption in Bank Lending Joel F. Houston, Chen Lin and Yue Ma February 10, 2010 ABSTRACT Building on the pioneering study by Beck, Demirguc-Kunt and Levine (2006), we examine the effects of media ownership and concentration on corruption in bank lending. Using the unique World Bank dataset covering more than 5,000 firms across 59 countries, we find strong evidence that that state ownership of media is associated with higher levels of bank corruption. We also find that media concentration increases corruption both directly and indirectly through its interaction with media state ownership. In addition, we find that media state ownership and media concentration both accentuate the positive link between official supervisory power and lending corruption and attenuate the negative link between the regulations that empower private monitoring and corruption in lending. Furthermore, the links between media structure and corruption are more pronounced when the borrowing firm is privately owned. Keywords: bank lending, corruption, media concentration, ownership, bank supervision. JEL Classifications: G21, G28, O16 Contact Information: Joel Houston (corresponding author), Department of Finance Insurance & Real Estate, Warrington College of Business Administration, University of Florida, PO BOX 117168, Gainesville, FL 32611-7168. (352) 392-7546, [email protected] ; Chen Lin, Department of Economics and Finance, City University of Hong Kong; Yue Ma, Department of Economics, Lingnan University, Hong Kong.
Transcript of Media Ownership, Concentration and Corruption in...

1
Media Ownership, Concentration and Corruption in
Bank Lending
Joel F. Houston, Chen Lin and Yue Ma
February 10, 2010
ABSTRACT
Building on the pioneering study by Beck, Demirguc-Kunt and Levine (2006), we examine
the effects of media ownership and concentration on corruption in bank lending. Using the
unique World Bank dataset covering more than 5,000 firms across 59 countries, we find
strong evidence that that state ownership of media is associated with higher levels of bank
corruption. We also find that media concentration increases corruption both directly and
indirectly through its interaction with media state ownership. In addition, we find that
media state ownership and media concentration both accentuate the positive link between
official supervisory power and lending corruption and attenuate the negative link between the
regulations that empower private monitoring and corruption in lending. Furthermore, the
links between media structure and corruption are more pronounced when the borrowing firm
is privately owned.
Keywords: bank lending, corruption, media concentration, ownership, bank supervision.
JEL Classifications: G21, G28, O16
Contact Information: Joel Houston (corresponding author), Department of Finance Insurance & Real Estate,
Warrington College of Business Administration, University of Florida, PO BOX 117168, Gainesville, FL
32611-7168. (352) 392-7546, [email protected]; Chen Lin, Department of Economics and Finance, City
University of Hong Kong; Yue Ma, Department of Economics, Lingnan University, Hong Kong.

2
1. Introduction
Banks play a fundamentally important role in the capital allocation process, and previous
research (e.g., Levine, 1997, 2005) has convincingly demonstrated that the health of a
country’s banking system has a positive influence on economic development. Given the
importance of a well functioning banking system, it is not surprising that a numbers of studies
have focused on how a variety of economic, regulatory and institutional factors have
influenced the efficiency of banking systems worldwide (e.g., Beck and Levine, 2002; Barth,
Caprio and Levine, 2004).1
As policymakers struggle to create institutional environments that promote efficient
banking, one limiting force is the presence of corruption. Corruption in banking may take
on a variety of forms, and when pervasive may undercut broader efforts to efficiently allocate
capital.2 Despite its importance, there has been limited research regarding the causes and
consequences of bank corruption. The relative lack of work in this area is certainly not
surprising, given the obvious difficulties in measuring bank corruption.
Two notable exceptions are the recent papers by Beck, Demirguc-Kunt and Levine
(2006) and Barth, Lin, Lin and Song (2009). These studies utilize the World Bank’s World
Business Environment Survey (WBES)—a unique and extensive survey of more than 9000
firms in 80 countries. More specifically, both studies use one of the questions that was
posed to firms in the survey: ―Is the corruption of bank officials an obstacle for the
operation and growth of your business?‖, as the key measure of bank lending corruption.
Beck et al. (2006) focus on whether providing regulators with strong oversight powers
helps mitigate corruption. One might expect that stronger oversight powers would help
regulators police corruption. However, Beck et al. (2006) find that the opposite result holds:
stronger oversight powers are correlated with more corruption. In contrast, they find that
efforts to promote private monitoring and transparency of banking activities lead to reduced
1 Please see Barth, Caprio and Levine (2006, 2007) for a thorough and comprehensive discussion and review of
the literature. 2 Anecdotal evidence show that banking corruption is pervasive in many developing countries (e.g., Levine and
Satarov, 2000; Barth et al. 2009). Based on the world wide enterprise survey conducted by the World Bank,
corruption of bank officials is considered as a major or moderate obstacle by 20%-40% of the firms in
non-OECD countries around the world (Batra, Kaufmann and Stone, 2004).
3
corruption. In a similar vein, the more recent study by Barth et al. (2009) demonstrates that
greater competition in banking and greater information sharing among bankers leads to
reduced levels of corruption.
More broadly, there are arguably two competing approaches for combating corruption.
One approach is to create countervailing (government or non-government) institutions with
strong powers to uncover corruption and/or enforce penalties. An alternative approach is to
create more competition and transparency to reduce the incentives for corruption and to
produce more ―sunshine‖ on banking practices. Put together, the two existing studies lend
strong support to the second approach, and suggest that policymakers can better reduce
corruption by promoting competition and openness than they can through a concentration of
state power.
Building upon these studies, this paper undertakes an in-depth examination of the role
that another important institution (the media) plays in influencing banking corruption. By
nature, media firms have strong incentives to reach a larger audience by reporting interesting
news. The media is therefore a potentially highly effective mechanism of external control
on corruption in bank lending. With respect to the bank officials, media monitoring
increases the probability of being detected and punished and consequently deters potential
corruption activities. However, the monitoring incentives of the media might be lower in
countries with a concentrated and state controlled media sector because the marginal returns
of monitoring are lower while the marginal costs are higher due to political pressure and
capture.
In our study, we combine the WBES firm-level data regarding banking corruption with
Djankov, McLiesh, Nenova and Shleifer’s (2003) extensive measures regarding media
ownership and concentration to provide a comprehensive analysis of the specific influence
the media has on banking corruption. We also utilize the bank regulation data collected by
Barth, Caprio and Levine (2006) which allows us to consider how the intersection of
government, media and corporate power influences the level of banking corruption.
Looking at a combined sample of more than 5000 firms in 58 countries, we find that state
ownership of the media has a strong and significantly positive effect on banking corruption,
4
and that increased concentration of media power leads to more corruption. The effects are
more pronounced in the countries with government controlled banking sector. Moreover,
we reaffirm the Beck et al. (2006) result that increased supervisory powers are correlated with
greater corruption, and we build upon this finding by showing that state ownership of the
media tends to accentuate this effect. Likewise, we confirm that regulations that empower
private monitoring reduce lending corruption, but we find that this result is mitigated when
the media is state owned or heavily concentrated. Utilizing the firm-level nature of the data,
we also find that the effects of media ownership and concentration on banking corruption are
particularly pronounced for privately owned firms. The presumption is that unlike
government-owned or foreign-owned firms who might be in a better bargaining position to
combat corrupt lenders, privately owned firms are more dependent on well functioning
institutions such as the media. Taken together, our results suggest that a private and
competitive media sector plays an important role in curtailing corruption in bank lending.
Our work contributes to two distinct literatures. First, we add to the small yet growing
banking corruption literature (e.g., Beck et al., 2006; Barth et al., 2009) by showing the
important role that a free and competitive media plays in controlling corruption in lending,
and we reject the notion that a strong state owned media can effectively combat corruption.
Furthermore, we explore how the interactive effects between the media, the banking system
and the regulatory system jointly influence the degree of lending corruption. By doing so,
we also contribute to the general corruption literature.3 Second, our study contributes to the
literature that focuses on the role that the media has on society. Djankov et al. (2003) show
that state ownership of the media tends to have a negative influence on a broad number of
important metrics including the degree of press freedom, the level of political and economic
freedom, as well as overall measures related to the health of the society (e.g., life expectancy,
infant mortality, and access to health and sanitation systems). Here by providing a detailed
assessment at the firm level of how media ownership and concentration influences corruption
in developing countries, we lend further support to those who stress the importance of an
3 For instance, Brunetti and Weder (2003) explored the connections between a measure of press freedom (the
primary measure is a country-level index assembled by Freedom House) and country-level corruption
perception measure and find a negative relationship between these two.

5
open and competitive media.4 More broadly, our research suggests that the concentration of
power promotes corruption, which in turn is likely to have a negative influence on economic
development. We specifically reject the notion that concentrated media power can offset
large regulatory or corporate power. Instead, we find that banking markets are more
efficient when markets are competitive; when regulators encourage openness and empower
private monitoring, and when the government or private families do not control the media
outlets. Our study therefore contributes to the media and economic development literature
(e.g., Leeson, 2008) by shedding direct light on one specific channel through which the media
ownership and structure affects economic development. The study also adds to the financial
development and growth literature by showing the importance of media ownership and
structure in shaping a well functional financial system, which is essential for economic
growth.
The rest of the paper proceeds as follows: Section 2 discusses the media’s potential
impacts on corruption in lending. Section 3 describes the various data sources and key
variables used in the analysis. The main empirical results are reported in Section 4, while
Section 5 provides some robustness tests. Section 6 summarizes the results and provides
some concluding thoughts.
2. The Media’s Influence on Bank Corruption
As mentioned above, only two existing studies have focused on the determinants of bank
corruption. The first study (Beck et al., 2006) found that banking corruption was more
pervasive in countries where the regulators had stronger regulatory powers, but they also
found that policies that promote private monitoring and transparency in lending helped
reduce perceived corruption. The second study (Barth et al., 2009) established that greater
banking competition and greater information sharing help reduce corruption. Put together,
these results suggest that policymakers interested in reducing corruption, should focus less on
strengthening regulatory power, and should instead take steps to enhance competition and
4 The importance of a private and competitive media is widely regarded so that it is often called ―the fourth
estate,‖ along with the executive, the legislature, and the courts (Djankov et al., 2003)

6
transparency.
Building upon this existing research, our study focuses on the role that the media plays in
combating (or encouraging) corruption. We hypothesize that an effective media may help
expose and deter corruption. On the other hand, an ineffective or dishonest media may be a
co-conspirator in corrupt activities. Our work is motivated, in part, by the economics
literature that has looked at the determinants of corruption. While this literature has not
explicitly examined banking corruption, it does offer some important insights for our study.
The existing literature highlights the important monitoring role of the media, which is
frequently referred to as one of its most important functions (e.g., Djankov et al. 2003). In a
similar vein, Brunetti and Weder (2003) find that a free press works to reduce overall
corruption. Given these findings, we argue that by investigating and exposing corrupt
banking officials, the media can potentially be an important external factor limiting
corruption.
For the media to be an effective deterrent to corruption, its members must have an
incentive to uncover corruption. So what motivates the media? As with all economic agents,
media firms make key decisions based on the perceived costs and benefits. In deciding
which stories to pursue, media agents arguably want to attract the largest possible audience.
This incentive is true both for newspapers, whose subscription and advertising revenues are
linked to circulation, and for television and radio stations where advertising and (where
applicable) cable fees are tied to viewer or listener ratings (Besley, Burgess, and Prat, 2002).
As defined in one popular journalism textbook (p. 41-52, Jamieson and Campbell, 2001), a
―newsworthy event‖ is an event with the following five characteristics: (1) personalized, (2)
conflict-filled, controversial, dramatic (3) actual and concrete as opposed to theoretical or
abstract, (4) novel and deviant, and (5) linked to issues with ongoing concern. Corruption in
bank lending is one of the few business stories that meets all these criteria. The often
hidden actions, tensions, incentives and conflicts of interests involved in bank lending
corruption make it a potentially compelling news story. Furthermore, corruption in lending
is also an important news event, because it has direct implications for understanding and
evaluating the performance of both the bank and its borrowing firms.

7
Knowing the media's interest in discovering lending corruption and broadcasting it widely,
the borrowing firm facing a corrupt lender can reveal (or credibly threaten to reveal) the bank
official’s misconduct to a journalist. The threat of being exposed in the media would raise
the probability that corrupt acts would be detected and punished, thereby raising the expected
costs of engaging in corruption (Brunetti and Weder, 2003).
While most countries have some form of media, their mere existence is no guarantee that
they are an effective mechanism for critical scrutiny of hidden actions such as corruption in
lending. The media's incentive to discover, pursue and report lending corruption cases
depends on the market structure of the media sector. Djankov et al. (2003) point out that
(p.342), ―competition among media firms assures that voters, consumers, and investors obtain,
on average, unbiased and accurate information.‖ In an open environment, competition for
audience interest pushes the media to look for interesting news such as corruption in bank
lending and to establish a reputation for reliability and quality to get ahead of its competitors
and increase its market share. In other words, the marginal return on a ―newsworthy event‖
such as corruption in lending is higher in a more competitive media sector. On the other
hand, journalists may not have strong incentives to discover and report lending corruption
cases in markets where the media is more concentrated, because the marginal return from
reporting the story is lower and because the investigation itself is costly.5 Moreover,
reporting lending corruption cases may in some circumstances create ―payback‖ effects
where the banks (and other institutions) facing media scrutiny and criticism choose to reduce
or eliminate their advertising in media outlets. For all of these various reasons, we expect to
see a positive link between media industry concentration and corruption in bank lending.
In some cases, political pressure may reduce the media's incentive to discover and report
lending corruption cases. This likelihood of this type of political pressure occurring
depends on the extent to which the media are politically controlled, captured, or repressed
through a variety of government actions (Besley et al. 2002). According to the political
media capture view (Djankov et al. 2003), politicians or supervisors might suppress the
5 By nature, corruption is kept secret and difficult to be observed (Shleifer and Vishny, 1993). Therefore,
investigation of corruption could be costly with the outcome highly uncertain at the beginning of the
investigation.

8
government controlled media in reporting bank corruption cases to entrench their positions,
preclude public oversight, and maximize their own private benefits (Beck et al., 2006). This
implies that the state ownership of media makes the media less effective in monitoring
corruption.
More specifically, what motivates politicians to suppress media reports of bank corruption?
As Beck et al. (2006) point out, the allocation of bank credit might be shaped by political ties
in environments where politicians and supervisors have the power to directly influence the
distribution of bank loans and to discipline non-compliant banks. Media reports on bank
corruption cases might spur calls for public oversight and external monitoring, which makes
it more difficult for private gains in the process of credit allocations. Furthermore,
politicians’ actions while in office may be an important source of information about their
underlying motivation or competence (Besley et al., 2002). Reported lending corruption is
often viewed as symptomatic of larger issues of corruption, and therefore may reflect
negatively on current politicians or supervisors, which reduces their chances of being
entrenched in their positions.6 Therefore, politicians or supervisors might have the incentive
to protect themselves from public scrutiny by suppressing the state controlled media in
reporting bank corruption cases, especially those corruption cases associated with the
government controlled banks.7
Arguably this incentive is more relevant when the
supervisory power is also strong because in those circumstances, the potential private gains
from credit mis-allocation are the greatest (Beck et al., 2006).
From the media’s perspective, reporters pursuing banking corruption cases may incur
higher costs if they are working for a state controlled media firm. These costs are
particularly relevant if (for the reasons outlined above) the government is not interested in
exposing corruption. In these cases, media managers and individual reporters who pursue
corruption cases may be concerned about retaining their job and future employability.8 For
6 Besley et al. (2002) point out that media press plays a substantial role in increasing political accountability.
7 As La Porta et al. point out (p.266, 2002), ―government acquire control of enterprises and banks in order to
provide employment, subsidies, and other benefits to supporters, who return the favor in the form of votes,
political contributions, and bribes.‖ 8 Despite constitutional provisions guaranteeing freedom of speech and of the press, government officials in
many developing countries continue to invoke insult laws against the media, often in an attempt to prevent

9
all of these reasons, we expect a positive relationship between media state ownership and
corruption in bank lending and we expect this relationship to be stronger when the banking
sector is controlled by the state and when the supervisory power is strong.
Beck et al. (2006) argue that the supervisory policies should focus on enhancing the
ability and incentives of private agents to overcome information and transaction costs, so that
private investors can exert effective governance and monitoring over banks. Consistent
with this argument, they find strong evidence that supervisory policies that focus on
empowering private monitoring by forcing banks to disclose accurate information to the
private sector tend to reduce the degree of corruption in bank lending. Building upon this
finding, we would argue that the news media is a key conduit for reporting and sharing this
information, and it therefore serves as another important channel through which private
investors can exert pressure, scrutiny and monitoring over corrupt bank lending activities.
Based on our discussion above, this channel might become less effective in countries with
state controlled and concentrated media sectors. We directly test this effect in our
subsequent empirical analysis.
Finally, to lend some additional support to the above arguments, we highlight some
anecdotal evidence from Bangladesh. According to Anam (2002), the media has recently
played a substantial role in curbing corrupt bank lending activities in Bangladesh. News
reports focusing on the large proportion of non-performing loans (> 40%), alongside other
reports documenting pervasive lending corruption have arguably exerted pressure on the
authorities to take disciplinary actions. Anam points out that, ―media exposure led to a
strengthening of the central bank's supervisory role, and oversight teams whose members
have been sent abroad for further training now visit bank branches across the country to
supervise and monitor their work.‖ (p.270, Anam). As a direct and immediate result, the
revelations of corruption and other abuses of power (Walden, 2002). In Kazakhstan (one country in our sample),
for example, the Committee to Protect Journalists reported that the state-owned printing company Dauir refused
to continue publishing the Russian-English biweekly Vremua Po after it reprinted articles from Newsweek and
the Wall Street journal on the corruption scandal. In Azerbaijan (another country in our sample), a journalist
with the newspaper Baku Boulevard was found guilty in 1999 of "insulting the honor" of the president's brother,
a member of parliament, for describing him as "king of the oil industry." The journalist received a one-year
suspended prison sentence and was barred from leaving the country. Many other examples can be found in
Walden (2002).

10
proportion of nonperforming loans had fallen to 34 percent by December 2000 (Anam, 2002).
Another significant success of the media in Bangladesh was exposing bank directors taking
illegal loans from their own banks under false names. Investigative journalism by
newspapers helped the central bank carry out its investigations and build the essential public
pressure to set up punitive measures and initiate the necessary reforms (Anam, 2002).9
3. Data and Summary Statistics of Key Variables
3.1 The Sample
The dataset used in this study is compiled from three main sources: (1) the World
Business Environment Survey (WBES) on corruption in 80 countries; (2) the Djankov et al.
(2003) dataset on media ownership and concentration in 97 countries around the world; (3) the
Barth et al. (2006) dataset on bank supervision and regulation in 152 countries. Most firm-level
data used in the study come from the WBES, which was conducted in 2000 by a team from the
World Bank. The main purpose of the study is to identify the driving factors behind and the
obstacles to enterprise performance for a broad range of countries. Managers from over 9,000
firms in more than 80 countries were surveyed with a standard questionnaire. The questionnaire
covered many aspects of a firm’s operations, including questions on corruption, financing,
regulation, and institutional environment. As summarized in Beck et al. (2006) and Barth et al.
(2009), there are three advantages in using the WBES data to study bank corruption. First, it
provides direct information on the degree to which firms perceive corruption in lending to be an
obstacle. Second, the surveyed firms vary in size, ownership (both public and private),
industrial sector, and organizational structure. In particular, the dataset covers a large
proportion of small- and medium-size private enterprises, whereas most other cross-country
studies focus exclusively on large, publicly listed firms. Third, the firm-level survey data allow
us to control for firm-specific characteristics and hence to draw appropriate inferences about the
relationships between media ownership, concentration and bank corruption.
The media ownership and competition data come from Djankov et al. (2003). Specifically,
9 Investigations of two banks revealed more than 200 false accounts, and the central bank found that bank
directors were taking illegal loans under false names

11
Djankov et al. (2003) compiled data from various data sources (e.g., Market and Media Fact
Book, World Press Trends, Media in CIS report) on the ownership patterns and market
concentration of media firms (newspapers, television, and radio) in 97 countries from reports
based in the year 2000.
We obtained the banking sector competition, regulation and ownership data from Barth et al.
(2006) and Bankscope. Because of the incomplete overlap among the three datasets and
missing firm-level and banking-sector variables, the final sample used in our study includes
5,331 enterprises in 59 countries all over the world.10
In addition to the three datasets mentioned above, we rely on three other data sources.
The press freedom index is obtained from the datasets assembled by Freedom House. We also
use the World Development Indicator (WDI, 2004) and the World Governance Indicator
compiled by Kaufmann et al. (2006), to control for macro- and institutional factors that might
affect a country’s overall level of bank corruption in a country. Tables 1 and 2 identify the data
sources and provide brief descriptions and summary statistics of the key variables.
[Tables 1 and 2 here]
3.2. Bank Corruption
The bank corruption measure is the dependent variable in our analysis. Following
Beck et al. (2006) and Barth et al. (2009), we construct the measure of corruption
(Corruption) using data from the WBES. Specifically, it is based on the key question
concerning bank corruption in the survey. The question takes the following form: ―Is
corruption of bank officials an obstacle for the operation and growth of your business?‖
Answers vary between 1 (no obstacle), 2 (a minor obstacle), 3 (a moderate obstacle), and 4 (a
major obstacle). Thus, a higher value indicates more severe and pervasive corruption in
lending.
Beck et al. (2006) provide a detailed explanation (see pp. 2136-2137) for why they
10 The countries include Argentina, Armenia, Azerbaijan, Belarus, Brazil, Bulgaria, Cameroon, Canada, Chile, China,
Colombia, Cote d'Ivoire, Croatia, Czech Republic, Egypt, Arab Rep., Estonia, Ethiopia, France, Georgia, Germany, Ghana,
Hungary, India, Indonesia, Italy, Kazakhstan, Kenya, Kyrgyz Republic, Lithuania, Malawi, Malaysia, Mexico, Moldova,
Nigeria, Pakistan, Peru, Philippines, Poland, Portugal, Romania, Russian Federation, Senegal, Singapore, Slovak Republic,
Slovenia, South Africa, Spain, Sweden, Tanzania, Thailand, Tunisia, Turkey, Uganda, Ukraine, United Kingdom, United
States, Venezuela, Zambia, Zimbabwe.

12
believe that these self-reported data are not biasing the results in favor of their findings.
They argue that if a firm facing the same obstacles responds to questions differently in
different institutional environments, then, to the extent that this represents pure measurement
error, it would bias the results against finding a significant relationship between competition,
information sharing and firm financing obstacles. Lending further support to their argument,
Beck et al. (2006) obtain the same key results even after controlling for a wide range of
country-specific traits. Finally, existing papers using the same database show that firms’
responses to the survey on financing obstacles are capturing more than idiosyncratic
differences in how firms rank obstacles; the survey data are associated with measurable
outcomes in terms of efficiency of investment flows, firm growth, corruption and property
rights, as shown in several recent and influential studies (see Barth et al., 2009 for a review
and discussion). Likewise, Beck, Demirguc-Kunt and Peria (2007) show that across
countries, an objective measure of the degree of access to and use of banking services is
closely related to the WBES measure of firm financing obstacles.
3.3. Media Ownership and Competition
As discussed in the previous section, one key independent variable in our study is media
ownership. Following Djankov et al. (2003), we use five variables to measure media
ownership. State Ownership, Press (by count) measures the percentage of state-owned
newspapers out of the five largest daily newspapers (by circulation). For instance, two out
of the top five newspaper enterprises in the Philippines are state owned.11
The Philippine
newspaper market ownership is then recorded as 40 percent state owned when measured by
count (Djankov et al., 2003). In contrast, State Ownership, Press (by share) measures the
market share of state owned newspapers out of the aggregate market share of the five largest
daily newspapers. Using the same example, the two state-owned newspapers in the
Philippines account for 22.2 percent and 21.3 percent of total circulation for the top five
newspapers, respectively, so the Philippine newspaper market is 43.5 percent state owned
11 The state owned media enterprises are the media enterprises with state as the ultimate controlling shareholder. Please see
DMNS (2003) for details in classification.

13
when measured by market share. In our sample, the average market share of state owned
newspapers is 22%.
We use two similar variables to measure the television market ownership. Specifically,
State Ownership, Television (by count) measures the percentage of state owned television
stations out of the five largest television stations (by viewership). State Ownership,
Television (by share) measures the market share of state owned television stations out of the
aggregate market share of the five largest television stations (by viewership). In our sample,
the average market share of state ownership television station is 55%. Regarding the radio
market, we create a dummy equal to one if the top radio station is state owned, and zero
otherwise.12
We use four variables to measure media market competition. A widely used measure of
market competition is the concentration ratio (e.g., Barth et al., 2009). We therefore use the
aggregate market share of the five largest daily news paper (Top 5 concentration, Press) to
measure the newspaper market concentration. Alternatively, we also construct the Top 3
concentration, Press, which is the aggregate market share of the three largest daily news
paper. Similarly, Top 5 concentration, TV, measures the aggregate market share of the five
largest television stations and Top 3 concentration, TV, measures the aggregate market share
of the three largest television stations.
3.4. Press Freedom
In our analysis, we also use a measure of press freedom to test the robustness of the link
between media and corruption in bank lending. Our main measure of press freedom is the
Freedom House Press Freedom Index, which measures for each country the level of press
freedom in three broad categories: the legal environment, political influences, and
economic pressures (Freedom House, 2003). Specifically, the legal environment
encompasses an examination of the laws and regulations that could influence media content
12
As discussed in DMNS (2003), data on radio market ownership are limited. The radio market is highly regional, which
precludes any single station from achieving a large market share. DMNS (2003) gather ownership data on the top radio
station as measured by peak adult audience and on the ―all-news‖ (not only entertainment) radio station when one exists in a
country.
14
as well as the government's inclination to use these laws to restrict the ability of media to
operate. The political influences mainly reflect the degree of political control over the
content of the news media.13
The economic pressures on the media reflects the competitive
pressures in the media sector (e.g., structure of media ownership, the costs of establishing
media outlets, official bias in licensing) as well as economic favoritism or reprisals by
government for unwanted press coverage (Brunetti and Weder, 2003, Freedom House, 2003).
The aggregate Press Freedom Index ranges from 0 to 100, with a higher value indicating
lower degree of press freedom. According to Freedom House,14
only 17 percent of the
world's citizens live in countries with a free press (Press Freedom < 30). In the rest of the
world, governments control the viewpoints that reach citizens and repress independent voices
who aim to promote accountability, good governance, and economic development. In our
sample, the mean of the press freedom index is about 44.6 with a standard deviation of 19.98,
suggesting that there is significant cross-country variation in the levels of press freedom.
3.5. Bank Competition and Information Sharing
Barth et al. (2009) find that credit information sharing and bank competition both
significantly reduce bank lending corruption. We therefore control for the information
sharing and bank competition to isolate the effects of the media on bank corruption.
Following Barth et al. (2009), we use the Herfindahl-Hirschman Index (HHI), which is equal
to the sum of the squares of the market shares (deposits) of each individual bank in individual
countries in the sample in 1999, to measure bank competition. The bank level data are from
the BankScope database. The (normalized) Herfindahl-Hirschman Index ranges from 0 to 1
with a higher value indicating greater monopoly power. To control for information sharing,
we include a dummy variable (Information Sharing) which equals one if an information
sharing agency is operating in the country by the end of 1999, and zero otherwise. The
information sharing agency is a database maintained by a public authority or private
13
Issues examined in this category include access to information and sources, editorial independence, official censorship
and self-censorship, the ability of the media to operate freely and without harassment, and the intimidation of journalists by
the state or other actors. 14
http://www.freedomhouse.org/template.cfm?page=16

15
commercial firm, which collects information on the creditworthiness of borrowers in the
financial system and facilitates the exchange of credit information among banks and financial
institutions (Barth et al., 2009). The information sharing data is obtained from the Djankov
et al. (2007).
3.6. Bank Supervision and Private Monitoring
Beck et al. (2006) examine the role that bank supervision plays in combating lending
corruption. They find that strengthening traditional official supervision does not have a
positive impact on the integrity of bank lending, but instead, a supervisory strategy that
focuses on empowering private monitoring of banks through the disclosure of accurate and
timely information reduces lending corruption. Official Supervisory Power is constructed
from a series of dummy variables that indicate whether bank supervisors can take specific
actions against bank management, bank owners, and bank auditors both in normal times and
times of distress. This measure includes information on whether the supervisory agency can
force a bank to change its internal organizational structure, suspend dividends, stop bonuses,
halt management fees, force banks to constitute provisions against actual or potential losses
as determined by the supervisory agency, supersede the legal rights of shareholders, remove
and replace managers and directors, obtain information from external auditors, and take legal
action against auditors for negligence. A high value of this measure indicates wider and
stronger authority for bank supervisors.
Private monitoring is the principal component indicator of nine dummy variables that
measure whether bank officials are legally liable for the accuracy of disclosed information;
whether banks disclose information such as consolidated accounts, off-balance sheet items,
accrued, unpaid interest/principal of non-performing loan and/or risk management procedure
to the public; whether banks must be audited by certified international auditors; whether
largest 10 banks are rated by international and domestic rating agencies; whether
subordinated debt is allowable as part of capital, and whether there is no explicit deposit
insurance system and no insurance was paid the last time a bank failed. A high value of this
measure indicates more tools and incentives for private bank creditors to monitor banks.

16
3.7. Government Bank Ownership
As mentioned earlier, the impacts of media state ownership and concentration on
corruption in bank lending might be accentuated by the government ownership of the banking
sector. We therefore include a variable to measure the government ownership of the
banking industry. Government Bank Ownership is the fraction of the banking system's assets
in banks that are 50% or more owned by government. The data is obtained from Barth et al.
(2006).
3.8. Firm Characteristics and Controls
Barth et al. (2009) find that the ownership structure of the firm is associated with the
existence of bribery payments. We therefore include two dummy variables that identify a
firm’s ownership type. Government equals 1 if any government agency or state body has a
financial stake in the ownership of a firm, and 0 otherwise. Foreign equals 1 if any foreign
investor has a financial stake in the ownership of a firm, and 0 otherwise.
In addition, we include several other enterprise-level controls. Firm Size is measured
by the natural logarithm of total sales. Competitors is the number of competitors in the
firm’s main business line. Exporter is a dummy variable, which takes on a value of one if
the firm exports, and 0 otherwise. Lastly, standard industry classification variables are
included in the analysis. For the sake of brevity, the coefficients of the industry
classification variables are not reported in the tables, but are available upon request.
3.9. Additional Country Controls
Our empirical analysis also includes several country-level variables to control for
differences in economic development and institutions across countries. Specifically, we
control for GDP per capita and inflation. Furthermore, we include a series of other political
and institutional quality indexes (World Governance Indexes, Kaufmann et al., 2006) as a
check on the robustness of the results. The World Governance Indexes are constructed
based on 276 individual variables taken from 31 different sources produced by 25 different

17
organizations. The indexes measure different dimensions of governance, which can be
summarized as follows:
(1) Government effectiveness (Government Effective)—the quality of public services, the
quality of the civil service and the degree of its independence from political pressures, the
quality of policy formulation and implementation, and the credibility of the government’s
commitment to such policies.
(2) Political stability and absence of violence (Political Stability)—perceptions of the
likelihood that the government will be destabilized or overthrown by unconstitutional or
violent means, including political violence and terrorism.
(3) Regulatory quality (Regulation)—the ability of the government to formulate and
implement sound policies and regulations that permit and promote market competition and
private-sector development.
(4) Rule of law (Law)—the extent to which agents have confidence in and abide by the rules
of society, and in particular, the quality of contract enforcement, the police, and the courts, as
well as the likelihood of crime and violence.
(5) Voice and accountability (Voice)—the extent to which a country’s citizens are able to
participate in selecting their government, as well as the extent to which they enjoy freedom of
expression, freedom of association, and a free media.
(6) Control of Corruption (Control of Corruption)—the extent to which public power is
exercised for private gain, including both petty and grand forms of corruption, as well as
―capture‖ of the state by elites and private interests. Higher values indicate better control of
corruption.
4. Empirical Results
4.1. Media Ownership and Corruption in Lending
As summarized below, we assume that a variety of factors influence a firm’s latent
response to a survey question regarding its perceptions about the degree of banking
corruption:

18
(1)
where the i and j subscripts indicate firm and country, respectively. The media ownership
measures include five variables: State Ownership, Press (by count), State Ownership, Press
(by share), State Ownership, Televisions (by count), State Ownership, Television (by share),
and State Owned Radio, respectively. The banking sector controls include government
ownership of the banking sector, bank concentration (HHI index), credit information sharing,
official supervisory power, and regulations that facilitate private monitoring. We also
control for firm characteristics such as firm size, ownership, exporting status, and
competition. Industry dummies and other macro controls are included as well. Detailed
definitions of these variables were described above in Section 3. Unlike the latent variable,
the observed dependent variable, is a polychotomous variable with a
natural order. Specifically, a firm classifies corruption in lending into 4 categories, with 3
threshold parameters, . We therefore use the ordered probit model to estimate the
-parameters together with the regression coefficients simultaneously. In addition, the
heteroskedasticity-robust standard errors clustered at the country level are used in computing
p-values. When clustering the standard errors by country, observations are not restricted to
be independent within countries; rather, observations are required to be independent across
countries. This treatment has been shown to be important in deriving robust and reliable
results (Beck et al. 2007). These results are reported in Table 3.
[Table 3 here]
The magnitude of the ordered probit coefficients cannot be simply interpreted as the
marginal effects of a one-unit increase in the independent variables on the dependent variable,
although the sign and statistical significance of the coefficients are similar to the linear
regression interpretations. We quantify the magnitude of the impact on an average firm
when we further discuss the results in Table 5 below.
Looking at Panel A of Table 3, the most important finding is that media state ownership
is positively associated with corruption in lending. As can be seen in the table, each of our
media state ownership measure (i.e., Press, TV or Radio) has a positive, highly statistically
significant coefficient, suggesting that increased state ownership of media results in greater

19
lending corruption. Overall, the empirical results support the political media capture
hypothesis which holds that politicians or supervisors might suppress the government
controlled media in reporting bank corruption cases to entrench their positions, preclude
public oversight, and maximize their own private benefits (Djankov et al. 2003, Beck et al.,
2006). This view implies that the state ownership of media makes the media less effective
in monitoring corruption, which consequently encourages corruption in bank lending. In
fact, all the media state ownership measures have significantly positive coefficients in the
regressions reported in Table 3, confirming the core predictions of the political/regulatory
capture view of media influence.
The aforementioned evidence implies that the state owned press is likely to face stronger
political pressure to avoid reporting incidents of bank corruption. The political pressures,
however, would presumably be much stronger if the corruption were occurring in state owned
banks. Given this presumption, we include interactive terms linking the state ownership of
the media and state ownership of the banking sector in our baseline models. Specifically,
we include Press state ownership × Government bank ownership in column (1); TV state
ownership × Government bank ownership in column (2); and State owned radio ×
Government bank ownership in column (3). In column (4), we include all three interactive
terms. The empirical results are presented in Panel B of Table 3.
In each case, the coefficients of the interactive terms are positive and statistically
significant, suggesting that state ownership of the media is likely to result in even more
corruption in those countries that also have a state controlled banking sector.
The control variables also yield interesting results. Consistent with Barth et al. (2009),
the coefficients related to the Herfindahl-Hirschman Index (HHI) are positive and statistically
significant in all specifications, indicating that increased bank concentration is associated
with more corruption in lending. Also consistent with Barth et al. (2009), we find that
information sharing helps reduce lending corruption. Official Supervisory Power is
positively associated with corruption in bank lending while Private Monitoring is negatively
associated with corruption in lending. These results confirm the findings by Beck et al.
(2006). In addition, we find some evidence that state-owned firms and foreign-owned firms

20
are less likely to rate bank corruption as an obstacle to growth. This finding suggests that
firms that have more government connections, soft-budget constraints and stronger
bargaining power suffer less from corruption. Furthermore, Firm Size generally is
negatively related to corruption in lending, while Exporting firms are associated with less
corruption in lending. Finally, we do not find a significant relationship between firm
competition and corruption in lending.
4.2. Media Ownership, Concentration and Corruption in Lending
In Table 4, we add the media concentration measures to our baseline models. As
discussed previously, we use four different variables to measure the degree of media market
concentration (i.e. TV top 5 concentration, TV top 3 concentration, Press top 5 concentration,
Press top 3 concentration). Once again, the detailed definitions of these variables can be
found in Section 3. The empirical model can be expressed as follows:
(2)
The empirical results, with robust standard errors clustered by country, are presented in
Table 4.
[Table 4 here]
Table 4 shows that media competition reduces corruption in lending. As can be seen in
all of the model specifications, the coefficients of TV top 5 (3) concentration and Press top 5
(3) concentration are positive and statistically significant at the 5% level. All of these
results strongly suggest that competition in the media market provides stronger incentives for
media firms to actively investigate newsworthy events such as bank corruption cases.
Bank concentration and bank government ownership are also positively associated with
more corruption in lending, suggesting that banking corruption is more pervasive and severe
in countries with concentrated and state controlled banking sector. As expected,
information sharing helps reduce corruption in lending. Furthermore, Official Supervisory

21
Power is positively associated with corruption in bank lending while Private Monitoring is
negatively associated with corruption in lending. The firm controls also yield the expected
results.
The effects of media ownership and concentration on corruption in lending are not only
statistically significant, but also economically significant. In order to demonstrate the
magnitude of the impacts of media ownership and concentration on bank corruption, we use
model (6) in Table 4 to quantify the effect that media ownership and concentration have on
the probability that corruption in lending is rated as an obstacle to firm growth. The
empirical results of this illustrative exercise are presented in Table 5.
[Table 5 here]
As can be seen, the magnitude of the effects is quite substantial. For example, the
estimates imply that a one standard deviation increase in Press state ownership would lead to
a 3.8 percentage point increase in the probability that a firm rates bank corruption as a major
obstacle (i.e., the probability that a firm rates bank corruption as a major obstacle) and a 7.1
percentage point decrease in the probability that a firm rates bank corruption as not an
obstacle to firm growth. Similarly, the estimates imply that a one standard deviation
increase in TV state ownership would lead to a 3.9 percentage point increase in the
probability that a firm rates bank corruption as a major obstacle and a 8.3 percentage point
decrease in the probability that a firm rates bank corruption as not an obstacle to firm growth.
If TV state ownership increases from the minimum to maximum in the sample, the
probability that a firm rates bank corruption as a major obstacle to a firm growth increases by
10.9 percentage points and the probability that a firm rates bank corruption as not being an
obstacle to firm growth decreases by about 23.6 percentage points. The effects are quite
substantial given that about 12% of the firms in the sample report that corruption in lending is
a major obstacle to their growth and about 58% of the firms say that bank corruption is not an
obstacle for growth.
With respect to media concentration, the estimates imply that a one standard deviation
increase in Press top 3 concentration would lead to a 3.2 percentage point increase in the
probability that a firm rates bank corruption as a major obstacle and a 6.3 percentage point

22
decrease in the probability that a firm rates bank corruption as not an obstacle to firm growth.
Similarly, a one standard deviation increase in TV top 3 concentration would lead to a 3.4
percentage point increase in the probability that a firm rates bank corruption as a major
obstacle and a 7 percentage point decrease in the probability that a firm rates bank corruption
as not an obstacle to firm growth. Again, all these effects are quite substantial given that
relatively few firms report lending corruption as a major obstacle to their growth and about
half of the firms report that bank corruption is not an obstacle for growth.
4.3. The Interplay between Media Ownership and Concentration
As discussed in Section 2, the anti-corruption monitoring incentives of media firms
might be even lower in countries with a state controlled and/or concentrated media sector.
We examine this potential effect by including the interactive terms between the media state
ownership variables and the media concentration variables. The empirical results are
presented in Table 6.
[Table 6 here]
As can be seen from the table, the coefficients of the interactive terms are positive and
statistically significant, suggesting that a strengthening of the positive effects between media
state ownership and corruption in lending in the countries with a concentrated media market.
In other words, corruption in lending is more pervasive in countries with a state controlled
and concentrated media sector.
The other control variables yield similar results. Bank concentration and bank
government ownership are positively associated with more corruption in lending, while
information sharing among creditors helps reduce corruption. Once again, Official
Supervisory Power is positively associated with corruption in bank lending while Private
Monitoring is negatively associated with corruption in lending. The firm controls also yield
similar results.
5. Robustness Tests and Further Explorations
5.1. Probit Analysis and Instrumental Variable Analysis

23
The fact that we do not have a balanced distribution of responses across the four
categories of answers regarding corruption of bank lending might invalidate the ordered
probit estimates. Moreover, a few outliers in one of the categories with a small number of
responses could exert an undue influence on the results (see Beck et al., 2006, Barth et al,
2009). In order to allow us to use a comparatively balanced distribution of responses and
lower the likelihood that idiosyncratic firm responses are biasing the results, we follow the
previous studies (e.g., Beck et al., 2006, Barth et al., 2009) and construct a bank corruption
dummy (Corruption Dummy) that takes on the value of zero if ―no obstacle‖ and one if the
firm’s response is ―minor,‖ ―moderate‖ or ―major.‖15
We use this lending corruption
dummy as the dependent variable and repeat the entire analysis with the probit regressions.
The results are reported in columns (1) – (3) of Table 7.
[Table 7 here]
The empirical results are very similar to our previous findings. The coefficients of
Press State Ownership, TV state ownership, and State owned ratio are positive and
statistically significant in all model specifications, suggesting that state control of the media
increases the likelihood that a firm rates bank corruption as an obstacle. With respect to the
media concentration variables, the coefficients of Press top 3 concentration, and TV top 3
concentration are positive and statistically significant, suggesting that media concentration
increases the likelihood of corruption in bank lending.
Similarly, banking sector concentration and government ownership increases the
probability that a firm rates bank corruption as an obstacle. Credit information sharing
reduces the likelihood that an average firm rates bank corruption as an obstacle. Official
Supervisory Power is positively associated with the likelihood of corruption in bank lending
while Private Monitoring reduces the likelihood of corruption in lending. Both the presence
of government and foreign firm ownership reduce the probability that a firm rates bank
corruption as an obstacle. Larger firms are also less likely to rate bank corruption as an
obstacle.
15
In our sample, about 58% of firms responded that corruption in bank lending is not an obstacle to firm
growth, while 42% indicated that bank corruption is an obstacle, indicating it is either a minor, moderate, or
major obstacle.

24
In our study, endogeneity-related problems are less of a concern than is the case in a pure
cross-country analysis, because we are examining the impact of media sector ownership and
concentration on individual firms. It seems unlikely that an individual firm’s view about
corruption in lending will influence nation-wide media concentration and ownership (Barth et
al., 2009). On the other hand, it is conceivable that high levels of lending corruption could
generate calls for lower level of media concentration and state ownership. However, if this
type of feedback from the corporate sector to policy making were in force, the empirical
relationship between media concentration/state ownership and corruption in bank lending
should be negative. Instead, our consistent finding of a positive and significant relationship
between media concentration/state ownership and corruption in bank lending suggests that
these types of feedback effects are unlikely to be of first-order concern.
Nevertheless, to more rigorously rule out these endogeneity concerns, we conduct some
robustness tests using instrumental variable probit analysis. We rely on the findings from
some recent studies in the media, institutions and economics literature (Easterly and Levine,
1997; Beck et al., 2003, Brunetti and Weder, 2003; Djankov et al. 2003; Egorov, Guriev and
Sonin, 2009), as a basis for selecting the instrumental variables. In particular, Egorov et al.
(2009) argue that, ―in resource rich countries, a dictator has larger rents to lose from a revolt
and has less interest in providing incentives to his bureaucrats.‖ Therefore, media freedom
might be less likely to emerge. Empirically, they find strong evidence that media freedom is
less likely in oil-rich economies. In the same spirit, we use oil reserve of the economy as
the first instrumental variable for media ownership and structure. We view this as a
plausible instrumentabl variable because it is less likely that oil reserve would exert a direct,
first-order effect on bank lending corruption.
We also search potential instrumental variables (IVs) based on the endowment theory,
which focuses on the role of geography and the disease environment in shaping the
institutional development (e.g., Beck et al., 2003). Beck et al. (2003) find strong evidence
that geographical endowment has substantial impacts on the formation of long-lasting
institutions that shape economic development. Consequently, we follow Beck et al. (2005,

25
2006) and use latitude16
as an additional instrumental variable for media ownership and
competition. We also include the ethnic fractionalization17
as an instrumental variable
because it has been found that economies with greater ethnic diversity tend to choose
institutions that allow those in power to expropriate resources from others (Beck et al. 2003,
2006). Furthermore, we follow Beck et al. (2006) and include the percentage of years that
the country has been independent since 1776 as an additional IV because ―countries that
gained their independence in the 18th or 19th centuries had more opportunity to modify
colonial institutions and policies and adopt policies more conducive to broad-based economic
growth (p.2154, Beck et al. 2006).‖ Barth et al. (2009) used a similar set of instrumental
variables in their recent analysis. The empirical results are presented in columns (4) – (6) of
Table 7.18
Alternatively, we also follow Brunetti and Weder (2003) and use the democracy indexes
compiled by Freedom House and the Polity IV dataset (Marshall and Jaggers, 2007) as
potential IVs. As documented by Djankov et al. (2003), democracy exerts significant
impacts on the media ownership and competition. However, it is less likely that democracy
would have direct impacts on bank official corruption in commercial lending. In fact, recent
studies (e.g., Fan, Lin and Treisman, 2009) find no relationship between democracy and firm
corruption activities. The Freedom House Democracy Indexes provide a comprehensive
classification of countries, based separately on political rights (Political Rights)19
and civil
liberties (Civil Liberties).20
Both indexes range from 1 to 7, with a higher value indicating a
higher degree of democracy. Because of the very high correlation of the two variables
(> 0.9), we use them as instrumental variables alternatively and find the results highly
16
The absolute value of the latitude of the country, scaled to take a value between 0 and 1, is from LLSV
(1999). 17
We use the average value of five different indices of ethnical fractionalization. The data are from Easterly
and Levine (1997). 18
Since we have four IVs but five media ownershio and concentration measures, we do not include all five
media variables in a sigle IV estimation. 19
Political rights enable people to participate freely in the political process, including the right to vote freely for
distinct alternatives in legitimate elections, to compete for public office, to join political parties and
organizations, and to elect representatives who have a decisive impact on public policies and are accountable to
the electorate. 20
Civil liberties refer to the freedoms develop views, institutions and personal autonomy without interference
from the government.
26
robust.21
The second IV based on democracy measure comes from the Polity IV dataset of
Marshall and Jaggers (2007), a project of the Integrated Network for Societal Conflict
Research Program, Center for Global Policy, George Mason University and Center of
Systemic Peace. This source contains, among many other variables, yearly composite
indicators measuring autocracy for every independent country with a population greater than
500,000 on an additive eleven-point scale (with higher values indicating greater democracy).
The autocracy index (Autocracy) is defined in terms of the presence of a distinctive set of
political characteristics that sharply restrict or suppress competitive political participation.
The autocracy index is derived from coding the competitiveness of political participation, the
openness and competitiveness of executive recruitment and constraints on the executive. A
higher value indicates a less democratic environment. We replace the oil reserve measure
with these democractc measures in the IV estimation and find the results highly robust.22
Following the literature (e.g., Beck et al. 2006), we conduct two tests to assess the
appropriateness of the instruments. First, we employ the overidentifying tests, which assess
whether the instrumental variables are associated with the dependent variable beyond their
effects through media sector ownership and strucutre or the other explanatory variables. We
refer to this analysis as the ―Overidentifying Test‖ and report the p-value of the test of the
overidentifying restrictions. Failure to reject the null hypothesis implies a failure to reject
the validity of the instruments. As can be seen from Table 7, we cannot reject the null
hypothesis that the instruments are valid in all model specifications, suggesting that these
instruments only exert an impact on corruption in lending through their effect on media sector
ownership and strucuture. In addition, we conduct an F-test of the excluded exogenous
variables in the first-stage regressions. Specifically, we test the null hypothesis that the
instruments do not explain cross-sectional differences in media ownship and concentration.
We reject this null hypothesis at the 1% level in all model specifications. For brevity, we
only report the p-values of the F-tests in the last row of table 7. The first-stage regressions
21
For brevity, we only report the empirical results using civil liberties as the IV. The results using political
rights as IV are available from the authors upon request. 22
For brevity, the empirical results are not reported but available from the authors.

27
are available from the authors upon request.
The empirical results are very robust. The coefficients of Press State Ownership, TV
state ownership, and State owned ratio are positive and statistically significant in all model
specifications, indicating that state ownership of media sector increases the likelihood that a
firm rates bank corruption as an obstacle. The coefficients of Press top 3 concentration, and
TV top 3 concentration are positive and statistically significant, suggesting that media
concentration increases the likelihood of corruption in bank lending. The other variables
also yield similar results. Furthermore, the IV coefficients are larger than the OLS
coefficients, indicating the existence of potential measurement error, which would tend to
―attenuate‖ the coefficient estimate toward zero (Barth et al. 2009). It is also worth noting
that our main results do not depend on instrumentation, although the latter increases the
magnitude of the coefficients. In fact, this is a regular finding in the finance and growth
literature (e.g., Beck et al. 2006; Barth et al. 2009).
5.2. More Macro and Micro Controls
In this section, we address the issue of potential omitted variables. Since the overall
quality of the institutional environment might influence lending corruption, we include a
series of macro and micro controls in our model to test the robustness of the results.
We first use the Press Freedom Index to test the robustness of the link between media and
corruption in bank lending. As can be seen from column 1 of table 8, lower degree of press
freedom results in more corruption in lending, which echoes our previous findings.
Following Beck et al. (2006) and Barth et al. (2009), we also test the robustness of the
results by including an additional control variable (General Financing Obstacle) that is based
on a firm’s response to the question ―how problematic is financing for the operation and
growth of your business?‖ (1-no obstacle, 2-a minor obstacle, 3-a moderate obstacle, 4-a
major obstacle). As Beck et al. (2006) point out, this variable provides a further indication
of the manager’s general level of pessimism, and incorporating this additional control
variable enables us to establish that the link we find is with bank corruption, not with overall
complaints about the financial sector. The empirical results are presented in Column 2 of

28
Table 8. As can be seen, all the key variables remain significant, suggesting that our main
findings are very robust to the inclusion of the new variable.
We then include one of the World Governance Indexes compiled by Kaufmann et al.
(2006) to control for the overall level institutional environment (control of corruption,
government effectiveness, quality of regulation, rule of law and voice and accountability).
Because some indexes are highly correlated with each other, we include the indexes
individually in the models. The empirical results are presented in columns 3-8 of Table 8.
[Table 8 here]
As can be seen from the Table, the empirical results are highly robust after the inclusion
of these new institutional controls. Regarding the new institutional controls, we find that
better control of corruption, more effective government, better rule of law and higher degree
of voice and accountability are associated with less corruption in lending.
5.3. Media, Supervisory Power and Private Monitoring
Beck et al. (2006) argue that if bank supervisory agencies have the power to discipline
non-compliant banks, then politicians and supervisors may use the power to shape the credit
allocation and thus induce more corruption in bank lending. They find supporting evidence
that supervisory power of bank regulator is positively associated with more corruption in
lending. Our study confirms this result. As discussed above in Section 3, this link
between supervisory power and corruption in bank lending is likely to be stronger in
countries with concentrated and state controlled media sector because the media firms in such
environments face stronger political pressure and lack the incentives to report bank
corruption cases. We examine this potential effect by including the interactive terms
between the media state ownership variables and supervisory power and the interactive terms
between media concentration and supervisory power. The empirical results are Apresented
in Table 9.
At the same time, Beck et al. (2006) argue that the supervisory policies should focus on
enhancing the ability and incentives of private agents to overcome information and
transaction costs, so that private investors can exert effective governance and monitoring over
29
banks. Consistent with this argument, they find strong evidence that the supervisory
policies that focus on empowering private monitoring of banks by forcing banks to disclose
accurate information to the private sector tend to low the degree of corruption in bank lending.
We find similar results in our study. As discussed before, media report is another important
channel through which private investors can exert pressure and monitoring over bank lending
corruption. In the countries with state controlled and concentrated media sectors, this
channel becomes less effective. We therefore expect that media state ownership and media
concentration weakens the link between private monitoring and corruption in lending. We
examine this potential effect by including the interactive terms between the media state
ownership variables and private monitoring measure and the interactive terms between media
concentration and private monitoring measure to the baseline model. The empirical results
are also presented in Table 9.
[Table 9 here]
As can be seen from the table, the empirical results confirm our expectations. The
coefficients on the media state ownership/supervisor power interaction terms and media
concentration/supervisory power interactive terms are consistently positive and statistically
significant across our various specifications. The estimations suggest that official
supervisory power results in more corruption in lending in the countries with concentrated
and state controlled media sectors. The coefficients on the media state ownership/private
monitoring and media concentration/private monitoring interactive terms are consistently
positive and statistically significant across model specifications. These findings suggest that
a concentrated and state controlled media sector weakens the anti-corruption role of private
monitoring. The other variables yield similar results.
5.4. A closer look at private firms
As discussed above, a free and competitive press constitutes an additional channel which
can protect firms against lending corruption. This type of protection might be particularly
important to private firms, who have lower bargaining power and limited resources in

30
fighting against lending corruption.23
Our previous results show that private firms are
subject to more corruption in lending. We expect the relationship will be stronger in the
countries with concentrated and state controlled media sectors. We examine this potential
effect by including the interactive terms between the media state ownership variables and
private firm dummy and the interactive terms between media concentration and private firm
dummy to the baseline model. The corresponding empirical results are presented in Table
10.
[Table 10 here]
As can be seen from the table, the empirical results confirm our expectation. The
coefficients on the media state ownership/private firm interaction terms and media
concentration/private firm interactive terms are consistently positive and statistically
significant across our various regressions. The estimations suggest that private firms are
subject to more corruption in lending in the countries with concentrated and state controlled
media sectors. The other variables yield similar results.
6. Conclusions
Corruption in lending undermines banks’ primary function of allocating scarce capital
efficiently and consequently impedes economic growth. This is a particularly serious
problem in developing countries to the extent they lack adequate laws, objective courts,
prudential regulations, and other appropriate institutions to sufficiently contain corruption
(Barth et al. 2009). Our paper examines the effects of media ownership and concentration
on corruption in bank lending. We use the World Bank Business Environment Survey
(2000) which contains direct firm-level information on the degree to which corruption in
bank lending represents an obstacle to firms; the Djankov et al. (2003) dataset on media
ownership and concentration in 97 countries around the world and the Barth et al. (2006)
23
State ownership of the firm, due to its political influence, may have an upper hand in negotiating with lending
officers on terms of loans. The enhanced bargaining power will lead to less bribery in lending. Furthermore,
SOEs sometimes can obtain bank loans due to government policy so there is less of a need to bribe bank officers
(Barth et al. 2009). Regarding the foreign-owned firms, they may have alternative financing channels for their
investments (e.g., from their parent companies), which in turn imply greater bargaining power and result in less
bribery in lending (Barth et al., 2009).

31
dataset on bank supervision and regulation in 152 countries. We find that state ownership of
media is associated with more banking corruption.. We also find that media concentration
increases corruption in bank lending both directly and indirectly through its interaction with
media state ownership. In addition, we find that media state ownership or media
concentration accentuates the positive link between official supervisory power and corruption
in lending and attenuates the negative link between the regulations that empower private
monitoring and corruption in lending. Furthermore, the effect of the media state ownership
or media concentration on the corruption in bank lending is more pronounced when the
borrowing firm is privately-owned.
Taken together, our results suggest that potential monitoring and investigation incentives
by media firms are undermined by state ownership and high market concentration of
ownership. The ineffective media monitoring reduces the expected costs of engaging in
corruption activities and, in turn, results in more corruption in lending.
Our findings complement the recent works of Beck et al. (2006) and Barth et al. (2009),
which are to our knowledge the only existing studies of the determinants of corruption in
obtaining bank finance by firms. More broadly, out study also contributes to the corruption
literature in other types (e.g., equity) of corporate finance (e.g., Liu and Ritter, 2009) and the
investor protection literature (e.g. LLSV, 2002). Our paper also contributes to the growing
literature on media and economics/finance by showing that the media ownership and
concentration play a very important roles in determining the corruption in bank finance. In
this regard, our study shed direct light on the channel through which the media ownership and
concentration might affect economic growth and highlight the importance of media
ownership and concentration in determining banking sector efficiency.

32
References
Anam, M. ―The Media and Development in Bangladesh,‖ in The Right to Tell—The Role of
Mass Media in Economic Development. Washington, DC: The World Bank Institute, 2002:
267-75.
Barth, J., Caprio, G., Levine, R., 2004. Bank regulation and supervision: what works best?
Journal of Financial Intermediation, 205-248.
Barth, J., Caprio, G., Levine, R., 2006. Rethinking Bank Regulation: Till Angels Govern. New
York: Cambridge University Press.
Barth, J., Caprio, G., Levine, R., 2007. The Microeconomic Effects of Different Approaches
to Bank Supervision, in The Politics of Financial Development, Eds: Stephen Haber,
Douglass North, and Barry Weingast, Stanford University Press, 156-188.
Barth, J., Lin C., Lin P., and Song F., 2009. Corruption in bank lending to firms:
Cross-country micro evidence on the beneficial role of competition and information sharing,
Journal of Financial Economics 91, 361-388.
Batra, G., Kaufmann, D., and Stone, A., 2004. The Firms Speak: What the World Business
Environment Survey Tells Us about Constraints on Private Sector Development. World Bank,
Washington, D.C.
Beck, T. and Levine, R., 2002. Industry growth and capital allocation: does having a market-
or bank-based system matter? Journal of Financial Economics 64,147-180.
Beck, T., Demirguc-Kunt, A., Levine, R., 2003. Law, endowment and finance. Journal of
Financial Economics 70, 137-181.
Beck, T., Demirguc-Kunt, A., and Levine, R., 2006. Bank supervision and corruption in
lending. Journal of Monetary Economics 53, 2131-2163.
Beck, T., Demirguc-Kunt, A., Peria, M., 2007. Reaching out: Access to and use of banking
services across countries. Journal of Financial Economics 85:234-266.

33
Besley, T., Burgess, R., and Prat, A., ―Mass media and political accountability,‖ in The Right
to Tell—The Role of Mass Media in Economic Development. Washington, DC: The World
Bank Institute, 2002: 45-61.
Brunetti, A., Weder, B., 2003. A free press is bad news for corruption. Journal of Public
Economics 87, 1801-1824.
Djankov, S., McLiesh, C., Nenova, T., Shleifer, A., 2003. Who owns the media? Journal of
Law and Economics 46, 341-381.
Djankov, S., McLiesh, C., Shleifer, A., 2007. Private credit in 129 countries. Journal of
Financial Economics 84, 299-329.
Easterly, W., Levine, R., 1997. Africa’s growth tragedy: policies and ethnic divisions.
Quarterly Journal of Economics 112, 1203-1250.
Egorov, G., Guriev, S., Sonin, K., 2009. Why resource-poor dictators allow freer media: A
theory and evidence from panel data. American Political Science Review 103, 645-668.
Fan, S., Lin, C., Treisman, D., 2009. Political Decentralization and Corruption: Evidence
from Around the World, Journal of Public Economics 93, 2009, 14-34.
Jamieson, K., Campbell, K., The Interplay of Influence, Fifth edition. Belmont, CA:
Wadsworth, 2001.
Kaufmann, D., Kraay, A., Mastruzzi, M., 2006. Governance matters V: Worldwide
governance indicators, 1996-2005. World Bank.
La Porta, R., López de Silanes, F., Shleifer, A., 2002. Government ownership of banks.
Journal of Finance 57, 265-301.
La Porta, R., López de Silanes, F., Shleifer, A., Vishny, R., 2002. Investor Protection and
Corporate Valuation. Journal of Finance 57, 1147-1170.
Leeson, P., 2008. Media freedom, political knowledge, and participation. Journal of
Economic Perspectives 22, 155–169.

34
Levine, R., 1997. Financial development and economic growth: views and agenda. Journal of
Economic Literature 35, 688-726.
Levine, R., 2005. Finance and growth: Theory and evidence. In Aghion, P., and Durlauf, S.,
(Eds.), Handbook of Economic Growth. Amsterdam: North-Holland Elsevier Publishers.
Liu, X., Ritter, J., 2009. The Economic Consequences of IPO Spinning, Review of Financial
Studies, Forthcoming.
Shleifer, A., Vishny, R., 1993. Corruption. Quarterly Journal of Economics, 108:3, pp.
599-617.

35
Table 1: Variable definitions and data sources
Variable Definition Original Sources
Media ownership
State ownership, press (by
count)
Percentage of state-owned newspapers out of the five largest daily newspapers
(by circulation) Djankov et al. (2003)
State ownership, press (by
share)
Market share of state-owned newspapers out of the aggregate market share of
the five largest daily newspapers (by circulation) Djankov et al. (2003)
State ownership,
television (by count)
Percentage of state-owned television stations out of the five largest television
stations (by viewership) Djankov et al. (2003)
State ownership,
television (by share)
Market share of state-owned television stations out of the aggregate market share
of the five largest television stations (by viewership) Djankov et al. (2003)
State owned radio A dummy equals to one if the top radio station is state owned, and zero otherwise. Djankov et al. (2003)
Media concentration
Top 5 concentration, press The aggregate market share of the five largest daily news paper Djankov et al. (2003)
Top 3 concentration, press The aggregate market share of the three largest daily news paper Djankov et al. (2003)
Top 5 concentration, TV The aggregate market share of the five largest televation stations Djankov et al. (2003)
Top 3 concentration, TV The aggregate market share of the three largest televation stations Djankov et al. (2003)
Press freedom measures
It measures for each country the level of press freedom in three broad categories: the legal environment,
political influences, and economic pressures (Freedom House, 2003). The aggregate Press Freedom
Index ranges from 0 to 100, with a higher value indicating lower degree of press freedom.
Freedom House (2003)
Bank Corruption Corruption of bank officials as an obstacle for the operation and growth of your business. (1-no obstacle,
2- minor obstacle, 3- a moderate obstacle, 4-major obstacle)
World Business
Environment Survey
(WBES, 2000)
Government bank
ownership
The fraction of the banking system's assets in the banks that are 50 percent or more owned by
government. The data are compiled based on a survey of banking regulators in 150 countries in 2001. Barth et al. (2006)
HHI of banking sector Herfindahl-Hirschman index is the sum of squared market shares (deposit) of each individual bank in Authors’ calculations using
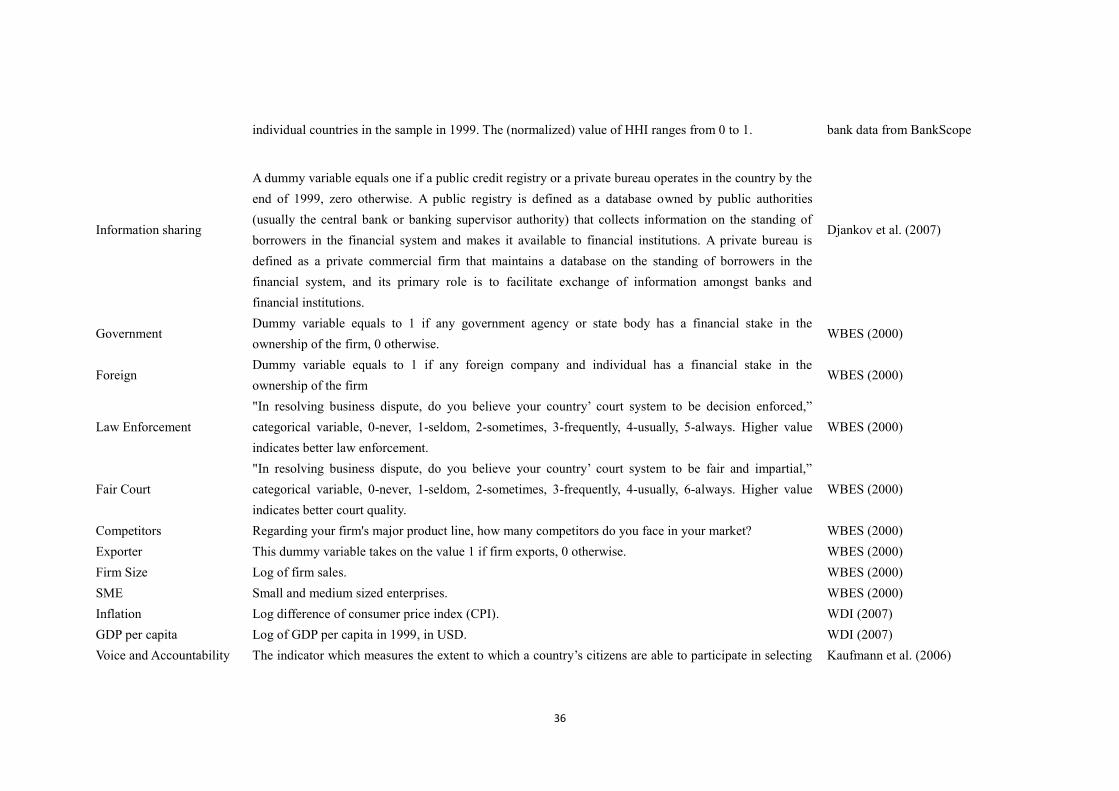
36
individual countries in the sample in 1999. The (normalized) value of HHI ranges from 0 to 1. bank data from BankScope
Information sharing
A dummy variable equals one if a public credit registry or a private bureau operates in the country by the
end of 1999, zero otherwise. A public registry is defined as a database owned by public authorities
(usually the central bank or banking supervisor authority) that collects information on the standing of
borrowers in the financial system and makes it available to financial institutions. A private bureau is
defined as a private commercial firm that maintains a database on the standing of borrowers in the
financial system, and its primary role is to facilitate exchange of information amongst banks and
financial institutions.
Djankov et al. (2007)
Government Dummy variable equals to 1 if any government agency or state body has a financial stake in the
ownership of the firm, 0 otherwise. WBES (2000)
Foreign Dummy variable equals to 1 if any foreign company and individual has a financial stake in the
ownership of the firm WBES (2000)
Law Enforcement
"In resolving business dispute, do you believe your country’ court system to be decision enforced,‖
categorical variable, 0-never, 1-seldom, 2-sometimes, 3-frequently, 4-usually, 5-always. Higher value
indicates better law enforcement.
WBES (2000)
Fair Court
"In resolving business dispute, do you believe your country’ court system to be fair and impartial,‖
categorical variable, 0-never, 1-seldom, 2-sometimes, 3-frequently, 4-usually, 6-always. Higher value
indicates better court quality.
WBES (2000)
Competitors Regarding your firm's major product line, how many competitors do you face in your market? WBES (2000)
Exporter This dummy variable takes on the value 1 if firm exports, 0 otherwise. WBES (2000)
Firm Size Log of firm sales. WBES (2000)
SME Small and medium sized enterprises. WBES (2000)
Inflation Log difference of consumer price index (CPI). WDI (2007)
GDP per capita Log of GDP per capita in 1999, in USD. WDI (2007)
Voice and Accountability The indicator which measures the extent to which a country’s citizens are able to participate in selecting Kaufmann et al. (2006)

37
their government, as well as freedom of expression, freedom of association, and free media. The value of
year 1999 is used in this study. Higher values mean greater political rights.
Government Effectiveness
The indicator which measure the quality of public services, the quality of the civil service and the degree
of its independence from political pressures, the quality of policy formulation and implementation, and
the credibility of the government’s commitment to such policies. The value of year 1999 is used in this
study. Higher values mean higher quality of public and civil service.
Kaufmann et al. (2006)
Rule of Law
The indicator which measure the extent to which agents have confidence in and abide by the rules of
society, and in particular the quality of contract enforcement, the police, and the courts, as well as the
likelihood of crime and violence. The value of year 1999 is used in this study. Higher values mean
stronger law and order.
Kaufmann et al. (2006)
Control of Corruption
The indicator which measure the extent to which public power is exercised for private gain, including
both petty and grand forms of corruption, as well as ―capture‖ of the state by elites and private interests.
The value of year 1999 is used in this study. Higher values indicate better control of corruption.
Kaufmann et al. (2006)
Official Supervisory
Power
Principal component indicator of 14 dummy variables: 1.Does the supervisory agency have the right to
meet with external auditors to discuss their report without the approval of the bank? 2.Are auditors
required by law to communicate directly to the supervisory agency any presumed involvement of bank
directors or senior managers in elicit activities, fraud, or insider abuse? 3. Can supervisors take legal
action against external auditors for negligence? 4.Can the supervisory authority force a bank to change
its internal organizational structure? 5. Are off-balance sheet items disclosed to supervisors? 6. Can the
supervisory agency order the bank's directors or management to constitute provisions to cover actual or
potential losses? 7. Can the supervisory agency suspend the directors' decision to distribute: a)
Dividends? b) Bonuses? c) Management fees? 8. Can the supervisory agency legally declare-such that
this declaration supersedes the rights of bank shareholders-that a bank is insolvent? 9. Does the Banking
Law give authority to the supervisory agency to intervene that is, suspend some or all ownership rights-a
problem bank? 10.Regarding bank restructuring and reorganization, can the supervisory agency
Barth et al. (2006)
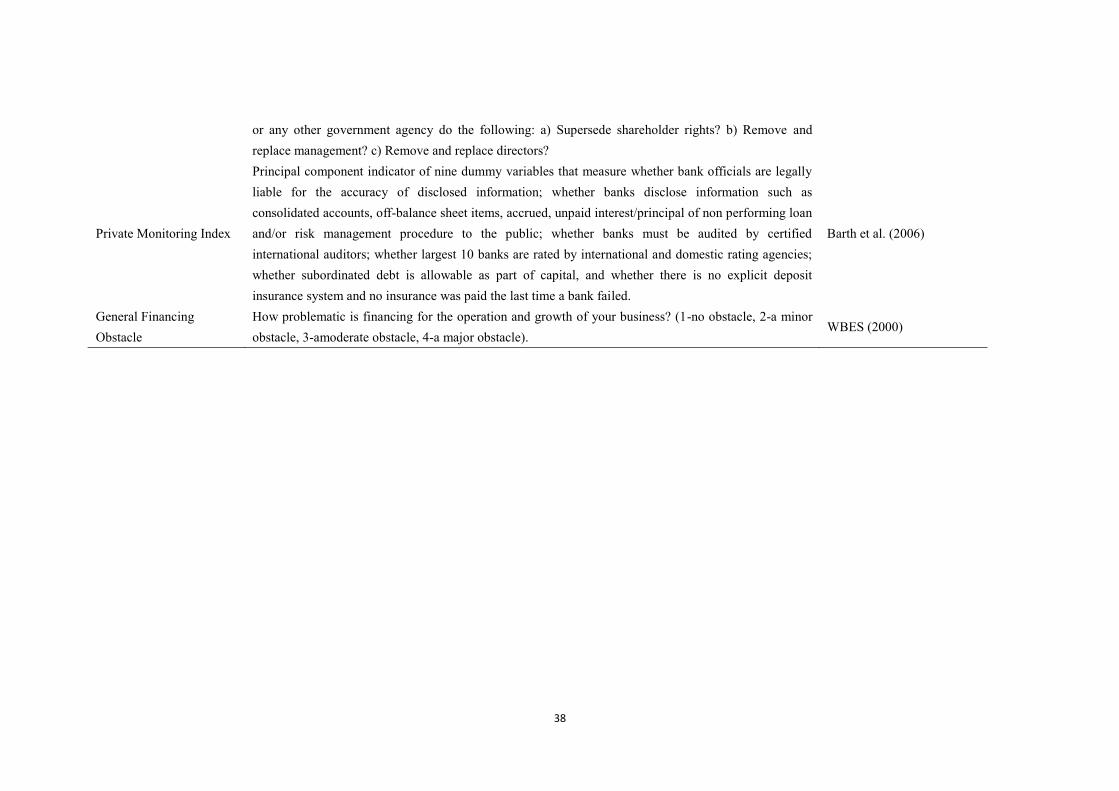
38
or any other government agency do the following: a) Supersede shareholder rights? b) Remove and
replace management? c) Remove and replace directors?
Private Monitoring Index
Principal component indicator of nine dummy variables that measure whether bank officials are legally
liable for the accuracy of disclosed information; whether banks disclose information such as
consolidated accounts, off-balance sheet items, accrued, unpaid interest/principal of non performing loan
and/or risk management procedure to the public; whether banks must be audited by certified
international auditors; whether largest 10 banks are rated by international and domestic rating agencies;
whether subordinated debt is allowable as part of capital, and whether there is no explicit deposit
insurance system and no insurance was paid the last time a bank failed.
Barth et al. (2006)
General Financing
Obstacle
How problematic is financing for the operation and growth of your business? (1-no obstacle, 2-a minor
obstacle, 3-amoderate obstacle, 4-a major obstacle). WBES (2000)

39
Table 2: Summary statistics
Variable Obs Mean Std. Dev Min Max
Firm level variables
Bank corruption 6900 1.75 1.05 1 4
Government 6900 0.11 0.31 0 1
Foreign 6900 0.17 0.38 0 1
Exporter 6900 0.35 0.48 0 1
Firm size 6900 9.94 7.79 0.11 25.33
SME 6900 0.81 0.39 0 1
Competitors 6900 2.33 0.73 0 9
General financing obstacle 6655 2.77 1.13 1 4
Fair court 6498 3.59 1.43 1 6
Law enforcement 6453 3.58 1.45 1 6
Country level variables
Press state ownership, by count 60 0.22 0.35 0 1
Press state ownership, by share 60 0.22 0.36 0 1
TV state ownership, by count 60 0.51 0.33 0 1
TV state ownership, by share 60 0.55 0.35 0 1
State owned radio 58 0.72 0.45 0 1
Top 5 Concentration, press 60 0.60 0.26 0.11 1
Top3 Concentration, press 60 0.49 0.27 0.08 1
Top 5 Concentration, TV 59 0.83 0.19 0.17 1
Top3 Concentration, TV 59 0.74 0.20 0.17 1
Control of Corruption 60 -0.02 0.98 -1.23 2.21
Government Effectiveness 60 0.14 0.90 -1.09 2.12
Political Stability 60 -0.07 0.79 -1.59 1.33
Quality and Regulation 60 0.18 0.85 -2.10 2.03
Rule of Law 60 0.00 0.89 -1.35 1.80
Voice and Accountability 60 0.01 0.86 -1.57 1.60
Internet bandwidth (bits per person) 74 28.14 80.70 0.01 495.41
Internet users (per 1,000 people) 75 49.48 86.27 0.13 413.89
Control of press freedom 75 44.64 19.98 10 81
Government bank ownership 75 23.68 25.12 0 98.1
HHI of banking sector 75 0.31 0.23 0.04 1
Information sharing 75 0.65 0.48 0 1
Official Supervisory Power 75 10.67 2.71 4 14
Private Monitoring 75 5.15 1.34 1 8
Inflation 75 0.12 0.19 -0.09 0.86
Log GDP per capita (USD) 75 7.52 1.40 4.78 10.43

40
Table 3 Panel A. Media ownership and bank corruption
1 2 3 4 5 6
Press state ownership, by count 0.152
[0.022]**
Press state ownership, by share
0.211
0.182
[0.006]***
[0.015]**
TV state ownership, by count
0.112
[0.037]**
TV state ownership, by share
0. 247
0.211
[0.016]**
[0.032]**
State owned radio
0.186 0.164
[0.011]** [0.027]**
Government bank ownership 0.003 0.004 0.003 0.004 0.005 0.004
[0.017]** [0.016]** [0.018]** [0.014]** [0.016]** [0.015]**
HHI of banking sector 0.687 0.693 0.663 0.654 0.643 0.684
[0.031]** [0.072]* [0.038]** [0.035]** [0.059]* [0.024]**
Info sharing -0.220 -0.230 -0.208 -0.171 -0.204 -0.214
[0.034]** [0.027]** [0.169] [0.064]* [0.037]** [0.039]**
Official Supervisory Power 0.140 0.138 0.137 0.124 0.121 0.115
[0.017]** [0.019]** [0.021]** [0.033]** [0.063]* [0.038]**
Private Monitoring -0.272 -0.264 -0.278 -0.281 -0.278 -0.241
[0.031]** [0.037]** [0.034]** [0.036]** [0.034]** [0.039]**
Government -0.301 -0.301 -0.305 -0.294 -0.343 -0.326
[0.037]** [0.184] [0.164] [0.027]** [0.048]** [0.041]**
Foreign -0.219 -0.219 -0.220 -0.219 -0.226 -0.221
[0.163] [0.029]** [0.156] [0.037]** [0.029]** [0.182]
Exporter -0.130 -0.124 -0.127 -0.114 -0.127 -0.125
[0.041]** [0.073]* [0.046]** [0.183] [0.161] [0.178]
Firm size -0.010 -0.010 -0.009 -0.009 -0.014 -0.009
[0.154] [0.037]** [0.071]* [0.043]** [0.152] [0.031]**
Competitors 0.014 0.015 0.018 0.024 0.024 0.027
[0.791] [0.779] [0.730] [0.640] [0.629] [0.591]
Other macro-controls yes yes yes yes yes yes
Industry dummies yes yes yes yes yes yes
Observations 5,331 5,331 5,331 5,331 5,282 5,225
Countries 59 59 59 59 59 58
Pseudo R2 0.051 0.052 0.051 0.052 0.054 0.055

41
Table 3 Panel B. Interactions of media ownership and government bank ownership
1 2 3 4
Press state ownership 0.127 0.148 0.152 0.141
[0.018]** [0.007]*** [0.014]** [0.016]**
TV state ownership 0.228 0.294 0.319 0.429
[0.036]** [0.027]** [0.018]** [0.024]**
State owned radio 0.114 0.110 0.164 0.175
[0.023]** [0.026]** [0.037]** [0.038]**
Government bank ownership 0.005 0.004 0.003 0.003
[0.019]** [0.028]** [0.026]** [0.025]**
Press state ownership x Government bank ownership 0.003
0.003
[0.029]**
[0.032]**
TV state ownership x Government bank ownership
0.003
0.002
[0.012]**
[0.018]**
State owned radio x Government bank ownership
0.002 0.002
[0.033]** [0.031]**
HHI of banking sector 0.704 0.696 0.741 0.803
[0.021]** [0.073]* [0.021]** [0.016]**
Info sharing -0.229 -0.213 -0.225 -0.262
[0.019]** [0.014]** [0.134] [0.081]*
Official Supervisory Power 0.110 0.117 0.129 0.121
[0.078]* [0.042]** [0.029]** [0.046]**
Private Monitoring -0.249 -0.198 -0.158 -0.135
[0.037]** [0.032]** [0.131] [0.036]**
Government -0.328 -0.330 -0.334 -0.329
[0.066]* [0.191] [0.029]** [0.274]
Foreign -0.222 -0.219 -0.224 -0.225
[0.183] [0.036]** [0.068]* [0.139]
Exporter -0.127 -0.123 -0.126 -0.129
[0.064]* [0.019]** [0.215] [0.247]
Firm size -0.009 -0.009 -0.007 -0.006
[0.031]** [0.170] [0.196] [0.034]**
Competitors 0.023 0.030 0.035 0.030
[0.651] [0.547] [0.497] [0.559]
Other macro-controls yes yes yes yes
Industry dummies yes yes yes yes
Observations 5,225 5,225 5,225 5,225
Countries 58 58 58 58
Pseudo R2 0.055 0.055 0.056 0.057
Note: The dependent variable is bank corruption, which is the response to the question ―Is the corruption of
bank officials as an obstacle for the operation and growth of your business (1-no obstacle, 2- minor obstacle, 3-
a moderate obstacle, 4-major obstacle)‖. Press and TV state ownerships are by market share. State owned radio
is a dummy equals to one if the top radio station is state owned, and zero otherwise. Detailed variable definitions
and sources are given in the Table 1. Other macro controls (GDP per capita and inflation) and industry dummies
are also included but not presented. The regressions are run with ordered probit, which is based on standard
maximum likelihood estimation with heteroskedasticity-robust standard errors. Furthermore, we allow for
clustering within countries to allow for possible correlation of errors in models. P-values based on robust
standard errors are in parentheses. ***, **, * indicate significance at the 1%, 5% and 10% levels, respectively.

42
Table 4. Media ownership, media competition, and bank corruption
1 2 3 4 5 6
Press top 5 Concentration 0.223
0.219
[0.021]**
[0.037]**
TV top 5 Concentration
0.338 0.307
[0.007]*** [0.012]**
Press top 3 Concentration
0.251
0.224
[0.024]**
[0.026]**
TV top 3 Concentration
0.461 0.413
[0.012]** [0.023]**
Press state ownership, by share 0.123 0.089 0.085 0.102 0.134 0.128
[0.024]** [0.017]** [0.029]** [0.029]** [0.026]** [0.027]**
TV state ownership, by share 0.167 0.296 0.261 0.161 0.313 0.275
[0.028]** [0.017]** [0.015]** [0.034]** [0.008]*** [0.024]**
State owned radio 0.029 0.042 0.028 0.029 0.042 0.030
[0.017]** [0.016]** [0.037]** [0.018]** [0.019]** [0.032]**
Government bank ownership 0.003 0.002 0.002 0.003 0.002 0.002
[0.028]** [0.054]* [0.039]** [0.029]** [0.051]* [0.037]**
HHI of banking sector 0.790 0.606 0.698 0.776 0.635 0.705
[0.011]** [0.071]* [0.032]** [0.016]** [0.181] [0.028]**
Info sharing -0.212 -0.221 -0.220 -0.203 -0.225 -0.218
[0.040]** [0.161] [0.091]* [0.047]** [0.054]* [0.036]**
Official Supervisory Power 0.129 0.094 0.106 0.131 0.090 0.103
[0.035]** [0.115] [0.074]* [0.033]** [0.032]** [0.032]**
Private Monitoring -0.212 -0.218 -0.214 -0.226 -0.216 -0.215
[0.028]** [0.041]** [0.031]** [0.031]** [0.153] [0.029]**
Government -0.327 -0.337 -0.333 -0.329 -0.336 -0.334
[0.162] [0.008]*** [0.261] [0.053]* [0.095]* [0.091]*
Foreign -0.216 -0.226 -0.220 -0.217 -0.226 -0.222
[0.056]* [0.011]** [0.183] [0.026]** [0.179] [0.078]*
Exporter -0.116 -0.121 -0.115 -0.117 -0.124 -0.120
[0.083]* [0.136] [0.173] [0.195] [0.024]** [0.038]**
Firm size -0.009 -0.011 -0.011 -0.009 -0.010 -0.010
[0.035]** [0.116] [0.037]** [0.127] [0.128] [0.196]
Competitors 0.029 0.032 0.031 0.030 0.036 0.036
[0.554] [0.530] [0.537] [0.544] [0.475] [0.475]
Other macro-controls yes yes yes yes yes yes
Industry dummies yes yes yes yes yes yes
Observations 5,225 5,132 5,132 5,225 5,132 5,132
Countries 58 57 57 58 57 57
Pseudo R2 0.052 0.053 0.059 0.054 0.057 0.058
Note: The dependent variable is bank corruption, which is the response to the question ―Is the corruption of
bank officials as an obstacle for the operation and growth of your business (1-no obstacle, 2- minor obstacle, 3-
a moderate obstacle, 4-major obstacle)‖. Press and TV state ownerships are by market share. State owned radio
is a dummy equals to one if the top radio station is state owned, and zero otherwise. Detailed variable definitions
and sources are given in the Table 1. Other macro controls (GDP per capita and inflation) and industry dummies
are also included but not presented. The regressions are run with ordered probit, which is based on standard
maximum likelihood estimation with heteroskedasticity-robust standard errors. Furthermore, we allow for
clustering within countries to allow for possible correlation of errors in models. P-values based on robust
standard errors are in parentheses. ***, **, * indicate significance at the 1%, 5% and 10% levels, respectively.

43
Table 5. Magnitude of the Effects: Media ownership, media competition, and bank corruption
1 2 3 4
Press state ownership, by share Change from minimum to maximum -0.174 0.043 0.058 0.073
1 standard dev. increase -0.071 0.013 0.020 0.038
Press top 3 concentration Change from minimum to maximum -0.151 0.032 0.046 0.074
1 standard dev. increase -0.063 0.013 0.018 0.032
TV state ownership, by share Change from minimum to maximum -0.236 0.049 0.078 0.109
1 standard dev. increase -0.083 0.017 0.026 0.039
TV top 3 concentration Change from minimum to maximum -0.184 0.029 0.040 0.116
1 standard dev. increase -0.070 0.014 0.022 0.034
State owned radio Change from 0 to 1 -0.073 0.015 0.026 0.032
Note: The results are estimated from Model 6 in Table 4.

44
Table 6. Interactions of media ownership and media concentration
1 2 3 4 5
Press state ownership 0.150 0.187 0.216 0.193 0.161
[0.026]** [0.035]** [0.027]** [0.018]** [0.034]**
TV state ownership 0.205 0.218 0.313 0.330 0.334
[0.031]** [0.027]** [0.016]** [0.004]*** [0.003]***
State owned radio 0.117 0.118 0.123 0.104 0.102
[0.028]** [0.021]** [0.011]** [0.036]** [0.038]**
Press top 5 concentration 0.236
[0.027]**
Press state ownership x Press top 5 concentration 0.182
[0.019]**
Press top 3 concentration
0.216
0.204
[0.021]**
[0.025]**
Press state ownership x Press top 3 concentration
0.271
0.253
[0.016]**
[0.016]**
TV top 5 concentration
0.298
[0.016]**
TV state ownership x TV top 5 concentration
0.362
[0.028]**
TV top 3 concentration
0.443 0.427
[0.017]** [0.034]**
TV state ownership x TV top 3 concentration
0.411 0.405
[0.012]** [0.023]**
Government bank ownership 0.002 0.003 0.003 0.003 0.003
[0.019]** [0.012]** [0.026]** [0.025]** [0.020]**
HHI of banking sector 0.718 0.704 0.691 0.676 0.677
[0.019]** [0.020]** [0.117] [0.035]** [0.030]**
Info sharing -0.173 -0.170 -0.250 -0.238 -0.199
[0.067]* [0.034]** [0.038]** [0.032]** [0.071]*
Official Supervisory Power 0.124 0.123 0.087 0.080 0.084
[0.037]** [0.053]* [0.026]** [0.021]** [0.034]**
Private Monitoring -0.263 -0.283 -0.217 -0.217 -0.244
[0.004]*** [0.012]** [0.058]* [0.011]** [0.030]**
Government -0.330 -0.332 -0.333 -0.329 -0.327
[0.079]* [0.029]** [0.190] [0.042]** [0.031]**
Foreign -0.223 -0.223 -0.214 -0.211 -0.209
[0.074] [0.109] [0.039]** [0.123] [0.035]**
Exporter -0.115 -0.116 -0.127 -0.133 -0.133
[0.064]* [0.034]** [0.111] [0.062]* [0.095]*
Firm size -0.011 -0.012 -0.012 -0.012 -0.008
[0.029]** [0.030]** [0.112] [0.137] [0.038]**
Competitors 0.046 0.045 0.028 0.030 0.040
[0.374] [0.387] [0.569] [0.553] [0.437]
Other macro-controls yes yes yes yes yes
Industry dummies yes yes yes yes yes
Observations 5,225 5,225 5,132 5,132 5,132
Countries 58 58 57 57 57
Pseudo R2 0.058 0.057 0.061 0.062 0.063
45
Note: The dependent variable is bank corruption, which is the response to the question ―Is the corruption of
bank officials as an obstacle for the operation and growth of your business (1-no obstacle, 2- minor obstacle, 3-
a moderate obstacle, 4-major obstacle)‖. Press and TV state ownerships are by market share. State owned radio
is a dummy equals to one if the top radio station is state owned, and zero otherwise. Detailed variable definitions
and sources are given in the Table 1. Other macro controls (GDP per capita and inflation) and industry dummies
are also included but not presented. The regressions are run with ordered probit, which is based on standard
maximum likelihood estimation with heteroskedasticity-robust standard errors. Furthermore, we allow for
clustering within countries to allow for possible correlation of errors in models. P-values based on robust
standard errors are in parentheses. ***, **, * indicate significance at the 1%, 5% and 10% levels, respectively.

46
Table 7. Probit and Instrumental variables estimations
1 2 3 4 5 6
Probit Probit Probit IV Probit IV Probit IV Probit
Press state ownership, by share 0.152
0.383
[0.017]**
[0.016]**
Press top 3 concentration 0.151
0.381
[0.023]**
[0.004]***
TV state ownership, by share
0.229
0.572
[0.021]**
[0.003]***
TV top 3 concentration
0.308
0.692
[0.011]**
[0.017]**
State owned radio
0.138
0.379
[0.021]**
[0.008]***
Government bank ownership 0.004 0.004 0.006 0.004 0.005 0.005
[0.028]** [0.030]** [0.032]** [0.019]** [0.029]** [0.034]**
HHI of banking sector 0.729 0.634 0.714 0.794 0.580 0.363
[0.006]*** [0.028]** [0.018]** [0.011]** [0.043]** [0.027]**
Info sharing -0.217 -0.196 -0.225 -0.242 -0.367 -0.256
[0.028]** [0.067]* [0.029]** [0.040]** [0.018]** [0.027]**
Official Supervisory Power 0.176 0.135 0.138 0.187 0.123 0.084
[0.018]** [0.021]** [0.032]** [0.015]** [0.068]* [0.035]**
Private Monitoring -0.264 -0.283 -0.241 -0.225 -0.135 -0.312
[0.032]** [0.041]** [0.036]** [0.032]** [0.034]** [0.039]**
Government -0.340 -0.335 -0.362 -0.331 -0.352 -0.337
[0.086]* [0.142] [0.073]* [0.153] [0.044]** [0.083]*
Foreign -0.236 -0.245 -0.232 -0.232 -0.238 -0.273
[0.191] [0.068]* [0.031]** [0.005]*** [0.143] [0.062]*
Exporter -0.100 -0.097 -0.121 -0.090 -0.120 -0.086
[0.081]* [0.040]** [0.146] [0.096]* [0.047]** [0.162]
Firm size -0.008 -0.009 -0.006 -0.009 -0.014 0.015
[0.016]** [0.014]** [0.154] [0.013]** [0.017]** [0.027]**
Competitors 0.033 0.042 0.042 0.038 0.018 0.035
[0.523] [0.430] [0.311] [0.067]* [0.810] [0.116]
Other macro-controls yes yes yes yes yes yes
Industry dummies yes yes yes yes yes yes
Observations 5,331 5,238 5,132 5,331 5,238 5,132
Countries 59 58 57 59 58 57
1st-stage F-test (p-value)
0.000 0.000 0.000
P-value of Hansen's overidentification J test
0.208 0.213 0.271
Pseudo R2 0.081 0.084 0.088 0.083 0.084 0.096
Note: The dependent variable is bank corruption dummy, which is the response to the question, ―Is the corruption of bank officials as an obstacle for the operation and growth of your business?‖, where ―no obstacle‖ is equal to zero, and ―minor‖, ―moderate‖ and ―major‖ is equal to one. Press and TV state ownerships are by market share. State owned radio is a dummy equals to one if the top radio station is state owned, and zero otherwise. Detailed variable definitions and sources are given in the Table 1. Other macro controls (GDP per capita and inflation) and industry dummies are also included but not presented. Regressions in column (1) to (3) are via probit, while regressions in column (4) to (6) are run with IV probit. In column (4) to (6), we use the log of one plus proved oil reserves, ethnic fractionalization, absolute value of latitude, and the percentage of years in independence since 1776 as instrumental variables of media ownership and media concentrations. 1st-stage F-test is the test of excluded IV in the 1st-stage regression. Furthermore, we allow for clustering within countries to allow for possible correlation of errors in models. P-values based on robust standard errors are in parentheses. ***, **, * indicate significance at the 1%, 5% and 10% levels, respectively.

47
Table 8. Robustness tests: More institutional controls
1 2 3 4 5 6 7 8
Press state ownership, by share 0.218 0.139 0.213 0.109 0.103 0.107 0.195
[0.016]** [0.002]*** [0.019]** [0.045]** [0.021]** [0.033]** [0.037]**
Press top 3 concentration 0.115 0.151 0.136 0.219 0.171 0.206 0.213
[0.014]** [0.029]** [0.036]** [0.039]** [0.012]** [0.006]*** [0.011]**
TV state ownership, by share 0.168 0.112 0.150 0.234 0.286 0.220 0.247
[0.016]** [0.018]** [0.006]*** [0.030]** [0.033]** [0.011]** [0.029]**
TV top 3 concentration 0.326 0.258 0.337 0.400 0.485 0.344 0.347
[0.005]*** [0.017]** [0.029]** [0.031]** [0.019]** [0.022]** [0.024]**
State owned radio 0.103 0.109 0.104 0.098 0.072 0.102 0.104
[0.039]** [0.032]** [0.051]* [0.004]*** [0.018]** [0.022]** [0.054]*
Government bank ownership 0.002 0.002 0.002 0.001 0.002 0.002 0.003 0.003
[0.037]** [0.019]** [0.023]** [0.052]* [0.057]* [0.035]** [0.029]** [0.032]**
HHI of banking sector 0.691 0.721 0.863 0.781 0.805 0.715 0.805 0.701
[0.016]** [0.056]* [0.040]** [0.023]** [0.027]** [0.061]* [0.031]** [0.054]*
Info sharing -0.175 -0.124 -0.176 -0.195 -0.206 -0.210 -0.185 -0.164
[0.021]** [0.067]* [0.043]** [0.042]** [0.032]** [0.033]** [0.044]** [0.031]**
Official Supervisory Power 0.102 0.106 0.098 0.083 0.111 0.104 0.103 0.096
[0.027]** [0.015]** [0.061]* [0.082]* [0.014]** [0.014]** [0.033]** [0.025]**
Private Monitoring -0.210 -0.241 -0.176 -0.230 -0.191 -0.215 -0.214 -0.232
[0.032]** [0.023]** [0.058]* [0.034]** [0.038]** [0.049]** [0.055]* [0.033]**
Government -0.275 -0.350 -0.335 -0.336 -0.321 -0.336 -0.330 -0.324
[0.081]* [0.193] [0.032]** [0.163] [0.131] [0.048]** [0.156] [0.033]**
Foreign -0.155 -0.154 -0.222 -0.221 -0.217 -0.220 -0.221 -0.207
[0.076]* [0.083]* [0.165] [0.022]** [0.043]** [0.136] [0.099]* [0.162]
Exporter -0.138 -0.128 -0.107 -0.106 -0.123 -0.116 -0.108 -0.102
[0.064]* [0.053]* [0.024]** [0.160] [0.143] [0.037]** [0.069]* [0.044]**
Firm size -0.009 -0.013 -0.012 -0.008 -0.011 -0.010 -0.008 -0.014
[0.310] [0.161] [0.157] [0.041]** [0.031]** [0.086]* [0.190] [0.162]

48
Competitors 0.034 0.038 0.046 0.047 0.042 0.038 0.049 0.055
[0.469] [0.878] [0.357] [0.350] [0.405] [0.447] [0.328] [0.268]
Control of press freedom 0.304
[0.019]**
General financing obstacle 0.286
[0.003]***
Control of Corruption
-0.289
[0.007]***
Government Effectiveness
-0.311
[0.016]**
Political Stability
-0.153
[0.128]
Quality and Regulation
-0.062
[0.517]
Rule of Law
-0.201
[0.030]**
Voice and Accountability
-0.316
[0.022]**
Other macro-controls yes yes yes yes yes yes yes yes
Industry dummies yes yes yes yes yes yes yes yes
Observations 6,800 4,909 5,132 5,132 5,132 5,132 5,132 5,132
Countries 74 57 57 57 57 57 57 57
Pseudo R2 0.056 0.086 0.062 0.061 0.059 0.058 0.060 0.064
Note: The dependent variable is bank corruption, which is the response to the question ―Is the corruption of bank officials as an obstacle for the operation and growth of
your business (1-no obstacle, 2- minor obstacle, 3- a moderate obstacle, 4-major obstacle)‖. Press and TV state ownerships are by market share. State owned radio is a
dummy equals to one if the top radio station is state owned, and zero otherwise. Detailed variable definitions and sources are given in the Table 1. Other macro controls
(GDP per capita and inflation) and industry dummies are also included but not presented. The regressions are run with ordered probit, which is based on standard maximum
likelihood estimation with heteroskedasticity-robust standard errors. Furthermore, we allow for clustering within countries to allow for possible correlation of errors in
models. P-values based on robust standard errors are in parentheses. ***, **, * indicate significance at the 1%, 5% and 10% levels, respectively.

49
Table 9. Interactions of media with bank supervision
1 2 3 4 5
Press state ownership 0.126 0.171 0.105 0.131 0.176
[0.001]*** [0.027]** [0.020]** [0.007]** [0.015]**
Press top 3 concentration 0.131 0.289 0.303 0.234 0.211
[0.011]** [0.013]** [0.024]** [0.021]** [0.036]**
TV state ownership 0.358 0.348 0.283 0.230 0.281
[0.019]** [0.017]** [0.023]** [0.022]** [0.021]**
TV top 3 concentration 0.250 0.441 0.398 0.468 0.431
[0.026]** [0.033]** [0.026]** [0.015]** [0.034]**
State owned radio 0.127 0.159 0.123 0.117 0.159
[0.041]** [0.023]** [0.015]** [0.028]** [0.014]**
Official Supervisory Power 0.136 0.081 0.098 0.144 0.113
[0.017]** [0.014]** [0.030]** [0.027]** [0.012]**
Private Monitoring -0.375 -0.290 -0.316 -0.330 -0.276
[0.016]** [0.027]** [0.036]** [0.011]** [0.014]**
Press state ownership x official supervisory power 0.058
[0.015]**
Press state ownership x private monitoring 0.040
[0.012]**
Press top 3 concentration x official supervisory power
0.057
[0.086]*
Press top 3 concentration x private monitoring
0.218
[0.023]**
TV state ownership x official supervisory power
0.056
[0.031]**
TV state ownership x private monitoring
0.049
[0.026]**
TV top 3 concentration x official supervisory power
0.072
[0.034]**
TV top 3 concentration x private monitoring
0.146
[0.003]***
State owned radio x official supervisory power
0.082
[0.115]
State owned radio x private monitoring
0.026
[0.023]**
Government bank ownership 0.004 0.003 0.003 0.002 0.002
[0.022]** [0.024]** [0.023]** [0.025]** [0.018]**
HHI of banking sector 0.758 0.816 0.665 0.765 0.721
[0.014]** [0.012]** [0.039]** [0.020]** [0.025]**
Info sharing -0.326 -0.227 -0.183 -0.310 -0.210
[0.024]** [0.029]** [0.004]*** [0.046]** [0.045]**
Government -0.325 -0.323 -0.323 -0.325 -0.332
[0.183] [0.146] [0.097]* [0.019]** [0.076]*
Foreign -0.239 -0.235 -0.214 -0.208 -0.220
[0.164] [0.017]** [0.154] [0.196] [0.049]**
Exporter -0.143 -0.123 -0.129 -0.122 -0.125
[0.047]** [0.046]** [0.098]* [0.017]** [0.159]

50
Firm size -0.011 -0.007 -0.007 -0.014 -0.009
[0.042]** [0.153] [0.132] [0.173] [0.110]
Competitors 0.028 0.040 0.046 0.029 0.039
[0.574] [0.416] [0.346] [0.554] [0.445]
Other macro-controls yes yes yes yes yes
Industry dummies yes yes yes yes yes
Observations 5,132 5,132 5,132 5,132 5,132
Countries 57 57 57 57 57
Pseudo R2 0.063 0.061 0.063 0.061 0.058
Note: The dependent variable is bank corruption, which is the response to the question ―Is the corruption of
bank officials as an obstacle for the operation and growth of your business (1-no obstacle, 2- minor obstacle, 3-
a moderate obstacle, 4-major obstacle)‖. Press and TV state ownerships are by market share. State owned radio
is a dummy equals to one if the top radio station is state owned, and zero otherwise. Detailed variable definitions
and sources are given in the Table 1. Other macro controls (GDP per capita and inflation) and industry dummies
are also included but not presented. The regressions are run with ordered probit, which is based on standard
maximum likelihood estimation with heteroskedasticity-robust standard errors. Furthermore, we allow for
clustering within countries to allow for possible correlation of errors in models. P-values based on robust
standard errors are in parentheses. ***, **, * indicate significance at the 1%, 5% and 10% levels, respectively.

51
Table 10. Interactions of media with private-owned firms
1 2 3 4 5
Press state ownership 0.197 0.170 0.177 0.178 0.177
[0.012]** [0.014]** [0.021]** [0.020]** [0.028]**
TV state ownership 0.278 0.279 0.332 0.278 0.279
[0.015]** [0.011]** [0.023]** [0.025]** [0.015]**
State owned radio 0.122 0.121 0.123 0.123 0.145
[0.025]** [0.067]* [0.016]** [0.012]** [0.028]**
Press top 3 concentration 0.185 0.286 0.184 0.186 0.186
[0.031]** [0.032]** [0.024]** [0.019]** [0.017]**
TV top 3 concentration 0.462 0.467 0.462 0.434 0.462
[0.031]** [0.029]** [0.023]** [0.030]** [0.037]**
Private firm 0.291 0.198 0.260 0.267 0.275
[0.027]** [0.039]** [0.025]** [0.034]** [0.022]**
Press state ownership x Private firm 0.117
[0.021]**
Press top 3 concentration x Private firm
0.263
[0.008]***
TV state ownership x Private firm
0.172
[0.026]**
TV top 3 concentration x Private firm
0.139
[0.032]**
State owned radio x Private firm
0.130
[0.018]**
Government bank ownership 0.002 0.001 0.002 0.002 0.002
[0.031]** [0.012]** [0.026]** [0.030]** [0.071]*
HHI of banking sector 0.697 0.685 0.697 0.698 0.699
[0.015]** [0.032]** [0.012]** [0.041]** [0.057]*
Info sharing -0.217 -0.220 -0.217 -0.216 -0.217
[0.036]** [0.058]* [0.015]** [0.019]** [0.028]**
Official Supervisory Power 0.101 0.104 0.102 0.103 0.102
[0.022]** [0.017]** [0.053]* [0.041]** [0.012]**
Private Monitoring -0.388 -0.421 -0.389 -0.386 -0.388
[0.023]** [0.026]** [0.027]** [0.031]** [0.026]**
Exporter -0.113 -0.118 -0.114 -0.116 -0.114
[0.028]** [0.062]* [0.153] [0.127] [0.043]**
Firm size -0.012 -0.011 -0.010 -0.013 -0.012
[0.136] [0.032]** [0.158] [0.047]** [0.132]
Competitors 0.038 0.039 0.041 0.039 0.044
[0.437] [0.428] [0.435] [0.435] [0.435]
Other macro-controls yes yes yes yes yes
Industry dummies yes yes yes yes yes
Observations 5,132 5,132 5,132 5,132 5,132
Countries 57 57 57 57 57
Pseudo R2 0.058 0.059 0.056 0.057 0.058
Note: The dependent variable is bank corruption, which is the response to the question ―Is the corruption of
bank officials as an obstacle for the operation and growth of your business (1-no obstacle, 2- minor obstacle, 3-
a moderate obstacle, 4-major obstacle)‖. Press and TV state ownerships are by market share. State owned radio
is a dummy equals to one if the top radio station is state owned, and zero otherwise. Detailed variable definitions
and sources are given in the Table 1. The regressions are run with ordered probit, which is based on standard
maximum likelihood estimation with heteroskedasticity-robust standard errors. Furthermore, we allow for
clustering within countries to allow for possible correlation of errors in models. P-values based on robust
standard errors are in parentheses. ***, **, * indicate significance at the 1%, 5% and 10% levels, respectively.
![Ownership, Concentration, Convergence: Google [2010-11]](https://static.fdocuments.net/doc/165x107/559a5fac1a28abc41d8b4751/ownership-concentration-convergence-google-2010-11.jpg)