Media optimization, scale-up and repeated fed-batch ...
88
Scholars' Mine Scholars' Mine Masters Theses Student Theses and Dissertations Summer 2017 Media optimization, scale-up and repeated fed-batch operations Media optimization, scale-up and repeated fed-batch operations for the production of 1,3-propanediol from glycerol by for the production of 1,3-propanediol from glycerol by halanaerobium hydrogeniformans halanaerobium hydrogeniformans Shivani Kalia Follow this and additional works at: https://scholarsmine.mst.edu/masters_theses Part of the Biology Commons, and the Environmental Microbiology and Microbial Ecology Commons Department: Department: Recommended Citation Recommended Citation Kalia, Shivani, "Media optimization, scale-up and repeated fed-batch operations for the production of 1,3-propanediol from glycerol by halanaerobium hydrogeniformans" (2017). Masters Theses. 7677. https://scholarsmine.mst.edu/masters_theses/7677 This thesis is brought to you by Scholars' Mine, a service of the Missouri S&T Library and Learning Resources. This work is protected by U. S. Copyright Law. Unauthorized use including reproduction for redistribution requires the permission of the copyright holder. For more information, please contact [email protected].
Transcript of Media optimization, scale-up and repeated fed-batch ...
Scholars' Mine Scholars' Mine
Masters Theses Student Theses and Dissertations
Summer 2017
Media optimization, scale-up and repeated fed-batch operations Media optimization, scale-up and repeated fed-batch operations
for the production of 1,3-propanediol from glycerol by for the production of 1,3-propanediol from glycerol by
halanaerobium hydrogeniformans halanaerobium hydrogeniformans
Shivani Kalia
Follow this and additional works at: https://scholarsmine.mst.edu/masters_theses
Part of the Biology Commons, and the Environmental Microbiology and Microbial Ecology Commons
Department: Department:
Recommended Citation Recommended Citation Kalia, Shivani, "Media optimization, scale-up and repeated fed-batch operations for the production of 1,3-propanediol from glycerol by halanaerobium hydrogeniformans" (2017). Masters Theses. 7677. https://scholarsmine.mst.edu/masters_theses/7677
This thesis is brought to you by Scholars' Mine, a service of the Missouri S&T Library and Learning Resources. This work is protected by U. S. Copyright Law. Unauthorized use including reproduction for redistribution requires the permission of the copyright holder. For more information, please contact [email protected].
Media Optimization, Scale-up and Repeated Fed-Batch Operations for
the Production of 1,3-Propanediol From Glycerol by
Halanaerobium hydrogeniformans
by
SHIVANI KALIA
A THESIS
Presented to the Faculty of the Graduate School of the
MISSOURI UNIVERSITY OF SCIENCE AND TECHNOLOGY
In Partial Fulfillment of the Requirements for the Degree
MASTER OF SCIENCE
in
APPLIED AND ENVIRONMENTAL BIOLOGY
2017
Approved by
Dr. Melanie R. Mormile, Advisor
Dr. Oliver C. Sitton
Dr. Katie B. Shannon

2017
Shivani Kalia
All Rights Reserved

iii
PUBLICATION THESIS OPTION
This thesis is prepared in the style of three journals. The first paper has been
submitted to Life- an open access journal and published. The second paper has been
prepared for submission to the Journal of Biotechnology. The third paper has also been
prepared for the submission to the Journal of Biotechnology. The Introduction in Section
1 and the Conclusion have been added for the purposes normal to thesis writing.

iv
ABSTRACT
The development of renewable energy sources, such as biofuels, is of great
interest in today’s world due to depletion of fossil fuels and concerns about climate
change. The production of the main by-product, crude glycerol, in biodiesel production
presents an opportunity for the production of industrially relevant commodities. Crude
glycerol in biodiesel waste is highly impure and possesses high salt concentrations and
alkalinity, making it infeasible for direct industrial utilization. Moreover, current glycerol
purification methods are highly cost-intensive, necessitating a search for cost-effective
approaches that are feasible to employ. Genome data analysis of Halanaerobium
hydrogeniformans, revealed the metabolic capability of this bacterium to convert glycerol
into 1,3-propanediol (PDO), a relevant industrial commodity. To develop an optimum
growth medium for this glycerol conversion, assays with different combinations of
twenty-four media components were performed. Data analysis using HPLC demonstrated
enhanced production of 1,3-propanediol with specific additions of glycerol, pH, vitamin
B12, ammonium-ions, sodium sulfide, cysteine, iron and cobalt. Reactor studies were
also performed to monitor the production of PDO, as a function of scale up in reactor
volume. In addition, the impact of different glycerol concentrations and retained fraction
volumes on PDO productivity was determined through repeated fed-batch reactions. Fed-
batch operation provided a 39.2 percent increase in PDO concentration and a 61.7 percent
increase in the productivity in comparison to the batch operation. Ongoing enzyme
kinetics studies are being performed in order to better understand the PDO production
pathway. This information will be helpful in modelling the dynamics of culture to
maximize the yield and productivity of PDO production.

v
ACKNOWLEDGMENTS
I would thank my advisor Dr. Melanie R. Mormile as I consider myself very
fortunate to have a mentor like her. Thank you for being so supportive and motivational. I
would always aspire to be as hard-working, inspirational and professional like you are. I
also thank Dr. Oliver. C. Sitton for helping me with the bio-reactor studies, French press
and data analysis. You have been very humble and helpful. I also thank Dr. Katie B.
Shannon for helping me in troubleshooting the primer sequences. I also thank Dr. David
J. Westenberg for very valuable research discussions. Thank you, Jennifer Parks, for
always being very supportive. Thank you, Jordan Trager for your contributions. Thank
you, Michael Sadler for helping me with the anaerobic work. I also thank my fellow
graduate students in Biological Sciences and Mormile lab members, I had wonderful time
because of you guys.
Finally, I thank my parents for their unconditional support. You have always
believed in me and encouraged me to pursue research. My husband, Sachin, thank you
for being supportive and helping me with the writings and the presentations.

vi
TABLE OF CONTENTS
Page
PUBLICATION THESIS OPTION ................................................................................... iii
ABSTRACT ....................................................................................................................... iv
ACKNOWLEDGMENTS .................................................................................................. v
LIST OF ILLUSTRATIONS ............................................................................................. ix
LIST OF TABLES .............................................................................................................. x
SECTION
1. INTRODUCTION ...................................................................................................... 1
1.1. BIOENERGY ..................................................................................................... 1
1.2. HALOALKALIPHILE ....................................................................................... 1
1.3. OBJECTIVES AND GOALS ............................................................................. 3
1.3.1. Media Optimization for 1,3-propanediol Production ............................... 3
1.3.2. Scale up Reactor Studies .......................................................................... 3
1.3.3. Fed-Batch Reactor Studies to Maximize the Productivity ....................... 3
1.3.4. Ongoing Enzyme Kinetics Study ............................................................. 4
PAPER
I. THE USE OF A FRACTIONAL FACTORIAL DESIGN TO DETERMINE THE
FACTORS THAT IMPACT 1,3-PROPANEDIOL PRODUCTION FROM GLYCEROL
BY HALANAEROBIUM HYDROGENIFORMANS ........................................................... 5
ABSTRACT ............................................................................................................... 5
1. INTRODUCTION ................................................................................................. 6
2. MATERIALS AND METHODS ........................................................................... 8
2.1. Growth media preparation ........................................................................... 8
2.2. Eperimental design ...................................................................................... 9
2.3. Statistical design of experiments ............................................................... 10
2.4. Optimization tests procedures ................................................................... 12
3. RESULTS ............................................................................................................ 13
3.1. Screening tests and HPLC ......................................................................... 13
3.2. Effect tests ................................................................................................. 13
4. DISCUSSION ...................................................................................................... 16

vii
5. CONCLUSIONS.................................................................................................. 17
Acknowledgements .................................................................................................. 18
REFERENCES ........................................................................................................ 19
II. 1,3-PROPANEDIOL PRODUCTION FROM GLYCEROL BY HALANAEROBIUM
HYDROGENIFORMANS IN SCALE UP REACTOR AND REPEATED FED BATCH
OPERATION .................................................................................................................... 21
ABSTRACT ............................................................................................................. 21
1. INTRODUCTION ............................................................................................... 21
2. MATERIALS AND METHODS ......................................................................... 23
2.1. Microorganism used for study ................................................................... 23
2.2. Growth medium ......................................................................................... 24
2.3. Fermentation medium ................................................................................ 24
2.4. Fermentation experiments ......................................................................... 25
2.5. Component analysis .................................................................................. 26
3. RESULTS ........................................................................................................... 26
3.1. Batch fermentation .................................................................................... 26
3.2. Fed-batch fermentation .............................................................................. 30
4. DISCUSSION ..................................................................................................... 40
5. REFERENCES .................................................................................................... 43
SUPPLEMENTARY MATERIAL .......................................................................... 48
III. ENZYME KINETICS ................................................................................................. 55
1. INTRODUCTION .................................................................................................... 55
2. METHODOLOGY ................................................................................................... 56
2.1. Enzyme assays on purified enzyme obtained through His-tagging .................. 56
2.1.1. Molecular cloning of expression constructs ........................................... 56
2.1.2. Protein expression .................................................................................. 62
2.1.3. Enzyme assays ........................................................................................ 64
2.2. Enzyme assays on cell free extract ................................................................... 65
3. RESULTS ................................................................................................................. 65
3.1. Enzyme assays on purified enzyme obtained through His-tagging .................. 65
3.2. Enzyme assays on cell free extract ................................................................... 69
REFERENCES ........................................................................................................ 70

viii
SECTION
2. CONCLUSIONS ...................................................................................................... 72
BIBLIOGRAPHY ............................................................................................................. 75
VITA ................................................................................................................................ 77

ix
LIST OF ILLUSTRATIONS
Figure Page
SECTION
1.1. Glycerol fermentation pathway................................................................................... 2
PAPER II
1. 2-liter batch reactor ....................................................................................................... 27
2. 20-liter batch reactor ..................................................................................................... 29
3. 2-liter RFB reaction at 0.5 retained volume fraction… ................................................ 31
4. 2-liter RFB reaction at 0.5 retained volume fraction and 1000 mM Glycerol in feed...33
5. 2-liter RFB reaction at 0.6 retained volume fraction and 1000 mM Glycerol in feed...34
6. Effect of retained volume fraction on reactor performance … ..................................... 36
7. 2-liter RFB reaction at 0.8 retained volume fraction and 1500 mM Glyecrol in feed...37
8. 2-liter RFB reaction at 0.8 retained volume fraction and 2000 mM Glyecrol in feed...39
9. Effect of glycerol feed concentration on reactor performance… ................................. 39
PAPER III
1. pET29a (+) vector ......................................................................................................... 62
2. Modified image for protein expression induction ......................................................... 63
3. Agarose gel image for PCR ......................................................................................... 66
4. Agarose gel image for PCR performed on purifed plasmid ........................................ 67
5. SDS pattern of proteins in lysed cells .......................................................................... 68

x
LIST OF TABLES
Table Page
PAPER I
1. Factors for screening experiments .................................................................................. 9
2. Experimental block setup .............................................................................................. 11
3. Multiple linear regression analysis of PDO yield ......................................................... 14
PAPER II
1. Kinetic parameter values for PDO in 2 L and 20 L bioreactors ................................... 30
2. Effect of retained volume fraction on RFB reactor performance ................................. 35
3. Effect of glycerol feed concentration on RFB reactor performance ............................ 40
PAPER III
1. Primer sequences .......................................................................................................... 57
2. Modified primer sequences ........................................................................................... 59

SECTION
1. INTRODUCTION
1.1. BIOENERGY
The limited supply of non-renewable energy resources, such as coal, oil and
natural gas, have brought interest to the utilization of renewable energy resources such as
solar, biomass, wind and water [1]. Over the last decades,’ great attention has been
focused on the development of technologies to increase the efficiency of renewable
energy sources [2]. Common types of biofuels thus far developed are ethanol and
biodiesel. According to the US EPA, biodiesel and renewable energy market produced
2.8 billion gallons in the United States in 2016 [4]. However, biodiesel production
generates high amounts of glycerol (almost 10% (w/w)) as its waste product [5].
Although pure glycerol has various industrial purposes, glycerol obtained from biodiesel
is in crude form and possesses high pH (10), salt concentrations (3%) and impurities such
as methanol, minerals, NaOH, and esters [6,7]. Therefore, prior to its utilization,
purification and neutralization of crude glycerol are essential, leading to the increased
cost of biodiesel production. To reduce such costs, it is crucial to develop effective ways
for crude glycerol to be used. Various studies have been performed on the conversion of
glycerol to 1,3-propanediol (PDO) by using bacteria such as; Clostridium butyricum,
Citrobacter freundii and Klebsiella pneumoniae [8,9,10]. 1,3-propanediol (PDO) is used
to make the polymer, polytrimethylene terephthalate, used in the carpet and leather
industries [11]. Moreover, it is a chemical intermediate for the synthesis of lubricants,
cosmetics, perfumes, and laminates [12]. Nevertheless, neutralization of crude glycerol is
essential prior to its utilization by these non-extremophilic microorganisms in PDO
production.
1.2. HALOALKALIPHILE
This project entails working with a haloalkaliphilic bacterium, Halanaerobium
hydrogeniformans, isolated from Soap Lake in Washington state [13]. The genome
analysis of H. hydrogeniformans indicated that this bacterium possesses genes actively
involved in the conversion of glycerol to 1,3-propanediol. Optimum growth conditions

2
for this bacterium are 30˚C, pH 11 and 7.5% salt concentration, with the ability to grow
at broad pH (7.5-12) and salt (2.5-15%) ranges [14]. This ability of the bacterium makes
it ideal for the conversion of crude glycerol into PDO, as it removes the need for
neutralization and can possibly make 1,3-propanediol production a cost-effective
approach.
Glycerol is used as a carbon and energy source for the growth of microorganisms.
Under anaerobic conditions, glycerol assimilation in the cell occurs via two pathways,
oxidative and reductive, as shown in Figure 1.1 [15]. Through the oxidative pathway,
glycerol is dehydrogenated by the enzyme glycerol dehydrogenase to dihydroxyacetone,
which is further converted to pyruvate and further into various end-products such as
acetate, ethanol, and lactic acid. In the reductive pathway, the conversion of glycerol to
PDO occurs in two steps. In the first step, a water molecule is removed from glycerol and
3- hydroxy-propionaldehyde (3-HPA) is formed. This reaction is catalyzed by a vitamin
B12 dependent enzyme, glycerol dehydratase. In the consecutive step, 3-HPA is reduced
to PDO by the enzyme 1,3-propanediol dehydrogenase that oxidizes NADH2 and
regenerates NAD+ needed by cell. In the cell, PDO is produced for the regeneration of
NAD+.
Figure1.1. Glycerol fermentation pathway modified from Zeng et al. [15]

3
In the initial studies on PDO production, media screening tests were designed and
performed to identify the media components that have significant impact on PDO
production. These tests showed that glycerol, ammonium ion, sodium sulfide, cysteine,
iron, and cobalt had significant impact on the productivity [16]. Under these optimized
media conditions, reactor studies were performed with this bacterium to determine the
PDO yield. Reactors were run under batch and fed-batch conditions. HPLC analysis
demonstrated the formation of PDO along with high amount of acetate, another
fermentation byproduct. In order to increase the amount of PDO but minimize the
concentration of by-products, it is essential to understand the kinetics of enzymes
involved in PDO production.
1.3. GOALS AND OBJECTIVES
1.3.1. Media Optimization for 1,3-propanediol Production. The primary
objective was to determine the factors that could have significant impact on the PDO
production from glycerol by H. hydrogeniformans. A fractional factorial design approach
was used to determine the effect of 24 factors, evaluated on the basis of standard media
composition. This approach revealed the enhanced production of PDO with the addition
of eight factors: glycerol, pH, ammonium ions, vitamin B12, sodium sulfide, cysteine, iron
and cobalt.
1.3.2. Scale up Reactor Studies. The objective was to measure the yield and
productivity of PDO as a function of scale up in the reactor volume from 2 liters to 20
liters under batch conditions. In both of the reactor runs, three products were routinely
found through HPLC analysis, PDO, acetate, and formate. As the reactor volume
increased from 2 L to 20 L, both PDO concentration and productivity decreased by 10%.
1.3.3. Fed-Batch Reactor Studies to Maximize Productivity. This study was
performed to identify the effect of high glycerol concentration as well as the impact of
retained volume fraction on the PDO production. PDO production and productivity at
five different retained volume fractions were measured. With increase in retained volume
fraction, increase in the PDO concentration and productivity was observed. Moreover, the
effect of five different glycerol feed concentrations on the PDO production was also

4
measured. Here too, increase in the glycerol concentration had resulted in the
enhancement of PDO concentration and productivity.
1.3.4. Ongoing Enzyme Kinetics Study. This study is aimed at the activity
analysis of the enzymes involved in PDO production by H. hydrogeniformans. Genes
coding for each of the enzyme will be extracted from the bacterium. The genome data
suggested that there is a total of six genes involved in the PDO production. The
amplification of each gene will be done by using specifically designed primers. The
amplified genes will be ligated into vectors and cloned into competent E. coli cells.
Resulting recombinant proteins or enzymes will be purified from the transformed
competent E. coli cells for activity analysis. Optimum conditions for the enzymes will
also be determined. This information will be helpful in modelling the dynamics of the
culture to maximize the yield and productivity of PDO production and for genetic
modification of industrially relevant microorganisms.

5
PAPER
I. THE USE OF A FRACTIONAL FACTORIAL DESIGN TO DETERMINE THE
FACTORS THAT IMPACT 1,3-PROPANEDIOL PRODUCTION FROM
GLYCEROL BY HALANAEROBIUM HYDROGENIFORMANS
Published in Life- an open access journal.
ABSTRACT
In recent years, biodiesel, a substitute for fossil fuels, has led to the excessive
production of crude glycerol. The resulting crude glycerol can possess a high
concentration of salts and an alkaline pH. Moreover, current crude glycerol purification
methods are expensive, rendering this former commodity a waste product. However,
Halanaerobium hydrogeniformans, a haloalkaliphilic bacterium, possesses the metabolic
capability to convert glycerol into 1,3-propanediol, a valuable commodity compound,
without the need for salt dilution or adjusting pH. Experiments were performed with
different combinations of twenty-four medium components to determine their impact on
the production of 1,3-propanediol by using a fractional factorial design. Tested medium
components were selected based on data from the organism’s genome. Analysis of
HPLC data revealed enhanced production of 1,3-propanediol with additional glycerol,
pH, vitamin B12, ammonium ions, sodium sulfide, cysteine, iron, and cobalt. However,
other selected components nitrate ions, phosphate ions, sulfate ions, sodium:potassium
ratio, chloride, calcium, magnesium, silicon, manganese, zinc, borate, nickel,
molybdenum, tungstate, copper and aluminum did not enhance 1,3-propanediol
production. The use of a fractional factorial design enabled the quick and efficient
assessment of the impact of twenty-four different medium components on 1,3-
propanediol production from glycerol from a haloalkaliphilic bacterium.
Keywords: glycerol, 1,3-propanediol, haloalkaliphilic bacteria, fractional factorial
design

6
1. INTRODUCTION
Humanity’s increasing consumption of energy requires the expenditure of
resources. However, primary resources i.e. fossil fuels are finite and limited. This
problem has drawn interest from the scientific community to develop effective methods
for generating renewable sources of energy. Biodiesel is one of these emerging
alternatives. However, a fundamental problem with biodiesel is that it leads to large
amount of waste products as almost 10% (w/w) glycerol is produced as the main
byproduct [1]. Pure glycerol has numerous applications in food, pharmaceutical, and
cosmetic industries. Moreover, it can be converted to various chemical intermediates
such as 1,3-propanediol (PDO), poly-hydroxyalkanoates, epichlorohydrin, acrylic acid,
polyhydroxybutyrate etc. [2]. On the other hand, glycerol obtained from biodiesel is in a
crude form and has many impurities. Hansen et al. [3] performed a study to determine
the composition of crude glycerol samples obtained from the different biodiesel plants.
They demonstrated that glycerol content in the samples ranged from 38% to 96%, with
some samples comprising up to 14% methanol and 29% ash. Besides, crude glycerol has
high pH (10) and salt concentration (3%). Therefore, purification and neutralization of
crude glycerol, prior to its industrial utilization, is essential and leads to increased costs of
biodiesel production [4].
Subsequently, effective ways for the utilization of crude glycerol need to be
developed to reduce the cost of biodiesel production, thus, enhance the growth of
biodiesel industries. One of such process is the conversion of crude glycerol to a
chemical commodity, 1,3-propanediol. 1,3-propanediol has various industry applications,
as it is used as a chemical intermediate for the synthesis of cosmetics, lubricants,
adhesives, perfumes and laminates [5]. It is also used to make polymer polytrimethylene
terephthalate, is used in carpet and textile industries [6]. Previous studies have revealed
the role of microorganisms such as Klebsiella pneumoniae [7] and Clostridium butyricum
[8] can have in the production of PDO. However, neutralization of the crude glycerol has
to be done before it can be metabolized by these organisms.

7
This study was performed with a haloalkaliphilc bacterium, Halanaerobium
hydrogeniformans, isolated from Soap Lake in Washington State [9]. H.
hydrogeniformans has the ability to convert crude glycerol into PDO. It should be noted
that optimum growth conditions for this bacterium are pH of 11, salt concentration of
7.5%, and a temperature of 30˚C [10]. Moreover, this bacterium is capable of growing at
a broader pH range (7.5-12) and salt range (2.5-15%) in comparison to other PDO-
producing bacterial species. This property of H. hydrogeniformans makes it ideal for the
conversion of crude glycerol into PDO. The use of this organism removes the need for
the neutralization of crude glycerol and salt dilution, possibly making PDO production a
cost-effective approach.
Genome data analysis of H. hydrogeniformans revealed that it possesses the genes
for PDO production. In general, glycerol to PDO production pathway entails two steps.
In the first step, a water molecule is removed from glycerol, forming 3-
hydroxypropionaldehyde, catalyzed by the enzyme glycerol dehydratase. In the
following step, enzyme 1,3-propanediol dehydrogenase, regenerates NAD+ needed by
cell through the oxidation of NADH2 and produces PDO. Glycerol dehydratase is a
vitamin B12 dependent enzyme. Moreover, H. hydrogeniformans possesses the vitamin
B12 synthesis pathway. However, earlier experiments performed with H.
hydrogeniformans, on glycerol fermentation, suggest that the production of PDO almost
doubles when its growth medium is supplemented with vitamin B12. Previous work
indicated that H. hydrogeniformans had a 60.3% conversion of glycerol in our standard
growth medium [11].
Therefore, primary objective of this study was to determine the components that
could have significant impact on the production of PDO from glycerol by H.
hydrogeniformans. Furthermore, potential sources of nitrogen and sulfur in the medium
were evaluated. On the basis of standard medium composition, a total 24 factors were
evaluated for their effect on PDO production. The experimental design for these factors
was generated by using a statistical approach, fractional factorial design. This study
8
suggests that eight factors: glycerol, vitamin B12, pH, ammonium ion, sodium sulfide,
cysteine, iron, and cobalt, have significant impact on the production of PDO.
2. MATERIALS AND METHODS
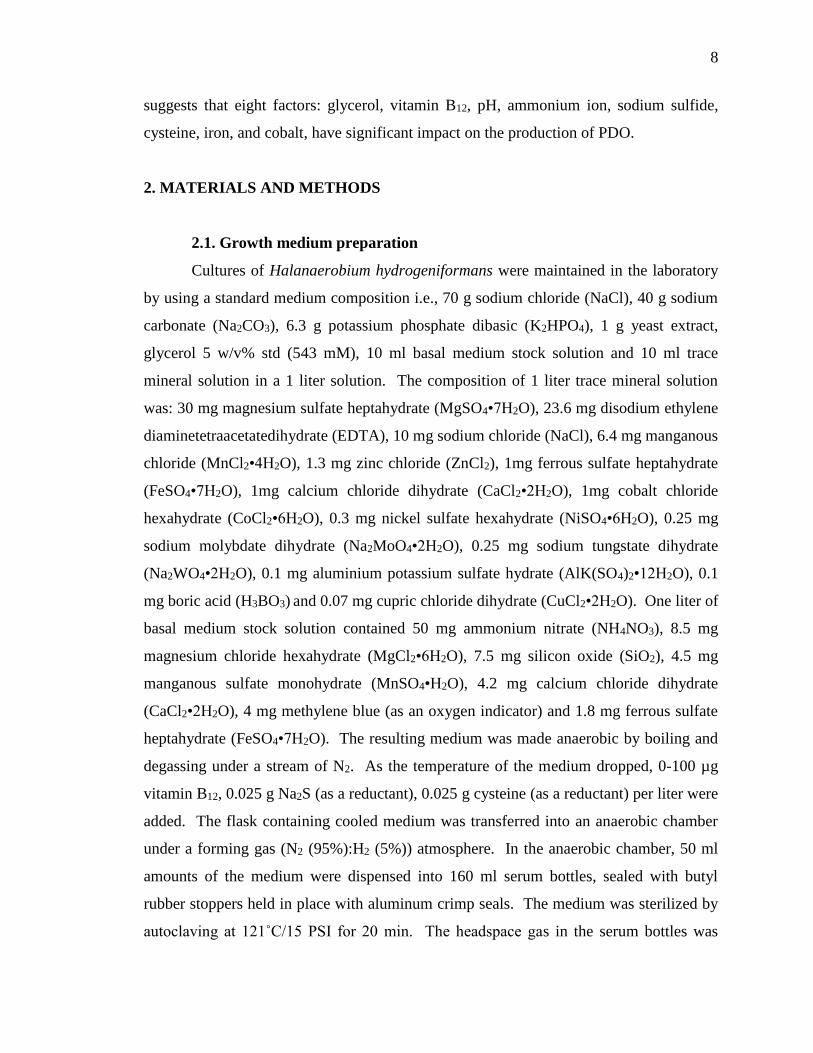
2.1. Growth medium preparation
Cultures of Halanaerobium hydrogeniformans were maintained in the laboratory
by using a standard medium composition i.e., 70 g sodium chloride (NaCl), 40 g sodium
carbonate (Na2CO3), 6.3 g potassium phosphate dibasic (K2HPO4), 1 g yeast extract,
glycerol 5 w/v% std (543 mM), 10 ml basal medium stock solution and 10 ml trace
mineral solution in a 1 liter solution. The composition of 1 liter trace mineral solution
was: 30 mg magnesium sulfate heptahydrate (MgSO4•7H2O), 23.6 mg disodium ethylene
diaminetetraacetatedihydrate (EDTA), 10 mg sodium chloride (NaCl), 6.4 mg manganous
chloride (MnCl2•4H2O), 1.3 mg zinc chloride (ZnCl2), 1mg ferrous sulfate heptahydrate
(FeSO4•7H2O), 1mg calcium chloride dihydrate (CaCl2•2H2O), 1mg cobalt chloride
hexahydrate (CoCl2•6H2O), 0.3 mg nickel sulfate hexahydrate (NiSO4•6H2O), 0.25 mg
sodium molybdate dihydrate (Na2MoO4•2H2O), 0.25 mg sodium tungstate dihydrate
(Na2WO4•2H2O), 0.1 mg aluminium potassium sulfate hydrate (AlK(SO4)2•12H2O), 0.1
mg boric acid (H3BO3) and 0.07 mg cupric chloride dihydrate (CuCl2•2H2O). One liter of
basal medium stock solution contained 50 mg ammonium nitrate (NH4NO3), 8.5 mg
magnesium chloride hexahydrate (MgCl2•6H2O), 7.5 mg silicon oxide (SiO2), 4.5 mg
manganous sulfate monohydrate (MnSO4•H2O), 4.2 mg calcium chloride dihydrate
(CaCl2•2H2O), 4 mg methylene blue (as an oxygen indicator) and 1.8 mg ferrous sulfate
heptahydrate (FeSO4•7H2O). The resulting medium was made anaerobic by boiling and
degassing under a stream of N2. As the temperature of the medium dropped, 0-100 µg
vitamin B12, 0.025 g Na2S (as a reductant), 0.025 g cysteine (as a reductant) per liter were
added. The flask containing cooled medium was transferred into an anaerobic chamber
under a forming gas (N2 (95%):H2 (5%)) atmosphere. In the anaerobic chamber, 50 ml
amounts of the medium were dispensed into 160 ml serum bottles, sealed with butyl
rubber stoppers held in place with aluminum crimp seals. The medium was sterilized by
autoclaving at 121˚C/15 PSI for 20 min. The headspace gas in the serum bottles was

9
exchanged aseptically with 100% nitrogen. The medium was inoculated with 10%
inoculum from previous stock cultures. Cultures were incubated at 30˚C in a shaking
incubator.
2.2. Experimental design
On the basis of standard medium composition, a total of 24 (23 + Na:K) factors
were considered to evaluate their impact on PDO production. Table 1 lists the
experimental variables or factors, each identified by using a capital letter. For screening
purposes, two levels of each factor, either high or low, were used to evaluate its
significance in PDO production, as shown in the Table 1.
Table 1: Factors for screening experiments.
Factor Name Variable Std Media Low Value
(-1)
High Value
(+1)
A GLYC Glycerol 542,947 µM 500,000
µM
2,000,000
µM
B B12 Vitamin B12 100 µg/L 0 µM,
0.0M
500 µg/L,
0.3689µM
C pH pH 10.85 9.0 10.85
D NH4 Ammonium ion 624 µM 0 µM 3,000 µM
E NO3 Nitrate ion 624 µM 0 µM 3,000 µM
F SO4 Sulfate ion 160 µM 160 µM 800 µM
G PO4 Phosphate ion 36,169 µM 40,000
µM
200,000
µM
H NaK Sodium:potassium
ratio
27 12.5 50.0
J NaS Sodium sulfide 104 µM 50 µM 200 µM
K Cys Cysteine 142 µM 75 µM 300 µM
L Cl Chloride 1,198,371 µM 600,000
µM
2,400,000
µM

10
M Ca Calcium 35 µM 0 µM 500 µM
N Mg Magnesium 164 µM 0 µM 1000 µM
O Si Silicon 125 µM 0 µM 500 µM
P Mn Manganese 59 µM 0 µM 500 µM
Q Zn Zinc 9.5 µM 0 µM 100 µM
R Fe Iron 10.0 µM 0 µM 100 µM
S Co Cobalt 4.2 µM 0 µM 100 µM
T BO3 Borate 1.6 µM 0 µM 10 µM
U Ni Nickel 1.1 µM 0 µM 10 µM
V MoO4 Molybdenum 1.0 µM 0 µM 10 µM
W WO4 Tungstate 0.8 µM 0 µM 10 µM
X Cu Copper 0.4 µM 0 µM 5 µM
Y Al Aluminum 0.2 µM 0 µM 2 µM
2.3. Statistical design of experiments
A screening experiment was designed to determine the effect of each factor and
all interactions among them by using a fractional factorial design approach. In this
design, there are 2k-p experiments where p defines the 1/2p fraction of the total number of
experiments. Therefore, for this study, a set of 32 experiments was designed to
determine the effect of each factor. This design does not consider the effect of interfactor
interactions on the PDO production. For H. hydrogeniformans, a significant interaction
among the factor is not expected, as the bacteria either requires a factor or not.
Therefore, a classical resolution III design, also labeled as24 192III
design, was used. The
interaction among factors was considered negligible.
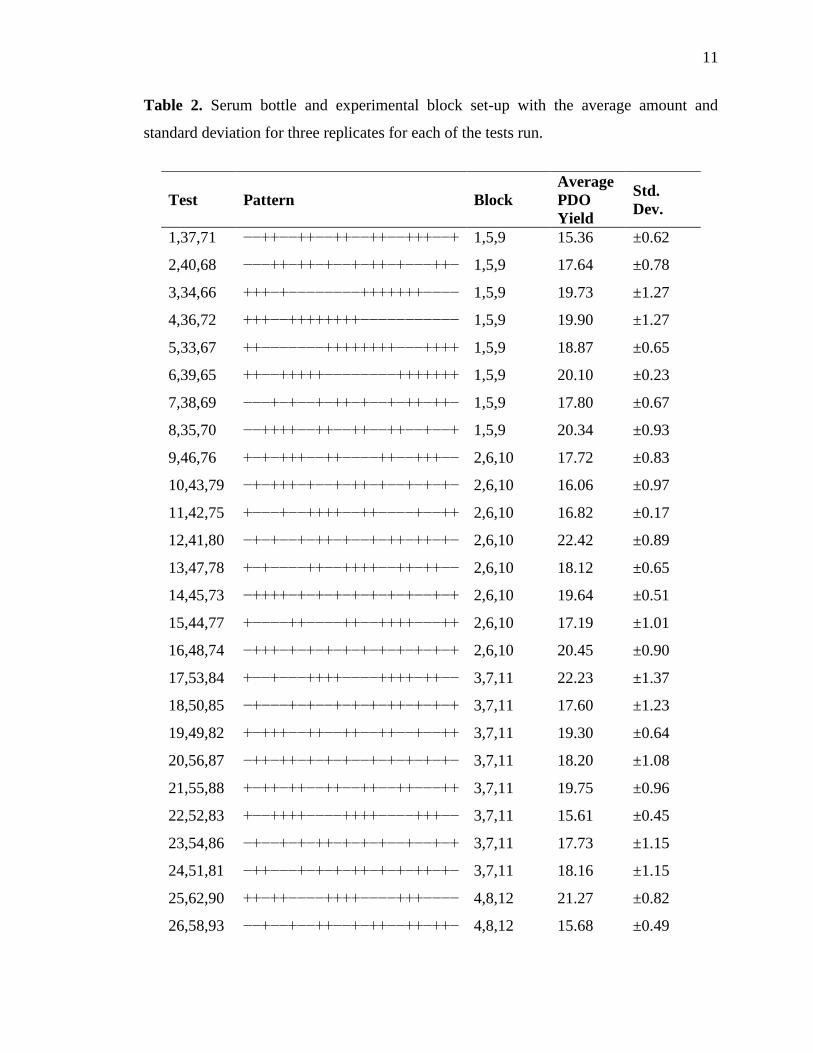
These 32 experiments were performed in triplicates and were divided into four
blocks. Therefore, each block included a total of 24 tests. Each of the 24 factors were
taken in two concentrations either high or low level. In the Table 2, the pattern value of -
represents the low level of a factor and + represents the high level of a factor for each of
the 24 factors.
11
Table 2. Serum bottle and experimental block set-up with the average amount and
standard deviation for three replicates for each of the tests run.
Test Pattern Block
Average
PDO
Yield
Std.
Dev.
1,37,71 −−++−−++−−++−−++−−+++−−+ 1,5,9 15.36 ±0.62
2,40,68 −−−++−++−+−−+−++−+−−−++− 1,5,9 17.64 ±0.78
3,34,66 +++−+−−−−−−−−+++++++−−−− 1,5,9 19.73 ±1.27
4,36,72 +++−−++++++++−−−−−−−−−−− 1,5,9 19.90 ±1.27
5,33,67 ++−−−−−−−++++++++−−−++++ 1,5,9 18.87 ±0.65
6,39,65 ++−−+++++−−−−−−−−+++++++ 1,5,9 20.10 ±0.23
7,38,69 −−−+−+−−+−++−+−−+−++−++− 1,5,9 17.80 ±0.67
8,35,70 −−++++−−++−−++−−++−−+−−+ 1,5,9 20.34 ±0.93
9,46,76 +−+−+++−−++−−−−++−−+++−− 2,6,10 17.72 ±0.83
10,43,79 −+−+++−+−−+−++−+−−+−+−+− 2,6,10 16.06 ±0.97
11,42,75 +−−−+−−++++−−++−−−−+−−++ 2,6,10 16.82 ±0.17
12,41,80 −+−+−−+−++−+−−+−++−++−+− 2,6,10 22.42 ±0.89
13,47,78 +−+−−−−++−−++++−−++−++−− 2,6,10 18.12 ±0.65
14,45,73 −++++−+−+−+−+−+−+−+−−+−+ 2,6,10 19.64 ±0.51
15,44,77 +−−−−++−−−−++−−++++−−−++ 2,6,10 17.19 ±1.01
16,48,74 −+++−+−+−+−+−+−+−+−+−+−+ 2,6,10 20.45 ±0.90
17,53,84 +−−+−−−++++−−−−++++−++−− 3,7,11 22.23 ±1.37
18,50,85 −+−−−+−+−−+−+−+−++−+−+−+ 3,7,11 17.60 ±1.23
19,49,82 +−+++−−++−−++−−++−−+−−++ 3,7,11 19.30 ±0.64
20,56,87 −++−++−+−+−+−−+−+−+−+−+− 3,7,11 18.20 ±1.08
21,55,88 +−++−++−−++−−++−−++−−−++ 3,7,11 19.75 ±0.96
22,52,83 +−−++++−−−−++++−−−−+++−− 3,7,11 15.61 ±0.45
23,54,86 −+−−+−+−++−+−+−+−−+−−+−+ 3,7,11 17.73 ±1.15
24,51,81 −++−−−+−+−+−++−+−+−++−+− 3,7,11 18.16 ±1.15
25,62,90 ++−++−−−−++++−−−−+++−−−− 4,8,12 21.27 ±0.82
26,58,93 −−+−−+−−++−−+−++−−++−++− 4,8,12 15.68 ±0.49

12
2.4. Optimization tests procedure
Test solutions were prepared to achieve the concentration of each tested
component as prescribed in Table 1. The pH of these solutions was adjusted by using
two different base stock solutions. One stock solution had a Na:K ratio of 12.5 and the
other had a Na:K ratio of 50 to match the Na:K ratios to be tested. Test medium was
made anaerobic by boiling and sparging with argon gas. Anaerobic medium was placed
into the anaerobic chamber and 50 ml aliquots of medium were transferred to 160 ml
serum bottle. In each serum bottle, cysteine and sodium sulfide solutions were added.
Serum bottles containing test medium were then sealed with butyl rubber stoppers held in
place with aluminum crimp seals and autoclaved. After cooling, the serum bottles were
inoculated with 1 ml of inoculum and placed onto a shaking incubator at 30˚C for three
days. After three days, serum bottles were removed and samples were analyzed for PDO
production by using HPLC.
For HPLC analysis, samples were filter sterilized using 0.45µM PTFE filters.
Filtered samples were injected onto an Aminex HPX-87H, 300x 7.8 mm column
(BioRad, Hercules, CA). The column’s temperature was maintained at 50˚C. Here, 2.5
mM H2SO4 was used as mobile phase and its flow rate was 0.6 ml/min at 2.2 MPa
pressure. For the sample analysis, two types of detectors; a UV 231 (at 210 nm) and
refractive index monitor were used.
27,59,91 ++++++++++++++++++++++++ 4,8,12 25.24 ±1.56
28,60,94 ++−+−++++−−−−++++−−−−−−− 4,8,12 20.77 ±1.14
29,64,95 −−−−−−++−+−−++−−+−+++−−+ 4,8,12 15.84 ±0.62
30,57,92 −−−−++−−+−++−−++−+−−+−−+ 4,8,12 16.74 ±0.45
31,61,96 ++++−−−−−−−−−−−−−−−−++++ 4,8,12 17.86 ±1.03
32,63,89 −−+−+−++−−++−+−−++−−−++− 4,8,12 16.52 ±0.38

13
3. RESULTS
The statistical experimental design resulted into 32 different screening tests, run
in blocks (Table 2). Each block contained 8 different test conditions. Experiments were
run in triplicates. For each screening test, the media were inoculated with H.
hydrogeniformans and incubated for 3 days. The production of PDO in each culture was
determined by HPLC analysis.
3.1. Screening tests and HPLC
The amount of PDO produced during each test is reported in Table 2. Yield was
calculated as the moles of PDO produced per the moles of the initial glycerol
concentration. Maximum PDO yield was observed when all the factors were added in
their high concentration. The lowest yield was observed when low levels of glycerol,
vitamin B12, nitrate, sulfate, sodium sulfide, cysteine, magnesium, silicon, iron, cobalt,
tungstate, and copper were provided. This indicates that these components are essential
during the production of PDO by H. hydrogeniformans.
3.2. Effect tests
Based on genome data analysis, it was predicted that ammonium ion, nitrate ion,
sulfate ion, Na:K ratio, zinc, iron, nickel, and tungstate might positively impact PDO
production. To confirm these predictions, an experimental design was generated. This
experimental design was created by using fractional factorial design approach, in which
the individual effect of each variable or factor was determined. HPLC data for the PDO
yield from the screening tests was fed into JMP Pro 12.1 software for multiple linear
regression analysis. This model generates data for the effect test, on the basis of PDO
yield obtained. This analysis works on the null hypothesis (P-value>0.05), that each
factor has no significance and the alternate hypothesis (P-value<0.05), where each factor
is significant. Here, results from the effect tests are presented in the Table 3 that lists all
the 24 factors and their respective P-value. The P-value for glycerol, vitamin B12, pH,
ammonium ion, sodium sulfide, cysteine, iron, and cobalt was less than 0.05 for each.
Therefore, the null hypothesis is rejected for each and the alternate hypothesis is

14
accepted, indicating that these factors have significant impact on the production of PDO
at the 95 % confidence level. In contrast, P-value for nitrate ion, sulfate ion, phosphate
ion, Na:K ratio, chloride, calcium, magnesium, silicon, manganese, zinc, borate, nickel,
molybdenum, tungstate, copper, and aluminum was more than 0.05. Therefore, the null
hypothesis is accepted and these factors did not have a significant impact on the
production of PDO at the 95 % confidence level.
Table 3. Multiple linear regression analysis of PDO yield by using JMP Pro 12.1
software for each assay run
Factor Number of
parameters
Degrees
of
Freedom
Sum of
Squares F Ratio Prob > F
GLYC 1 1 55.161176 67.9746 <.0001
B12 1 1 92.022084 113.3979 <.0001
pH 1 1 4.964051 6.1172 0.0164
NH4 1 1 67.318251 82.9556 <.0001
NO3 1 1 0.040426 0.0498 0.8242
SO4 1 1 0.259376 0.3196 0.5741
PO4 1 1 0.587501 0.724 0.3985
NAK 1 1 1.226276 1.5111 0.2241
NAS 1 1 60.055884 74.0063 <.0001
CYS 1 1 51.993984 64.0717 <.0001
CL 1 1 0.681751 0.8401 0.3633
CA 1 1 2.145026 2.6433 0.1096
MG 1 1 1.318359 1.6246 0.2077
SI 1 1 0.100751 0.1242 0.7259
MN 1 1 0.008626 0.0106 0.9183
ZN 1 1 0.106001 0.1306 0.7191
FE 1 1 46.078959 56.7826 <.0001
CO 1 1 86.165651 106.1811 <.0001

15
BO3 1 1 0.958001 1.1805 0.2819
NI 1 1 0.221376 0.2728 0.6035
MOO4 1 1 0.111384 0.1373 0.7124
WO4 1 1 0.090651 0.1117 0.7395
CU 1 1 0.197109 0.2429 0.624
AL 1 1 0.094376 0.1163 0.7344
Block 11 11 7.465253 0.8363 0.6052
GLYC*pH 1 1 0.469001 0.5779 0.4503
B12*pH 1 1 0.198926 0.2451 0.6225
pH*MOO4 1 1 0.098176 0.121 0.7293
NH4*MOO4 1 1 1.547876 1.9074 0.1727
There is another factor provided in Table 3, the Block factor. As previously
mentioned that screening tests were divided into 4 blocks and each block included 8
experiments. These experiments were performed separately. The block factor is used to
determine if any difference in results was due to performing these screening test on
different days. P-value for block factor is 0.6052 i.e., more than 0.05. Thus, the block
factor had no significant impact, indicating consistency in test measurements.
This experimental design was also able to identify the two factor interactions for
some of the main factors. This interaction test whether high or low value of a factor has
any impact on the other factor. This design works on the assumption that all the two
factor interactions are not important, which may or may not be true. Previous studies
have shown the significance of factors such as glycerol, vitamin B12 and pH on the
production of PDO form glycerol by H. hydrogeniformans. The interaction between
glycerol*pH, vitamin B12*pH, pH*MoO4 and NH4*MoO4 were identified. P-value for
the each of these interactions was more than 0.05, indicating that these interactions are
not significant.

16
4. DISCUSSION
Microbial mediated conversion of crude glycerol into PDO is an effective way to
utilize waste glycerol. Previous experiments performed in our lab have showed
significant production of PDO from glycerol by H. hydrogeniformans [11]. The primary
objective of this study was to determine the impact of 24 different factors on the
production of PDO. These factors were selected on the basis of standard medium
components for the growth of H. hydrogeniformans. From the genome information of
this bacterium, factors such as ammonium ion, nitrate ion, sulfate ion, Na:K ratio, zinc,
iron, nickel and tungstate were anticipated to be important for the PDO production. It
was anticipated that ammonium ion and nitrate ion are important sources of nitrogen,
sulfate ion is the source of sulfur, and Na:K ratio is essential to maintain the ability for
this organism to salting-in potassium and maintain its osmotic balance. The trace
elements zinc, iron, nickel, and tungstate were thought to be crucial for the enzymatic
activity.
Through statistical analysis, 8 of 24 factors were found to significantly enhance
PDO production. These factors were glycerol, vitamin B12, pH, ammonium ion, sodium
sulfide, cysteine, iron, and cobalt. Glycerol is the initial substrate in this pathway,
thereby, higher concentration of glycerol would lead to higher production of end-product
PDO. In this pathway, glycerol dehydratase converts glycerol into an unstable
intermediate 3-hydroxypropionaldehyde. This intermediate is the precursor for PDO and
the reaction is catalyzed by PDO dehydrogenase enzyme. Glycerol dehydratase is a
vitamin B12 dependent enzyme, indicating that vitamin B12 a significant factor here.
Previous experiments performed with vitamin B12 have shown that H. hydrogeniformans
can produce PDO even in the absence of B12. It appears that this bacterium possesses
vitamin B12 synthesis pathway as evidenced in its genome. However, the
supplementation of vitamin B12 doubles the concentration of PDO produced [11].
In the standard growth medium, ammonium ion and nitrate ion are supplemented
as potential nitrogen sources. In order to identify the nitrogen source utilized by bacteria,

17
ammonium ion and nitrate ion were kept as separate factors. Generally, microorganisms
prefer ammonium over nitrate as the nitrogen source [12]. The exact mechanism
involved in the effect of ammonium ion on the production of PDO is still unknown.
However, the evidence for the impact of ammonia limited media on the glycerol
dissimilation to produce PDO has also been provided by Zheng et al. [13]. Furthermore,
H. hydrogeniformans is an anaerobic bacterium and requires a reducing environment. In
the standard growth medium of this bacterium, sodium sulfide and cysteine were added
as the reducing agents that reduce the oxidation-reduction potential of the media. This
makes these components essential for the growth of the bacterium and thereby, the
production of PDO. Additionally, H. hydrogeniformans grows preferentially at a pH of
11 and produces more PDO under highly alkaline conditions.
Microbial glycerol metabolism under anaerobic conditions occurs mainly via
enzyme-mediated oxidative-reductive pathways [14]. In general, the activity of enzymes
is attributed to the availability of cofactors or metal ions. Our results revealed the
significance of two cofactors, iron and cobalt, in the production of PDO. As mentioned
before, glycerol dehydratase is a vitamin B12 dependent enzyme and typically cobalt is an
integral part of vitamin B12’s structure. Therefore, concentration of cobalt in the medium
affects the structure and synthesis of vitamin B12, and subsequently, the production of
PDO. Moreover, iron is an essential cofactor for the activity of many alcohol
dehydrogenases. One such iron dependent alcohol dehydrogenase has been observed in
the C. acetobutylicum [15]. In conclusion, selected medium components in higher
concentrations significantly enhance the production of PDO by H. hydrogeniformans.
5. CONCLUSIONS
By using a fractional factorial design, this study effectively generated information
for the medium optimization of PDO production. Such experimental designs can be
crucial for the identification of significant factors among a large number of factors.
Moreover, this statistical design reduced the number of tests from a large number to a

18
feasible set of experiments. Furthermore, results obtained from this medium optimization
study can be utilized to produce PDO on a bioreactor scale.
Acknowledgments: This work was funded with a University of Missouri Fast Track
Grant.
Author Contributions: O. Sitton and M. Mormile conceived and designed the
experiments; J. Trager, S. Kalia, and O. Sitton performed the experiments; all authors
analyzed the data; O. Sitton and M. Mormile contributed reagents/materials/analysis
tools; all authors contributed to the writing of the paper.
Conflicts of Interest: The authors declare no conflict of interest.

19
REFERENCES
1. Anand, P.; Saxena, R.K. A comparative study of solvent-assisted pretreatment of
biodiesel derived crude glycerol on growth and 1,3-propanediol production from
Citrobacter freundii. New Biotechnol. 2012, 29, 199–205. DOI:
10.1016/j.nbt.2011.05.010.
2. Yang, F.; Hanna, M.A.; Sun, R. Value-added uses for crude glycerol-a byproduct of
biodiesel production. Biotechnol biofuels 2012, 5, 13. DOI:10.1186/1754-6834-5-13.
3. Hansen, C.F.; Hernandez, A.; Mullan, B.P.; Moore, K.; Trezona-Murray, M.; King,
R.H.; Pluske, J.R. A chemical analysis of samples of crude glycerol from the production
of biodiesel in Australia, and the effects of feeding crude glycerol to growing-finishing
pigs on performance, plasma metabolites and meat quality at slaughter. Anim Prod Sci.
2009, 49, 154–161. DOI: 10.1071/EA08210.
4. Lancrenon, X.; Fedders, J. An innovation in glycerin purification. Biodiesel Magazine.
http://www.biodieselmagazine.com/articles/2388/an-innovation-in-glycerin-purification
(accessed on June 22, 2016).
5. Zeng, A.P.; Biebl, H. Bulk chemicals from biotechnology: the case of 1,3-
propanediol production and the new trends. Adv. Biochem. Eng./Biotechnol. 2002, 74,
239-259. DOI:10.1007/3-540-45736-4_11.
6. Menzel, K.; Zeng, A-P.; Deckwer, W-D. High concentration and productivity of 1,3-
propanediol from continuous fermentation of glycerol by Klebsiella pneumoniae.
Enzyme Microb. Technol. 1997, 20, 82-86.
7. Cheng, K. K.; Liu, D. H.; Sun, Y.; Liu, W. B. 1,3-Propanediol production by
Klebsiella pneumoniae under different aeration strategies. Biotechnology Letters 2004,
26, 911–915.
20
8. Chatzifragkou, A.; Papanikolaou, S.; Dietz, D.; Doulgeraki, A.; Nychas, G-J.; Zeng,
A-P. Production of 1,3-propanediol by Clostridium butyricum growing on biodiesel-
derived crude glycerol through a non-sterilized fermentation process. Appl Microbiol
Biotechnol. 2011, 91, 101–112.
9. Mormile, M.R. Going from microbial ecology to genome data and back: studies on a
haloalkaliphilic bacterium isolated from Soap Lake, Washington State. Front Microbiol.
2014, 5, 628. DOI: 10.3389/fmicb.2014.00628.
10. Begemann, M. B.; Mormile, M. R.; Sitton, O. C.; Wall, J. D.; Elias, D. A. A
streamlined strategy for biohydrogen production with Halanaerobium hydrogeniformans,
an alkiliphilic bacterium. Front. Microbiol. 2012, 3,
p.93.DOI:10.3389/fmicb.2012.00093.
11. Roush, D. W. Production of 1,3-propanediol from glycerol under haloalkaline
conditions by Halanaerobium hydrogeniformans. Master’s thesis, Missouri University of
Science and Technology, Rolla, MO. 2013.
12. Kirchman, D. L.; Wheeler,P.A. Uptake of ammonium and nitrate by heterotrophic
bacteria and phytoplankton in the sub-Arctic Pacific. Deep-Sea Res. 1998, 45, 347-365.
13. Zheng, Z-M.; Xu, Y-Z.; Wang, T-P.; Dong, C-Q.; Yang, Y-P.; Liu, D-H.
Ammonium and phosphate limitation in 1,3-propanediol production by Klebsiella
pneumoniae. Biotechnol Lett. 2010, 32, 289-294. DOI: 10.1007/s10529-009-0150-y.
14. Clomburg, J.M.; Gonzalez, R. Anaerobic fermentation of glycerol: a platform for
renewable fuels and chemicals. Trends Biotechnol. 2013, 31, 20-28.
15. Youngleson, J. S.; Santangelo, J.D.; Jones, D.T.; Woods, D.R. Cloning and
expression of a Clostridium acetobutylicum alcohol dehydrogenase gene in Escherichia
coli. Appl. Environ. Microbiol. 1988, 54, 676-682.

21
II. 1,3-PROPANEDIOL PRODUCTION FROM GLYCEROL BY
HALANAEROBIUM HYDROGENIFORMANS IN SCALE UP
REACTOR AND REPEATED FED BATCH OPERATION
To be submitted to Journal of Biotechnology.
ABSTRACT
The development of renewable energy sources, such as biofuels, is a crucial issue
in today’s world. For instance, the production and disposal of crude glycerol, biodiesel
by-product, has become economically infeasible. Moreover, the high pH and salt
concentration of crude glycerol makes it essential to purify and neutralize before
utilization. However, the use of a haloalkaliphile microorganism could eliminate the need
for biodiesel waste neutralization and make glycerol product use cost-effective. A
haloalkaliphilic bacterium, Halanaerobium hydrogeniformans, capable of growing at a
broad pH range (7.5-12) and salt concentration (2.5-15%) can possibly serve this
purpose. H. hydrogeniformans can convert glycerol into 1,3-propanediol (PDO), a known
chemical commodity. The impact of scale up in the reactor volume on the PDO
production was investigated. An increase in reactor volume by 10X decreased the PDO
productivity by 10% from 1.67 to 1.5 mmol/L-hr and PDO concentration by 10 percent
from 327.8 to 300.75 mM. In order to enhance the PDO production and reactor
productivity, repeated fed batch (RFB) operations were performed with different retained
volume fraction and glycerol concentrations. In the RFB reactor, the optimal productivity
of 2.7 mmol/L-hr and maximum PDO concentration of 456 mM was observed. These
results were obtained at a retained volume fraction of 0.8 and glycerol feed concentration
of 2000 mM. Overall, in comparison to the batch fermentation, RFB operation resulted in
a 61.7 percent increase in productivity and a 39.2 increase in PDO concentration.
1. INTRODUCTION
A limited supply of primary energy resources has resulted in the development of
renewable energy sources such as biofuels. Biodiesel is the most common biofuel and is
made from animal fats or vegetable oils. In United States, biodiesel production increased
22
from 343 million of gallons in 2010 to 1359 millions of gallons in 2013 [1]. However,
this increase in biodiesel production has led to the generation of large amount of crude
glycerol as a waste product, almost 10% (w/w) [2]. Glycerol in its pure form is used in
the food, pharmaceutical, and cosmetics industries. Glycerol can also be chemically or
microbiologically converted to metabolites such as poly-hydroxyalkanoates, acrylic acid,
polyhydroxybutyrate, 1,3-propanediol, fumaric acid, arabitol and dihydroxyacetone [3, 4,
5, 6]. Crude glycerol obtained from biodiesel plants has various impurities. A study
performed on the composition of waste from biodiesel plants showed that glycerol
concentration can range from 38% to 96%, methanol 14% and ash 29% [7]. Presence of
methanol and ash in crude glycerol makes it unsuitable for utilization in chemical and
pharmaceutical industries. Along with these impurities, biodiesel waste has high pH and
salt concentration, up to 10 and 3%. Therefore, pre-treatment of waste glycerol is
required prior to its utilization, resulting in an increase of the cost of biodiesel production
and its use economically unfeasible [8]. Thus, crude glycerol is considered as a waste
stream that is to be disposed [9].
Conversion of crude glycerol to a higher value chemical commodity can be an
ecological and economical benefit to the biodiesel industry. One such product is 1,3-
propanediol (PDO). 1.3-propanediol is a key monomer for the manufacture of
polytrimethylene terephthalate (PTT), a polymer used in the textiles and carpet industry
[10]. 1,3-propanediol is also used in the synthesis of cosmetics, perfumes, antifreezes,
UV-cured coatings, and laminates [11]. Previous studies have assessed PDO production
by bacteria such as Clostridium butyricum, Citrobacter freundii and Klebsiella
pneumoniae [11, 12, 13]. However, these studies were performed with pure glycerol at
neutral pH values. Haloalkaliphilic microorganisms, due to their ability to grow at high
salt and pH level, could remove the need for glycerol pretreatment steps. Moreover,
hypersaline medium limits the growth of most organisms, therefore, sterilization cost of
biotechnological processes can be reduced [14].
An anaerobic haloalkaliphilic bacterium, Halanaerobium hydrogeniformans,
isolated from Soap Lake in Washington State, was assessed for its ability to metabolize

23
glycerol to PDO [15]. Optimum growth conditions for H. hydrogeniformans are 30˚C, pH
of 11 and a NaCl concentration of 7.5% [16]. The genome data analysis of this bacterium
revealed that it has the ability to convert glycerol into PDO [15]. Another interesting
feature is that this bacterium can grow at broad salt (2.5-15%) and pH (7.5-12) ranges
[16]. 1,3-propanediol production from crude glycerol using this bacterium could remove
the need for neutralization steps and salt dilution.
Under anaerobic conditions, glycerol assimilation occurs via two metabolic
pathways, reductive and oxidative [10]. Through the oxidative pathway, glycerol is
dehydrogenated by glycerol dehydrogenase to dihydroxyacetone and further converted to
various end-products such as acetate, ethanol, and lactic acid. Through the reductive
pathway, glycerol is converted into PDO in two steps. Initially, glycerol is dehydrated to
3-hydroxypropionaldehyde (3-HPA) by glycerol dehydratase. In the consecutive step, 3-
HPA is reduced to PDO by 1,3-propanediol dehydrogenase, oxidizing NADH2 and
regenerating NAD+. Previous work with H. hydrogeniformans had shown that it can
convert 60.3% of glycerol in our standard growth medium [17]. However, a medium
composition was also designed that contains the components that have significant impact
on the PDO production [18]. The objectives of the current study is to measure the yield,
titer, and production of PDO as a function of scale up in the reactor performance and to
determine the optimal fed-batch operating parameters in order to maximize the yield,
titer, and productivity of the PDO production.
2. MATERIALS AND METHODS
2.1. Microorganism used for study
A haloalkaliphilic bacterium strain, Halanaerobium hydrogeniformans was used
to convert crude glycerol into 1,3-propanediol. The bacterium was isolated from Soap
Lake, Washington State [17]. The complete genome of the bacterium has been deposited
in NCBI with accession number NC_014654 [19].

24
2.2. Growth Medium
H. hydrogeniformans was grown under anaerobic conditions by using a medium
composed of 70 g NaCl, 40 g Na2CO3, 6.3 g K2HPO4, 1 g yeast extract, glycerol 5 w/v%
std (543 mM), 10 ml basal medium stock solution and 10 ml trace mineral solution in a 1
liter solution. The composition of the trace mineral solution per 1 liter water was: 30 mg
MgSO4•7H2O, 23.6 mg EDTA, 10 mg NaCl, 6.4 mg MnCl2•4H2O, 1.3 mg ZnCl2, 1 mg
FeSO4•7H2O, 1 mg CaCl2•2H2O, 1 mg CoCl2•6H2O, 0.3 mg NiSO4•6H2O, 0.25 mg
Na2MoO4•2H2O, 0.25 mg Na2WO4•2H2O, 0.1 mg AlK(SO4)2•12H2O, 0.1 mg H3BO3 and
0.07 mg CuCl2•2H2O. One liter of basal medium stock solution contained 50 mg
NH4NO3, 8.5 mg MgCl2•6H2O, 7.5 mg SiO2, 4.5 mg MnSO4•H2O, 4.2 mg CaCl2•2H2O, 4
mg methylene blue (as an oxygen indicator) and 1.8 mg FeSO4•7H2O.
The medium was made anaerobic by boiling and degassing with nitrogen gas.
Once the medium cooled, 100 µg Vitamin B12 and reducing agents 0.025 g sodium
sulfide and 0.025 g cysteine per liter were added. The resulting anaerobic medium was
transferred to an anaerobic chamber under a forming gas (90% N2 : 10% H2) atmosphere.
Aliquots of medium, 50 ml, was transferred into 160 ml serum bottles. These bottles were
sealed with butyl rubber stoppers crimped into place with aluminum crimp seals. The
medium was autoclaved at 121ºC and 15 PSI for 20 min. The medium was inoculated
after exchanging headspace gas with 100% nitrogen. Cultures were incubated in shaking
incubator at 30ºC.
2.3. Fermentation Medium
The fermentation medium composition was a modification of the medium above
based upon the media screening tests for PDO production [18]. Media screening tests
showed that out of all the standard medium components; glycerol, vitamin B12, pH,
ammonium ion, sodium sulfide, cysteine, iron and cobalt have significant impact on the
PDO production. The resulting medium consisted of 1000 µM glycerol, 3000 µM
ammonium ion, 200 µM sodium sulfide, 300 µM cysteine hydrochloride, 500 µg/L

25
vitamin B12, 50 µM iron and 100 µM cobalt. The remaining components consisted of 160
µM sulfate, 40,000 µM phosphate and 600,000 µM chloride ion resulting in a Na:K ratio
of 12.5. All other salts were kept at zero concentration.
2.4. Fermentation Experiments
Two bioreactors manufactured by Sartorius Stedim were used, two-liter (Biostat
BPlus) and a twenty-liter working volume (Biostat C). Variables such as temperature,
agitator speed, optical density, pH, liquid flow, liquid level, and gas level were controlled
by a digital control unit. Before each run, the bioreactor was autoclaved at 121ºC for 45
minutes and sparged with argon gas for 30 minutes to maintain anaerobic conditions. All
liquids entered the reactor through a sterilizing filter (0.2 µm) attached to the liquid inlet
port and all gases passed through a sterilizing filter attached to the gas inlet port.
Fermentation medium was introduced into a feed vessel through a peristalic pump
attached to one of the inlet port. Oxygen was removed from the medium by sparging with
argon gas. The reducing agents, sodium sulfide and cysteine, were added to the feed
vessel via injection to maintain a reducing environment.
For batch cycle runs, anaerobic and filter-sterilized medium from the feed vessel
was fed into the reactor. The operating conditions were maintained at 30ºC, pH 11 and an
agitator speed of 250 RPM. The flow of the argon for the head space gas exchange was
set at 30 ml/min. As conditions stabilized, fresh inoculum was anaerobically added
through an injection port in the reactor head. Liquid culture samples were collected every
two hours using a ceramic filter (Flownamics, Madison, WI).
For fed-batch cycle runs, fresh medium was fed when liquid volume changed
from maximum reactor volume, Vmax (2 liters) to a specified initial volume (V0). This
reduction in liquid volume was measured with a low-level electrode and achieved by
pumping liquid from the liquid sampling port. As liquid volume reached V0, the peristalic
pump on the feed line transferred fresh, sterile medium of a specified glycerol

26
concentration into the reactor. Medium addition was stopped as soon as the liquid volume
reached apparent Vmax. Cell concentration in the reactor was determined by monitoring
the optical density of the culture fluid by using a Fundulus II (Sartorius Stedim) probe.
2.5. Component Analysis
Glycerol, PDO, and organic acids were analyzed by using HPLC. The analytical
column was a Rezex-RHM ion exchange column (Phenomenex, Torrance, CA) placed on
a HP1090 system running Chemstation A.03 software (Agilent, Santa Clara, Ca). Milli-Q
water containing 0.005 N sulfuric acid was used as the mobile phase at a flow rate of 0.6
ml/min. The column temperature was controlled at 85ºC. UV-VIS diode array detector
and a HP 1037 refractive index (RI) detector (Agilent, Santa Clara, Ca) were used. The
UV-VIS detector detected organic acids by quantitating the UV cut-off absorbance at 210
nm. The RI detector was used to measure glycerol and PDO concentration. For all
samples, the injection size was 10 µl. Samples were first filtered by using a membrane
filter and then analyzed on the HPLC system.
3. RESULTS
3.1. Batch fermentation
The impact of bioreactor scale-up on the production of PDO from glycerol by H.
hydrogeniformans was investigated. The process was analyzed in two reactor volumes, 2
liter and 20 liter. In order to establish reproducibility, the reactor tests were performed in
two replicates. Moreover, the 2-liter reactor was run for an extended time in order to find
the optimal reaction times. Data obtained from each run were used to calculate the kinetic
parameter, as shown in Table 1.

27
(a)
(b)
Figure 1. 2-liter batch reactor over extended time; (a) concentration profiles of
metabolite (PDO, acetate and formate) production with glycerol as a carbon source;
(b) reactor performance.
Glycerol PDO Acetate Formate
Cells Productivity Volume

28
Figure 1a shows the concentration profiles generated in 2-liter batch reactor. The
initial glycerol concentration in each batch reactor run was 1000 mM. After 200 hours,
323.1 mM of PDO was measured and its yield was 0.65 mol/mol. The productivity of
PDO after 200 hours was 1.65 mmol PDO/L-hr. However, it was found to decrease with
further reaction time. The concentration of acetate was 200 mM, approximately one-half
the concentration of PDO. A small amount of formate was also observed.
These results were consistent with a second 2-liter reaction test performed under
identical conditions. Results of this replicate are provided in Figure 1s in the
supplementary material. Reaction conditions were run in the 20 L bioreactor as in the
two-liter reactor test. Figure 2 shows the concentration profile and the performance of
one 20 L batch reactor run. The concentration of PDO at 200 hours was 303 mM and its
yield was 0.64 mol/mol. Though the PDO yield was similar under both reactor volumes,
the productivity was 1.51 mmol/L-hr, which is 10 percent lower than 2-liter run. The
concentration of acetate was observed 150 mM approx. one-half the concentration of
PDO and 20 mM of formate was formed.
(a)
Glycerol PDO Acetate Formate

29
(b)
Figure 2. 20-liter batch reactor; (a) concentration profiles of metabolite (PDO,
acetate and formate) production with glycerol as a carbon source; (b) reactor
performance.
A second test for 20-liter reactor was performed under identical conditions.
Figure 2s, supplementary material, provides the concentration profile and performance of
the 20-liter replicate run. The results were consistent with the previous 20-liter run. The
PDO productivity was 1.49 mmol/L-hr, approximately 10 percent lower from 2-liter
reactor run.
Table 1 summarizes the results from the 2-liter and 20-liter reactor tests along
with their replicates under batch conditions. At 200 hours, the PDO concentration was
higher in the 2 L reactor runs than the 20 L reactor runs. A similar trend was seen with
PDO productivity. Günzel et al. [20] performed the first scale-up experiments on PDO
synthesis by C. butyricum DSM 5431. The fermentation process was assessed in reactor
volumes ranging from 1.4 L to 2000 L. In air-lift bioreactors, the highest PDO
concentration was observed in 30 L and 1200 L bioreactors. However, in stirred-tank
bioreactors, the highest PDO concentration of 56 g/L was seen in the 30 L reactor.
Cells Productivity Volume

30
Another study performed on scale up of PDO production by Clostridium butyricum DSP1
from crude glycerol showed almost similar concentration of PDO in 6.6 L, 42 L and 150
L, averaged 37 g/L [21].
Table 1. Kinetic parameter values for PDO production from glycerol at ̴ 200 hr in 2
liter and 20 liter bioreactors.
Bioreactor Volume 2 L 20 L
Run # 1 2 1 2
PDO Concentration (mM) 323.1 332.5 303 298.5
Yield (mol PDO/mol
Glycerol)
0.65 0.64 0.64 0.63
Productivity (mmol PDO/L-
hr)
1.65 1.69 1.51 1.49
3.2. Fed-batch fermentation
Repeated fed-batch fermentation operations were run to identify the effect of high
glycerol concentration as well as a range of retained volume fraction on the production of
PDO. A 2-liter reactor volume was used as the maximum velocity (Vmax). At the end of
2-liter repeated batch run, the reactor volume was drained to 1 liter, resulting in a 0.5
retained volume fraction (V0/Vmax). Fresh, sterile and anaerobic medium containing a
glycerol concentration of 1000 mM was used as a feed. The feed flow was maintained at
0.2 ml/min until the reactor volume reached 2 liters. The feed flow was stopped for the
rest of the test. The concentration profile and performance of one cycle of fed batch
reaction at a retained volume fraction of 0.5 and 1000 mM glycerol feed concentration is
shown in Figure 3. The reaction ran for 200 hours. However, the productivity was
maximum around 75 hours near the time when the reactor volume was maximum. After
200 hours, the PDO concentration was 650 mM, acetate concentration was 300 mM and
25 mM of formate were formed. The reaction continued in batch mode and the
productivity decreased gradually. For the remaining tests, the cycle time was set as the

31
reactor volume reaches apparent Vmax and then the reactor contents were drained to V0.
Once this point was reached, feed flow started again to begin the next cycle.
(b)
Figure 3. 2-liter fed-batch reaction at 0.5 retained volume fraction (V0/Vmax) and
1000 mM Glycerol (Sin) in feed; (a) concentration profiles of metabolite (PDO,
Glycerol PDO Acetate Formate
Cells Productivity Reactor volume
(a)

32
acetate and formate) production with glycerol as a carbon source; (b) reactor
performance.
Further tests were performed under repeated fed batch (RFB) conditions ranging
from 0.5 to 0.9 retained volume fractions. The concentration profile and the performance
for a RFB at a retained volume fraction of 0.5 and a 1000 mM of feed glycerol
concentration is presented in Figure 4. The reaction ran for 600 hours for a total of seven
cycles. Figure 4a shows decrease in PDO concentration initially, due to the dilution of
reactor content as fresh medium is fed into the bioreactor. However, around 6th cycle, rate
of dilution was balanced by rate of PDO production and the system achieved apparent
steady state conditions where the productivity stabilized at 1.55 mmol/L-hr, as shown in
Figure 4b. At this point, the PDO concentration was 265.2 mM and the yield was 0.64
mol/mol.
(a)
Glycerol PDO Acetate Formate

33
(b)
Figure 4. 2-liter RFB reaction at 0.5 retained volume fraction (V0/Vmax) and 1000
mM Glycerol (Sin) in feed; (a) concentration profiles of metabolite (PDO, acetate
and formate) production with glycerol as a carbon source; (b) reactor performance.
The concentration profile and performance for a repeated fed-batch reaction at 0.6
retained volume fraction and a feed glycerol concentration of 1000 mM is given in Figure
5. The test ran for 200 hours and included three cycles. The PDO concentration after 200
hours was 294.1 mM, the yield was 0.67 mol/mol, and the productivity was 1.77 mmol
PDO/L-hr.
Cells Productivity Reactor volume

34
(a)
(b)
Figure 5. 2-liter RFB reaction at 0.6 retained volume fraction (V0/Vmax) and 1000
mM Glycerol (Sin) in feed; (a) concentration profiles of metabolite (PDO, acetate
and formate) production with glycerol as a carbon source; (b) reactor performance.
Glycerol PDO Acetate Formate
Cells Productivity Volume

35
Three more tests were performed with different retained volume fractions of 0.7,
0.8, 0.9. Figure 3s, 4s and 5s, supplementary material, provides the concentration profile
and the performance of 0.7, 0.8 and 0.9 retained volume reactions. For each of these tests,
the feed glycerol concentration was 1000 mM. For the 0.7 retained volume fraction, the
reactor achieved apparent steady state conditions after 4 cycles, however, for 0.8 and 0.9
retained volume, apparent steady state conditions were achieved after 3 cycles. Table 2
lists the kinetic parameters obtained under different retained volume fractions. By
increasing the retained volume fraction from 0.5 to 0.8, the RFB productivity increased
by 26.5 percent and the PDO concentration increased by 22.2 percent. The yield
remained nearly constant for all retained volume fractions, varying between 0.63-0.64
mol PDO/mol glycerol.
Table 2. Effect of retained volume fraction on a RFB reactor performance at a
glycerol feed concentration of 1000 mM.
Retained Volume Fraction 0.5 0.6 0.7 0.8 0.9
PDO Concentration (mM) 265.2 294.1 304 324 339
Yield (mol PDO/mol
Glycerol)
0.64 0.67 0.62 0.63 0.64
Productivity (mmol PDO/L-
hr)
1.55 1.77 1.82 1.96 2.05
An increase in retained volume fraction on the reactor performance can be clearly
observed in Figure 6. The productivity was maximum at a retained volume fraction 0.9.
However, the excessive cycling at this fraction is not feasible. Therefore, for the
remaining tests, 0.8 was used as the retained volume fraction.

36
Figure 6. Effect of retained volume fraction on reactor performance.
In the present study, four different reactor tests were performed with four
different glycerol feed concentrations of 1500, 2000, 2500, and 3000 mM. Due to the
increased viscosity of the feed media, 3000 mM was used as the maximum glycerol
concentration. The retained volume fraction in each test was kept same as 0.8. Figure 7
provides the concentration profile and reactor performance of the RFB reactor when
glycerol feed concentration was 1500 mM. The reaction ran for 340 hours that included
total 10 cycles. The system took approximately 10 cycles to attain apparent steady state
conditions. The productivity was also found to be increased by 25.5 percent i.e., from
1.96 to 2.46 mmol/L-hr, with an increase in glycerol feed concentration from 1000 to
1500 mM. The PDO yield remained same while PDO concentration increased by 27%.
Productivity Yield PDO

37
(a)
(b)
Figure 7. 2-liter RFB reaction at 0.8 retained volume fraction (V0/Vmax) and 1500
mM Glycerol (Sin) in feed; (a) concentration profiles of metabolite (PDO, acetate
and formate) production with glycerol as a carbon source; (b) reactor performance.
Glycerol PDO Acetate Formate
Cells Productivity Volume

38
Figure 8 shows the concentration profile and the performance of a RFB reactor
with a glycerol feed concentration of 2000 mM and retained volume fraction of 0.8. The
reaction ran for 340 hours that included 10 cycles. As the feed glycerol concentration
increased from 1000 mM to 2000 mM, the PDO concentration increased by 40.8% and
productivity increased by 36.7%. Figure 6s and 7s, supplementary materials, provides the
concentration profile and the performance of RFB reactor at the glycerol feed
concentration of 2500 and 3000 mM. The reaction achieved apparent steady state
conditions in 10 cycles. Figure 9 compares the effect of different feed glycerol
concentration on the reactor performance. It was observed that the increase in glycerol
feed concentration above 2000 mM had a small effect on the RFB reactor performance
(Table 3).
(a)
Glycerol PDO Acetate Formate

39
Figure 8. 2-liter RFB reaction at 0.8 retained volume fraction (V0/Vmax) and 2000
mM Glycerol (Sin) in feed; (a) concentration profiles of metabolite (PDO, acetate
and formate) production with glycerol as a carbon source; (b) reactor performance.
Figure 9. Effect of glycerol feed concentration on the RFB reactor performance.
Productivity Yield PDO
Cells Productivity Volume (b)
40
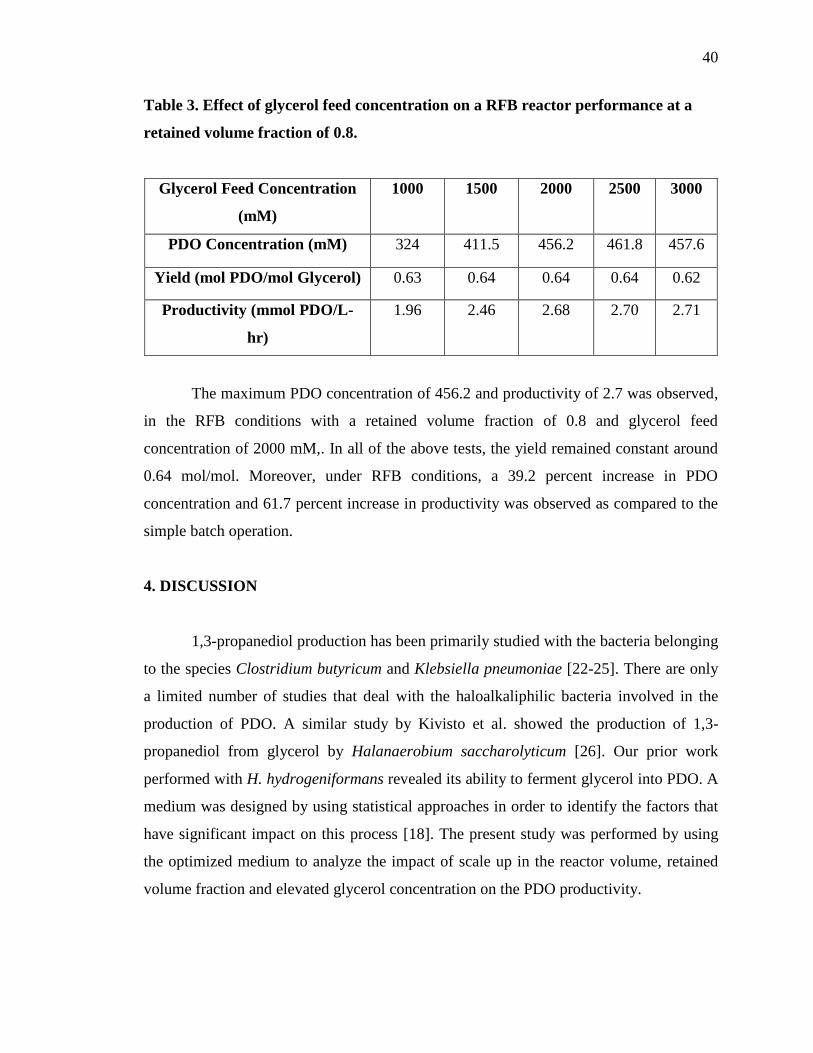
Table 3. Effect of glycerol feed concentration on a RFB reactor performance at a
retained volume fraction of 0.8.
Glycerol Feed Concentration
(mM)
1000 1500 2000 2500 3000
PDO Concentration (mM) 324 411.5 456.2 461.8 457.6
Yield (mol PDO/mol Glycerol) 0.63 0.64 0.64 0.64 0.62
Productivity (mmol PDO/L-
hr)
1.96 2.46 2.68 2.70 2.71
The maximum PDO concentration of 456.2 and productivity of 2.7 was observed,
in the RFB conditions with a retained volume fraction of 0.8 and glycerol feed
concentration of 2000 mM,. In all of the above tests, the yield remained constant around
0.64 mol/mol. Moreover, under RFB conditions, a 39.2 percent increase in PDO
concentration and 61.7 percent increase in productivity was observed as compared to the
simple batch operation.
4. DISCUSSION
1,3-propanediol production has been primarily studied with the bacteria belonging
to the species Clostridium butyricum and Klebsiella pneumoniae [22-25]. There are only
a limited number of studies that deal with the haloalkaliphilic bacteria involved in the
production of PDO. A similar study by Kivisto et al. showed the production of 1,3-
propanediol from glycerol by Halanaerobium saccharolyticum [26]. Our prior work
performed with H. hydrogeniformans revealed its ability to ferment glycerol into PDO. A
medium was designed by using statistical approaches in order to identify the factors that
have significant impact on this process [18]. The present study was performed by using
the optimized medium to analyze the impact of scale up in the reactor volume, retained
volume fraction and elevated glycerol concentration on the PDO productivity.
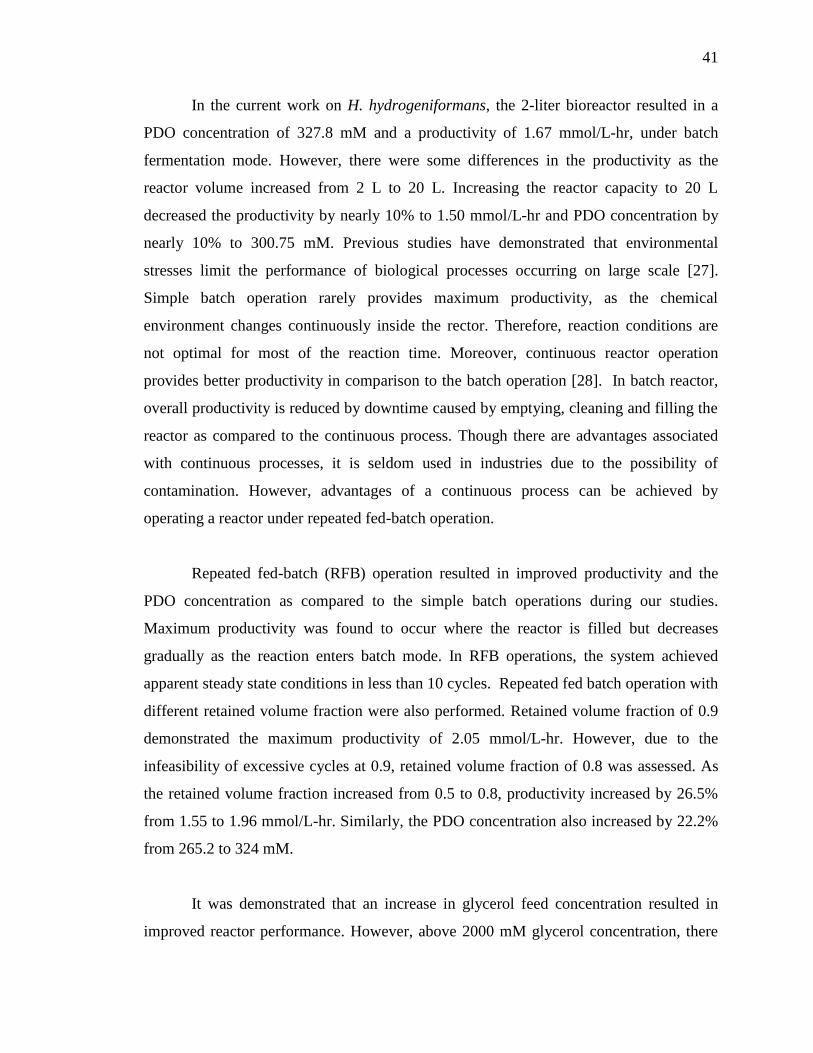
41
In the current work on H. hydrogeniformans, the 2-liter bioreactor resulted in a
PDO concentration of 327.8 mM and a productivity of 1.67 mmol/L-hr, under batch
fermentation mode. However, there were some differences in the productivity as the
reactor volume increased from 2 L to 20 L. Increasing the reactor capacity to 20 L
decreased the productivity by nearly 10% to 1.50 mmol/L-hr and PDO concentration by
nearly 10% to 300.75 mM. Previous studies have demonstrated that environmental
stresses limit the performance of biological processes occurring on large scale [27].
Simple batch operation rarely provides maximum productivity, as the chemical
environment changes continuously inside the rector. Therefore, reaction conditions are
not optimal for most of the reaction time. Moreover, continuous reactor operation
provides better productivity in comparison to the batch operation [28]. In batch reactor,
overall productivity is reduced by downtime caused by emptying, cleaning and filling the
reactor as compared to the continuous process. Though there are advantages associated
with continuous processes, it is seldom used in industries due to the possibility of
contamination. However, advantages of a continuous process can be achieved by
operating a reactor under repeated fed-batch operation.
Repeated fed-batch (RFB) operation resulted in improved productivity and the
PDO concentration as compared to the simple batch operations during our studies.
Maximum productivity was found to occur where the reactor is filled but decreases
gradually as the reaction enters batch mode. In RFB operations, the system achieved
apparent steady state conditions in less than 10 cycles. Repeated fed batch operation with
different retained volume fraction were also performed. Retained volume fraction of 0.9
demonstrated the maximum productivity of 2.05 mmol/L-hr. However, due to the
infeasibility of excessive cycles at 0.9, retained volume fraction of 0.8 was assessed. As
the retained volume fraction increased from 0.5 to 0.8, productivity increased by 26.5%
from 1.55 to 1.96 mmol/L-hr. Similarly, the PDO concentration also increased by 22.2%
from 265.2 to 324 mM.
It was demonstrated that an increase in glycerol feed concentration resulted in
improved reactor performance. However, above 2000 mM glycerol concentration, there

42
was only a minor effect on the reactor performance. Maximum PDO concentration and
productivity were achieved at glycerol feed concentration of 2500 mM. While operated in
RFB mode, optimal productivity observed was 2.7 mmol/L-hr with PDO concentration
measured at 456 mM when operated at 2000 mM of glycerol feed concentration and 0.8
retained volume fraction. Yield remained near constant at 0.64 mol/mol for all tests.
Some studies have shown the negative effect of increased substrate concentration on the
biomass yield and PDO formation [29]. This effect has been suggested due to the
substrate toxicity on the microorganism and to the increase in osmotic pressure. In a
study performed by Metsoviti et al. [30], a similar effect was observed under batch
operation, however, in fed-batch operation substrate inhibition was not observed. In the
present study, no such inhibitory effect of increased substrate concentration on PDO
formation in a repeated fed batch reactor was observed.
1,3-propanediol production at larger scale can be affected by various factors. 1,3-
propanediol synthesis by some anaerobic bacteria were reported to be influenced by
oxidative stress, osmotic stress and mechanical stress [27]. These stress conditions may
explain the decreased PDO concentration as a function of scale up in reactor volume.
Moreover, a study performed by Biebl et al [31] noted that by-products of glycerol
fermentation, butyric acid and acetic acid, inhibit the production of PDO. Inhibition of
PDO production in a fed-batch fermentation by lactic acid, butyric acid and acetic acids
have also been reported [23]. I this study, fed-batch fermentation process provided a 39.2
percent increase in PDO concentration and a 61.7 percent increase in the productivity as
compared to the batch fermentation process. Metabolically active biomass as inoculum
from previous fermentation run was used to begin next fermentation run, thus, reducing
the total reaction time. This eliminates the phase of unsteady reactor conditions,
microbial adaptation to the media and ultimately improves the PDO production, a result
also reported by Szymanowska [32].

43
REFERENCES
1. Biodiesel Purchases by EPAct-Regulated Fleets. Available from:
http://www.afdc.energy.gov/data/10325
2. Anand P, Saxena RK. A comparative study of solvent-assisted pretreatment of
biodiesel derived crude glycerol on growth and 1,3-propanediol production from
Citrobacter freundii. New Biotechnol. 2012; 29: 199–205. doi:
10.1016/j.nbt.2011.05.010.
3. Yang F, Hanna MA, Sun R. Value-added uses for crude glycerol-a byproduct of
biodiesel production. Biotechnol biofuels. 2012; 5 (13). doi:10.1186/1754-6834-5-13.
4. Moon SK, Wee YJ, Yun JS, Ryu HW. Production of fumaric acid using rice bran and
subsequent conversion to succinic acid through a two-step process. Appl Biochem
Biotechnol. 2004;115: 843–856.
5. Koganti S, Kuo TM, Kurtzman CP. Production of arabitol from glycerol: strain
screening and study of factors affecting production yield. Appl Microbiol Cell Physiol.
2011; 90: 257–267.
6. Nabe K, Izuo N, Yamada S, Chibata I. Conversion of glycerol to dihydroxyacetone by
immobilized whole cells of Acetobacter xylinum. Appl Env Microbiol. 1979; 38: 1056–
1060.
7. Hansen CF, Hernandez A, Mullan BP, Moore K, Trezona-Murray M, King RH, et al.
A chemical analysis of samples of crude glycerol from the production of biodiesel in
Australia, and the effects of feeding crude glycerol to growing-finishing pigs on
performance, plasma metabolites and meat quality at slaughter. Anim Prod Sci. 2009;
49: 154–161. doi: 10.1071/EA08210.

44
8. Lancrenon X, Fedders J. An innovation in glycerin purification. Biodiesel Magazine.
Available from: http://www.biodieselmagazine.com/articles/2388/an-innovation-in-
glycerin-purification (accessed on June 22, 2016).
9. Yazdani SS, Gonzalez R. Anaerobic fermentation of glycerol: a path to economic
viability for the biofuels industry. Current Opinion in Biotechnology. 2007;18: 213–219.
10. Zeng AP, Biebl H. Bulk chemicals from biotechnology: the case of 1,3-propanediol
production and the new trends. Adv. Biochem. Eng./Biotechnol. 2002;74: 239-259.
doi:10.1007/3-540-45736-4_11.
11. Chatzifragkou A, Papanikolaou S, Dietz D, Doulgeraki A, Nychas GJ, Zeng AP.
Production of 1,3-propanediol by Clostridium butyricum growing on biodiesel-derived
crude glycerol through a non-sterilized fermentation process. Appl Microbiol
Biotechnol. 2011;91: 101–112.
12. Drożdżyńska A, Pawlicka J, Kubiak P, Kośmider A, Pranke D, Olejnik-Schmidt A, et
al. Conversion of glycerol to 1,3-propanediol by Citrobacter freundii and Hafnia alvei -
newly isolated strains from the Enterobacteriaceae. N Biotechnol. 2014; 31:402–10.
http://dx.doi.org/10.1016/j.nbt.2014.04.002.
13. Cheng KK, Liu D H, Sun Y, Liu WB. 1,3-Propanediol production by Klebsiella
pneumoniae under different aeration strategies. Biotechnology Letters. 2004; 26:911–
915.
14. Kivistö A. Halophilic Biohydrogen and 1,3-Propanediol Production from Raw
Glycerol: A Genomic Perspective. Tampere University of Technology. 2013, Publication;
Vol. 1160.

45
15. Mormile MR. Going from microbial ecology to genome data and back: studies on a
haloalkaliphilic bacterium isolated from Soap Lake, Washington State. Front Microbiol.
2014; 5: 628. DOI: 10.3389/fmicb.2014.00628.
16. Begemann MB, Mormile MR, Sitton OC, Wall J D, Elias DA. A streamlined
strategy for biohydrogen production with Halanaerobium hydrogeniformans, an
alkiliphilic bacterium. Front Microbiol. 2012; 3: p.93. DOI:10.3389/fmicb.2012.00093.
17. Roush DW. Production of 1,3-propanediol from glycerol under haloalkaline
conditions by Halanaerobium hydrogeniformans. Master’s thesis, Missouri University of
Science and Technology, Rolla, MO. 2013.
18. Kalia S, Trager J, Sitton OC, Mormile MR. The use of a fractional factorial design to
determine the factors that impact 1,3-propanediol production from glycerol by
Halanaerobium hydrogeniformans. Life. 2016; 6: x. DOI: FOR PEER REVIEW.
19. Brown SD, Begemann MB, Mormile MR, Wall JD, Han CS, Goodwin LA, Pitluck S,
Land ML, Hauser LJ, Elias DA: Complete genome sequence of the haloalkaliphilic,
hydrogen-producing bacterium Halanaerobium hydrogeniformans. J Bacteriol. 2011;193:
3682-3683.
20. Günzel B, Yonsel S, Deckwer WD. Fermentative production of 1,3-propanediol from
glycerol by Clostridium butyricum up to a scale of 2 m3. Appl Microbiol Biotechnol
1991; 36:289–294.
21.Szymanowska-Powałowska D, Biała W. Scale-up of anaerobic 1,3-propanediol
production by Clostridium butyricum DSP1 from crude glycerol. BMC Microbiol. 2014;
14:45. http://dx.doi.org/10.1186/1471-2180-14-45.
22. Chatzifragkou A, Papanikolaou S, Dietz D, Doulgeraki AI, Nychas GJE, Zeng AP.
Production of 1,3-propanediol by Clostridium butyricum growing on biodiesel-derived
46
crude glycerol through a non-sterilized fermentation process. Applied Microbiology and
Biotechnology. 2011; 91: 101–112.
23. Chen X, Zhang D, Qi W, Gao S, Xiu ZL, Xu P. Microbial fed-batch production of
1,3-propanediol by Klebsiella pneumoniae under micro-aerobic conditions. Applied
Microbiology and Biotechnology. 2003; 63: 143–146.
24. Gonzalez-Pajuelo M, Andrade JC, Vasconcelos I. Production of 1,3- propanediol by
Clostridium butyricum VPI 3266 using a synthetic medium and raw glycerol. Journal of
Industrial Microbiology and Biotechnology. 2004; 34: 442–446.
25. Papanikolaou S, Fick M, Aggelis G. The effect of raw glycerol concentration on the
production of 1,3-propanediol by Clostridium butyricum. Journal of Chemical
Technology and Biotechnology. 2004; 79: 1189–1196.
26. Kivistö A, Santala V, Karp M. Hydrogen production from glycerol using halophilic
fermentative bacteria. Bioresour Technol. 2010; 101: 8671–8677
27. Kubiak P, Leja K, Myszka K, Celińska E, Spychała M, Szymanowska-Powałowska
D, Czaczyk K, Grajek W. Physiological predisposition of various Clostridium species to
synthetize 1,3-propanediol from glycerol. Proc Biochem 2012; 47:1308–1319.
28.https://www.generalkinematics.com/blog/batch-processing-vs-continuous-flow/
(accessed on May, 2017).
29. Chatzifragkou A, Dietz D, Komaitis M, Zeng AP, Papanikolaou S. Effect of
biodiesel-derived waste glycerol impurities on biomass and 1,3-propanediol production
of Clostridium butyricum VPI 1718. Biotechnology and Bioengineering. 2010; 107: 76–
84.

47
30. Metsoviti M, Zeng A, Koutinas AA, Papanikolaou S. Enhanced 1,3-propanediol
production by a newly isolated Citrobacter freundii strain cultivated on biodiesel-derived
waste glycerol through sterile and non-sterile processes. Journal of Biotechnology. 2013;
163: 408-418.
31. Biebl H. Glycerol fermentation of 1,3-propanediol by Clostridium butyricum.
Measurement of product inhibition by use of a pH-auxostat. Appl Microbiol Biotechnol.
1991; 35:701–705.
32. Szymanowska-Powalowska D. 1,3-propanediol production from crude glycerol by
Clostridium butyricum DSP1 in repeated batch. Electronic Journal of Biotechnology.
2014; 17:322-328.
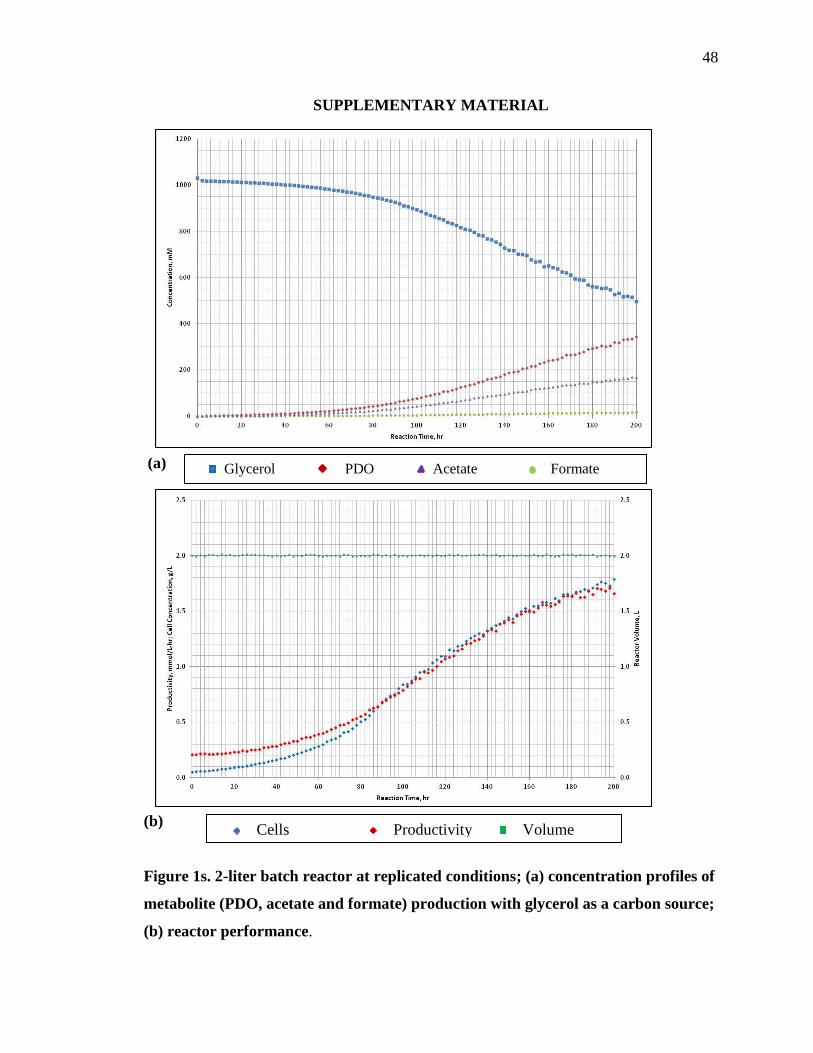
48
SUPPLEMENTARY MATERIAL
(a)
(b)
Figure 1s. 2-liter batch reactor at replicated conditions; (a) concentration profiles of
metabolite (PDO, acetate and formate) production with glycerol as a carbon source;
(b) reactor performance.
Cells Productivity Volume
Glycerol PDO Acetate Formate
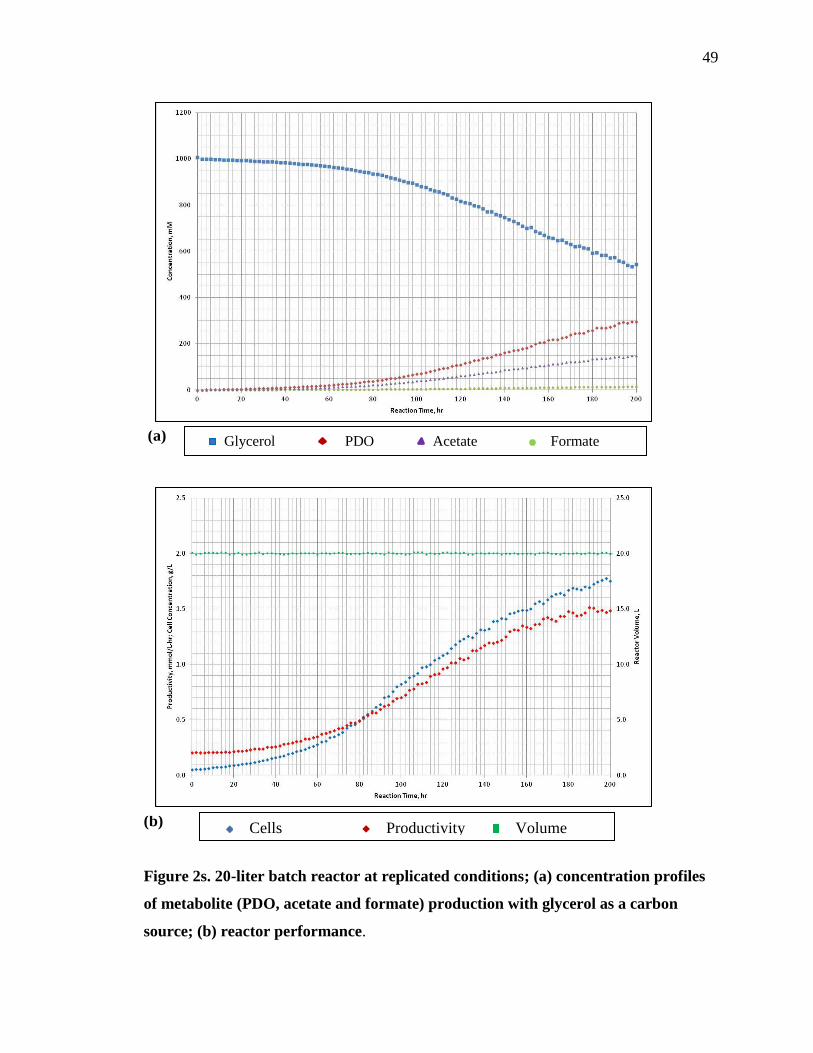
49
(a)
(b)
Figure 2s. 20-liter batch reactor at replicated conditions; (a) concentration profiles
of metabolite (PDO, acetate and formate) production with glycerol as a carbon
source; (b) reactor performance.
Glycerol PDO Acetate Formate
Cells Productivity Volume
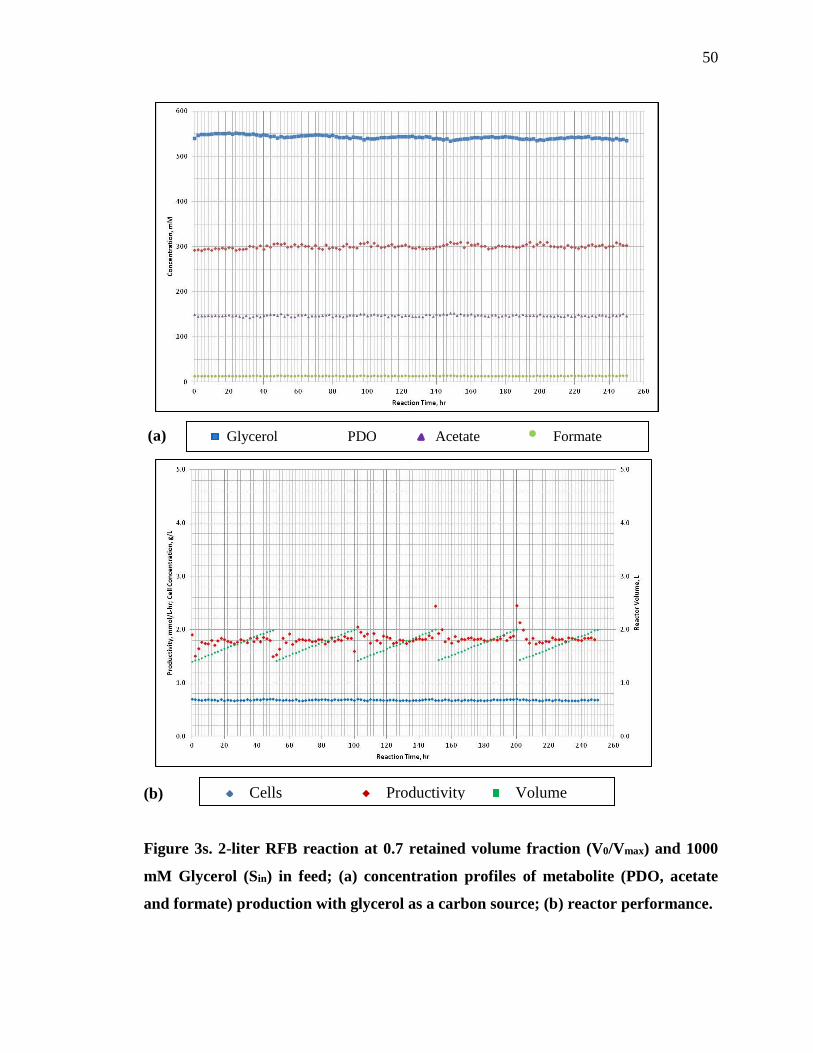
50
(a)
(b)
Figure 3s. 2-liter RFB reaction at 0.7 retained volume fraction (V0/Vmax) and 1000
mM Glycerol (Sin) in feed; (a) concentration profiles of metabolite (PDO, acetate
and formate) production with glycerol as a carbon source; (b) reactor performance.
Glycerol PDO Acetate Formate
Cells Productivity Volume

51
(a)
(b)
Figure 4s. 2-liter RFB reaction at 0.8 retained volume fraction (V0/Vmax) and 1000
mM Glycerol (Sin) in feed; (a) concentration profiles of metabolite (PDO, acetate
and formate) production with glycerol as a carbon source; (b) reactor performance.
Glycerol PDO Acetate Formate
Cells Productivity Volume

52
(a)
(b)
Figure 5s. 2-liter RFB reaction at 0.9 retained volume fraction (V0/Vmax) and 1000
mM Glycerol (Sin) in feed; (a) concentration profiles of metabolite (PDO, acetate
and formate) production with glycerol as a carbon source; (b) reactor performance.
Glycerol PDO Acetate Formate
Cells Productivity Volume

53
(a)
(b)
Figure 6s. 2-liter RFB reaction at 0.8 retained volume fraction (V0/Vmax) and 2500
mM Glycerol (Sin) in feed; (a) concentration profiles of metabolite (PDO, acetate
and formate) production with glycerol as a carbon source; (b) reactor performance.
Glycerol PDO Acetate Formate
Cells Productivity Volume

54
(a)
(b)
Figure 7s. 2-liter RFB reaction at 0.8 retained volume fraction (V0/Vmax) and 3000
mM Glycerol (Sin) in feed; (a) concentration profiles of metabolite (PDO, acetate
and formate) production with glycerol as a carbon source; (b) reactor performance.
Glycerol PDO Acetate Formate
Cells Productivity Volume

55
III. ENZYME KINETICS
This manuscript will be prepared for Journal of Biotechnology.
1. INTRODUCTION
Halanaerobium hydrogeniformans, a strict anaerobe and haloalkaliphilic
bacterium can metabolize glycerol to produce 1,3-propanediol (PDO). Mainly two
enzymes are involved in the PDO production; glycerol dehydratase and 1,3-propanediol
dehydrogenase. Glycerol dehydratase converts glycerol to 3-hydroxypropionaldehyde (3-
HPA) and 1,3-propanediol dehydrogenase reduces 3-HPA to PDO. Previously performed
batch and repeated fed-batch reactor operations confirmed production of PDO by this
bacterium. However, other by-products (acetate and formate) were also formed. In order
to have better understanding of the glycerol conversion to PDO by the bacterium, it is
essential to assess the kinetic activity of the enzymes involved.
This study is aimed at analyzing the activity of both enzymes involved in PDO
production by H. hydrogeniformans. Two approaches are proposed for performing this
study. The first approach is based on performing enzyme assays on enzyme purified from
E. coli through Histidine tagging by using the C-terminal His6 tag expression vector,
pET29a. Genes of H. hydrogeniformans involved in the PDO production were found by
using the JGI IMG database [1]. These genes are 1,3-propanediol dehydrogenase
(Halsa_0672), iron containing alcohol dehydrogenase (Halsa_2285), glycerol dehydratase
cobalamin dependent alpha subunit (Halsa_0984), dehydratase medium subunit
(Halsa_0985), dehydratase small subunit (Halsa_0986) and dehydratase reactivase factor
large subunit (Halsa_0987). 1,3-propanediol dehydrogenase catalyzes the last step of the
PDO pathway. Iron containing alcohol dehydrogenase is a non-specific enzyme that
could also catalyze the last step. For glycerol dehydratase, enzyme that catalyzes the
initial step in PDO production, H. hydrogeniformans potentially possesses four genes.
Three of the genes have been annotated for three subunits of the enzyme: alpha, medium
and small subunit. A fourth gene is annotated for a reactivase factor, essential to maintain

56
the activity of glycerol dehydratase enzyme. In order to assess these enzymes, each
protein will be purified after ligation of the gene into a C-terminal His-tag expression
vector and transformation into E. coli cells.
Another approach to perform this study, is to assay enzymes from cell free extract
obtained from H. hydrogeniformans. Bacteria will be grown in the bioreactor under batch
conditions to get high biomass and enzyme assays will be performed on lysed cells.
Quantification of enzymatic activity is essential for the enzyme characterization.
Furthermore, enzyme activity information determined from assays will be used in
modeling the dynamics of culture to maximize the PDO yield and productivity.
2. METHODOLOGY.
2.1. Enzyme assays on purified enzyme obtained through His-tagging. In
order to fully understand the biochemical properties of glycerol dehydratase and 1,3-
propanediol dehydrogenase enzymes, genes for each enzyme will be amplified and the
resulting protein will be characterized. As mentioned above, there are a total of six genes
of H. hydrogeniformans that are considered to be involved in the PDO production. For
this thesis, only one gene, Halsa_2285 was amplified and purified.
2.1.1. Molecular cloning of expression constructs. The coding sequence of
Halsa_2285 was cloned into Not1 and Sal1 restriction sites of the C-terminal His6 tag
expression vector, pET29a. For the activity analysis of enzyme, initial step was to isolate
the total genomic DNA from the bacterial culture. Halsa_2285 was amplified using PCR
performed with designed primers. Primers for each gene were designed by using
SeqBuilder feature on DNASTAR navigator software [2]. Restriction sites available on
the vector were compared with its presence on the given gene sequence. Restriction sites
for Sal1 and Not1 were selected as these enzymes do not cut within the insert. Therefore,
unique restriction sites for Sal1 and Not1 were added to the forward and reverse primer
sequence, in order to create cohesive ends in the amplified genes in a proper orientation.

57
Extra base pairs, known as leader sequence were also added to the 5’end of the primer.
The designed primers are shown in Table 1
In each primer sequence, GCGT is the leader sequence. On the forward primer,
GTCGAC is the flanking restriction sequence for Sal1 and on reverse primer,
GCGGCCGC is the restriction sequence for Not1. The melting temperature for each
primer sequence was calculated by using the formula:
Tm = 2ºC x (nA + nT) + 4ºC x (nG + nC) [3]
Table 1: Primer sequences for putative enzymes in PDO-pathway of H.
hydrogeniformans.
Gene Primer Sequences Melting temperature (Tm)
1,3-propanediol
dehydrogenase
(Halsa_0672)
Forward- 5’GCGT GTCGAC
ATG TAT GAT TAT ATG TTA
CCA AC 3’
Reverse-- 5’GCGT GCGGCCGC
TTA ATA AGC TGC TTT AAA
GAT T 3’
58ºC
60ºC
1,3-propanediol
dehydrogenase
(Halsa_2285)
Forward- 5’ GCGT GTCGAC
ATG TCC GAT TAT TAT GAT
TAT AT 3’
Reverse- 5’ GCGT GCGGCCGC
TTA AAA GGC ATC TTC
AAA TAT T 3’
56ºC
54ºC
Glycerol dehydratase
alpha subunit
(Halsa_0984)
Forward- 5’ GCGT GTCGAC
ATG GTG AAA AGG TCC
AAG CGA TTT 3’
Reverse- 5’ GCGT GCGGCCGC
60ºC
56ºC

58
TTA TTC TCC TAT TTC GTC
AAT A 3’
dehydratase medium
subunit
(Halsa_0985)
Forward- 5’ GCGT GTCGAC
ATG CAA TTA AAT GAA
GAT GCT ATT 3’
Reverse- 5’ GCGT GCGGCCGC
TTA TTT GAA TGT TAC CTC
AAC T 3’
60ºC
56ºC
dehydratase small
subunit
(Halsa_0986)
Forward- 5’ GCGT GTCGAC
ATG GAT AAA GAG TTA
GTT GAA TCT 3’
Reverse- 5’ GCGT GCGGCCGC
TTA TCT ATC ACC TTT TAG
TCT G 3’
62ºC
58ºC
Glycerol dehydratase
reactivating factor
large subunit
(Halsa_0987)
Forward- 5’ GCGT GTCGAC
ATG GAA TAT ATT GTA
GGG GTC GA 3’
Reverse- 5’ GCGT GCGGCCGC
TTA CTC ATC TAT TAC ACT
TCC C 3’
64ºC
60ºC
Amplifiaction of Halsa_2285 was performed by using the above-mentioned
primer sequences. All of the results shown in this thesis are with the same amplified
gene. The main idea behind this methodology was to purify enzyme through His-tag,
which is added via gene insertion into C-terminal His6 tag expression vector, pET29a.
However, due to the presence of a stop codon on the reverse primer sequence, translation
was inadvertently terminated before addition of His-tag at C-terminal of the protein.

59
Moreover, the sequence was not in-frame with respect to the N and C-tag in the vector.
Therefore, new primer sequences, shown in Table 2, were designed to bring sequence in-
frame and without a stop codon.
Table 2: Modified primer sequences without stop codons for putative enzymes in
PDO-pathway of H. hydrogeniformans.
Gene Primer Melting temperature (Tm)
1,3-propanediol
dehydrogenase
(Halsa_0672)
Forward- 5’GCGT GT CGA
CAA ATG TAT GAT TAT ATG
TTA CCA 3’
Reverse- 5’GCGT GCG GCC
GCA ATA AGC TGC TTT
AAA GAT TCC 3’
56ºC
56ºC
1,3-propanediol
dehydrogenase
(Halsa_2285)
Forward- 5’ GCGT GT CGA
CAA ATG TCC GAT TAT TAT
GAT TAT A 3’
Reverse- 5’ GCGT GCG GCC
GCA AAA GGC ATC TTC
AAA TAT TCT 3’
58ºC
56ºC
Glycerol dehydratase
alpha subunit
(Halsa_0984)
Forward- 5’ GCGT GT CGA
CAA GTG AAA AGG TCC
AAG CG 3’
Reverse- 5’ GCGT GCG GCC
GCA TTC TCC TAT TTC GTC
AAT ATC 3’
56ºC
58ºC
dehydratase medium
subunit
Forward- 5’ GCGT GT CGA
CCA ATG CAA TTA AAT
58ºC

60
(Halsa_0985) GAA GAT GC 3’
Reverse- 5’ GCGT GCG GCC
GCA TTT GAA TGT TAC CTC
AAC TTC 3’
54ºC
dehydratase small
subunit
(Halsa_0986)
Forward- 5’ GCGT GT CGA
CAA ATG GAT AAA GAG
TTA GTT GAA T 3’
Reverse- 5’ GCGT GCG GCC
GCA TCT ATC ACC TTT TAG
TCT GTT 3’
60ºC
58ºC
Glycerol dehydratase
reactivating factor
large subunit
(Halsa_0987)
Forward- 5’ GCGT GT CGA
CAA ATG GAA TAT ATT
GTA GGG GTC 3’
Reverse- 5’ GCGT GCG GCC
GCA CTC ATC TAT TAC ACT
TCC CTC 3’
64ºC
62ºC
PCR for Halsa_2285 using designed primers (Table 1) and Phusion high fidelity
PCR kit was performed. The PCR reaction mixture of 50 µl was prepared by adding 10 µl
of 5X reaction HF buffer, 1 µl of 10 mM dNTPs, 2.5 µl of forward primers, 2.5 µl of
reverse primers, 2 µl of template DNA, 0.5 µl of Phusion DNA polymerase and 31.5 µl
nuclease-free water. A positive control, DNA template of 1.35 Kbp and negative control,
reaction mixture without DNA, were also prepared by using the same protocol.
Amplification of genes of interest were confirmed by performing 1% agarose gel
electrophoresis. Subsequently, amplified DNA was purified by using GFX PCR DNA
purification kit system.

61
Purified amplified DNA was digested with Sal1 and Not1 restriction enzymes to
create cohesive ends. In addition, a pET29a vector was digested by using the same
restriction enzymes, so the gene of interest can be ligated into vector at specific site, in
proper orientation.
The restriction sites for Sal1 and Not1 are [4]:
The cohesive ends generation in the gene of interest and vector were confirmed
by running samples on 1% agarose gel. Before proceeding with further steps, the cut
DNA fragments were purified by using a Qiagen DNA purification kit system. Purified
gene segment was ligated into the cut His-tag expression vector pET29a. Thus, the DNA
segment was cloned at Sal1 and Not1 restriction site in 5’ to 3’ direction.
pET29a vector was chosen because of the presence of a tag of 6 Histidine residues
just after its multiple cloning site. Insertion of the gene into the multiple cloning site of
the vector adds a C-terminal tag of Histidine residues. Protein tagging enables the
purification of desired recombinant protein from a mixture of proteins by using a His-pur
cobalt spin column. pET29a vector contains a gene coding for antibiotic (kanamycin)
resistance, used as a selection marker for the transformed clones and lacI gene from lac
operon that codes for lac repressor. Moreover, multiple cloning sites arejust after T7
promoter DNA sequence, lac promotor DNA sequence and ribosome binding site.
Halsa_2285 was cloned after the T7 promotor DNA sequence which is recognized by T7
RNA polymerase coded by E. coli BL21 cells.
Sal1: Not1:
5’—G TCGAC—3’ 5’—GC GGCCGC—3’
3’—CAGCT G—5’ 3’—CGCCGG CG—5’

62
Figure 1. pET29a(+) vector (Novagen) [5]
Subsequently, transformation E. coli BL21(DE3) cells with the of pET29a
construct was performed by using theheat shock method. E. coli BL21(DE3) cells have a
gene for T7 RNA polymerase, which is under the control of lac operon [6]. Moreover, E.
coli BL21(DE3) cells are sensitive towards antibiotic kanamycin. In addition, pET29a
vectors have a resistant marker for antibiotic kanamycin. Following transformation when
E. coli cells were plated onto kanamycin-containing media, only transformed cells should
grow. Presence of Halsa_2285 in transformed clones was confirmed by performing
plasmid purification. A PCR reaction for purified plasmids with primers designed for the
Halsa_2285 (Table1) confirmed the presence of desired gene in the transformed colonies.
2.1.2. Protein expression. In transformed cells, protein expression for genes of
interest was induced by adding IPTG (isopropyl ß-D-1-thiogalactopyranoside). IPTG is a
non-hydrolyzable and structural analog for lactose. As mentioned earlier, in E. coli

63
BL21(DE3) cells, transformation of T7 RNA polymerase is under the control of the lac
operon. Moreover, within the vector, transcription of the gene of interest is under the
control of the T7 promotor (Figure 2). Therefore, the addition of IPTG to the media
enhances the transcription of T7 RNA polymerase and subsequently will induce the
protein expression of the gene of interest.
Figure 2. Modified Image for protein expression induction [7]
Bacterial cells were harvested by centrifugation. Cell pellets were suspended in
equilibrium/wash solution supplemented with protease inhibitor and
phenylmethylsulfonyl fluoride [8]. Cell suspensions were lysed by using the bead beater
homogenizer and beads of 0.1 mm diameter. Protein expression post induction was
observed by SDS PAGE analysis. SDS PAGE were performed on 8% (v/v) acrylamide
by using Bio-Rad Mini protean system.
Once protein expression is confirmed, recombinant proteins from cell lysate will
be purified using His-pur cobalt spin columns. Recombinant proteins with a string of
poly-histidine tag to their N- or C-terminus can be purified due to the binding of histidine
residues to the column. Purified recombinant proteins on the column can be eluted by
using imidazole, as it competes with histidine for binding to the column. Eluted proteins

64
would have some amount of imidazole that can interfere with the enzymatic activity.
Therefore, recombinant proteins will be purified and concentrated by using a Slide-A-
Lyzer dialysis device kit. Purity of concentrated recombinant proteins or enzymes will be
confirmed by using SDS PAGE analysis. Moreover, protein or enzyme concentrations
will be determined by using Bradford protein assay.
2.1.3. Enzyme assays. The pH, temperature and salt concentrations critical for the
activity of purified enzyme will be optimized. For pH optimization, a pH gradient
ranging from 6-12 in the enzyme assay mixture will be created. For temperature
optimization, a temperature gradient ranging from 20-40ºC in the enzyme assay mixture
will be prepared. For salt optimization, two different salts (NaCl and KCl) will be used,
and a gradient of salt concentrations ranging from 1-7% in the enzyme assay mixture will
be prepared. For each of the optimization tests, absorbance will be measured by using
spectrophotometer.
In addition, enzyme assays to determine the activity of each purified enzyme
under optimized conditions will be performed. We will perform glycerol dehydratase
enzyme assays for the activity analysis of each of the following subunits: glycerol
dehydratase cobalamin dependent alpha subunit (Halsa_0984), glycerol dehydratase
medium subunit (Halsa_0985), glycerol dehydratase small subunit (Halsa_0986), and
glycerol dehydratase reactivase factor large subunit (Halsa_0987). For glycerol
dehydratase enzyme assay, 1,2-propanediol as the substrate will be used. For this study,
one activity unit of glycerol dehydratase will be defined as the amount of enzyme
catalyzing the formation of 1 µmol of propionaldehyde in a minute [9]. Product formed
will be detected by measuring the absorbance at 305 nm by using spectrophotometer. On
the basis of this data, Km, Kcat & catalytic efficiency values for each subunit will be
calculated by using the Michaelis-Menten equation. Km measures the affinity of enzyme
for the substrate. Turnover number or Kcat measures the number of molecules of
substrate converted to product per active site per second. Catalytic efficiency is a
measurement for the efficiency of an enzyme.

65
In the case of 1,3-propanediol dehydrogenase, two enzyme assays for subunits
1,3-propanediol dehydrogenase (Halsa_0672) and iron containing alcohol dehydrogenase
(Halsa_2285) will be performed. 1,3-propanediol will be used as the substrate due to the
instability of 3-hydroxy-propionaldehyde. Henceforth, one activity unit of 1,3-
propanediol dehydrogenase will be defined as the amount of enzyme catalyzing the
formation of 1 µmol of NADH2 in a minute [10]. Product formed will be detected by
measuring the absorbance at 340 nm. On the basis of this data, we will calculate Km,
Vmax, Kcat & catalytic efficiency values for 1,3-propanediol dehydrogenase.
2.2 Enzyme assays on cell free extract.
Culture of H. hydrogeniformans were grown in a 20-liter reactor under batch
culture and anaerobic conditions. Culture conditions were maintained at a temperature of
30ºC, pH 11, and salt concentration of 7%. Anaerobic conditions were maintained by
sparging media with argon at an agitator speed of 250 rpm. Culture were grown for 7
days and collected anaerobically. Collected cells were centrifuged at 6500 rpm for 30 min
at 1ºC to collect pellets [11]. Pellets were washed with Tris buffer (1 liter; 50 mM Tris-
HCl, 2 mM DTT and 1 mM MnCl2; pH 7.4) and resuspended in the same buffer up to an
O.D. of 10 [11, 12]. Cells were lysed using a French press anaerobically. Cell lysate were
collected in glass vials and stored at -20ºC. Bicinchoninic acid (BCA) protein assay was
performed to measure the protein concentration in cell lysate. Protein expression was
visualized using SDS PAGE analysis. Optimum pH, temperature and salt conditions for
the enzymes will be determined. Enzyme assays will be performed to determine the
activity of enzyme under standard optimized conditions. Anaerobic conditions will be
maintained anaerobic for each step.
3. RESULTS
3.1. Enzyme assays on purified enzyme obtained through His-tagging.
It is suspected that a total of six genes of Halanaerobium hydrogeniformans are
involved in the PDO production. The first amplified gene was Halsa_2285 (iron-

66
containing alcohol dehydrogenase). Halsa_2285 has a molecular size of 1.29 kbp and its
amplification was confirmed by agarose gel electrophoresis, Figure 4. For PCR, a
positive control, molecular size 1.35 kbp and a negative control were also ran as shown in
the Figure 3. Five samples out of six showed gene amplification with a molecular size of
1.29 kbp.
Figure 3. Agarose gel image for PCR. Lanes labeled as 1 represents the
amplification of Halsa_2285.
The amplified DNA fragments were purified and digested by Sal1 and Not1
restriction enzymes to create cohesive ends. The restricted DNA was ligated into cut His-
tag expression vector pET29a and transformed into E. coli BL21(DE3) cells by using
heat shock method. Growth of transformed clones, plated onto agar plates containing
antibiotic kanamycin after overnight incubation, confirmed the successful transformation
of E. coli cells. The presence of Halsa_2285 in transformed clones was confirmed by
plasmid purification. Plasmids were purified from transformed clones by using a plasmid
DNA purification kit from Qiagen. A PCR reaction was performed on the purified
Ladder C-ve C+ve 1 1 1 1 1 1kbp
23.19.46.54.4
2.32.03
1.361.080.87
0.60

67
plasmids by using primers designed for Halsa_2285. In order to confirm amplification or
presence of Halsa_2285, agarose gel electrophoresis was performed. Figure 4 confirms
the presence of the gene of interest (shows a band size of 1.29 kbp) in two of the
transformed clones.
Figure 4. Agarose gel electrophoresis for PCR performed on purified plasmid.
Transformed clones that showed the presence of Halsa_2285, were utilized
further to induce the protein expression. Along with transformed clones, a control (E. coli
cells containing vector only) was also kept, in order to compare the results. Protein
expression in induced and uninduced cultures was visualized by SDS PAGE analysis on
8% separating gel, Figure 5. Samples were collected after 4 hours of adding IPTG and
overnight incubation. Halsa_2285 protein has a molecular weight of 105 kDa. Protein
expression induction was observed in both induced sample (1’) and induced control (C’),
however, for a protein with molecular weight of approximately125 kDa. There was no
induction observed for protein of interest.
Ladder C-ve C+ve Samples
kbp
23.19.46.54.4
2.32.03
1.361.080.87
0.60

68
Figure 5. SDS PAGE pattern of proteins in lysed cells. Lanes labeled as 1 are for the
uninduced samples. Lanes labeled as 1’ are for the induced samples. Lanes labeled
as C are for induced control. Lanes labeled as C’ are for induced control.
Halsa_2285 protein is an insoluble and extracellular protein. Insolubility of
protein was determined using a sequence based protein solubility evaluator software,
PROSO II [13] and extracellular using PrediSi software [14]. Initially it was thought that
the protein either due to its insolubility was being lost or it had a toxic effect on E. coli
cells due to which its production was being hindered. A solubility protocol for the
recovery of insoluble proteins was utilized, but still expression of desired protein was not
observed by using SDS PAGE. However, final analysis revealed that gene was not in-
frame with the N- and C-terminal of the vector, due to which desired protein was not
being formed. This problem was associated with the designed primer sequences (Table
1). Therefore, modified primer sequences were designed to bring gene in-frame (Table
2). The genes will be re-amplified with modified primers and analyzed for protein
expression.
Kda
250
130
100
70
Marker 1 1’ C C’ 1 1’ C C’
4 hour Overnight

69
3.2. Enzyme assays on cell free extract.
A culture of Halanaerobium hydrogeniformans has been grown in 20-liter
bioreactor under anaerobic conditions. Further steps on the grown culture are being
performed.

70
REFERENCES
1. https://img.jgi.doe.gov/cgi-bin/m/main.cgi?section=FindGenes (last accessed on April,
2017).
2. https://www.dnastar.com/t-navigator.aspx (software downloaded).
3. http://www.sciencelauncher.com/oligocalc.html (last accessed on April, 2017).
4.https://www.neb.com/tools-and-resources/selection-charts/alphabetized-list-of-
recognition-specificities 9 (last accessed on April, 2017).
5.https://www.snapgene.com/resources/plasmid_files/pet_and_duet_vectors_(novagen)/p
ET-29a(+)/ (last accessed on April, 2017).
6. Rosano GL, Ceccarelli EA. Recombinant protein expression in Escherichia coli:
advances and challenges. Frontiers in Microbiology. 2014; 5:172. DOI:10.3389/
fmicb.2014.001
7.https://www.quora.com/How-does-IPTG-induced-gene-expression-work-at-a
molecular-level. (last accessed on April, 2017)
8. Findley SD, Mormile MR, Sommer-Hurley A, et al. Activity-based metagenomic
screening and biochemical characterization of bovine ruminal protozoan Glycoside
hydrolases. Applied and Environmental Microbiology. 2011;77(22):8106-8113.
9. Daniel R, Bobik TA, Gottschalk G. Biochemistry of coenzyme B12 glycerol and diol
dehydratases and organization of the encoding genes. FEMS Microbiology Reviews.
1999; 22: 553-566.

71
10. Daniel R, Boenigk R, Gottschalk G. Purification of 1,3-propanediol dehydrogenase
from Citrobacter freundii and cloning, sequencing and overexpression of the
corresponding gene in Escherichia coli. Journal of Bacteriology. 1995; 177: 2151-2156.
11. Menzel K, Zeng A-P, Deckwer WD. Enzymatic evidence for an involvement of
pyruvate dehydrogenase in the anaerobic glycerol metabolism of Klebsiella pneumoniae.
J Biotechnol. 1997; 56:135.
12. Malaoui H, Marczak R. Separation and characterization of the 1,3-propanediol and
glycerol dehydrogenase activities from Clostridium butyricum E5 wild-type and mutant
D. J Appl Microbiol. 2001: 90(6):1006–1014
13. http://mbiljj45.bio.med.uni-muenchen.de:8888/prosoII/prosoII.seam. (last accessed
on May 2017)
14. http://www.predisi.de/ (last accessed on May, 2017)

72
SECTION
2. CONCLUSIONS
Preliminary experiments showed the ability of Halanaerobium hydrogeniformans
to convert glycerol into PDO. Media supplementation with vitamin B12 almost doubled
the production of PDO [17]. In this work, media screening tests showed that out of 24
factors tested, eight factors, glycerol, vitamin B12, pH, ammonium ion, sodium sulfide,
cysteine, iron, and cobalt, had a significant impact on PDO production. Glycerol is the
initial substrate and carbon source in the medium, therefore, its high concentration would
lead to high PDO production. Glycerol dehydratase, enzyme involved in PDO production
is a vitamin B12 dependent enzyme, which indicates the significance of vitamin B12.
Moreover, cobalt is a part of vitamin B12 structure, making it essential for PDO
production. Ammonium ions are the source of nitrogen in the medium. Sodium sulfide
and cysteine are the reducing agents that reduce the oxidation-reduction potential of the
medium. H. hydrogeniformans grows at high pH and hence, more PDO is produced under
alkaline conditions. Moreover, iron is essential for the activity of many alcohol
dehydrogenases [18]. Therefore, the resulting medium of glycerol (1000 µM), vitamin
B12 (500 µg/L)), ammonium ion (3000 µM)), cysteine (300 µM), sodium sulfide (200
µM), cobalt (100 µM), iron (50 µM) and pH (11) was used for the remaining
experiments.
The impact of scale up in reactor volume, retained volume fraction, and elevated
glycerol concentration on the reactor productivity was analyzed. Scale up studies were
performed under batch mode using 2 liter and 20 liter reactor volumes. A 2-liter
bioreactor operation resulted in a PDO concentration of 327.8 mM and a productivity of
1.67 mmol/L-hr. As reactor volume increased from 2 L to 20 L, productivity decreased
by 10% to 1.50 mmol/L-hr and PDO concentration also by 10% to 300.75 mM. However,
both productivity and PDO concentration were enhanced with repeated fed-batch
operation as compared to batch operation.

73
Environmental stresses have been reported to be associated with limiting
performances of the biological processes at large scale [18]. Moreover, simple batch
operation rarely provides maximum productivity, as the reaction conditions are not
optimal for most of the reaction time. Moreover, continuous reactor operation provides
better productivity in comparison to the batch operation [19]. Though there are
advantages associated with continuous processes, it is seldom used in industries due to
the possibility of contamination. However, advantages of a continuous process can be
achieved by operating a reactor under repeated fed-batch operation.
In repeated fed batch operations, apparent steady state conditions were achieved
within 10 cycles. Repeated fed batch operation with different retained volume fraction
showed increase in reactor productivity with increase in retained volume fraction. As the
retained volume fraction increased from 0.5 to 0.8, the PDO concentration increased by
22.2% from 265.2 mM to 324 mM, similarly, productivity increased by 26.5% from 1.55
to 1.96 mmol/L-hr. Furthermore, increase in glycerol concentration in the feed media,
enhanced the reactor productivity. As glycerol feed concentration increased from 1000
mM to 2000 mM at a retained volume fraction of 0.8, the productivity increased by
38.3% and the PDO concentration increased by 42.8%. On comparing results obtained
from repeated fed batch operation with simple batch operation, a 61.7 % increase in
productivity and a 39.2 % increase in PDO concentration was observed.
Glycerol to PDO conversion is accomplished by two enzymes: glycerol
dehydratase and 1.3-propanediol dehydrogenase. In order to study the kinetics of
enzymes of H. hydrogeniformans involved in PDO production, the gene for 1,3-
propanediol dehydrogenase (Halsa_2285) enzyme was ligated into the C-terminal His6
tag expression vector pET29a and transformed into E. coli BL21 (DE3) cells. Presence of
the gene in the transformed clones was confirmed through PCR performed on plasmids
purified from the transformed clones. Protein expression in the transformed clones was
induced by the addition of 1 mM IPTG. However, SDS PAGE analysis did not show the
expression for Halsa_2285 (molecular weight 105 KDa). It was determined that gene was
not in-frame with the N- and C-terminal of the vector, ergo the desired protein was not

74
being formed. Therefore, modified primer sequences were designed to bring the gene in-
frame. There is another ongoing approach to analyze the activity of these two enzymes,
which is to perform enzyme assays on cell free extract.
Since enzymes will be obtained from a haloalkaliphile bacterium (optimum
growth conditions; pH 11 and salt concentration 7%), optimum pH and salt concentration
for the enzymes are expected to be high. However, pH and salt concentration inside the
cell would be less as compared to the media pH and salt level. Thus, optimum pH is
expected between 9-10 and salt concentration between 2-4%. Moreover, optimum
temperature for the enzyme activity should be around 30ºC, similar to the optimum
growing temperature of the bacterium. The stability of these enzymes at extreme pH,
temperature and salt conditions could provide unique features for the application of
enzymes in crude glycerol fermentation processes at an industrial scale. These findings
would also facilitate the understanding of structural and biochemical basis of the stability
of molecules under extreme conditions.
75
BIBLIOGRAPHY
[1] https://ww2.kqed.org/quest/2014/02/13/nonrenewable-and-renewable-energy-
resources-2/. February 2017.
[2] http://www.geo.lu.lv/fileadmin/user_upload/lu_portal/projekti/gzzf/videunilgtspejiga
attistiba/VidZ1000/7.LECTURE-Energy_resources.pdf. March 2017
[3]http://www.25x25.org/index.php?option=com_content&task=view&id=16&Itemid=4
5. March 2017.
[4] http://biodiesel.org/production/production-statistics. February 2017.
[5] Anand, P.; Saxena, R.K, “A comparative study of solvent-assisted pretreatment of
biodiesel derived crude glycerol on growth and 1,3-propanediol production from
Citrobacter freundii,” in New Biotechnol. 29, 199–205. DOI: 10.1016/j.nbt.2011.05.010,
2012.
[6] Hansen, C.F.; Hernandez, A.; Mullan, B.P.; Moore, K.; Trezona-Murray, M.; King,
R.H.; Pluske, J.R, “A chemical analysis of samples of crude glycerol from the production
of biodiesel in Australia, and the effects of feeding crude glycerol to growing-finishing
pigs on performance, plasma metabolites and meat quality at slaughter,” in Anim Prod
Sci. 49, 154–161. DOI: 10.1071/EA08210, 2009.
[7] E. Celik, et al. “Use of biodiesel byproduct crude glycerol as the carbon source for
fermentation processes by recombinant Pichia pastoris,” in Ind. Eng. Chem. Res., 47, pp.
2985–2990, 2008.
[8] Chatzifragkou, A.; Papanikolaou, S.; Dietz, D.; Doulgeraki, A.; Nychas, G-J.; Zeng,
A-P. “Production of 1,3-propanediol by Clostridium butyricum growing on biodiesel-
derived crude glycerol through a non-sterilized fermentation process,” in Appl Microbiol
Biotechnol, 91, 101–112, 2011.
[9] Drożdżyńska A, Pawlicka J, Kubiak P, Kośmider A, Pranke D, Olejnik-Schmidt A, et
al. “Conversion of glycerol to 1,3-propanediol by Citrobacter freundii and Hafnia alvei -
newly isolated strains from the Enterobacteriaceae,” in N Biotechnol, 31:402–10, 2014.
http://dx.doi.org/10.1016/j.nbt.2014.04.002.
[10] Cheng, K. K.; Liu, D. H.; Sun, Y.; Liu, W. B., “1,3-Propanediol production by
Klebsiella pneumoniae under different aeration strategies,” Biotechnology Letters, 26,
911–915, 2004.
[11] Menzel, K.; Zeng, A-P.; Deckwer, W-D., “High concentration and productivity of
1,3-propanediol from continuous fermentation of glycerol by Klebsiella pneumoniae,” in
Enzyme Microb. Technol. 20, 82-86, 1997.

76
[12] Zeng, A.P.; Biebl, H., “Bulk chemicals from biotechnology: the case of 1,3-
propanediol production and the new trends,” in Adv. Biochem. Eng./Biotechnol. 74, 239-
259, 2002. DOI:10.1007/3-540-45736-4_11.
[13] Mormile, M.R., “Going from microbial ecology to genome data and back: studies on
a haloalkaliphilic bacterium isolated from Soap Lake, Washington State,” Front
Microbiol. 5, 628, 2014. DOI: 10.3389/fmicb.2014.00628.
[14] Begemann, M. B.; Mormile, M. R.; Sitton, O. C.; Wall, J. D.; Elias, D. A., “A
streamlined strategy for biohydrogen production with Halanaerobium hydrogeniformans,
an alkiliphilic bacterium,” in Front. Microbiol. 3, p.93, 2012.
DOI:10.3389/fmicb.2012.00093.
[15] Zeng AP, Biebl H., “Bulk chemicals from biotechnology: the case of 1,3-
propanediol production and the new trends,” in Adv. Biochem. Eng./Biotechnol, 74: 239-
259, 2002. doi:10.1007/3-540-45736-4_11.
[16] Kalia, S.; Trager, J.; Sitton, O.C; Mormile, M.R., “The use of a fractional factorial
design to determine the factors that impact 1,3-propanediol production from glycerol by
Halanaerobium hydrogeniformans,” in Life, 6, x, 2016. doi: FOR PEER REVIEW.
[17] Roush, D. W., “Production of 1,3-propanediol from glycerol under haloalkaline
conditions by Halanaerobium hydrogeniformans,” Master’s thesis, Missouri University
of Science and Technology, Rolla, MO. 2013.
[18] Kubiak, P.; Leja, K.; Myszka, K.; Celińska, E.; Spychała, M.; Szymanowska-
Powałowska, D.; Czaczyk, K.; Grajek, W., “Physiological predisposition of various
Clostridium species to synthetize 1,3-propanediol from glycerol,” in Proc Biochem, 2012,
47:1308–1319.
[19]https://www.generalkinematics.com/blog/batch-processing-vs-continuous-flow. May,
2017.

77
VITA
Shivani Kalia was born in Chintpurni, India. In June 2011, she received her
Bachelor of Technology degree in Biotechnology from Lovely Professional University,
Jalandhar, India. In June 2013, she received her Master of Technology degree from
Amity University, Noida, India. In Fall 2015, she joined Department of Biological
Sciences in Missouri University of Science and Technology, Rolla, USA. She joined the
Environmental Microbiology lab and worked as a Graduate Research Assistant from Fall
2015 till Summer 2016. She also worked as Graduate Teaching Assistant from Fall 2016
till Spring 2017. She received her M.S. in Applied and Environmental Biology from
Missouri University of Science and Technology, Rolla, USA, in July 2017.