Medi-Cal Managed Care Program Quality Improvement Projects ... · Medi-Cal Managed Care Program...
45
Medi-Cal Managed Care Program Quality Improvement Projects Status Report October 1, 2011 – December 31, 2011 Medi-Cal Managed Care Division California Department of Health Care Services April 2012
Transcript of Medi-Cal Managed Care Program Quality Improvement Projects ... · Medi-Cal Managed Care Program...

Medi-Cal Managed Care Program
Quality Improvement Projects Status Report
October 1, 2011 – December 31, 2011
Medi-Cal Managed Care Division California Department of Health Care Services
April 2012

QIPs Status Report: October 1, 2011 – December 31, 2011 April 2012 California Department of Health Care Services Health Services Advisory Group, Inc.
Pagei
TTAABBLLEE OOFF CCOONNTTEENNTTSS
1. EXECUTIVE SUMMARY ......................................................................................................... 1
Purpose of Report ...................................................................................................................................... 1 Scope of External Quality Review Activities Conducted ..................................................................... 1 Summary of Overall Validation Findings ................................................................................................ 2 Summary of Overall QIP Outcomes ....................................................................................................... 5 Conclusions and Recommendations ........................................................................................................ 7
2. INTRODUCTION .................................................................................................................... 8
Organization of Report .............................................................................................................................. 8 QIP Requirements ...................................................................................................................................... 8 Description of the QIP Validation Process ............................................................................................ 9
Evaluating the Overall Validity and Reliability of Study Results ............................................. 9
3. QUARTERLY QIP ACTIVITY .............................................................................................. 10
QIP Validation Activities......................................................................................................................... 10
4. SUMMARY OF FINDINGS .................................................................................................... 14
Findings Specific to the DHCS Statewide Collaborative Quality Improvement Project ............... 15 Design ...................................................................................................................................... 16 Implementation ............................................................................................................................ 16 Outcomes ...................................................................................................................................... 18 Statewide Collaborative QIP Strengths and Opportunities for Improvement ................... 19 Statewide Collaborative QIP Recommendations .................................................................... 20
Findings Specific to Small-Group Collaborative Quality Improvement Projects ........................... 20 Findings Specific to Internal Quality Improvement Projects ............................................................ 21
Design ...................................................................................................................................... 22 Implementation ............................................................................................................................ 24 Outcomes ...................................................................................................................................... 25 Internal QIP Strengths and Opportunities for Improvement ............................................... 27 Internal QIP Recommendations ................................................................................................ 27
APPENDIX A. STATUS OF ACTIVE QIPS ............................................................................ A-1
APPENDIX B. EVALUATION ELEMENT SCORING TABLES .............................................. B-1
QIPs Status Report: October 1, 2011 – December 31, 2011 April 2012 California Department of Health Care Services Health Services Advisory Group, Inc.
Page1
11.. EEXXEECCUUTTIIVVEE SSUUMMMMAARRYY
PPuurrppoossee ooff RReeppoorrtt
The California Department of Health Care Services (DHCS) is responsible for administering the Medi-Cal Managed Care Program and overseeing quality improvement activities. The DHCS requires its contracted, full-scope managed care plans, prepaid health plans, and specialty plans to conduct quality improvement projects (QIPs) to assess and improve the quality of a targeted area of clinical or nonclinical care or service provided to Medi-Cal managed care members.
This QIPs Status Report provides a summary of QIPs validated during the period of October 1, 2011, through December 31, 2011, and presents recommendations for improvement.
SSccooppee ooff EExxtteerrnnaall QQuuaalliittyy RReevviieeww AAccttiivviittiieess CCoonndduucctteedd
The DHCS contracts with Health Services Advisory Group, Inc. (HSAG) as the external quality review organization (EQRO) that validates QIP proposals and annual submissions. The Centers for Medicare & Medicaid Services (CMS) produced protocols for plans to use when conducting QIPs1 and for EQROs to use when validating QIPs.2 The EQRO reviews each QIP using the validating protocol to ensure plans design, conduct, and report QIPs in a methodologically sound manner, consistent with the protocol for conducting QIPs. As a result of this validation, the DHCS and interested parties can have confidence in reported improvements that result from the QIP.
1 U.S. Department of Health and Human Services, Centers for Medicare & Medicaid Services. EQR
Managed Care Organization Protocol. Conducting Performance Improvement Projects: A Protocol for Use in Conducting Medicaid External Quality Review Activities, Final Protocol, Version 1.0, May 2002.
Available at: http://www.cms.hhs.gov/MedicaidSCHIPQualPrac/07_Tools_Tips_and_Protocols.asp 2 U.S. Department of Health and Human Services, Centers for Medicare & Medicaid Services. EQR
Managed Care Organization Protocol. Validating Performance Improvement Projects: A Protocol for Use in Conducting Medicaid External Quality Review Activities, Final Protocol, Version 1.0, May 2002.
Available at: http://www.cms.hhs.gov/MedicaidSCHIPQualPrac/07_Tools_Tips_and_Protocols.asp

EEXXEECCUUTTIIVVEE SSUUMMMMAARRYY
QIPs Status Report: October 1, 2011 – December 31, 2011 April 2012 California Department of Health Care Services Health Services Advisory Group, Inc.
Page2
SSuummmmaarryy ooff OOvveerraallll VVaalliiddaattiioonn FFiinnddiinnggss
HSAG evaluated QIPs submitted by plans using its QIP Validation Tool, which scores the QIPs against the CMS validation protocol. Through QIP validation HSAG assesses a plan’s methodology for conducting the QIP and evaluates the overall validity and reliability of study results. The Introduction section of this report provides a detailed description of HSAG’s validation process.
HSAG provided an overall validation status of Met, Partially Met, or Not Met for each QIP submission. The DHCS requires that QIPs receive an overall Met validation status; therefore, plans must resubmit their QIP until it achieves a Met validation status, unless otherwise specified.
For the period of October 1, 2011, through December 31, 2011, HSAG reviewed 44 QIPS which included a combination of annual submissions and resubmissions. Of the 44 QIPs, 24 were submissions of the statewide collaborative QIP Reducing Avoidable Emergency Room Visits, and the remaining were internal QIPs. The figure below depicts the topics of all 44 QIPs from most frequent to least.
Figure 1-1—Medi-Cal Managed Care Program Quarterly QIP Activity October 1, 2011, through December 31, 2011
EEXXEECCUUTTIIVVEE SSUUMMMMAARRYY
QIPs Status Report: October 1, 2011 – December 31, 2011 April 2012 California Department of Health Care Services Health Services Advisory Group, Inc.
Page3
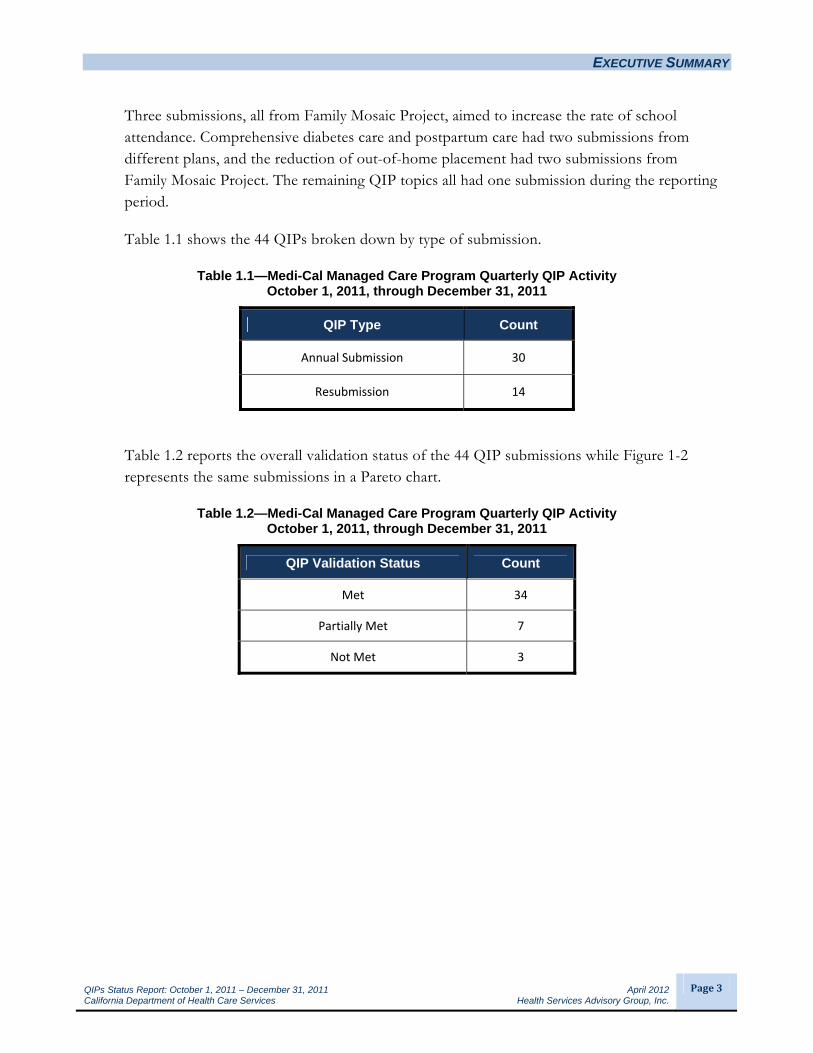
Three submissions, all from Family Mosaic Project, aimed to increase the rate of school attendance. Comprehensive diabetes care and postpartum care had two submissions from different plans, and the reduction of out-of-home placement had two submissions from Family Mosaic Project. The remaining QIP topics all had one submission during the reporting period.
Table 1.1 shows the 44 QIPs broken down by type of submission.
Table 1.1—Medi-Cal Managed Care Program Quarterly QIP Activity October 1, 2011, through December 31, 2011
QIP Type Count
Annual Submission 30
Resubmission 14
Table 1.2 reports the overall validation status of the 44 QIP submissions while Figure 1-2 represents the same submissions in a Pareto chart.
Table 1.2—Medi-Cal Managed Care Program Quarterly QIP Activity October 1, 2011, through December 31, 2011
QIP Validation Status Count
Met 34
Partially Met 7
Not Met 3

EEXXEECCUUTTIIVVEE SSUUMMMMAARRYY
QIPs Status Report: October 1, 2011 – December 31, 2011 April 2012 California Department of Health Care Services Health Services Advisory Group, Inc.
Page4
Figure 1-2—Medi-Cal Managed Care Program Quarterly QIP Activity
October 1, 2011, through December 31, 2011
Seventy-seven percent of all submissions received a Met validation status. Sixteen percent received a Partially Met status and seven percent received a Not Met status.

EEXXEECCUUTTIIVVEE SSUUMMMMAARRYY
QIPs Status Report: October 1, 2011 – December 31, 2011 April 2012 California Department of Health Care Services Health Services Advisory Group, Inc.
Page5
SSuummmmaarryy ooff OOvveerraallll QQIIPP OOuuttccoommeess
Of the 44 submissions, 39 QIPs validated during the review period progressed to a second remeasurement period and were assessed for real improvement. Statistically significant improvement is considered real improvement. Seventeen QIP submissions achieved real improvement for at least one study indicator outcome:
Alameda Alliance for Health—Alameda County, Reducing Avoidable Emergency Room Visits
Anthem Blue Cross Partnership Plan—Alameda, Contra Costa, Fresno, Sacramento, San Diego, San Francisco, San Joaquin, Santa Clara, Stanislaus, and Tulare counties, Reducing Avoidable Emergency Room Visits
CalOptima—Orange County, Improving the Rates of Cervical Cancer Screening
CenCal Health Plan—Santa Barbara County, Reducing Avoidable Emergency Room Visits
Central California Alliance for Health—Monterey and Santa Cruz counties, Reducing Avoidable Emergency Room Visits
Community Health Group—San Diego County, Increasing Follow-Up to Positive Postpartum Screens
Community Health Group—San Diego County, Reducing Avoidable Emergency Room Visits
Contra Costa Health Plan—Contra Costa County, Reducing Avoidable Emergency Room Visits
Health Net— Fresno, Kern, Los Angeles, Placer, Sacramento, San Diego, Stanislaus, and Tulare counties, Reducing Avoidable Emergency Room Visits
Health Plan of San Joaquin—San Joaquin County, Reducing Avoidable Emergency Room Visits
Inland Empire Health Plan—Riverside and San Bernardino counties, Reducing Avoidable Emergency Room Visits
Kern Family Health Care—Kern County, Reducing Avoidable Emergency Room Visits
LA Care Health Plan—Los Angeles County, Reducing Avoidable Emergency Room Visits
Partnership Health Plan—Napa/Solano/Yolo counties, Improving Care and Reducing Acute Readmissions for People With COPD
Partnership Health Plan—Napa/Solano/Yolo counties, , Reducing Avoidable Emergency Room Visits
San Francisco Health Plan—San Francisco County, Reducing Avoidable Emergency Room Visits
Santa Clara Family Health Plan —Santa Clara County, Reducing Avoidable Emergency Room Visits

EEXXEECCUUTTIIVVEE SSUUMMMMAARRYY
QIPs Status Report: October 1, 2011 – December 31, 2011 April 2012 California Department of Health Care Services Health Services Advisory Group, Inc.
Page6
Of the 39 QIPs that were assessed for real improvement, 30 were also assessed for sustained improvement. Sustained improvement is defined as improvement in performance over baseline, which is maintained or increased for at least one subsequent measurement period. Additionally, the most current measurement period’s results must reflect improvement when compared to the baseline results.
Of the 30 QIP submissions assessed for sustained improvement during the reporting period, 12 achieved sustained improvement:
Alameda Alliance for Health—Alameda County, Decrease Return Emergency Room Visits for Asthmatic Exacerbations in Children 2–18
Anthem Blue Cross Partnership Plan—Alameda, Contra Costa, Fresno, Sacramento, San Diego, San Francisco, San Joaquin, Santa Clara, Stanislaus, and Tulare counties, Reducing Avoidable Emergency Room Visits
Central California Alliance for Health—Monterey and Santa Cruz counties, Reducing Avoidable Emergency Room Visits
Community Health Group—San Diego County, Increasing Follow-Up to Positive Postpartum Screens
Community Health Group—San Diego County, Reducing Avoidable Emergency Room Visits
Health Plan of San Joaquin—San Joaquin County, Reducing Avoidable Emergency Room Visits
Inland Empire Health Plan—Riverside and San Bernardino counties, Reducing Avoidable Emergency Room Visits
Kaiser Permanente—San Diego County, Postpartum Care (two submissions)
Kern Family Health Care—Kern County, Reducing Avoidable Emergency Room Visits
Partnership Health Plan—Napa/Solano/Yolo counties, Improving Care and Reducing Acute Readmissions for People With COPD
SCAN Health Plan—Los Angeles County, Prevention of Stroke and Transient Ischemic Attack (TIA)

EEXXEECCUUTTIIVVEE SSUUMMMMAARRYY
QIPs Status Report: October 1, 2011 – December 31, 2011 April 2012 California Department of Health Care Services Health Services Advisory Group, Inc.
Page7
CCoonncclluussiioonnss aanndd RReeccoommmmeennddaattiioonnss
QIPs validated during the review period of October 1, 2011, through December 31, 2011, showed that plans continued to demonstrate strength in the design and implementation study stages as a majority (seventy-seven percent) of QIP submissions received an overall Met validation status.
The greatest areas of opportunity for improvement involve plans achieving real and sustained improvement within Activities IX and X of the QIP. Additionally, many plans required a resubmission from their initial QIP submission due to missing critical evaluation elements.
Based on a review of validation findings during the review period, HSAG provides the following recommendations:
Plans should work with HSAG to obtain technical assistance on the QIP validation feedback prior to sending their resubmission to ensure a thorough understanding of the validation feedback.
Plans should address all prior recommendations before resubmitting their QIPs.
Plans should incorporate a method to evaluate the effectiveness of each intervention and, based on the results, revise current interventions or implement new interventions to increase the likelihood of achieving statistically significant and sustained improvement.
Plans should use intervention evaluations to monitor and standardize all current and ongoing interventions.
Plans should complete barrier analysis and subgroup analysis annually, at a minimum, and develop interventions targeted to any subpopulation identified with suboptimal outcome rates that impact the overall rate.
Plans should ensure that the interpretation of the findings are accurate and complete, including the overall success of the study.
Plans should continue to monitor emergency room usage data, conduct periodic review, identify and prioritize barriers, and develop strategies to reduce avoidable emergency room visits.

QIPs Status Report: October 1, 2011 – December 31, 2011 April 2012 California Department of Health Care Services Health Services Advisory Group, Inc.
Page8
22.. IINNTTRROODDUUCCTTIIOONN
OOrrggaanniizzaattiioonn ooff RReeppoorrtt
This report has six sections:
Executive Summary––Outlines the scope of external quality review activities, provides the status of plan submissions and overall validation findings for the review period, and presents recommendations.
Introduction––Provides an overview of QIP requirements and HSAG’s QIP validation process.
Quarterly QIP Activity––Provides a table of all QIPs that HSAG validated during the review period, including evaluation element scores and the overall validation status by type of QIP.
Summary of QIP Validation Findings––Summarizes validation findings across plans related to QIP study design, study implementation, quality outcomes achieved, strengths and opportunities for improvement, and recommendations by type of QIP.
Appendix A––Includes a listing of all active QIPs and their status.
Appendix B––Provides detailed scoring tables for each evaluation element within the 10 QIP activities for the small-group collaborative (SGC) QIPs and internal QIPs (IQIPs).
QQIIPP RReeqquuiirreemmeennttss
QIPs are a federal requirement. The Code of Federal Regulations (CFR) at 42 CFR 438.2403 requires that all states operating a Medicaid managed care program ensure that their contracted plans conduct QIPs.
QIPs are a contract requirement for Medi-Cal managed care plans. The DHCS requires each of its contracted Medi-Cal managed care plans to conduct two DHCS-approved QIPs in accordance with federal requirements. Plans must always maintain two active QIPs. For full-scope plans, the statewide Medi-Cal managed care collaborative project serves as one of the two required QIPs. The second QIP can be either an IQIP or an SGC QIP involving at least three Medi-Cal managed care plans.
3 Federal Register/Vol. 67, No. 115, June 14, 2002, 2002/Rules and Regulations, p. 41109.

IINNTTRROODDUUCCTTIIOONN
QIPs Status Report: October 1, 2011 – December 31, 2011 April 2012 California Department of Health Care Services Health Services Advisory Group, Inc.
Page9
DDeessccrriippttiioonn ooff tthhee QQIIPP VVaalliiddaattiioonn PPrroocceessss
The primary objective of QIP validation is to determine each plan’s compliance with federal requirements, which include:
Measuring performance using objective quality indicators.
Implementing systematic interventions to achieve improvement in quality.
Evaluating the effectiveness of the interventions.
Planning and initiating activities to increase or sustain improvement.
Federal regulations also require that plans conduct and that an EQRO validate QIPs in a manner consistent with the CMS protocols for conducting and validating QIPs.4
The CMS protocol for validating QIPs focuses on two major areas:
Assessing the plan’s methodology for conducting the QIP.
Evaluating the overall validity and reliability of study results.
QIP validation ensures that:
Plans design, implement, and report QIPs in a methodologically sound manner.
Real improvement in quality of care and services is achievable.
Documentation complies with the CMS protocol for conducting QIPs.
Stakeholders can have confidence in the reported improvements.
EEvvaalluuaattiinngg tthhee OOvveerraallll VVaalliiddiittyy aanndd RReelliiaabbiilliittyy ooff SSttuuddyy RReessuullttss
A QIP that accurately documents CMS protocol requirements has high validity and reliability. Validity is the extent to which the data collected for a QIP measure its intent. Reliability is the extent to which an individual can reproduce the study results. For each completed QIP, HSAG assesses threats to the validity and reliability of QIP findings and determines when a QIP is no longer credible. Using its QIP Validation Tool and standardized scoring, HSAG reports the overall validity and reliability of the findings as one of the following categories:
Met = High confidence/confidence in the reported study findings.
Partially Met = Low confidence in the reported study findings.
Not Met = Reported study findings that are not credible. 4 U.S. Department of Health and Human Services, Centers for Medicare & Medicaid Services. EQR Managed
Care Organization Protocol. Conducting Performance Improvement Projects: A Protocol for Use in Conducting Medicaid External Quality Review Activities, Final Protocol, Version 1.0, May 2002, and Validating Performance Improvement Projects: A Protocol for Use in Conducting Medicaid External Quality Review Activities, Final Protocol, Version 1.0, May 2002.

QIPs Status Report: October 1, 2011 – December 31, 2011 April 2012 California Department of Health Care Services Health Services Advisory Group, Inc.
Page10
33.. QQUUAARRTTEERRLLYY QQIIPP AACCTTIIVVIITTYY
QQIIPP VVaalliiddaattiioonn AAccttiivviittiieess
HSAG reviewed 44 QIP submissions for the period of October 1, 2011, through December 31, 2011. Table 3.1 lists the QIPs by plan and subject. Additionally, the table summarizes the QIPs HSAG validated during the review period with an overall validation status of Met, Partially Met, or Not Met. Table 3.1 also displays the percentage score of evaluation elements that received a Met score as well as the percentage score of critical elements that received a Met score. Critical elements are those within the validation tool that HSAG has identified as essential for producing a valid and reliable QIP. All critical elements must receive a Met score for a QIP to receive an overall validation status of Met.

QQUUAARRTTEERRLLYY QQIIPP AACCTTIIVVIITTYY
QIPs Status Report: October 1, 2011 – December 31, 2011 April 2012California Department of Health Care Services Health Services Advisory Group, Inc.
Page11
Table 3.1—Medi-Cal Managed Care Program Quarterly QIP Activity October 1, 2011, through December 31, 2011
Plan Name and County Name of Project/Study Type of Review1
Percentage Score of
Evaluation Elements Met2
Percentage Score of Critical
Elements Met3
Overall Validation
Status4
Internal QIPs AHF Healthcare Centers—Los Angeles Advance Directives Resubmission 97% 100% Met
AHF Healthcare Centers—Los Angeles Increasing CD4 and Viral Load Testing Annual Submission 89% 100% Met
Alameda Alliance for Health—Alameda Decrease Return Emergency Room Visits for Asthmatic Exacerbations in Children 2–18
Annual Submission 89% 100% Met
CalOptima—Orange Improving the Rates of Cervical Cancer Screening
Resubmission 98% 100% Met
Care 1st—San Diego Comprehensive Diabetes Care Resubmission 85% 91% Partially Met
Central California Alliance for Health—Monterey and Santa Cruz
Improving Asthma Health Outcomes Annual Submission 70% 75% Partially Met
Community Health Group—San Diego Increasing Follow‐Up to Positive Postpartum Screens
Resubmission 98% 100% Met
Family Mosaic Project—San Francisco Increase the Rate of School Attendance Resubmission 77% 82% Not Met
Family Mosaic Project—San Francisco Increase the Rate of School Attendance Resubmission 88% 90% Not Met
Family Mosaic Project—San Francisco Increase the Rate of School Attendance Resubmission 88% 90% Partially Met
Family Mosaic Project—San Francisco Reduction of Out‐of‐Home Placement Annual Submission 78% 70% Partially Met
Family Mosaic Project—San Francisco Reduction of Out‐of‐Home Placement Resubmission 86% 70% Partially Met
Health Plan of San Mateo—San Mateo Timeliness of Prenatal Care Resubmission 94% 100% Met
Inland Empire health Plan—Riverside and San Bernardino
Attention Deficit Hyperactivity Disorder (ADHD) Management
Annual Submission 92% 100% Met
Kaiser Permanente—San Diego Postpartum Care Resubmission 79% 100% Partially Met
Kaiser Permanente—San Diego Postpartum Care Resubmission 82% 100% Met
Kern Family Health Care—Kern Comprehensive Diabetes Care Resubmission 92% 100% Met
Partnership Health Plan—Napa, Solano, and Yolo
Improving Care and Reducing Acute Readmissions for People With COPD
Resubmission 93% 100% Met

QQUUAARRTTEERRLLYY QQIIPP AACCTTIIVVIITTYY
QIPs Status Report: October 1, 2011 – December 31, 2011 April 2012California Department of Health Care Services Health Services Advisory Group, Inc.
Page12
Table 3.1—Medi-Cal Managed Care Program Quarterly QIP Activity October 1, 2011, through December 31, 2011
Plan Name and County Name of Project/Study Type of Review1
Percentage Score of
Evaluation Elements Met2
Percentage Score of Critical
Elements Met3
Overall Validation
Status4
SCAN Health Plan—Kern, Los Angeles, Orange, Riverside, San Bernardino, San Diego, and Ventura
Care for Older Adults Resubmission 100% 100% Met
SCAN Health Plan—Kern, Los Angeles, Orange, Riverside, San Bernardino, San Diego, and Ventura
Prevention of Stroke and Transient Ischemic Attack (TIA)
Annual Submission 95% 100% Met
Statewide Collaborative QIPs Alameda Alliance for Health—Alameda Reducing Avoidable Emergency Room Visits Annual Submission 97% 100% Met
Anthem Blue Cross—Alameda, Contra Costa, Fresno, Sacramento, San Francisco, San Joaquin, Santa Clara, Stanislaus, and Tulare
Reducing Avoidable Emergency Room Visits Annual Submission 97% 100% Met
CalOptima—Orange Reducing Avoidable Emergency Room Visits Annual Submission 89% 100% Met
Care 1st—San Diego Reducing Avoidable Emergency Room Visits Annual Submission 76% 100% Partially Met
CenCal Health Plan—San Luis Obispo Reducing Avoidable Emergency Room Visits Annual Submission 92% 100% Met
CenCal Health Plan—Santa Barbara Reducing Avoidable Emergency Room Visits Annual Submission 97% 100% Met
Central California Alliance for Health— Monterey and Santa Cruz
Reducing Avoidable Emergency Room Visits Annual Submission 79% 90% Not Met
Community Health Group—San Diego Reducing Avoidable Emergency Room Visits Annual Submission 97% 100% Met
Contra Costa Health Plan—Contra Costa Reducing Avoidable Emergency Room Visits Annual Submission 92% 100% Met
Health Net—Fresno, Kern, Los Angeles, Sacramento, San Diego, Stanislaus, and Tulare
Reducing Avoidable Emergency Room Visits Annual Submission 97% 100% Met
Health Plan of San Joaquin—San Joaquin Reducing Avoidable Emergency Room Visits Annual Submission 100% 100% Met
Health Plan of San Mateo—San Mateo Reducing Avoidable Emergency Room Visits Annual Submission 84% 100% Met

QQUUAARRTTEERRLLYY QQIIPP AACCTTIIVVIITTYY
QIPs Status Report: October 1, 2011 – December 31, 2011 April 2012California Department of Health Care Services Health Services Advisory Group, Inc.
Page13
Table 3.1—Medi-Cal Managed Care Program Quarterly QIP Activity October 1, 2011, through December 31, 2011
Plan Name and County Name of Project/Study Type of Review1
Percentage Score of
Evaluation Elements Met2
Percentage Score of Critical
Elements Met3
Overall Validation
Status4
Inland Empire health Plan—Riverside and San Bernardino
Reducing Avoidable Emergency Room Visits Annual Submission 95% 100% Met
Kaiser Permanente—Sacramento Reducing Avoidable Emergency Room Visits Annual Submission 87% 100% Met
Kaiser Permanente—San Diego Reducing Avoidable Emergency Room Visits Annual Submission 85% 100% Met
Kern Family Health Care—Kern Reducing Avoidable Emergency Room Visits Annual Submission 95% 100% Met
LA Care Health Plan—Los Angeles Reducing Avoidable Emergency Room Visits Annual Submission 97% 100% Met
Molina Healthcare—Riverside Reducing Avoidable Emergency Room Visits Annual Submission 89% 100% Met
Molina Healthcare—Sacramento Reducing Avoidable Emergency Room Visits Annual Submission 95% 100% Met
Molina Healthcare—San Bernardino Reducing Avoidable Emergency Room Visits Annual Submission 89% 100% Met
Molina Healthcare—San Diego Reducing Avoidable Emergency Room Visits Annual Submission 89% 100% Met
Partnership Health Plan—Napa, Solano, and Yolo
Reducing Avoidable Emergency Room Visits Annual Submission 87% 100% Met
San Francisco Health Plan—San Francisco
Reducing Avoidable Emergency Room Visits Annual Submission 92% 100% Met
Santa Clara Family Health Plan—Santa Clara
Reducing Avoidable Emergency Room Visits Annual Submission 95% 100% Met
1Type of Review—Designates the QIP review as a new proposal, annual submission, or resubmission. A resubmission means the plan was required to resubmit the QIP with updated documentation because it did not meet HSAG’s validation criteria to receive an overall Met validation status.
2Percentage Score of Evaluation Elements Met—The percentage score is calculated by dividing the total elements Met (critical and non‐critical) by the sum of the total elements of all categories (Met, Partially Met, and Not Met).
3Percentage Score of Critical Elements Met—The percentage score of critical elements Met is calculated by dividing the total critical elements Met by the sum of the critical elements Met, Partially Met, and Not Met.
4Overall Validation Status—Populated from the QIP Validation Tool and based on the percentage scores and whether critical elements were Met, Partially Met, or Not Met. *Not Applicable—Percentage scores were not applied for a small number of QIPs still in the process of final QIP submission/closeout, for which a new scoring methodology had not yet been implemented.

QIPs Status Report: October 1, 2011 – December 31, 2011 April 2012 California Department of Health Care Services Health Services Advisory Group, Inc.
Page14
44.. SSUUMMMMAARRYY OOFF FFIINNDDIINNGGSS
The CMS protocol for conducting a QIP specifies ten core activities. Rather than assessing them separately, HSAG categorizes them into three main stages to examine strengths and opportunities for improvement across key areas. For each of the three types of QIPs—SWCs, SGCs, and IQIPs—HSAG presents validation findings according to these three main study stages:
1. Design—CMS Protocol Activities I–IV
Selecting an appropriate study topic(s).
Presenting a clearly defined, answerable study question(s).
Documenting a clearly defined study indicator(s).
Stating a correctly identified study population.
2. Implementation—CMS Protocol Activities V–VII
Presenting a valid sampling technique (if sampling was used).
Specifying accurate/complete data collection procedures.
Designing/documenting appropriate improvement strategies.
3. Outcomes—CMS Protocol Activities VIII–X
Presenting sufficient data analysis and interpretation.
Reporting evidence of real improvement achieved.
Documenting data for sustained improvement achieved.
This section provides specific findings for each of the three QIP types and discusses strengths, opportunities for improvement, and recommendations. At the end of the section, HSAG also provides conclusions across all QIPs.

SSUUMMMMAARRYY OOFF FFIINNDDIINNGGSS
QIPs Status Report: October 1, 2011 – December 31, 2011 April 2012 California Department of Health Care Services Health Services Advisory Group, Inc.
Page15
FFiinnddiinnggss SSppeecciiffiicc ttoo tthhee DDHHCCSS SSttaatteewwiiddee CCoollllaabboorraattiivvee QQuuaalliittyy IImmpprroovveemmeenntt PPrroojjeecctt
The measurement period of October 1, 2011, through December 31, 2011, was the last annual submission for the statewide collaborative QIP, Reducing Avoidable Emergency Room (ER) Visits. The objective of the statewide ER collaborative was to reduce ER visits that could have been more appropriately managed by and/or referred to a primary care provider in an office or clinic setting among members 12 months of age and older.
HSAG received 24 statewide collaborative QIP submissions for validation. Of the 24 submissions all were annual submissions.
Table 4.1 provides average rates for each activity within the CMS protocols. Appendix B includes a table of scores for each evaluation element within the activities.
Table 4.1—Statewide Collaborative QIP Activity Average Rates* (N = 24 Submission)
October 1, 2011, through December 31, 2011
QIP Study Stages
Activity Met
Elements
Partially Met
Elements
Not Met Elements
Design
I: Appropriate Study Topic† 99%
(142/144) 1%
(1/144) 1%
(1/144)
II: Clearly Defined, Answerable Study Question(s) 100% (48/48)
0% (0/48)
0% (0/48)
III: Clearly Defined Study Indicator(s) 100%
(168/168) 0%
(0/168) 0%
(0/168)
IV: Correctly Identified Study Population 100% (48/48)
0% (0/48)
0% (0/48)
Implementation
V: Valid Sampling Techniques 0% (0/1)
0% (0/1)
100% (1/1)
VI: Accurate/Complete Data Collection 93%
(112/120) 3%
(3/120) 4%
(5/120)
VII: Appropriate Improvement Strategies 95%
(80/84) 5%
(4/84) 0%
(0/84)
Outcomes
VIII: Sufficient Data Analysis and Interpretation 89% (170/192)
6% (12/192)
5% (10/192)
IX: Real Improvement Achieved 75%
(71/95) 0%
(0/95) 25%
(24/95)
X: Sustained Improvement Achieved 26% (6/23)
0% (0/23)
74% (17/23)
* The activity average rate represents the average percentage of applicable elements with a Met, Partially Met, or Not Met finding across all the evaluation elements for a particular activity. See Appendix B for the number and a description of evaluation elements.
†The sum may not equal 100 percent due to rounding.

SSUUMMMMAARRYY OOFF FFIINNDDIINNGGSS
QIPs Status Report: October 1, 2011 – December 31, 2011 April 2012 California Department of Health Care Services Health Services Advisory Group, Inc.
Page16
DDeessiiggnn
QIPs submitted during this review period demonstrated excellent study design, with Activities I through IV receiving a very high percentage of evaluation elements scored Met. Most QIP submissions received 100 percent scores for all activities in the design phase.
Two QIPs received Partially Met and Not Met scores for at least one evaluation element in Activity I. Health Plan of San Mateo—San Mateo County received a Not Met score for not discussing whether members with special health care needs were included or excluded. Partnership Health Plan—Napa/Solano/Yolo counties received a Partially Met score for not including the exclusion criteria for the second study indicator. HSAG has notified the plan of this deficiency over the last two reporting periods.
QIP submissions all received perfect scores for Activities II through IV.
IImmpplleemmeennttaattiioonn
Similar to the design stage, many QIPs received Met scores for all evaluation elements in Activities V through VII.
AAccttiivviittyy VV.. VVaalliidd SSaammpplliinngg TTeecchhnniiqquueess
Activity Summary: Overall, QIPs were appropriately documented to show that sampling was not applicable.
While the statewide collaborative did not use sampling, one plan, Central California Alliance for Health, did not appropriately document that sampling was not used; therefore, this QIP was scored down to a Not Met score because the plan did not address HSAG’s prior recommendations.
AAccttiivviittyy VVII.. AAccccuurraattee//CCoommpplleettee DDaattaa CCoolllleeccttiioonn
Activity Summary: Overall, plans documented accurate and complete data collection.
Plans met most of the evaluation element criteria for accurate and complete data collection with 93 percent of the evaluation elements scored Met. Only two of the 11 elements comprising this activity were scored down. Seven plans received a Partially Met or Not Met score for one of these two evaluation elements.

SSUUMMMMAARRYY OOFF FFIINNDDIINNGGSS
QIPs Status Report: October 1, 2011 – December 31, 2011 April 2012 California Department of Health Care Services Health Services Advisory Group, Inc.
Page17
These QIPs did not display a timeline for the collection of baseline and remeasurement data.
Anthem Blue Cross—Alameda, Contra Costa, Fresno, Sacramento, San Francisco, San Joaquin, Santa Clara, Stanislaus, and Tulare counties
Central California Alliance for Health—Monterey and Santa Cruz counties
Inland Empire Health Plan—Riverside and San Bernardino counties
Kaiser Permanente—San Diego County
Partnership Health Plan—Napa/Solano/Yolo counties
These QIPs did not demonstrate administrative data collection algorithms/flow charts that show activities in the production of indicators.
Care 1st—San Diego County
Central California Alliance for Health—Monterey and Santa Cruz counties
AAccttiivviittyy VVIIII.. AApppprroopprriiaattee IImmpprroovveemmeenntt SSttrraatteeggiieess
Activity Summary: Overall, QIP demonstrated appropriate improvement strategies
Ninety-five percent of evaluation elements for Activity VII received a Met score. There were only four submissions that received a Partially Met score. The four Partially Met scores were all associated with not documenting how successful interventions would be standardized and monitored.
The four submissions that were scored down were Central California Alliance for Health— Monterey and Santa Cruz counties, Community Health Group—San Diego County, Kaiser Permanente—San Diego, and Partnership Health Plan—Napa/Solano/Yolo counties.

SSUUMMMMAARRYY OOFF FFIINNDDIINNGGSS
QIPs Status Report: October 1, 2011 – December 31, 2011 April 2012 California Department of Health Care Services Health Services Advisory Group, Inc.
Page18
OOuuttccoommeess
All QIP submissions validated during the review period progressed to a third remeasurement period with the exception of CenCal Health in San Luis Obispo County. The second remeasurement period data was reported for San Luis County because the plan expanded into this county after the collaborative QIP had begun. With the exception of this QIP, HSAG assessed Activities VIII through X to for the remainder of the submissions to determine whether the plans achieved the intended quality outcome of reducing avoidable ER visits.
AAccttiivviittyy VVIIIIII.. SSuuffffiicciieenntt DDaattaa AAnnaallyyssiiss aanndd IInntteerrpprreettaattiioonn
Activity Summary: Overall, QIP submissions provided sufficient data analysis and interpretation.
For this activity, HSAG assessed whether the plans had sufficient data analysis and interpretation of results between remeasurement periods. Overall, plans documented adequate data analysis and interpretation with 89 percent of the elements scored as Met.
However, there were eleven submissions that received either a Partially Met or Not Met for at least one element in Activity VIII. The lowest scoring evaluation element under this activity related to plans providing an inaccurate or incomplete interpretation of the study findings. Care 1st—San Diego County and Central CA Alliance for Health—Monterey and Santa Cruz counties accumulated the most Partially Met and Not Met scores out of all of the submissions with four each.
AAccttiivviittyy IIXX.. RReeaall IImmpprroovveemmeenntt AAcchhiieevveedd
Activity Summary: Overall, plans had average performance relating to real improvement between measurement periods.
For this activity, HSAG assessed whether the plans’ most recent measurement period of the quality indicators had meaningful change in performance relative to the performance observed during the prior measurement period.
Fourteen QIP submissions received a Met score for achieving statistically significant improvement in Activity IX, which demonstrated that the plans were able to reduce their avoidable ER visits. While ten submissions received a Not Met score for not showing statistical evidence that the observed improvement was true improvement, their improvement may have been due to chance and not due to any of the plans’ efforts.

SSUUMMMMAARRYY OOFF FFIINNDDIINNGGSS
QIPs Status Report: October 1, 2011 – December 31, 2011 April 2012 California Department of Health Care Services Health Services Advisory Group, Inc.
Page19
AAccttiivviittyy XX.. SSuussttaaiinneedd IImmpprroovveemmeenntt AAcchhiieevveedd
Activity Summary: Approximately twenty-six percent of QIP submissions plans achieved the desired goal of achieving sustained improvement.
Unlike Activity IX, which measured for statistically significant improvement compared to the prior measurement period, Activity X assessed for sustained improvement from baseline to the most recent measurement period.
Six submissions were able to achieve sustained improvement: Anthem Blue Cross Partnership Plan, Central California Alliance for Health, Community Health Group, Health Plan of San Joaquin, Inland Empire Health Plan, and Kern Family Health Care. For these plans, there had been a decrease in avoidable ER visits from baseline to the most recent measurement period; however, 17 QIP submissions were not able to achieve sustained improvement.
SSttaatteewwiiddee CCoollllaabboorraattiivvee QQIIPP SSttrreennggtthhss aanndd OOppppoorrttuunniittiieess ffoorr IImmpprroovveemmeenntt
The DHCS recognized that growing emergency room utilization has been a considerable concern for the increasing cost of health care. The avoidable visits to ERs have been extremely costly and care could be provided in a more appropriate setting. When possible, members should be treated by their primary care provider for non-emergency conditions in order to promote consistent, quality care.
The statewide collaborative QIP submissions demonstrated high validation scores for both the study design and study implementation phases. This suggests that plans followed the statewide collaborative QIP methodology to produce valid and reliable rates.
Health plans play an important piece in the process of member health and clinical outcomes. It must be noted that the plans’ role is limited in the ER visits process and that the member, provider, and hospital all play major roles in the process and must work cohesively to have an impact on reducing avoidable ER visits.
Plan QIPs scored lowest in the study outcomes phase. The plans’ greatest challenge was achieving real and sustained improvement. Fifty-eight percent of the QIPs demonstrated statistically significant improvement between the two most recent remeasurement years and reduced the percentage of avoidable ER visits.
As a whole, the statewide collaborative QIP did not yield the intended result of sustained improvement across all of the participating plans; however, six plans were able to achieve

SSUUMMMMAARRYY OOFF FFIINNDDIINNGGSS
QIPs Status Report: October 1, 2011 – December 31, 2011 April 2012 California Department of Health Care Services Health Services Advisory Group, Inc.
Page20
sustained improvement and positively impact their members’ ER visits by emphasizing a patient-centered medical home.
SSttaatteewwiiddee CCoollllaabboorraattiivvee QQIIPP RReeccoommmmeennddaattiioonnss
As this was the last measurement period for the QIP, the QIP is now closed. HSAG recommends that plans continue to focus improvement strategies on reducing avoidable ER visits through system, provider, and member interventions. Although the DHCS and HSAG will not be tracking this measure in the future as part of the formal QIP process, HSAG recommends that the plans continue to do the following:
Monitor ER usage data.
Conduct quarterly data reviews.
Identify and prioritize barriers.
Continue to work with hospitals, providers and members to develop strategies to reduce avoidable ER visits.
FFiinnddiinnggss SSppeecciiffiicc ttoo SSmmaallll--GGrroouupp CCoollllaabboorraattiivvee QQuuaalliittyy IImmpprroovveemmeenntt PPrroojjeeccttss
There were no small group collaborative QIPs validated during the measurement period.

SSUUMMMMAARRYY OOFF FFIINNDDIINNGGSS
QIPs Status Report: October 1, 2011 – December 31, 2011 April 2012 California Department of Health Care Services Health Services Advisory Group, Inc.
Page21
FFiinnddiinnggss SSppeecciiffiicc ttoo IInntteerrnnaall QQuuaalliittyy IImmpprroovveemmeenntt PPrroojjeeccttss
For the period of October 1, 2011, through December 31, 2011, HSAG reviewed 20 IQIP submissions. Fourteen were resubmissions and six were annual submissions.
Table 4.2 provides average rates for each activity within the CMS protocols. Appendix B includes a table of scores for each evaluation element within the activities.
Table 4.2—Internal QIP Activity Average Rates* (N = 20 Submission) October 1, 2011, through December 31, 2011
QIP Study Stages
Activity Met
Elements
Partially Met
Elements
Not Met Elements
Design
I: Appropriate Study Topic 99% (115/116)
0% (0/116)
1% (1/116)
II: Clearly Defined, Answerable Study Question(s) 95% (38/40)
5% (2/40)
0% (0/40)
III: Clearly Defined Study Indicator(s) 98% (117/119)
2% (2/119)
0% (0/119)
IV: Correctly Identified Study Population† 92% (55/60)
7% (4/60)
2% (1/60)
Implementation
V: Valid Sampling Techniques 100% (30/30)
0% (0/30)
0% (0/30)
VI: Accurate/Complete Data Collection 92% (129/140)
4% (5/140)
4% (6/140)
VII: Appropriate Improvement Strategies 96% (54/56)
2% (1/56)
2% (1/56)
Outcomes
VIII: Sufficient Data Analysis and Interpretation 75% (96/128)
16% (20/128)
9% (12/128)
IX: Real Improvement Achieved 56% (29/52)
13% (7/52)
31% (16/52)
X: Sustained Improvement Achieved 86% (6/7)
0% (0/7)
14% (1/7)
* The activity average rate represents the average percentage of applicable elements with a Met, Partially Met, or Not Met finding across all the evaluation elements for a particular activity. See Appendix B for the number and a description of evaluation elements.
†The sum may not equal 100 percent due to rounding.

SSUUMMMMAARRYY OOFF FFIINNDDIINNGGSS
QIPs Status Report: October 1, 2011 – December 31, 2011 April 2012 California Department of Health Care Services Health Services Advisory Group, Inc.
Page22
Thirteen of the 20 IQIP submissions validated during the review period progressed to a first remeasurement period and were assessed for real (statistically significant) improvement. Of those 13 QIP submissions, seven submissions progressed to at least a second remeasurement period and were assessed for sustained improvement. These included:
Alameda Alliance for Health—Alameda County, Decrease Return Emergency Room Visits for Asthmatic Exacerbations in Children 2–18
Community Health Group—San Diego County, Increase Follow-up to Positive Postpartum Screens
Kaiser Permanente—San Diego County, Postpartum Care (2 submissions)
Kern Family Health Care—Kern County, Comprehensive Diabetes Care
Partnership Health Plan—Napa/Solano/Yolo counties, Improving Care and Reducing Acute Readmissions for People With COPD
SCAN Health Plan—Kern, Los Angeles, Orange, Riverside, San Bernardino, San Diego, and Ventura counties, Prevention of Stroke and Transient Ischemic Attack (TIA)
DDeessiiggnn
IQIP validation findings for Activities I through IV include the following:
AAccttiivviittyy II.. AApppprroopprriiaattee SSttuuddyy TTooppiicc
Activity Summary: Overall, the plans met the criteria for the evaluation elements within Activity I.
Only one submission, Central California Alliance for Health—Monterey and Santa Cruz counties, Improving Asthma Health Outcomes QIP received a Not Met score for not discussing the eligible population in its submission.
AAccttiivviittyy IIII.. CClleeaarrllyy DDeeffiinneedd,, AAnnsswweerraabbllee SSttuuddyy QQuueessttiioonn((ss))
Activity Summary: Overall, QIPs had a clearly defined and answerable study question.
Ninety-five percent of the evaluation elements in Activity II received a Met score. No QIP submissions scored a Not Met for either of the elements in Activity II, showing that plans were able to submit clearly defined and answerable study questions.

SSUUMMMMAARRYY OOFF FFIINNDDIINNGGSS
QIPs Status Report: October 1, 2011 – December 31, 2011 April 2012 California Department of Health Care Services Health Services Advisory Group, Inc.
Page23
Only two submissions (both were Family Mosaic Project—San Francisco County, Reduction of Out of Home Placement) received a Partially Met for not stating the study question(s) in simple terms.
AAccttiivviittyy IIIIII.. CClleeaarrllyy DDeeffiinneedd SSttuuddyy IInnddiiccaattoorr((ss))
Activity Summary: Overall, QIP submissions met the evaluation elements for clearly defined study indicators.
Just as in Activity II, QIPs scored well on Activity III and there were no elements that were scored less than Partially Met. Only two submissions (both Family Mosaic Project—San Francisco County, Reduction of Out-of-Home Placement) received a Partially Met for not having well-defined, objective, and measureable study indicator(s).
AAccttiivviittyy IIVV.. CCoorrrreeccttllyy IIddeennttiiffiieedd SSttuuddyy PPooppuullaattiioonn
Activity Summary: Overall, QIP submissions had correctly identified study populations.
Ninety-two percent of the applicable elements for Activity IV received a Met score, which demonstrates that plans are able to correctly identify and document the QIP study population. Three elements comprised Activity IV:
Study population is accurately and completely defined.
QIP includes requirements for the length of a member’s enrollment.
Study population captures all members to whom the study question applies.
Three submissions (Central California Alliance for Health—Monterey and Santa Cruz counties, Improving Asthma Health Outcomes and two submissions for Family Mosaic Project—San Francisco County, Reduction of Out-of-Home Placement) did not receive a Met score for at least one of the three elements. The most commonly scored-down element was due to an inaccurate or incomplete study population definition.

SSUUMMMMAARRYY OOFF FFIINNDDIINNGGSS
QIPs Status Report: October 1, 2011 – December 31, 2011 April 2012 California Department of Health Care Services Health Services Advisory Group, Inc.
Page24
IImmpplleemmeennttaattiioonn
HSAG assessed all but one (Central California Alliance for Health—Monterey and Santa Cruz counties, Improving Asthma Health Outcomes) IQIP submissions through Activity VII.
AAccttiivviittyy VV.. VVaalliidd SSaammpplliinngg TTeecchhnniiqquueess
Activity Summary: QIPs using sampling demonstrated excellent results.
For a majority of QIPs, sampling techniques were not used in the study; however, for the five submissions where sampling was applicable; all scored 100 percent Met for all six elements in Activity V. The five QIPs were:
Cal Optima—Orange County, Improve the Rates of Cervical Cancer Screening
Community Health Group—San Diego County, Increasing Follow-Up to Positive Postpartum Screens
Health Plan of San Mateo—San Mateo County, Timeliness of Prenatal Care
Kern Family Health Care—Kern County, Comprehensive Diabetes Care
SCAN Health Plan—Kern, Los Angeles, Orange, Riverside, San Bernardino, San Diego, and Ventura counties, Prevention of Stroke and Transient Ischemic Attack (TIA)
AAccttiivviittyy VVII.. AAccccuurraattee//CCoommpplleettee DDaattaa CCoolllleeccttiioonn
Activity Summary: Overall, QIPs demonstrated accurate and completed data collection.
As a whole, IQIP submissions were able to produce accurate and complete data as 92 percent of the elements were scored Met. However, eight percent of the elements were scored either Partially Met or Not Met, which means that the submissions did show some deficiencies in the data collection.
Four QIP submissions received a Partially Met or Not Met score for not including a complete timeline for the collection of baseline and remeasurement data.

SSUUMMMMAARRYY OOFF FFIINNDDIINNGGSS
QIPs Status Report: October 1, 2011 – December 31, 2011 April 2012 California Department of Health Care Services Health Services Advisory Group, Inc.
Page25
AAccttiivviittyy VVIIII.. AApppprroopprriiaattee IImmpprroovveemmeenntt SSttrraatteeggiieess
Activity Summary: Overall, QIP submissions demonstrated effective improvement strategies.
Ninety-six percent of the elements for Activity VII received a Met score, revealing that QIP submissions documented effective improvement strategies. Of the four elements on Activity VII, only two submissions received a Partially Met or Not Met score for one element each.
Alameda Alliance for Health—Alameda County, Decrease Return Emergency Room Visits for Asthmatic Exacerbations in Children 2–18 received a Not Met for not revising its improvement strategy after the original strategy proved to be unsuccessful.
SCAN Health Plan—Kern, Los Angeles, Orange, Riverside, San Bernardino, San Diego and Ventura counties, Prevention of Stroke and Transient Ischemic Attack (TIA) received a Partially Met score for the lack of sufficient documentation to show how the plan’s successful interventions were standardized and monitored.
OOuuttccoommeess
AAccttiivviittyy VVIIIIII.. SSuuffffiicciieenntt DDaattaa AAnnaallyyssiiss aanndd IInntteerrpprreettaattiioonn
Activity Summary: QIP submissions had mixed results for providing sufficient data analysis and interpretation.
For this activity, HSAG assessed whether the plans had sufficient data analysis and interpretation of results between remeasurement periods. Four QIP submissions received a Met score for all nine of the elements in Activity VIII:
Cal Optima—Orange County, Improve the Rates of Cervical Cancer Screening
Community Health Group—San Diego County, Increase Follow-Up to Positive Postpartum Screens
Health Plan of San Mateo—San Mateo County, Timeliness of Prenatal Care
Kern Family Health Care—Kern County, Comprehensive Diabetes Care
The remaining submissions all had at least one element receive a Partially Met or Not Met score. Family Mosaic Project and Kaiser Permanente—San Diego County both had two submissions for the same QIP during the reporting period. Each plan’s second submission had several elements that remained Partially Met or Not Met showing that these plans were unable or unwilling to address the deficiencies identified in the first submission. Seven submissions did not include an accurate and/or complete interpretation of the findings.

SSUUMMMMAARRYY OOFF FFIINNDDIINNGGSS
QIPs Status Report: October 1, 2011 – December 31, 2011 April 2012 California Department of Health Care Services Health Services Advisory Group, Inc.
Page26
AAccttiivviittyy IIXX.. RReeaall IImmpprroovveemmeenntt AAcchhiieevveedd
Activity Summary: Fifty-six percent of IQIP submissions demonstrated statistically significant improvement between measurement periods.
A total of 13 QIP submissions were evaluated through Activity IX. Of those 13 submissions, none earned a Met score on all four elements in Activity IX. Ten plans reported improvement for at least one of their study indicator outcomes; however, the improvement was potentially due to chance. Only three plans demonstrated statistically significant improvement for at least one study indicator outcome. Statistically significant improvement is considered true improvement and reflects a positive effect on the members’ care.
AAccttiivviittyy XX.. SSuussttaaiinneedd IImmpprroovveemmeenntt AAcchhiieevveedd
Activity Summary: Seven IQIP submissions progressed to the point of assessment for sustained improvement and six submissions received a Met score.
Unlike Activity IX, which measured for statistically significant improvement between the two most recent measurement periods, Activity X assessed for sustained improvement from baseline to the final remeasurement period. Sustained improvement is defined as improvement in performance over baseline, which is maintained or increased for at least one subsequent measurement period. Additionally, the most current measurement period’s results must reflect improvement when compared to the baseline results.
Of the seven QIP submissions assessed for sustained improvement, six submissions achieved sustained improvement. Overall, the progression of these QIPs has led to improved health outcomes for the targeted study populations:
Reduction in the ER visits for Alameda Alliance for Health—Alameda County children with asthmatic exacerbations.
An increase in follow-up to postpartum depression screens for members of Community Health Group in San Diego County.
Increased rate of postpartum care within the first 21–56 days after delivery for Kaiser Permanente—San Diego County (two submissions).
An increase in members with COPD who received appropriate spirometry testing, and a reduction in the number of hospital discharges and emergency room visits for Partnership— Napa/Solano/Yolo counties.

SSUUMMMMAARRYY OOFF FFIINNDDIINNGGSS
QIPs Status Report: October 1, 2011 – December 31, 2011 April 2012 California Department of Health Care Services Health Services Advisory Group, Inc.
Page27
An increase in the prevention of stroke/TIA among SCAN Health Plan—Kern, Los Angeles, Orange, Riverside, San Bernardino, San Diego, and Ventura counties high-risk members.
The only submission that received a Not Met score was Kern Family Health Care—Kern County, Comprehensive Diabetes Care, as sustained improvement was not achieved for any of the three indicator outcomes in its QIP.
IInntteerrnnaall QQIIPP SSttrreennggtthhss aanndd OOppppoorrttuunniittiieess ffoorr IImmpprroovveemmeenntt
Similar to the last reporting period, plans demonstrated aptitude with the design and implementation phases for QIPs, as evidenced by the high percentage of Met evaluation elements for this review period, October 1, 2011, through December 31, 2011. The percentages of QIPs achieving a Met score for sustained improvement increased by eleven percentage points from the last measurement period.
The two main opportunities for improvement were related to QIP outcomes. In general, QIPs lacked accurate and complete interpretation of findings and had low performance as related to achieving real improvement.
IInntteerrnnaall QQIIPP RReeccoommmmeennddaattiioonnss
Many plans required a resubmission from their initial annual submissions, which could have been avoided by incorporating the recommendations provided in the prior year’s QIP validation feedback. Plans do not always apply the knowledge gained from prior review periods as they relate to the requirements for the critical evaluation elements. Plans should focus on HSAG’s previous recommendations prior to resubmitting their QIPs.
Barrier analysis and subgroup analysis should be completed annually, at a minimum. Plans should prioritize barriers and address the barriers affecting the highest proportion of the study population. Plans should develop interventions targeted to any subpopulation identified with a suboptimal outcome affecting the overall rates.
Plans should incorporate a method to evaluate the effectiveness of each intervention and, based on the results, revise current interventions or implement new interventions.

QIPs Status Report: October 1, 2011 – December 31, 2011 CA2011-12_QIP_Qtr_10-1 to 12-31-11_F1_0412 California Department of Health Care Services Health Services Advisory Group, Inc.
PageA‐1
AAppppeennddiixx AA.. SSTTAATTUUSS OOFF AACCTTIIVVEE QQIIPPSS
Appendix A presents the status of the following types of active QIPs:
The DHCS Statewide Collaborative QIP Small-Group Collaborative QIPs Internal QIPs

SSTTAATTUUSS OOFF AACCTTIIVVEE QQIIPPSS
QIPs Status Report: October 1, 2011 – December 31, 2011 CA2011-12_QIP_Qtr_10-1 to 12-31-11_F1_0412 California Department of Health Care Services Health Services Advisory Group, Inc.
PageA‐2
Table A.1––The DHCS Statewide Collaborative QIPs October 1, 2011, through December 31, 2011
(*See page A-10 for grid category explanations.)
Plan Name and County Plan
Model Type
Clinical/ Nonclinical
QIP Description Level of QIP Progress
Steps Validated
Measurement Completion
Name of Project/Study: Reducing Avoidable Emergency Room Visits
Alameda Alliance for Health—Alameda LI Clinical Reduce the number of members 1 year of age and older who use the emergency room for a visit that could have been more appropriately managed in an office or a clinic setting.
I – XClosed
Remeasurement 3
Anthem Blue Cross—
Alameda, Contra Costa, Fresno, San Francisco, San Joaquin, Santa Clara
Sacramento
Stanislaus, Tulare
CP
GMC
LI
I – XClosed
Remeasurement 3
CalOptima—Orange COHS I – XClosed
Remeasurement 3
Care 1st Partner Plan—San Diego GMC I – XClosed
Remeasurement 3
CenCal Health Plan—Santa Barbara COHS I – XClosed
Remeasurement 3
CenCal Health Plan—San Luis Obispo COHS I – IX
Remeasurement 2
Central California Alliance for Health—
Monterey, Santa Cruz COHS
I – XClosed
Remeasurement 3
Community Health Group—San Diego GMC I – XClosed
Remeasurement 3
Contra Costa Health Plan—Contra Costa LI I – XClosed
Remeasurement 3
Health Net—
Fresno, Kern, Los Angeles, Stanislaus, Tulare
Sacramento, San Diego
CP
GMC
I – XClosed
Remeasurement 3

SSTTAATTUUSS OOFF AACCTTIIVVEE QQIIPPSS
QIPs Status Report: October 1, 2011 – December 31, 2011 CA2011-12_QIP_Qtr_10-1 to 12-31-11_F1_0412 California Department of Health Care Services Health Services Advisory Group, Inc.
PageA‐3
Table A.1––The DHCS Statewide Collaborative QIPs October 1, 2011, through December 31, 2011
(*See page A-10 for grid category explanations.)
Plan Name and County Plan
Model Type
Clinical/ Nonclinical
QIP Description Level of QIP Progress
Steps Validated
Measurement Completion
Name of Project/Study: Reducing Avoidable Emergency Room Visits
Health Plan of San Joaquin—San Joaquin LI Clinical Reduce the number of members 1 year of age and older who use the emergency room for a visit that could have been more appropriately managed in an office or a clinic setting.
I – XClosed
Remeasurement 3
Health Plan of San Mateo—San Mateo COHS I – XClosed
Remeasurement 3
Inland Empire Health Plan—Riverside, San
Bernardino
LI I – XClosed
Remeasurement 3
Kaiser Permanente—Sacramento GMC I – XClosed
Remeasurement 3
Kaiser Permanente—San Diego GMC I – XClosed
Remeasurement 3
Kern Family Health Care—Kern LI I – XClosed
Remeasurement 3
L A Care Health Plan—Los Angeles LI I – XClosed
Remeasurement 3
Molina Healthcare— Riverside, San Bernardino
Sacramento, San Diego
CP
GMC
I – XClosed
Remeasurement 3
Partnership Health Plan—Napa, Solano, Yolo COHS I – XClosed
Remeasurement 3
San Francisco Health Plan—San Francisco LI I – XClosed
Remeasurement 3
Santa Clara Family Health Plan—Santa Clara LI I – XClosed
Remeasurement 3

SSTTAATTUUSS OOFF AACCTTIIVVEE QQIIPPSS
QIPs Status Report: October 1, 2011 – December 31, 2011 CA2011-12_QIP_Qtr_10-1 to 12-31-11_F1_0412 California Department of Health Care Services Health Services Advisory Group, Inc.
PageA‐4
Table A.2––Small-Group Collaborative QIPs October 1, 2011, through December 31, 2011
(*See page A-10 for grid category explanations.)
Plan Name and County Plan
Model Type
Name of Project/Study Clinical/
Nonclinical QIP Description
Level of QIP Progress
Steps Validated
Measurement Completion
NA NA NA NA NA NA

SSTTAATTUUSS OOFF AACCTTIIVVEE QQIIPPSS
QIPs Status Report: October 1, 2011 – December 31, 2011 CA2011-12_QIP_Qtr_10-1 to 12-31-11_F1_0412 California Department of Health Care Services Health Services Advisory Group, Inc.
PageA‐5
Table A.3––Internal QIPs
October 1, 2011, through December 31, 2011 (*See page A-10 for grid category explanations.)
Plan Name and County Plan
Model Type
Name of Project/Study Clinical/
Nonclinical QIP Description
Level of QIP Progress
Steps Validated
Measurement Completion
AHF Healthcare Centers—Los Angeles
SP Advance Directives Nonclinical Improve the rate of members who have an advance directive document or documented discussion of advance directives
VIII Remeasurement 1
AHF Healthcare Centers—Los Angeles
SP Increasing CD4 and Viral Load Testing
Clinical Increase the percentage of members who receive CD4 and Viral Load tests
IX Remeasurement 1
Alameda Alliance for Health—Alameda
LI Decrease Return Emergency Room Visits for Asthmatic Exacerbations in Children
Clinical Reduce the number of children 2–18 years of age who visit the ER with asthma and return to the ER with additional asthmatic events
I – XClosed
Remeasurement 3
Anthem Blue Cross Partnership Plan—Alameda
CP Postpartum Care Clinical Improve the rate of postpartum care visits
IX Remeasurement 1
Anthem Blue Cross Partnership Plan—Contra Costa
CP Postpartum Care Clinical Improve the rate of postpartum care visits
IX Remeasurement 1
Anthem Blue Cross Partnership Plan—Fresno
CP Postpartum Care Clinical Improve the rate of postpartum care visits
IX Remeasurement 1
Anthem Blue Cross Partnership Plan—Sacramento
GMC Postpartum Care Clinical Improve the rate of postpartum care visits
IX Remeasurement 1
Anthem Blue Cross Partnership Plan—San Francisco
CP Postpartum Care Clinical Improve the rate of postpartum care visits
IX Remeasurement 1
Anthem Blue Cross Partnership Plan—San Joaquin
CP Postpartum Care Clinical Improve the rate of postpartum care visits
IX Remeasurement 1
Anthem Blue Cross Partnership Plan—Santa Clara
CP Postpartum Care Clinical Improve the rate of postpartum care visits
IX Remeasurement 1

SSTTAATTUUSS OOFF AACCTTIIVVEE QQIIPPSS
QIPs Status Report: October 1, 2011 – December 31, 2011 CA2011-12_QIP_Qtr_10-1 to 12-31-11_F1_0412 California Department of Health Care Services Health Services Advisory Group, Inc.
PageA‐6
Table A.3––Internal QIPs October 1, 2011, through December 31, 2011
(*See page A-10 for grid category explanations.)
Plan Name and County Plan
Model Type
Name of Project/Study Clinical/
Nonclinical QIP Description
Level of QIP Progress
Steps Validated
Measurement Completion
Anthem Blue Cross Partnership Plan—Stanislaus
LI Postpartum Care Clinical Improve the rate of postpartum care visits
IX Remeasurement 1
Anthem Blue Cross Partnership Plan—Tulare
LI Postpartum Care Clinical Improve the rate of postpartum care visits
IX Remeasurement 1
CalOptima—Orange COHS Improving the Rates of Cervical Cancer Screening
Clinical Improve the rate of cervical cancer screening
IX Remeasurement 1
Care 1st—San Diego GMC Comprehensive Diabetes Care
Clinical Improve the rate of comprehensive diabetes care
VIII Proposal
CenCal Health Plan—San Luis Obispo
COHS Weight Assessment andCounseling for Nutrition and Physical Activity for Children/Adolescents
Clinical Increase the documentation rates of BMI percentile, counseling or referral for nutrition education and physical activity
IX Remeasurement 1
CenCal Health Plan—Santa Barbara
COHS Weight Assessment and Counseling for Nutrition and Physical Activity for Children/Adolescents
Clinical Increase the documentation rates of BMI percentile, counseling or referral for nutrition education and physical activity
X Remeasurement 2
Central California Alliance for Health—Monterey, Santa Cruz
COHS Improving Asthma Health Outcomes
Clinical Decrease the rate of ER admissions for members with persistent asthma
VI Proposal
Community Health Group—San Diego
GMC Postpartum Care Clinical Increase the percentage of women being screened for postpartum depression
X Remeasurement 3
Contra Costa Health Plan—Contra Costa
LI Reducing Health Disparities ‐ Childhood Obesity
Clinical Increase rates of provider documentation of BMI percentiles, counseling for nutrition, and counseling for physical activity for children
IX Remeasurement 1

SSTTAATTUUSS OOFF AACCTTIIVVEE QQIIPPSS
QIPs Status Report: October 1, 2011 – December 31, 2011 CA2011-12_QIP_Qtr_10-1 to 12-31-11_F1_0412 California Department of Health Care Services Health Services Advisory Group, Inc.
PageA‐7
Table A.3––Internal QIPs October 1, 2011, through December 31, 2011
(*See page A-10 for grid category explanations.)
Plan Name and County Plan
Model Type
Name of Project/Study Clinical/
Nonclinical QIP Description
Level of QIP Progress
Steps Validated
Measurement Completion
Family Mosaic Project—San Francisco
SP Increase the Rate of School Attendance
Nonclinical Increase the rate of school attendance
VIII Baseline
Family Mosaic Project—San Francisco
SP Reduction of Out of Home Placement
Clinical Reduce the occurrences of out of home placement
IX Remeasurement 1
Health Net—Fresno CP Improve Cervical Cancer Screening Among Seniors and Persons With Disabilities
Clinical Improve cervical cancer screening among seniors and persons with disabilities
IX Remeasurement 1
Health Net—Kern CP Improve Cervical Cancer Screening Among Seniors and Persons With Disabilities
Clinical Improve cervical cancer screening among seniors and persons with disabilities
IX Remeasurement 1
Health Net—Los Angeles CP Improve Cervical Cancer Screening Among Seniors and Persons With Disabilities
Clinical Improve cervical cancer screening among seniors and persons with disabilities
IX Remeasurement 1
Health Net—Sacramento GMC Improve Cervical Cancer Screening Among Seniors and Persons With Disabilities
Clinical Improve cervical cancer screening among seniors and persons with disabilities
IX Remeasurement 1
Health Net—San Diego GMC Improve Cervical Cancer Screening Among Seniors and Persons With Disabilities
Clinical Improve cervical cancer screening among seniors and persons with disabilities
IX Remeasurement 1
Health Net—Stanislaus CP Improve Cervical Cancer Screening Among Seniors and Persons With Disabilities
Clinical Improve cervical cancer screening among seniors and persons with disabilities
IX Remeasurement 1

SSTTAATTUUSS OOFF AACCTTIIVVEE QQIIPPSS
QIPs Status Report: October 1, 2011 – December 31, 2011 CA2011-12_QIP_Qtr_10-1 to 12-31-11_F1_0412 California Department of Health Care Services Health Services Advisory Group, Inc.
PageA‐8
Table A.3––Internal QIPs October 1, 2011, through December 31, 2011
(*See page A-10 for grid category explanations.)
Plan Name and County Plan
Model Type
Name of Project/Study Clinical/
Nonclinical QIP Description
Level of QIP Progress
Steps Validated
Measurement Completion
Health Net—Tulare CP Improve Cervical Cancer Screening Among Seniors and Persons With Disabilities
Clinical Improve cervical cancer screening among seniors and persons with disabilities
IX Remeasurement 1
Health Plan of San Joaquin—San Joaquin
LI Improving the Percentage Rate of HbA1c Testing
Clinical Improve the percentage rate of HbA1c testing
VIII Baseline
Health Plan of San Mateo—San Mateo
COHS Timeliness of Prenatal Care Clinical Increase the rate of first prenatal visits occurring within the first trimester of pregnancy
IX Remeasurement 1
Inland Empire Health Plan—Riverside, San Bernardino
LI Attention Deficit Hyperactivity Disorder (ADHD) Management
Clinical Improve the percentage of follow‐up visits for members who are prescribed ADHD medications
IX Remeasurement 1
Kaiser Permanente—Sacramento
GMC Childhood Obesity Clinical Increase the documentation rates of BMI percentile, counseling or referral for nutrition education and physical activity for children
IX Remeasurement 1
Kaiser Permanente—San Diego GMC Postpartum Care Clinical Increase the rate of postpartum care within the first 21–56 days after delivery
IX Remeasurement 1
Kern Family Health Care—Kern LI Comprehensive Diabetes Care
Clinical Increase compliance with the American Diabetes Association (ADA) preventive care tests/screenings guidelines, specifically related to HbA1c testing, LDL‐C screening, and retinal eye exams
XClosed
Remeasurement 2

SSTTAATTUUSS OOFF AACCTTIIVVEE QQIIPPSS
QIPs Status Report: October 1, 2011 – December 31, 2011 CA2011-12_QIP_Qtr_10-1 to 12-31-11_F1_0412 California Department of Health Care Services Health Services Advisory Group, Inc.
PageA‐9
Table A.3––Internal QIPs October 1, 2011, through December 31, 2011
(*See page A-10 for grid category explanations.)
Plan Name and County Plan
Model Type
Name of Project/Study Clinical/
Nonclinical QIP Description
Level of QIP Progress
Steps Validated
Measurement Completion
LA Care Health Plan—Los Angeles
LI Improving HbA1c and Diabetic Retinal Exam Screening Rates
Clinical Improve HbA1C and diabeticretinal exam screening rates
IX Remeasurement 1
Molina Healthcare—Riverside/San Bernardino
CP Improving Hypertension Control
Clinical Increase the percentages of controlled blood pressure
IX Remeasurement 1
Molina Healthcare— Sacramento
GMC Improving Hypertension Control
Clinical Increase the percentages of controlled blood pressure
IX Remeasurement 1
Molina Healthcare—San Diego GMC Improving Hypertension Control
Clinical Increase the percentages of controlled blood pressure
IX Remeasurement 1
Partnership Health Plan—Napa/Solano/Yolo
COHS Improving Care and Reducing Acute Readmissions for People With COPD
Clinical Improve care and reduce acute readmissions for people with COPD
X Remeasurement 2
San Francisco Health Plan—San Francisco
LI Improving the Patient Experience II
Clinical Increase the percentage of members selecting the top rating for overall health care and personal doctor on a patient satisfaction survey
I – VIII Baseline
Santa Clara Family Health Plan—Santa Clara
LI Childhood Obesity Partnership and Education
Clinical Increase the percentage of members with at least one BMI calculated and documented by a primary care practitioner
VI Proposal
SCAN Health Plan—Kern, Los Angeles, Orange, Riverside, San Bernardino, San Diego, and Ventura
SP Prevention of Stroke and Transient Ischemic Attack (TIA)
Clinical Decrease new incidence of stroke/TIA for members at high risk for stroke—those with hypertension, diabetes, dyslipidemia, all three conditions, and/or atrial fibrillation
I – X
Closed
Remeasurement 2

SSTTAATTUUSS OOFF AACCTTIIVVEE QQIIPPSS
QIPs Status Report: October 1, 2011 – December 31, 2011 CA2011-12_QIP_Qtr_10-1 to 12-31-11_F1_0412 California Department of Health Care Services Health Services Advisory Group, Inc.
PageA‐10
Table A.3––Internal QIPs
October 1, 2011, through December 31, 2011
Plan Name and County Plan
Model Type
Name of Project/Study Clinical/
Nonclinical QIP Description
Level of QIP Progress
Steps Validated
Measurement Completion
SCAN Health Plan—Kern, Los Angeles, Orange, Riverside, San Bernardino, San Diego, and Ventura
SP Care for Older Adults Clinical Improve rates for all submeasures (HEDIS and other) in care for older adults
VII Proposal
*Grid category explanations: Plan Model Type—designated plan model type:
County‐Organized Health System (COHS) plan Geographic‐Managed Care (GMC) plan Two‐Plan Model
Local initiative plan (LI)
Commercial plan (CP) Specialty plan (SP)
Clinical/Nonclinical—designates if the QIP addresses a clinical or nonclinical area of study.
QIP Description—provides a brief description of the QIP and the study population.
Level of QIP Progress—provides the status of each QIP as shown through Steps Validated and Measurement Completion: Steps Validated—provides the number of CMS activities/steps completed through Step X. Measurement Completion—indicates the QIP status as proposal, baseline assessment, Remeasurement 1, Remeasurement 2, etc.

QIPs Status Report: October 1, 2011 – December 31, 2011 April 2012 California Department of Health Care Services Health Services Advisory Group, Inc.
PageB‐1
AAppppeennddiixx BB.. EEVVAALLUUAATTIIOONN EELLEEMMEENNTT SSCCOORRIINNGG TTAABBLLEESS
Table B.1—Statewide Collaborative QIP Activities I to IV Ratings (N = 24 Submissions) October 1, 2011, through December 31, 2011
Evaluation Elements Met Partially Met Not Met
Activity I: Appropriate Study Topic 1. Reflects high‐volume or high‐risk conditions (or was
selected by the State). 100% (24/24) 0% (0/24) 0% (0/24)
2. Is selected following collection and analysis of data (or was selected by the State).
100% (24/24) 0% (0/24) 0% (0/24)
3. Addresses a broad spectrum of care and services (or was selected by the State).
100% (24/24) 0% (0/24) 0% (0/24)
4. Includes all eligible populations that meet the study criteria. 96% (23/24) 4% (1/24) 0% (0/24)
5. Does not exclude members with special health care needs. 96% (23/24) 0% (0/24) 4% (1/24)
C* 6. Has the potential to affect member health, functional status, or satisfaction.
100% (24/24) 0% (0/24) 0% (0/24)
Activity Average Rates** 99% (142/144) 1% (1/144) 1% (1/144)
Activity II: Clearly Defined, Answerable Study Question(s) C* 1. States the problem to be studied in simple terms. 100% (24/24) 0% (0/24) 0% (0/24)
C* 2. Is answerable. 100% (24/24) 0% (0/24) 0% (0/24)
Activity Average Rates** 100% (48/48) 0% (0/48) 0% (0/48)
Activity III: Clearly Defined Study Indicator(s) C* 1. Are well‐defined, objective, and measurable. 100% (24/24) 0% (0/24) 0% (0/24)
2. Are based on current, evidence‐based practice guidelines, pertinent peer review literature, or consensus expert panels.
100% (24/24) 0% (0/24) 0% (0/24)
C* 3. Allow for the study questions to be answered. 100% (24/24) 0% (0/24) 0% (0/24)
4. Measure changes (outcomes) in health or functional status, member satisfaction, or valid process alternatives.
100% (24/24) 0% (0/24) 0% (0/24)
C* 5. Have available data that can be collected on each indicator. 100% (24/24) 0% (0/24) 0% (0/24)
6. Are nationally recognized measures such as HEDIS specifications, when appropriate.
100% (24/24) 0% (0/24) 0% (0/24)
7. Includes the basis on which each indicator was adopted, if internally developed.
100% (24/24) 0% (0/24) 0% (0/24)
Activity Average Rates** 100% (168/168) 0% (0/168) 0% (0/168)
Activity IV: Correctly Identified Study Population C* 1. Is accurately and completely defined. 100% (24/24) 0% (0/24) 0% (0/24)
2. Includes requirements for the length of a member's enrollment in the plan.
Not applicable Not applicable Not applicable
C* 3. Captures all members to whom the study question applies. 100% (24/24) 0% (0/24) 0% (0/24)
Activity Average Rates** 100% (48/48) 0% (0/48) 0% (0/48)
Note: Activity evaluation element columns represent the average percentage for Met, Partially Met, and Not Met elements. All Not Applicable and Not Assessed elements are excluded. *“C” in this column denotes a critical element in HSAG’s validation protocol. Plans must receive a Met score for these
elements for a QIP to receive a Met validation status. **The activity average rate represents the average percentage of elements with a Met, Partially Met, or Not Met finding
across all the evaluation elements for a particular activity. All Not Applicable or Not Assessed findings are excluded.

EEVVAALLUUAATTIIOONN EELLEEMMEENNTT SSCCOORRIINNGG TTAABBLLEESS
QIPs Status Report: October 1, 2011 – December 31, 2011 April 2012 California Department of Health Care Services Health Services Advisory Group, Inc.
PageB‐2
Table B.2—Statewide Collaborative QIP Activities I to IV Ratings (N = 24 Submissions) October 1, 2011, through December 31, 2011
Evaluation Elements Met Partially Met Not Met
Activity V: Valid Sampling Techniques 1. Consider and specify the true or estimated frequency of
occurrence. 0% (0/1) 0% (0/1) 100% (1/1)
2. Identify the sample size. Not applicable Not applicable Not applicable
3. Specify the confidence level. Not applicable Not applicable Not applicable
4. Specify the acceptable margin of error. Not applicable Not applicable Not applicable
C* 5. Ensure a representative sample of the eligible population. Not applicable Not applicable Not applicable
6. Are in accordance with generally accepted principles of research design and statistical analysis.
Not applicable Not applicable Not applicable
Activity Average Rates** 0% (0/1) 0% (0/1) 100% (1/1)
Activity VI: Accurate/Complete Data Collection 1. The identification of data elements to be collected. 100% (24/24) 0% (0/24) 0% (0/24)
2. The identification of specified sources of data. 100% (24/24) 0% (0/24) 0% (0/24)
3. A defined and systematic process for collecting baseline and remeasurement data.
Not applicable Not applicable Not applicable
4. A timeline for the collection of baseline and remeasurement data.
75% (18/24) 4% (1/24) 21% (5/24)
5. Qualified staff and personnel to abstract manual data. Not applicable Not applicable Not applicable
C* 6. A manual data collection tool that ensures consistent and accurate collection of data according to indicator specifications.
Not applicable Not applicable Not applicable
7. A manual data collection tool that supports interrater reliability.
Not applicable Not applicable Not applicable
8. Clear and concise written instructions for completing the manual data collection tool.
Not applicable Not applicable Not applicable
9. An overview of the study in written instructions. Not applicable Not applicable Not applicable
10. Administrative data collection algorithms/flowcharts that show activities in the production of indicators.
92% (22/24) 8% (2/24) 0% (0/24)
11. An estimated degree of automated data completeness. 100% (24/24) 0% (0/24) 0% (0/24)
Activity Average Rates** 93% (112/120) 3% (3/120) 4% (5/120)
Activity VII: Appropriate Improvement Strategies
C* 1. Related to causes/barriers identified through data analysis and quality improvement processes.
100% (24/24) 0% (0/24) 0% (0/24)
2. System changes that are likely to induce permanent change. 100% (24/24) 0% (0/24) 0% (0/24)
3. Revised if original interventions are not successful. 100% (20/20) 0% (0/20) 0% (0/20)
4. Standardized and monitored if interventions were successful. 75% (12/16) 25% (4/16) 0% (0/16)
Activity Average Rates** 95% (80/84) 5% (4/84) 0% (0/84)
Note: Activity evaluation element columns represent the average percentage for Met, Partially Met, and Not Met elements. All Not Applicable and Not Assessed elements are excluded. *“C” in this column denotes a critical element in HSAG’s validation protocol. Plans must receive a Met score for these
elements for a QIP to receive a Met validation status. **The activity average rate represents the average percentage of elements with a Met, Partially Met, or Not Met finding
across all the evaluation elements for a particular activity. All Not Applicable or Not Assessed findings are excluded.

EEVVAALLUUAATTIIOONN EELLEEMMEENNTT SSCCOORRIINNGG TTAABBLLEESS
QIPs Status Report: October 1, 2011 – December 31, 2011 April 2012 California Department of Health Care Services Health Services Advisory Group, Inc.
PageB‐3
Table B.3—Statewide Collaborative QIP Activities I to IV Ratings (N = 24 Submissions) October 1, 2011, through December 31, 2011
Evaluation Elements Met Partially Met Not Met
Activity VIII: Sufficient Data Analysis and Interpretation
C* 1. Is conducted according to the data analysis plan in the study design.
100% (24/24) 0% (0/24) 0% (0/24)
C* 2. Allows for the generalization of the results to the study population if a sample was selected.
Not applicable Not applicable Not applicable
3. Identifies factors that threaten the internal or external validity of the findings.
88% (21/24) 0% (0/24) 13% (3/24)
4. Includes an interpretation of the findings. 71% (17/24) 25% (6/24) 4% (1/24)
5. Is presented in a way that provides accurate, clear, and easily understood information.
96% (23/24) 0% (0/24) 4% (1/24)
6. Identifies initial measurement and remeasurement of study indicators.
100% (24/24) 0% (0/24) 0% (0/24)
7. Identifies statistical differences between initial measurement and remeasurement.
79% (19/24) 17% (4/24) 4% (1/24)
8. Identifies factors that affect the ability to compare the initial measurement with remeasurement.
79% (19/24) 4% (1/24) 17% (4/24)
9. Includes interpretation of the extent to which the study was successful.
96% (23/24) 4% (1/24) 0% (0/24)
Activity Average Rates** 89% (170/192) 6% (12/192) 5% (10/192)
Activity IX: Real Improvement Achieved 1. Remeasurement methodology is the same as baseline
methodology. 100% (24/24) 0% (0/24) 0% (0/24)
2. There is documented improvement in processes or outcomes of care.
71% (17/24) 0% (0/24) 29% (7/24)
3. The improvement appears to be the result of planned intervention(s).
70% (16/23) 0% (0/23) 30% (7/23)
4. There is statistical evidence that observed improvement is true improvement.
58% (14/24) 0% (0/24) 42% (10/24)
Activity Average Rates** 75% (71/95) 0% (0/95) 25% (24/95)
Activity X: Sustained Improvement Achieved 1. Repeated measurements over comparable time periods
demonstrate sustained improvement, or that a decline in improvement is not statistically significant.
26% (6/23) 0% (0/23) 74% (17/23)
Activity Average Rates** 26% (6/23) 0% (0/23) 74% (17/23)
Note: Activity evaluation element columns represent the average percentage for Met, Partially Met, and Not Met elements. All Not Applicable and Not Assessed elements are excluded. *“C” in this column denotes a critical element in HSAG’s validation protocol. Plans must receive a Met score for these
elements for a QIP to receive a Met validation status. **The activity average rate represents the average percentage of elements with a Met, Partially Met, or Not Met finding
across all the evaluation elements for a particular activity. All Not Applicable or Not Assessed findings are excluded.

EEVVAALLUUAATTIIOONN EELLEEMMEENNTT SSCCOORRIINNGG TTAABBLLEESS
QIPs Status Report: October 1, 2011 – December 31, 2011 April 2012 California Department of Health Care Services Health Services Advisory Group, Inc.
PageB‐4
Table B.4—Internal QIP Activities I to IV Ratings (N = 20 Submissions) October 1, 2011, through December 31, 2011
Evaluation Elements Met Partially Met Not Met
Activity I: Appropriate Study Topic 1. Reflects high‐volume or high‐risk conditions (or was
selected by the State). 100% (16/16) 0% (0/16) 0% (0/16)
2. Is selected following collection and analysis of data (or was selected by the State).
100% (20/20) 0% (0/20) 0% (0/20)
3. Addresses a broad spectrum of care and services (or was selected by the State).
100% (20/20) 0% (0/20) 0% (0/20)
4. Includes all eligible populations that meet the study criteria. 95% (19/20) 0% (0/20) 5% (1/20)
5. Does not exclude members with special health care needs. 100% (20/20) 0% (0/20) 0% (0/20)
C* 6. Has the potential to affect member health, functional status, or satisfaction.
100% (20/20) 0% (0/20) 0% (0/20)
Activity Average Rates** 99% (115/116) 0% (0/116) 1% (1/116)
Activity II: Clearly Defined, Answerable Study Question(s) C* 1. States the problem to be studied in simple terms. 90% (18/20) 10% (2/20) 0% (0/20)
C* 2. Is answerable. 100% (20/20) 0% (0/20) 0% (0/20)
Activity Average Rates** 95% (38/40) 5% (2/40) 0% (0/40)
Activity III: Clearly Defined Study Indicator(s) C* 1. Are well‐defined, objective, and measurable. 90% (18/20) 10% (2/20) 0% (0/20)
2. Are based on current, evidence‐based practice guidelines, pertinent peer review literature, or consensus expert panels.
100% (15/15) 0% (0/15) 0% (0/15)
C* 3. Allow for the study questions to be answered. 100% (20/20) 0% (0/20) 0% (0/20)
4. Measure changes (outcomes) in health or functional status, member satisfaction, or valid process alternatives.
100% (20/20) 0% (0/20) 0% (0/20)
C* 5. Have available data that can be collected on each indicator. 100% (20/20) 0% (0/20) 0% (0/20)
6. Are nationally recognized measures such as HEDIS specifications, when appropriate.
100% (11/11) 0% (0/11) 0% (0/11)
7. Includes the basis on which each indicator was adopted, if internally developed.
100% (13/13) 0% (0/13) 0% (0/13)
Activity Average Rates** 98% (117/119) 2% (2/119) 0% (0/119)
Activity IV: Correctly Identified Study Population C* 1. Is accurately and completely defined. 85% (17/20) 15% (3/20) 0% (0/20)
2. Includes requirements for the length of a member's enrollment in the plan.
95% (19/20) 0% (0/20) 5% (1/20)
C* 3. Captures all members to whom the study question applies. 95% (19/20) 5% (1/20) 0% (0/20)
Activity Average Rates** 92% (55/60) 7% (4/60) 2% (1/60)
Note: Activity evaluation element columns represent the average percentage for Met, Partially Met, and Not Met elements. All Not Applicable and Not Assessed elements are excluded. *“C” in this column denotes a critical element in HSAG’s validation protocol. Plans must receive a Met score for these
elements for a QIP to receive a Met validation status. **The activity average rate represents the average percentage of elements with a Met, Partially Met, or Not Met finding
across all the evaluation elements for a particular activity. All Not Applicable or Not Assessed findings are excluded.

EEVVAALLUUAATTIIOONN EELLEEMMEENNTT SSCCOORRIINNGG TTAABBLLEESS
QIPs Status Report: October 1, 2011 – December 31, 2011 April 2012 California Department of Health Care Services Health Services Advisory Group, Inc.
PageB‐5
Table B.5—Internal QIP Activities V to VII Ratings (N = 20 Submissions)
October 1, 2011, through December 31, 2011
Evaluation Elements Met Partially Met Not Met
Activity V: Valid Sampling Techniques 1. Consider and specify the true or estimated frequency of
occurrence. 100% (5/5) 0% (0/5) 0% (0/5)
2. Identify the sample size. 100% (5/5) 0% (0/5) 0% (0/5)
3. Specify the confidence level. 100% (5/5) 0% (0/5) 0% (0/5)
4. Specify the acceptable margin of error. 100% (5/5) 0% (0/5) 0% (0/5)
C* 5. Ensure a representative sample of the eligible population. 100% (5/5) 0% (0/5) 0% (0/5)
6. Are in accordance with generally accepted principles of research design and statistical analysis.
100% (5/5) 0% (0/5) 0% (0/5)
Activity Average Rates** 100% (30/30) 0% (0/30) 0% (0/30)
Activity VI: Accurate/Complete Data Collection 1. The identification of data elements to be collected. 100% (20/20) 0% (0/20) 0% (0/20)
2. The identification of specified sources of data. 95% (19/20) 5% (1/20) 0% (0/20)
3. A defined and systematic process for collecting baseline and remeasurement data.
100% (8/8) 0% (0/8) 0% (0/8)
4. A timeline for the collection of baseline and remeasurement data.
80% (16/20) 10% (2/20) 10% (2/20)
5. Qualified staff and personnel to abstract manual data. 100% (8/8) 0% (0/8) 0% (0/8)
C* 6. A manual data collection tool that ensures consistent and accurate collection of data according to indicator specifications.
88% (7/8) 0% (0/8) 13% (1/8)
7. A manual data collection tool that supports interrater reliability.
88% (7/8) 0% (0/8) 13% (1/8)
8. Clear and concise written instructions for completing the manual data collection tool.
88% (7/8) 0% (0/8) 13% (1/8)
9. An overview of the study in written instructions. 88% (7/8) 0% (0/8) 13% (1/8)
10. Administrative data collection algorithms/flowcharts that show activities in the production of indicators.
88% (15/17) 12% (2/17) 0% (0/17)
11. An estimated degree of automated data completeness. 100% (15/15) 0% (0/15) 0% (0/15)
Activity Average Rates** 92% (129/140) 4% (5/140) 4% (6/140)
Activity VII: Appropriate Improvement Strategies
C* 1. Related to causes/barriers identified through data analysis and quality improvement processes.
100% (19/19) 0% (0/19) 0% (0/19)
2. System changes that are likely to induce permanent change.
100% (19/19) 0% (0/19) 0% (0/19)
3. Revised if original interventions are not successful. 88% (7/8) 0% (0/8) 13% (1/8)
4. Standardized and monitored if interventions were successful.
90% (9/10) 10% (1/10) 0% (0/10)
Activity Average Rates** 96% (54/56) 2% (1/56) 2% (1/56)
Note: Activity evaluation element columns represent the average percentage for Met, Partially Met, and Not Met elements. All Not Applicable and Not Assessed elements are excluded. *“C” in this column denotes a critical element in HSAG’s validation protocol. Plans must receive a Met score for these
elements for a QIP to receive a Met validation status. **The activity average rate represents the average percentage of elements with a Met, Partially Met, or Not Met finding
across all the evaluation elements for a particular activity. All Not Applicable or Not Assessed findings are excluded.
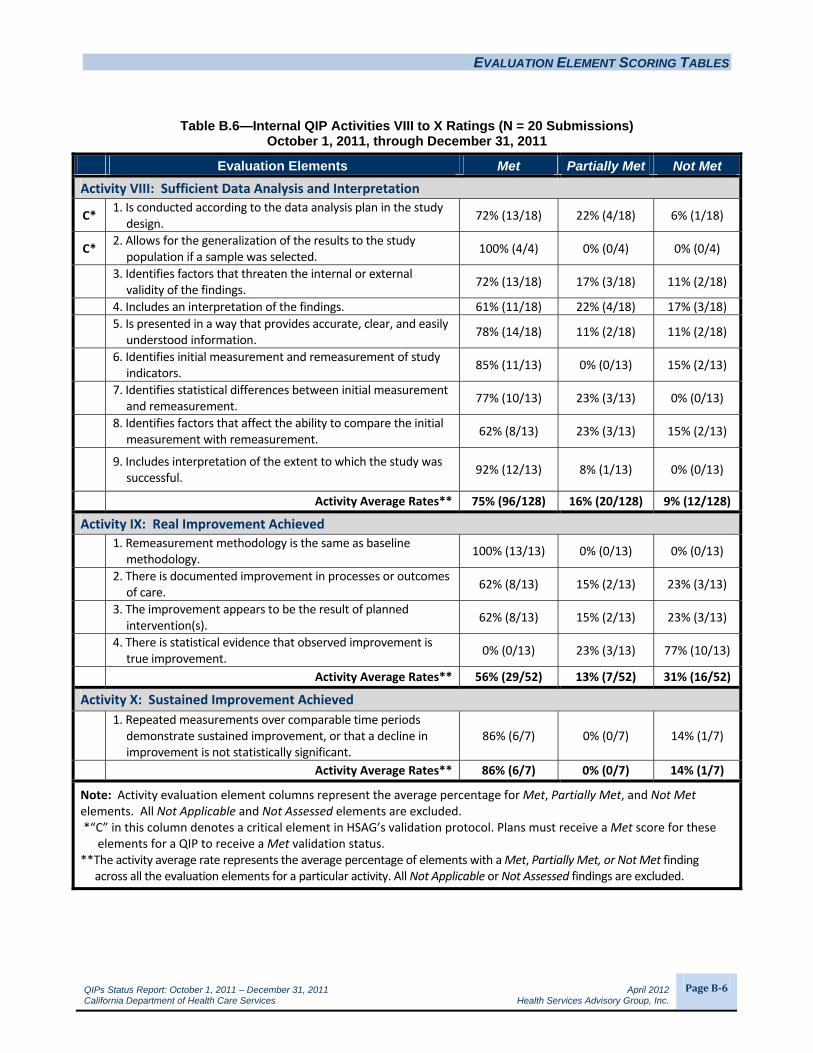
EEVVAALLUUAATTIIOONN EELLEEMMEENNTT SSCCOORRIINNGG TTAABBLLEESS
QIPs Status Report: October 1, 2011 – December 31, 2011 April 2012 California Department of Health Care Services Health Services Advisory Group, Inc.
PageB‐6
Table B.6—Internal QIP Activities VIII to X Ratings (N = 20 Submissions) October 1, 2011, through December 31, 2011
Evaluation Elements Met Partially Met Not Met
Activity VIII: Sufficient Data Analysis and Interpretation
C* 1. Is conducted according to the data analysis plan in the study design.
72% (13/18) 22% (4/18) 6% (1/18)
C* 2. Allows for the generalization of the results to the study population if a sample was selected.
100% (4/4) 0% (0/4) 0% (0/4)
3. Identifies factors that threaten the internal or external validity of the findings.
72% (13/18) 17% (3/18) 11% (2/18)
4. Includes an interpretation of the findings. 61% (11/18) 22% (4/18) 17% (3/18)
5. Is presented in a way that provides accurate, clear, and easily understood information.
78% (14/18) 11% (2/18) 11% (2/18)
6. Identifies initial measurement and remeasurement of study indicators.
85% (11/13) 0% (0/13) 15% (2/13)
7. Identifies statistical differences between initial measurement and remeasurement.
77% (10/13) 23% (3/13) 0% (0/13)
8. Identifies factors that affect the ability to compare the initial measurement with remeasurement.
62% (8/13) 23% (3/13) 15% (2/13)
9. Includes interpretation of the extent to which the study was successful.
92% (12/13) 8% (1/13) 0% (0/13)
Activity Average Rates** 75% (96/128) 16% (20/128) 9% (12/128)
Activity IX: Real Improvement Achieved 1. Remeasurement methodology is the same as baseline
methodology. 100% (13/13) 0% (0/13) 0% (0/13)
2. There is documented improvement in processes or outcomes of care.
62% (8/13) 15% (2/13) 23% (3/13)
3. The improvement appears to be the result of planned intervention(s).
62% (8/13) 15% (2/13) 23% (3/13)
4. There is statistical evidence that observed improvement is true improvement.
0% (0/13) 23% (3/13) 77% (10/13)
Activity Average Rates** 56% (29/52) 13% (7/52) 31% (16/52)
Activity X: Sustained Improvement Achieved 1. Repeated measurements over comparable time periods
demonstrate sustained improvement, or that a decline in improvement is not statistically significant.
86% (6/7) 0% (0/7) 14% (1/7)
Activity Average Rates** 86% (6/7) 0% (0/7) 14% (1/7)
Note: Activity evaluation element columns represent the average percentage for Met, Partially Met, and Not Met elements. All Not Applicable and Not Assessed elements are excluded. *“C” in this column denotes a critical element in HSAG’s validation protocol. Plans must receive a Met score for these
elements for a QIP to receive a Met validation status. **The activity average rate represents the average percentage of elements with a Met, Partially Met, or Not Met finding
across all the evaluation elements for a particular activity. All Not Applicable or Not Assessed findings are excluded.