Mechanistic modeling of the effects of climate change … modeling of the effects of climate change...
119
Mechanistic modeling of the effects of climate change on sea turtle migration to nesting beaches A Thesis Submitted to the Faculty of Drexel University by Noga Neeman in partial fulfillment of the requirements for the degree of Doctor of Philosophy December 2014
Transcript of Mechanistic modeling of the effects of climate change … modeling of the effects of climate change...
Mechanistic modeling of the effects of climate change
on sea turtle migration to nesting beaches
A Thesis
Submitted to the Faculty
of
Drexel University
by
Noga Neeman
in partial fulfillment of the
requirements for the degree
of
Doctor of Philosophy
December 2014

© Copyright 2014
Noga Neeman. All Rights Reserved

ii
Dedication
“The highest function of ecology is understanding consequences”
-Frank Herbert (Dune)

iii
Acknowledgements
First off, I want to express my immense gratitude to my dissertation committee.
While it’s obviously true that I wouldn’t have been able to do this without each of your
contributions, I also feel like you have all played a huge role in my development both as a
scientist and as a person.
I first met Dr. James Spotila in Costa Rica, where he kindly agreed to talk to me
while I was still in the application process at Drexel. I believe it was this first meeting
that made my entire experience at Drexel possible. For that honor, as well as for how
surreal it’s been to work with him since then, I will always be thankful to Jim.
Once at Drexel, I introduced myself to Dr. Michael O’Connor, my advisor, who
has become a very important influence for me. It’s hard to imagine what my graduate
experience would have been like with a different advisor, and I don’t care to. Mike set a
very high standard for the type of researcher and mentor I’d like to be one day. He has
always looked out for my well-being as well as for my intellectual development, and
under his care I’ve become much more capable and confident. I can only hope to pay this
forward if I get the chance to mentor students of my own.
Mike and Jim introduced me to two more of my committee members: Dr. Gail
Hearn and Dr. Frank Paladino. Gail has always kept me on track looking for conservation
implications in my work and has been a huge support for me over the years. Frank has
always pushed me to understand and properly explain why my work is novel and how it
could be useful, which has made my research stronger.
iv
Finally, Dr. Shaya Honarvar and I first met at a departmental barbecue. The
warm, friendly, and welcoming tone she set in that first meeting has been maintained
throughout our relationship and she has been both a great mentor and a great friend. I
look forward to talking about turtles and life for years to come.
Of course I couldn’t have done this work without any data. Thank you to the Sea
Turtle Conservancy, the Leatherback Trust, and the US Fish and Wildlife Service for
allowing me to use their data for my work. And thank you to the volunteers, research
assistants, field coordinators, and scientific directors who have spent countless hours in
the field monitoring and protecting these sea turtles.
The faculty and staff at Drexel have enriched the graduate experience for me in
ways I can’t express. Thanks for great discussions during grad seminar and thanks for
always being there when I had questions. Special thanks to Susan Cole (BEES) and Taz
Kwok (Office of Graduate Studies) for making countless problems disappear for me over
the years and for always being so calming whenever I came to you.
To the Bio/BEES graduate students past and present (Gabi, Lucio, Annette,
Eugenia, Elena, Victoria, Annie, Sara, Karen, Steve, Maggie, Carlos Mario, Lori, Laurie,
Claire, Emily, Samir, Aliki, Jack, Yuxiang, Abby, Jules, Kevin, Dane, LeeAnn, Ryan,
Marilyn, Pat(rick), Jake, Alexis, Drew C, Deme, Pat(ricia), Paul S, Shauna, Anna J, Anna
V, Kaitlin, Nina, Alina, Yi, Narayan, Drew S, Karl, Tom, Mitch, Suruchi, Bo, Jasmine,
Eva, Siddhita, Paul U, and anyone I may have forgotten because I’m a little tired of
typing), thank you for making my experience at Drexel complete. Thank you for guiding
me, commiserating with me, celebrating with me, and generally showing me how to have
a good time while trying to do good science.

v
To my family (Itay, Barak, Keren, Or, Noam, Aviv, Nina, Monica) and
particularly to my parents (Bruria and Avraham), thank you for setting high standards for
me all my life and thank you even more for being patient and supportive as I try to live
up to them. I couldn’t have done any of this without our weekly talks, my recharging
visits to Costa Rica, and the constant knowledge that you’re there for me whenever I need
you.
And last, but absolutely not least, thanks to Tibi. It’s been an amazing five years!
I couldn’t have gotten through them without you holding my hand and I look forward to
many more. Thanks for your love and support, especially these past couple of months.
And thanks for agreeing to adopt Schmoopsie (the hedgehog) and Honey (the cat) -
p0vbg;[;-0
ftggggggggkkkkkkkkkkkkkkl – and I believe that’s her telling me to wrap up.
vi
Table of Contents
List of Tables ...................................................................................................................... x
List of Figures .................................................................................................................... xi
Abstract ............................................................................................................................ xiv
CHAPTER 1: General Introduction .................................................................................... 1
Phenological shifts in response to climate change ...................................................... 5
Change in remigration intervals in response to climate change .................................. 6
CHAPTER 2: Phenology shifts in leatherback turtles (Dermochelys coriacea) due to
changes in sea surface temperature ..................................................................................... 9
Abstract ........................................................................................................................... 9
Introduction ................................................................................................................... 10
Methods ......................................................................................................................... 14
Study sites .................................................................................................................. 14
Nesting data ............................................................................................................... 15
Temperatures ............................................................................................................. 16
Net Primary Production ............................................................................................. 17
Statistical analysis...................................................................................................... 17
vii
Results ........................................................................................................................... 19
Discussion ..................................................................................................................... 20
Tables and Figures ........................................................................................................ 26
CHAPTER 3: A simple, physiologically-based model of sea turtle remigration intervals
and nesting population dynamics: effects of temperature................................................. 35
Abstract ......................................................................................................................... 35
Introduction ................................................................................................................... 36
Methods ......................................................................................................................... 38
Forcing functions ....................................................................................................... 38
Algorithm................................................................................................................... 40
Parameterization ........................................................................................................ 40
Output ........................................................................................................................ 41
Simulation scenarios .................................................................................................. 41
Alternate model structure .......................................................................................... 42
Results ........................................................................................................................... 43
Parameterization ........................................................................................................ 43
Standard model .......................................................................................................... 43
Cohort diffusion ......................................................................................................... 43
viii
Pulse perturbations .................................................................................................... 44
Sinusoidal cycles ....................................................................................................... 45
Alternate model ......................................................................................................... 45
Discussion ..................................................................................................................... 46
Cohort dynamics ........................................................................................................ 46
Comparison to published results................................................................................ 49
Possible extensions .................................................................................................... 50
Conservation implications ......................................................................................... 51
Summary .................................................................................................................... 52
Figures ........................................................................................................................... 53
CHAPTER 4: Using a simple, physiologically-based model to predict leatherback turtle
(Dermochelys coriacea) nesting numbers and remigration intervals at two rookeries .... 62
Abstract ......................................................................................................................... 62
Introduction ................................................................................................................... 63
Methods ......................................................................................................................... 65
Standard model .......................................................................................................... 65
Foraging temperature data ......................................................................................... 66
Nesting data ............................................................................................................... 68
ix
Fitting the model to specific populations .................................................................. 69
Analysis ..................................................................................................................... 70
Results ........................................................................................................................... 70
Discussion ..................................................................................................................... 72
CHAPTER 5: General Conclusions .................................................................................. 84
List of References ............................................................................................................. 89
Appendix A: Pseudocode for main and alternate models ................................................. 99
Main model ................................................................................................................... 99
Alternate model ........................................................................................................... 100
Vita .................................................................................................................................. 101

x
List of Tables
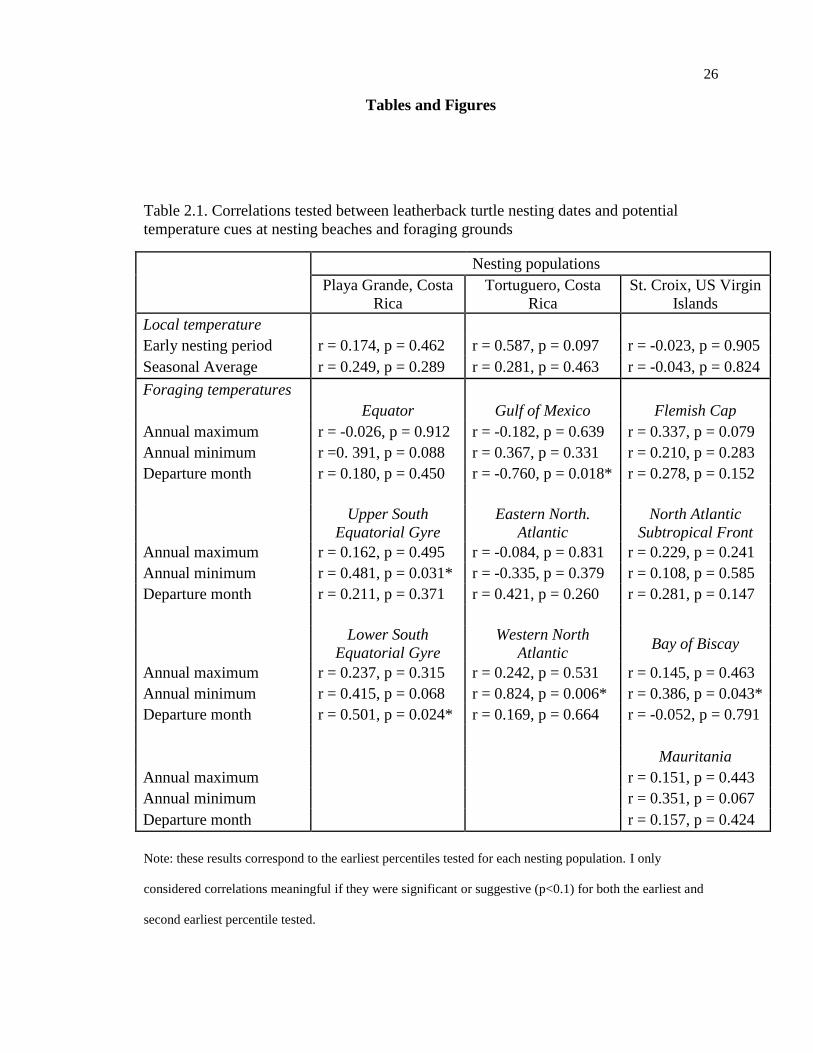
Table 2.1. Correlations tested between leatherback turtle nesting dates and potential
temperature cues at nesting beaches and foraging grounds ....................................... 26
xi
List of Figures
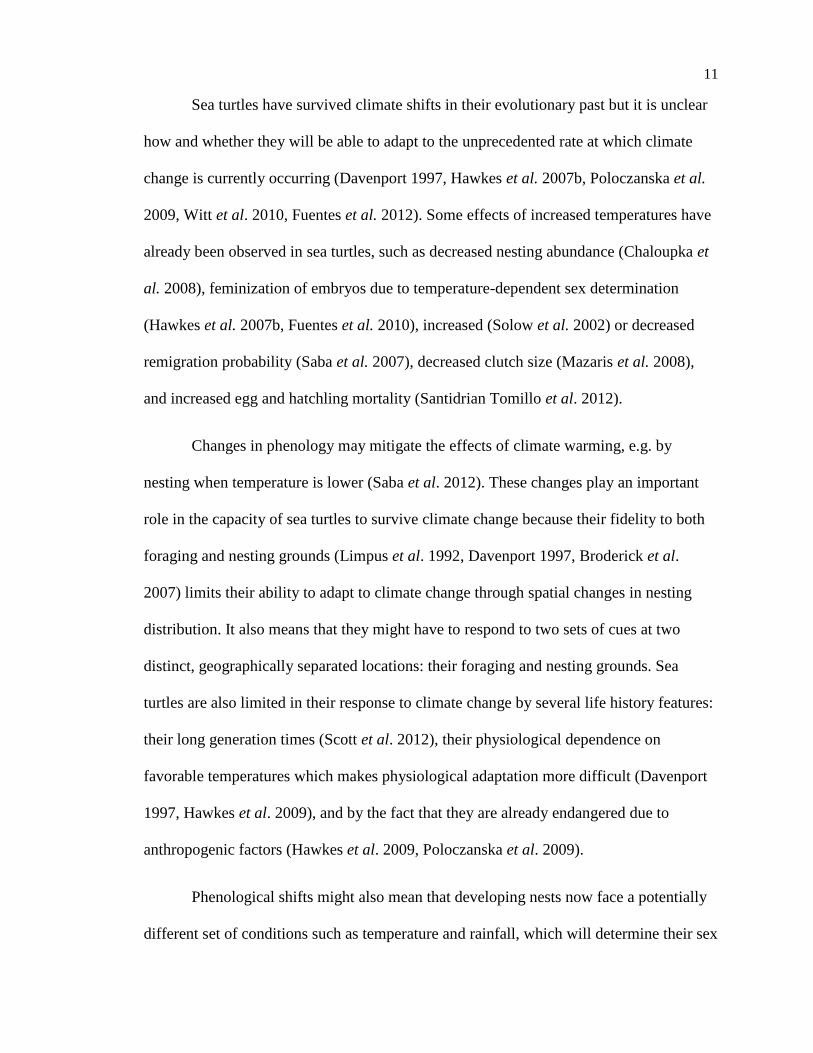
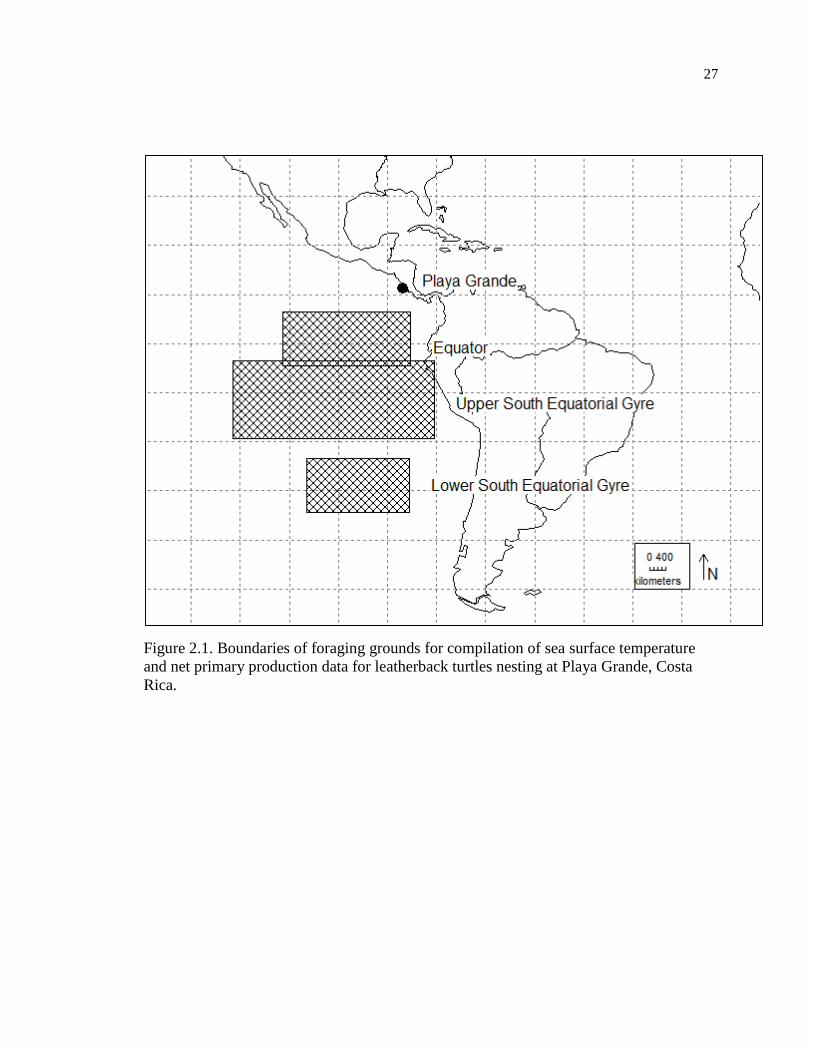
Figure 2.1. Boundaries of foraging grounds for compilation of sea surface temperature
and net primary production data for leatherback turtles nesting at Playa Grande,
Costa Rica. ................................................................................................................. 27
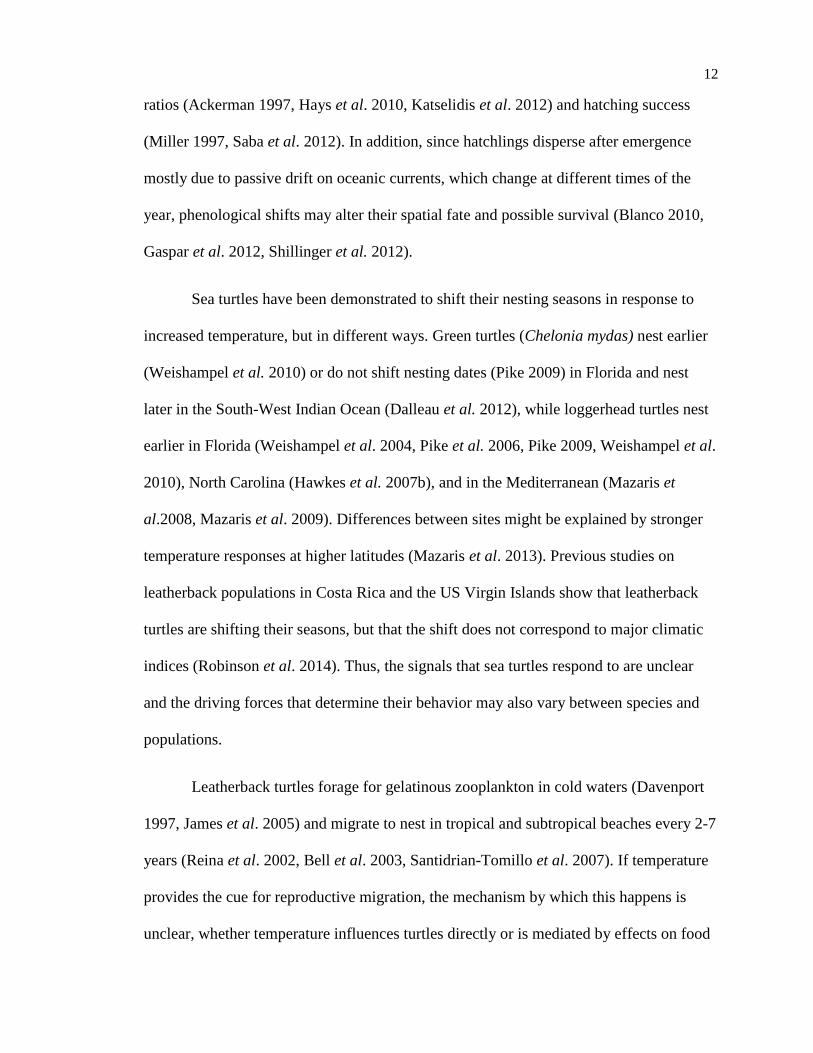
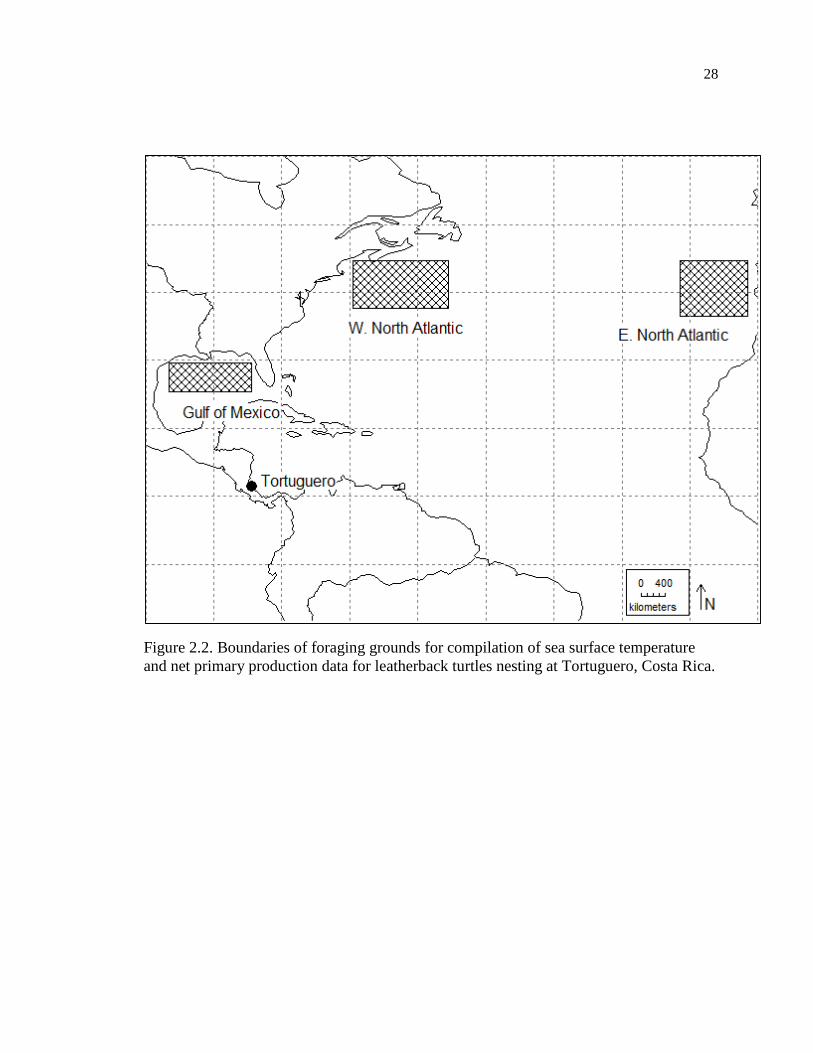
Figure 2.2. Boundaries of foraging grounds for compilation of sea surface temperature
and net primary production data for leatherback turtles nesting at Tortuguero, Costa
Rica. ........................................................................................................................... 28
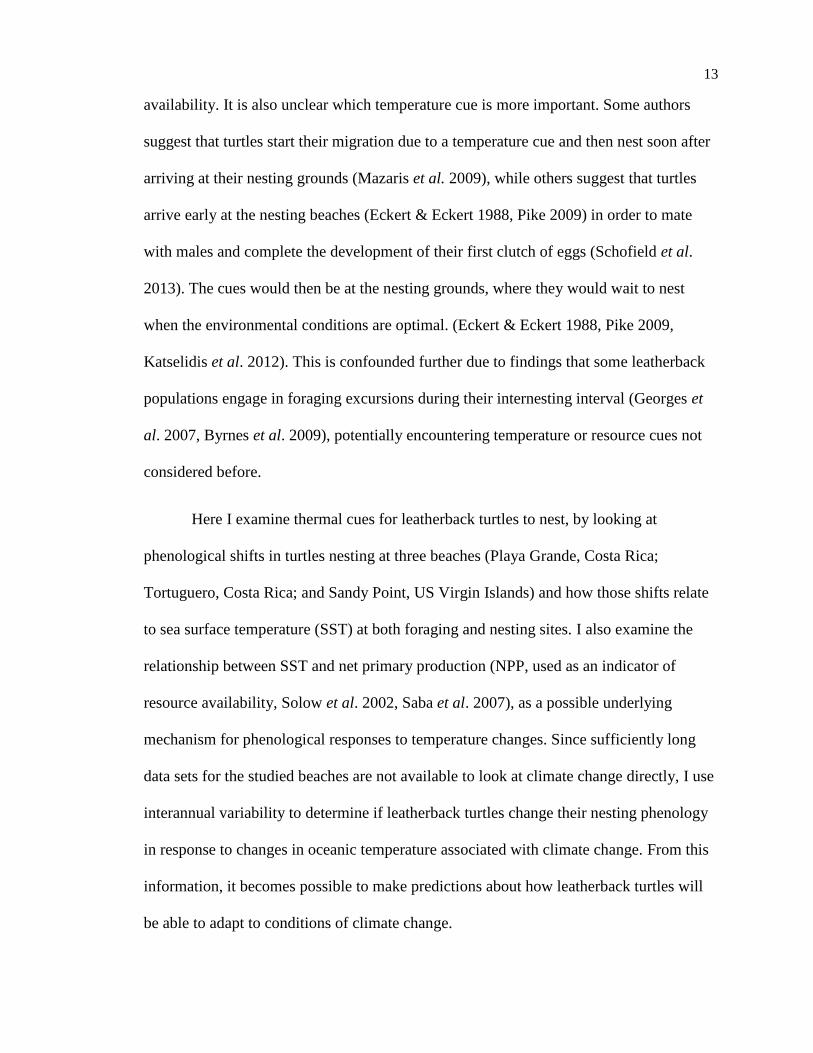
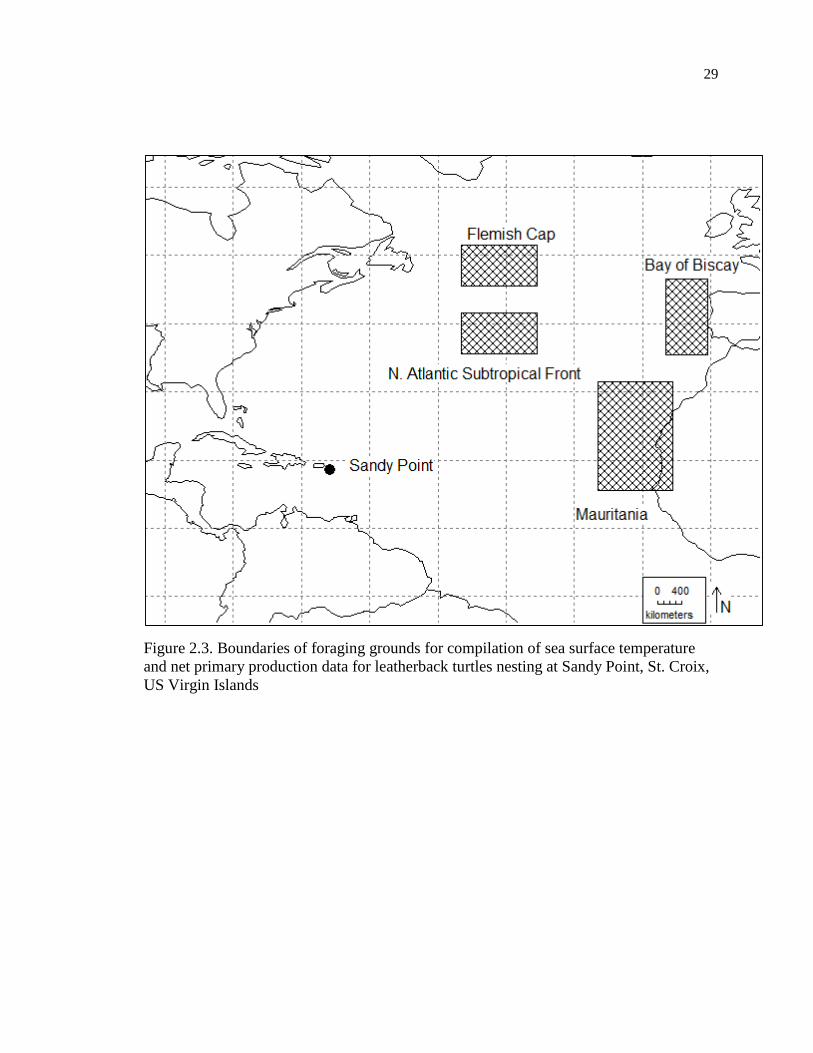
Figure 2.3. Boundaries of foraging grounds for compilation of sea surface temperature
and net primary production data for leatherback turtles nesting at Sandy Point, St.
Croix, US Virgin Islands ........................................................................................... 29
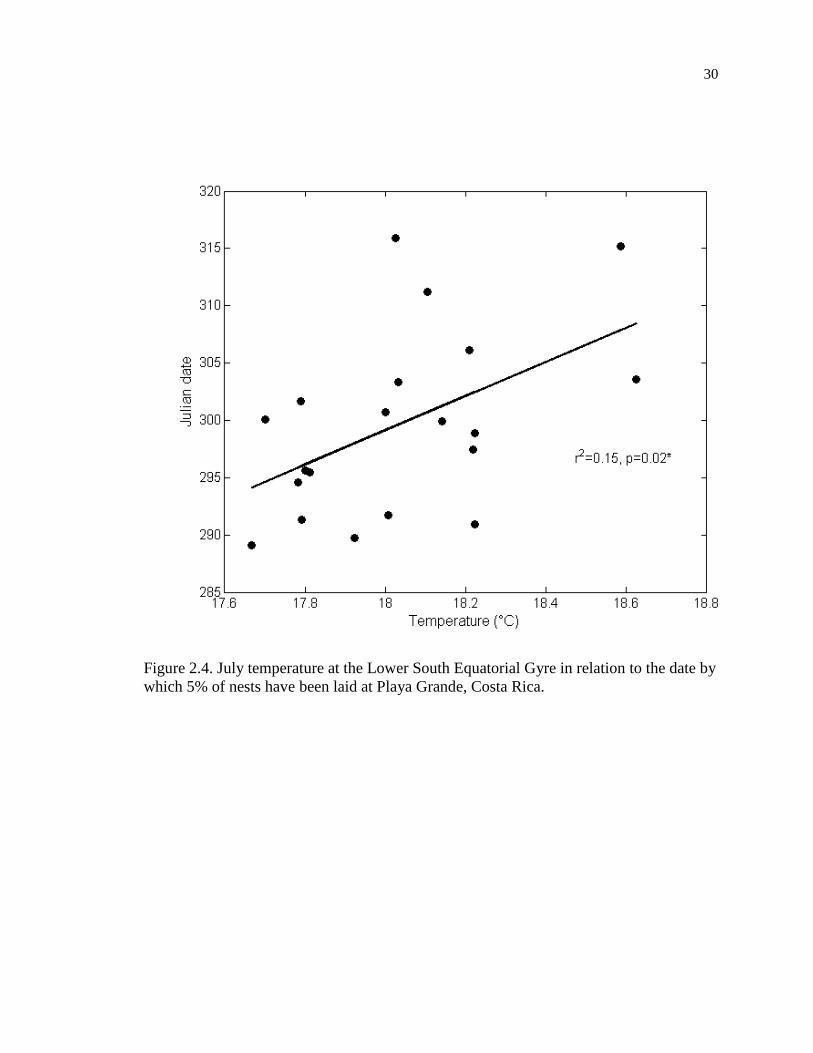
Figure 2.4. July temperature at the Lower South Equatorial Gyre in relation to the date by
which 5% of nests have been laid at Playa Grande, Costa Rica. ............................... 30
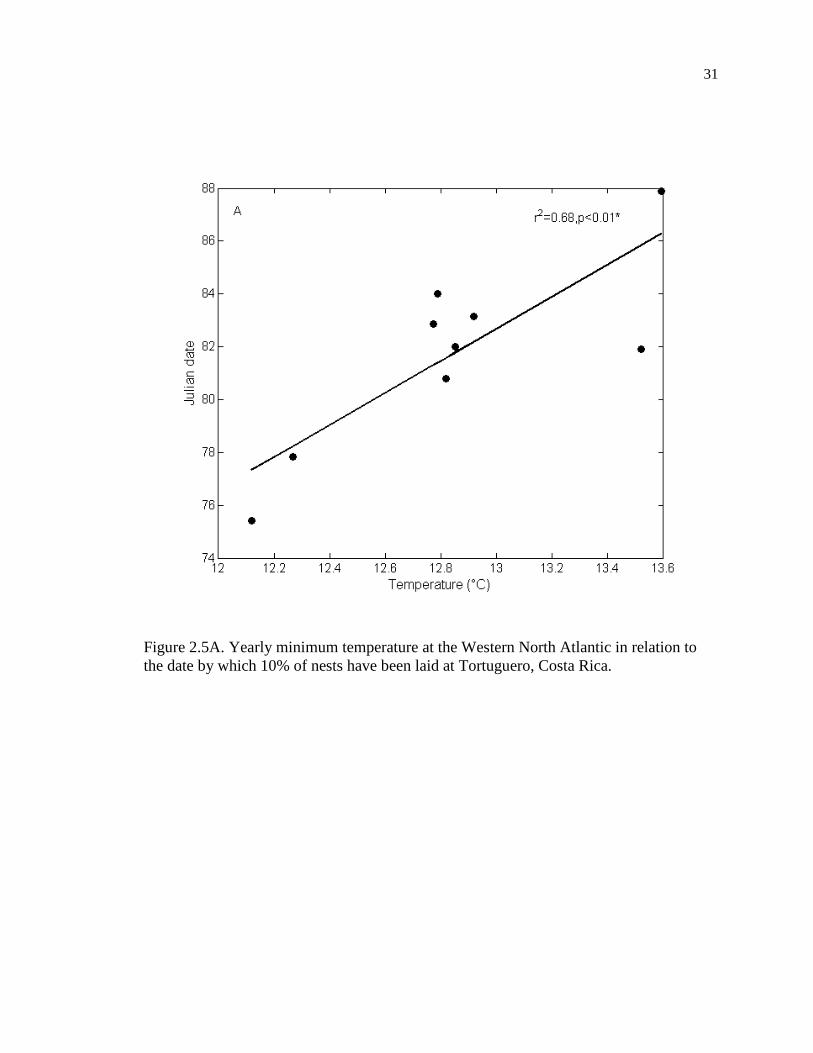
Figure 2.5A. Yearly minimum temperature at the Western North Atlantic in relation to
the date by which 10% of nests have been laid at Tortuguero, Costa Rica. .............. 31
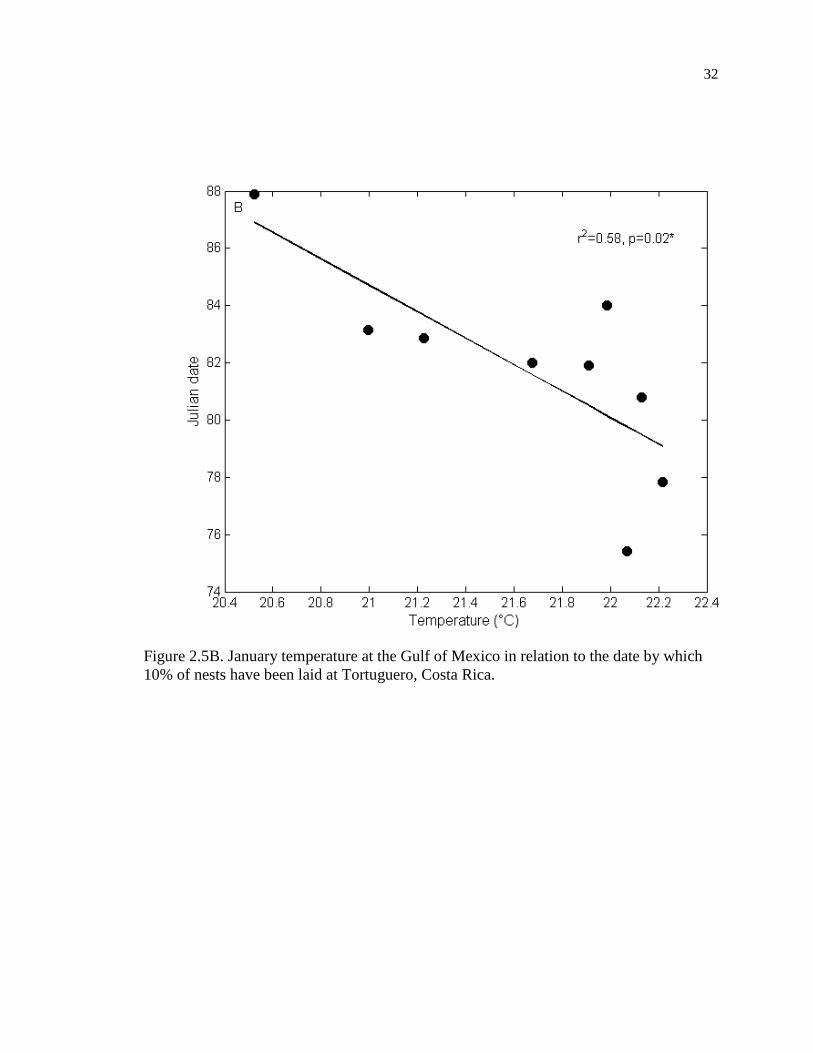
Figure 2.5B. January temperature at the Gulf of Mexico in relation to the date by which
10% of nests have been laid at Tortuguero, Costa Rica. ........................................... 32
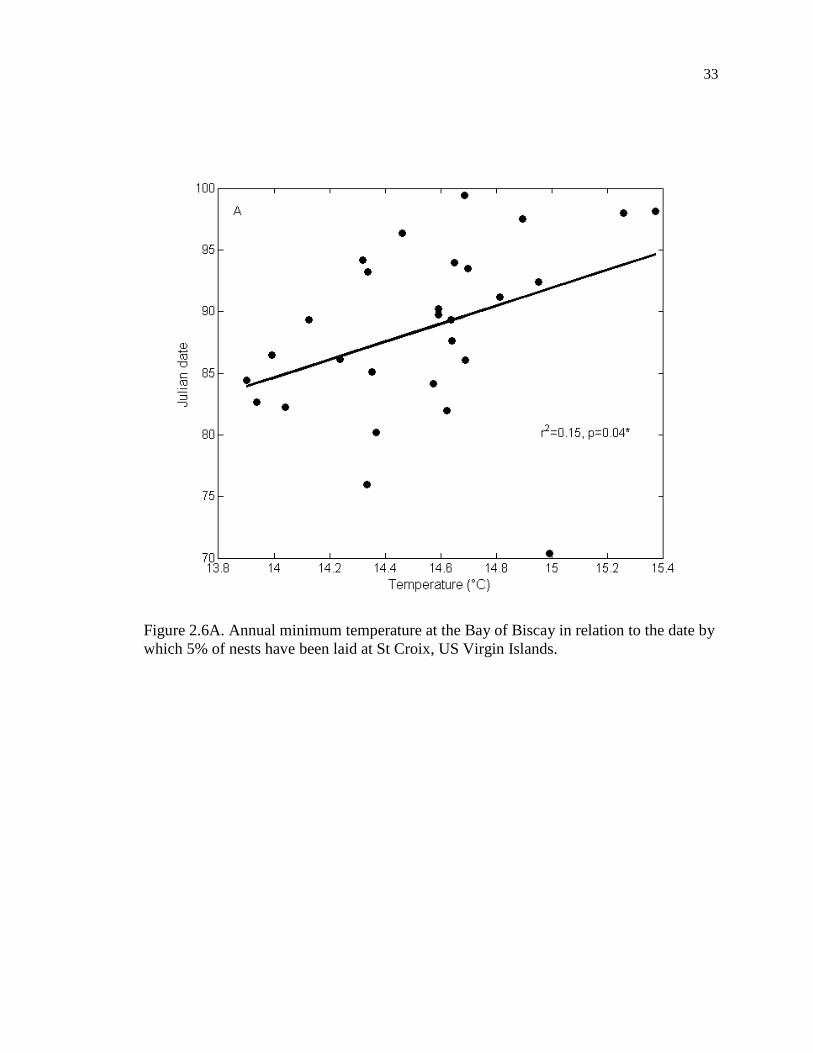
Figure 2.6A. Annual minimum temperature at the Bay of Biscay in relation to the date by
which 5% of nests have been laid at St Croix, US Virgin Islands. ........................... 33
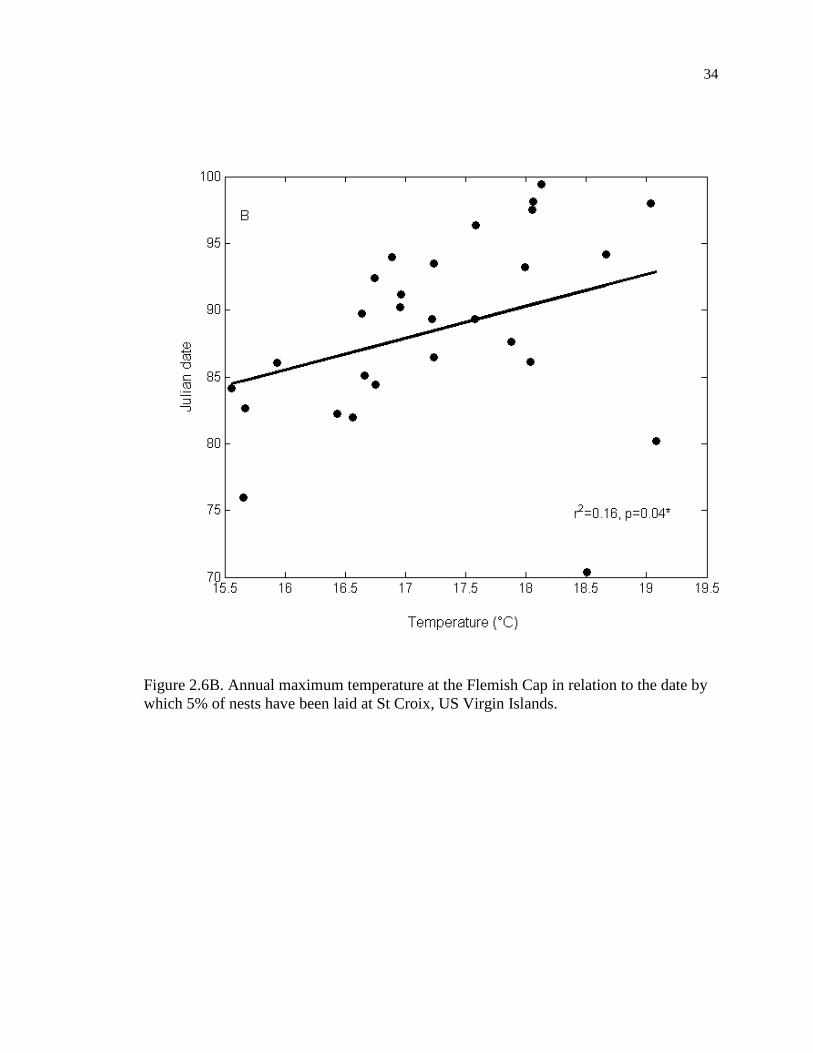
Figure 2.6B. Annual maximum temperature at the Flemish Cap in relation to the date by
which 5% of nests have been laid at St Croix, US Virgin Islands. ........................... 34
Figure 3.1. Comparison between model remigration intervals and those published by
Wallace and Saba (2009) for leatherback turtles with different values of annual net
primary production. ................................................................................................... 53
Figure 3.2. Mean number of nesting turtles, from a total population of 500, predicted
under three modeled relationships between resource availability and remigration
probability. ................................................................................................................. 54
xii
Figure 3.3. Heat map of yearly remigration intervals (A) and mean (+/- standard
deviation) nesting numbers (B) for an initial sea turtle nesting cohort under a
constant temperature of 13.6°C. ................................................................................ 55
Figure 3.4. Heat map of yearly remigration intervals (A) and mean (+/- standard
deviation) nesting numbers (B) for an initial sea turtle nesting cohort under a
constant temperature of 14.5°C. ................................................................................ 56
Figure 3.5. Predicted yearly nesting numbers of sea turtles after a pulse perturbation in
temperature. ............................................................................................................... 57
Figure 3.6. Heat map of yearly remigration intervals (A) and mean (+/- standard
deviation) nesting numbers (B) of sea turtles following a decrease in temperature of
0.45°C. ....................................................................................................................... 58
Figure 3.7. Heat map of yearly remigration intervals (A) and mean (+/- standard
deviation) nesting numbers (B) of sea turtles following an increase in temperature of
0.45°C. ....................................................................................................................... 59
Figure 3.8. Modeled nesting numbers of sea turtles under sinusoidal temperature
oscillations of varying cycle duration. ....................................................................... 60
Figure 3.9. Lag between minimum temperature and minimum nesting numbers of nesting
turtles under sinusoidal temperature oscillations of varying cycle duration. ............ 61
Figure 4.1. Observed nesting numbers for the leatherback populations at Playa Grande
(Costa Rica) and St. Croix (US Virgin Islands) and those predicted by the standard
model, using global average temperature and all three different metabolic functions.
................................................................................................................................... 76
Figure 4.2. Observed remigration intervals for the leatherback populations nesting at
Playa Grande (Costa Rica) and St. Croix (US Virgin Islands) and those predicted by
the standard model, using global average temperature and all three different
metabolic functions.................................................................................................... 77
Figure 4.3. Correlations between the mean monthly temperatures for three putative
foraging grounds for the population of leatherbacks nesting at Playa Grande, Costa
Rica. ........................................................................................................................... 78
xiii
Figure 4.4. Correlations between the mean monthly temperatures for four putative
foraging grounds for the population of leatherbacks nesting at St. Croix, US Virgin
Islands. ....................................................................................................................... 79
Figure 4.5. Observed nesting numbers for the leatherback population at Playa Grande
(Costa Rica) and those predicted by the theoretical model, using temperature signals
from the Equator/Upper South Equatorial Gyre (EQS1) and Lower South Equatorial
Gyre (S2) foraging grounds and the exponential metabolic function. ...................... 80
Figure 4.6. Observed remigration intervals for the leatherback population nesting at Playa
Grande (Costa Rica) and those predicted by the theoretical model, using temperature
signals from the Equator/Upper South Equatorial Gyre (EQS1) and Lower South
Equatorial Gyre (S2) foraging grounds and the exponential metabolic function. ..... 81
Figure 4.7. Observed nesting numbers for the leatherback population at St. Croix (US
Virgin Islands) and those predicted by the theoretical model, using temperature
signals from the Bay of Biscay/Mauritania (BBMA) and Flemish Cap/North Atlantic
Subtropical Gyre (FCNA) foraging grounds and the Monod metabolic function. .... 82
Figure 4.8. Observed remigration intervals for the leatherback population nesting at St.
Croix (US Virgin Islands) and those predicted by the theoretical model, using
temperature signals from the Bay of Biscay/Mauritania (BBMA) and Flemish
Cap/North Atlantic Subtropical Gyre (FCNA) foraging grounds and the Monod
metabolic function. .................................................................................................... 83
xiv
Abstract
Mechanistic modeling of the effects of climate change on sea turtle migration to nesting
beaches
Noga Neeman
Supervisor: Michael P. O’Connor
The purpose of this dissertation was to study how sea turtles currently respond to
changes in temperature, in order to predict how they may respond to climate change in
the future. I looked at two of the most commonly reported responses to changes in
temperature: phenology shifts and changes in the duration of remigration intervals. I
studied how the timing of leatherback nesting at three nesting beaches responds to
temperature changes at both the nesting and the foraging grounds. There was no effect for
local temperatures, but there was an overall trend for delayed nesting with increased
temperatures at the foraging grounds. Deviations from this trend as well as different
trends found in other studies suggest that the phenological response is complex and
variable. To look at remigration intervals, I developed a theoretical, physiologically-
based model that links temperature to resource availability and its accumulation by sea
turtles, remigration intervals, and nesting numbers. The model shows that apparent
nesting cohorts are formed not by life history traits but rather by a population-level
response to environmental temperatures and that these cohorts are unstable over time.
Using the model to explore different temperature history scenarios showed that short
pulses of altered temperatures can have a large effect on nesting numbers. Cold pulses
tend to synchronize nesting in the following year, owing to decreased remigration

xv
intervals, while warm pulses tend to delay nesting in a less synchronized way. Cyclical
temperature variation increases remigration intervals in general and leads to a cyclical
response in both remigration intervals and nesting numbers, with a lag and amplitude that
vary with cycle duration. Adapting this model to specific populations of leatherback
turtles reveals that it is able to capture both year-to-year and decade-to-decade trends in
remigration intervals for both populations. Due to the difficulties in isolating the effect of
strong population trends on nesting numbers and oscillations, it is unable to predict
nesting numbers. Future model iterations should include inherent population trends to
allow for better comparison and forecasting as well as using the model to help plan
conservation efforts and properly interpret changes in nesting numbers.

1
CHAPTER 1: General Introduction
According to the latest meteorological data (IPCC 2013), it is certain that global
mean temperature has increased since the late 19th century. The past three decades have
all been warmer than any of the previous decades in the historical instrumental record,
and they have each been warmer than the last (IPCC 2013). Over the past 100 years, the
global average temperature has increased by about 0.85°C and this warming trend is
expected to increase at accelerated rates, in conjunction with the continued emission of
CO2 and other greenhouse gases (Hughes 2000, McMahon & Hays 2006, Hawkes et al.
2009, IPCC 2013).
The physical features of the earth’s surface, such as sea ice and glaciers, are
responding to climate change in a predictable way (Hughes 2000). In addition, the
anomalous climate of the 20th century is already affecting many taxonomic groups in
ways that are consistent with theoretical predictions (Hughes 2000, Parmesan 2006).
Meta-analyses of long term data sets indicate widespread, globally coherent, predictable
changes in response to climate change, in biological systems ranging from polar
terrestrial to tropical marine (Hughes 2000, Parmesan & Yohe 2003, Root et al. 2003,
Parmesan 2006, Hawkes et al. 2009).
The predicted effects of climate change on species and ecological communities
can be divided into four categories: effects on physiology (such as metabolic and
developmental rates and processes like respiration and growth), effects on species
distributions (such as density and range shifts), effects on phenology (the timing of life
cycle events triggered by environmental cues), and effects on genetic frequency (this type
2
of adaptation is most likely to occur in species with short generation times and large
population growth rates) (Hughes 2000, Root et al. 2003, Parmesan 2006). These changes
in physiology, distribution, and phenology can alter interactions between species and thus
local abundances and community composition (Hughes 2000, Parmesan 2006).
Extant sea turtles species arose during the middle-late Jurassic period and have
undoubtedly survived climate shifts in their evolutionary past, probably by shifting their
migratory routes, changing their foraging and nesting grounds, and adjusting
physiological parameters (Poloczanska et al. 2009). However, it is unclear whether or not
they will be able to adapt to anthropogenic climate change at its unprecedented rate
(Davenport 1997, Hawkes et al. 2007a, Poloczanska et al. 2009, Witt et al. 2010, Fuentes
et al. 2012).
Sea turtles inhabit a wide range of habitats throughout their life history, including
temperate and tropical sandy beaches where they nest, tropical and subtropical waters,
oceanic frontal systems and gyres, coastal mangrove forests, reefs, seagrass beds and
other shallow foraging areas (Musick & Limpus 1997, Spotila 2004, Poloczanska et al.
2009). During their development they may cross and interact with major oceanic currents
(Shillinger et al. 2008, Poloczanska et al. 2009).
All marine turtle species are considered vulnerable to climate change due to their
temperature-dependent sex determination (Davenport 1997, Hawkes et al. 2009,
Poloczanska et al. 2009), their long age to maturity (Scott et al. 2012, Poloczanska et al.
2009), their fidelity to both foraging and nesting grounds (Limpus et al. 1992, Davenport
1997, Broderick et al. 2007), and their current conservation status which is already
threatened due to anthropogenic pressures (Hawkes et al. 2009, Poloczanska et al. 2009).
3
Sea turtles will likely be impacted by climate change throughout the habitats they use and
throughout their life history stages (Hawkes et al. 2009, Poloczanska et al. 2009).
As developing embryos, sea turtles will be faced with altered incubation
conditions and duration (Chaloupka et al. 2008, Hawkes et al. 2009, Poloczanska et al.
2009), which may lead to feminization of embryos due to temperature-dependent sex
determination (Hawkes et al. 2007a, Fuentes et al. 2010) as well as increased egg and
hatchling mortality (Santidrian-Tomillo et al. 2012). Females could alter aspects of their
behavior to select for cooler nest sites (e.g. shaded areas, altering phenology to nest
during rainy seasons, altering migratory routes to nest at at higher latitudes), although
their capacity for this sort of adaptation is questionable (Hawkes et al. 2009).
As hatchlings and juveniles, changes in pelagic temperatures will mean changes
in the currents upon which sea turtles depend (Hawkes et al. 2009). Since hatchlings
disperse mostly due to passive drift on oceanic currents, this will lead to altered spatial
fate (Blanco 2010, Gaspar et al. 2012, Shillinger et al. 2012) as well as changes in the
abundance and composition of their predators and their prey (Hawkes et al. 2009). This
will affect mortality, growth rates and maturation. The full extent of the effects of these
changes remain unknown and are difficult to predict (Hawkes et al. 2009).
As adults, since sea turtles forage over large oceanic areas, it is possible that
widespread distribution will mitigate the effects of temperature on their prey distribution
and, therefore, their resource acquisition (Hawkes et al. 2009). However, since sea
surface temperature (SST) is an important determinant of their distribution and currents
have an unknown influence on their migrations, the effects of climate change are difficult
to predict (McMahon & Hays 2006, Hawkes et al. 2009). Observed effects on nesting
4
females include: decreased nesting abundance (Chaloupka et al. 2008), increased (Solow
et al. 2002) or decreased remigration probability (Saba et al. 2007), and decreased clutch
size (Mazaris et al. 2008).
Leatherback turtles, Dermochelys coriacea, feed on gelatinous zooplankton, for
which they forage in cold waters (Davenport 1997, James et al. 2005). From their
foraging grounds, they migrate to nest on tropical and subtropical beaches every 2-7
years (Reina et al. 2002, Bell et al. 2003, Santidrian-Tomillo et al. 2007). Leatherback
turtles are classified as critically endangered, owing mostly to population sizes and trends
inferred from nesting abundance studies (Spotila et al. 1996, Spotila et al. 2000,
Santidrian-Tomillo et al. 2007).
The Pacific subpopulation of leatherbacks is declining dramatically (Spotila et al.
1996, Santidrian-Tomillo et al. 2007) while different Caribbean subpopulations are either
stable to slowly declining (Troëng et al. 2004, 2007) or increasing (Robinson et al. 2014).
The main threats to these populations include incidental capture by fisheries (Spotila et
al. 1996, Santidrian-Tomillo et al. 2007), killing of nesting females on nesting beaches
(Troëng et al. 2004) , low overall hatching success (Bell et al. 2003, Ralph et al. 2005),
and illegal egg collection (Troëng et al. 2004, Santidrian-Tomillo et al. 2007).
With this dissertation, I set out to determine the potential effects of climate
change on leatherback turtle nesting migrations and population dynamics. I have focused
on the effects of rising temperature on their nesting phenology and remigration intervals
and studied three nesting populations, in collaboration with the organizations in charge of
their long-term monitoring and conservation: Playa Grande (Costa Rica), Tortuguero
(Costa Rica), and St. Croix (US Virgin Islands).
5
Phenological shifts in response to climate change
By far, the majority of observations of climate change response have involved
alterations in species’ phenology (Parmesan 2006). Phenological shifts have been
reported across taxonomic groups and across habitats (Parmesan & Yohe 2003, Root et
al. 2003). These include: plant flowering and budding; insect migrations, larval
development and emergence; and fish, amphibian, and bird reproduction and migrations
(Parmesan & Yohe 2003, Root et al. 2003, Parmesan 2006, Miller-Rushing and Primack
2008).
Several sea turtle species have been reported to shift their nesting seasons in
response to increasing temperatures: Green turtles (Chelonia mydas) nest earlier
(Weishampel et al. 2010) or do not shift their nesting seasons (Pike 2009) in Florida and
delay their nesting in the South-West Indian Ocean (Dalleau et al. 2012), while
loggerhead turtles nest earlier in Florida (Weishampel et al. 2004, Pike et al. 2006, Pike
2009, Weishampel et al. 2010), North Carolina (Hawkes et al. 2007b), and in the
Mediterranean (Mazaris et al.2008, Mazaris et al. 2009). Leatherback turtles have been
shifting their nesting seasons both in St. Croix and in Playa Grande, though this is
thought not to correspond to major climatic indices (Robinson et al. 2014).
A complication in studying phenological response to changes in sea surface
temperatures is that sea turtles, due their extensive nesting migrations, might be
responding to very different temperature cues at their foraging and nesting grounds.
Some authors suggest that changes in temperature cue turtles to leave their foraging
6
grounds at particular times which determine their arrival at nesting beaches and the start
of their nesting as soon as they arrive (Mazaris et al. 2009), while others suggest that
turtles arrive early at the nesting beaches and wait for optimal environmental conditions
in order to begin nesting (Eckert & Eckert 1988, Pike 2009).
In chapter 2, I investigate potential thermal cues for leatherback migration and
nesting for three populations (Playa Grande, Costa Rica; Tortuguero, Costa Rica; and
Sandy Point, US Virgin Islands), both at their foraging grounds and their nesting beaches.
I also examine the relationship between SST and net primary production (NPP, used as
an indicator of resource availability, Solow et al. 2002, Saba et al. 2007), as a possible
underlying mechanism for any observed phenological responses to changes in
temperature.
Change in remigration intervals in response to climate change
Sea turtles spend at least one year at their foraging grounds, accumulating
sufficient resources and body fat deposits to undertake their migration to distant nesting
beaches (Kwan 1994). Temperature changes at these foraging grounds can affect the
availability of resources, either primary or secondary production (Broderick et al. 2001,
Lynam et al. 2004, Richardson & Schoeman 2004, Hays et al. 2005).
Resource availability at the foraging grounds determines energy accumulation
rates and, therefore, the migratory schedules of sea turtles. Poor foraging conditions can
lead to delayed migration schedules and longer remigration intervals while good foraging
conditions can lead to shorter remigration intervals (Carr & Carr 1970, Chaloupka 2001,
7
Solow et al. 2002, Wallace et al. 2006, Saba et al. 2007, Troëng & Chaloupka 2007,
Hatase & Tsukamoto 2008, Suryan et al. 2009).
Individuals from a nesting population tend to experience similar foraging
conditions, so that nesting behavior becomes synchronized, leading to large oscillations
in yearly nesting numbers (Limpus & Nichols 1988, Hays 2000, Broderick et al. 2001,
Chaloupka 2001, Solow et al. 2002, Price et al. 2006, Chaloupka et al. 2008, Reina et al.
2002, Reina et al. 2009). These oscillations can obscure population trends and hinder the
assessment of general population trends (Broderick et al. 2001, Chaloupka 2001).
Due to these complications in assessing nesting trends and due to the added
urgency of their assessment in order to estimate and quantify the effects of climate
change on sea turtle population sizes and abundance, several authors have called for a
theoretical model than can unify the effects of climate change on resource acquisition by
individual turtles and the resulting effects on nesting numbers population dynamics (Price
et al. 2006, Chaloupka et al. 2008, Wallace & Jones 2008, Wallace & Saba 2009). With
climate change and its resulting temperatures changes at the foraging grounds, further
resource limitation is expected for sea turtles (Richardson & Schoeman 2004, Saba et al.
2007) as well as inevitable effects on population dynamics.
In Chapter 3, I present a simple, physiologically-based model that links
environmental temperatures to resource availability at the foraging grounds, which in turn
affect the energy stores and remigration probabilities of individual sea turtles within a
stable, theoretical population. This ultimately alters observed nesting numbers and may
allow for more realistic population projections under various climate change scenarios, as
8
the model depends on global average sea surface temperatures as its environmental
signal.
With such a model, it becomes possible to isolate the effects of climate change on
nesting populations in order properly identify other factors which may play an effect on
population sizes and trends, such as anthropogenic impacts (Saba et. al 2007). This can
then lead to improved forecasting at the nesting beaches, more effective management
strategies, and a better understanding of how climate change may already be affecting
nesting populations and what measures should be taken to mitigate these effects (Saba et
al. 2007, Chaloupka et al. 2008, Wallace & Jones 2008, Wallace & Saba 2009).
In order to determine whether the proposed model could indeed be used for these
purposes, in Chapter 4 I compare the model output (remigration intervals and nesting
numbers) with observed data from two nesting populations: Playa Grande, Costa Rica
and St. Croix, US Virgin Islands. These two populations show opposite overall trends:
decreasing for Playa Grande (Spotila et al. 1996, Santidrian-Tomillo et al. 2007) and
increasing for St. Croix (Robinson et al. 2014), so that testing the model under these
different circumstances makes it possible to determine whether or not the model can
capture the climate fingerprint despite the opposing population trends. It can also help
determine whether these opposite trends may be driven by climate or if there are other
factors influencing the populations.
9
CHAPTER 2: Phenology shifts in leatherback turtles (Dermochelys coriacea) due to
changes in sea surface temperature
Abstract
Sea turtles have responded to climate change in the past, but it is unclear whether
they will be able to respond to the unprecedented rate of anthropogenic climate change.
One way to respond would be altering the timing of their nesting to align with changes in
temperature, which may lead to altered incubation conditions, hatching success, sex
ratios, and hatchling dispersal. Here, I investigate whether the timing of the nesting
season for three populations of leatherback turtles (Playa Grande, Costa Rica;
Tortuguero, Costa Rica; and St. Croix, US Virgin Islands) varies with (and putatively in
response to) sea surface temperatures at either their nesting or foraging grounds, as a
proxy for how they would respond to warming trends. At the foraging grounds I
examined several candidate temperatures: annual maximum and minimum of the year
prior to nesting and month in which turtles were estimated to leave their foraging
grounds. At the nesting grounds I considered: temperatures at the start of nesting and
over the whole season as well as a measure of seasonality at the foraging grounds.
Seasonality at the foraging grounds and temperatures at the nesting beaches did not affect
nesting phenology, while temperatures at some foraging grounds did. Different
temperature signals appeared related to nesting at different foraging grounds as was the
direction in which these increased temperatures shifted nesting, suggesting that there
might be a mediating factor explaining the temperature effect. I therefore looked at the
relationship between temperature and primary production at the foraging grounds to
explain these differences but found no consistent relation between temperature and
10
production. The overall pattern is that increased temperatures at the foraging grounds
tend to delay nesting, which is different from previous studies for other species of sea
turtles that show earlier nesting with increased temperatures either at nesting or foraging
grounds. Further study is needed at the nesting beaches to determine how environmental
conditions change within the season and how these changes affect nesting success, so that
it’s possible to predict what temperature, humidity, and currents will look like in the new,
shifted nesting seasons and how that will affect hatching success, sex ratios, and
hatchling dispersal; i.e., will delayed nesting seasons help mitigate climate change effects
on these populations or exacerbate them?
Introduction
The ecological effects of climate change are already apparent in an increasing
number of species (Hughes 2000). Meta-analyses have discerned widespread, predictable
changes in species distribution and phenology in response to climate change (Parmesan &
Yohe 2003, Root et al. 2003). There are several possible mechanisms by which species
can adapt to climate change, including density and range shifts, morphological changes,
shifts in genetic frequency (Root et al.2003), and physiological adaptations (Hughes
2000). The most commonly studied responses to climate change are shifts in phenology,
or changes in the timing of seasonal events (Parmesan 2006). Phenological changes have
been observed across diverse groups including shifts in plant flowering, tree budburst,
arrival of migrant butterflies, bird nesting, amphibian spawning, insect larval
development, spring greening, and fish spawning (Parmesan & Yohe 2003, Root et al.
2003, Parmesan 2006, Miller-Rushing and Primack 2008).
11
Sea turtles have survived climate shifts in their evolutionary past but it is unclear
how and whether they will be able to adapt to the unprecedented rate at which climate
change is currently occurring (Davenport 1997, Hawkes et al. 2007b, Poloczanska et al.
2009, Witt et al. 2010, Fuentes et al. 2012). Some effects of increased temperatures have
already been observed in sea turtles, such as decreased nesting abundance (Chaloupka et
al. 2008), feminization of embryos due to temperature-dependent sex determination
(Hawkes et al. 2007b, Fuentes et al. 2010), increased (Solow et al. 2002) or decreased
remigration probability (Saba et al. 2007), decreased clutch size (Mazaris et al. 2008),
and increased egg and hatchling mortality (Santidrian Tomillo et al. 2012).
Changes in phenology may mitigate the effects of climate warming, e.g. by
nesting when temperature is lower (Saba et al. 2012). These changes play an important
role in the capacity of sea turtles to survive climate change because their fidelity to both
foraging and nesting grounds (Limpus et al. 1992, Davenport 1997, Broderick et al.
2007) limits their ability to adapt to climate change through spatial changes in nesting
distribution. It also means that they might have to respond to two sets of cues at two
distinct, geographically separated locations: their foraging and nesting grounds. Sea
turtles are also limited in their response to climate change by several life history features:
their long generation times (Scott et al. 2012), their physiological dependence on
favorable temperatures which makes physiological adaptation more difficult (Davenport
1997, Hawkes et al. 2009), and by the fact that they are already endangered due to
anthropogenic factors (Hawkes et al. 2009, Poloczanska et al. 2009).
Phenological shifts might also mean that developing nests now face a potentially
different set of conditions such as temperature and rainfall, which will determine their sex
12
ratios (Ackerman 1997, Hays et al. 2010, Katselidis et al. 2012) and hatching success
(Miller 1997, Saba et al. 2012). In addition, since hatchlings disperse after emergence
mostly due to passive drift on oceanic currents, which change at different times of the
year, phenological shifts may alter their spatial fate and possible survival (Blanco 2010,
Gaspar et al. 2012, Shillinger et al. 2012).
Sea turtles have been demonstrated to shift their nesting seasons in response to
increased temperature, but in different ways. Green turtles (Chelonia mydas) nest earlier
(Weishampel et al. 2010) or do not shift nesting dates (Pike 2009) in Florida and nest
later in the South-West Indian Ocean (Dalleau et al. 2012), while loggerhead turtles nest
earlier in Florida (Weishampel et al. 2004, Pike et al. 2006, Pike 2009, Weishampel et al.
2010), North Carolina (Hawkes et al. 2007b), and in the Mediterranean (Mazaris et
al.2008, Mazaris et al. 2009). Differences between sites might be explained by stronger
temperature responses at higher latitudes (Mazaris et al. 2013). Previous studies on
leatherback populations in Costa Rica and the US Virgin Islands show that leatherback
turtles are shifting their seasons, but that the shift does not correspond to major climatic
indices (Robinson et al. 2014). Thus, the signals that sea turtles respond to are unclear
and the driving forces that determine their behavior may also vary between species and
populations.
Leatherback turtles forage for gelatinous zooplankton in cold waters (Davenport
1997, James et al. 2005) and migrate to nest in tropical and subtropical beaches every 2-7
years (Reina et al. 2002, Bell et al. 2003, Santidrian-Tomillo et al. 2007). If temperature
provides the cue for reproductive migration, the mechanism by which this happens is
unclear, whether temperature influences turtles directly or is mediated by effects on food
13
availability. It is also unclear which temperature cue is more important. Some authors
suggest that turtles start their migration due to a temperature cue and then nest soon after
arriving at their nesting grounds (Mazaris et al. 2009), while others suggest that turtles
arrive early at the nesting beaches (Eckert & Eckert 1988, Pike 2009) in order to mate
with males and complete the development of their first clutch of eggs (Schofield et al.
2013). The cues would then be at the nesting grounds, where they would wait to nest
when the environmental conditions are optimal. (Eckert & Eckert 1988, Pike 2009,
Katselidis et al. 2012). This is confounded further due to findings that some leatherback
populations engage in foraging excursions during their internesting interval (Georges et
al. 2007, Byrnes et al. 2009), potentially encountering temperature or resource cues not
considered before.
Here I examine thermal cues for leatherback turtles to nest, by looking at
phenological shifts in turtles nesting at three beaches (Playa Grande, Costa Rica;
Tortuguero, Costa Rica; and Sandy Point, US Virgin Islands) and how those shifts relate
to sea surface temperature (SST) at both foraging and nesting sites. I also examine the
relationship between SST and net primary production (NPP, used as an indicator of
resource availability, Solow et al. 2002, Saba et al. 2007), as a possible underlying
mechanism for phenological responses to temperature changes. Since sufficiently long
data sets for the studied beaches are not available to look at climate change directly, I use
interannual variability to determine if leatherback turtles change their nesting phenology
in response to changes in oceanic temperature associated with climate change. From this
information, it becomes possible to make predictions about how leatherback turtles will
be able to adapt to conditions of climate change.
14
Methods
Study sites
Playa Grande (Figure 2.1) is a 3.5km long, low-medium energy beach located in
Pacific Northwest Costa Rica (10°20’N, 85°51’W). For this study, I considered it as one
nesting unit together with adjacent Playa Ventanas (Steyermark et al. 1996). I
circumscribed the following putative foraging grounds for leatherback turtles nesting at
Playa Grande (Saba et al. 2007,Shillinger et al. 2008, Shillinger et al. 2011): Equator
(5.5°S-5.5°N, 84.5-110.5°W), Upper South Equatorial Gyre (4.5-20.5°S, 79.5-120.5°W),
and Lower South Equatorial Gyre (24.5-35.5°S, 84.5-105.5°W). I split the South
Equatorial Gyre into two different areas to better represent its triangular shape and
possibly different conditions due to its extensive N-S range.
Tortuguero (Figure 2.2) is a 35.4km long, highly dynamic beach located on the
Caribbean coast of Costa Rica, between the Tortuguero River mouth (10°35’N, 83°31’W)
and the Parismina River mouth (10°19’N, 83°21’W) (Fowler 1979). I delineated the
following putative foraging sites for leatherback turtles nesting at Tortuguero, by looking
at tracking data available on the Sea Turtle Conservancy website
(http://www.conserveturtles.org/seaturtletracking.php): Gulf of Mexico (24.5-29.5°N,
83.5-95.5°W), Western North Atlantic (36.5-43.5°N, 54.5-68.5°W), and Eastern North
Atlantic (35.5-43.5°N, 10.5-20.5°W).
Sandy Point (Figure 2.3) is a 3km long, dynamic beach on St. Croix, US Virgin
Islands (17°40’N, 64°52’W) (Boulon et al. 1996). I chose putative foraging sites for
15
leatherback turtles nesting at Sandy Point, to match those studies for the Trinidad
population (Eckert 2006) due to a lack of tracking data for Sandy Point. They were as
follows: Bay of Biscay (34.5-45.5°N, 9.5-15.5°W), Flemish Cap (44.5-50.5°N, 34.5-
45.5°W), Mauritania (14.5-30.5°N, 14.5-25.5°W), and North Atlantic subtropical front
(34.5-40.5°N, 34.5-45.5°W).
Nesting data
At each beach, nesting by leatherbacks is documented each year (October to
March at Playa Grande, March-June at Tortuguero, and March-August at Sandy Point)
and nesting has been monitored by conservation organizations for at least 9 seasons. The
data used in this study are for the following nesting seasons (which occur at each beach
during the months listed above) for each of the sites (Playa Grande:1993-2012,
Tortuguero: 2002-2010, Sandy Point:1983-2010).
Turtle tracks are recorded during nightly patrols and daily morning surveys at
Playa Grande and Sandy Point, while they are recorded every three days at Tortuguero.
For this study, I counted all recorded tracks, without separating nests from tracks that did
not lead to a nesting event (false crawls) due to the difficulty in distinguishing real nests
and false crawls (both by volunteers in the field and while curating resulting data). A few
very early nests may be missed at the beginning of the season, so that no exact date can
be given for the start of nesting. Therefore, I approximated the start of nesting by looking
at the dates by which a small percentage of total nests for the season were laid, the 5th and
10thpercentiles of all nests during a single season. I interpolated these percentiles by
considering cumulative nests as a function of Julian date. Since nesting season extends
from one calendar year to the next in Playa Grande, I merged Julian dates between pairs
16
of years that corresponded to one nesting season (January first being 366, etc). Early
percentiles were comparable between the three nesting beaches and among different
years, with about 1% of the season’s nests laid each day, so it was not necessary to
standardize the percentiles between different nesting years.
For three out of the nine seasons in Tortuguero, more than 5% of nests were
missed at the beginning of the season (known because the first nesting survey counts all
visible nests on the beach and leatherback nests can stay visible for up to two weeks). It
was not possible to accurately parameterize the nest distributions for these seasons, so the
earliest date used was the 10th percentile. When looking at the nest distributions for the
seasons in which the 5th percentile was missed, they appear to be truncated at an early
stage in the season in which the number of nests per day is still low.
Temperatures
I used monthly average sea surface temperature (SST) from the NOAA NCEP
EMC CMB GLOBAL Reynolds and Smith v2 data set (Reynolds et al. 2002), available
on the International Research Institute for Climate and Society website
(http://iridl.ldeo.columbia.edu/docfind/databrief/cat-airsea.html). This dataset combines
ship, buoy and satellite-corrected temperature data at a resolution of 1x1°. For each
foraging site, I averaged out temperatures over the entire area, for each month. I
considered the following candidate SST cues at each foraging site: yearly maximum and
minimum for the year prior to nesting, and the temperature for the month at which I
estimated (based on available tracking data) that turtles would be starting their migration
to the nesting beach. Annual minimum and maximum temperatures were a proxy for long
term temperature shifts that might affect foraging conditions and resource acquisition,
17
while the temperature for the month at which migration was thought to start was a
possible cue for migration. For each nesting site, I looked at a 1x1 degree area centered
on the nesting beach and evaluated the average seasonal temperature (starting two months
prior to the start of nesting and including all nesting months) and the temperature for the
early part of the nesting season (two months prior to nesting and first month of nesting). I
include two months prior to the recorded start of the nesting season to account for sea
turtles arriving early to mate and complete first clutch development (Schofield et al.
2013).
Net Primary Production
I took average monthly Net Primary Production (NPP) estimates from the Ocean
Productivity website
(http://orca.science.oregonstate.edu/1080.by.2160.monthly.hdf.vgpm.s.chl.a.sst.php).
They were calculated using the Vertically Generalized Production Model (Behrenfeld &
Falkowski 1997) that estimated production based on surface chlorophyll concentrations
(from SeaWiFS for one data set and from MODIS for another), sea surface temperature
and photosynthetically active radiation. I averaged NPP estimates for all the cells in each
foraging area, for each month. In order to obtain a longer time series, MODIS NPP
estimates were regressed to the SeaWiFS estimates for which their dates overlapped and
(because they were very highly correlated) converted to SeaWiFS estimates and merged
with them.
Statistical analysis
18
For each nesting beach, I correlated the 5th and 10th percentile dates (or dates by
which 5 or 10 percent of all the nests for the season were laid) with each of the candidate
temperatures for each of the population’s foraging sites (maximum, minimum, and
migration month) as well as with the first month and seasonal average for local
temperature at the nesting site.
In order to determine whether there was an effect of seasonality (i.e., early or late
annual shifts in warming or cooling) at the foraging grounds on nesting dates, I used the
de-trended temperature data from 1982 to 2010 at each of the foraging grounds and
calculated the temporal deviation between when temperatures are reached in an average
year and when they are reached each recorded year. For each foraging ground, I
correlated the average deviation for the months prior to the estimated departure date with
the 5th and 10th percentile dates.
For the relationship between NPP and temperature, NPP estimates are only
available from 1997 to 2009, which omits some of the years for which nesting data are
available. Therefore, it was not possible to correlate nesting data with NPP without losing
a large volume of nesting data. Instead, to see if any of the relationships actually reflected
an underlying relationship with NPP, I correlated temperature with NPP for each of the
foraging sites. Since the magnitude and direction of the relationship between temperature
and NPP changes throughout the year, these analyses were completed separately for each
month as well as between the relevant temperature (for each foraging ground) and
maximum, minimum, and average yearly NPP.
19
Results
I tested a total of 72 correlations between nesting dates and candidate
temperatures, of which 10 were significant or suggestive for both the earliest and second
percentiles tested. I chose these relationships as ecologically relevant and explored them
further by looking at the relationships between SST and NPP. I also tested 20 correlations
between seasonal offsets in the timing of temperatures and nesting dates, of which one
was significant at the earliest percentile tested but not at the second percentile tested. I
did not consider this relationship ecologically relevant and, therefore, did not study it
further.
There was no correlation between nesting dates and local beach SST for any of
the nesting beaches, either for the early nesting period or for the average seasonal
temperature. Each nesting beach had at least one foraging site at which temperature was
correlated to nesting date (Table 1).
For Playa Grande, nesting date was correlated with the July temperature at the
lower South Equatorial Gyre (r = 0.501, p = 0.024, n = 20, Figure 2.4).
For Tortuguero, nesting date was correlated with annual minimum temperature at
the Western North Atlantic (r = 0.824, p = 0.006, n = 9, Figure 2.5A) and with January
temperatures in the Gulf of Mexico (r = -0.760, p = 0.017, n = 9, Figure 2.5B).
For Sandy Point, nesting date was correlated with the annual minimum at the Bay
of Biscay (r = 0.386, p = 0.043, n = 28, Figure 2.6A) and with the annual maximum at the
Flemish Cap (r = 0.398, p = 0.035, n = 28, Figure 2.6B).
20
There were no consistent correlations between the relevant temperatures for each
foraging ground and yearly minimum, average, or maximum NPP, nor between
temperature and NPP for the relevant months (data not shown). There was also no
correlation between the measure of seasonality used and nesting dates (data not shown).
Discussion
I attempted to distinguish whether it was temperature at the foraging grounds or at
the nesting grounds that served as a cue for leatherback turtles to travel to their nesting
sites. There was no shift in nesting phenology at any site due to local temperatures near
the nesting beach. This is more consistent with the hypothesis (Mazaris et al. 2009) that
these turtles start their migration due to temperature cues at the foraging grounds than
with the hypothesis that they arrive at the nesting beach early and wait for an optimal
local temperature cue (Eckert & Eckert 1988, Pike 2009). It is worth noting that these
individuals might travel to foraging grounds during their nesting period (see Georges et
al. 2007, Byrnes et al. 2009), providing new foraging areas that have not been studied
and cues not explored here.
At the foraging grounds, there was no correlation between nesting phenology and
the seasonal offsets in the timing of temperatures, i.e. early vs late dates of achieving
mean seasonal temperatures. There were some significant correlations of nesting dates
with candidate foraging ground temperatures. None of these correlations are strongly
significant and there were many correlations, so it is possible that these relationships are
false positives. Given the multiplicity of foraging sites per nesting beach and the many
21
factors that may affect how turtles decide when to migrate (Parmesan 2006) it remains
surprising that each of the beaches in this study had at least one foraging site for which
temperature correlated with observed nesting dates.
The data suggest that migratory cues are complex and might differ between
nesting beaches and among foraging grounds for the same nesting beach. There was no
indication that sea turtles respond to changes in seasonality at the foraging grounds, but
there were diverse responses to temperature: some foraging populations appear to
respond to minimum annual temperatures (Western North Atlantic and Bay of Biscay),
some to maximum temperatures (Flemish cap) and some to temperature in the month in
which their migration starts (Lower South Equatorial Gyre and Gulf of Mexico). It is not
apparent that any common underlying factor drives all of these correlations.
The most common trend is for increased temperatures at the foraging grounds to
lead to later nesting for leatherback turtles. This was observed for all except one of the
foraging grounds. This is different from results of other studies on nesting beaches
(Weishampel et al. 2004, Hawkes et al. 2007b, Mazaris et al.2008, Mazaris et al. 2009,
Pike 2009, Weishampel et al. 2010) in which increased temperatures lead to earlier
nesting or did not affect nesting dates. This difference might be explained by mean sea
surface temperature, with warmer waters showing different effects than colder waters as
observed in the different foraging grounds for the Tortuguero nesting population in this
study.
At Tortuguero, increased temperatures at different foraging grounds appear to
have opposite effects on nesting dates. This means that looking at median nesting dates
22
would no longer show the effect, because individuals would have arrived from several
foraging grounds therefore obscuring the separate effects for each site. Indeed, median
nesting dates showed no correlation to temperature in the present study (data not shown).
Another possible explanation for not finding an effect of temperature on median nesting
dates is that multiple nests are already counted for each individual turtle when looking at
median nesting dates, so they become very sensitive to any changes in nesting start date,
end date, and interesting interval. This highlights the importance of looking both at
median nesting dates and at early nesting dates. These two possibilities offer different
signals with different sensitivities as well as potentially different evolutionary
implications
The relative lack of net primary production data made it impossible to correlate
nesting dates directly with NPP without losing a large part of the nesting data, but no
patterns emerged from the relationship between temperature (correlated with nesting) and
NPP at the foraging grounds. The diversity of relationships between temperatures (that
correlated with nesting date) and simultaneous NPP estimates suggests that the effect of
temperature on nesting phenology was not driven by NPP. The NPP was used as an
indicator of resources available to the turtles. It is possible, however, that NPP is poorly
correlated with the abundance of jellyfish, the dominant food item for leatherback turtles,
or that a lag exists between temperature changes and jellyfish population response such
that temperature may actually be a better indicator of leatherback resource availability
(Sherrill-Mix et al. 2008). Another possibility is that this study did not adequately reflect
the relationship between temperature and primary production at each site, due to
insufficient data.
23
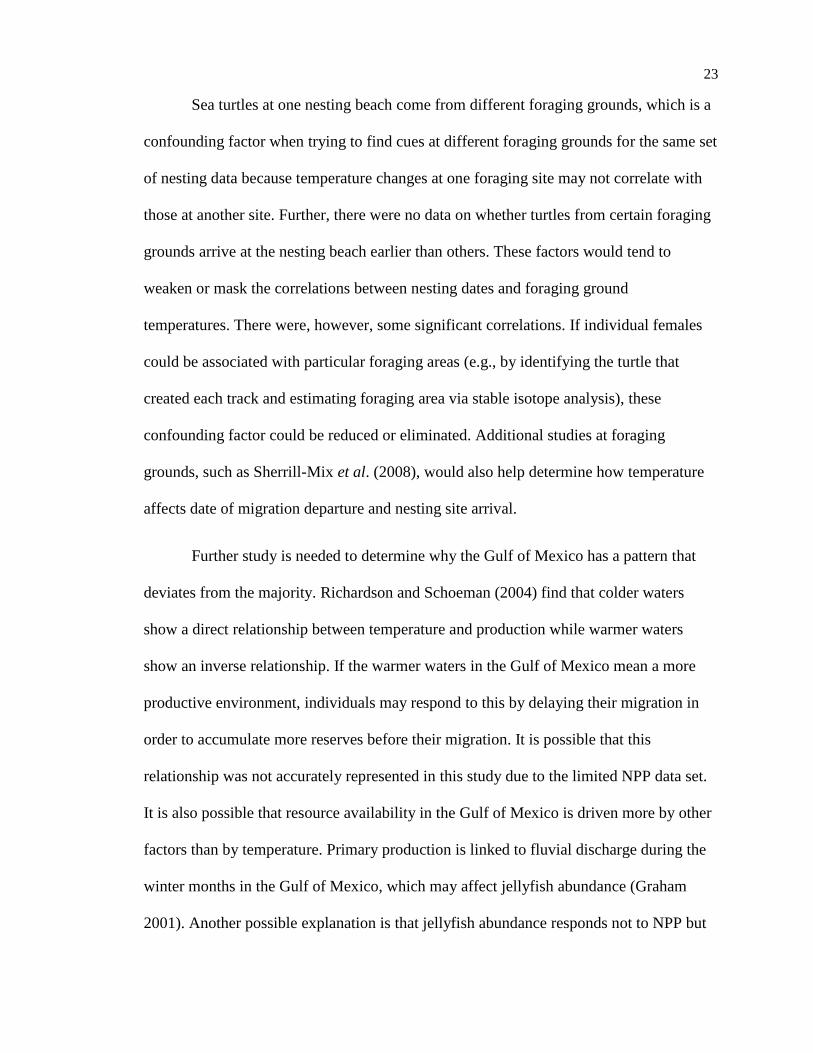
Sea turtles at one nesting beach come from different foraging grounds, which is a
confounding factor when trying to find cues at different foraging grounds for the same set
of nesting data because temperature changes at one foraging site may not correlate with
those at another site. Further, there were no data on whether turtles from certain foraging
grounds arrive at the nesting beach earlier than others. These factors would tend to
weaken or mask the correlations between nesting dates and foraging ground
temperatures. There were, however, some significant correlations. If individual females
could be associated with particular foraging areas (e.g., by identifying the turtle that
created each track and estimating foraging area via stable isotope analysis), these
confounding factor could be reduced or eliminated. Additional studies at foraging
grounds, such as Sherrill-Mix et al. (2008), would also help determine how temperature
affects date of migration departure and nesting site arrival.
Further study is needed to determine why the Gulf of Mexico has a pattern that
deviates from the majority. Richardson and Schoeman (2004) find that colder waters
show a direct relationship between temperature and production while warmer waters
show an inverse relationship. If the warmer waters in the Gulf of Mexico mean a more
productive environment, individuals may respond to this by delaying their migration in
order to accumulate more reserves before their migration. It is possible that this
relationship was not accurately represented in this study due to the limited NPP data set.
It is also possible that resource availability in the Gulf of Mexico is driven more by other
factors than by temperature. Primary production is linked to fluvial discharge during the
winter months in the Gulf of Mexico, which may affect jellyfish abundance (Graham
2001). Another possible explanation is that jellyfish abundance responds not to NPP but
24
to episodes of hypoxia in the Gulf of Mexico, which are linked to temperature (Diaz &
Solow 1999, Diaz & Rosenberg 2008). Such hypotheses could explain a resource driven
effect that resulted in no apparent correlation with NPP, but a significant correlation with
surface temperatures.
In conclusion, I am unable to offer specific management implications because
there were no consistent patterns other than an overall trend towards later nesting with
increased temperatures at the foraging grounds. Instead, it appears that migratory cues are
complex and variable between sites. This raises the possibility that there might not be an
overarching effect of temperature on nesting dates, but rather various local population
effects. There was no support for local sea surface temperature effects on nesting dates
but there was a trend for altered nesting dates due to increased temperatures at the
foraging grounds. This favors the hypothesis that foraging grounds are central to nesting
phenology. The present study also highlights the importance of looking at early nesting
percentiles as well as median nesting dates when studying nesting phenology. The trend
toward delayed nesting due to increased temperatures at the foraging grounds is not
consistently driven by temperature effects on NPP. Further study is needed to determine
why the Gulf of Mexico shows the opposite trend and what this says about which cues
sea turtles actually respond to when initiating their nesting migrations: how does
temperature cue nesting and why is this different at different sites?
Further studies at the foraging sites should determine what other factors are
related to the timing of sea turtle migration other than temperature, e.g. bathymetry and
currents, in order to present a more complete picture of the cues that turtles respond to. At
the nesting beaches, research should focus on how environmental conditions change

25
within the season and how they affect nesting success, so that it is possible to predict
what temperature, humidity, and currents will look like in the new, shifted nesting
seasons and how that will affect hatching success, sex ratios, and hatchling dispersal.
Will delayed seasons help mitigate climate change effects on these populations or
exacerbate them?
26
Tables and Figures
Table 2.1. Correlations tested between leatherback turtle nesting dates and potential
temperature cues at nesting beaches and foraging grounds
Nesting populations
Playa Grande, Costa
Rica
Tortuguero, Costa
Rica
St. Croix, US Virgin
Islands
Local temperature
Early nesting period r = 0.174, p = 0.462 r = 0.587, p = 0.097 r = -0.023, p = 0.905
Seasonal Average r = 0.249, p = 0.289 r = 0.281, p = 0.463 r = -0.043, p = 0.824
Foraging temperatures
Equator Gulf of Mexico Flemish Cap
Annual maximum r = -0.026, p = 0.912 r = -0.182, p = 0.639 r = 0.337, p = 0.079
Annual minimum r =0. 391, p = 0.088 r = 0.367, p = 0.331 r = 0.210, p = 0.283
Departure month r = 0.180, p = 0.450 r = -0.760, p = 0.018* r = 0.278, p = 0.152
Upper South
Equatorial Gyre
Eastern North.
Atlantic
North Atlantic
Subtropical Front
Annual maximum r = 0.162, p = 0.495 r = -0.084, p = 0.831 r = 0.229, p = 0.241
Annual minimum r = 0.481, p = 0.031* r = -0.335, p = 0.379 r = 0.108, p = 0.585
Departure month r = 0.211, p = 0.371 r = 0.421, p = 0.260 r = 0.281, p = 0.147
Lower South
Equatorial Gyre
Western North
Atlantic Bay of Biscay
Annual maximum r = 0.237, p = 0.315 r = 0.242, p = 0.531 r = 0.145, p = 0.463
Annual minimum r = 0.415, p = 0.068 r = 0.824, p = 0.006* r = 0.386, p = 0.043*
Departure month r = 0.501, p = 0.024* r = 0.169, p = 0.664 r = -0.052, p = 0.791
Mauritania
Annual maximum
r = 0.151, p = 0.443
Annual minimum
r = 0.351, p = 0.067
Departure month r = 0.157, p = 0.424
Note: these results correspond to the earliest percentiles tested for each nesting population. I only
considered correlations meaningful if they were significant or suggestive (p<0.1) for both the earliest and
second earliest percentile tested.
27
Figure 2.1. Boundaries of foraging grounds for compilation of sea surface temperature
and net primary production data for leatherback turtles nesting at Playa Grande, Costa
Rica.
28
Figure 2.2. Boundaries of foraging grounds for compilation of sea surface temperature
and net primary production data for leatherback turtles nesting at Tortuguero, Costa Rica.
29
Figure 2.3. Boundaries of foraging grounds for compilation of sea surface temperature
and net primary production data for leatherback turtles nesting at Sandy Point, St. Croix,
US Virgin Islands
30
Figure 2.4. July temperature at the Lower South Equatorial Gyre in relation to the date by
which 5% of nests have been laid at Playa Grande, Costa Rica.
31
Figure 2.5A. Yearly minimum temperature at the Western North Atlantic in relation to
the date by which 10% of nests have been laid at Tortuguero, Costa Rica.
32
Figure 2.5B. January temperature at the Gulf of Mexico in relation to the date by which
10% of nests have been laid at Tortuguero, Costa Rica.
33
Figure 2.6A. Annual minimum temperature at the Bay of Biscay in relation to the date by
which 5% of nests have been laid at St Croix, US Virgin Islands.
34
Figure 2.6B. Annual maximum temperature at the Flemish Cap in relation to the date by
which 5% of nests have been laid at St Croix, US Virgin Islands.
35
CHAPTER 3: A simple, physiologically-based model of sea turtle remigration
intervals and nesting population dynamics: effects of temperature
Abstract
Variation in the yearly number of sea turtles nesting at rookeries can interfere
with population estimates and obscure real population dynamics. Previous theoretical
models suggested that this variation in nesting numbers may be driven by changes in
resources at the foraging grounds. I developed a physiologically-based model that uses
mean global temperatures to predict foraging conditions, resource accumulation,
remigration probabilities, and, ultimately, nesting numbers for a stable population of sea
turtles. I used this model to explore several scenarios of temperature variation at the
foraging grounds, including one-year perturbations and cyclical temperature oscillations.
I found that thermally driven resource variation can indeed synchronize nesting in groups
of turtles, creating cohorts, but that these cohorts tend to break down over 5-10 years
unless regenerated by environmental conditions. Cohorts were broken down faster at
lower temperatures. One-year perturbations of low temperature had a synchronizing
effect on nesting the following year, while high temperature perturbations tended to delay
nesting in a less synchronized way. Cyclical temperatures lead to cyclical responses both
in nesting numbers and remigration intervals, with the amplitude and lag of the response
depending on the duration of the cycle. Overall, model behavior is consistent with
observations at nesting beaches. Future work should focus on refining the model to fit
particular nesting populations and testing further whether or not it may be used to predict
observed nesting numbers and remigration intervals.
36
Introduction
Abiotic environmental factors, resource limitation, and physiology are major
influences on an organism’s life history. An individual’s physiological state interacts with
the biophysical environment to determine the total amount of resources available to
allocate to different processes, such as maintenance, growth, storage, and reproduction
(Dunham et al. 1989).
For sea turtles, this sort of consideration is crucial at the foraging grounds, where
adult individuals spend at least one year acquiring sufficient body fat deposits to
undertake their migration to distant rookeries to reproduce (Kwan 1994). Changes in
oceanographic conditions or climatic indices affect resource availability at the foraging
grounds: either primary production, relevant to herbivorous green turtles (Broderick et al.
2001, Richardson & Schoeman 2004), or the abundance of prey items for carnivorous
species (Lynam et al. 2004, Hays et al. 2005).
These environmental conditions and their associated resource availability at the
foraging grounds, may shorten or extend the remigration interval, the period between
nesting attempts for an individual turtle. Poor foraging conditions lead to longer
remigration intervals and good conditions lead to shorter remigration intervals (Carr &
Carr 1970, Chaloupka 2001, Solow et al. 2002, Wallace et al. 2006, Saba et al. 2007,
Troëng & Chaloupka 2007, Hatase & Tsukamoto 2008, Suryan et al. 2009).
Since many individuals may experience similar foraging conditions, nesting
behavior may become synchronized and lead to great variation in the number of turtles
37
observed nesting each year (Limpus & Nichols 1988, Hays 2000, Broderick et al. 2001,
Chaloupka 2001, Solow et al. 2002, Troëng & Rankin 2004, Price et al. 2006, Chaloupka
et al. 2008, Reina et al. 2009). This interannual variability in nesting numbers can
obscure long term trends and make it more difficult to assess general population size and
trends through nesting numbers (Broderick et al. 2001, Chaloupka 2001).
Several authors have called for a theoretical model that can bring together the
effects of changing climatic conditions at the foraging grounds, resource acquisition by
individual turtles, and the resulting population dynamics at nesting beaches (Price et al.
2006, Chaloupka et al. 2008, Wallace & Jones 2008, Wallace & Saba 2009). The need
for this sort of model is more urgent due to the effects of anthropogenic climate change.
With climate change, temperatures will rise at the foraging grounds, leading to further
resource limitation for sea turtles (Richardson & Schoeman 2004, Saba et al. 2007) and
inevitable effects on population dynamics.
Hays (2000) developed a model for a stable population of adult female sea turtles
in which each individual chooses to re-nest every 3 or 4 years with equal probability.
This re-nesting interval is then adapted due to the average environmental conditions
(randomly assigned to each year) since the last nesting attempt: having experienced better
than average years leads to nesting one year earlier while having experienced worse than
average years leads to delaying nesting by one year. I refined this model so that the
quality of the year (production, in this model) is a function of temperature.
I propose a simple model that links environmental temperatures to resource
availability at the foraging grounds, affecting individual energy stores and, therefore, the
probability of remigrating to the nesting beach. This ultimately links to nesting numbers
38
and could allow for more realistic population projections under various climate change
scenarios.
Methods
I used an individual-based model of turtle remigration, similar to that of Hays
(2000), in which each year a turtle migrates to the nesting beach or not depending on the
net primary production since its last nesting year. In order to introduce thermal and
resource accumulation effects into the Hays (2000) framework, I developed simple
representations of the effects of temperature on production and those of production on
remigration probabilities. Temperature is represented as the Global Land-Ocean
Temperature Index (LOTI), an estimate for mean global temperatures since 1880 as a
deviation from 13°C, available on the Goddard Institute for Space Studies website
http://data.giss.nasa.gov/gistemp/).
Forcing functions
The relationship between production and sea surface temperature is complex, with
colder waters showing a positive correlation between temperature and production while
warmer waters show a negative correlation (Chavez et al.1999, Richardson & Schoeman
2004). The transition between the two patterns occurs around 13°C (Richardson &
Schoeman 2004). Because sea surface temperature for sea turtles is virtually always
above 13°C and because the 15°C isotherm is the cold limit to sea turtle distribution
(Davenport 1997, McMahon & Hays 2006), an inverse relationship between sea surface
temperature and production is appropriate.
39
Richardson and Schoeman (2004) present a good summary of how the
relationship between temperature and production may change with mean temperature, but
they do not find significant relationships for particular temperatures or ranges of
temperatures. I therefore chose a simple, inverse relationship between temperature and
annual production, and adapted the coefficients so that the annual production values
included those available in the literature for the foraging grounds of studied populations
(Wallace and Saba 2009). The final relationship was
PP = 300/T – 125 (1)
where PP is annual production and T is the temperature deviation from 13°C in
the LOTI dataset, which ranges between 0.54 and 1.65°C.
The probability of remigration to the nesting beach in any given year is thought to
depend on resource (e.g. energy) accumulation and hence on metabolic rates and resource
acquisition rates (Wallace & Jones 2008). Since metabolic rates for sea turtles and their
relationship to nutrient availability are largely unknown (Wallace & Jones 2008, Wallace
& Saba 2009), I ran the model using three different saturating functions (logarithmic,
Monod, and exponential) to try to reasonably represent a process that must reach a certain
threshold (Kwan 1994, Madsen & Shine 1999, Hays 2000). In each case, resource
accumulation was modeled as the available net primary production since the last nesting
attempt:
PR = ln(∑(PP)/150) (2)
PR = ∑(PP)/ (∑(PP)+150) (Monod) (3)
PR = 1-e-0.25∑(PP) (4)
40
where PR is the probability of remigration for a given year and PP is the annual
primary production. Production is summed over the years from the last nesting attempt to
the proposed nesting year (not including nesting years).
Algorithm
See appendix for the pseudocode (or brief outline) for the algorithm. Briefly, the model
iterates through years and then through individual turtles to determine whether or not
they will nest given their accumulated resources since the last nesting year.
Parameterization
I ran the models (see Appendix) under constant annual production values
corresponding to those found by Wallace and Saba (2009) for the leatherback populations
nesting at Playa Grande (Costa Rica) and St. Croix (US Virgin Islands) and compared the
model remigration intervals with the published values for these populations. The
logarithmic function, representing a flatter function which saturates less quickly than the
other proposed functions, provided the best fit to the published data (Figure 3.1) so it was
used for the modeled scenarios. This model “metabolic” function can be refined as the
process is understood better in sea turtles, by adjusting the type of equation (logarithmic,
Monod, exponential) as well as its parameters.
The model can be adapted to specific populations in two ways: by altering the
function that connects temperature to production to account for populations foraging at
sites with more or less resources (e.g. warmer vs. colder sites) and by altering the
41
function that defines the remigration probability to account for populations with faster or
slower resource acquisition rates.
Output
For each simulation I measured yearly: average temperature, average net primary
production, accumulated resources since last nesting attempt for each turtle, whether or
not each turtle nested, and its remigration interval if it did. This made it possible to
calculate the number of nesting turtles and the distribution of remigration intervals for
each year, which comprise the main output variables for the model.
Simulation scenarios
I ran the model under several scenarios, to explore how changes in temperature
and production at the foraging grounds might be reflected in nesting numbers and
remigration intervals. I ran the model 100 times under each scenario and present mean
values between runs for the results. The scenarios were as follows:
Standard model: The standard model uses temperatures directly from the LOTI
database of average global temperatures, which represents an overall warming trend, with
some oscillation (GISS 2014).
Cohort diffusion: In order to examine the fate of a cohort of simultaneously
nesting turtles, I ran the model with every individual nesting in the first year (instead of
spread over the first four years as described in the appendix) and observed nesting
numbers and remigration intervals in subsequent years. I ran this scenario at two constant
temperatures to determine whether temperature affects the time it takes for cohorts to
42
break down. I used temperatures that correspond to deviations of +/-0.45°C from the
midpoint of the LOTI dataset (13.645°C and 14.545°C).
Pulse perturbations: To determine the effects of variations in sea surface
temperature on nesting I used what systems engineers call an impulse response, i.e. I kept
all the years in the model at a constant temperature (in the midpoint of the range for the
LOTI dataset) and then introduced perturbations of temperatures with varying amplitude.
I examined the number of nesting turtles and remigration intervals in succeeding years.
Sinusoidal cycles: In order to look at the effect of oscillations in environmental
conditions without an overall warming or cooling trend (e.g. El Niño Southern
oscillation, North Atlantic Oscillation), I created four temperature functions that oscillate
smoothly and regularly between the minimum and maximum values in the LOTI dataset
at different frequencies. I looked at cycles with a duration of two, four, eight, and sixteen
years to determine how changes in cycle duration affect the amplitude of the resulting
oscillations in nesting numbers as well as the lag between temperature deviations and
response in nesting numbers.
Alternate model structure
The described model encodes one possible biological structure of the system
(migration probability depending on accumulated resources). In order to determine
whether the results and patterns observed were a result of the choice of model, I also
developed an alternate model starting from a second, but also individually-based
framework. The alternate model created energy thresholds that each turtle must reach
before nesting, as opposed to responding based on remigration probabilities. These
43
thresholds are different for each turtle but maintained for the entire simulation. Turtles
also incorporate a varying amount of the total available resources each year, owing to
individual physiological states, and providing annual and individual variability in the
model. I used the same model outputs and scenarios with this alternate model.
Results
Parameterization
When comparing the different relationships between resource accumulation and
the probability of remigration (Equations 2-4), the best fit between published and
modeled remigration intervals at constant annual production values corresponded to the
logarithmic model (Figure 3.1). This model was used for the rest of the simulations.
Using the other relationships gave similar results (data not shown).
Standard model
The standard model based on the global LOTI signal (Figure 3.2) produced yearly
oscillations in nesting numbers with an overall slowly decreasing trend in nesting
numbers. The change in nesting numbers as a response to temperature was most
pronounced for the logarithmic model. In all three models, there was an apparent long-
term, three year cycle in both input temperature (from the LOTI dataset) and in number
of nesting turtles (Figure 3.1).
Cohort diffusion
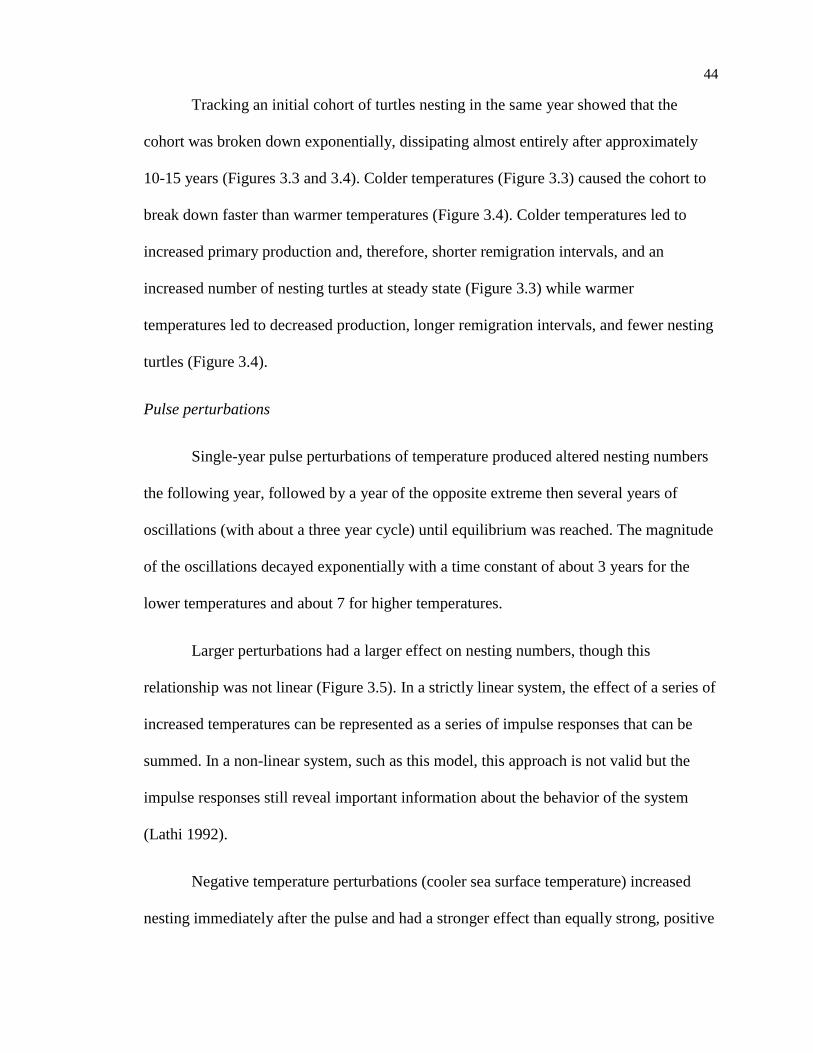
44
Tracking an initial cohort of turtles nesting in the same year showed that the
cohort was broken down exponentially, dissipating almost entirely after approximately
10-15 years (Figures 3.3 and 3.4). Colder temperatures (Figure 3.3) caused the cohort to
break down faster than warmer temperatures (Figure 3.4). Colder temperatures led to
increased primary production and, therefore, shorter remigration intervals, and an
increased number of nesting turtles at steady state (Figure 3.3) while warmer
temperatures led to decreased production, longer remigration intervals, and fewer nesting
turtles (Figure 3.4).
Pulse perturbations
Single-year pulse perturbations of temperature produced altered nesting numbers
the following year, followed by a year of the opposite extreme then several years of
oscillations (with about a three year cycle) until equilibrium was reached. The magnitude
of the oscillations decayed exponentially with a time constant of about 3 years for the
lower temperatures and about 7 for higher temperatures.
Larger perturbations had a larger effect on nesting numbers, though this
relationship was not linear (Figure 3.5). In a strictly linear system, the effect of a series of
increased temperatures can be represented as a series of impulse responses that can be
summed. In a non-linear system, such as this model, this approach is not valid but the
impulse responses still reveal important information about the behavior of the system
(Lathi 1992).
Negative temperature perturbations (cooler sea surface temperature) increased
nesting immediately after the pulse and had a stronger effect than equally strong, positive
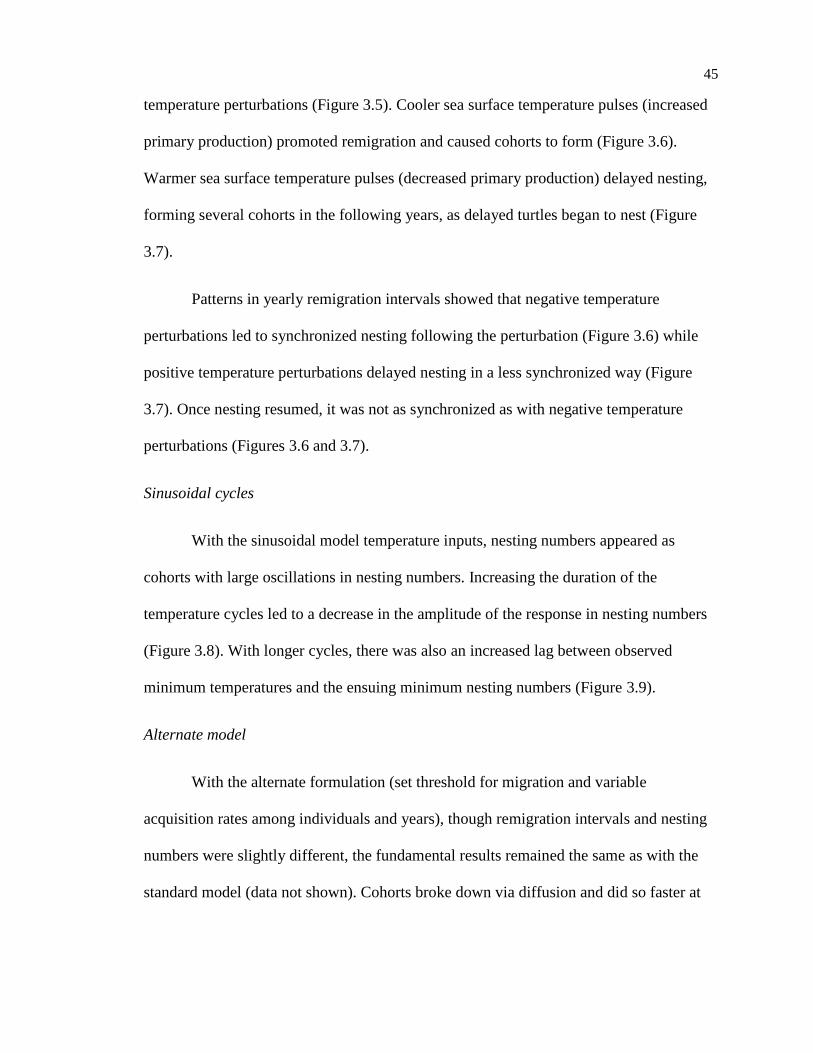
45
temperature perturbations (Figure 3.5). Cooler sea surface temperature pulses (increased
primary production) promoted remigration and caused cohorts to form (Figure 3.6).
Warmer sea surface temperature pulses (decreased primary production) delayed nesting,
forming several cohorts in the following years, as delayed turtles began to nest (Figure
3.7).
Patterns in yearly remigration intervals showed that negative temperature
perturbations led to synchronized nesting following the perturbation (Figure 3.6) while
positive temperature perturbations delayed nesting in a less synchronized way (Figure
3.7). Once nesting resumed, it was not as synchronized as with negative temperature
perturbations (Figures 3.6 and 3.7).
Sinusoidal cycles
With the sinusoidal model temperature inputs, nesting numbers appeared as
cohorts with large oscillations in nesting numbers. Increasing the duration of the
temperature cycles led to a decrease in the amplitude of the response in nesting numbers
(Figure 3.8). With longer cycles, there was also an increased lag between observed
minimum temperatures and the ensuing minimum nesting numbers (Figure 3.9).
Alternate model
With the alternate formulation (set threshold for migration and variable
acquisition rates among individuals and years), though remigration intervals and nesting
numbers were slightly different, the fundamental results remained the same as with the
standard model (data not shown). Cohorts broke down via diffusion and did so faster at
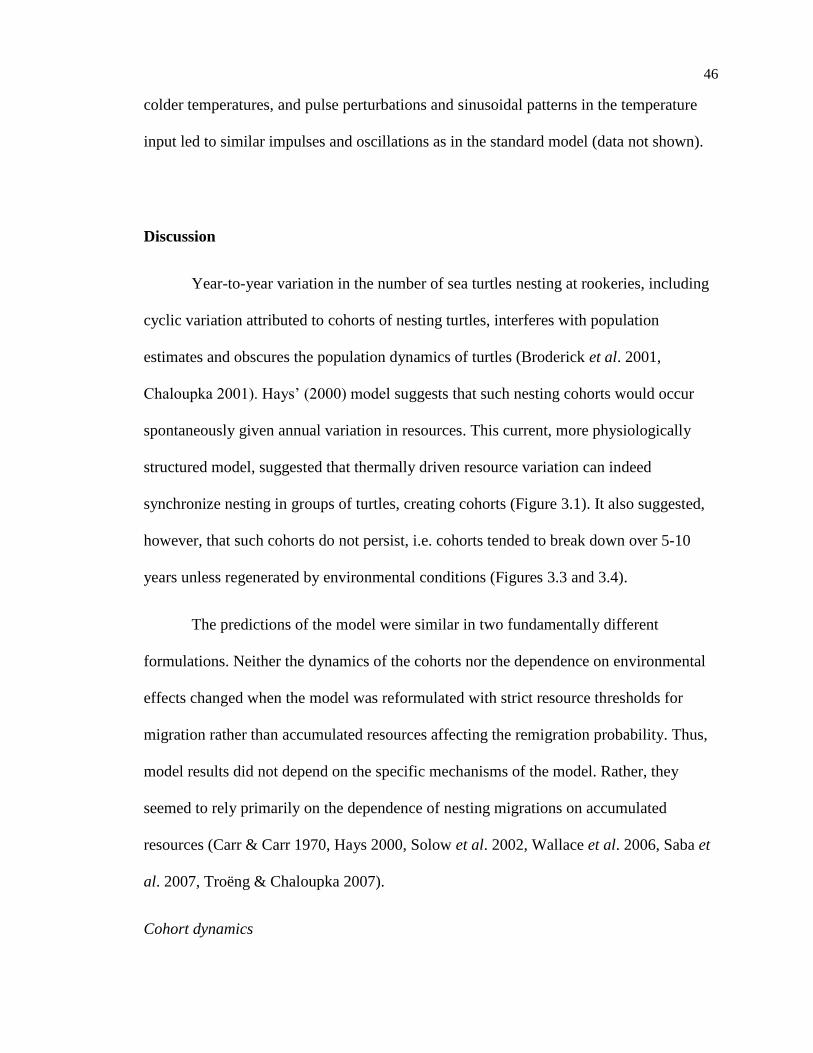
46
colder temperatures, and pulse perturbations and sinusoidal patterns in the temperature
input led to similar impulses and oscillations as in the standard model (data not shown).
Discussion
Year-to-year variation in the number of sea turtles nesting at rookeries, including
cyclic variation attributed to cohorts of nesting turtles, interferes with population
estimates and obscures the population dynamics of turtles (Broderick et al. 2001,
Chaloupka 2001). Hays’ (2000) model suggests that such nesting cohorts would occur
spontaneously given annual variation in resources. This current, more physiologically
structured model, suggested that thermally driven resource variation can indeed
synchronize nesting in groups of turtles, creating cohorts (Figure 3.1). It also suggested,
however, that such cohorts do not persist, i.e. cohorts tended to break down over 5-10
years unless regenerated by environmental conditions (Figures 3.3 and 3.4).
The predictions of the model were similar in two fundamentally different
formulations. Neither the dynamics of the cohorts nor the dependence on environmental
effects changed when the model was reformulated with strict resource thresholds for
migration rather than accumulated resources affecting the remigration probability. Thus,
model results did not depend on the specific mechanisms of the model. Rather, they
seemed to rely primarily on the dependence of nesting migrations on accumulated
resources (Carr & Carr 1970, Hays 2000, Solow et al. 2002, Wallace et al. 2006, Saba et
al. 2007, Troëng & Chaloupka 2007).
Cohort dynamics
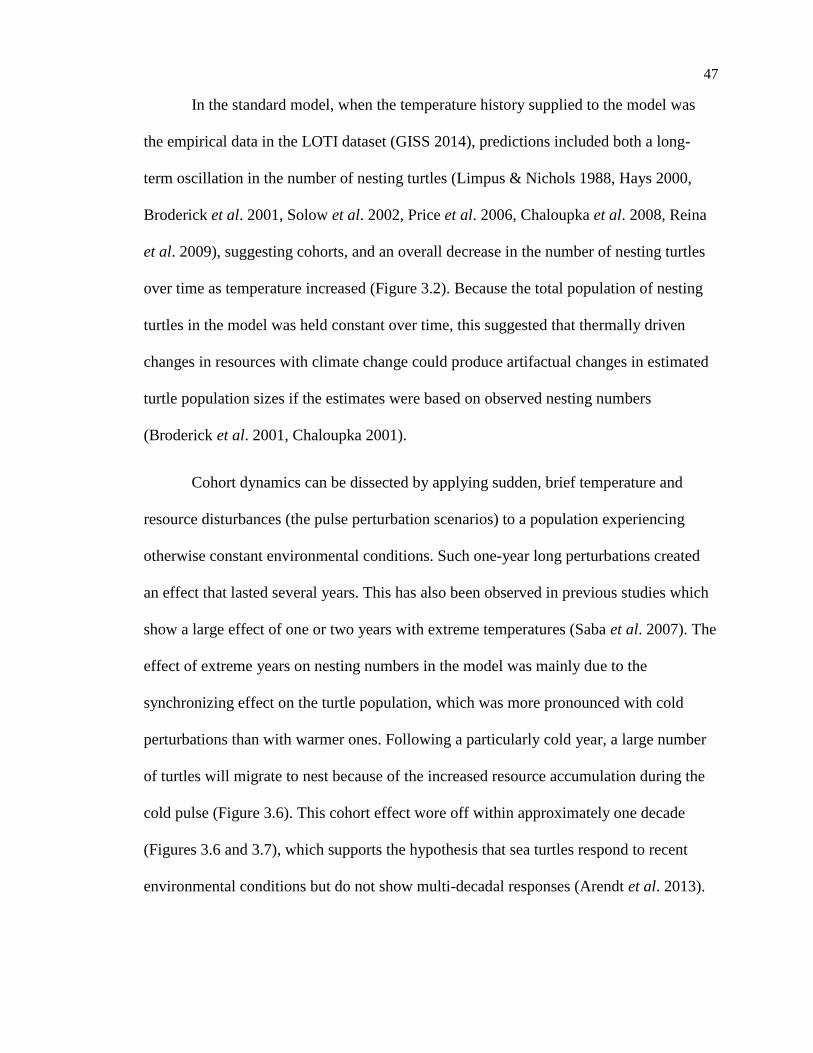
47
In the standard model, when the temperature history supplied to the model was
the empirical data in the LOTI dataset (GISS 2014), predictions included both a long-
term oscillation in the number of nesting turtles (Limpus & Nichols 1988, Hays 2000,
Broderick et al. 2001, Solow et al. 2002, Price et al. 2006, Chaloupka et al. 2008, Reina
et al. 2009), suggesting cohorts, and an overall decrease in the number of nesting turtles
over time as temperature increased (Figure 3.2). Because the total population of nesting
turtles in the model was held constant over time, this suggested that thermally driven
changes in resources with climate change could produce artifactual changes in estimated
turtle population sizes if the estimates were based on observed nesting numbers
(Broderick et al. 2001, Chaloupka 2001).
Cohort dynamics can be dissected by applying sudden, brief temperature and
resource disturbances (the pulse perturbation scenarios) to a population experiencing
otherwise constant environmental conditions. Such one-year long perturbations created
an effect that lasted several years. This has also been observed in previous studies which
show a large effect of one or two years with extreme temperatures (Saba et al. 2007). The
effect of extreme years on nesting numbers in the model was mainly due to the
synchronizing effect on the turtle population, which was more pronounced with cold
perturbations than with warmer ones. Following a particularly cold year, a large number
of turtles will migrate to nest because of the increased resource accumulation during the
cold pulse (Figure 3.6). This cohort effect wore off within approximately one decade
(Figures 3.6 and 3.7), which supports the hypothesis that sea turtles respond to recent
environmental conditions but do not show multi-decadal responses (Arendt et al. 2013).
48
Alternatively, a warm pulse, with attendant decreased resource accumulation,
decreased the number of nesting turtles in the following year. However, a compensatory
increase in nesting occurred the following year when some of the turtles that did not nest
the previous year now migrated to nest (Figure 3.7). As with a cold pulse, the oscillating
effects wore off over the next few years (Figure 3.7).
When I simulated complete synchronization of nesting, by having all the turtles
nest at once in a single cohort and then examining nesting in the following years, there
were similar results. The forced cohort breaks down over the next 5-10 years (Figures 3.3
and 3.4). I describe this process as ‘diffusion’ with some turtles nesting slightly ahead of
the majority of the cohort and others nesting slightly later (Figures 3.3 and 3.4). Thus,
instead of cohorts persisting stably, they diffusively spread over the next 5-10 years.
Cooler years, with higher resource accumulation, led to a faster breakdown of cohorts
than did warmer years with lower net primary production (Figures 3.3 and 3.4).
As predicted from the impulse responses (Figures 3.3 and 3.4), temperatures that
varied cyclically produced a cyclical variation in both remigration interval and predicted
number of nesting turtles. Both the amplitude of the variation (Figure 3.8) and the lag
between temperature minimums and predicted minimums in the number of nesting turtles
(Figure 3.9) varied with the duration of the sinusoidal cycle chosen.
When looking at temperatures that vary as a sinusoidal function, the lag between
temperatures and nesting numbers was remarkably short with short sinusoidal cycles.
With a cycle of 4 years, there was an observed lag of only 2 years between changes in
temperature and corresponding changes in nesting numbers, which corresponded to the
lag observed for the Playa Grande leatherback population responding to temperature
49
variations due to El Niño Southern Oscillation (Saba et al. 2007). In the model this lag
tended to increase with cycle duration, which merits further study to determine if this
effect can be observed in nesting populations. One possibility to study this is to determine
whether longer ENSO cycles have a longer observed lag when compared to shorter ones.
Cyclical temperatures in this model also tended to increase overall population
remigration intervals (data not shown). This corresponds well with observations by
Wallace et al. (2006) and Saba et al. (2008) that increasing variability at the foraging
grounds leads to poor resource acquisition rates and longer remigration intervals for
leatherback turtles in the Eastern Pacific.
Comparison to published results
Though the model uses a different mechanism to predict production and
remigration intervals, its results are consistent with observations by Wallace and Saba
(2009) who found that increasing net primary production from 3.3 to 12.5 teragrams of
Carbon (Tg C) per 12 days (values corresponding to the foraging areas of Eastern Pacific
and Western Atlantic leatherback turtles respectively) leads to a near halving of
remigration intervals. These values are similar to the remigration intervals produced by
the logarithmic model for the corresponding values of annual net primary production.
While this is due, in part, to the calibration of the production and remigration functions
(Eq. 1-4), those calibrations provided remigration behavior consistent with the published
behavior of the turtles.
A model linking SST anomaly at foraging grounds to nesting numbers at Playa
Grande, Costa Rica, was developed by Saba et al. (2007). The present model differs in
50
that it uses global average temperatures and can thus be applied to populations for which
foraging grounds are unknown. The model also explicitly takes into account resource
acquisition rates, allowing for either individual or population based metabolic response to
changes in resource availability. This made it possible to explore how different
temperature patterns may affect remigration intervals and how this is reflected by annual
nesting numbers.
As in Saba et al. (2007), overall warmer years lead to larger nesting populations
than colder years, due to warm years extending the remigration interval because of their
associated decreased resource availability. This can be seen when comparing the
remigration intervals in the cohort tracking models for all warm years with those for all
cold years (Figures 3.3 and 3.4).
Possible extensions
There are several refinements that should be considered for the current model.
Further development should include a way to account for anthropogenic impacts.
Currently the population of adult females is stable but future versions should include a
population growth rate that can be built in to account for the different adult survivorships
of different populations. Another possibility is to make survivorship depend on available
resources, with females having a probability of dying off if they encounter several
consecutive bad years.
In terms of the relationship between accumulated resources and nesting efforts,
the present model assumes that when a turtle migrates to nest, it consumes all its
accumulated resources. One extension of the model could use the amount of resources an
51
individual has accumulated prior to nesting to determine measures of reproductive effort
(e.g clutch size, number of nesting attempts) that would then vary between individuals
and affect future population dynamics. Individuals with excess resources may also have
carryover effects for their next nesting attempt, either in their growth rate (and resulting
resource accumulation rates) or in the reproductive effort for their next nesting season.
The relationship between temperature and resources should also be evaluated
differently for different species of sea turtles, as it may change depending on the diet of
the species. Special considerations can also be made for species that rely on patchy
resources, such as leatherback turtles feeding on jellyfish (Davenport 1997, Lynam et al.
2004, James et al. 2005).
In addition to these refinements, the model should be fine-tuned for particular
rookeries and compared with their nesting trends and remigration data. This would help
to determine whether the model reflects observed behavior and whether or not it could be
used to project observed nesting numbers for future years and under different climate
change scenarios.
Conservation implications
Proper adjustment of the model will make it possible to use to forecast nesting
numbers, which can help conservation and management planning. Being able to predict
patterns in nesting numbers can also prevent over interpretation of nesting oscillations.
Since the model predicts cycling between good and bad years, short-term trends should
not be seen as a reflection of long-term population dynamics. Policy should then be based
on long-term monitoring efforts rather than shorter (1-3 year) datasets.
52
Summary
Overall, both developed models are consistent with the published effects of
temperature on nesting numbers and remigration intervals. Any observed cohort
dynamics at the nesting beaches are driven by temperature and resource dynamics at the
foraging grounds. This emphasizes the importance of considering temperatures when
trying to estimate population trends from nesting data, since temperature variation may
confound nesting numbers and lead to an apparent but false population trend. Also, any
synchronizing effect of environmental temperature on nesting cohorts is short-lived rather
than multi-decadal, since nesting cohorts tend to break down over a period of 5-10 years.
However, there is a lag between temperature changes and their responses in nesting
numbers, which increases with the duration of temperature cycles. Though part of this
effect is driven by a built-in lag in the model (as turtles cannot respond to temperature in
the current year), it may also reflect real lags in observed nesting numbers following
temperature changes at the foraging grounds. Future work should focus on model
refinement to particular nesting populations in order to determine whether its behavior
matches the observed trends in nesting numbers and remigration intervals.
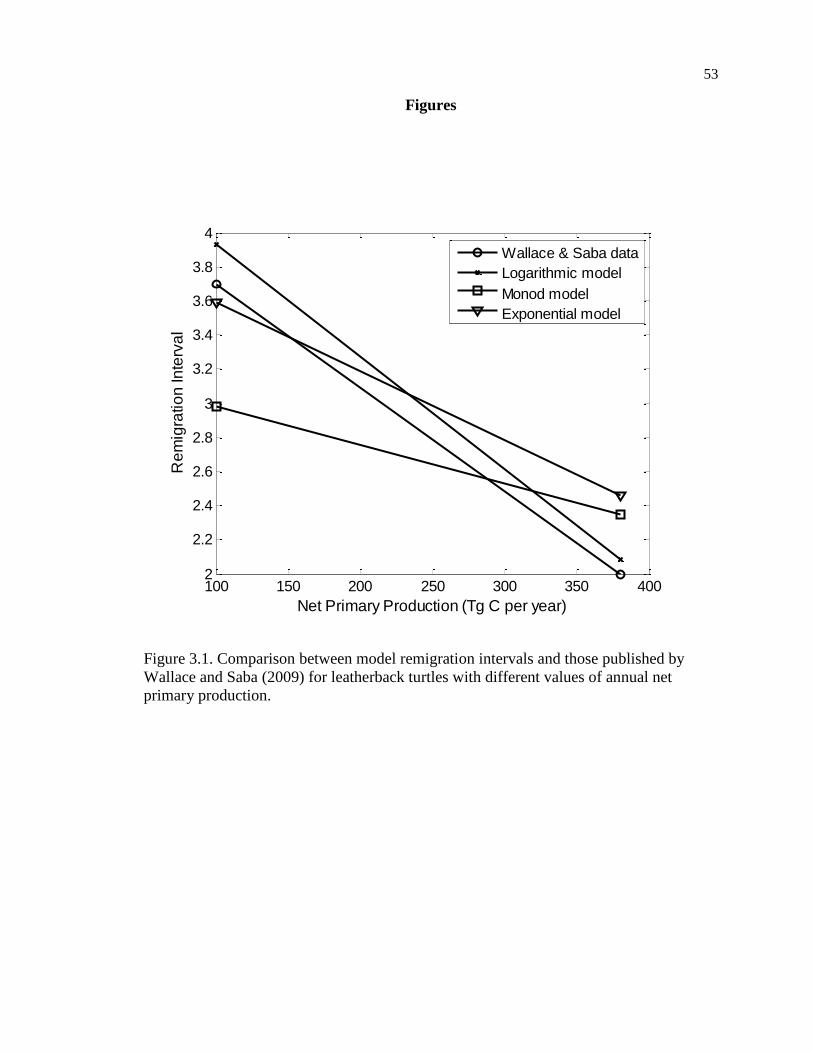
53
Figures
Figure 3.1. Comparison between model remigration intervals and those published by
Wallace and Saba (2009) for leatherback turtles with different values of annual net
primary production.
100 150 200 250 300 350 4002
2.2
2.4
2.6
2.8
3
3.2
3.4
3.6
3.8
4
Net Primary Production (Tg C per year)
Re
mig
ratio
n In
terv
al
Wallace & Saba data
Logarithmic model
Monod model
Exponential model
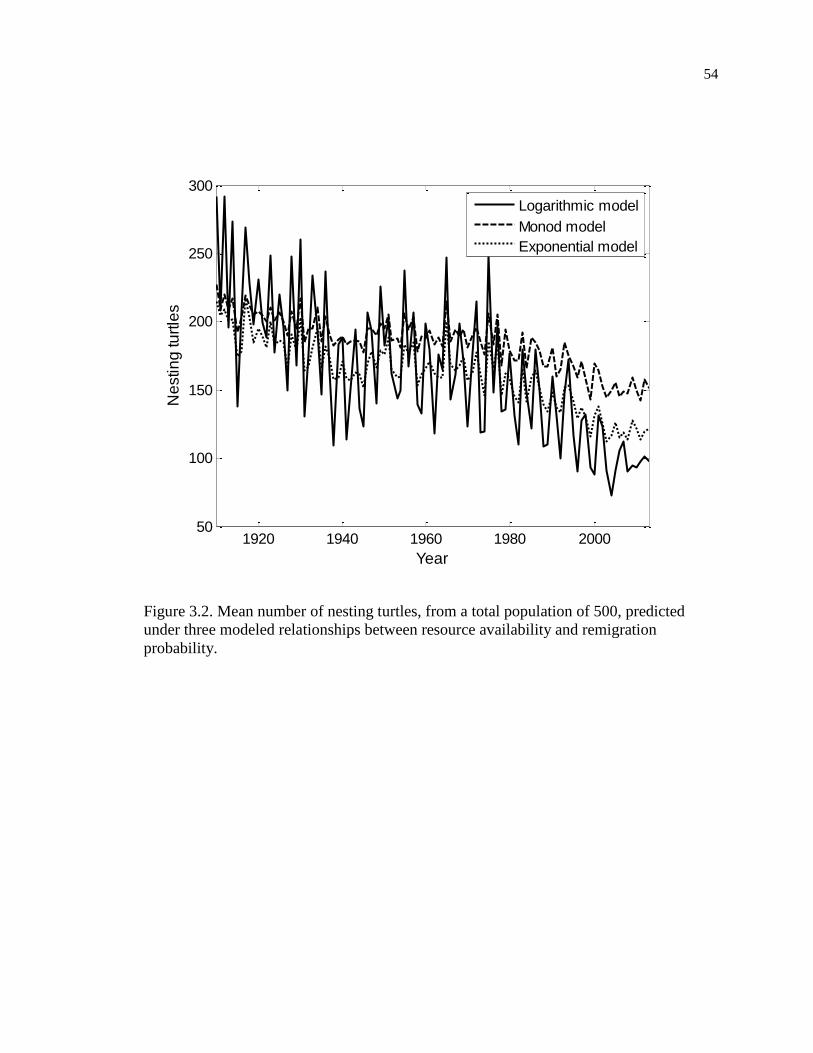
54
Figure 3.2. Mean number of nesting turtles, from a total population of 500, predicted
under three modeled relationships between resource availability and remigration
probability.
1920 1940 1960 1980 200050
100
150
200
250
300
Year
Ne
stin
g tu
rtle
s
Logarithmic model
Monod model
Exponential model
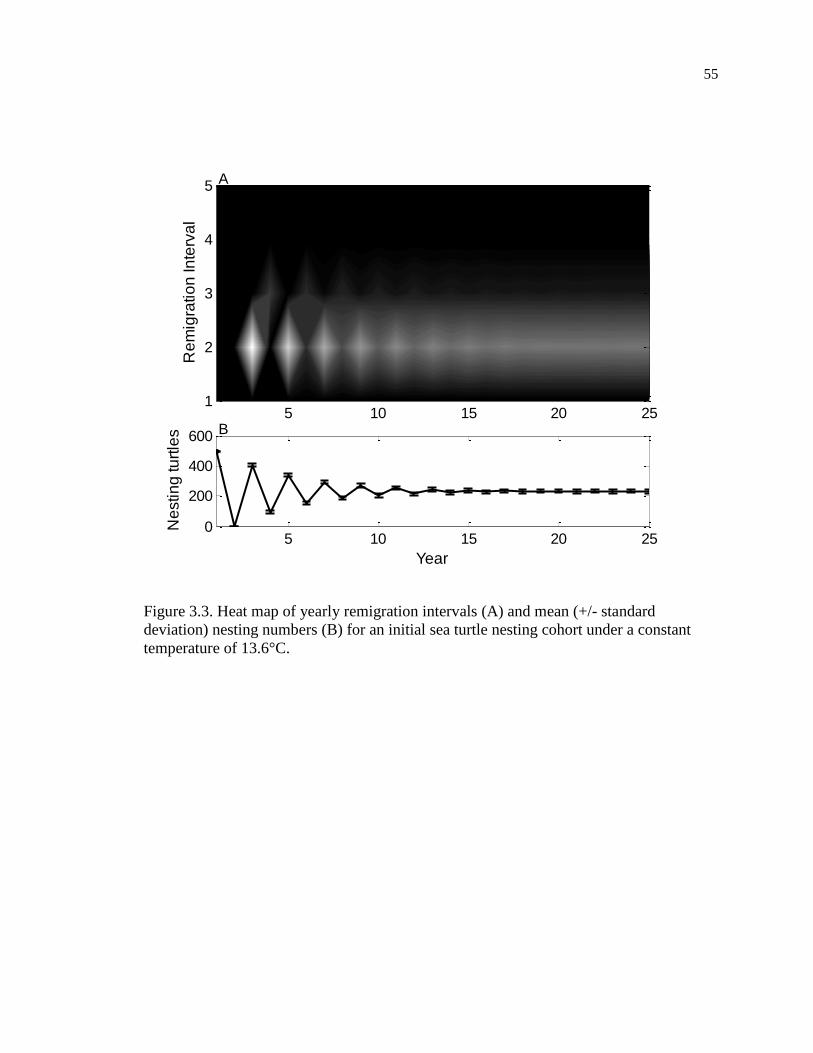
55
Figure 3.3. Heat map of yearly remigration intervals (A) and mean (+/- standard
deviation) nesting numbers (B) for an initial sea turtle nesting cohort under a constant
temperature of 13.6°C.
Re
mig
ratio
n In
terv
al
5 10 15 20 251
2
3
4
5
5 10 15 20 250
200
400
600
Ne
stin
g tu
rtle
s
Year
A
B
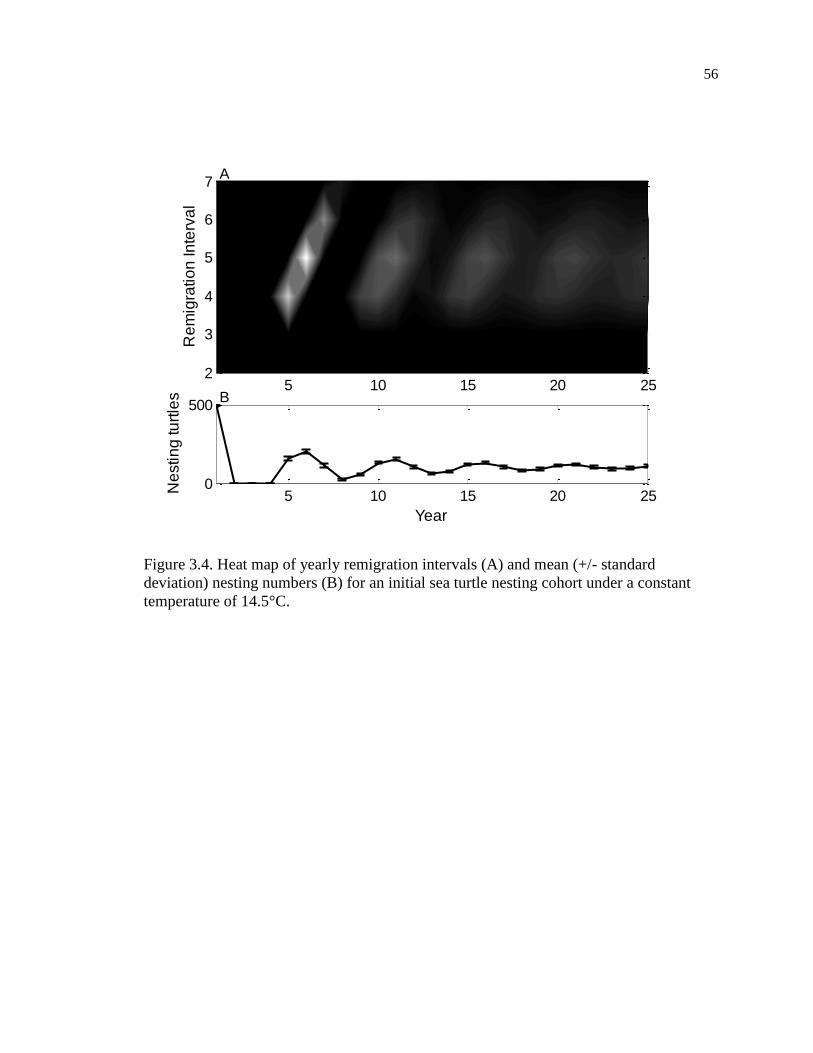
56
Figure 3.4. Heat map of yearly remigration intervals (A) and mean (+/- standard
deviation) nesting numbers (B) for an initial sea turtle nesting cohort under a constant
temperature of 14.5°C.
Re
mig
ratio
n In
terv
al
5 10 15 20 252
3
4
5
6
7
5 10 15 20 250
500
Ne
stin
g tu
rtle
s
Year
B
A
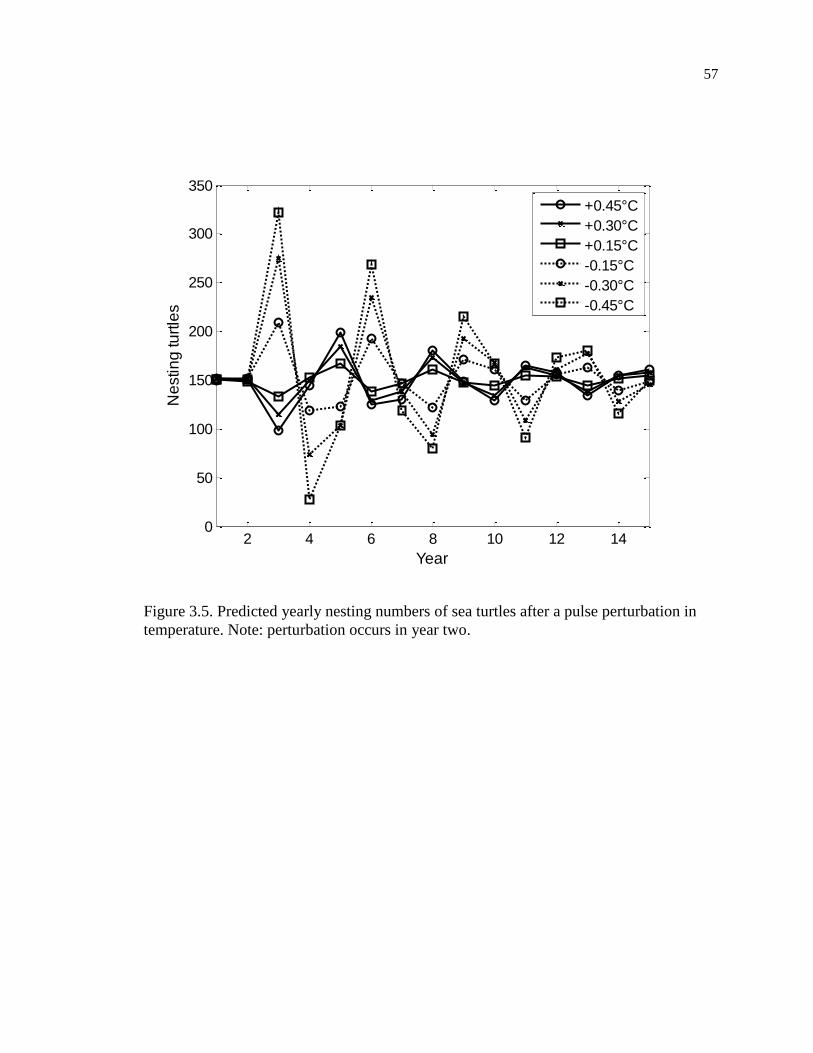
57
Figure 3.5. Predicted yearly nesting numbers of sea turtles after a pulse perturbation in
temperature. Note: perturbation occurs in year two.
2 4 6 8 10 12 140
50
100
150
200
250
300
350N
estin
g tu
rtle
s
Year
+0.45°C
+0.30°C
+0.15°C
-0.15°C
-0.30°C
-0.45°C
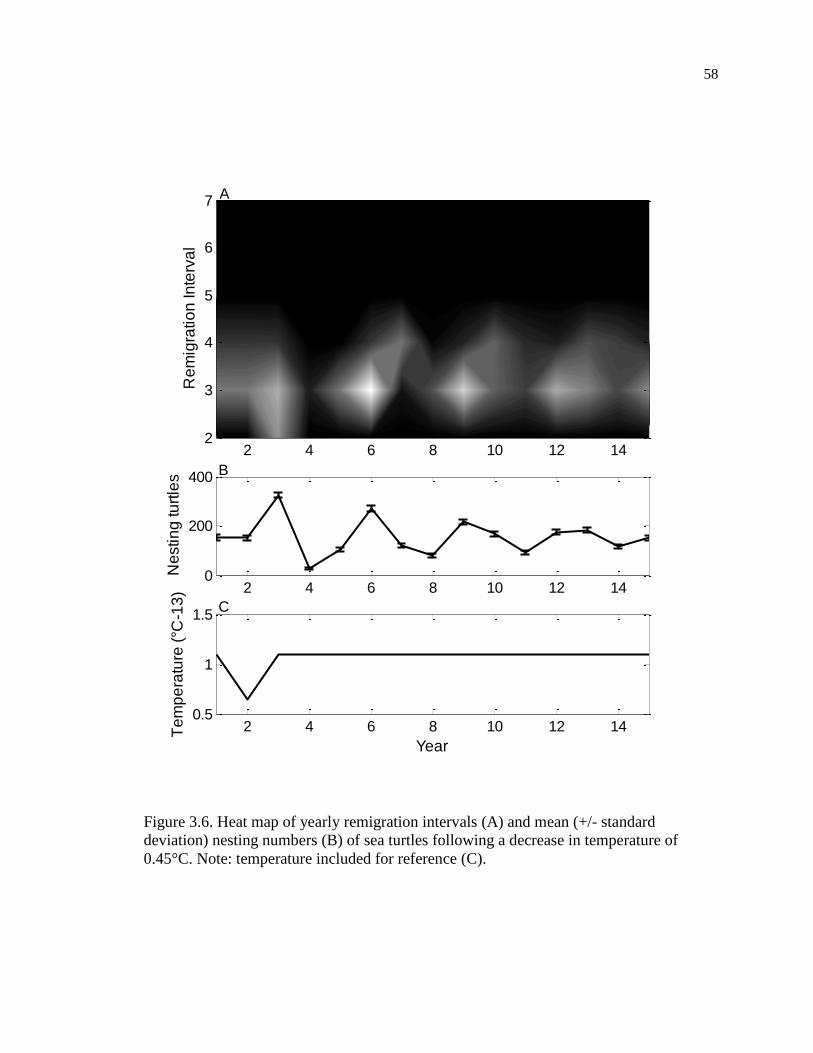
58
Figure 3.6. Heat map of yearly remigration intervals (A) and mean (+/- standard
deviation) nesting numbers (B) of sea turtles following a decrease in temperature of
0.45°C. Note: temperature included for reference (C).
Re
mig
ratio
n In
terv
al
2 4 6 8 10 12 142
3
4
5
6
7
2 4 6 8 10 12 140
200
400
Ne
stin
g tu
rtle
s
2 4 6 8 10 12 140.5
1
1.5
Te
mp
era
ture
(°C
-13
)
Year
B
A
C
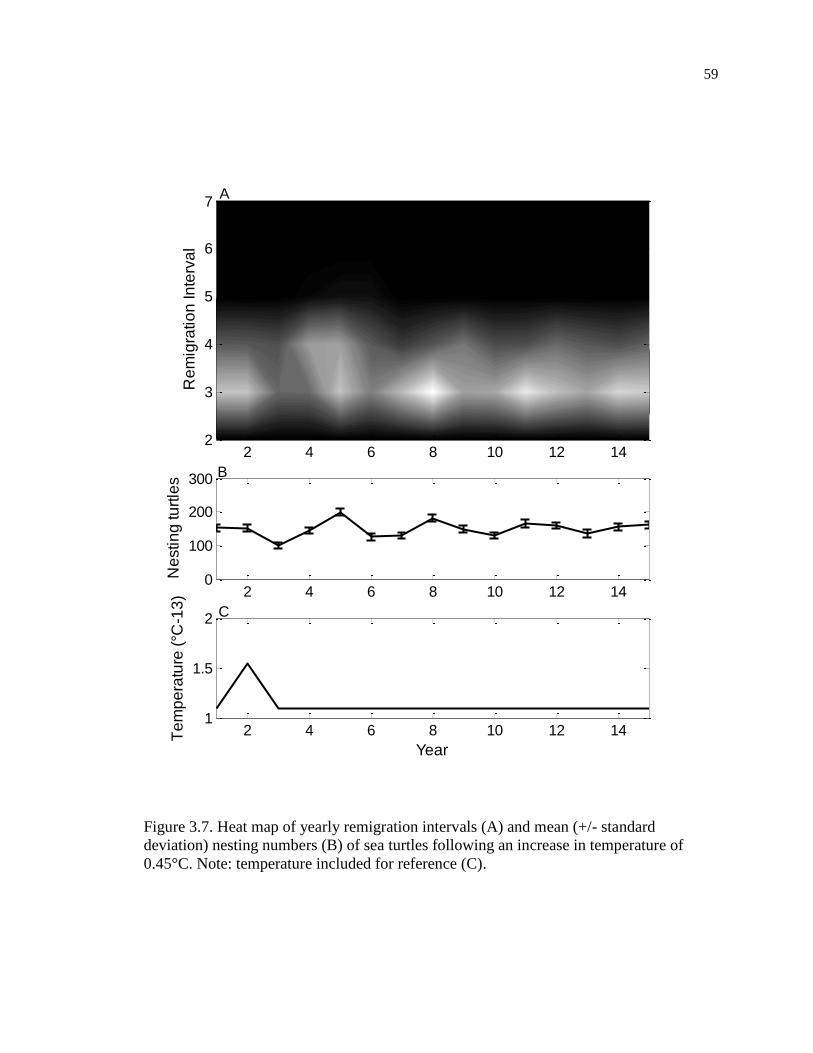
59
Figure 3.7. Heat map of yearly remigration intervals (A) and mean (+/- standard
deviation) nesting numbers (B) of sea turtles following an increase in temperature of
0.45°C. Note: temperature included for reference (C).
Re
mig
ratio
n In
terv
al
2 4 6 8 10 12 142
3
4
5
6
7
2 4 6 8 10 12 140
100
200
300
Ne
stin
g tu
rtle
s
2 4 6 8 10 12 141
1.5
2
Te
mp
era
ture
(°C
-13
)
Year
A
C
B
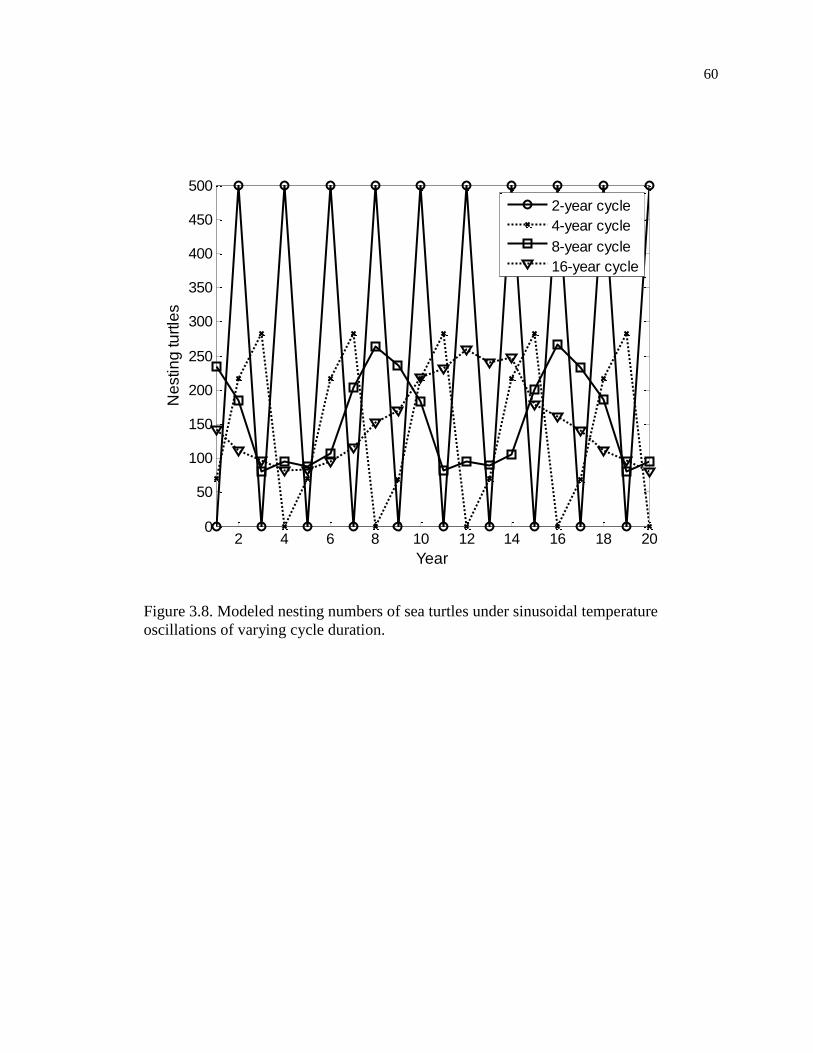
60
Figure 3.8. Modeled nesting numbers of sea turtles under sinusoidal temperature
oscillations of varying cycle duration.
2 4 6 8 10 12 14 16 18 200
50
100
150
200
250
300
350
400
450
500N
estin
g tu
rtle
s
Year
2-year cycle
4-year cycle
8-year cycle
16-year cycle
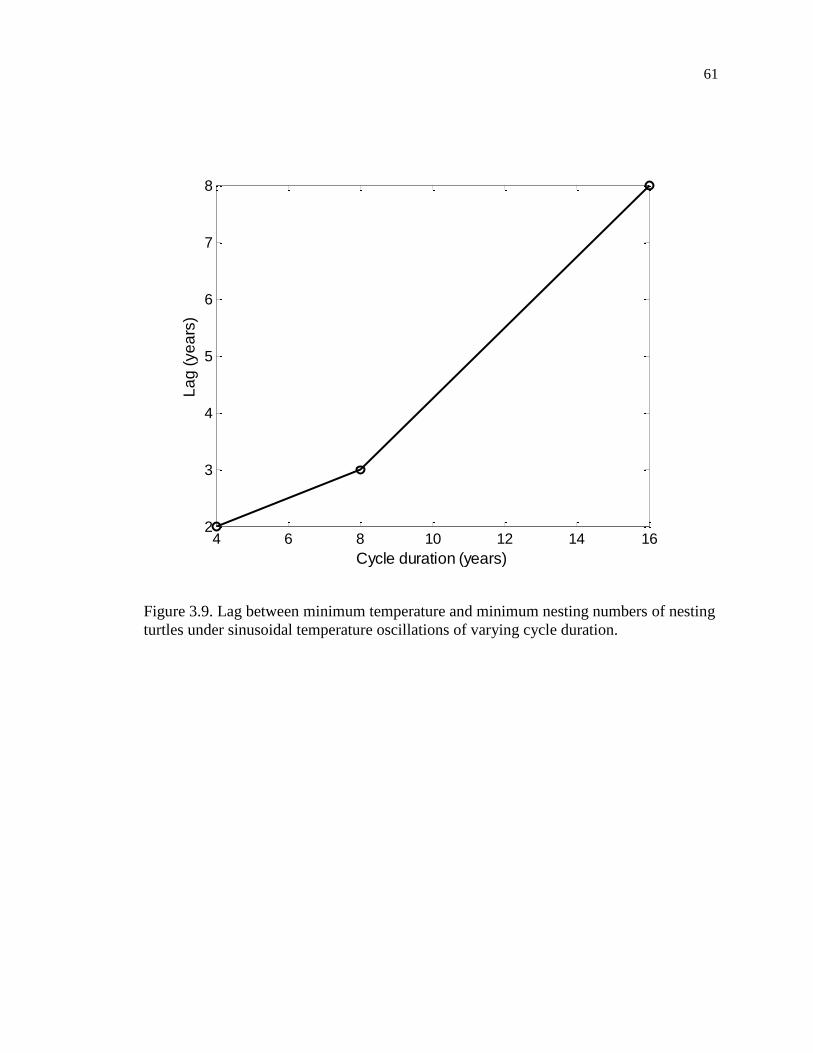
61
Figure 3.9. Lag between minimum temperature and minimum nesting numbers of nesting
turtles under sinusoidal temperature oscillations of varying cycle duration.
4 6 8 10 12 14 162
3
4
5
6
7
8L
ag
(ye
ars
)
Cycle duration (years)
62
CHAPTER 4: Using a simple, physiologically-based model to predict leatherback
turtle (Dermochelys coriacea) nesting numbers and remigration intervals at two
rookeries
Abstract
Year-to year variation in the number of nesting sea turtles and their remigration
intervals is often influenced by temperature and resource availability at the foraging
grounds. Since nesting censuses are heavily used to estimate population sizes and trends,
this means that any signal in population trends may be obscured by these year-to-year
oscillations. I compared predictions from a simple, physiologically-based model with
observed nesting numbers and remigration intervals (obtained in collaboration with
monitoring and conservation organizations) for two leatherback nesting beaches with
opposite population trends (Playa Grande, Costa Rica, and St. Croix, US Virgin Islands)
in order to determine whether it was possible to isolate the temperature signal from the
overall population trends. When running the model with global mean temperatures, any
correlations between model and observed nesting numbers were dominated by the overall
population trends, while the remigration intervals in both the model and observed data
was driven by a long-term temperature decrease and its consequential remigration
interval increase. However, when fine-tuning the model to the foraging temperature
signals for each population, the model captured the basic behavior of the remigration
intervals both on a year-to-year and decade-to-decade trend. The model was not able to
predict nesting numbers, as they were dominated by the overall trend for each population.
Future work should focus on building growth rates into the model so it may be used to
forecast both nesting numbers and remigration intervals for different populations. This
63
would allow the model to be used for conservation and management planning as well in
properly interpreting oscillations in nesting numbers.
Introduction
Population assessments for sea turtles, as well as for other seasonal migrants, are
based on census numbers for nesting females, due to the relative ease of monitoring these
sites and estimating abundance there (Mazaris et al. 2005, Saba et. al 2007, Calvert et al.
2009). However, nesting can be affected by events throughout the migratory cycle such
as changes in temperature and resource availability, which can alter nesting frequency
and numbers (Seminoff & Shanker 2008, Calvert et al. 2009).
Changes in temperature have been shown to affect nesting numbers of sea turtles
(Limpus & Nicholls 1988, Solow et al. 2002, Saba et al. 2007, Chaloupka et al. 2008,
Reina et al. 2009). This relationship is mediated by the effects of temperature on resource
availability at the foraging grounds: increased temperatures lead to poorer conditions at
the foraging grounds, which tend to extend remigration intervals, while lower
temperatures lead to increased resource availability and shorter remigration intervals
(Solow et al. 2002, Wallace et al. 2006, Saba et al. 2007).
Because individuals in the same nesting population tend to experience similar
foraging conditions, nesting may become synchronized (Limpus & Nicholls 1988, Hays
2000, Broderick et al. 2001, Solow et al. 2002, Reina et al. 2002, Reina et al. 2009). This
is then seen as large oscillations at the nesting grounds that do not necessarily reflect
64
changes in the overall population and may even obscure population trends (Hays 2000,
Broderick et al. 2001).
Being able to separate the effects of temperature on nesting population trends is
key to isolating other factors which may affect sea turtle populations, such as
anthropogenic impacts which can define population trends (Saba et. al 2007). This
understanding can lead not only to improved forecasting at nesting beaches (and thus,
more efficient management and conservation) but also to a better understanding of how
climate change could affect sea turtles and what measures should be taken to protect
populations from this added threat (Saba et al. 2007, Chaloupka et al. 2008, Wallace &
Jones 2008, Wallace & Saba 2009).
In order to study temperature effects on nesting numbers, I used a
physiologically-based model (Chapter 3, this dissertation) that predicts remigration
intervals and nesting numbers for a theoretical sea turtle population based on yearly
global average temperatures since 1900. I compared the results from this model with the
observed numbers for two nesting populations: Playa Grande, Costa Rica and St. Croix,
US Virgin Islands. I also adapted the model inputs and forcing functions to the chosen
populations to determine if this provided a better fit than the standard model.
I chose these two populations because they have opposite overall trends: the Playa
Grande population is declining precipitously (Spotila et al. 1996, Santidrian-Tomillo et
al. 2007) while the St. Croix population is increasing (Robinson et al. 2014). Testing the
model under these different circumstances made it possible to determine whether the
climate signal was still apparent, independently of population trends and whether or not
65
the model could be fine-tuned to predict the nesting behaviors of two very different
populations which experienced potentially different temperature signals.
Methods
Standard model
I used a theoretical model (Chapter 3, this dissertation) that predicts remigration
intervals and nesting numbers for a stable population of sea turtles subject to temperature
increases (See appendix for the algorithm’s pseudocode). The model uses global average
temperatures from the Global Land-Ocean Temperature Index (LOTI, available on the
Goddard Institute for Space Studies website http://data.giss.nasa.gov/gistemp/), to
calculate a measure of production or resource availability, with the following relationship
PP = 300/T – 125 (1)
where PP is annual production and T is the temperature deviation from 13°C in
the LOTI dataset, which ranges between 0.54 and 1.65°C. This equation was fitted in
order to produce the yearly Net Primary Production (NPP) values for the populations of
leatherback turtles nesting in Playa Grande and St. Croix.
Individual turtles in the model select their first nesting year randomly from the
first four years in the model. After this initial nesting year, each year the remigration
probability for each turtle is calculated from the accumulated annual NPP since the last
nesting year. This relationship between accumulated resources and remigration
66
probability is modeled with three different “metabolic” equations each of which
approximates a metabolic process that must reach a certain threshold, as follows:
PR = ln(∑(PP)/150) (2)
PR = ∑(PP)/ (∑(PP)+150) (3)
PR = 1-e-0.25∑(PP) (4)
where PR is the probability of remigration for a given year and PP is the annual
primary production. Production is summed over the years from the last nesting attempt to
the proposed nesting year (not including nesting years).
I ran the standard model ten times using a stable population of 500 turtles and
tracked the mean yearly nesting numbers and remigration intervals in order to compare
them with those observed for each nesting population.
Foraging temperature data
In order to fine-tune the model to respond to the foraging conditions experienced
by each population rather than mean global temperatures, I looked at monthly average sea
surface temperature (SST) from the NOAA NCEP EMC CMB GLOBAL Reynolds and
Smith v2 data set (Reynolds et al. 2002), available on the International Research Institute
for Climate and Society’s website (http://iridl.ldeo.columbia.edu/docfind/databrief/cat-
airsea.html). This dataset combines ship, buoy and satellite-corrected temperature data at
a resolution of 1x1°.
67
For each nesting population, I took the average temperatures for the foraging
grounds proposed by Neeman et al. (2015) from 1982 to 2012. I then used these foraging
temperatures in order to derive a foraging temperature signal for each population.
For the Playa Grande population, I circumscribed the following putative foraging
grounds for leatherback turtles (Saba 2007,Shillinger et al. 2008, Shillinger et al. 2011,
Neeman et al. 2015): Equator (5.5°S-5.5°N, 84.5-110.5°W), Upper South Equatorial
Gyre (4.5-20.5°S, 79.5-120.5°W), and Lower South Equatorial Gyre (24.5-35.5°S, 84.5-
105.5°W). I divided the South Equatorial Gyre into two different areas to better represent
its triangular shape and possibly different conditions due to its extensive N-S range
(Neeman et al. 2015).
For St. Croix, I chose putative foraging sites for leatherback turtles to match those
studies for the Trinidad population (Eckert 2006, Neeman et al. 2015) due to a lack of
tracking data for Sandy Point. They were as follows: Bay of Biscay (34.5-45.5°N, 9.5-
15.5°W), Flemish Cap (44.5-50.5°N, 34.5-45.5°W), Mauritania (14.5-30.5°N, 14.5-
25.5°W), and North Atlantic subtropical front (34.5-40.5°N, 34.5-45.5°W).
For each population, I calculated the deviations from mean temperature for each
foraging ground. I then ran correlations between these deviations from the mean for all
the foraging grounds for a particular population in order to determine which could be
merged into a single temperature signal. This made it possible to derive two independent
signals for each population, representing those foraging grounds which were most
strongly correlated.
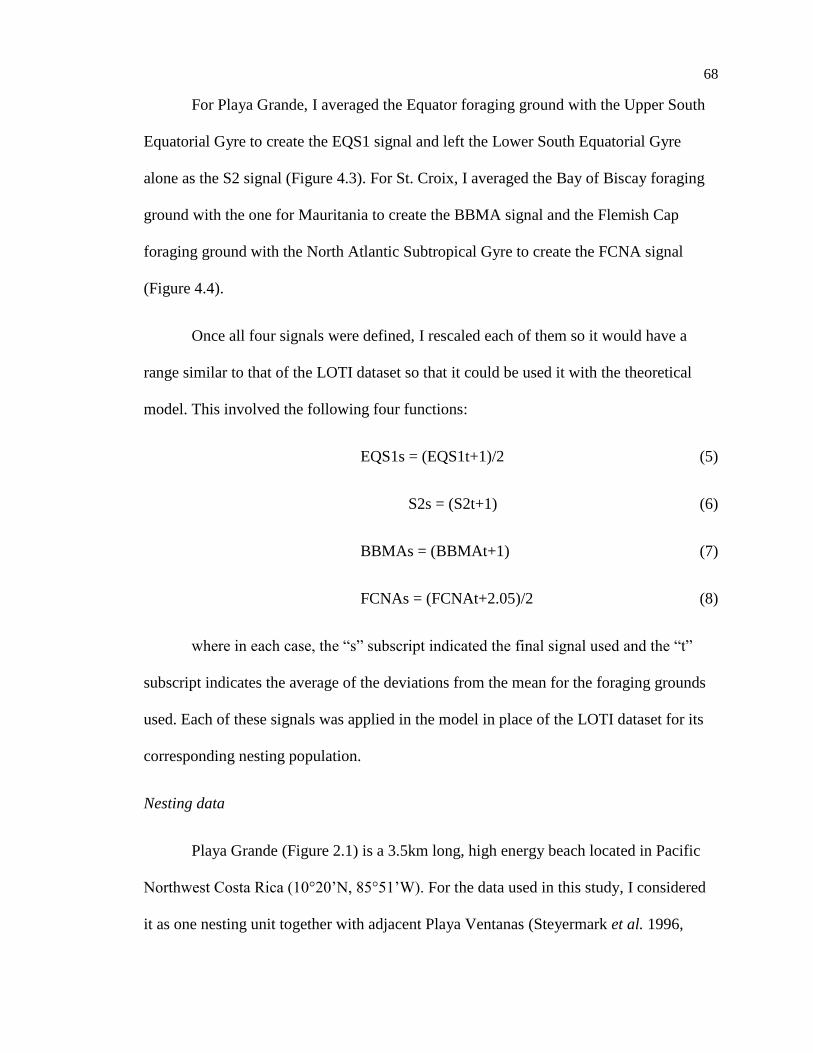
68
For Playa Grande, I averaged the Equator foraging ground with the Upper South
Equatorial Gyre to create the EQS1 signal and left the Lower South Equatorial Gyre
alone as the S2 signal (Figure 4.3). For St. Croix, I averaged the Bay of Biscay foraging
ground with the one for Mauritania to create the BBMA signal and the Flemish Cap
foraging ground with the North Atlantic Subtropical Gyre to create the FCNA signal
(Figure 4.4).
Once all four signals were defined, I rescaled each of them so it would have a
range similar to that of the LOTI dataset so that it could be used it with the theoretical
model. This involved the following four functions:
EQS1s = (EQS1t+1)/2 (5)
S2s = (S2t+1) (6)
BBMAs = (BBMAt+1) (7)
FCNAs = (FCNAt+2.05)/2 (8)
where in each case, the “s” subscript indicated the final signal used and the “t”
subscript indicates the average of the deviations from the mean for the foraging grounds
used. Each of these signals was applied in the model in place of the LOTI dataset for its
corresponding nesting population.
Nesting data
Playa Grande (Figure 2.1) is a 3.5km long, high energy beach located in Pacific
Northwest Costa Rica (10°20’N, 85°51’W). For the data used in this study, I considered
it as one nesting unit together with adjacent Playa Ventanas (Steyermark et al. 1996,
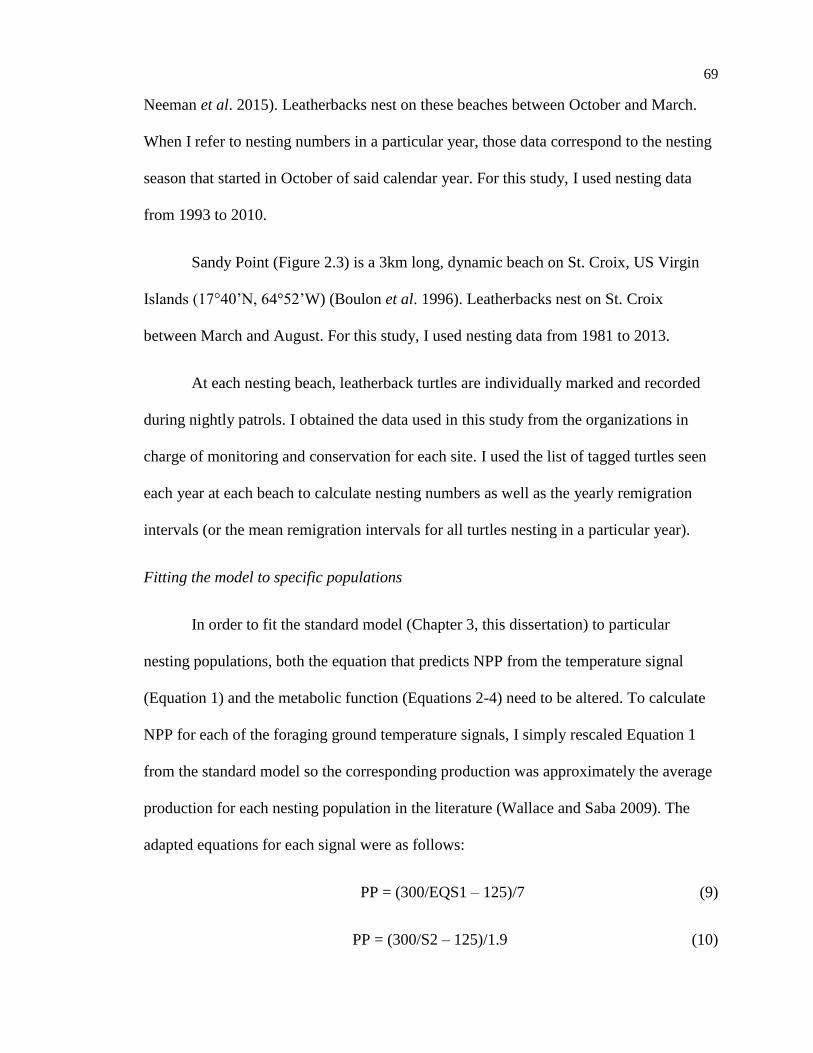
69
Neeman et al. 2015). Leatherbacks nest on these beaches between October and March.
When I refer to nesting numbers in a particular year, those data correspond to the nesting
season that started in October of said calendar year. For this study, I used nesting data
from 1993 to 2010.
Sandy Point (Figure 2.3) is a 3km long, dynamic beach on St. Croix, US Virgin
Islands (17°40’N, 64°52’W) (Boulon et al. 1996). Leatherbacks nest on St. Croix
between March and August. For this study, I used nesting data from 1981 to 2013.
At each nesting beach, leatherback turtles are individually marked and recorded
during nightly patrols. I obtained the data used in this study from the organizations in
charge of monitoring and conservation for each site. I used the list of tagged turtles seen
each year at each beach to calculate nesting numbers as well as the yearly remigration
intervals (or the mean remigration intervals for all turtles nesting in a particular year).
Fitting the model to specific populations
In order to fit the standard model (Chapter 3, this dissertation) to particular
nesting populations, both the equation that predicts NPP from the temperature signal
(Equation 1) and the metabolic function (Equations 2-4) need to be altered. To calculate
NPP for each of the foraging ground temperature signals, I simply rescaled Equation 1
from the standard model so the corresponding production was approximately the average
production for each nesting population in the literature (Wallace and Saba 2009). The
adapted equations for each signal were as follows:
PP = (300/EQS1 – 125)/7 (9)
PP = (300/S2 – 125)/1.9 (10)
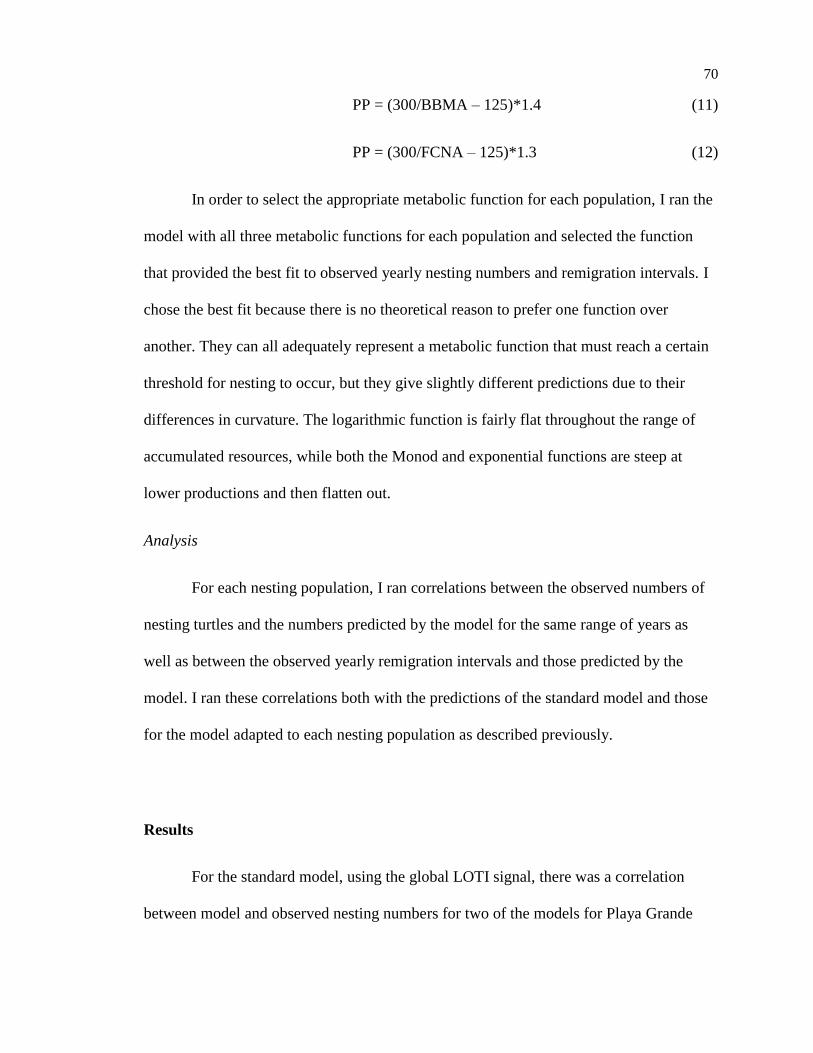
70
PP = (300/BBMA – 125)*1.4 (11)
PP = (300/FCNA – 125)*1.3 (12)
In order to select the appropriate metabolic function for each population, I ran the
model with all three metabolic functions for each population and selected the function
that provided the best fit to observed yearly nesting numbers and remigration intervals. I
chose the best fit because there is no theoretical reason to prefer one function over
another. They can all adequately represent a metabolic function that must reach a certain
threshold for nesting to occur, but they give slightly different predictions due to their
differences in curvature. The logarithmic function is fairly flat throughout the range of
accumulated resources, while both the Monod and exponential functions are steep at
lower productions and then flatten out.
Analysis
For each nesting population, I ran correlations between the observed numbers of
nesting turtles and the numbers predicted by the model for the same range of years as
well as between the observed yearly remigration intervals and those predicted by the
model. I ran these correlations both with the predictions of the standard model and those
for the model adapted to each nesting population as described previously.
Results
For the standard model, using the global LOTI signal, there was a correlation
between model and observed nesting numbers for two of the models for Playa Grande
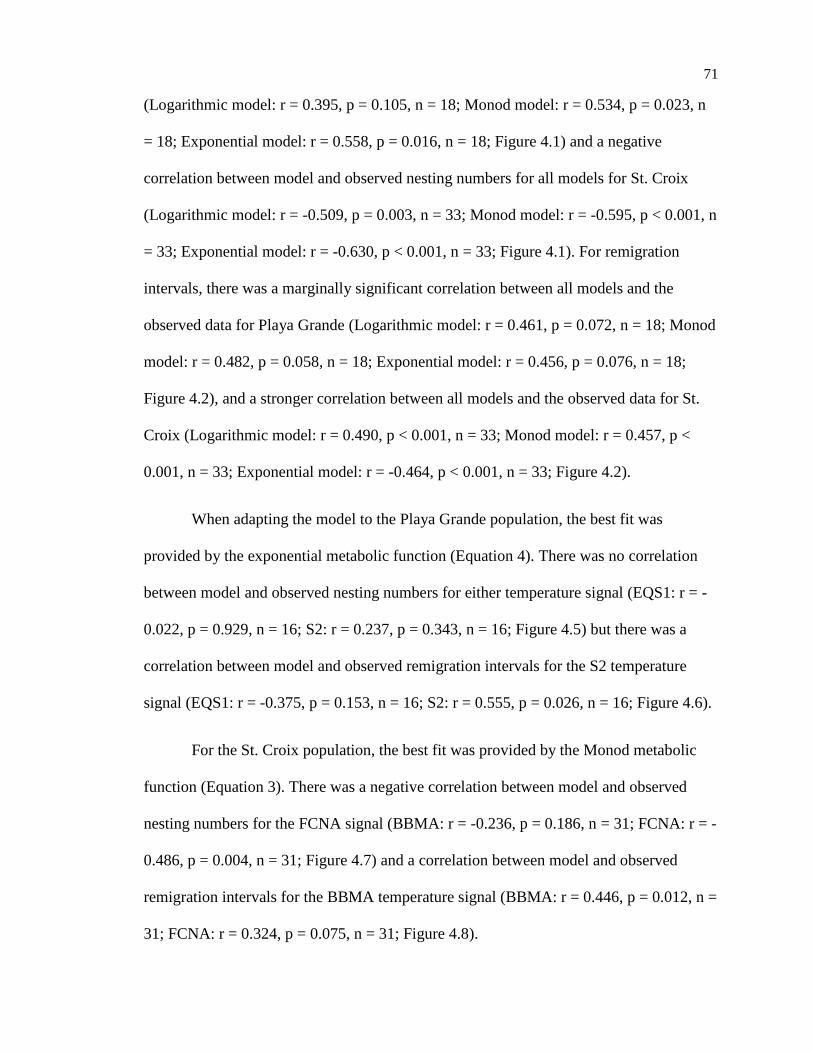
71
(Logarithmic model: r = 0.395, p = 0.105, n = 18; Monod model: r = 0.534, p = 0.023, n
= 18; Exponential model: r = 0.558, p = 0.016, n = 18; Figure 4.1) and a negative
correlation between model and observed nesting numbers for all models for St. Croix
(Logarithmic model: r = -0.509, p = 0.003, n = 33; Monod model: r = -0.595, p < 0.001, n
= 33; Exponential model: r = -0.630, p < 0.001, n = 33; Figure 4.1). For remigration
intervals, there was a marginally significant correlation between all models and the
observed data for Playa Grande (Logarithmic model: r = 0.461, p = 0.072, n = 18; Monod
model: r = 0.482, p = 0.058, n = 18; Exponential model: r = 0.456, p = 0.076, n = 18;
Figure 4.2), and a stronger correlation between all models and the observed data for St.
Croix (Logarithmic model: r = 0.490, p < 0.001, n = 33; Monod model: r = 0.457, p <
0.001, n = 33; Exponential model: r = -0.464, p < 0.001, n = 33; Figure 4.2).
When adapting the model to the Playa Grande population, the best fit was
provided by the exponential metabolic function (Equation 4). There was no correlation
between model and observed nesting numbers for either temperature signal (EQS1: r = -
0.022, p = 0.929, n = 16; S2: r = 0.237, p = 0.343, n = 16; Figure 4.5) but there was a
correlation between model and observed remigration intervals for the S2 temperature
signal (EQS1: r = -0.375, p = 0.153, n = 16; S2: r = 0.555, p = 0.026, n = 16; Figure 4.6).
For the St. Croix population, the best fit was provided by the Monod metabolic
function (Equation 3). There was a negative correlation between model and observed
nesting numbers for the FCNA signal (BBMA: r = -0.236, p = 0.186, n = 31; FCNA: r = -
0.486, p = 0.004, n = 31; Figure 4.7) and a correlation between model and observed
remigration intervals for the BBMA temperature signal (BBMA: r = 0.446, p = 0.012, n =
31; FCNA: r = 0.324, p = 0.075, n = 31; Figure 4.8).
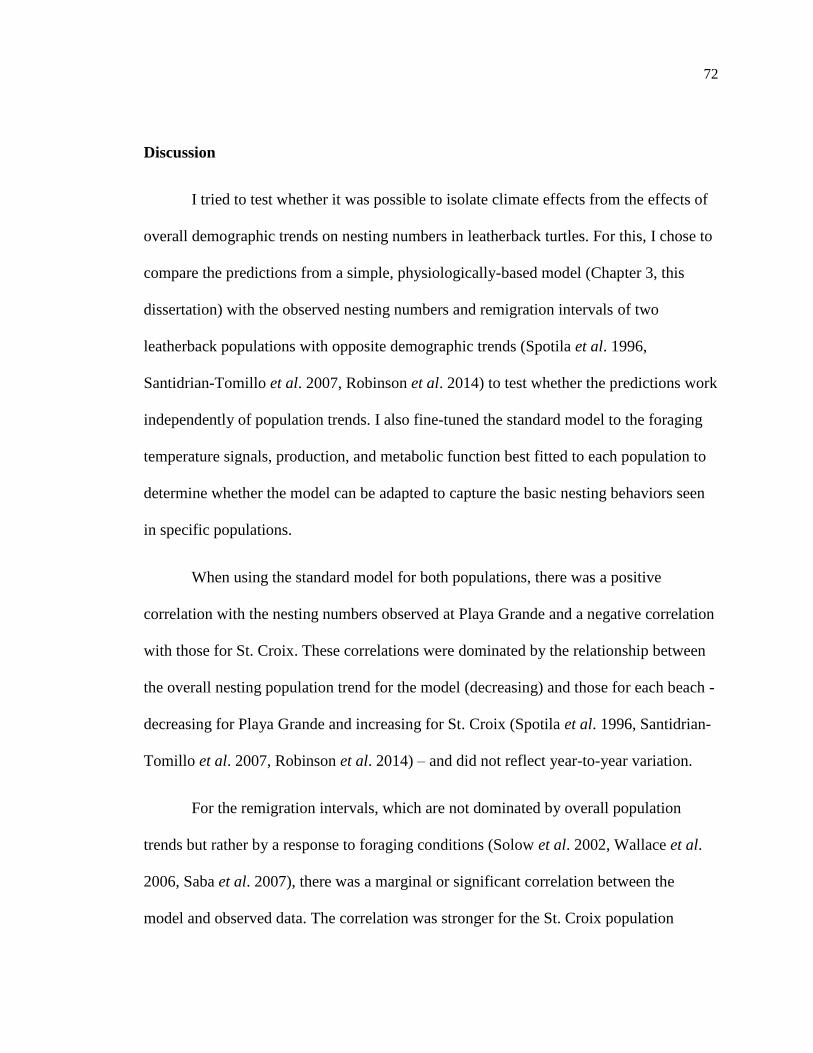
72
Discussion
I tried to test whether it was possible to isolate climate effects from the effects of
overall demographic trends on nesting numbers in leatherback turtles. For this, I chose to
compare the predictions from a simple, physiologically-based model (Chapter 3, this
dissertation) with the observed nesting numbers and remigration intervals of two
leatherback populations with opposite demographic trends (Spotila et al. 1996,
Santidrian-Tomillo et al. 2007, Robinson et al. 2014) to test whether the predictions work
independently of population trends. I also fine-tuned the standard model to the foraging
temperature signals, production, and metabolic function best fitted to each population to
determine whether the model can be adapted to capture the basic nesting behaviors seen
in specific populations.
When using the standard model for both populations, there was a positive
correlation with the nesting numbers observed at Playa Grande and a negative correlation
with those for St. Croix. These correlations were dominated by the relationship between
the overall nesting population trend for the model (decreasing) and those for each beach -
decreasing for Playa Grande and increasing for St. Croix (Spotila et al. 1996, Santidrian-
Tomillo et al. 2007, Robinson et al. 2014) – and did not reflect year-to-year variation.
For the remigration intervals, which are not dominated by overall population
trends but rather by a response to foraging conditions (Solow et al. 2002, Wallace et al.
2006, Saba et al. 2007), there was a marginal or significant correlation between the
model and observed data. The correlation was stronger for the St. Croix population
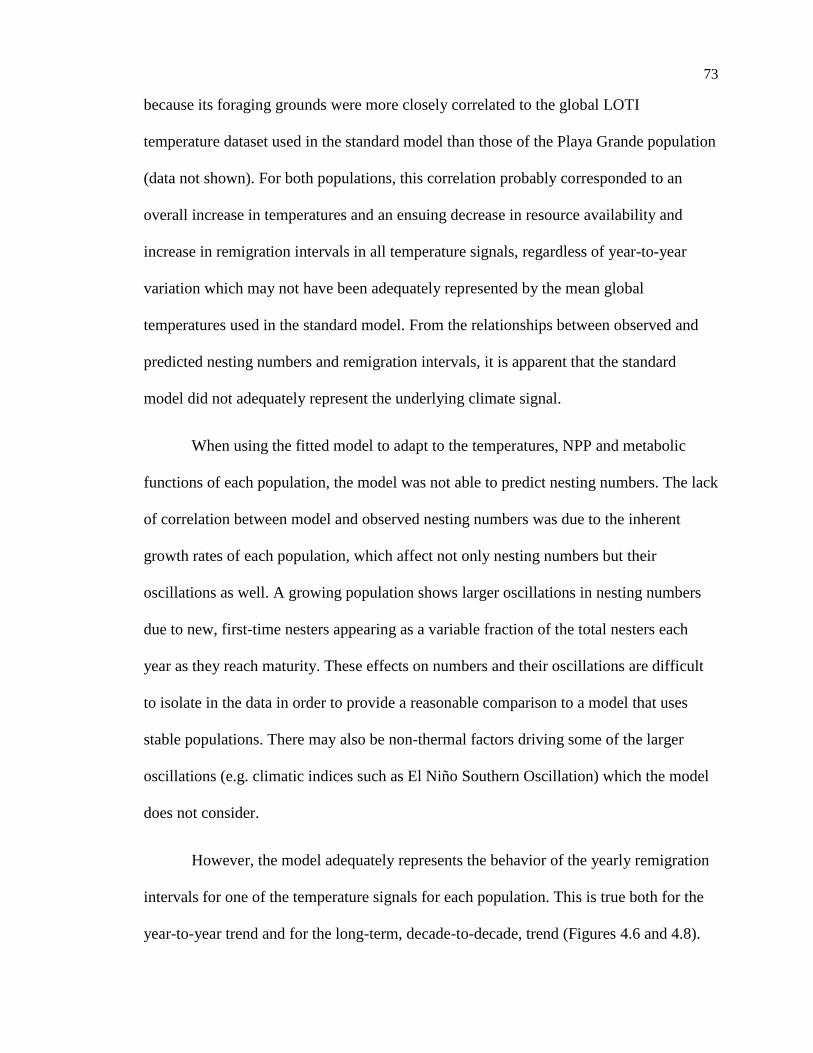
73
because its foraging grounds were more closely correlated to the global LOTI
temperature dataset used in the standard model than those of the Playa Grande population
(data not shown). For both populations, this correlation probably corresponded to an
overall increase in temperatures and an ensuing decrease in resource availability and
increase in remigration intervals in all temperature signals, regardless of year-to-year
variation which may not have been adequately represented by the mean global
temperatures used in the standard model. From the relationships between observed and
predicted nesting numbers and remigration intervals, it is apparent that the standard
model did not adequately represent the underlying climate signal.
When using the fitted model to adapt to the temperatures, NPP and metabolic
functions of each population, the model was not able to predict nesting numbers. The lack
of correlation between model and observed nesting numbers was due to the inherent
growth rates of each population, which affect not only nesting numbers but their
oscillations as well. A growing population shows larger oscillations in nesting numbers
due to new, first-time nesters appearing as a variable fraction of the total nesters each
year as they reach maturity. These effects on numbers and their oscillations are difficult
to isolate in the data in order to provide a reasonable comparison to a model that uses
stable populations. There may also be non-thermal factors driving some of the larger
oscillations (e.g. climatic indices such as El Niño Southern Oscillation) which the model
does not consider.
However, the model adequately represents the behavior of the yearly remigration
intervals for one of the temperature signals for each population. This is true both for the
year-to-year trend and for the long-term, decade-to-decade, trend (Figures 4.6 and 4.8).
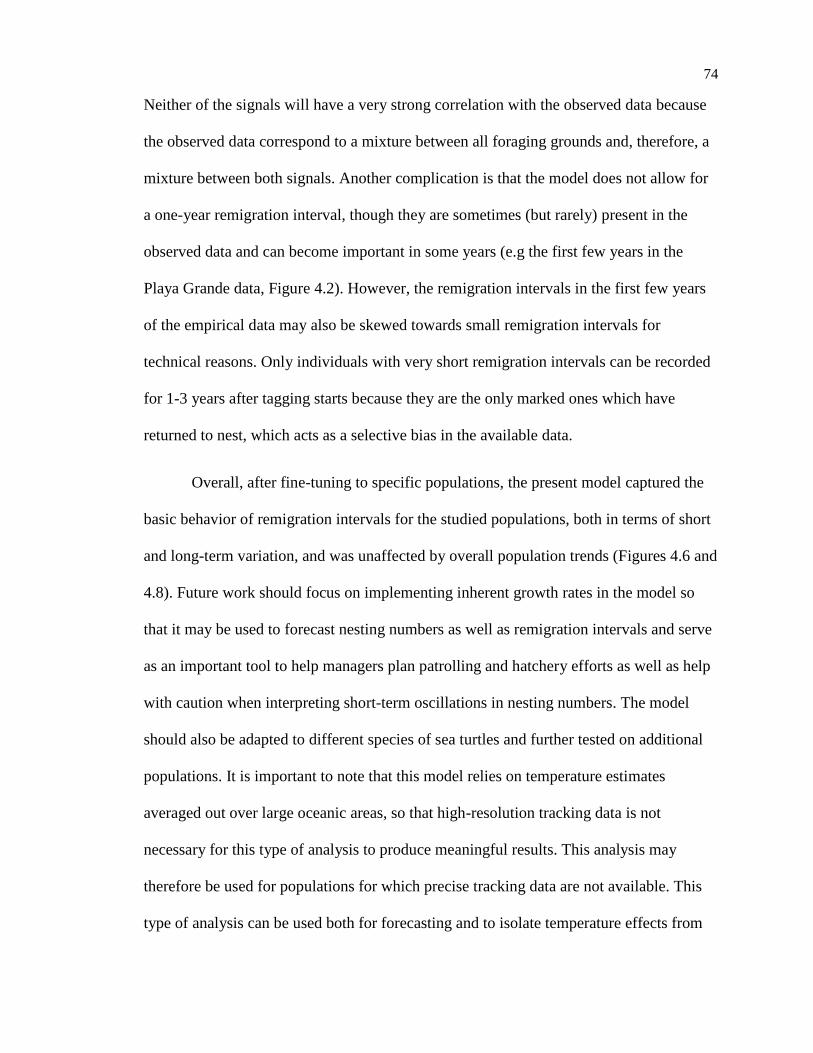
74
Neither of the signals will have a very strong correlation with the observed data because
the observed data correspond to a mixture between all foraging grounds and, therefore, a
mixture between both signals. Another complication is that the model does not allow for
a one-year remigration interval, though they are sometimes (but rarely) present in the
observed data and can become important in some years (e.g the first few years in the
Playa Grande data, Figure 4.2). However, the remigration intervals in the first few years
of the empirical data may also be skewed towards small remigration intervals for
technical reasons. Only individuals with very short remigration intervals can be recorded
for 1-3 years after tagging starts because they are the only marked ones which have
returned to nest, which acts as a selective bias in the available data.
Overall, after fine-tuning to specific populations, the present model captured the
basic behavior of remigration intervals for the studied populations, both in terms of short
and long-term variation, and was unaffected by overall population trends (Figures 4.6 and
4.8). Future work should focus on implementing inherent growth rates in the model so
that it may be used to forecast nesting numbers as well as remigration intervals and serve
as an important tool to help managers plan patrolling and hatchery efforts as well as help
with caution when interpreting short-term oscillations in nesting numbers. The model
should also be adapted to different species of sea turtles and further tested on additional
populations. It is important to note that this model relies on temperature estimates
averaged out over large oceanic areas, so that high-resolution tracking data is not
necessary for this type of analysis to produce meaningful results. This analysis may
therefore be used for populations for which precise tracking data are not available. This
type of analysis can be used both for forecasting and to isolate temperature effects from

75
the effects of population trends in order to better determine whether any observed trends
are real, or may correspond to a stable population responding to anomalous climate.
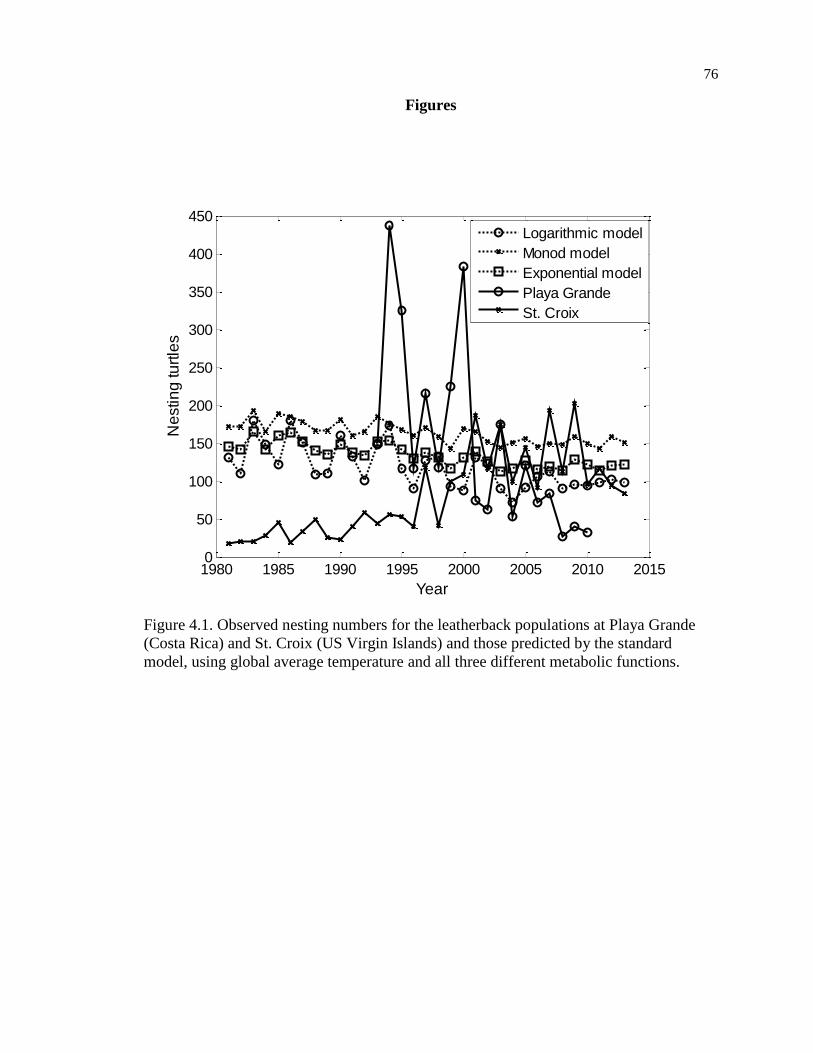
76
Figures
Figure 4.1. Observed nesting numbers for the leatherback populations at Playa Grande
(Costa Rica) and St. Croix (US Virgin Islands) and those predicted by the standard
model, using global average temperature and all three different metabolic functions.
1980 1985 1990 1995 2000 2005 2010 20150
50
100
150
200
250
300
350
400
450
Year
Ne
stin
g tu
rtle
s
Logarithmic model
Monod model
Exponential model
Playa Grande
St. Croix
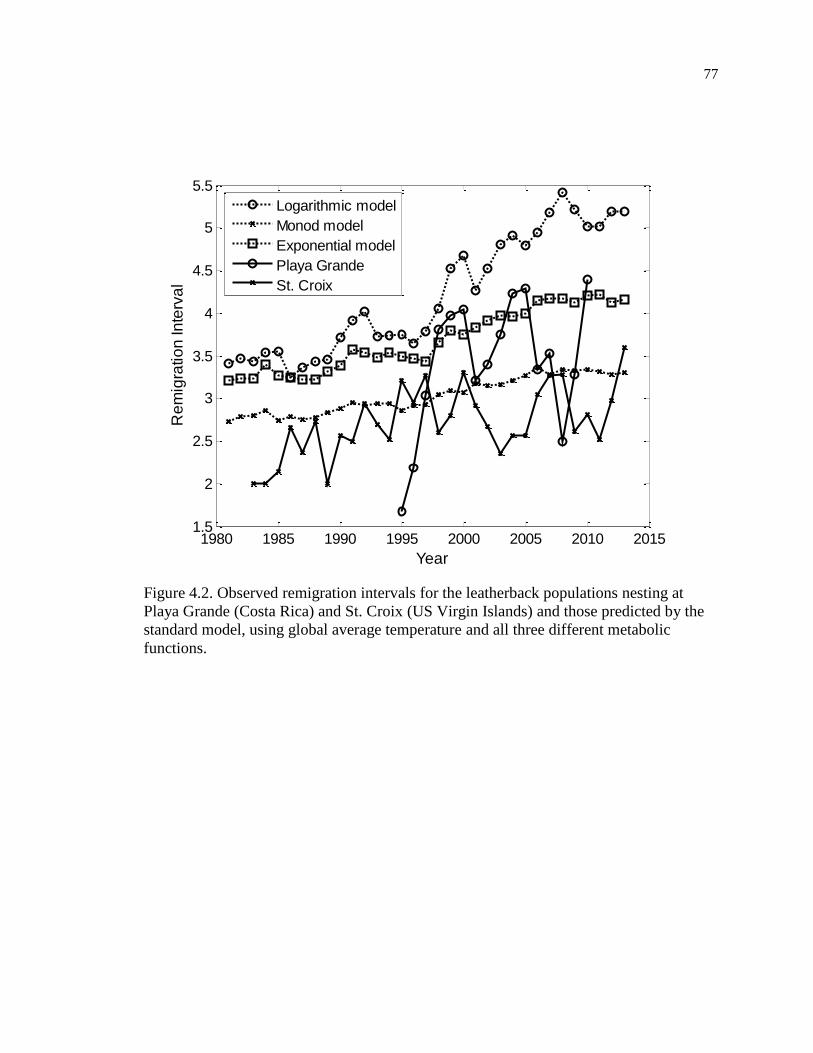
77
Figure 4.2. Observed remigration intervals for the leatherback populations nesting at
Playa Grande (Costa Rica) and St. Croix (US Virgin Islands) and those predicted by the
standard model, using global average temperature and all three different metabolic
functions.
1980 1985 1990 1995 2000 2005 2010 20151.5
2
2.5
3
3.5
4
4.5
5
5.5
Year
Re
mig
ratio
n In
terv
al
Logarithmic model
Monod model
Exponential model
Playa Grande
St. Croix
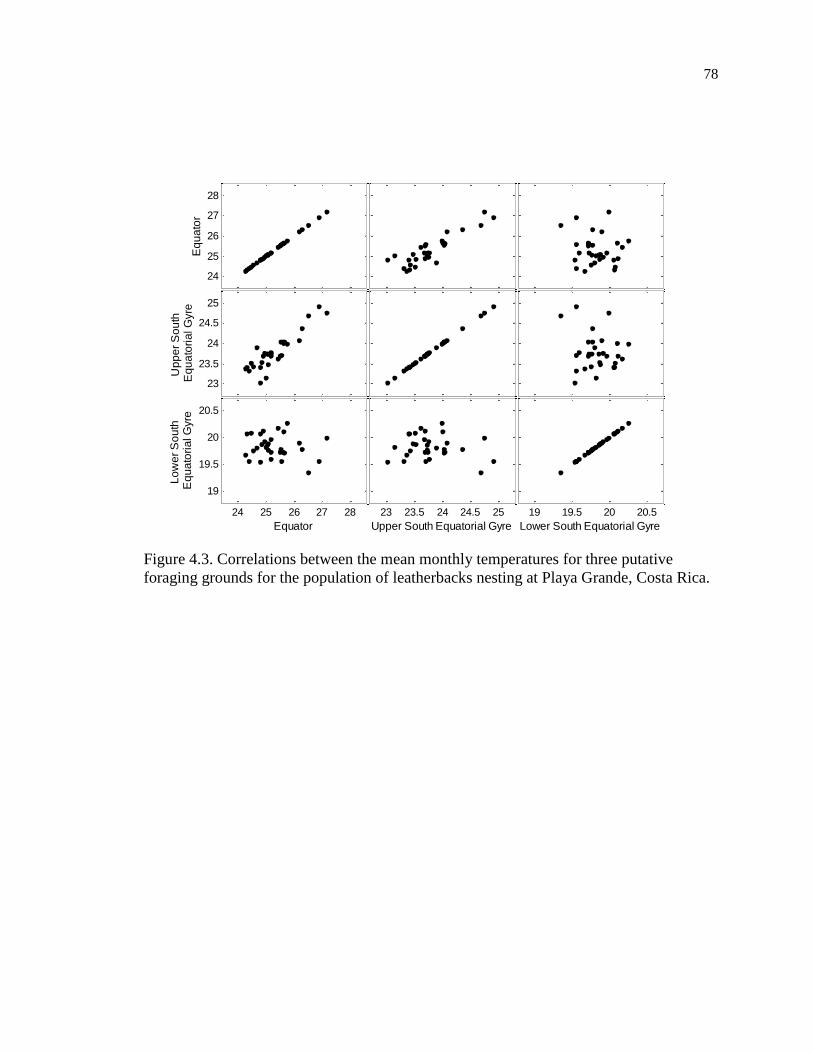
78
Figure 4.3. Correlations between the mean monthly temperatures for three putative
foraging grounds for the population of leatherbacks nesting at Playa Grande, Costa Rica.
19 19.5 20 20.5
Lower South Equatorial Gyre
23 23.5 24 24.5 25
Upper South Equatorial Gyre
24 25 26 27 28
19
19.5
20
20.5
Equator
Lo
we
r S
ou
th
Eq
ua
tori
al G
yre
23
23.5
24
24.5
25
Up
pe
r S
ou
th
Eq
ua
tori
al G
yre
24
25
26
27
28E
qu
ato
r
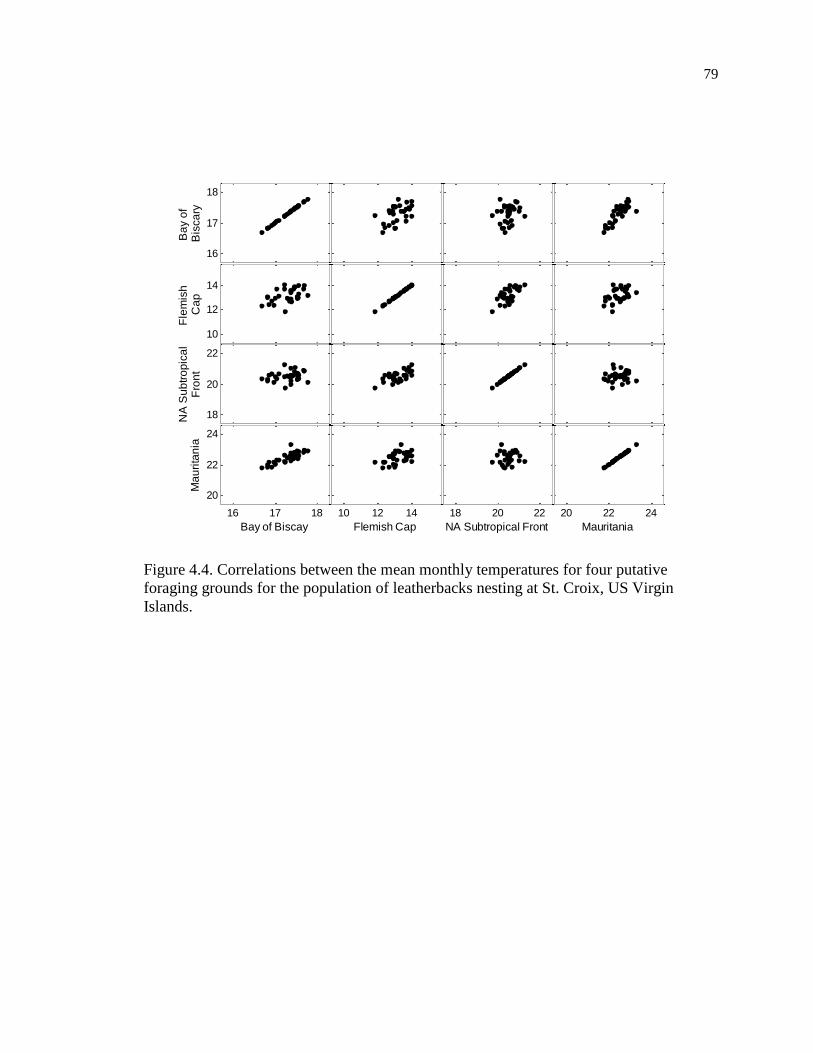
79
Figure 4.4. Correlations between the mean monthly temperatures for four putative
foraging grounds for the population of leatherbacks nesting at St. Croix, US Virgin
Islands.
20 22 24
Mauritania
18 20 22
NA Subtropical Front
10 12 14
Flemish Cap
16 17 18
20
22
24
Bay of Biscay
Ma
uri
tan
ia
18
20
22
NA
Su
btr
op
ica
lF
ron
t
10
12
14
Fle
mis
h
Ca
p
16
17
18B
ay o
f B
isca
ry
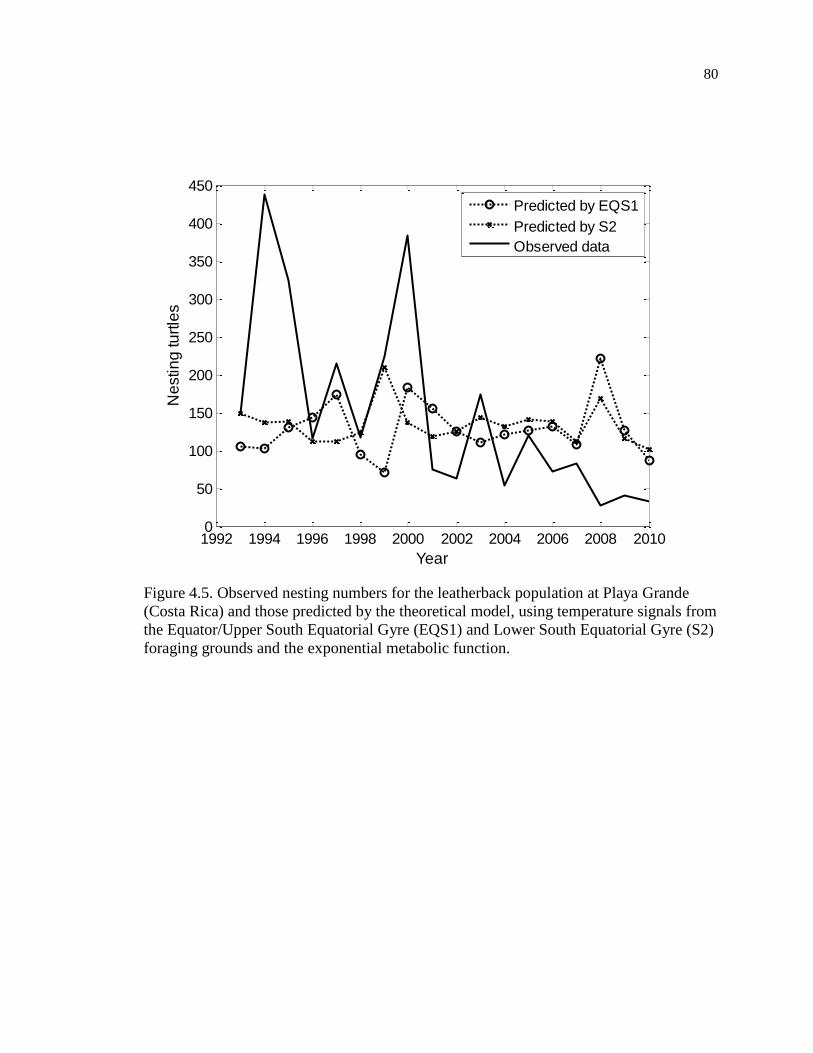
80
Figure 4.5. Observed nesting numbers for the leatherback population at Playa Grande
(Costa Rica) and those predicted by the theoretical model, using temperature signals from
the Equator/Upper South Equatorial Gyre (EQS1) and Lower South Equatorial Gyre (S2)
foraging grounds and the exponential metabolic function.
1992 1994 1996 1998 2000 2002 2004 2006 2008 20100
50
100
150
200
250
300
350
400
450
Year
Ne
stin
g tu
rtle
s
Predicted by EQS1
Predicted by S2
Observed data
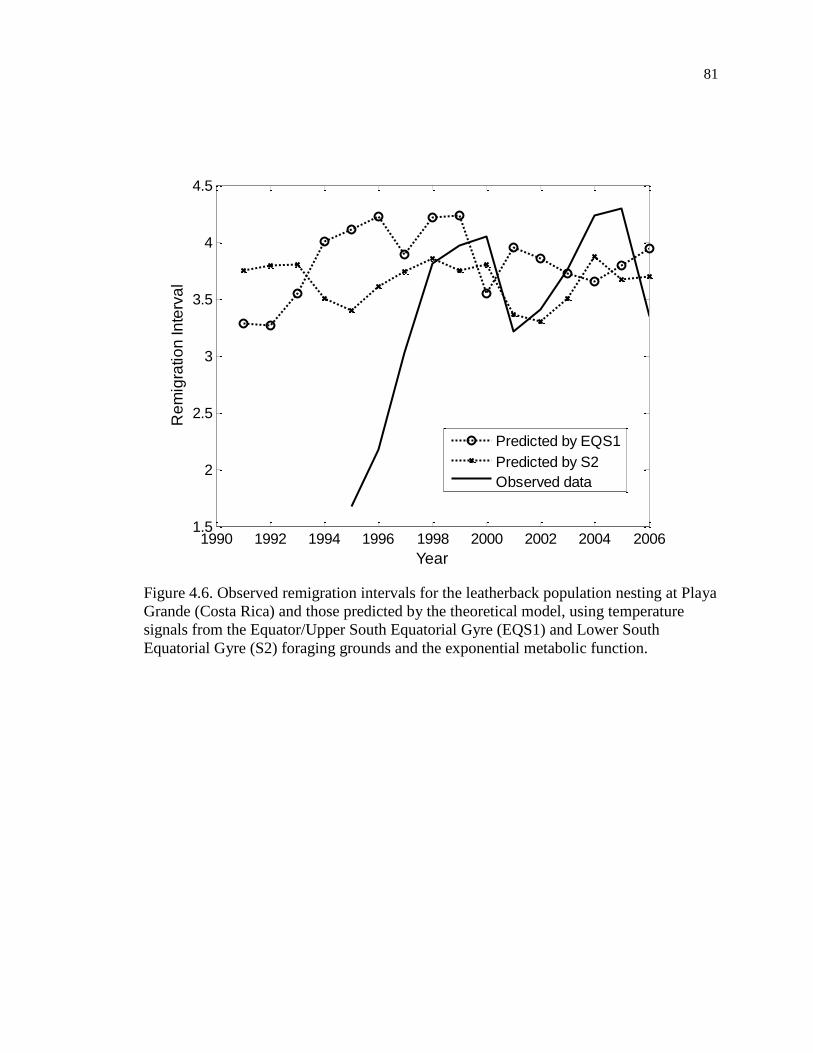
81
Figure 4.6. Observed remigration intervals for the leatherback population nesting at Playa
Grande (Costa Rica) and those predicted by the theoretical model, using temperature
signals from the Equator/Upper South Equatorial Gyre (EQS1) and Lower South
Equatorial Gyre (S2) foraging grounds and the exponential metabolic function.
1990 1992 1994 1996 1998 2000 2002 2004 20061.5
2
2.5
3
3.5
4
4.5
Year
Re
mig
ratio
n In
terv
al
Predicted by EQS1
Predicted by S2
Observed data
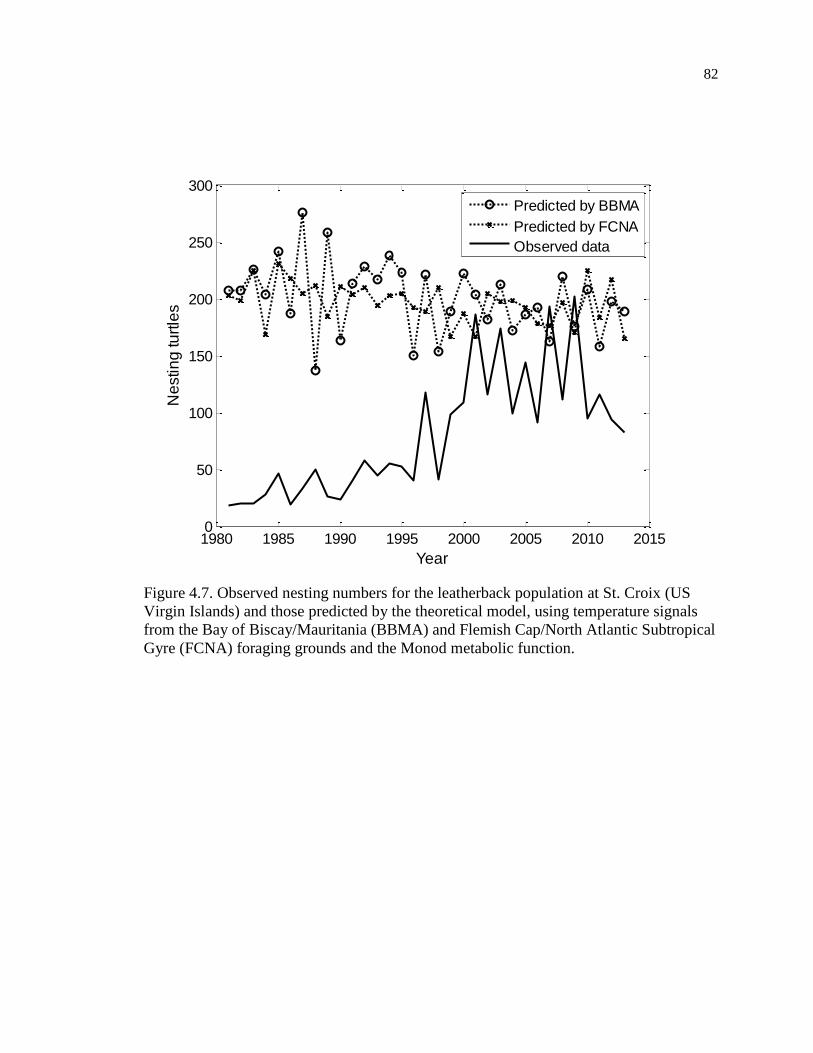
82
Figure 4.7. Observed nesting numbers for the leatherback population at St. Croix (US
Virgin Islands) and those predicted by the theoretical model, using temperature signals
from the Bay of Biscay/Mauritania (BBMA) and Flemish Cap/North Atlantic Subtropical
Gyre (FCNA) foraging grounds and the Monod metabolic function.
1980 1985 1990 1995 2000 2005 2010 20150
50
100
150
200
250
300
Year
Ne
stin
g tu
rtle
s
Predicted by BBMA
Predicted by FCNA
Observed data
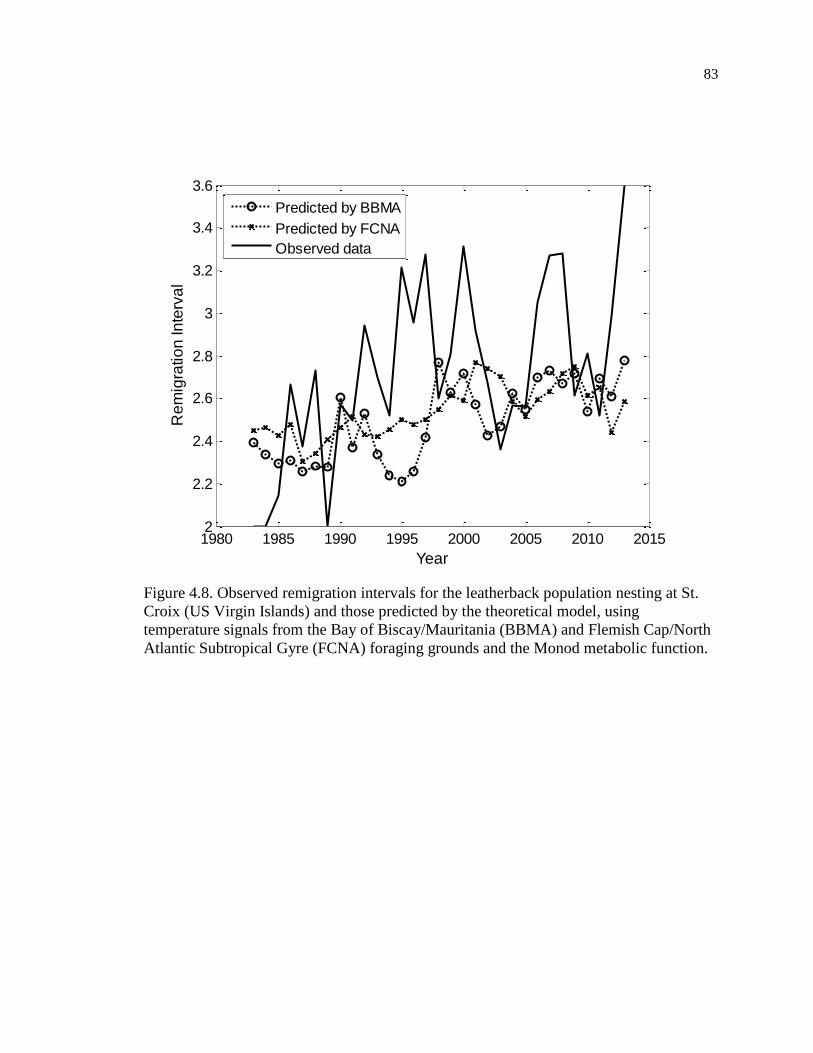
83
Figure 4.8. Observed remigration intervals for the leatherback population nesting at St.
Croix (US Virgin Islands) and those predicted by the theoretical model, using
temperature signals from the Bay of Biscay/Mauritania (BBMA) and Flemish Cap/North
Atlantic Subtropical Gyre (FCNA) foraging grounds and the Monod metabolic function.
1980 1985 1990 1995 2000 2005 2010 20152
2.2
2.4
2.6
2.8
3
3.2
3.4
3.6
Year
Re
mig
ratio
n In
terv
al
Predicted by BBMA
Predicted by FCNA
Observed data
84
CHAPTER 5: General Conclusions
With this dissertation, I aimed to mechanistically examine how sea turtles
currently respond to changes in temperature, in order to provide some insight into how
they may respond to climate change. I looked at two of the main ways in which sea
turtles have been reported to respond to altered temperatures and their corresponding
altered resource availability: shifting the timing of their nesting seasons (Weishampel et
al. 2004, Pike et al. 2006, Hawkes et al.2007b, Mazaris et al.2008, Mazaris et al. 2009,
Pike 2009, Weishampel et al. 2010, Dalleau et al. 2012) and shortening or lengthening
their remigration intervals (Carr & Carr 1970, Chaloupka 2001, Solow et al. 2002,
Wallace et al. 2006, Saba et al. 2007, Troëng & Chaloupka 2007, Hatase & Tsukamoto
2008, Suryan et al. 2009) which ultimately leads to large oscillations in annual nesting
numbers (Limpus & Nichols 1988, Hays 2000, Broderick et al. 2001, Chaloupka 2001,
Solow et al. 2002, Price et al. 2006, Chaloupka et al. 2008, Reina et al. 2009).
In order to examine possible phenological changes, I determined whether the
timing of nesting seasons for three populations of leatherback turtles (Playa Grande,
Costa Rica; Tortuguero, Costa Rica; and St. Croix, US Virgin Islands) has varied in
response to interannual temperature variation both at their nesting and foraging sites.
Since previous studies have found contrasting trends in sea turtle response to
temperatures (Weishampel et al. 2004, Pike et al. 2006, Hawkes et al.2007b, Mazaris et
al.2008, Mazaris et al. 2009, Pike 2009, Weishampel et al. 2010, Dalleau et al. 2012), I
looked at the relationship between temperature and net primary production at the foraging
85
grounds in order to determine whether or not resource availability mediated any observed
relationships between temperature and nesting dates.
I found that, though foraging temperatures (and not local temperatures) did
overall contribute to shifting nesting dates for all the populations studied, these
relationships were neither consistent nor very strong. The most common trend was for
increased temperatures to delay nesting, which differs from results on other nesting
beaches (Weishampel et al. 2004, Hawkes et al. 2007, Mazaris et al.2008, Mazaris et al.
2009, Pike 2009, Weishampel et al. 2010) where increased temperatures lead to earlier
nesting or did not affect nesting dates. However, one of the nesting grounds for the
Tortuguero nesting population, the Gulf of Mexico, showed the opposite trend with
increased temperatures leading to earlier nesting. These contrasts in observed trends were
not explained by differences in the relationship between temperature and net primary
production. Rather, the inconsistencies between studies and sites may be due to
differences in mean sea surface temperature, with warmer waters showing opposite
effects than colder waters (Richardson and Schoeman 2004). Specifically for the
contrasts in the present study, it is also possible that resource availability in the Gulf of
Mexico is driven by other factors such as hypoxia (Diaz & Solow 1999, Diaz &
Rosenberg 2008) or changes in fluvial discharge (Graham 2001) rather than strictly by
temperature.
Overall, this study suggests that migratory cues are complex and vary between
different sites. This raises the possibility that there might not be an overarching effect of
temperature on the timing of nesting seasons, but rather various local population effects.
86
It also highlights the importance of studying both local and foraging temperature signals
when looking for possible effects on phenology.
For possible changes in remigration intervals and nesting numbers, I developed a
physiologically-based mechanistic model that links global or foraging ground
temperatures to resource availability and accumulation by sea turtles, remigration
intervals, and observed annual nesting numbers. I found that thermally-driven resource
variation, rather than specific life history traits, synchronizes nesting in groups of sea
turtles and can lead to large fluctuations in yearly nesting numbers. These cohorts of
nesting turtles do not persist long-term, they diffuse out over a period of 5-10 years
unless environmental conditions regenerate them.
Using the proposed theoretical model to explore different temperature scenarios, I
found that one-year perturbations of cold temperatures shorten remigration intervals and
can have a synchronizing effect on nesting numbers. In contrast, warm temperature
pulses tend to delay nesting in a less synchronized way. I also looked at cyclical
temperature variation and found that it leads to cyclical responses in both remigration
intervals and nesting numbers, with lag and amplitude both varying with cycle duration.
Model behavior was consistent with general observations on nesting beaches, so I
wanted to test whether it was also consistent with the behavior of specific nesting
populations. I looked at two leatherback populations with opposing growth trends: Playa
Grande, Costa Rica, which is dramatically decreasing (Spotila et al. 1996, Santidrian-
Tomillo et al. 2007), and St. Croix, US Virgin Islands, which is increasing (Robinson et
al. 2014), in order to determine whether it is possible to observe and isolate the
temperature signal despite opposing population trends.
87
When I ran the model using mean global temperatures, there was a positive
correlation with nesting numbers for Playa Grande and a negative correlation with
nesting numbers for St. Croix. These relationships were dominated by the overall trend
for each population. There was a correlation between predicted and observed remigration
intervals, but this was driven by an overall warming trend both in global temperatures
and in the relevant temperatures for each nesting population and did not adequately
reflect year-to-year variation.
When I adapted the model to use foraging temperature signals for each beach, it
was able to capture both the year-to-year and decade-to-decade variation in remigration
intervals for both populations. Nesting numbers were not well predicted, due to large
oscillations in the observed data (which may be driven by non-thermal factors) as well as
the difficulty in isolating the effects of population trends both on nesting numbers and
their oscillations. Future versions of the model should incorporate population growth
rates in order to allow for better comparison.
Considering these studies together, I am able to offer some general management
recommendations as well as recommendations for future work. With increasing
temperatures, nesting seasons will shift. Studies of specific populations should focus on
determining the magnitude and direction of the shift in order to successfully plan for
management and conservation. It will also be important to use climate change scenarios
to determine whether these shifted seasons will mean altered incubations conditions for
the populations and whether any additional measures need to be taken to improve
hatching success and manage hatchling sex ratios, such as shading nests or relocating
them to a hatchery.
88
The remigration interval study suggests that, unless there are strong population
trends, with temperatures increasing globally an overall decreasing trend in nesting
numbers is expected even for stable populations. This can obscure population trends
when estimating them from nesting censuses and should be taken into consideration when
determining population sizes and their trends. With improvements to this theoretical
model, it could potentially be used to forecast nesting numbers for specific populations
leading to better planning for individual seasons, even when no precise tracking data are
available. Additional studies could include using the model to explore the magnitude of
the effect of temperature on remigration intervals and nesting numbers under different
climate change scenarios.
89
List of References
Arendt, M D, J A Schwenter, B E Witherington, A B Meylan, and V S Saba. 2013. “Historical
versus Contemporary Climate Forcing on the Annual Nesting Variability of Loggerhead
Sea Turtles in the Northwest Atlantic Ocean.” PloS One 8: e81097.
Ackerman, R A. 1975. “Diffusion and the Gas Exchange of Sea Turtle Eggs”. Doctoral
Dissertation, University of Florida.
Behrenfeld, M J, and P G Falkowski. 1997. “Photosynthetic Rates Derived from Satellite-Based
Chlorophyll Concentration.” Limnology and Oceanography 42: 1–20.
Bell, B, J R Spotila, F V Paladino, and R D Reina. 2003. “Low Reproductive Success of
Leatherback Turtles, Dermochelys coriacea, is Due to High Embryonic Mortality.”
Biological Conservation 115: 131–38.
Blanco, G S. 2010. “Movements and Behavior of the East Pacific Green Turtle (Chelonia mydas)
from Costa Rica”. Doctoral Dissertation, Drexel University.
Boulon, R H, P H Dutton, and D L McDonald. 1996. “Leatherback Turtles Dermochelys
coriacea on St. Croix, U.S. Virgin Islands: Fifteen Years of Conservation.” Chelonian
Conservation Biology 2: 141-147.
Broderick, A C, B J Godley, and G C Hays. 2001. “Trophic Status Drives Interannual Variability
in Nesting Numbers of Marine Turtles.” Proceedings of The Royal Society Biological
Sciences 268: 1481–87.
Broderick, A C, M S Coyne, W J Fuller, F Glen, and B J Godley. 2007. “Fidelity and over-
Wintering of Sea Turtles.” Proceedings of The Royal Society Biological Sciences 274:
1533–38.
Byrne, R, J Fish, T K Doyle, and J D R Houghton. 2009. “Tracking Leatherback Turtles
(Dermochelys coriacea) during Consecutive Inter-Nesting Intervals: Further Support for
Direct Transmitter Attachment.” Journal of Experimental Marine Biology and Ecology
377: 68–75.
90
Calvert, A M, S J Walde, and P D Taylor. 2009. “Nonbreeding-Season Drivers of Population
Dynamics in Seasonal Migrants: Conservation Parallels Across Taxa.” Avian
Conservation and Ecology 4: 5.
Carr, A, and M H Carr. 1970. “Modulated Reproductive Periodicity in Chelonia.” Ecology 51:
335–37.
Chaloupka, M. 2001. “Historical Trends, Seasonality and Spatial Synchrony in Green Sea Turtle
Egg Production.” Biological Conservation 101: 263–79.
Chaloupka, M, N Kamezaki, and C Limpus. 2008. “Is Climate Change Affecting the Population
Dynamics of the Endangered Pacific Loggerhead Sea Turtle?” Journal of Experimental
Marine Biology and Ecology 356: 136–43.
Chavez, F P, P G Strutton, G E Friederich, R A Feely, G C Feldman, D G Foley, and M J
McPhaden. 1999. “Biological and Chemical Response of the Equatorial Pacific Ocean to
the 1997-98 El Niño.” Science 286: 2126–31.
Dalleau, M, S Ciccione, J A Mortimer, J Garnier, S Benhamou, and J Bourjea. 2012. “Nesting
Phenology of Marine Turtles: Insights from a Regional Comparative Analysis on Green
Turtle (Chelonia mydas).” PloS One 7: e46920.
Davenport, J. 1997. “Temperature and the Life-History Strategies of Sea Turtles.” Journal of
Thermal Biology 22: 479–88.
Diaz, R J, and A Solow. 1999. Ecological and Economic Consequences of Hypoxia Topic 2
Report for the Integrated Assessment on Hypoxia in the Gulf of Mexico. NOAA Coastal
Ocean Program Decision Analysis Series No. 16. NOAA Coastal Ocean Program, Silver
Spring, MD.
Diaz, R J, and R Rosenberg. 2008. “Spreading Dead Zones and Consequences for Marine
Ecosystems.” Science 321: 926–29.
Dunham, A E, B W Grant, and K L Overall. 1989. “Interfaces between Biophysical and
Physiological Ecology and the Population Ecology of Terrestrial Vertebrate Ectotherms.”
Physiological Zoology 62: 335–55.
Eckert, K L, and S A Eckert. 1988. “Pre-Reproductive Movements of Leatherback Sea Turtles
(Dermochelys coriacea) Nesting in the Caribbean.” Copeia 1988: 400–406.
91
Eckert, Scott A. 2006. “High-Use Oceanic Areas for Atlantic Leatherback Sea Turtles
(Dermochelys coriacea) as Identified Using Satellite Telemetered Location and Dive
Information.” Marine Biology 149: 1257–67.
Fowler, L E. 1979. “Hatching Success and Nest Predation in the Green Sea Turtle, Chelonia
Mydas, at Tortuguero, Costa Rica.” Ecology 60: 946–55.
Fuentes, M M P B, M Hamann, and C J Limpus. 2010. “Past, Current and Future Thermal
Profiles of Green Turtle Nesting Grounds: Implications from Climate Change.” Journal
of Experimental Marine Biology and Ecology 383: 56–64.
Fuentes, M. M. P. B., M. R. Fish, and J. A. Maynard. 2012. “Management Strategies to Mitigate
the Impacts of Climate Change on Sea Turtle’s Terrestrial Reproductive Phase.”
Mitigation and Adaptation Strategies for Global Change 17: 51–63.
Gaspar, P, S R Benson, P H Dutton, A Reveillere, G Jacob, C Meetoo, A Dehecq, and S
Fossette. 2012. “Oceanic Dispersal of Juvenile Leatherback Turtles: Going beyond
Passive Drift Modeling.” Marine Ecology Progress Series 457: 265–84.
Graham, W M. 2001. “Numerical Increases and Distributional Shifts of Chrysaora
quinquecirrha (Desor) and Aurelia aurita (Linne) (Cnidaria: Scyphozoa) in the Northern
Gulf of Mexico.” Hydrobiologia 451: 97–111.
Georges, J Y, A Billes, S Ferraroli, S Fossette, J Fretey, D Grémillet, Y L Maho, A E Myers, H
Tanaka, and G C Hays. 2007. “Meta-Analysis of Movements in Atlantic Leatherback
Turtles during Nesting Season: Conservation Implications.” Marine Ecology Progress
Series 338: 225–32.
Goddard Institute for Space Studies. GISS Surface Temperature Analysis (GISTEMP), accessed
September 2014. http://data.giss.nasa.gov/gistemp/
Hatase, H, and K Tsukamoto. 2008. “Smaller Longer, Larger Shorter: Energy Budget
Calculations Explain Intrapopulation Variation in Remigration Intervals for Loggerhead
Sea Turtles (Caretta caretta).” Canadian Journal of Zoology 86: 595–600.
Hawkes, L A, A C Broderick, M S Coyne, M H Godfrey, and B J Godley. 2007a. “Only Some
like It Hot — Quantifying the Environmental Niche of the Loggerhead Sea Turtle.”
Diversity and Distributions 13: 447–57.
92
Hawkes, L A, A C Broderick, M H Godfrey, and B J Godley. 2007b. “Investigating the Potential
Impacts of Climate Change on a Marine Turtle Population.” Global Change Biology 13:
923–32.
Hawkes, L A, A C Broderick, M H Godfrey, and B J Godley. 2009. “Climate Change and
Marine Turtles.” Endangered Species Research 7: 137–54.
Hays, G C. 2000. “The Implications of Variable Remigration Intervals for the Assessment of
Population Size in Marine Turtles.” Journal of Theoretical Biology 206: 221–27.
Hays, G C, A J Richardson, and C Robinson. 2005. “Climate Change and Marine Plankton.”
Trends in Ecology & Evolution 20: 337–44.
Hays, G C, S Fossette, K A Katselidis, G Schofield, and M B Gravenor. 2010. “Breeding
Periodicity for Male Sea Turtles, Operational Sex Ratios, and Implications in the Face of
Climate Change.” Conservation Biology 24: 1636–43.
Hughes, L. 2000. “Biological Consequences of Global Warming: Is the Signal Already
Apparent?” Trends in Ecology & Evolution 15: 56–61.
IPCC, 2013: Climate Change 2013: The Physical Science Basis. Contribution of Working Group
I to the Fifth Assessment Report of the Intergovernmental Panel on Climate Change.
Stocker, T.F., D. Qin, G.-K. Plattner, M. Tignor, S.K. Allen, J. Boschung, A. Nauels, Y.
Xia, V. Bex and P.M. Midgley (eds.). Cambridge University Press, Cambridge, United
Kingdom and New York, NY, USA, 1535 pp.
International Research Institute for Climate and Society. Air-Sea Interface Data in the IRI Data
Library, accessed September 2013. http://iridl.ldeo.columbia.edu/docfind/databrief/cat-
airsea.html
James, M C, R A Myers, and C A Ottensmeyer. 2005. “Behaviour of Leatherback Sea Turtles,
Dermochelys coriacea, during the Migratory Cycle.” Proceedings of The Royal Society
Biological Sciences 272: 1547–55.
Katselidis, K A, G Schofield, G Stamou, P Dimopoulos, and J D Pantis. 2012. “Females First?
Past, Present and Future Variability in Offspring Sex Ratio at a Temperate Sea Turtle
Breeding Area.” Animal Conservation 15: 508–18.
93
Kwan, D. 1994. “Fat Reserves and Reproduction in the Green Turtle, Chelonia mydas.” Wildlife
Research 21: 257–66.
Lathi, B P. 1992. “Linear Systems and Signals.” Berkeley-Cambridge Press, Carmichael,
California.
Limpus, C J, and N Nicholls. 1988. “The Southern Oscillation Regulates the Annual Numbers of
Green Turtles (Chelonia mydas) Breeding Around Northern Australia.” Australian
Journal of Wildlife Research 15: 157–61.
Limpus, C J, J D Miller, C J Paramenter, D Reimer, N McLachlan, and R Webb. 1992.
“Migration of Green (Chelonia mydas) and Loggerhead (Caretta caretta) Turtles to and
from Eastern Australian Rookeries.” Wildlife Research 19: 347–58.
Lynam, C P., S J. Hay, and A S. Brierley. 2004. “Interannual Variability in Abundance of North
Sea Jellyfish and Links to the North Atlantic Oscillation.” Limnology and Oceanography
49: 637–43.
Madsen, T, and R Shine. 1999. “The Adjustment of Reproductive Threshold to Prey Abundance
in a Capital Breeder.” Journal of Animal Ecology 68: 571–80.
Mazaris, A D., O Fiksen, and Y G. Matsinos. 2005. “Using an Individual-Based Model for
Assessment of Sea Turtle Population Viability.” Population Ecology 47: 179–91.
Mazaris, A D, A S Kallimanis, S P Sgardelis, and J D Pantis. 2008. “Do Long-Term Changes in
Sea Surface Temperature at the Breeding Areas Affect the Breeding Dates and
Reproduction Performance of Mediterranean Loggerhead Turtles? Implications for
Climate Change.” Journal of Experimental Marine Biology and Ecology 367: 219–26.
Mazaris, A D, A D Kallimanis, J Tzanopoulos, S P Sgardelis, and J D Pantis. 2009. “Sea Surface
Temperature Variations in Core Foraging Grounds Drive Nesting Trends and Phenology
of Loggerhead Turtles in the Mediterranean Sea.” Journal of Experimental Marine
Biology and Ecology 379: 23–27.
Mazaris, A D, A S Kallimanis, J D Pantis, and G C Hays. 2013. “Phenological Response of Sea
Turtles to Environmental Variation across a Species’ Northern Range.” Proceedings of
The Royal Society Biological Sciences 280: 1–9.
94
McMahon, C R, and G C Hays. 2006. “Thermal Niche, Large-Scale Movements and
Implications of Climate Change for a Critically Endangered Marine Vertebrate.” Global
Change Biology 12: 1330–38.
Miller, J D, 1997. “Reproduction in sea turtles.” Lutz, P L, and J A Musick (eds.). The Biology
of Sea Turtles, CRC Press, Boca Raton, Florida.
Miller-Rushing, A J, and R B Primack. 2008. “Global Warming and Flowering Times in
Thoreau’s Concord: A Community Perspective.” Ecology 89: 332–41.
Musick, J A & C J Limpus. 1997. “Habitat Utilization and Migration in Juvenile Sea Turtles.”
Lutz, P L, and J A Musick (eds.). The Biology of Sea Turtles, CRC Press, Boca Raton,
Florida.
Neeman, N, N J Robinson, F V Paladino, J R Spotila, and M P O’Connor. P. 2015. “Phenology
Shifts in Leatherback Turtles (Dermochelys coriacea) Due to Changes in Sea Surface
Temperature”. Journal of Experimental Marine Biology and Ecology 462:113-120.
Ocean Productivity. Online Data: Standard VPGM, accessed September 2013.
http://orca.science.oregonstate.edu/1080.by.2160.monthly.hdf.vgpm.s.chl.a.sst.php
Parmesan, C, and G Yohe. 2003. “A Globally Coherent Fingerprint of Climate Change Impacts
across Natural Systems.” Nature 421: 37–42.
Parmesan, C. 2006. “Ecological and Evolutionary Responses to Recent Climate Change.” The
Annual Review of Ecology, Evolution and Systematics: 637–69.
Pike, D A, R L Antworth, and J C Stiner. 2006. “Earlier Nesting Contributes to Shorter Nesting
Seasons for the Loggerhead Seaturtle, Caretta caretta.” Journal of Herpetology 40: 91–
94.
Pike, D A. 2009. “Do Green Turtles Modify Their Nesting Seasons in Response to
Environmental Temperatures?” Chelonian Conservation and Biology: 43–47.
Poloczanska, E S, C J Limpus, and G C Hays. 2009. “Chapter 2. Vulnerability of Marine Turtles
to Climate Change.” In Advances in Marine Biology, edited by D W Sims, 56:151–211.
Elsevier Academic Press.
95
Price, E R, B P Wallace, R D Reina, J R Spotila, F V Paladino, R Piedra, and E Vélez. 2006.
“Size, Growth, and Reproductive Output of Adult Female Leatherback Turtles
Dermochelys coriacea.” Endangered Species Research 1: 41–48.
Ralph, C R, R D Reina, B P Wallace, P R Sotherland, J R Spotila, and F V Paladino. 2005.
“Effect of egg location and respiratory gas concentrations on developmental success in
nests of the leatherback turtle, Dermochelys coriacea.” Australian Journal of Zoology 53:
289-294.
Reina, R D, P A Mayor, J R Spotila, R Piedra, and F V Paladino. 2002. “Nesting Ecology of the
Leatherback Turtle, Dermochelys coriacea, at Parque Nacional Marino Las Baulas, Costa
Rica, 1988-1989 to 1999-2000.” Copeia 2002: 653–64.
Reina, R D, J R Spotila, F V Paladino, and A E Dunham. 2009. “Changed Reproductive
Schedule of Eastern Pacific Leatherback Turtles Dermochelys coriacea Following the
1997–98 El Niño to La Niña Transition.” Endangered Species Research 7: 155–61.
Reynolds, R, N Rayner, T Smith, D Stokes, and W Wang. 2002. “An improved in situ and
satellite SST analysis for climate.” Journal of Climate 15: 1609-1625.
Richardson, A J, and D S Schoeman. 2004. “Climate Impact on Plankton Ecosystems in the
Northeast Atlantic.” Science 305: 1609–12.
Robinson, N J, S E Valentine, P S Tomillo, V S Saba, J R Spotila, and F V Paladino. 2014.
“Multidecadal Trends in the Nesting Phenology of Pacific and Atlantic Leatherback
Turtles Are Associated with Population Demography.” Endangered Species Research 24:
197–206.
Root, T L, J T Price, K R Hall, and S H Schneider. 2003. “Fingerprints of Global Warming on
Wild Animals and Plants.” Nature 42: 57.
Saba, V S., P Santidrián-Tomillo, R D. Reina, J R. Spotila, J A. Musick, D A. Evans, and F V.
Paladino. 2007. “The Effect of the El Niño Southern Oscillation on the Reproductive
Frequency of Eastern Pacific Leatherback Turtles.” Journal of Applied Ecology 44: 395–
404.
Saba, V S, J R Spotila, F P Chavez, and J A Musick. 2008. “Bottom-up and Climatic Forcing on
the Worldwide Population of Leatherback Turtles.” Ecology 89: 1414–27.
96
Saba, V S., C A Stock, J R. Spotila, F V. Paladino, and P Santidrián-Tomillo. 2012. “Projected
Response of an Endangered Marine Turtle Population to Climate Change.” Nature
Climate Change 2: 814–20.
Santidrián-Tomillo, P, E Velez, R D Reina, R Piedra, F V Paladino, J R Spotila, and E Vélez.
2007. “Reassessment of the Leatherback Turtle (Dermochelys coriacea) Nesting
Population at Parque Nacional Marino Las Baulas, Costa Rica: Effects of Conservation
Efforts.” Chelonian Conservation and Biology 6: 54–62.
Santidrián Tomillo, P, V S Saba, G S Blanco, C A Stock, F V Paladino, and J R Spotila. 2012.
“Climate Driven Egg and Hatchling Mortality Threatens Survival of Eastern Pacific
Leatherback Turtles.” PloS One 7: e37602.
Schofield, G, R Scott, A Dimadi, S Fossette, K A Katselidis, D Koutsoubas, M K S Lilley, J D
Pantis, A D Karagouni, and G C. Hays. 2013. “Evidence-Based Marine Protected Area
Planning for a Highly Mobile Endangered Marine Vertebrate.” Biological Conservation
161: 101–9.
Scott, R, R Marsh, and G C Hays. 2012. “Life in the Really Slow Lane: Loggerhead Sea Turtles
Mature Late Relative to Other Reptiles.” Functional Ecology 26: 227–35.
Sea Turtle Conservancy. List of Sea Turtle Tracking Projects Participating in STC's Educational
Program, accessed September 2013. http://www.conserveturtles.org/seaturtletracking.php
Seminoff, J, and K Shanker. 2008. “Marine Turtles and IUCN Red Listing: A Review of the
Process, the Pitfalls, and Novel Assessment Approaches.” Journal of Experimental
Marine Biology and Ecology 356: 52–68.
Sherrill-Mix, S A, M C James, and R A Myers. 2008. “Migration Cues and Timing in
Leatherback Sea Turtles.” Behavioral Ecology 19: 231–36.
Shillinger, G L, D M Palacios, H Bailey, S J Bograd, A M Swithenbank, P Gaspar, B P Wallace,
et al. 2008. “Persistent Leatherback Turtle Migrations Present Opportunities for
Conservation.” PLoS Biology 6: e171.
Shillinger, G L, A M Swithenbank, H Bailey, S J Bograd, M R Castelton, B P Wallace, J R
Spotila, F V Paladino, R Piedra, and B A Block. 2011. “Vertical and Horizontal Habitat
Preferences of Post-Nesting Leatherback Turtles in the South Pacific Ocean.” Marine
Ecology Progress Series 422: 275–89.
97
Shillinger, G L, E Di Lorenzo, H Luo, S J Bograd, E L Hazen, H Bailey, and J R Spotila. 2012.
“On the Dispersal of Leatherback Turtle Hatchlings from Mesoamerican Nesting
Beaches.” Proceedings. Biological Sciences B The Royal Society 279: 2391–95.
Solow, A R, K A Bjorndal, and A B Bolten. 2002. “Annual Variation in Nesting Numbers of
Marine Turtles: The Effect of Sea Surface Temperature on Re-Migration Intervals.”
Ecology Letters 5: 742–46.–60.
Spotila, J R, A E Dunham, and A J Leslie. 1996. “Worldwide Population Decline of
Dermochelys coriacea: Are Leatherback Turtles Going Extinct?” Chelonian
Conservation and Biology 2: 209–22.
Spotila, J R, R Reina, A Steyermark, P. Plotkin, and F V Paladino. 2000. “Pacific leatherback
turtles face extinction”. Nature 405: 529–530.
Spotila, J R. 2004. Sea Turtles: A Complete Guide to their Biology, Behavior and Conservation,
The Johns Hopkins University Press, Baltimore, Maryland.
Steyermark, A C, K Williams, J R Spotila, F V Paladino, D C Rostal, S J Morreale, M T Koberg,
and R Arauz. 1996. “Nesting Leatherback Turtles at Las Baulas National Park, Costa
Rica.” Chelonian Conservation and Biology 2: 173–83.
Suryan, R M, V S Saba, B P Wallace, S A Hatch, M Frederiksen, and S Wanless. 2009.
“Environmental Forcing on Life History Strategies: Evidence for Multi-Trophic Level
Responses at Ocean Basin Scales.” Progress In Oceanography 81: 214–22.
Troëng, S, D Chacon, and B Dick. 2004. “Possible Decline in Leatherback Turtle Dermochelys
coriacea Nesting along the Coast of Caribbean Central America.” Oryx 38: 395–403.
Troëng, S, and E Rankin. 2004. “Long-Term Conservation Efforts Contribute to Positive Green
Turtle Chelonia mydas Nesting Trend at Tortuguero, Costa Rica.” Biological
Conservation 121: 111–16.
Troëng, S, and M Chaloupka. 2007. “Variation in Adult Annual Survival Probability and
Remigration Intervals of Sea Turtles.” Marine Biology 151: 1721–30.
Troëng, S, E Harrison, D Evans, A De Haro, E Vargas, and S Troëng. 2007. “Leatherback Turtle
Nesting Trends and Threats at Tortuguero, Costa Rica.” Chelonian Conservation and
Biology 6: 117–22.
98
Wallace, B P, S S Kilham, F V Paladino, and J R Spotila. 2006. “Energy Budget Calculations
Indicate Resource Limitation in Eastern Pacific Leatherback Turtles.” Marine Ecology
Progress Series 318: 263–70.
Wallace, B P, and T T Jones. 2008. “What Makes Marine Turtles Go: A Review of Metabolic
Rates and Their Consequences.” Journal of Experimental Marine Biology and Ecology
356: 8–24.
Wallace, B P, and V S Saba. 2009. “Environmental and Anthropogenic Impacts on Intra-Specific
Variation in Leatherback Turtles: Opportunities for Targeted Research and
Conservation.” Endangered Species Research 7: 11–21.
Weishampel, J F, D A Bagley, and L M Ehrhart. 2004. “Earlier Nesting by Loggerhead Sea
Turtles Following Sea Surface Warming.” Global Change Biology 10: 1424–27.
Weishampel, J F, D A Bagley, L M Ehrhart, and A C Weishampel. 2010. “Nesting Phenologies
of Two Sympatric Sea Turtle Species Related to Sea Surface Temperatures.” Endangered
Species Research 12: 41–47.
Witt, M J, L A Hawkes, M H Godfrey, B J Godley, and A C Broderick. 2010. “Predicting the
Impacts of Climate Change on a Globally Distributed Species: The Case of the
Loggerhead Turtle.” Journal of Experimental Biology 213: 901–11.
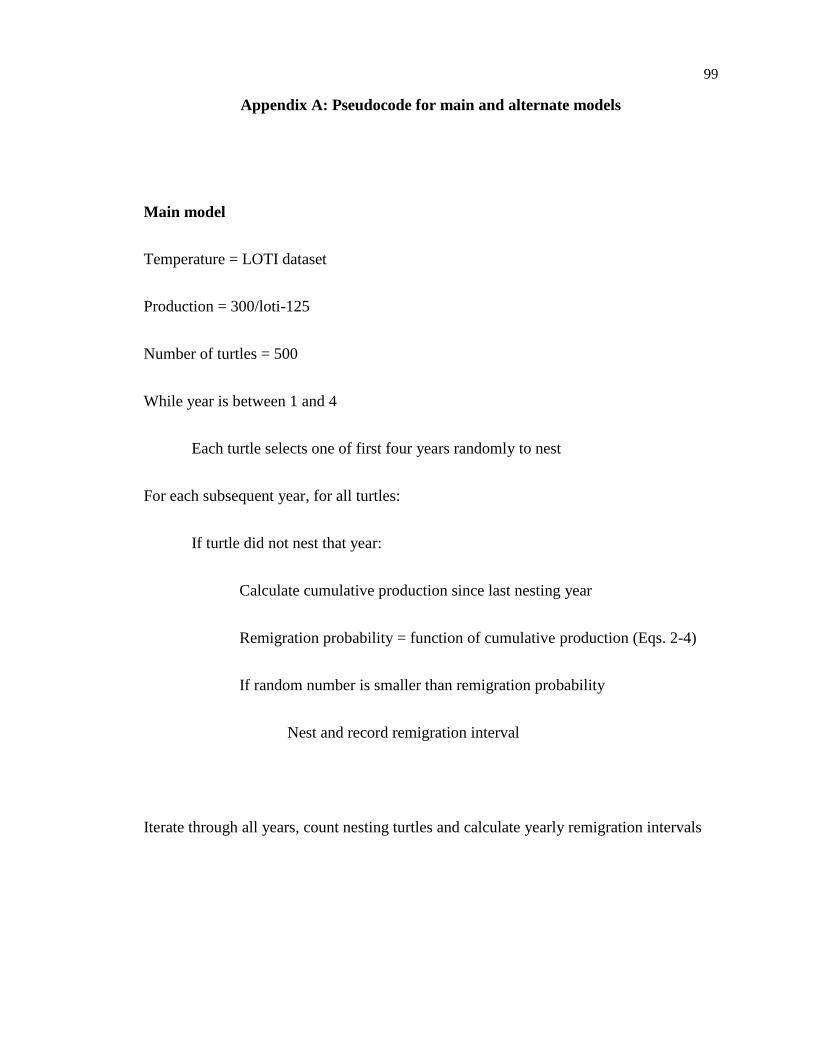
99
Appendix A: Pseudocode for main and alternate models
Main model
Temperature = LOTI dataset
Production = 300/loti-125
Number of turtles = 500
While year is between 1 and 4
Each turtle selects one of first four years randomly to nest
For each subsequent year, for all turtles:
If turtle did not nest that year:
Calculate cumulative production since last nesting year
Remigration probability = function of cumulative production (Eqs. 2-4)
If random number is smaller than remigration probability
Nest and record remigration interval
Iterate through all years, count nesting turtles and calculate yearly remigration intervals

100
Alternate model
Temperature = LOTI dataset
Production = 300/loti-125
Number of turtles = 500
Set resource threshold for each turtle
While year is between 1 and 4
Each turtle selects one of first four years randomly to nest
For each subsequent year, for all turtles:
If turtle did not nest that year:
Calculate cumulative production (available yearly production * yearly
resource accumulation rate) since last nesting year
If cumulative production is greater than threshold
Nest and record remigration interval
Iterate through all years, count nesting turtles and calculate yearly remigration intervals
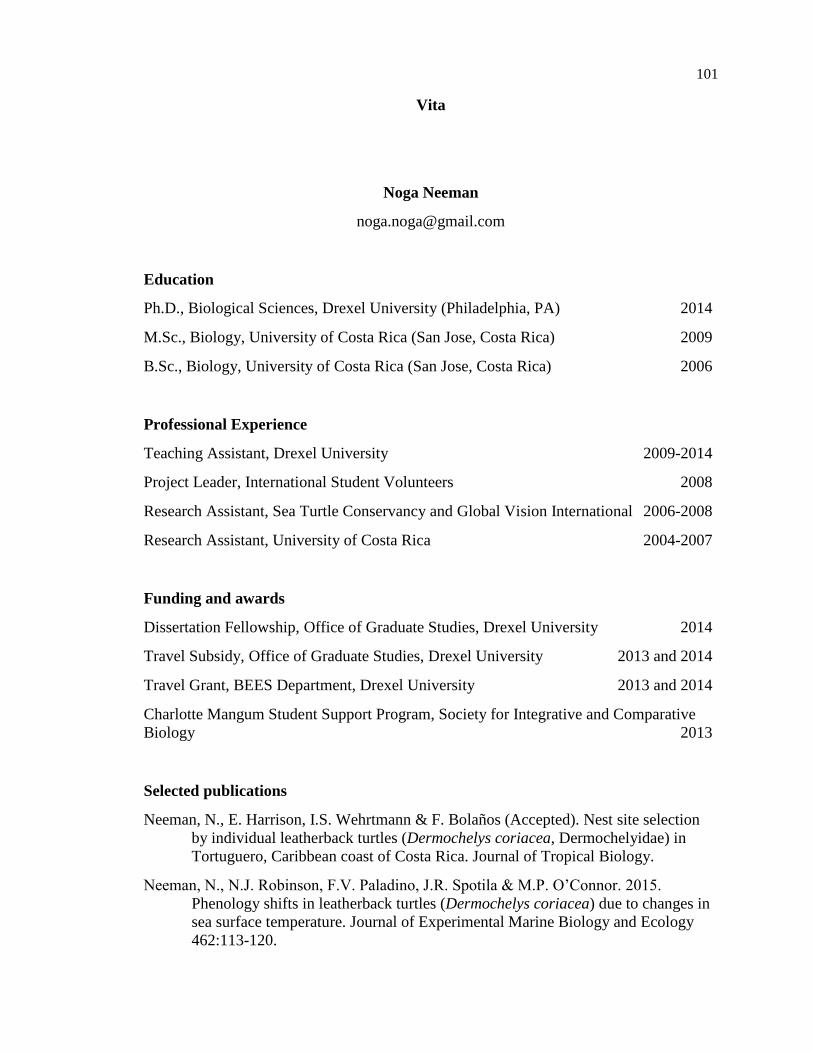
101
Vita
Noga Neeman
Education
Ph.D., Biological Sciences, Drexel University (Philadelphia, PA) 2014
M.Sc., Biology, University of Costa Rica (San Jose, Costa Rica) 2009
B.Sc., Biology, University of Costa Rica (San Jose, Costa Rica) 2006
Professional Experience
Teaching Assistant, Drexel University 2009-2014
Project Leader, International Student Volunteers 2008
Research Assistant, Sea Turtle Conservancy and Global Vision International 2006-2008
Research Assistant, University of Costa Rica 2004-2007
Funding and awards
Dissertation Fellowship, Office of Graduate Studies, Drexel University 2014
Travel Subsidy, Office of Graduate Studies, Drexel University 2013 and 2014
Travel Grant, BEES Department, Drexel University 2013 and 2014
Charlotte Mangum Student Support Program, Society for Integrative and Comparative
Biology 2013
Selected publications
Neeman, N., E. Harrison, I.S. Wehrtmann & F. Bolaños (Accepted). Nest site selection
by individual leatherback turtles (Dermochelys coriacea, Dermochelyidae) in
Tortuguero, Caribbean coast of Costa Rica. Journal of Tropical Biology.
Neeman, N., N.J. Robinson, F.V. Paladino, J.R. Spotila & M.P. O’Connor. 2015.
Phenology shifts in leatherback turtles (Dermochelys coriacea) due to changes in
sea surface temperature. Journal of Experimental Marine Biology and Ecology
462:113-120.