Mechanistic modeling of cyclic voltammetry: A …...Mechanistic modeling of cyclic voltammetry: a...
20
General rights Copyright and moral rights for the publications made accessible in the public portal are retained by the authors and/or other copyright owners and it is a condition of accessing publications that users recognise and abide by the legal requirements associated with these rights. Users may download and print one copy of any publication from the public portal for the purpose of private study or research. You may not further distribute the material or use it for any profit-making activity or commercial gain You may freely distribute the URL identifying the publication in the public portal If you believe that this document breaches copyright please contact us providing details, and we will remove access to the work immediately and investigate your claim. Downloaded from orbit.dtu.dk on: May 30, 2020 Mechanistic modeling of cyclic voltammetry: A helpful tool for understanding biosensor principles and supporting design optimization Semenova, Daria; Zubov, Alexandr; Silina, Yuliya E.; Micheli, Laura; Koch, Marcus; Fernandes, Ana C.; Gernaey, Krist V. Published in: Sensors and Actuators B: Chemical Link to article, DOI: 10.1016/j.snb.2017.12.088 Publication date: 2018 Document Version Peer reviewed version Link back to DTU Orbit Citation (APA): Semenova, D., Zubov, A., Silina, Y. E., Micheli, L., Koch, M., Fernandes, A. C., & Gernaey, K. V. (2018). Mechanistic modeling of cyclic voltammetry: A helpful tool for understanding biosensor principles and supporting design optimization. Sensors and Actuators B: Chemical, 259, 945–955. https://doi.org/10.1016/j.snb.2017.12.088
Transcript of Mechanistic modeling of cyclic voltammetry: A …...Mechanistic modeling of cyclic voltammetry: a...

General rights Copyright and moral rights for the publications made accessible in the public portal are retained by the authors and/or other copyright owners and it is a condition of accessing publications that users recognise and abide by the legal requirements associated with these rights.
Users may download and print one copy of any publication from the public portal for the purpose of private study or research.
You may not further distribute the material or use it for any profit-making activity or commercial gain
You may freely distribute the URL identifying the publication in the public portal If you believe that this document breaches copyright please contact us providing details, and we will remove access to the work immediately and investigate your claim.
Downloaded from orbit.dtu.dk on: May 30, 2020
Mechanistic modeling of cyclic voltammetry: A helpful tool for understandingbiosensor principles and supporting design optimization
Semenova, Daria; Zubov, Alexandr; Silina, Yuliya E.; Micheli, Laura; Koch, Marcus; Fernandes, Ana C.;Gernaey, Krist V.
Published in:Sensors and Actuators B: Chemical
Link to article, DOI:10.1016/j.snb.2017.12.088
Publication date:2018
Document VersionPeer reviewed version
Link back to DTU Orbit
Citation (APA):Semenova, D., Zubov, A., Silina, Y. E., Micheli, L., Koch, M., Fernandes, A. C., & Gernaey, K. V. (2018).Mechanistic modeling of cyclic voltammetry: A helpful tool for understanding biosensor principles and supportingdesign optimization. Sensors and Actuators B: Chemical, 259, 945–955.https://doi.org/10.1016/j.snb.2017.12.088

Accepted Manuscript
Title: Mechanistic modeling of cyclic voltammetry: A helpfultool for understanding biosensor principles and supportingdesign optimization
Authors: Daria Semenova, Alexandr Zubov, Yuliya E. Silina,Laura Micheli, Marcus Koch, Ana C. Fernandes, Krist V.Gernaey
PII: S0925-4005(17)32414-0DOI: https://doi.org/10.1016/j.snb.2017.12.088Reference: SNB 23776
To appear in: Sensors and Actuators B
Received date: 14-11-2017Revised date: 12-12-2017Accepted date: 14-12-2017
Please cite this article as: Daria Semenova, Alexandr Zubov, Yuliya E.Silina,Laura Micheli, Marcus Koch, Ana C.Fernandes, Krist V.Gernaey, Mechanisticmodeling of cyclic voltammetry: A helpful tool for understanding biosensorprinciples and supporting design optimization, Sensors and Actuators B:Chemical https://doi.org/10.1016/j.snb.2017.12.088
This is a PDF file of an unedited manuscript that has been accepted for publication.As a service to our customers we are providing this early version of the manuscript.The manuscript will undergo copyediting, typesetting, and review of the resulting proofbefore it is published in its final form. Please note that during the production processerrors may be discovered which could affect the content, and all legal disclaimers thatapply to the journal pertain.
Mechanistic modeling of cyclic voltammetry: a helpful tool for
understanding biosensor principles and supporting design optimization
Authors
Daria Semenovaa,*, Alexandr Zubova, Yuliya E. Silinab, Laura Michelic, Marcus Kochb, Ana C. Fernandesa, Krist V. Gernaeya
a Process and Systems Engineering Center (PROSYS), Department of Chemical and Biochemical Engineering, Technical University of
Denmark, Søltofts Plads, Building 229, 2800 Kgs. Lyngby, Denmark b INM – Leibniz Institute for New Materials, Campus D2 2, 66123 Saarbrücken, Germany
c Department of Chemical Science and Technologies, Università di Roma Tor Vergata, Via della Ricerca Scientifica 1, 00133 Rome, Italy
*Corresponding author.
E-mail address: [email protected] (D. Semenova).
Highlights
The physicochemical parameters required for mathematical modeling were
either found in literature or estimated on the basis of experimental data. Thus,
the applicability of the developed model is not limited by the dataset or
biosensor design.
The developed cyclic voltammetry simulator was applied for interpreting the
experimental results at various mediator concentrations, membrane
thickness/compositions and operating conditions of the proposed multi-layer
biosensor system.
An accurate electrochemical, morphological and microscopic characterization
of the biosensor system coupled with the model predictions allowed to identify
the parameters crucial for the stable biosensor response.
Based on the model predictions, a more favourable design of the biosensor
system was developed, which subsequently reduced the reagent usage and
waste generation.
Abstract
Design, optimization and integration of biosensors hold a great potential for the development of cost-effective screening and point-of-
care technologies. However, significant progress in this field can still be obtained on condition that sufficiently accurate mathematical
models will be developed. Herein, we present a novel approach for the improvement of mechanistic models which do not only combine
the fundamental principles but readily incorporate the results of electrochemical and morphological studies. The first generation glucose
biosensors were chosen as a case study for model development and to perform cyclic voltammetry (CV) measurements. As initial step in
the model development we proposed the interpretation of experimental voltammograms obtained in the absence of substrate (glucose).
The model equations describe dynamic diffusion and reaction of the involved species (oxygen, oxidized/reduced forms of the mediator –
Prussian Blue/Prussian White). Furthermore, the developed model was applied under various operating conditions as a crucial tool for
biosensor design optimization. The obtained qualitative and quantitative dependencies towards amperometric biosensors design
ACCEPTED MANUSCRIP
T

optimization were independently supported by results of cyclic voltammetry and multi-analytical studies, such as scanning electron
microscopy (SEM), energy dispersive X-ray spectroscopy (EDX) and liquid chromatography-electrospray ionization-tandem mass
spectrometry (LC-ESI-MS/MS). Remarkably, a linear response of the optimized biosensors tested at the applied voltage (-0.14 V) in the
presence of the glucose was obtained from 10-3 to 10-5 M (relative standard deviation (RSD) < 7% per electrode). We believe that the
presented model can be used to determine the exact mechanism driving the electrochemical reactions and to identify critical system
parameters affecting the biosensor response that would significantly contribute to the knowledge on biosensing, device´s design and
bioengineering strategies in the future.
Keywords
Mechanistic Modeling, Cyclic Voltammograms, Amperometric Biosensors, Glucose Biosensors, SEM/EDX, LC-ESI-MS/MS.
1. Introduction
The development of a crucial tool for an accurate and reliable diagnostics and continuous monitoring of glucose concentrations, mainly
for diabetes patients, resulted in more than 50 years of research and the establishment of the amperometric glucose sensors in clinical
diagnostics [1,2]. Being compact, relatively stable and cheap, biosensors nowadays found their application in medicine [3,4],
pharmacology [5], microbiology [6], the food industry [7], defense technologies [8] and others. Moreover, glucose biosensors hold a
great potential for glucose monitoring in fermentation processes [9,10] addressing the needs within biotechnological strain
development. However, the reliability of the biosensor response in the continuous monitoring is still a limiting factor for their further
integration in biotechnology.
Common detection techniques applied to biosensors, such as electrochemical impedance spectroscopy (EIS),
chronoamperometry (AM) and cyclic voltammetry (CV), allow getting more detailed insights into the principles of sensing
mechanisms [11]. In order to get a better understanding of the nature of the electrode reactions and to improve the biosensor
performance, mathematical models were applied to electrochemical biosensors [12]. The first model for the amperometric response of
an enzyme electrode for the glucose - glucose oxidase system was presented by Mell and Maloy [13] in the seventies, after Guilbault and
Lubrano [14] constructed an amperometric glucose sensitive electrode. The first theoretical treatment of the cyclic voltammograms was
presented by Nicholson and Shain [15]. In their work, the reversible and irreversible charge transfer mechanisms were coupled with
homogenous first order chemical or electrochemical reactions. Moreover, the analytical solution was also presented for the
electrochemical reaction followed by the mediated enzyme reaction. A commercially available simulation program for cyclic
voltammetry, DigiSim (Bioanalytical Systems, West Lafayette, IN), developed by Feldberg and Rudolph [16] describes the electrochemical
reactions coupled with first- and/or second-order chemical reactions. However, the mechanism of the enzymatic reactions is very
complex and the assumption that the kinetics obey a first-order reaction can only be applied in very rare cases. Yokoyama and
Kayanuma [17] developed a cyclic voltammetry simulator for electrochemically mediated enzyme reactions for various mediator and
substrate concentrations, therefore not being limited by first- or pseudo-first-order reaction kinetics. The presented model allowed
determining the kinetic constants for the homogeneous reaction between glucose oxidase (GOx) and glucose in the presence of
ferrocene derivatives. Later on, the model principles were applied for modeling the reversible electrochemical reaction with one electron
followed by the mediated reaction of immobilized enzyme with two electrons [18]. The simulation of cyclic voltammetry was also applied
for studying the influence of ohmic drop [19,20], electrode area, electrochemical reaction constants and transferring coefficients [21], as
well as the effect of flow rates [22–24] on the current response and wave shape. Analyzing the curve shape, peak shifts and amplitudes
between the first cycle and successive scans in the obtained cyclic voltammograms is an important key in providing useful information
on the mechanism of the electrochemical reaction as well as the adsorption mechanism and the diffusivities of the electrochemical
species [25]. All these experimental data make CV a powerful analytical tool to identify the correlations between the sensor morphology
and system parameters, underlying the desired biosensor response. However, only the works of Cannes et al. [26,27] demonstrated how
the analytical techniques, such as CV measurements and scanning electrochemical microscopy (SECM), can be combined with simple
numerical simulations for quantitative estimation of biosensor system parameters.
The general idea underlying this study is the development of a novel mathematical tool for amperometric biosensor
operation and design optimization. To achieve this goal, we have used, as a first step, the combination of a mechanistic model for cyclic
voltammograms with experimental multi - analytical studies. As a case study, the biosensor design with enhanced stability was adopted
from the works of Ricci et al. [28,29]. The surface of the working electrode (WE) of commercially available screen-printed electrodes was
chemically modified with a hydrogen peroxide sensitive catalyst, Prussian Blue [30], and covered with an enzyme/membrane layer (see
Figure S1, Supplementary Materials). The experimental voltammograms were compared with simulation results, which allowed to use the
formulated model not only for studying the processes occurring inside the biosensor system, but also to identify the critical system
parameters. The results of the model predictions were fully supported by subsequent electrochemical (CV), bioanalytical (LC-ESI-MS/MS,
EDX) and morphological (SEM) studies.
ACCEPTED MANUSCRIP
T

2. Mathematical Modeling
2.1. Computational Domain and Governing Equations
The main objective of the model was to predict cyclic voltammetry curves for the reversible electrochemical reaction coupled with
oxidation/reduction of the catalyst in the absence of substrate (glucose) for an air saturated phosphate buffer solution, at different
operating conditions. The biosensor was modeled spatially as a one-dimensional system. Non-linear second order partial differential
equations combine the dynamic diffusion and reaction of the involved chemical species in the enzymatic/membrane layer, as well as
electrochemical reaction on the surface of the electrode. Different regions of the multi-layer glucose biosensor system (electrode
surface, enzyme/membrane layer and stagnant diffusion layer) were associated with diffusion fluxes, chemical and electrochemical
reactions (see Figure S2, Supplementary Materials). It was assumed that the oxidized form (Mox) of artificial peroxidase - Prussian Blue
(PB), was deposited on the surface of the working electrode, whereas the reduced form (Mred) - Prussian White (PW), was produced
during the reversible two - electron transfer reaction [31] (note that the PB/PW abbreviation is simplified to Mox/Mred since historically
Prussian Blue was called a “mediator” in the literature):
The complete reduction of molecular oxygen in the presence of Prussian White was described as a four - electron transfer reaction
taking place inside of the enzyme/membrane layer [32]:
The kinetics of the electrochemical reactions were assumed to be fully reversible, whereas the oxygen reduction
followed a second order kinetics. Considering one-dimensional diffusion, the governing equations for oxygen (1), (4), oxidized (2) and
reduced (3) forms of the mediator were formulated as follows:
Enzyme/membrane layer, t > 0, and 0 < x < de:
𝜕[𝑂2]
𝜕𝑡= 𝐷𝑂2,𝑒
𝜕2[𝑂2]
𝜕𝑥2− 𝑟([𝑂2], [𝑀𝑟𝑒𝑑]) (1)
𝜕[𝑀𝑜𝑥]
𝜕𝑡= 𝐷𝑀𝑜𝑥,𝑒
𝜕2[𝑀𝑜𝑥]
𝜕𝑥2+ 𝑟([𝑂2], [𝑀𝑟𝑒𝑑]) (2)
𝜕[𝑀𝑟𝑒𝑑]
𝜕𝑡= 𝐷𝑀𝑟𝑒𝑑,𝑒
𝜕2[𝑀𝑟𝑒𝑑]
𝜕𝑥2− 𝑟([𝑂2], [𝑀𝑟𝑒𝑑]) (3)
Diffusion layer, t > 0, and de < x < de + dd:
𝜕[𝑂2]
𝜕𝑡= 𝐷𝑂2,𝑑
𝜕2[𝑂2]
𝜕𝑥2 (4)
where 𝐷𝑂2,𝑒 and 𝐷𝑂2,𝑑
are diffusion coefficients for the oxygen inside the enzyme/membrane and diffusion layers, respectively. Inside the
enzyme/membrane layer, 𝐷𝑀𝑟𝑒𝑑,𝑒and 𝐷𝑀𝑜𝑥,𝑒
refer to the diffusion coefficients of the reduced and oxidized form of the mediator,
respectively. The thickness of the enzyme/membrane layer was set as 𝑑𝑒, whereas for the diffusion layer it was 𝑑𝑑 . The mediator layer
thickness was neglected in the model, assuming that PB crystals are adsorbed inside the cavities of the graphene oxide layer surface (see
Figure S3, Supplementary Materials). The rate (𝑟) of the homogeneous reaction (5) between the reduced form of the mediator and
oxygen is provided in the equation below:
𝑟([𝑂2], [𝑀𝑟𝑒𝑑]) = 𝑘1 ∙ [𝑂2] ∙ [𝑀𝑟𝑒𝑑] (5)
where 𝑘1 is a kinetic constant for the complete PW oxidation in the presence of oxygen for air saturated solutions [32].
2.2. Init ial and Boundary Condit ions
The zero mediator concentration inside the enzyme/membrane layer (6), as well as the oxygen absence (7) inside the diffusion and
enzyme/membrane layers, were set as the initial conditions of the model following the equations below:
𝑡 = 0, and 0 < 𝑥 < 𝑑𝑒 [𝑀𝑜𝑥] = [𝑀𝑟𝑒𝑑] = 0 (6)
ACCEPTED MANUSCRIP
T

𝑡 = 0, and 0 < 𝑥 < 𝑑𝑒 + 𝑑𝑑 [𝑂2] = 0 (7)
The boundary conditions for oxygen dissolved in the bulk solution (8), the continuity of oxygen diffusion fluxes at the
interface between the enzyme/membrane and diffusion layer (9) and the zero oxygen flux at the electrode surface (10) were set in the
model as follows:
𝑡 > 0, and 𝑥 = 𝑑𝑒 + 𝑑𝑑 [𝑂2] = [𝑂2, 𝑏𝑢𝑙𝑘] (8)
𝑡 > 0, and 𝑥 = 𝑑𝑒 𝐷𝑂2,𝑒
𝜕[𝑂2]
𝜕𝑥= 𝐷𝑂2,𝑑
𝜕[𝑂2]
𝜕𝑥 (9)
𝑡 > 0, and 𝑥 = 0 𝐷𝑂2,𝑒
𝜕[𝑂2]
𝜕𝑥= 0
(10)
The zero mediator concentration at the boundary of the enzyme/membrane layer (11) and the concentration ratio
between oxidized and reduced forms of the mediator controlled by the Nernst equation at the electrode surface (12) were given by:
𝑡 > 0, and 𝑥 = 𝑑𝑒 [𝑀𝑜𝑥] = [𝑀𝑟𝑒𝑑] = 0 (11)
𝑡 > 0, and 𝑥 = 0 [𝑀𝑜𝑥]
[𝑀𝑟𝑒𝑑]= exp {
𝑛𝑒 ∙ 𝐹
𝑅 ∙ 𝑇∙ (𝐸 − 𝐸0)} (12)
where 𝑛𝑒 is a number of electrons involved in a charge transfer, 𝐹 is the Faraday constant, 𝑅 represents the universal gas constant, 𝑇 is
temperature, 𝐸 is the applied potential vs. the reference electrode and 𝐸0 is the standard potential. The biosensor response (13),
measured as the current as a function of time, 𝑖 (𝑡), was governed by:
𝑖(𝑡) = 𝑛𝑒 ∙ 𝐴 ∙ 𝐹 ∙ 𝐷𝑀𝑟𝑒𝑑,𝑒
∙ 𝜕 [𝑀𝑟𝑒𝑑]
𝜕𝑥 (13)
where 𝐴 is the surface area of the working electrode.
2.3. Model Implementation
The governing model equations were discretized by the finite difference method (FDM) and numerically solved using an explicit Euler
scheme. The proposed model for cyclic voltammetry responses was implemented in both MATLAB® and FORTRAN languages. Following
the IUPAC recommendation, the arising positive current in the voltammogram corresponds to the oxidation process (anodic current),
whereas the negative current represents the reduction process (cathodic current).
The major part of the physicochemical parameters required for the mathematical model was found in the literature (Table 1). The
mediator concentration and standard redox potential values had to be adjusted based on the difference between the fabrication
procedures of biosensor systems (values are also presented in Table 1). The thickness of the enzyme/membrane layer was estimated
from SEM analysis presented in section 4.3. The thickness of the diffusion layer was set as 1 µm in all simulations.
Table 1 – Values of the biosensor system parameters used in simulations
Parameter Description Model value Reference
𝐷𝑂2,𝑒 [m2/s]
Diffusivity of oxygen in polymeric
membrane 5.0 × 10⁻¹² [33]
𝐷𝑀𝑜𝑥,𝑒 [m2/s]
Diffusivity of oxidized form of
mediator in polymeric membrane 10.0 × 10⁻¹⁴
[34,35]
𝐷𝑀𝑟𝑒𝑑,𝑒 [m2/s]
Diffusivity of reduced form of
mediator in polymeric membrane 7.0 × 10⁻¹³
𝐷𝑂2,𝑑 [m2/s] Diffusivity of oxygen in diffusion layer 2.0 × 10−09 [33]
𝑘1 [M-1
s-1] Kinetic constant for the oxygen
reduction by PB 0.107 [32]
𝑛𝑒 Electrons involved in the PB redox
reaction 2 [36,37]
𝑂2 [mol/m3] Oxygen concentration dissolved in 0.271563 [38]
ACCEPTED MANUSCRIP
T

water
𝑀𝑜𝑥 [mol/m3] Prussian Blue concentration deposited
over WE 5/20/100 experiment
𝐸0 [V] Standard Potential
PW/PB redox couple 0.13/-0.05 CV experiment
𝑑𝑒 [m] Thickness of the enzyme/membrane
layer 7.0 × 10−06 SEM experiment
𝑑𝑑 [m] Thickness of the diffusion layer 1.0 × 10−06 estimation
𝐴 [m2] Surface area of the working electrode 1.257 × 10−05 experiment
𝑇 [K] Temperature 298.15 experiment
3. Experimental Section
3.1. Materia ls and reagents
Screen printed electrodes (SPEs) DRP-PW-110DGPHOX were customized by DropSens (Llanera, Spain). The electrodes were printed on
polyester substrate and each sensor consists of a carbon working electrode modified with graphene oxide, a carbon counter electrode
and a silver reference electrode. The diameter of the working electrode was 0.4 cm, resulting in an apparent geometric area of 0.126 cm2.
Glucose oxidase (GOx) (EC 1.1.3.4, type VII, 248 U/g solid) and bovine serum albumin (BSA) were obtained from Sigma (St. Louis, MO,
USA). Glutaraldehyde solution (25% (v/v)), ethanol (UV HPLC gradient, 99.9%) and potassium hexacyanoferrate (III) (ACS reagent,
≥99.0%) were purchased from Sigma – Aldrich (St. Louis, MO, USA). Iron (III) chloride (anhydrous, 99.99%) and Nafion®117 solution
(~5% (v/v) in a mixture of lower aliphatic alcohols and water) were provided by Aldrich (Steinheim, Germany). D-Glucose (anhydrous)
was provided by Fluka (Loughborough, UK). Mono – and di-potassium hydrogen phosphates (anhydrous) were obtained from Merck
(Darmstadt, Germany). Sodium hydroxide (50% (w/w)) and hydrochloric acid (37% (w/w)) solutions were purchased from VWR
International A/S (Søborg, Denmark). All the solutions were prepared with 0.1 M phosphate buffer supplemented with 0.1 M KCl
(pH = 6), unless stated otherwise.
3.2. Glucose biosensor preparation
Preparation method 1:
The chemical deposition procedure of PB was adopted from works of Ricci et al. [29]. A 10 µL drop (total volume) of freshly made
precursor solution, containing 0.1 M potassium ferrocyanide (K3Fe(CN)6) in 10 mM HCl mixed with 0.1 M ferric chloride (FeCl3) solution in
10 mM HCl (1:1 proportion (v/v)), was directly placed over the working electrode (WE) surface of the SPEs. The sensors were left to dry
for 15 (sensor 1) or 40 (sensor 2) minutes at room temperature and then washed with a 10 mM HCl solution and deionized water. In
order to stabilize the PB layer, the sensors were placed in the oven at 100°C for 2 h. Prior to glucose oxidase (GOx) immobilization, a
2.5 µL droplet of freshly prepared glutaraldehyde solution (1% (v/v) diluted in water) was placed over the WE of the PB modified SPEs
and was left to dry at room temperature for 30 min. After the glutaraldehyde solution layer was dried, the enzyme/membrane layer was
deposited. The fresh enzyme/membrane solution was made by mixing GOx solution (53.7 U in phosphate buffer), BSA (5 vol. % diluted in
water) and Nafion®117 (0.2 vol. % diluted in water) in a 1:1:1 proportion (v/v/v). A drop of 3 µL of the final solution was placed over the
working electrode of the PB/glutaraldehyde modified SPEs.
Preparation method 2:
In order to remove the impurities, the surfaces of all electrodes were pre-treated in a phosphate buffer solution under
chronoamperometric conditions with applied potential of +1.7 V. The chronoamperometric measurement was performed using
MultiEmStat (PalmSens, Utrecht, The Netherlands) with a DRP-CAST1X8 interface (DropSens, Llanera, Spain) controlled by
MultiTrace 3.4 software (PalmSens, Utrecht, The Netherlands). After the stable current curve was obtained, the surface of the working
electrode was modified with a Prussian Blue (PB) layer. The PB chemical deposition procedure presented in preparation method 1 was
modified. Thus, a 5 µL drop of 0.1 M solution of potassium ferrocyanide K3Fe(CN)6 in 10 mM HCl was placed over the working electrode
and mixed with a 5 µL drop of 0.1 M solution of ferric chloride, FeCl3 in 10 mM HCl directly on the surface of the electrode. The sensors
were left to dry for 40 min at room temperature and then washed with a 10 mM HCl solution, deionized water and dried with air. In
order to stabilize the PB layer, the sensors were placed in the oven at 100°C for 1 h. Similar to preparation method 1, the surface of WE
for PB modified SPEs was pretreated with glutaraldehyde solution prior to enzyme/membrane layer deposition. In contrast to
preparation method 1, Nafion®117 (2 vol. %) neutralized in ethanol [39] was mixed with GOx solution (53.7 U in phosphate buffer) and
BSA (5 vol. % diluted in water) in a 1:1:1 proportion (v/v/v). A drop of 3 µL of final solution was placed over the working electrode of the
PB/glutaraldehyde modified SPEs, yielding sensor 3 batch.
Regardless of the preparation method, sensors with deposited enzyme/membrane layer were placed to dry overnight in a climate
chamber at 40% of humidity and 8°C. Moreover, both PB modified SPEs and complete glucose biosensors were stored in the dark, at
room temperature and 4°C, respectively.
3.3. Glucose Oxidase activ ity measurement
ACCEPTED MANUSCRIP
T

The GOx activity measurement prior to the immobilization step of the stock solutions, as well as the enzyme/membrane mixtures, was
performed by using an OXSOLV solvent-resistant, fiber - optic oxygen sensor (Pyro Science GmbH, Aachen, Germany) connected to a
FireStingO2 fiber - optic meter (Pyro Science GmbH, Aachen, Germany) and controlled by Pyro Oxygen Logger software (Pyro Science
GmbH, Aachen, Germany). The measurement was based on on-line monitoring of the dissolved oxygen (DO) consumption in the
reaction of GOx with 100 mM glucose solution at room temperature (see Figure S4, Supplementary Materials). The set – up assembly, as
well as the experimental procedure, were adopted from the works of Bolivar et al. [40,41]. A glass beaker with a liquid working volume of
10 mL and a magnetic stirrer (10 × 5 mm) were used for the experiments. The magnetic stirring was performed at 600 rpm (IKA® RET
Basic, Staufen im Breisgau, Germany). The 100 µL of glucose solution was dissolved in 7 mL of buffer solution. The oxidation reaction was
initialized by addition of different volumes of the GOx stock solution or the enzyme/membrane mixtures after the value of DO was
stabilized. For the enzyme activity calculations, one unit (U) of enzyme corresponds to a substrate consumption of 1 µmol per min. The
GOx activity in the enzyme/membrane mixture prior to immobilization was estimated as 0.179 U/µL.
3.4. Cycl ic voltammetry behavior of glucose biosensors in p hosphate buffer
Cyclic voltammetry (CV) measurements were performed using MultiEmStat (PalmSens, Utrecht, The Netherlands) with a DRP-CAST1X8
interface (DropSens, Llanera, Spain) controlled by MultiTrace 3.4 software (PalmSens, Utrecht, The Netherlands). A 100 µL droplet of
phosphate buffer was placed over all three electrodes of SPE. The voltammograms were recorded at different scan rates in a potential
range from -0.5 V to +0.5 V. After each run sample droplets were collected for subsequent LC-ESI–MS/MS analysis.
3.5. Biosensor sensit ivity determination
In order to estimate the sensitivity of the developed biosensors, chronoamperometric studies were carried out in the presence of
glucose solutions (concentration range: 10-7-10-3 M) at the applied voltage equal to the peak potential of the reduction curve (-0.14 V).
Moreover, the biosensors were characterized in the presence of the analytical range of glucose concentrations (0.1 to 2 mM). All
measurements from the same biosensor were repeated at least in triplicates.
3.6. Scanning electron microscopy (SEM) and energy dispersive X-ray spectroscopy (EDX)
Micrographs of the bare and PB/(GOx + Nafion) modified SPEs were obtained by scanning electron microscopy (SEM) using a
FEI (Hilsboro, OR, USA) Quanta 400 FEG, operating at 10 kV accelerating voltage. Secondary (SE) and backscattered (BSE) electron
images were collected in low vacuum mode (pH2O = 100 Pa). The microscope was equipped with an EDAX (Mahwah, NJ, USA)
Genesis V6.04 energy dispersive X-ray (EDX) system in order to obtain information on elemental composition of the biosensor surfaces.
The measuring time per sample was equal to 100 sec. In addition, the correlative SEM/EDX analysis allowed determining the
composition of the multi-layer biosensor.
3.7. Liquid chromatography-electrospray ionization-tandem mass spectrometry (LC-ESI-MS/MS)
In order to verify the chemical stability of the biosensor layers deposited over the surface of the working electrode, liquid
chromatography electrospray ionization tandem mass spectrometry (LC-ESI-MS/MS) was utilized. The HPLC analysis was performed on
an Agilent Infinity 1260 series instrument (Agilent Technologies, CA, USA) coupled with a quadrupole time-of-flight mass spectrometer
Q-TOF LC/MS 6545 (Agilent Technologies, CA, USA) equipped with Jet Stream Thermal Focusing Technology ESI source. The data
acquisition was controlled by MassHunter Software Tools. For LC-ESI-MS/MS experiments, a 30 µL water droplet spotted for 30 min on
the glucose biosensors, previously not used in electrochemical studies, was taken. The obtained results were compared with data
obtained in the LC-ESI-MS/MS study of buffer samples collected after each scan in CV. Chromatographic separation was achieved on the
ZORBAX Eclipse Plus C 18 column (2.1 × 50 mm, particles size 1.8 µm) (Agilent, CA, USA). The mobile phase consisting of 0.3% formic
acid in water (Solvent A) and acetonitrile (Solvent B) was used in the following gradient elution step: 90% Solvent A, was held for 2 min,
then decreased to 10% in 9 min and held for 2 min, and returned back to the starting conditions in 0.5 min for 8 min equilibration. The
column operation temperature was fixed at 30ºC, the mobile phase flow rate was 0.3 mL/min and the injection volume was 10 µL.
MS scans were performed in a negative ion mode, operating under capillary voltage at 4500 V; the fragmentor voltage was set at 70 eV;
dry gas temperature at 350°C; gas flow at 9 L/min; nebulizing gas pressure at 45 psi. The mass spectra for all samples were recorded at
m/z 100-1500. The MS/MS experiments were conducted in product ion scan mode at collision energies ranging from 10 to 50 eV. The
elemental compositions were identified based on the accurate mass measurements and data processing of total ion chromatograms
(TICs) of the parent ions and fragments obtained in the MS/MS experiments.
4. Results and Discussion
4.1. Mathematical Model Validation
The initial design of the glucose biosensor system was based on the preparation method 1. In Figure 1 a good qualitative response of
the numerical solutions is presented together with the experimental voltammograms obtained at 50 mV/sec for the two types of glucose
biosensors with different PB modification time.
ACCEPTED MANUSCRIP
T

Figure 1 - Comparison of the model output (dashed line) vs. experimental data (solid line) for two types of glucose biosensor fabricated
according to preparation method 1: sensor 1 represents the results of 15 min PB deposition time, whereas sensor 2 refers to the 40 min
procedure. The presented voltammograms were recorded/simulated for 50 mV/sec scanning speed.
In both simulations, the initial value for the deposited PB had to be adjusted for the two different types of biosensor: for sensor 1 the
concentration of the deposited oxidized form of mediator (Mox) was estimated as 5 mM, whereas for sensor 2 this parameter value was
equal to 20 mM. From Figure 1 it is clear that no significant quantitative response can be obtained for the reduction curve, especially in
case of higher mediator loadings. In order to validate the developed model, an additional set of experiments for the glucose biosensors
was proposed. The sensor 2 type was tested at a potential range from -0.5 V to +0.5 V with higher scan rates: from 100 to 500 mV/sec.
The obtained voltammograms were compared with the model output shown in Figure 2.
Figure 2 – The experimental voltammograms (solid line) vs. the model output (dashed line). Glucose biosensors were cycled at different
scan rates (100 to 500 mV/sec).
The results presented in Figure 2 clearly demonstrated a strong disagreement between the model predictions and
experimental data at high cycling speeds: no relevant peak potential shifts and peak current increase were obtained with the model.
Therefore, it was concluded that the assumed mechanisms of chemical and physical processes taking place inside the biosensor system
proposed in the model were not sufficient. However, the variation of model parameters, namely 𝒅𝒆 and 𝑴𝒐𝒙, and further comparison of
the simulation results with the experimental voltammograms allowed assuming that the irreversible changes occur inside the biosensor
system. Thus, the disagreement between the model predictions and the experimental data was mainly attributed to the constant
decrease in the thickness of the enzyme/membrane layer, as well as in the concentration of deposited mediator after each scan.
Moreover, a reversible electron transfer behaviour estimated at the lower scans was not present in the experimental voltammograms
obtained at cycling speeds higher than 50 mV/sec. Varying the values of only two parameters (𝒅𝒆, 𝑴𝒐𝒙) within the model allowed to
ACCEPTED MANUSCRIP
T
understand better the additional processes taking place inside the biosensor, and to focus on the optimization of the PB deposition and
membrane composition methods. In a subsequent part of the study the model was used to identify the crucial biosensor system
parameters that were further optimized in a new preparation method for the glucose biosensors.
4.2. Biosensor Design Optimization
In order to achieve a reproducible response and improved stability of the biosensor system layers the preparation method 2 was
proposed. In this procedure, two crucial aspects had to be fulfilled: first, to achieve a higher and stable loading of PB; and second, to
guarantee the stability of the enzyme/membrane layer under different operating conditions. Therefore, the deposition procedure of the
PB layer had to be modified together with the composition of the Nafion membrane. In order to avoid changes in the biosensor
topology, such as mechanical decomposition of the PB and the membrane layer and its subsequent leakage, that effected the switch
from reversible to irreversible electron transfer behavior of the biosensor system, the optimized biosensors from preparation method 2
(sensor 3 type) were cycled at scan rates lower than 50 mV/sec. The potential range of the PB/PW redox couple from -0.5 V to +0.5 V was
applied, as shown in Figure 3. Similar model parameters were used as for the simulations done for the preparation method 1. The value
for the concentration of the deposited PB and the standard redox potential were now fixed to 100 mM and -0.05 V, respectively.
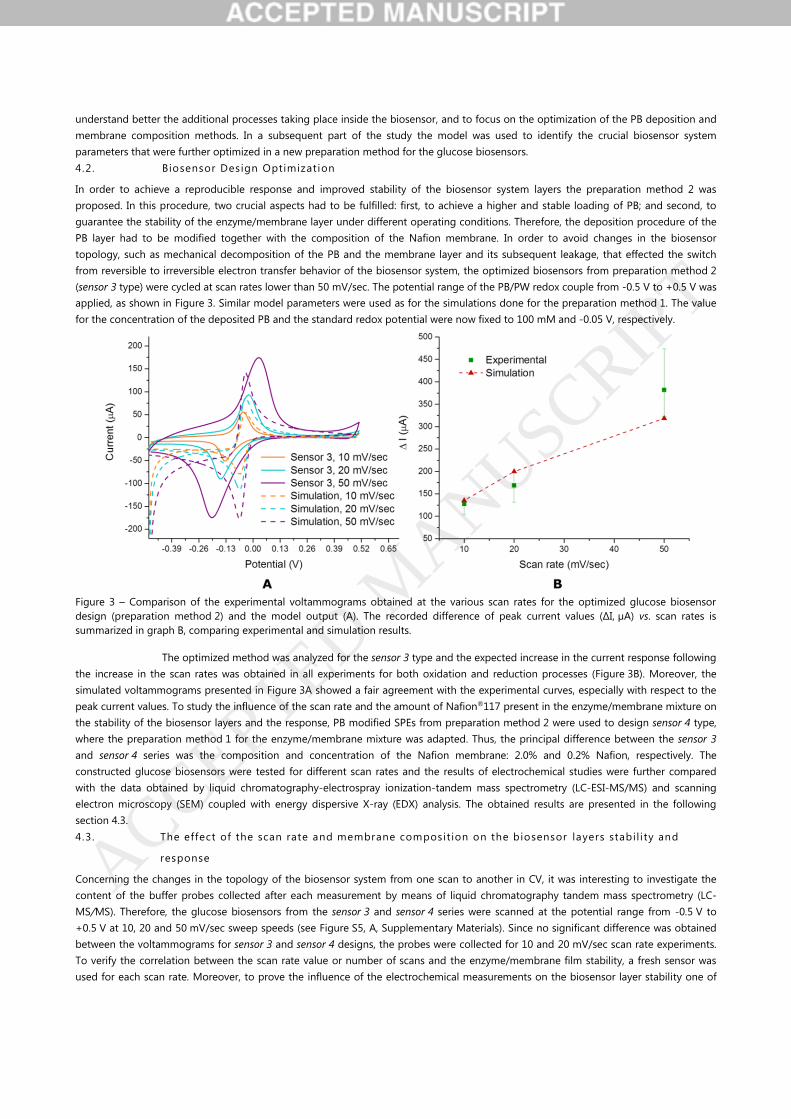
Figure 3 – Comparison of the experimental voltammograms obtained at the various scan rates for the optimized glucose biosensor
design (preparation method 2) and the model output (A). The recorded difference of peak current values (ΔI, µA) vs. scan rates is
summarized in graph B, comparing experimental and simulation results.
The optimized method was analyzed for the sensor 3 type and the expected increase in the current response following
the increase in the scan rates was obtained in all experiments for both oxidation and reduction processes (Figure 3B). Moreover, the
simulated voltammograms presented in Figure 3A showed a fair agreement with the experimental curves, especially with respect to the
peak current values. To study the influence of the scan rate and the amount of Nafion®117 present in the enzyme/membrane mixture on
the stability of the biosensor layers and the response, PB modified SPEs from preparation method 2 were used to design sensor 4 type,
where the preparation method 1 for the enzyme/membrane mixture was adapted. Thus, the principal difference between the sensor 3
and sensor 4 series was the composition and concentration of the Nafion membrane: 2.0% and 0.2% Nafion, respectively. The
constructed glucose biosensors were tested for different scan rates and the results of electrochemical studies were further compared
with the data obtained by liquid chromatography-electrospray ionization-tandem mass spectrometry (LC-ESI-MS/MS) and scanning
electron microscopy (SEM) coupled with energy dispersive X-ray (EDX) analysis. The obtained results are presented in the following
section 4.3.
4.3. The effect of the scan rate and membrane composit ion on the biosensor layers stabil i ty and
response
Concerning the changes in the topology of the biosensor system from one scan to another in CV, it was interesting to investigate the
content of the buffer probes collected after each measurement by means of liquid chromatography tandem mass spectrometry (LC-
MS/MS). Therefore, the glucose biosensors from the sensor 3 and sensor 4 series were scanned at the potential range from -0.5 V to
+0.5 V at 10, 20 and 50 mV/sec sweep speeds (see Figure S5, A, Supplementary Materials). Since no significant difference was obtained
between the voltammograms for sensor 3 and sensor 4 designs, the probes were collected for 10 and 20 mV/sec scan rate experiments.
To verify the correlation between the scan rate value or number of scans and the enzyme/membrane film stability, a fresh sensor was
used for each scan rate. Moreover, to prove the influence of the electrochemical measurements on the biosensor layer stability one of
ACCEPTED MANUSCRIP
T

the non-used glucose biosensors (sensor 3 and sensor 4 series) was tested in a steady state experiment with a water droplet. All the
collected probes were investigated by subsequent LC-ESI–MS/MS analysis (Figure 4).
Figure 4 – Mass spectra (A-D), TIC and extracted ion chromatograms (EICs) (A,B) of buffer probes (coloured) and water droplets (black) of
sensor 3 (E-G) and sensor 4 (H) series obtained for a different number of scans (E) and sweep rates (G). The results of the comparison of
steady state experiment vs. CV probes collected for sensor 3 and sensor 4 series are presented in graphs F and H, respectively. Nafion -
corresponding fragments in MS/MS spectra are shown at collision-induced dissociation (CID) experiments 10 eV.
In all samples tested by mass spectrometry the fragments corresponding to the Nafion membrane were clearly
observed (Figure 4, A-D). The mass spectra were shown for perfluorinated carboxylic acids as the most environmentally persistent
compounds of the Nafion fluoropolymer [42]. Thus, peaks at m/z equal to 394.9758 and 444.9725 were tentatively identified as
CF3(CF2)5CHFCOO- and CF3(CF2)6CHFCOO- fragments, respectively (Figure 4A,B). These structures were further confirmed by the major
MS/MS fragments presented in Figure 4Figure C and Figure 4D [43].
From the TIC chromatograms presented in Figure 4E, it is clear that at low scan rates (10 mV/sec) the membrane layer
(sensor 3 series, 2.0% Nafion) stabilizes approximately at the fifth scan, whereas at 20 mV/sec (Figure 4F) the Nafion elution profile for
ACCEPTED MANUSCRIP
T

the same type of membrane reaches a constant trend already at the third scan. The tendency of Nafion membrane stabilization at a
higher sweeping speed was demonstrated for both probes collected after the first scans in Figure 4G and could also be traced in the
voltammograms recorded at scan rates equal to 10 and 20 mV/sec (see Figure S5, B,C, Supplementary Materials). Comparing the elution
profiles of Nafion-corresponded products, for probes collected after a steady state experiment and different scans in Figure 4G and
Figure 4H, it is clear that the CV measurements allow faster stabilization of the membrane layer regardless of its composition. Moreover,
the concentration profiles of Nafion-corresponded products for the sensor 4 (0.2% Nafion) series tested at 20 mV/sec (see Figure S6,
Supplementary Materials) showed a higher signal in comparison to the sensor 3 series (2.0% Nafion) at the first scans which corresponds
to a lower stability of the 0.2% Nafion membrane. The stability of the 2.0% Nafion membrane was also confirmed in the subsequent
SEM/EDX studies of the sensor 3 and sensor 4 samples (Figure 5), obtained after CV characterization.
Figure 5 – SEM images (A-E) and EDX spectra (F) of glucose biosensor layers. The enzyme/membrane layer of the sensor 4 series, without
graphene oxide is presented in A. Top view of the enzyme/membrane layer is enlarged in B. For the sensor 3 series graphene oxide, PB
and enzyme/membrane layers are shown in C. The PB layer of the sensor 3 series is enlarged in D, as well as a part of the
enzyme/membrane layer (top right). The working electrode prior to modification steps is shown in E.
ACCEPTED MANUSCRIP
T

A non-uniform enzyme/membrane layered structure was observed in Figure 5A with a dense Nafion coating on top of
the surface (Figure 5B). A more detailed view on the biosensor structure for the 2.0% Nafion membrane is presented in Figure 5C, where
the graphene oxide layer with deposited Prussian Blue (Figure 5D) is covered by the enzyme/membrane film. Figure 5C clearly indicates
that 2.0% Nafion coating allows the formation of a uniform layer with final thickness equal to 5-7 µm thickness (estimated by SEM). The
graphene oxide layer (top) over the plastic substrate (bottom) for commercial SPEs was demonstrated in Figure 5E. Moreover, EDX
spectra taken from the enzyme/membrane film, clearly indicated the presence of Nafion, based on the fluorine and sulphur spectral lines
(Figure 5F). Therefore, EDX analysis demonstrated that the Nafion layer remains fixed on the biosensor surface after performing cyclic
voltammetry measurements.
4.4. Chronoamperometric characterizat ion of optimized biosensors
The analytical merit of the optimized biosensors (sensor 3 series) was evaluated via chronoamperometric studies in the presence of
glucose. The linear response (Figure 6A) of the constructed biosensors was obtained in the range of glucose concentrations from 10-3 to
10-5 M (RSD < 7% per electrode). The biosensors were also calibrated in the analytical range of glucose concentrations between 0.1 and
2 mM (Figure 6B). The mean value of the slope estimated for the linear response (0 to 2 mM) was - 1.25 µA/mM with a standard
deviation equal to 0.035 µA/mM. The obtained results are in a good agreement with literature data reported for fermentation
monitoring [44,45].
Figure 6 – Calibration curve (A) obtained for the optimized sensor 3 biosensors in the presence of glucose. The current response is
plotted towards the glucose concentration range equal to 10-5-10-3 M. The zero glucose concentration corresponds to the phosphate
buffer solution. The relative standard deviation per electrode is not shown, due to the low value (RSD = 7%). The chronoamperometric
response (current vs time) of the analytical range of glucose concentrations is presented in B.
5. Conclusions and Future Work
The mathematical model of cyclic voltammetry response was developed for the glucose biosensors operating in aerobic conditions in
the absence of glucose at low scan rates. The model was validated with the biosensors with various amounts of immobilized mediator
and different enzyme/membrane film compositions. The biosensor system parameters required for numerical simulations were either
found in literature or estimated from experimental data, therefore not limiting the applicability of the proposed model to a single
biosensor design. In this work, we have demonstrated that combining the results of multi-analytical studies together with mechanistic
modeling is an effective approach in identifying the key parameters of the biosensor system crucial for the optimal biosensors operation
and design. Therefore, a more favorable composition of the enzyme/membrane layer (2.0% Nafion) was proposed and further proved to
be stable at various operation conditions during cyclic voltammetry measurements.
In summary, the practical merit of the presented work is in the development of a time and cost effective tool crucial
for amperometric biosensor design optimization. The demonstrated approach could potentially allow reducing the reagent usage and
waste generation. As a future work, the optimized design of the glucose biosensor system will undergo further bioanalytical,
morphological and amperometric studies, and the constructed model will be extended to describe the mediated enzymatic reaction of
glucose oxidase in the presence of glucose. Thus, the proposed model will summarize all available process knowledge together with the
results of bioanalytical and morphological analysis. Combining such model with global sensitivity and uncertainty analysis tools, will
allow mapping the influence of the complete set of system input parameters on the biosensor response, which subsequently opens up
the possibilities for optimization of the biosensor performance and ultimately the design of novel improved biosensors.
ACCEPTED MANUSCRIP
T

Acknowledgments
This research was supported by the EUROMBR project that received funding from the People Programme (Marie Curie Actions, Multi-
ITN) of the European Union’s Seventh Framework Programme for research, technological development and demonstration under grant
agreement № 608104.
The authors acknowledge Dr. Irina Petrushina, Aleksey Valerievich Nikiforov and Larisa Seerup from the Department of
Energy Conversion and Storage (DTU Energy) together with Tannaz Tajsoleiman and Dr. Ulrich Krühne (PROSYS, DTU Chemical
Engineering) for fruitful discussions. Moreover, the authors would like to acknowledge Dr. Claudia Fink-Straube (Chemical Analytics,
INM) and the Danish Polymer Center (DPC, DTU Chemical Engineering) for their support and for providing access to their
instrumentation.
References
[1] J. Wang, Electrochemical glucose biosensors, Electrochem. Sensors, Biosens. Their Biomed. Appl. (2008) 57–69.
doi:10.1016/B978-012373738-0.50005-2.
[2] A. Heller, B. Feldman, Electrochemical glucose sensors and their applications in diabetes management, Chem. Rev. 108 (2008)
2482–2505. doi:10.1021/cr068069y.
[3] J. Sołoducho, J. Cabaj, Electrochemical and Optical Biosensors in Medical Applications, in: T. Rinken (Ed.), Biosens. - Micro
Nanoscale Appl., InTech, 2015: p. 466. doi:10.5772/711.
[4] M.S. Belluzo, M.É. Ribone, C.M. Lagier, Assembling Amperometric Biosensors for Clinical Diagnostics, Sensors. 8 (2007) 1366–
1399. doi:10.3390/s8031366.
[5] A.M. Gonçalves, A.Q. Pedro, F.M. Santos, L.M. Martins, C.J. Maia, J.A. Queiroz, L.A. Passarinha, Trends in protein-based biosensor
assemblies for drug screening and pharmaceutical kinetic studies, Molecules. 19 (2014) 12461–12485.
doi:10.3390/molecules190812461.
[6] M.A. Alonso-Lomillo, O. Domínguez-Renedo, M.J. Arcos-Martínez, Screen-printed biosensors in microbiology; A review, Talanta.
82 (2010) 1629–1636. doi:10.1016/j.talanta.2010.08.033.
[7] L.D. Mello, L.T. Kubota, Review of the use of biosensors as analytical tools in the food and drink industries, Food Chem. 77
(2002) 237–256. doi:10.1016/S0308-8146(02)00104-8.
[8] B.M. Paddle, Biosensors for chemical and biological agents of defence interest, Biosens. Bioelectron. 11 (1996) 1079–1113.
doi:10.1016/0956-5663(96)82333-5.
[9] J.M. Montornes, M.S. Vreeke, I. Katakis, Glucose Biosensors, Bioelectrochemistry Fundam. Exp. Tech. Appl. (2008) 199–217.
doi:10.1002/9780470753842.ch5.
[10] J. Shi, D. Feng, Y. Li, Biosensors in Fermentation Applications, in: A.F. Jozala (Ed.), Ferment. Process., InTech, 2017: p. 310.
doi:10.5772/711.
[11] D. Grieshaber, R. Mackenzie, J. Vörös, E. Reimhult, Electrochemical Biosensors -Sensor Principles and Architectures, Sensors. 8
(2008) 1400–1458. doi:10.3390/s8031400.
[12] R. Baronas, F. Ivanauskus, J. Kulys, Mathematical Modeling of Biosensors An Introduction for Chemists and Mathematicians,
Springer Netherlands, 2010. doi:10.1007/b100321.
[13] L.D. Mell, J.T. Maloy, Model for the amperometric enzyme electrode obtained through digital simulation and applied to the
immobilized glucose oxidase system, Anal. Chem. 47 (1975) 299–307. doi:10.1021/ac60352a006.
[14] G.G. Guilbault, G.J. Lubrano, An enzyme electrode for the amperometric determination of glucose, Anal. Chim. Acta. 64 (1973)
439–455. doi:10.1016/S0003-2670(01)82476-4.
[15] R.S. Nicholson, I. Shain, Theory of Stationary Electrode Polarography: Single Scan and Cyclic Methods Applied to Reversible,
Irreversible, and Kinetic Systems, Anal. Chem. 36 (1964) 706–723. doi:10.1021/ac60210a007.
[16] M. Rudolph, D.P. Reddy, S.W. Feldberg, A simulator for cyclic voltammetric responses, Anal. Chem. 66 (1994) 589A–600A.
[17] K. Yokoyama, Y. Kayanuma, Cyclic Voltammetric Simulation for Electrochemically Mediated Enzyme Reaction and Determination
of Enzyme Kinetic Constants, Anal. Chem. 70 (1998) 3368–3376. doi:10.1021/ac9711807.
ACCEPTED MANUSCRIP
T

[18] K. Yokoyama, S. Koide, Y. Kayanuma, Cyclic voltammetric simulation of electrochemically mediated enzyme reaction and
elucidation of biosensor behaviors., Anal. Bioanal. Chem. 372 (2002) 248–53. doi:10.1007/s00216-001-1203-9.
[19] M. Orlik, An improved algorithm for the numerical simulation of cyclic voltammetric curves affected by the ohmic potential
drops and its application to the kinetics of bis(biphenyl)chromium(I) electroreduction, J. Electroanal. Chem. 575 (2005) 281–286.
doi:10.1016/j.jelechem.2004.10.001.
[20] Z. Deng, X. Lin, Digital simulation of fast cyclic voltammogram by integration of the double layer charging current, J.
Electroanal. Chem. 464 (1999) 215–221.
[21] H. Cho, T. Kim, D. Yoon, A study on the computational simulation of cyclic voltammetry using semi-infinite diffusion model, J.
Korean Electrochem. Soc. 14 (2011) 138–144.
[22] B.J. Adesokan, X. Quan, A. Evgrafov, M.P. Sørensen, A. Heiskanen, A. Boisen, Hydrodynamics studies of cyclic voltammetry for
electrochemical micro biosensors, J. Phys. Conf. Ser. 574 (2015) 12008. doi:10.1088/1742-6596/574/1/012008.
[23] B.J. Adesokan, X. Quan, A. Evgrafov, A. Heiskanen, A. Boisen, M.P. Sørensen, Experimentation and numerical modeling of cyclic
voltammetry for electrochemical micro-sized sensors under the influence of electrolyte flow, J. Electroanal. Chem. 763 (2016)
141–148. doi:10.1016/j.jelechem.2015.12.029.
[24] M.J. Bidwell, J.A. Alden, R.G. Compton, Hydrodynamic voltammetry with channel microband electrodes: The simulation of
voltammetric waveshapes, J. Electroanal. Chem. 417 (1996) 119–128. doi:10.1016/S0022-0728(96)04739-0.
[25] D. Pletcher, R. Greef, R. Peat, L.M. Peter, J. Robinson, Instrumental methods in Electrochemisty, Woodhead Publishing Limited,
Cambridge, 2011. doi:http://dx.doi.org/10.1016/B978-0-12-525440-3.50002-X.
[26] C. Cannes, F. Kanoufi, A.J. Bard, Cyclic voltammetry and scanning electrochemical microscopy of ferrocenemethanol at
monolayer and bilayer-modified gold electrodes, J. Electroanal. Chem. 547 (2003) 83–91. doi:10.1016/S0022-0728(03)00192-X.
[27] C. Cannes, F. Kanoufi, A.J. Bard, Cyclic voltammetric and scanning electrochemical microscopic study of menadione permeability
through a self-assembled monolayer on a gold electrode, Langmuir. 18 (2002) 8134–8141. doi:10.1021/la0258906.
[28] F. Ricci, A. Amine, C.S. Tuta, A.A. Ciucu, F. Lucarelli, G. Palleschi, D. Moscone, Prussian Blue and enzyme bulk-modified screen-
printed electrodes for hydrogen peroxide and glucose determination with improved storage and operational stability, Anal.
Chim. Acta. 485 (2003) 111–120. doi:10.1016/S0003-2670(03)00403-3.
[29] F. Ricci, A. Amine, G. Palleschi, D. Moscone, Prussian Blue based screen printed biosensors with improved characteristics of
long-term lifetime and pH stability, Biosens. Bioelectron. 18 (2003) 165–174.
[30] A.N. Sekretaryova, M. Eriksson, A.P.F. Turner, Bioelectrocatalytic systems for health applications, Biotechnol. Adv. 34 (2016) 177–
197. doi:10.1016/j.biotechadv.2015.12.005.
[31] R.C. Cretu, D.M. Gligor, L. Muresan, I.C. Popescu, L.M. Muresan, Kinetic characterization of Prussian Blue-modified graphite
electrodes for amperometric detection of hydrogen peroxide, J. Appl. Electrochem. 36 (2006) 1327–1332. doi:10.1007/s10800-
006-9242-8.
[32] K. Itaya, N. Shoji, I. Uchida, Catalysis of the reduction of molecular oxygen to water at Prussian blue modified electrodes, J. Am.
Chem. Soc. 106 (1984) 3423–3429. doi:10.1021/ja00324a007.
[33] P. Gros, A. Bergel, Improved model of a polypyrrole glucose oxidase modified electrode, J. Electroanal. Chem. 386 (1995) 65–73.
doi:10.1016/0022-0728(94)03804-C.
[34] S.C. Barton, Chapter 8: Enzyme catalysis in biological fuel cells, in: W. Vielstich, H.A. Gasteiger, A. Lamm, H. Yokokawa (Eds.),
Handb. Fuel Cells – Fundam. Technol. Appl., John Wiley & Sons, Ltd, 2010: pp. 1–19.
http://www.wiley.com/WileyCDA/WileyTitle/productCd-0470723114.html.
[35] H.C. Chang, C.C. Wu, S.J. Ding, I.S. Lin, I.W. Sun, Measurement of diffusion and partition coefficients of ferrocyanide in protein-
immobilized membranes, Anal. Chim. Acta. 532 (2005) 209–214. doi:10.1016/j.aca.2004.10.063.
[36] K. Itaya, K. Shibayama, H. Akahoshi, S. Toshima, Prussian-blue-modified electrodes: An application for a stable electrochromic
display device, J. Appl. Phys. 53 (1982) 804–805. doi:10.1063/1.329997.
[37] K. Itaya, H. Akahoshi, S. Toshima, Electrochemistry of Prussian Blue Modified Electrodes: An Electrochemical Preparation
Method, J. Electrochem. Soc. 129 (1982) 1498–1500. doi:10.1149/1.2124191.
ACCEPTED MANUSCRIP
T

[38] J. Kulys, R. Vidziunaite, Laccase based synergistic electrocatalytical system, Electroanalysis. 21 (2009) 2228–2233.
doi:10.1002/elan.200904679.
[39] M. Mahosenaho, F. Caprio, L. Micheli, A.M. Sesay, G. Palleschi, V. Virtanen, A disposable biosensor for the determination of
alpha-amylase in human saliva, Microchim. Acta. 170 (2010) 243–249. doi:10.1007/s00604-010-0360-y.
[40] J.M. Bolivar, T. Consolati, T. Mayr, B. Nidetzky, Quantitating intraparticle O2 gradients in solid supported enzyme immobilizates:
Experimental determination of their role in limiting the catalytic effectiveness of immobilized glucose oxidase, Biotechnol.
Bioeng. 110 (2013) 2086–2095. doi:10.1002/bit.24873.
[41] J.M. Bolivar, S. Schelch, M. Pfeiffer, B. Nidetzky, Intensifying the O2-dependent heterogeneous biocatalysis: superoxygenation of
solid support from H2O2 by a catalase tailor-made for effective immobilization, J. Mol. Catal. B Enzym. 134 (2016) 302–309.
doi:http://dx.doi.org/10.1016/j.molcatb.2016.10.017.
[42] D.A. Ellis, S.A. Mabury, J.W. Martin, D.C.G. Muir, Thermolysis of fluoropolymers as a potential source of halogenated organic
acids in the environment., Nature. 412 (2001) 321–324. doi:10.1038/35085548.
[43] M. Feng, R. Qu, Z. Wei, L. Wang, P. Sun, Z. Wang, Characterization of the thermolysis products of Nafion membrane: A potential
source of perfluorinated compounds in the environment, Sci. Rep. 5 (2015) 9859. doi:10.1038/srep09859.
[44] S.F. White, I.E. Tothill, J.D. Newman, A.P.F. Turner, Development of a mass-producible glucose biosensor and flow-injection
analysis system suitable for on-line monitoring during fermentations, Anal. Chim. Acta. 321 (1996) 165–172. doi:10.1016/0003-
2670(95)00514-5.
[45] A.C. Fernandes, D. Semenova, P. Panjan, A.M. Sesay, K. V Gernaey, U. Krühne, Multi-function microfluidic sensor integration
platform for sensors integration, N. Biotechnol. In press (n.d.).
ACCEPTED MANUSCRIP
T

Daria Semenova received her M.S. degree in chemical technology of
synthetic bioactive substances from D. Mendeleev University of Chemical Technology of
Russia in 2012. She worked as a researcher on modifications of natural alkaloids and
synthesis of novel fluorinated thebaine derivatives in the Laboratory of Fine Organic
Synthesis at A.N. Nesmeyanov Institute of Organoelement Compounds (INEOS) Russian
Academy of Sciences until 2014. Since August 2014 she has been working toward her PhD
degree at the Process and Systems Engineering Center (PROSYS), at the Chemical and
Biochemical department at the Technical University of Denmark (DTU). Her current research
interests are focused on the development of the mathematical models for the design and
optimization of screening technologies for bio-based processes.
Alexandr Zubov received PhD in Chemical Engineering in 2014 from the
University of Chemistry and Technology Prague. Until 2015 he worked there as a research
assistant and assistant professor in the Group of Polymer Reaction Engineering led by Prof.
Juraj Kosek. Since October 2015 he is employed as a postdoc at the Technical University of
Denmark. His research interests include mathematical modelling of multi-phase reactors,
dynamic transport in hetero-phase media, model-based optimization and control of industrial
processes, and mathematical morphology.
ACCEPTED MANUSCRIP
T

Yuliya E. Silina has completed her PhD in Analytical Chemistry in 2005
(Voronezh State University of Engineering Technology, Russia). Currently, she is a principal
investigator of a team focusing on developments in the modern mass spectrometry, lab-on-a-
chip devices, bio- and environmental sensing at INM – Leibniz Institute of New Materials
(Saarbrücken, Germany). She has published more than 30 papers in reputed journals and
holds 11 patients for her inventions.
Laura Micheli is an associate professor in analytical chemistry at the
department of Chemical Science and Technologies at the Università di Roma Tor Vergata
(Italy). The research activities of Prof. Micheli are focused on the study and development of
disposable electrochemical tools for the determination of several analytes in food, clinical and
cultural heritage fields, by use of spectrophotometric and chromatographic methods. Here
research interests include the development of immunosensors, interference-free biosensors
based on screen printed electrodes (SPEs), as well as novel techniques and tools for biosensor
platform integration. She collaborates with the research group CEMIS-OULU (University of
Oulu, Finland) and private companies (EUROLAB srl, 2005-2010, Systea S.p.A., 2012-now).
ACCEPTED MANUSCRIP
T

Marcus Koch has received his PhD in Physics in 2004 (Saarland
University, Germany). In June 2000 he started working at INM – Leibniz Institute of New
Materials (Saarbrücken, Germany) in the group of electron microscopy and X-ray diffraction.
Since January 2015 he’s leader of the group Physical Analytics at INM. His main research
interests are correlative and environmental electron microscopy of nanostructured samples.
Ana C. Fernandes graduated in 2012 in Biological Engineering from the
Technical University of Lisbon (Portugal). She worked as a researcher in microfluidics and
integration of magnetic sensors towards health applications at INESC-Microsystems and
Nanotechnology in Lisbon (Portugal) until 2014. In June 2014 she started her PhD at the
Process and Systems Engineering Center (PROSYS), at the Chemical and Biochemical
department at the Technical University of Denmark (DTU) with Adama M. Sesay, Krist
Gernaey and Ulrich Krühne.
Krist V. Gernaey holds a PhD degree in Applied Biological Sciences from
Ghent University (Belgium) since 1997. He is professor in industrial fermentation technology
at the Department of Chemical and Biochemical Engineering, Technical University of
ACCEPTED MANUSCRIP
T

Denmark (DTU) since 2013. He is head of the Process and Systems Engineering Center
(PROSYS), and CEO of the startup company Bioscavenge. He has been a postdoctoral fellow at
Ghent University, Ecole Polytechnique de Montreal, DTU and Lund University (1998-2005),
and associated professor at DTU Chemical Engineering since 2005. His current research
interests are large-scale fermentation, modelling and process simulation, scaling up/down and
resource recovery processes.
ACCEPTED MANUSCRIP
T
![Cyclic Voltammetry of Zirconyl Chloride (ZrOCl2) in KF ......Solutions of zirconyl chloride reach their maximum hydrolysis in three hours [7-10]. Table 3. Cyclic voltammetry parameters](https://static.fdocuments.net/doc/165x107/611a62ecf0687b2382647c1c/cyclic-voltammetry-of-zirconyl-chloride-zrocl2-in-kf-solutions-of-zirconyl.jpg)