Mechanistic Evaluation of Matrix Effect on Three Different ... · on Three Different Model of Mass...
11
Open Access Research Article Journal of Analytical & Bioanalytical Techniques J ou r n a l o f A n a l y t i c a l & B i o a n a l y t i c a l T e c h n i q u e s ISSN: 2155-9872 Vats et al., J Anal Bioanal Tech 2016, 7:3 DOI: 10.4172/2155-9872.1000314 Volume 7 • Issue 3 • 1000314 J Anal Bioanal Tech ISSN: 2155-9872 JABT, an open access journal Keywords: Matrix effect; Process efficiency; Sample extraction technique; LC-MS/MS; Instrument model Introduction Liquid chromatography-tandem mass spectrometer (LC-MS) systems using an electrospray ion source coupled with tandem mass analyzers (LC-ESI-MS/MS) have been applied to a wide variety of studies in pharmaceutical analysis and life sciences. With LC-ESI- MS/MS now considered the benchmark for measurement of drugs and their metabolites in biological matrices, the high selectivity of tandem mass spectrometry, with successive mass filtrations, leads to little or no observed interference even though there may be relatively high concentrations of co-extracted and co-eluted matrix components present. ese characteristics have led to a growing trend of high- throughput analysis that incorporates little or no sample preparation and minimal chromatographic retention. Moreover, LC-MS has unprecedented capabilities especially for the molecules which are incompatible with GC-MS due to high polarity, high mass and thermo labile in nature and allowed for the elimination of derivatisation steps prior to injects, saving on time and reagent cost. With LC-ESI-MS/ MS having these characteristics of high selectivity, sensitivity and throughput, it is not surprising that this technology is being increasingly used in the clinical laboratory. ough it is considered as a powerful tool for the quantitation of drug at a very low level, it s selectivity was challenged by Tang et al. [1] while studying the effect of conductivity and ion intensity in electro spray. ey coined the term matrix effect, wherein along with the analyte of interest other endogenous matter of matrix also ionize and results in suppression or enhancement of response of analyte. ereby accuracy of the data is compromised. erefore ion-suppression and/or ion-enhancement due to matrix effect has been one of the major unknown variables of concern that could adversely affect the accuracy and precision of the assay results for biological sample assay in LC-MS/MS methods [2]. Eeckhaut et al. [3], in their review article on matrix effect discussed in detail about the assessment of matrix effect, parameters like sample preparation technique, chromatographic conditions and mass spectrometric conditions that needs to be optimized to the best to eliminate matrix effect. In their review article they emphasised that during validation of any bioanalytical technique, quantitative assessment of matrix effect is must to ensure precision and accuracy of data. Large amount of literature is available on the factors which causes the occurrence of matrix effect in the developed method. ese include endogenous substances in the matrix [4,5], exogenous materials such as buffers, ion pairing agents [6], co-medication [7], type of soſt ionization technique i.e., atmospheric pressure chemical ionization (APCI) or electro spray ionization (ESI), source design [8]. At the same time, number of approaches was reported to minimize or to eliminate the matrix effect while developing the methods in biological matrix. ese include change in chromatographic conditions [9,10], sample preparation techniques [11,12], selection of ionization source and polarity [13-15], stable isotope labeled- internal standard, decrease the amount of sample [16]. erefore upon literature review, it was evident that to control the matrix effect various parameters which included sample processing *Corresponding author: Poonam Vats, Department of Clinical Pharmacology and Pharmacokinetics, Sun Pharmaceutical Industries Ltd, Gurgaon-122 015, Haryana, India, Tel: +91-9810173171; E-mail: [email protected] Received March 05, 2016; Accepted March 23, 2016; Published March 30, 2016 Citation: Vats P, Verma SM, Monif T (2016) Mechanistic Evaluation of Matrix Effect on Three Different Model of Mass Spectrometer by Using a Model Drug. J Anal Bioanal Tech 7: 314. doi:10.4172/2155-9872.1000314 Copyright: © 2016 Vats P, et al. This is an open-access article distributed under the terms of the Creative Commons Attribution License, which permits unrestricted use, distribution, and reproduction in any medium, provided the original author and source are credited. Abstract In this research work we have tried to emphasis that the synergistic approach is required wherein during method development sample processing and instrument i.e., mass spectrometer shall be evaluated in synchronized manner to get the best possible combination of processing technique and instrument model to get a method with no or minimal matrix effect. To perform this research work polar molecule niacin is considered as a model drug to evaluate the synergistic approach. Plasma was treated with three different conventional sample preparation procedures (PPT, LLE and SPE) and samples processed with the three methodology were then analyzed on three different instrument models of AB Sciex i.e., API-3000, API-3200, API-4000. Except for type of sample processing technique and instrument model, rest of the parameters like aliquot volume, internal standard working solution volume and chromatographic conditions were kept constant to avoid contribution of these factors due to these variables. Samples were analyzed using Inertsil ® CN-3 as an analytical column and mobile phase consist of acetonitrile - solution-1(0.002% formic acid in water, v/v) in the ratio of 70:30, v/v. Result evidently showed that matrix effect was minimized through SPE technique over LLE technique and behavior of the co-elute matrix also changed significantly with ion-source design of the mass spectrometer. Consequently, the development result clearly showed that matrix effect was nullified by samples prepared by SPE technique and analyzed on API-3000. Results obtained from API- 3000 and API-4000 models were also comparable in terms of matrix effect. API-3000 in combination with solid phase extraction procedure was selected to further validate the method as API-4000 showed charge competition of internal standard. Overall, the results indicate that extraction procedure plays a crucial role to control matrix effect but to get the best result LC have to be coupled with mass spectrometer with proper ion source. Mechanistic Evaluation of Matrix Effect on Three Different Model of Mass Spectrometer by Using a Model Drug Poonam Vats 1 *, S Manaswita Verma 2 and Tausif Monif 1 1 Department of Clinical Pharmacology and Pharmacokinetics, Sun Pharmaceutical Industries Ltd, Gurgaon-122 015, Haryana, India 2 Department of Pharmaceutical Sciences, Birla Institute of Technology, Mesra, Ranchi-835 215, Jharkhand, India
Transcript of Mechanistic Evaluation of Matrix Effect on Three Different ... · on Three Different Model of Mass...
Open AccessResearch Article
Journal ofAnalytical & Bioanalytical TechniquesJo
urna
l of A
nalyt
ical & Bioanalytical Techniques
ISSN: 2155-9872
Vats et al., J Anal Bioanal Tech 2016, 7:3 DOI: 10.4172/2155-9872.1000314
Volume 7 • Issue 3 • 1000314J Anal Bioanal TechISSN: 2155-9872 JABT, an open access journal
Keywords: Matrix effect; Process efficiency; Sample extractiontechnique; LC-MS/MS; Instrument model
IntroductionLiquid chromatography-tandem mass spectrometer (LC-MS)
systems using an electrospray ion source coupled with tandem mass analyzers (LC-ESI-MS/MS) have been applied to a wide variety of studies in pharmaceutical analysis and life sciences. With LC-ESI-MS/MS now considered the benchmark for measurement of drugs and their metabolites in biological matrices, the high selectivity of tandem mass spectrometry, with successive mass filtrations, leads to little or no observed interference even though there may be relatively high concentrations of co-extracted and co-eluted matrix components present. These characteristics have led to a growing trend of high-throughput analysis that incorporates little or no sample preparation and minimal chromatographic retention. Moreover, LC-MS has unprecedented capabilities especially for the molecules which are incompatible with GC-MS due to high polarity, high mass and thermo labile in nature and allowed for the elimination of derivatisation steps prior to injects, saving on time and reagent cost. With LC-ESI-MS/MS having these characteristics of high selectivity, sensitivity and throughput, it is not surprising that this technology is being increasingly used in the clinical laboratory. Though it is considered as a powerful tool for the quantitation of drug at a very low level, it s selectivity was challenged by Tang et al. [1] while studying the effect of conductivity and ion intensity in electro spray. They coined the term matrix effect, wherein along with the analyte of interest other endogenous matter of matrix also ionize and results in suppression or enhancement of response of analyte. Thereby accuracy of the data is compromised. Therefore ion-suppression and/or ion-enhancement due to matrix effect has been one of the major unknown variables of concern that could adversely affect the accuracy and precision of the assay results for biological sample assay in LC-MS/MS methods [2].
Eeckhaut et al. [3], in their review article on matrix effect discussed in detail about the assessment of matrix effect, parameters like sample preparation technique, chromatographic conditions and mass spectrometric conditions that needs to be optimized to the best to eliminate matrix effect. In their review article they emphasised that during validation of any bioanalytical technique, quantitative assessment of matrix effect is must to ensure precision and accuracy of data. Large amount of literature is available on the factors which causes the occurrence of matrix effect in the developed method. These include endogenous substances in the matrix [4,5], exogenous materials such as buffers, ion pairing agents [6], co-medication [7], type of soft ionization technique i.e., atmospheric pressure chemical ionization (APCI) or electro spray ionization (ESI), source design [8]. At the same time, number of approaches was reported to minimize or to eliminate the matrix effect while developing the methods in biological matrix. These include change in chromatographic conditions [9,10], sample preparation techniques [11,12], selection of ionization source and polarity [13-15], stable isotope labeled- internal standard, decrease the amount of sample [16].
Therefore upon literature review, it was evident that to control the matrix effect various parameters which included sample processing
*Corresponding author: Poonam Vats, Department of Clinical Pharmacologyand Pharmacokinetics, Sun Pharmaceutical Industries Ltd, Gurgaon-122 015,Haryana, India, Tel: +91-9810173171; E-mail: [email protected]
Received March 05, 2016; Accepted March 23, 2016; Published March 30, 2016
Citation: Vats P, Verma SM, Monif T (2016) Mechanistic Evaluation of Matrix Effect on Three Different Model of Mass Spectrometer by Using a Model Drug. J Anal Bioanal Tech 7: 314. doi:10.4172/2155-9872.1000314
Copyright: © 2016 Vats P, et al. This is an open-access article distributed under the terms of the Creative Commons Attribution License, which permits unrestricted use, distribution, and reproduction in any medium, provided the original author and source are credited.
AbstractIn this research work we have tried to emphasis that the synergistic approach is required wherein during method
development sample processing and instrument i.e., mass spectrometer shall be evaluated in synchronized manner to get the best possible combination of processing technique and instrument model to get a method with no or minimal matrix effect. To perform this research work polar molecule niacin is considered as a model drug to evaluate the synergistic approach. Plasma was treated with three different conventional sample preparation procedures (PPT, LLE and SPE) and samples processed with the three methodology were then analyzed on three different instrument models of AB Sciex i.e., API-3000, API-3200, API-4000. Except for type of sample processing technique and instrument model, rest of the parameters like aliquot volume, internal standard working solution volume and chromatographic conditions were kept constant to avoid contribution of these factors due to these variables. Samples were analyzed using Inertsil® CN-3 as an analytical column and mobile phase consist of acetonitrile - solution-1(0.002% formic acid in water, v/v) in the ratio of 70:30, v/v. Result evidently showed that matrix effect was minimized through SPE technique over LLE technique and behavior of the co-elute matrix also changed significantly with ion-source design of the mass spectrometer. Consequently, the development result clearly showed that matrix effect was nullified by samples prepared by SPE technique and analyzed on API-3000. Results obtained from API-3000 and API-4000 models were also comparable in terms of matrix effect. API-3000 in combination with solid phase extraction procedure was selected to further validate the method as API-4000 showed charge competition of internal standard. Overall, the results indicate that extraction procedure plays a crucial role to control matrix effect but to get the best result LC have to be coupled with mass spectrometer with proper ion source.
Mechanistic Evaluation of Matrix Effect on Three Different Model of Mass Spectrometer by Using a Model DrugPoonam Vats1*, S Manaswita Verma2 and Tausif Monif1
1Department of Clinical Pharmacology and Pharmacokinetics, Sun Pharmaceutical Industries Ltd, Gurgaon-122 015, Haryana, India2Department of Pharmaceutical Sciences, Birla Institute of Technology, Mesra, Ranchi-835 215, Jharkhand, India
Citation: Vats P, Verma SM, Monif T (2016) Mechanistic Evaluation of Matrix Effect on Three Different Model of Mass Spectrometer by Using a Model Drug. J Anal Bioanal Tech 7: 314. doi:10.4172/2155-9872.1000314
Page 2 of 11
Volume 7 • Issue 3 • 1000314J Anal Bioanal TechISSN: 2155-9872 JABT, an open access journal
techniques, the mode of ionization, and optimization of pretreatment of sample have been investigated, but the role of instrument model based on source design and the sensitivity of instrument have not been reported till date. In this research work, we investigated the role of conventional sample processing techniques and instrument models in controlling the matrix effect. Samples processed by conventional sample processing techniques (i.e., PPT, LLE and SPE) were analyzed on different models of mass spectrometer (i.e., API-3000, API-3200 and API-4000).
Based on the level of sensitivity, different models of instruments have been designed. This research work involves comparison of API-3200, API-3000 and API-4000 models of mass spectrometer from AB Sciex [17]. The orders of sensitivity of the machines are: API-4000>API-3000>API-3200. API-4000 and API-3200 has the same source design and API-3000 has different source design. This difference in source designs also contributes to the matrix effect. In some cases, problem of matrix effects could be resolved by using a MS instrument of other model or manufacturer [18,19]. In today’s scenario, many regulatory bodies ask to demonstrate that there will not be any matrix effect if two different models of MS with different source designs are being used like API-3200 and API-3000 of sciex in analysis of single compound or drug.
In some research work, role of ionization source was also studied. A detailed review of literature suggested that the best approach to eliminate or minimize matrix effect in LC-MS/MS include use of APCI ionization source [5,20-22] for analysis. AS per the study done by Liang et al. [23] being a less sensitive source, matrix effect observed on APCI is also less. However, the APCI source has its own boundaries for use as it cannot be used for thermo labile molecules and has a low sensitivity. In case of the model drug selected for research, satisfactory sensitivity could not be attained on the APCI source. ESI source is the workhorse for routine bioanalysis in industries. Therefore research was conducted using the ESI source on which required sensitivity could be attained for the molecule.
In this research work, we emphasized that there is no generic method for detecting and eliminating the matrix effect. For each molecule it needs to be investigated independently. Consequently, while developing bio-analytical methodology for any molecule, optimization and selection of sample processing methodology and instrument model and ionization technique shall be done in combination. Synergistic approach is required to evaluate matrix effect wherein all the parameters need to be optimized in combination and not individually.
Rational for selection of model drug
It is reported that polar compound exhibits higher degree of matrix effect in reverse phase chromatography [24]. Therefore, niacin is selected as a model drug in this research work, as it is polar in nature. Niacin is easily ionizable because of which its extraction procedure could be easily developed with multiple processing techniques. The required sensitivity for this analyte could also be achieved on all the three instrument models. To develop a bio-analytical method in reverse chromatography for polar molecule with minimal or no matrix effect is a challenging task. Since in the reverse phase chromatography, co-elution of phospholipids may also take place with similar retention time of target analyte. This is probably the cause for higher value of matrix effect for polar molecule in reverse phase chromatography. For development an assay method for niacin, reverse phase chromatography is selected due to shorter analysis time. As matrix effect is mainly due
to endogenous phospholipids, SPE techniques helps in the effective cleaning of the sample when compared to other techniques because it selectively helps to remove the phospholipids from SPE cartridge by washing and extract the analyte of interest during extraction.
ExperimentalChemicals and materials
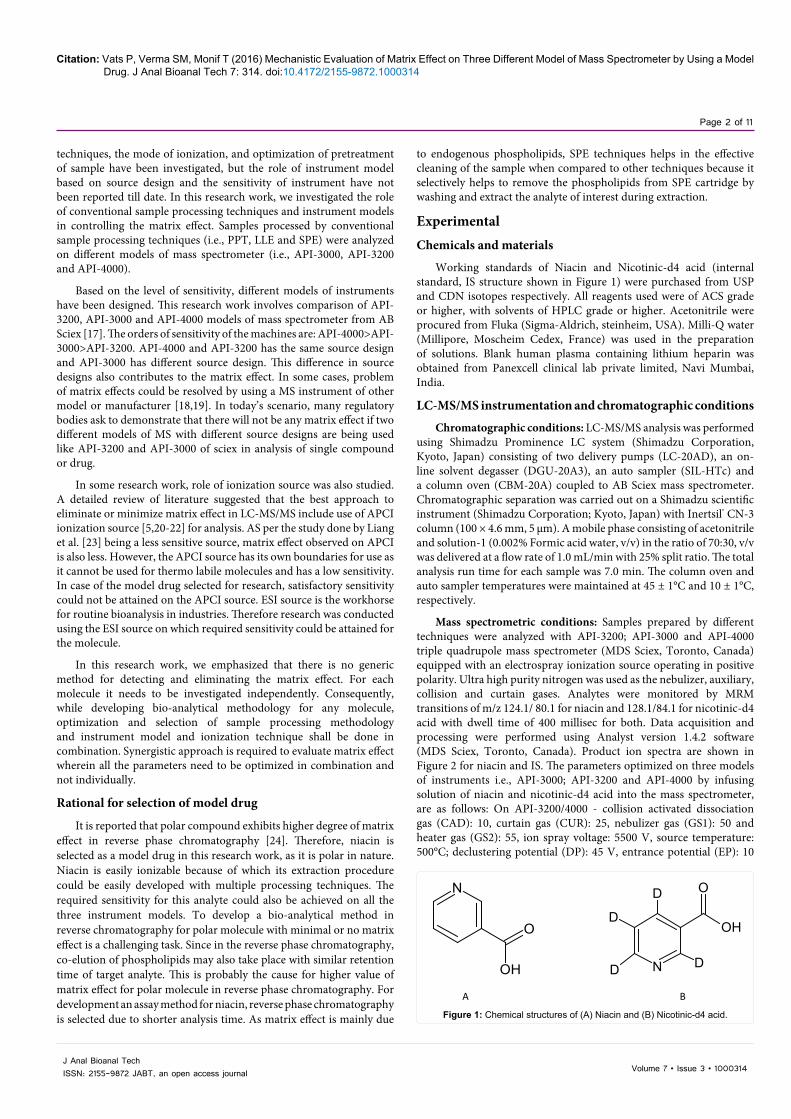
Working standards of Niacin and Nicotinic-d4 acid (internal standard, IS structure shown in Figure 1) were purchased from USP and CDN isotopes respectively. All reagents used were of ACS grade or higher, with solvents of HPLC grade or higher. Acetonitrile were procured from Fluka (Sigma-Aldrich, steinheim, USA). Milli-Q water (Millipore, Moscheim Cedex, France) was used in the preparation of solutions. Blank human plasma containing lithium heparin was obtained from Panexcell clinical lab private limited, Navi Mumbai, India.
LC-MS/MS instrumentation and chromatographic conditions
Chromatographic conditions: LC-MS/MS analysis was performed using Shimadzu Prominence LC system (Shimadzu Corporation, Kyoto, Japan) consisting of two delivery pumps (LC-20AD), an on-line solvent degasser (DGU-20A3), an auto sampler (SIL-HTc) and a column oven (CBM-20A) coupled to AB Sciex mass spectrometer. Chromatographic separation was carried out on a Shimadzu scientific instrument (Shimadzu Corporation; Kyoto, Japan) with Inertsil® CN-3 column (100 × 4.6 mm, 5 µm). A mobile phase consisting of acetonitrile and solution-1 (0.002% Formic acid water, v/v) in the ratio of 70:30, v/v was delivered at a flow rate of 1.0 mL/min with 25% split ratio. The total analysis run time for each sample was 7.0 min. The column oven and auto sampler temperatures were maintained at 45 ± 1°C and 10 ± 1°C, respectively.
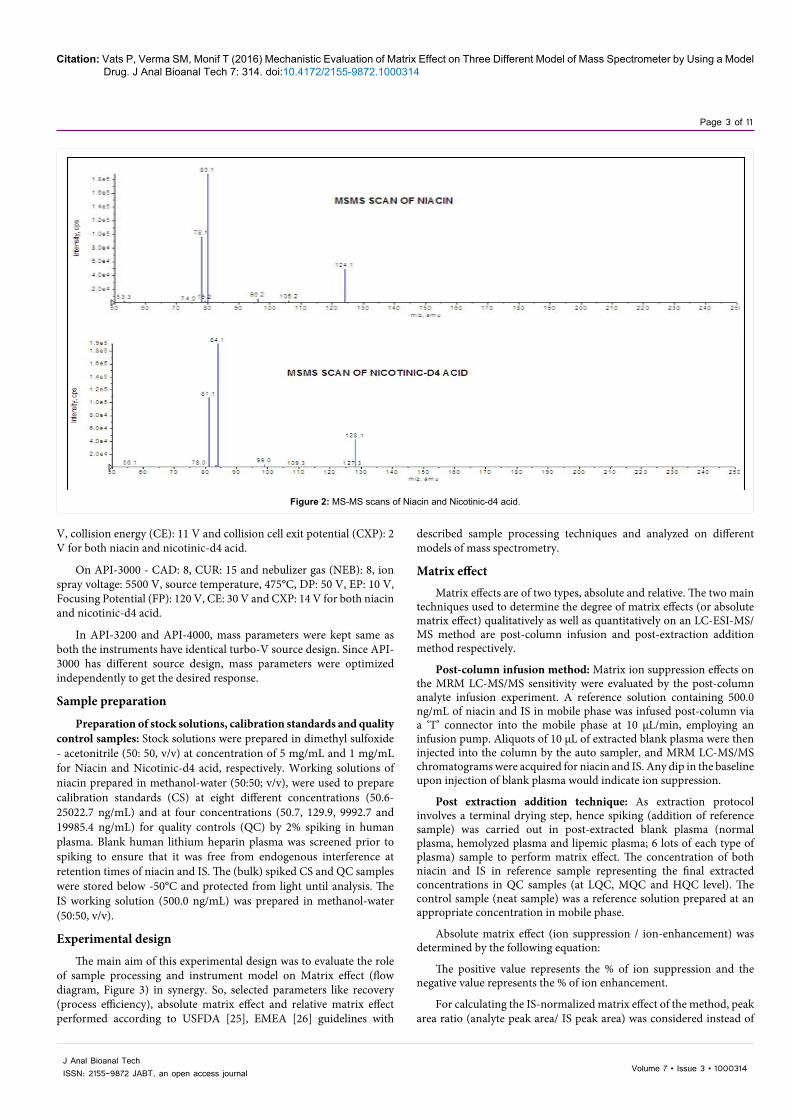
Mass spectrometric conditions: Samples prepared by different techniques were analyzed with API-3200; API-3000 and API-4000 triple quadrupole mass spectrometer (MDS Sciex, Toronto, Canada) equipped with an electrospray ionization source operating in positive polarity. Ultra high purity nitrogen was used as the nebulizer, auxiliary, collision and curtain gases. Analytes were monitored by MRM transitions of m/z 124.1/ 80.1 for niacin and 128.1/84.1 for nicotinic-d4 acid with dwell time of 400 millisec for both. Data acquisition and processing were performed using Analyst version 1.4.2 software (MDS Sciex, Toronto, Canada). Product ion spectra are shown in Figure 2 for niacin and IS. The parameters optimized on three models of instruments i.e., API-3000; API-3200 and API-4000 by infusing solution of niacin and nicotinic-d4 acid into the mass spectrometer, are as follows: On API-3200/4000 - collision activated dissociation gas (CAD): 10, curtain gas (CUR): 25, nebulizer gas (GS1): 50 and heater gas (GS2): 55, ion spray voltage: 5500 V, source temperature: 500°C; declustering potential (DP): 45 V, entrance potential (EP): 10
A B
O
N
OH N
D
D D
D O
OH
Figure 1: Chemical structures of (A) Niacin and (B) Nicotinic-d4 acid.
Citation: Vats P, Verma SM, Monif T (2016) Mechanistic Evaluation of Matrix Effect on Three Different Model of Mass Spectrometer by Using a Model Drug. J Anal Bioanal Tech 7: 314. doi:10.4172/2155-9872.1000314
Page 3 of 11
Volume 7 • Issue 3 • 1000314J Anal Bioanal TechISSN: 2155-9872 JABT, an open access journal
V, collision energy (CE): 11 V and collision cell exit potential (CXP): 2 V for both niacin and nicotinic-d4 acid.
On API-3000 - CAD: 8, CUR: 15 and nebulizer gas (NEB): 8, ion spray voltage: 5500 V, source temperature, 475°C, DP: 50 V, EP: 10 V, Focusing Potential (FP): 120 V, CE: 30 V and CXP: 14 V for both niacin and nicotinic-d4 acid.
In API-3200 and API-4000, mass parameters were kept same as both the instruments have identical turbo-V source design. Since API-3000 has different source design, mass parameters were optimized independently to get the desired response.
Sample preparation
Preparation of stock solutions, calibration standards and quality control samples: Stock solutions were prepared in dimethyl sulfoxide - acetonitrile (50: 50, v/v) at concentration of 5 mg/mL and 1 mg/mL for Niacin and Nicotinic-d4 acid, respectively. Working solutions of niacin prepared in methanol-water (50:50; v/v), were used to prepare calibration standards (CS) at eight different concentrations (50.6-25022.7 ng/mL) and at four concentrations (50.7, 129.9, 9992.7 and 19985.4 ng/mL) for quality controls (QC) by 2% spiking in human plasma. Blank human lithium heparin plasma was screened prior to spiking to ensure that it was free from endogenous interference at retention times of niacin and IS. The (bulk) spiked CS and QC samples were stored below -50°C and protected from light until analysis. The IS working solution (500.0 ng/mL) was prepared in methanol-water (50:50, v/v).
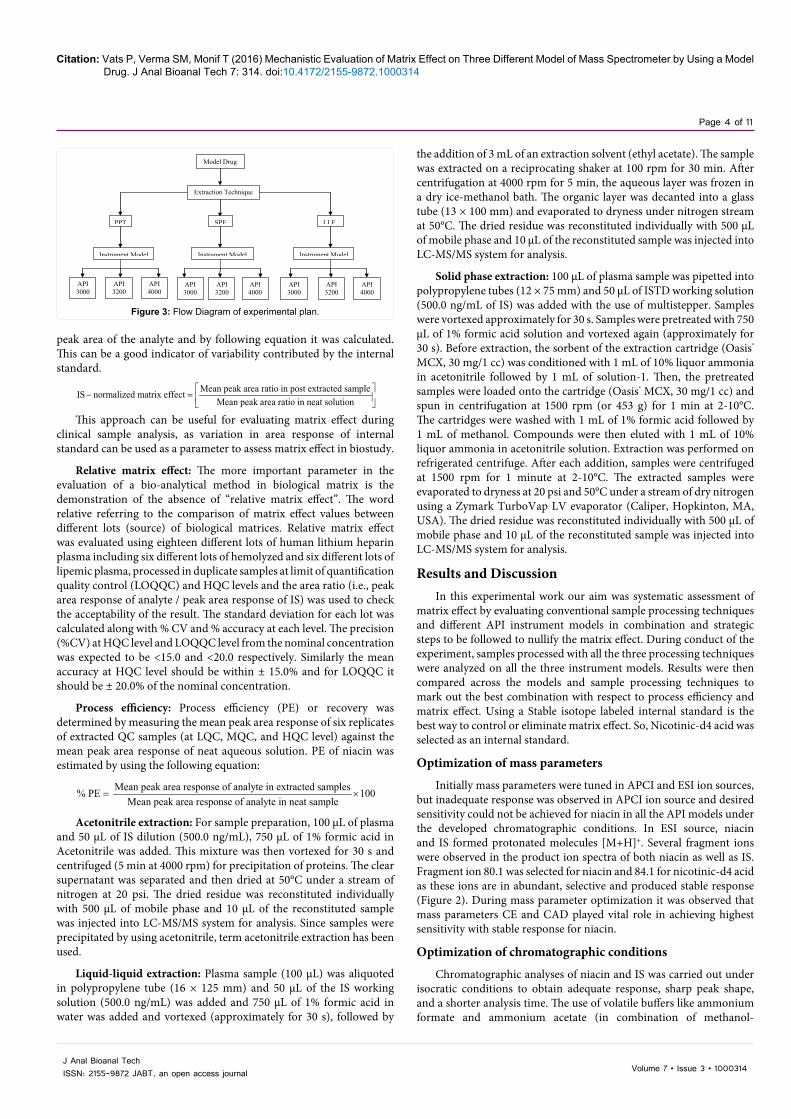
Experimental design
The main aim of this experimental design was to evaluate the role of sample processing and instrument model on Matrix effect (flow diagram, Figure 3) in synergy. So, selected parameters like recovery (process efficiency), absolute matrix effect and relative matrix effect performed according to USFDA [25], EMEA [26] guidelines with
described sample processing techniques and analyzed on different models of mass spectrometry.
Matrix effectMatrix effects are of two types, absolute and relative. The two main
techniques used to determine the degree of matrix effects (or absolute matrix effect) qualitatively as well as quantitatively on an LC-ESI-MS/MS method are post-column infusion and post-extraction addition method respectively.
Post-column infusion method: Matrix ion suppression effects on the MRM LC-MS/MS sensitivity were evaluated by the post-column analyte infusion experiment. A reference solution containing 500.0 ng/mL of niacin and IS in mobile phase was infused post-column via a ‘T’ connector into the mobile phase at 10 µL/min, employing an infusion pump. Aliquots of 10 µL of extracted blank plasma were then injected into the column by the auto sampler, and MRM LC-MS/MS chromatograms were acquired for niacin and IS. Any dip in the baseline upon injection of blank plasma would indicate ion suppression.
Post extraction addition technique: As extraction protocol involves a terminal drying step, hence spiking (addition of reference sample) was carried out in post-extracted blank plasma (normal plasma, hemolyzed plasma and lipemic plasma; 6 lots of each type of plasma) sample to perform matrix effect. The concentration of both niacin and IS in reference sample representing the final extracted concentrations in QC samples (at LQC, MQC and HQC level). The control sample (neat sample) was a reference solution prepared at an appropriate concentration in mobile phase.
Absolute matrix effect (ion suppression / ion-enhancement) was determined by the following equation:
The positive value represents the % of ion suppression and the negative value represents the % of ion enhancement.
For calculating the IS-normalized matrix effect of the method, peak area ratio (analyte peak area/ IS peak area) was considered instead of
Figure 2: MS-MS scans of Niacin and Nicotinic-d4 acid.
Citation: Vats P, Verma SM, Monif T (2016) Mechanistic Evaluation of Matrix Effect on Three Different Model of Mass Spectrometer by Using a Model Drug. J Anal Bioanal Tech 7: 314. doi:10.4172/2155-9872.1000314
Page 4 of 11
Volume 7 • Issue 3 • 1000314J Anal Bioanal TechISSN: 2155-9872 JABT, an open access journal
peak area of the analyte and by following equation it was calculated. This can be a good indicator of variability contributed by the internal standard.
Mean peak area ratio in post extracted sample IS normalized matrix effect Mean peak area ratio in neat solution
− =
This approach can be useful for evaluating matrix effect during clinical sample analysis, as variation in area response of internal standard can be used as a parameter to assess matrix effect in biostudy.
Relative matrix effect: The more important parameter in the evaluation of a bio-analytical method in biological matrix is the demonstration of the absence of “relative matrix effect”. The word relative referring to the comparison of matrix effect values between different lots (source) of biological matrices. Relative matrix effect was evaluated using eighteen different lots of human lithium heparin plasma including six different lots of hemolyzed and six different lots of lipemic plasma, processed in duplicate samples at limit of quantification quality control (LOQQC) and HQC levels and the area ratio (i.e., peak area response of analyte / peak area response of IS) was used to check the acceptability of the result. The standard deviation for each lot was calculated along with % CV and % accuracy at each level. The precision (%CV) at HQC level and LOQQC level from the nominal concentration was expected to be <15.0 and <20.0 respectively. Similarly the mean accuracy at HQC level should be within ± 15.0% and for LOQQC it should be ± 20.0% of the nominal concentration.
Process efficiency: Process efficiency (PE) or recovery was determined by measuring the mean peak area response of six replicates of extracted QC samples (at LQC, MQC, and HQC level) against the mean peak area response of neat aqueous solution. PE of niacin was estimated by using the following equation:
Mean peak area response of analyte in extracted samples % PE 100Mean peak area response of analyte in neat sample
= ×
Acetonitrile extraction: For sample preparation, 100 µL of plasma and 50 µL of IS dilution (500.0 ng/mL), 750 µL of 1% formic acid in Acetonitrile was added. This mixture was then vortexed for 30 s and centrifuged (5 min at 4000 rpm) for precipitation of proteins. The clear supernatant was separated and then dried at 50°C under a stream of nitrogen at 20 psi. The dried residue was reconstituted individually with 500 µL of mobile phase and 10 μL of the reconstituted sample was injected into LC-MS/MS system for analysis. Since samples were precipitated by using acetonitrile, term acetonitrile extraction has been used.
Liquid-liquid extraction: Plasma sample (100 µL) was aliquoted in polypropylene tube (16 × 125 mm) and 50 µL of the IS working solution (500.0 ng/mL) was added and 750 µL of 1% formic acid in water was added and vortexed (approximately for 30 s), followed by
the addition of 3 mL of an extraction solvent (ethyl acetate). The sample was extracted on a reciprocating shaker at 100 rpm for 30 min. After centrifugation at 4000 rpm for 5 min, the aqueous layer was frozen in a dry ice-methanol bath. The organic layer was decanted into a glass tube (13 × 100 mm) and evaporated to dryness under nitrogen stream at 50°C. The dried residue was reconstituted individually with 500 µL of mobile phase and 10 μL of the reconstituted sample was injected into LC-MS/MS system for analysis.
Solid phase extraction: 100 µL of plasma sample was pipetted into polypropylene tubes (12 × 75 mm) and 50 µL of ISTD working solution (500.0 ng/mL of IS) was added with the use of multistepper. Samples were vortexed approximately for 30 s. Samples were pretreated with 750 µL of 1% formic acid solution and vortexed again (approximately for 30 s). Before extraction, the sorbent of the extraction cartridge (Oasis® MCX, 30 mg/1 cc) was conditioned with 1 mL of 10% liquor ammonia in acetonitrile followed by 1 mL of solution-1. Then, the pretreated samples were loaded onto the cartridge (Oasis® MCX, 30 mg/1 cc) and spun in centrifugation at 1500 rpm (or 453 g) for 1 min at 2-10°C. The cartridges were washed with 1 mL of 1% formic acid followed by 1 mL of methanol. Compounds were then eluted with 1 mL of 10% liquor ammonia in acetonitrile solution. Extraction was performed on refrigerated centrifuge. After each addition, samples were centrifuged at 1500 rpm for 1 minute at 2-10°C. The extracted samples were evaporated to dryness at 20 psi and 50°C under a stream of dry nitrogen using a Zymark TurboVap LV evaporator (Caliper, Hopkinton, MA, USA). The dried residue was reconstituted individually with 500 µL of mobile phase and 10 μL of the reconstituted sample was injected into LC-MS/MS system for analysis.
Results and DiscussionIn this experimental work our aim was systematic assessment of
matrix effect by evaluating conventional sample processing techniques and different API instrument models in combination and strategic steps to be followed to nullify the matrix effect. During conduct of the experiment, samples processed with all the three processing techniques were analyzed on all the three instrument models. Results were then compared across the models and sample processing techniques to mark out the best combination with respect to process efficiency and matrix effect. Using a Stable isotope labeled internal standard is the best way to control or eliminate matrix effect. So, Nicotinic-d4 acid was selected as an internal standard.
Optimization of mass parameters
Initially mass parameters were tuned in APCI and ESI ion sources, but inadequate response was observed in APCI ion source and desired sensitivity could not be achieved for niacin in all the API models under the developed chromatographic conditions. In ESI source, niacin and IS formed protonated molecules [M+H]+. Several fragment ions were observed in the product ion spectra of both niacin as well as IS. Fragment ion 80.1 was selected for niacin and 84.1 for nicotinic-d4 acid as these ions are in abundant, selective and produced stable response (Figure 2). During mass parameter optimization it was observed that mass parameters CE and CAD played vital role in achieving highest sensitivity with stable response for niacin.
Optimization of chromatographic conditions
Chromatographic analyses of niacin and IS was carried out under isocratic conditions to obtain adequate response, sharp peak shape, and a shorter analysis time. The use of volatile buffers like ammonium formate and ammonium acetate (in combination of methanol-
Model Drug
Extraction Technique
PPT SPE LLE
Instrument Model Instrument Model
Instrument Model
API 3000
API 3200
API 4000
API 4000
API 3200
API 3000
API 4000
API 3200
API 3000
Figure 3: Flow Diagram of experimental plan.
Citation: Vats P, Verma SM, Monif T (2016) Mechanistic Evaluation of Matrix Effect on Three Different Model of Mass Spectrometer by Using a Model Drug. J Anal Bioanal Tech 7: 314. doi:10.4172/2155-9872.1000314
Page 5 of 11
Volume 7 • Issue 3 • 1000314J Anal Bioanal TechISSN: 2155-9872 JABT, an open access journal
acetonitrile) for the separation of niacin had been also evaluated. It was observed that the pH of mobile phase and selection of column were critical parameters. Chromatographic separation was tried using various combinations of methanol-acetonitrile, acidic buffers and additives (like formic acid, glacial acetic acid and liquor ammonia solution) on different C18, C8, cyano and phenyl reversed phase columns with 5 μm particle size (viz., several like Xterra C18, Chromolith RP-18, Atlantis HILLIC, Ascentis C8 Poroshell 120 EC-C18, Ascentis express, Sunshell C18, Kinetex C18, Hypurity advance, Zorbax SB-C18, Zorbax SB-CN, Discovery C18, Unisol C18, Luna C18(2), kinetex PFP and ACE C18 PFP). The analytes showed nonlinear behavior on Chromolith RP-18 column while HILLIC column was marked unsuitable due to co-eluting matrix compounds especially with haemolysed plasma samples. In most of the columns, the endogenous peak (adjacent to the peak of interest) merged with the target analyte i.e., niacin. Column with fused core technology was also evaluated to attain resolution between niacin and the endogenous peak, but due to high back pressure these column could not be used.
Inertsil® CN-3 column provided good peak shape for niacin with acetonitrile as organic component in combination with formic acid solution in mobile phase. Niacin and the endogenous compound were chromatographically well separated on Inertsil® CN-3 (150 × 4.6 mm, 5 µm) column with high S/N ratio for niacin. This could be due to lower carbon loading of the column, enabling the selectivity by base material of the column and lower carbon load reduces RT of niacin and increased high throughput. Additionally, column oven temperature was optimized to 45°C. With the increase in temperature to 45°C, resolution of peak of analyte from the other endogenous substances improved further.
Control of variablesIn order to draw the accurate results, except for the extraction
techniques and instrument models, other parameters which includes volume of plasma (aliquot volume); volume of addition for IS working solution, the concentration of IS working solution, pretreatment of the samples prior to extraction; final solvent composition of reconstituted extract, final reconstitution volume of the extracted samples, model of HPLC (Shimadzu) and LC parameters (like mobile phase, flow rate, analytical column, injection volume and rinsing solution) to be used on three different API models i.e., API-3200, API-3000, API-4000 for analysis were kept constant across analysis. Here, various variable factors had to be controlled to ensure precise comparison of results. Therefore for each extraction procedure, the equal volume of plasma (100 µL) was aliquoted, so that the starting endogenous matrix levels are identical in all methods; pretreatment was kept exactly same so that sample constitution is same prior to extraction; reconstitution composition is chosen same for all methods, to solubilize both highly polar and non-polar compounds, dried extract reconstituted with same volume (500 µL) so that the final concentration of endogenous matter is same across different processing techniques, injection volume was kept constant so that equal volume of sample is loaded onto the analytical column. Same analytical column was used on three instruments so that chromatographic separation and retention time is also same across instrument models. Chromatographic conditions like rinsing solution (acetonitrile-methanol-water, 60:20:20, v/v/v) composition and mobile phase composition was also kept alike on all three models for identical chromatographic separation.
Optimization of sample preparation
As the purpose of this research is to evaluate the role of sample processing technique on matrix effect, initially individual method was
optimized for each extraction technique which gives better results in terms of higher process efficiency and less matrix effect. In general, high throughput sample analysis has led the common practice of preparing samples by the simplest, fastest method possible, which often means using PPT. Although the PPT is quick and easy step to extract the target analyte from the biological matrix but fails to effectively remove enough of the endogenous plasma components (i.e., phospholipids).
During extraction step optimization, different protein precipitating agents like ACN, MeOH, acidic MeOH, basic MeOH, acidic ACN, and basic ACN were evaluated to increase the process efficiency. It was observed that in acidic condition, the process efficiency of niacin is increased but high value of % ion suppression (Table 1) was also noted. High value of % ion suppression leads to significant decrease in the S/N ratio of niacin and observed S/N value was less than 3 which is not an acceptable value as per current regulatory guidelines. Hence, further matrix evaluation exercises were not carried out with PPT technique as it was evident from the obtained results that PPT will lead to massive matrix effect. Besides this, samples processed by PPT technique were not clean and injection of these samples onto analytical column resulted in fluctuation of area response and retention time of analytes. This fluctuation might be due to the deposition of phospholipids on the analytical column and its impact on the subsequent analysis.
Niacin being a polar compound and zwitterionic in nature, liquid-liquid extraction was a method of choice as it can be easily be extracted out in any polar solvent [27,28]. Initially for LLE, ethyl acetate, tertiary butyl methyl ether (TBME), diethyl ether was tried to check the extraction efficiency for higher recovery. From the Table 2 data, we concluded that due to polar nature of niacin, the process efficiency is maximum in ethyl acetate which is also polar in nature. To further enhance the process efficiency and minimize the matrix
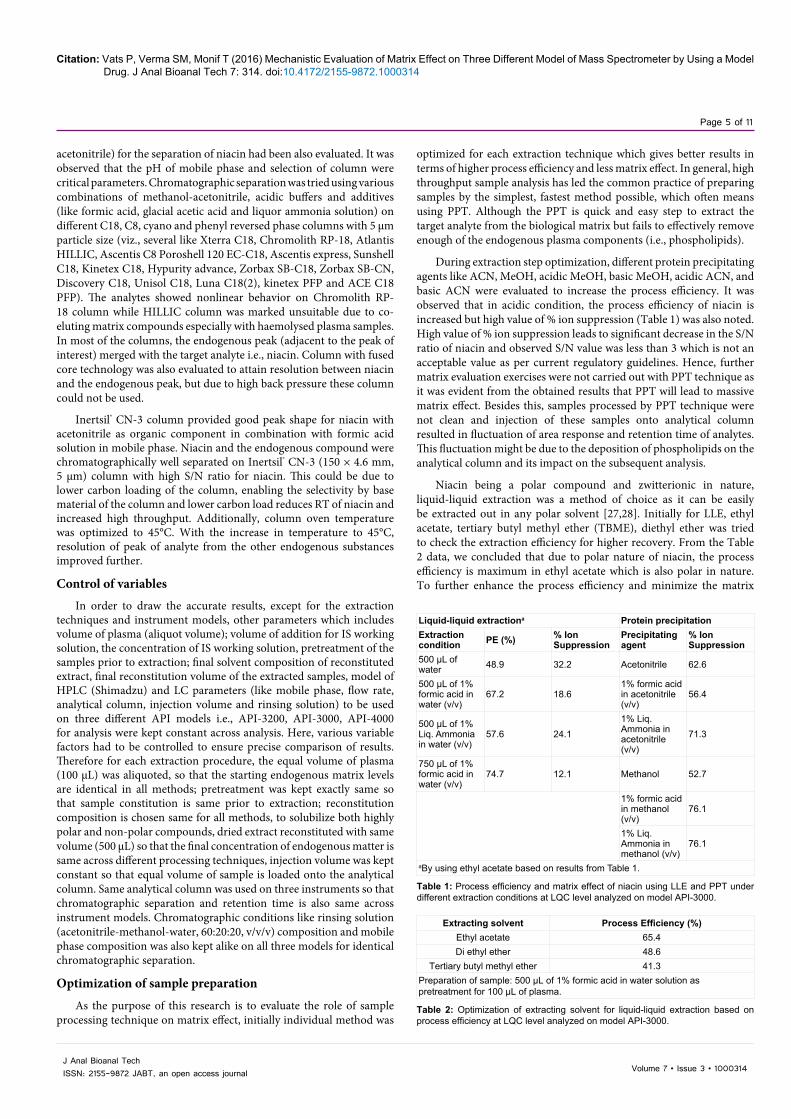
Liquid-liquid extractiona Protein precipitationExtraction condition PE (%) % Ion
SuppressionPrecipitating agent
% Ion Suppression
500 µL of water 48.9 32.2 Acetonitrile 62.6
500 µL of 1% formic acid in water (v/v)
67.2 18.61% formic acid in acetonitrile (v/v)
56.4
500 µL of 1% Liq. Ammonia in water (v/v)
57.6 24.11% Liq. Ammonia in acetonitrile (v/v)
71.3
750 µL of 1% formic acid in water (v/v)
74.7 12.1 Methanol 52.7
1% formic acid in methanol (v/v)
76.1
1% Liq. Ammonia in methanol (v/v)
76.1
aBy using ethyl acetate based on results from Table 1.
Table 1: Process efficiency and matrix effect of niacin using LLE and PPT under different extraction conditions at LQC level analyzed on model API-3000.
Extracting solvent Process Efficiency (%)Ethyl acetate 65.4Di ethyl ether 48.6
Tertiary butyl methyl ether 41.3Preparation of sample: 500 µL of 1% formic acid in water solution as pretreatment for 100 µL of plasma.
Table 2: Optimization of extracting solvent for liquid-liquid extraction based on process efficiency at LQC level analyzed on model API-3000.
Citation: Vats P, Verma SM, Monif T (2016) Mechanistic Evaluation of Matrix Effect on Three Different Model of Mass Spectrometer by Using a Model Drug. J Anal Bioanal Tech 7: 314. doi:10.4172/2155-9872.1000314
Page 6 of 11
Volume 7 • Issue 3 • 1000314J Anal Bioanal TechISSN: 2155-9872 JABT, an open access journal
effect composition of pretreatment solution was optimized. From various trials it was observed that sample pretreatment should be done with 750 µL of 1% formic acid in water (v/v) to get higher recovery and less matrix effect. Addition of acidic solution during sample preparation step caused the ionization of phospholipids and the ionized phospholipids (hydrophilic nature) remains in the aqueous layer which leads to minimized matrix effect. Finally LLE technique were developed using ethyl acetate as extracting solvent and formic acid solution as a pretreatment solution.
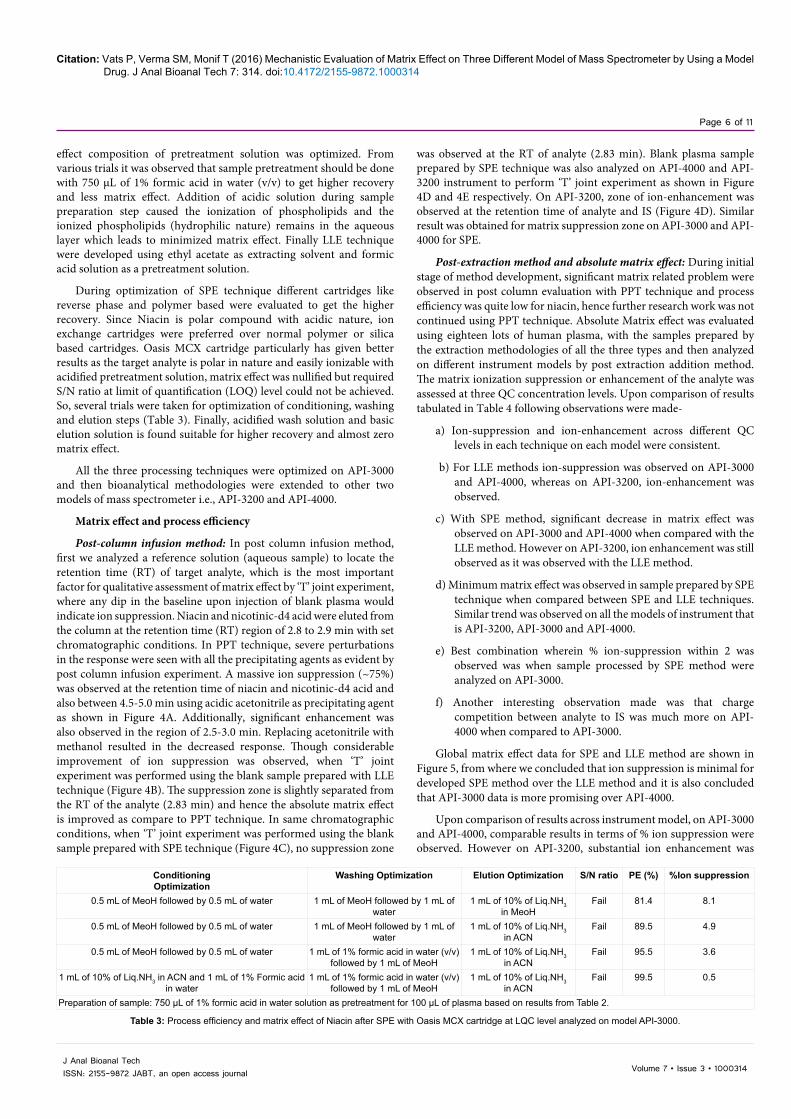
During optimization of SPE technique different cartridges like reverse phase and polymer based were evaluated to get the higher recovery. Since Niacin is polar compound with acidic nature, ion exchange cartridges were preferred over normal polymer or silica based cartridges. Oasis MCX cartridge particularly has given better results as the target analyte is polar in nature and easily ionizable with acidified pretreatment solution, matrix effect was nullified but required S/N ratio at limit of quantification (LOQ) level could not be achieved. So, several trials were taken for optimization of conditioning, washing and elution steps (Table 3). Finally, acidified wash solution and basic elution solution is found suitable for higher recovery and almost zero matrix effect.
All the three processing techniques were optimized on API-3000 and then bioanalytical methodologies were extended to other two models of mass spectrometer i.e., API-3200 and API-4000.
Matrix effect and process efficiency
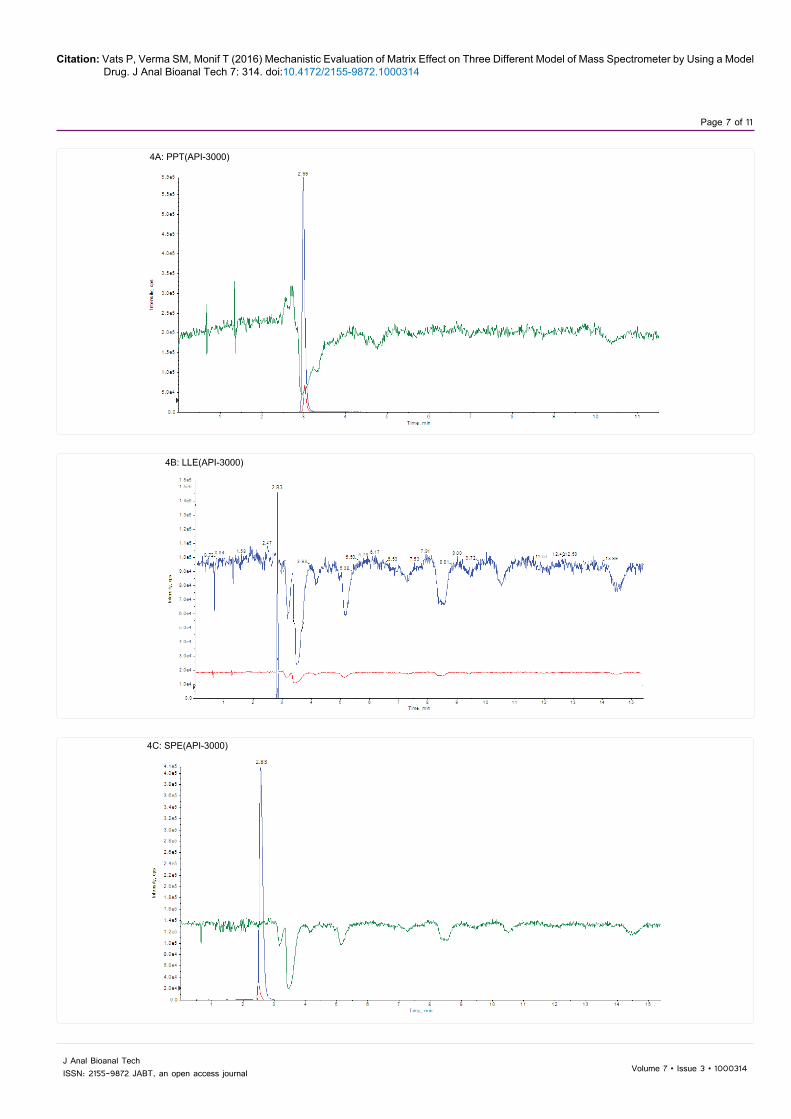
Post-column infusion method: In post column infusion method, first we analyzed a reference solution (aqueous sample) to locate the retention time (RT) of target analyte, which is the most important factor for qualitative assessment of matrix effect by ‘T’ joint experiment, where any dip in the baseline upon injection of blank plasma would indicate ion suppression. Niacin and nicotinic-d4 acid were eluted from the column at the retention time (RT) region of 2.8 to 2.9 min with set chromatographic conditions. In PPT technique, severe perturbations in the response were seen with all the precipitating agents as evident by post column infusion experiment. A massive ion suppression (~75%) was observed at the retention time of niacin and nicotinic-d4 acid and also between 4.5-5.0 min using acidic acetonitrile as precipitating agent as shown in Figure 4A. Additionally, significant enhancement was also observed in the region of 2.5-3.0 min. Replacing acetonitrile with methanol resulted in the decreased response. Though considerable improvement of ion suppression was observed, when ‘T’ joint experiment was performed using the blank sample prepared with LLE technique (Figure 4B). The suppression zone is slightly separated from the RT of the analyte (2.83 min) and hence the absolute matrix effect is improved as compare to PPT technique. In same chromatographic conditions, when ‘T’ joint experiment was performed using the blank sample prepared with SPE technique (Figure 4C), no suppression zone
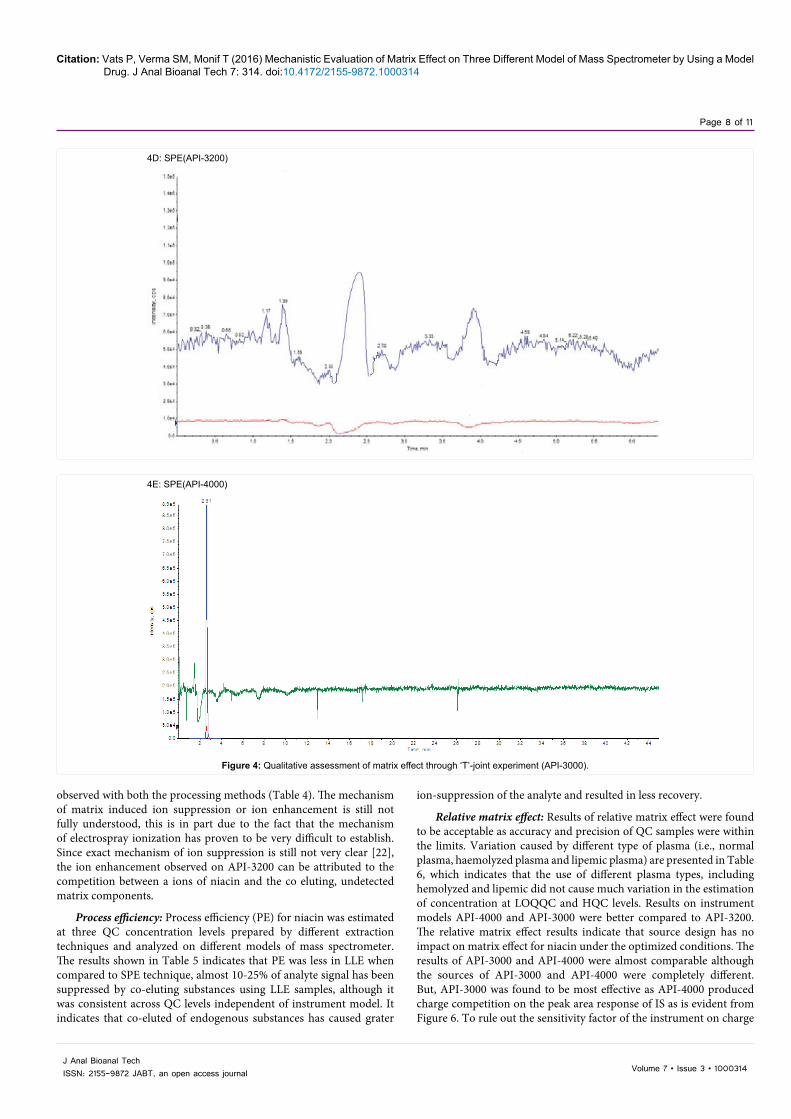
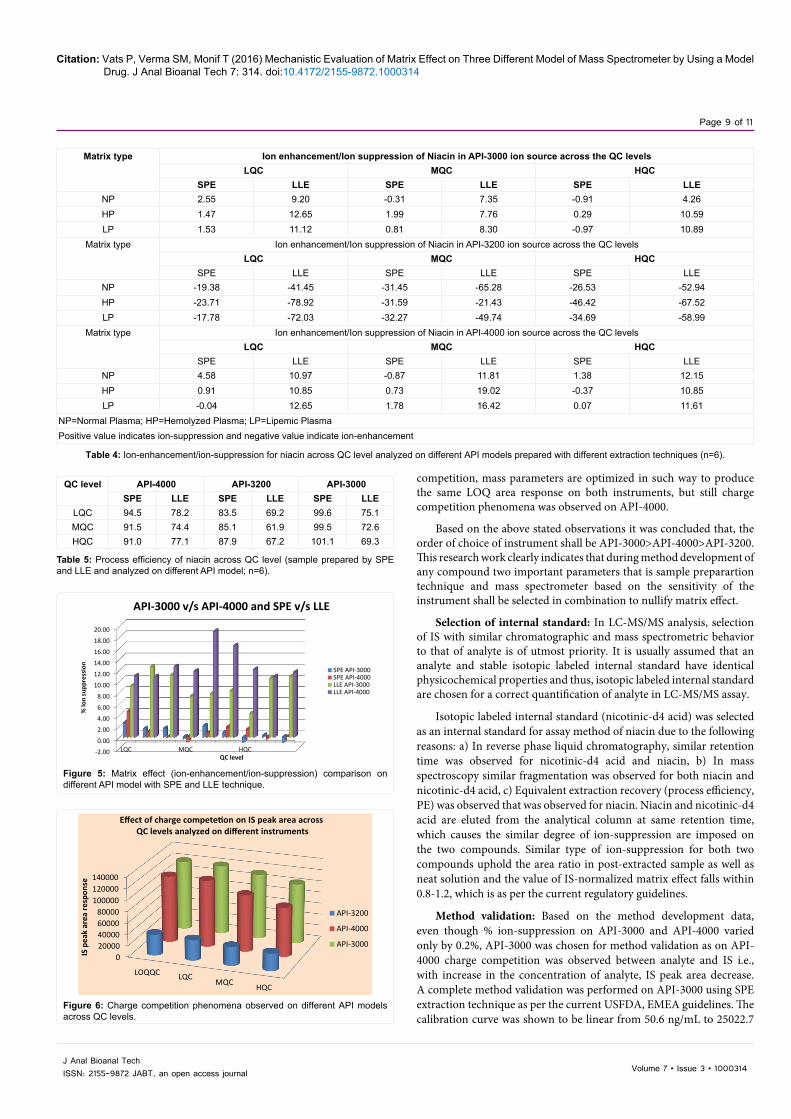
was observed at the RT of analyte (2.83 min). Blank plasma sample prepared by SPE technique was also analyzed on API-4000 and API-3200 instrument to perform ‘T’ joint experiment as shown in Figure 4D and 4E respectively. On API-3200, zone of ion-enhancement was observed at the retention time of analyte and IS (Figure 4D). Similar result was obtained for matrix suppression zone on API-3000 and API-4000 for SPE.
Post-extraction method and absolute matrix effect: During initial stage of method development, significant matrix related problem were observed in post column evaluation with PPT technique and process efficiency was quite low for niacin, hence further research work was not continued using PPT technique. Absolute Matrix effect was evaluated using eighteen lots of human plasma, with the samples prepared by the extraction methodologies of all the three types and then analyzed on different instrument models by post extraction addition method. The matrix ionization suppression or enhancement of the analyte was assessed at three QC concentration levels. Upon comparison of results tabulated in Table 4 following observations were made-
a) Ion-suppression and ion-enhancement across different QC levels in each technique on each model were consistent.
b) For LLE methods ion-suppression was observed on API-3000 and API-4000, whereas on API-3200, ion-enhancement was observed.
c) With SPE method, significant decrease in matrix effect was observed on API-3000 and API-4000 when compared with the LLE method. However on API-3200, ion enhancement was still observed as it was observed with the LLE method.
d) Minimum matrix effect was observed in sample prepared by SPE technique when compared between SPE and LLE techniques. Similar trend was observed on all the models of instrument that is API-3200, API-3000 and API-4000.
e) Best combination wherein % ion-suppression within 2 was observed was when sample processed by SPE method were analyzed on API-3000.
f) Another interesting observation made was that charge competition between analyte to IS was much more on API-4000 when compared to API-3000.
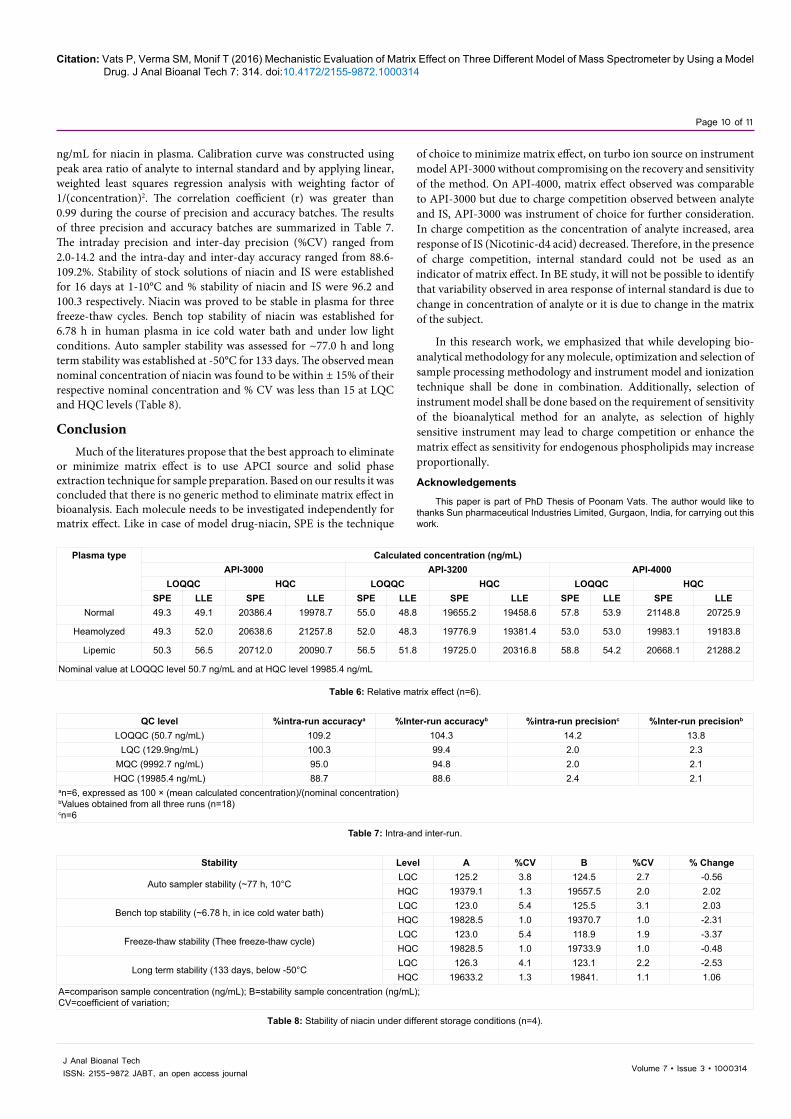
Global matrix effect data for SPE and LLE method are shown in Figure 5, from where we concluded that ion suppression is minimal for developed SPE method over the LLE method and it is also concluded that API-3000 data is more promising over API-4000.
Upon comparison of results across instrument model, on API-3000 and API-4000, comparable results in terms of % ion suppression were observed. However on API-3200, substantial ion enhancement was
ConditioningOptimization
Washing Optimization Elution Optimization S/N ratio PE (%) %Ion suppression
0.5 mL of MeoH followed by 0.5 mL of water 1 mL of MeoH followed by 1 mL of water
1 mL of 10% of Liq.NH3 in MeoH
Fail 81.4 8.1
0.5 mL of MeoH followed by 0.5 mL of water 1 mL of MeoH followed by 1 mL of water
1 mL of 10% of Liq.NH3 in ACN
Fail 89.5 4.9
0.5 mL of MeoH followed by 0.5 mL of water 1 mL of 1% formic acid in water (v/v) followed by 1 mL of MeoH
1 mL of 10% of Liq.NH3 in ACN
Fail 95.5 3.6
1 mL of 10% of Liq.NH3 in ACN and 1 mL of 1% Formic acid in water
1 mL of 1% formic acid in water (v/v) followed by 1 mL of MeoH
1 mL of 10% of Liq.NH3 in ACN
Fail 99.5 0.5
Preparation of sample: 750 µL of 1% formic acid in water solution as pretreatment for 100 µL of plasma based on results from Table 2.
Table 3: Process efficiency and matrix effect of Niacin after SPE with Oasis MCX cartridge at LQC level analyzed on model API-3000.
Citation: Vats P, Verma SM, Monif T (2016) Mechanistic Evaluation of Matrix Effect on Three Different Model of Mass Spectrometer by Using a Model Drug. J Anal Bioanal Tech 7: 314. doi:10.4172/2155-9872.1000314
Page 7 of 11
Volume 7 • Issue 3 • 1000314J Anal Bioanal TechISSN: 2155-9872 JABT, an open access journal
4A: PPT(API-3000)
4C: SPE(API-3000)
4B: LLE(API-3000)
Citation: Vats P, Verma SM, Monif T (2016) Mechanistic Evaluation of Matrix Effect on Three Different Model of Mass Spectrometer by Using a Model Drug. J Anal Bioanal Tech 7: 314. doi:10.4172/2155-9872.1000314
Page 8 of 11
Volume 7 • Issue 3 • 1000314J Anal Bioanal TechISSN: 2155-9872 JABT, an open access journal
4D: SPE(API-3200)
4E: SPE(API-4000)
Figure 4: Qualitative assessment of matrix effect through ‘T’-joint experiment (API-3000).
observed with both the processing methods (Table 4). The mechanism of matrix induced ion suppression or ion enhancement is still not fully understood, this is in part due to the fact that the mechanism of electrospray ionization has proven to be very difficult to establish. Since exact mechanism of ion suppression is still not very clear [22], the ion enhancement observed on API-3200 can be attributed to the competition between a ions of niacin and the co eluting, undetected matrix components.
Process efficiency: Process efficiency (PE) for niacin was estimated at three QC concentration levels prepared by different extraction techniques and analyzed on different models of mass spectrometer. The results shown in Table 5 indicates that PE was less in LLE when compared to SPE technique, almost 10-25% of analyte signal has been suppressed by co-eluting substances using LLE samples, although it was consistent across QC levels independent of instrument model. It indicates that co-eluted of endogenous substances has caused grater
ion-suppression of the analyte and resulted in less recovery.
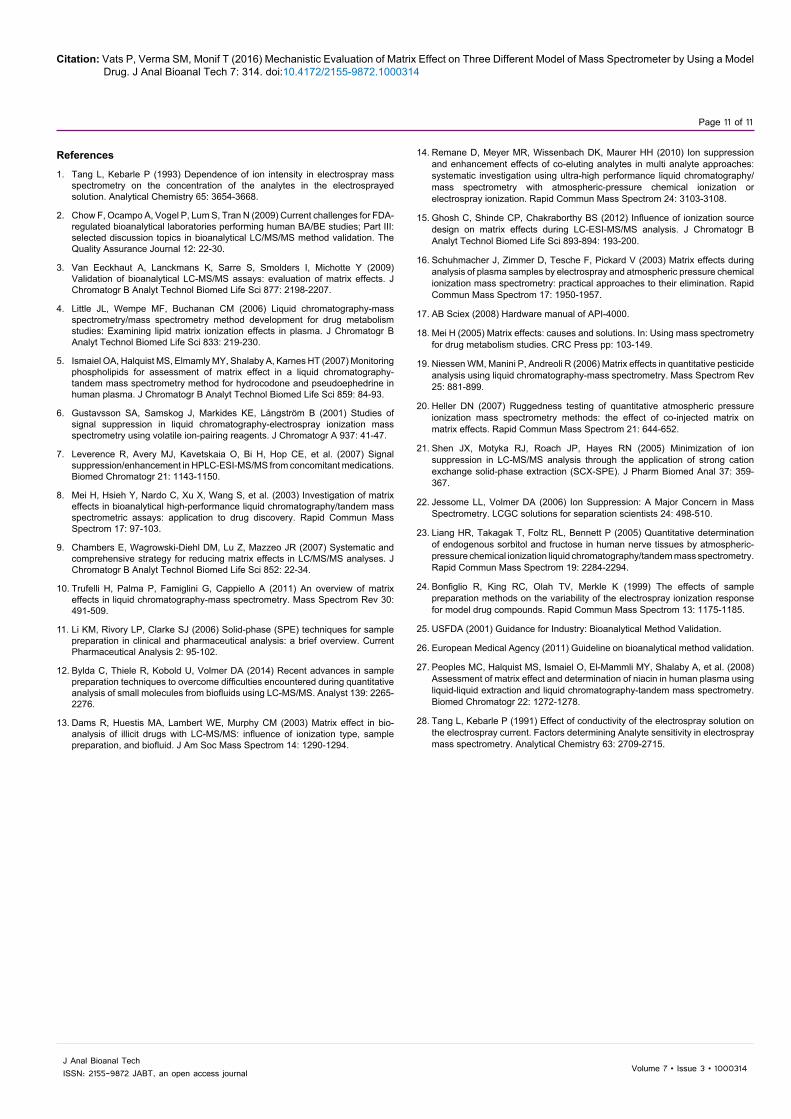
Relative matrix effect: Results of relative matrix effect were found to be acceptable as accuracy and precision of QC samples were within the limits. Variation caused by different type of plasma (i.e., normal plasma, haemolyzed plasma and lipemic plasma) are presented in Table 6, which indicates that the use of different plasma types, including hemolyzed and lipemic did not cause much variation in the estimation of concentration at LOQQC and HQC levels. Results on instrument models API-4000 and API-3000 were better compared to API-3200. The relative matrix effect results indicate that source design has no impact on matrix effect for niacin under the optimized conditions. The results of API-3000 and API-4000 were almost comparable although the sources of API-3000 and API-4000 were completely different. But, API-3000 was found to be most effective as API-4000 produced charge competition on the peak area response of IS as is evident from Figure 6. To rule out the sensitivity factor of the instrument on charge
Citation: Vats P, Verma SM, Monif T (2016) Mechanistic Evaluation of Matrix Effect on Three Different Model of Mass Spectrometer by Using a Model Drug. J Anal Bioanal Tech 7: 314. doi:10.4172/2155-9872.1000314
Page 9 of 11
Volume 7 • Issue 3 • 1000314J Anal Bioanal TechISSN: 2155-9872 JABT, an open access journal
competition, mass parameters are optimized in such way to produce the same LOQ area response on both instruments, but still charge competition phenomena was observed on API-4000.
Based on the above stated observations it was concluded that, the order of choice of instrument shall be API-3000>API-4000>API-3200. This research work clearly indicates that during method development of any compound two important parameters that is sample preparartion technique and mass spectrometer based on the sensitivity of the instrument shall be selected in combination to nullify matrix effect.
Selection of internal standard: In LC-MS/MS analysis, selection of IS with similar chromatographic and mass spectrometric behavior to that of analyte is of utmost priority. It is usually assumed that an analyte and stable isotopic labeled internal standard have identical physicochemical properties and thus, isotopic labeled internal standard are chosen for a correct quantification of analyte in LC-MS/MS assay.
Isotopic labeled internal standard (nicotinic-d4 acid) was selected as an internal standard for assay method of niacin due to the following reasons: a) In reverse phase liquid chromatography, similar retention time was observed for nicotinic-d4 acid and niacin, b) In mass spectroscopy similar fragmentation was observed for both niacin and nicotinic-d4 acid, c) Equivalent extraction recovery (process efficiency, PE) was observed that was observed for niacin. Niacin and nicotinic-d4 acid are eluted from the analytical column at same retention time, which causes the similar degree of ion-suppression are imposed on the two compounds. Similar type of ion-suppression for both two compounds uphold the area ratio in post-extracted sample as well as neat solution and the value of IS-normalized matrix effect falls within 0.8-1.2, which is as per the current regulatory guidelines.
Method validation: Based on the method development data, even though % ion-suppression on API-3000 and API-4000 varied only by 0.2%, API-3000 was chosen for method validation as on API-4000 charge competition was observed between analyte and IS i.e., with increase in the concentration of analyte, IS peak area decrease. A complete method validation was performed on API-3000 using SPE extraction technique as per the current USFDA, EMEA guidelines. The calibration curve was shown to be linear from 50.6 ng/mL to 25022.7
Matrix type Ion enhancement/Ion suppression of Niacin in API-3000 ion source across the QC levelsLQC MQC HQC
SPE LLE SPE LLE SPE LLENP 2.55 9.20 -0.31 7.35 -0.91 4.26HP 1.47 12.65 1.99 7.76 0.29 10.59LP 1.53 11.12 0.81 8.30 -0.97 10.89
Matrix type Ion enhancement/Ion suppression of Niacin in API-3200 ion source across the QC levelsLQC MQC HQC
SPE LLE SPE LLE SPE LLENP -19.38 -41.45 -31.45 -65.28 -26.53 -52.94HP -23.71 -78.92 -31.59 -21.43 -46.42 -67.52LP -17.78 -72.03 -32.27 -49.74 -34.69 -58.99
Matrix type Ion enhancement/Ion suppression of Niacin in API-4000 ion source across the QC levelsLQC MQC HQC
SPE LLE SPE LLE SPE LLENP 4.58 10.97 -0.87 11.81 1.38 12.15HP 0.91 10.85 0.73 19.02 -0.37 10.85LP -0.04 12.65 1.78 16.42 0.07 11.61
NP=Normal Plasma; HP=Hemolyzed Plasma; LP=Lipemic PlasmaPositive value indicates ion-suppression and negative value indicate ion-enhancement
Table 4: Ion-enhancement/ion-suppression for niacin across QC level analyzed on different API models prepared with different extraction techniques (n=6).
-2.00
0.00
2.00
4.00
6.00
8.00
10.00
12.00
14.00
16.00
18.00
20.00
LQC MQC HQC
% Io
n su
ppre
ssio
n
QC level
API-3000 v/s API-4000 and SPE v/s LLE
SPE API-3000SPE API-4000LLE API-3000LLE API-4000
Figure 5: Matrix effect (ion-enhancement/ion-suppression) comparison on different API model with SPE and LLE technique.
020000400006000080000
100000120000140000
LOQQC LQCMQC HQC
IS p
eak
area
resp
onse
Effect of charge competetion on IS peak area acrossQC levels analyzed on different instruments
API-3200
API-4000
API-3000
Figure 6: Charge competition phenomena observed on different API models across QC levels.
QC level API-4000 API-3200 API-3000SPE LLE SPE LLE SPE LLE
LQC 94.5 78.2 83.5 69.2 99.6 75.1MQC 91.5 74.4 85.1 61.9 99.5 72.6HQC 91.0 77.1 87.9 67.2 101.1 69.3
Table 5: Process efficiency of niacin across QC level (sample prepared by SPE and LLE and analyzed on different API model; n=6).
Citation: Vats P, Verma SM, Monif T (2016) Mechanistic Evaluation of Matrix Effect on Three Different Model of Mass Spectrometer by Using a Model Drug. J Anal Bioanal Tech 7: 314. doi:10.4172/2155-9872.1000314
Page 10 of 11
Volume 7 • Issue 3 • 1000314J Anal Bioanal TechISSN: 2155-9872 JABT, an open access journal
ng/mL for niacin in plasma. Calibration curve was constructed using peak area ratio of analyte to internal standard and by applying linear, weighted least squares regression analysis with weighting factor of 1/(concentration)2. The correlation coefficient (r) was greater than 0.99 during the course of precision and accuracy batches. The results of three precision and accuracy batches are summarized in Table 7. The intraday precision and inter-day precision (%CV) ranged from 2.0-14.2 and the intra-day and inter-day accuracy ranged from 88.6-109.2%. Stability of stock solutions of niacin and IS were established for 16 days at 1-10°C and % stability of niacin and IS were 96.2 and 100.3 respectively. Niacin was proved to be stable in plasma for three freeze-thaw cycles. Bench top stability of niacin was established for 6.78 h in human plasma in ice cold water bath and under low light conditions. Auto sampler stability was assessed for ~77.0 h and long term stability was established at -50°C for 133 days. The observed mean nominal concentration of niacin was found to be within ± 15% of their respective nominal concentration and % CV was less than 15 at LQC and HQC levels (Table 8).
ConclusionMuch of the literatures propose that the best approach to eliminate
or minimize matrix effect is to use APCI source and solid phase extraction technique for sample preparation. Based on our results it was concluded that there is no generic method to eliminate matrix effect in bioanalysis. Each molecule needs to be investigated independently for matrix effect. Like in case of model drug-niacin, SPE is the technique
Plasma type Calculated concentration (ng/mL)API-3000 API-3200 API-4000
LOQQC HQC LOQQC HQC LOQQC HQCSPE LLE SPE LLE SPE LLE SPE LLE SPE LLE SPE LLE
Normal 49.3 49.1 20386.4 19978.7 55.0 48.8 19655.2 19458.6 57.8 53.9 21148.8 20725.9
Heamolyzed 49.3 52.0 20638.6 21257.8 52.0 48.3 19776.9 19381.4 53.0 53.0 19983.1 19183.8
Lipemic 50.3 56.5 20712.0 20090.7 56.5 51.8 19725.0 20316.8 58.8 54.2 20668.1 21288.2
Nominal value at LOQQC level 50.7 ng/mL and at HQC level 19985.4 ng/mL
Table 6: Relative matrix effect (n=6).
QC level %intra-run accuracya %Inter-run accuracyb %intra-run precisionc %Inter-run precisionb
LOQQC (50.7 ng/mL) 109.2 104.3 14.2 13.8LQC (129.9ng/mL) 100.3 99.4 2.0 2.3
MQC (9992.7 ng/mL) 95.0 94.8 2.0 2.1HQC (19985.4 ng/mL) 88.7 88.6 2.4 2.1
an=6, expressed as 100 × (mean calculated concentration)/(nominal concentration) bValues obtained from all three runs (n=18) cn=6
Table 7: Intra-and inter-run.
Stability Level A %CV B %CV % Change
Auto sampler stability (~77 h, 10°CLQC 125.2 3.8 124.5 2.7 -0.56HQC 19379.1 1.3 19557.5 2.0 2.02
Bench top stability (~6.78 h, in ice cold water bath)LQC 123.0 5.4 125.5 3.1 2.03HQC 19828.5 1.0 19370.7 1.0 -2.31
Freeze-thaw stability (Thee freeze-thaw cycle)LQC 123.0 5.4 118.9 1.9 -3.37HQC 19828.5 1.0 19733.9 1.0 -0.48
Long term stability (133 days, below -50°CLQC 126.3 4.1 123.1 2.2 -2.53HQC 19633.2 1.3 19841. 1.1 1.06
A=comparison sample concentration (ng/mL); B=stability sample concentration (ng/mL);CV=coefficient of variation;
Table 8: Stability of niacin under different storage conditions (n=4).
of choice to minimize matrix effect, on turbo ion source on instrument model API-3000 without compromising on the recovery and sensitivity of the method. On API-4000, matrix effect observed was comparable to API-3000 but due to charge competition observed between analyte and IS, API-3000 was instrument of choice for further consideration. In charge competition as the concentration of analyte increased, area response of IS (Nicotinic-d4 acid) decreased. Therefore, in the presence of charge competition, internal standard could not be used as an indicator of matrix effect. In BE study, it will not be possible to identify that variability observed in area response of internal standard is due to change in concentration of analyte or it is due to change in the matrix of the subject.
In this research work, we emphasized that while developing bio-analytical methodology for any molecule, optimization and selection of sample processing methodology and instrument model and ionization technique shall be done in combination. Additionally, selection of instrument model shall be done based on the requirement of sensitivity of the bioanalytical method for an analyte, as selection of highly sensitive instrument may lead to charge competition or enhance the matrix effect as sensitivity for endogenous phospholipids may increase proportionally.
Acknowledgements
This paper is part of PhD Thesis of Poonam Vats. The author would like to thanks Sun pharmaceutical Industries Limited, Gurgaon, India, for carrying out this work.
Citation: Vats P, Verma SM, Monif T (2016) Mechanistic Evaluation of Matrix Effect on Three Different Model of Mass Spectrometer by Using a Model Drug. J Anal Bioanal Tech 7: 314. doi:10.4172/2155-9872.1000314
Page 11 of 11
Volume 7 • Issue 3 • 1000314J Anal Bioanal TechISSN: 2155-9872 JABT, an open access journal
References
1. Tang L, Kebarle P (1993) Dependence of ion intensity in electrospray massspectrometry on the concentration of the analytes in the electrosprayedsolution. Analytical Chemistry 65: 3654-3668.
2. Chow F, Ocampo A, Vogel P, Lum S, Tran N (2009) Current challenges for FDA-regulated bioanalytical laboratories performing human BA/BE studies; Part III:selected discussion topics in bioanalytical LC/MS/MS method validation. TheQuality Assurance Journal 12: 22-30.
3. Van Eeckhaut A, Lanckmans K, Sarre S, Smolders I, Michotte Y (2009)Validation of bioanalytical LC-MS/MS assays: evaluation of matrix effects. JChromatogr B Analyt Technol Biomed Life Sci 877: 2198-2207.
4. Little JL, Wempe MF, Buchanan CM (2006) Liquid chromatography-massspectrometry/mass spectrometry method development for drug metabolismstudies: Examining lipid matrix ionization effects in plasma. J Chromatogr BAnalyt Technol Biomed Life Sci 833: 219-230.
5. Ismaiel OA, Halquist MS, Elmamly MY, Shalaby A, Karnes HT (2007) Monitoring phospholipids for assessment of matrix effect in a liquid chromatography-tandem mass spectrometry method for hydrocodone and pseudoephedrine inhuman plasma. J Chromatogr B Analyt Technol Biomed Life Sci 859: 84-93.
6. Gustavsson SA, Samskog J, Markides KE, Långström B (2001) Studies ofsignal suppression in liquid chromatography-electrospray ionization massspectrometry using volatile ion-pairing reagents. J Chromatogr A 937: 41-47.
7. Leverence R, Avery MJ, Kavetskaia O, Bi H, Hop CE, et al. (2007) Signalsuppression/enhancement in HPLC-ESI-MS/MS from concomitant medications. Biomed Chromatogr 21: 1143-1150.
8. Mei H, Hsieh Y, Nardo C, Xu X, Wang S, et al. (2003) Investigation of matrix effects in bioanalytical high-performance liquid chromatography/tandem massspectrometric assays: application to drug discovery. Rapid Commun MassSpectrom 17: 97-103.
9. Chambers E, Wagrowski-Diehl DM, Lu Z, Mazzeo JR (2007) Systematic andcomprehensive strategy for reducing matrix effects in LC/MS/MS analyses. JChromatogr B Analyt Technol Biomed Life Sci 852: 22-34.
10. Trufelli H, Palma P, Famiglini G, Cappiello A (2011) An overview of matrixeffects in liquid chromatography-mass spectrometry. Mass Spectrom Rev 30:491-509.
11. Li KM, Rivory LP, Clarke SJ (2006) Solid-phase (SPE) techniques for samplepreparation in clinical and pharmaceutical analysis: a brief overview. CurrentPharmaceutical Analysis 2: 95-102.
12. Bylda C, Thiele R, Kobold U, Volmer DA (2014) Recent advances in samplepreparation techniques to overcome difficulties encountered during quantitative analysis of small molecules from biofluids using LC-MS/MS. Analyst 139: 2265-2276.
13. Dams R, Huestis MA, Lambert WE, Murphy CM (2003) Matrix effect in bio-analysis of illicit drugs with LC-MS/MS: influence of ionization type, sample preparation, and biofluid. J Am Soc Mass Spectrom 14: 1290-1294.
14. Remane D, Meyer MR, Wissenbach DK, Maurer HH (2010) Ion suppressionand enhancement effects of co-eluting analytes in multi analyte approaches:systematic investigation using ultra-high performance liquid chromatography/mass spectrometry with atmospheric-pressure chemical ionization orelectrospray ionization. Rapid Commun Mass Spectrom 24: 3103-3108.
15. Ghosh C, Shinde CP, Chakraborthy BS (2012) Influence of ionization source design on matrix effects during LC-ESI-MS/MS analysis. J Chromatogr BAnalyt Technol Biomed Life Sci 893-894: 193-200.
16. Schuhmacher J, Zimmer D, Tesche F, Pickard V (2003) Matrix effects duringanalysis of plasma samples by electrospray and atmospheric pressure chemical ionization mass spectrometry: practical approaches to their elimination. RapidCommun Mass Spectrom 17: 1950-1957.
17. AB Sciex (2008) Hardware manual of API-4000.
18. Mei H (2005) Matrix effects: causes and solutions. In: Using mass spectrometry for drug metabolism studies. CRC Press pp: 103-149.
19. Niessen WM, Manini P, Andreoli R (2006) Matrix effects in quantitative pesticide analysis using liquid chromatography-mass spectrometry. Mass Spectrom Rev 25: 881-899.
20. Heller DN (2007) Ruggedness testing of quantitative atmospheric pressureionization mass spectrometry methods: the effect of co-injected matrix onmatrix effects. Rapid Commun Mass Spectrom 21: 644-652.
21. Shen JX, Motyka RJ, Roach JP, Hayes RN (2005) Minimization of ion suppression in LC-MS/MS analysis through the application of strong cationexchange solid-phase extraction (SCX-SPE). J Pharm Biomed Anal 37: 359-367.
22. Jessome LL, Volmer DA (2006) Ion Suppression: A Major Concern in MassSpectrometry. LCGC solutions for separation scientists 24: 498-510.
23. Liang HR, Takagak T, Foltz RL, Bennett P (2005) Quantitative determinationof endogenous sorbitol and fructose in human nerve tissues by atmospheric-pressure chemical ionization liquid chromatography/tandem mass spectrometry. Rapid Commun Mass Spectrom 19: 2284-2294.
24. Bonfiglio R, King RC, Olah TV, Merkle K (1999) The effects of sample preparation methods on the variability of the electrospray ionization responsefor model drug compounds. Rapid Commun Mass Spectrom 13: 1175-1185.
25. USFDA (2001) Guidance for Industry: Bioanalytical Method Validation.
26. European Medical Agency (2011) Guideline on bioanalytical method validation.
27. Peoples MC, Halquist MS, Ismaiel O, El-Mammli MY, Shalaby A, et al. (2008)Assessment of matrix effect and determination of niacin in human plasma using liquid-liquid extraction and liquid chromatography-tandem mass spectrometry.Biomed Chromatogr 22: 1272-1278.
28. Tang L, Kebarle P (1991) Effect of conductivity of the electrospray solution onthe electrospray current. Factors determining Analyte sensitivity in electrospray mass spectrometry. Analytical Chemistry 63: 2709-2715.