
MECHANISMS OF POLYUNSATURATED FATTY...
147
MECHANISMS OF POLYUNSATURATED FATTY ACID ALTERATIONS IN CYSTIC FIBROSIS By Sarah Wanjiku Njoroge Dissertation Submitted to the Faculty of the Graduate School of Vanderbilt University in partial fulfillment of the requirements for the degree of DOCTOR OF PHILOSOPHY in Pathology August, 2013 Nashville, Tennessee Approved: Michael Laposata M. D., Ph. D Adam Seegmiller M. D., Ph. D Andrew Bremer M. D., Ph. D Sean Davies Ph. D Larry Swift Ph. D W. Gray Jerome Ph. D., Chair
Transcript of MECHANISMS OF POLYUNSATURATED FATTY...

MECHANISMS OF POLYUNSATURATED FATTY ACID ALTERATIONS IN
CYSTIC FIBROSIS
By
Sarah Wanjiku Njoroge
Dissertation
Submitted to the Faculty of the
Graduate School of Vanderbilt University
in partial fulfillment of the requirements
for the degree of
DOCTOR OF PHILOSOPHY
in
Pathology
August, 2013
Nashville, Tennessee
Approved:
Michael Laposata M. D., Ph. D
Adam Seegmiller M. D., Ph. D
Andrew Bremer M. D., Ph. D
Sean Davies Ph. D
Larry Swift Ph. D
W. Gray Jerome Ph. D., Chair

ii
To my amazing parents, Mom and Dad, infinitely loving and supportive
and
To my beloved fiancé, Adam, who is my everything

iii
ACKNOWLEDGEMENTS
I would first like to thank my wonderful parents, mom and dad, for everything
you have given me. Thank you for teaching me to strive hard to achieve my goals. Thank
you, dad, for instilling in me a deep love for chemistry, and for introducing me to a
laboratory environment at a very early age. Above all, thank you both for your never-
ending love, support, encouragement and sacrifice, without which I would never have
made it to this point. I love you so much and all I wish to do is make you proud.
I would also like to thank my fiancé Adam, the love of my life. You have been
there with me through every step of graduate school, to celebrate the highs and get over
the lows. Thank you for your constant love and encouragement-you somehow managed
to brighten up my worst lab days. I am blessed to have you by my side and thank God for
you every day.
I would also like to thank my sister, Elizabeth, for being my greatest confidant.
And my brother, Danson, for being a constant source of joy.
Last, but certainly not least, I am truly grateful to all the people who have helped
me to grow as a scientist. The only thing better than one amazing mentor is two
phenomenal ones. Dr. Seegmiller and Dr. Laposata, you have both taught me more than I
could ever give you credit for here. Thank you for being such wonderful role-models, for
supporting my career goals, and for pushing me to be the best I can be. Go Red Sox! And
to each of the members of my dissertation committee, I am forever thankful for your
continued guidance, advice and support.

iv
TABLE OF CONTENTS
Page
DEDICATION .................................................................................................................... ii
ACKNOWLEDGEMENTS ............................................................................................... iii
LIST OF FIGURES ........................................................................................................... vi
LIST OF TABLES ............................................................................................................. ix
LIST OF ABBREVIATIONS ..............................................................................................x
CHAPTER
I. INTRODUCTION ............................................................................................................1
Objective ..................................................................................................................1
Molecular structure and function of the cystic fibrosis transmembrane
conductance regulator (CFTR) ................................................................................3
CFTR gene class mutations .....................................................................................6
Class I mutations ..........................................................................................6
Class II mutations ........................................................................................7
Class III mutations .......................................................................................8
Class IV mutations .......................................................................................8
Class V mutations ........................................................................................9
Class VI mutations .......................................................................................9
Clinical features of cystic fibrosis ............................................................................9
Fatty acid abnormalities in cystic fibrosis .............................................................11
Fatty acid abnormalities in CF patients .....................................................11
Fatty acid abnormalities in CF model systems ..........................................13
Rationale for current studies ..................................................................................14
II. FATTY ACID CHANGES IN CYSTIC FIBROSIS RESULT FROM INCREASED
EXPRESSION AND ACTIVITY OF DESATURASE METABOLIC ENZYMES ........16
Introduction ............................................................................................................16
Experimental procedures .......................................................................................17
Materials ....................................................................................................17
Cell culture .................................................................................................18

v
Mice ...........................................................................................................18
Total fatty acid analysis .............................................................................19
Fatty acid radiolabeling experiments .........................................................21
Quantitative real-time PCR ........................................................................22
Western blotting .........................................................................................24
Eicosanoid ELISA .....................................................................................24
Cyclooxygenase-2 (COX-2) inhibition ......................................................24
Results ....................................................................................................................25
Discussion ..............................................................................................................51
Mechanisms of PUFA alterations in CF ....................................................51
Role of PUFA alterations in CF pathophysiology .....................................54
III. EFFECT OF DHA AND EPA SUPPLEMENTATION ON PUFA METABOLISM
AND THE PATHOGENESIS OF CYSTIC FIBROSIS ...................................................57
Introduction ............................................................................................................57
Experimental procedures .......................................................................................58
Fatty acid supplementation ........................................................................58
Mice ...........................................................................................................59
Histopathology ...........................................................................................60
Results ....................................................................................................................61
Discussion ..............................................................................................................83
DHA and EPA supplementation in cultured CF cells ................................83
Retroconversion of DHA to EPA ..............................................................84
DHA and EPA supplementation in cftrtm1Unc
mice ....................................85
IV. NEW FINDINGS AND CONCLUSIONS ..................................................................91
Introduction ............................................................................................................91
Experimental procedures .......................................................................................93
HPLC superoxide measurements ...............................................................93
Antioxidant treatment ................................................................................94
Western blotting .........................................................................................95
Results ....................................................................................................................95
Conclusions ..........................................................................................................102
Proposed mechanism linking CFTR mutations to PUFA alterations ......103
Potential impact on therapy .....................................................................110
BIBLIOGRAPHY ............................................................................................................115

vi
LIST OF FIGURES
Figure Page
1. Diagram of PUFA metabolism through the n-6 and n-3 pathways ...............................2
2. Diagram showing the different domains of the CFTR protein ......................................4
3. Fatty acid composition of sense and antisense bronchial epithelial cells ....................26
4. Fatty acid composition of C38 and IB3 bronchial epithelial cells ...............................27
5. Metabolism of LA and LNA through the n-6 and n-3 pathways in 16HBE cells .......29
6. Metabolism of AA and EPA through the n-6 and n-3 pathways in 16HBE cells ........30
7. Relative mRNA and protein expression of PUFA metabolic enzymes in the n-6
and n-3 pathways .........................................................................................................32
8. Metabolism of 14
C-22:5n-3 in 16HBE cells.................................................................33
9. Diagram of the oxidative metabolism of AA, EPA and DHA .....................................34
10. Relative mRNA expression of eicosanoid synthesis enzymes in 16HBE cells ...........35
11. Relative mRNA expression of PGE2 receptor subtypes in 16HBE cells .....................36
12. Relative COX-2 mRNA expression in 16HBE cells following COX-2 siRNA
knockdown ...................................................................................................................37
13. Metabolism of AA through the n-6 pathway in 16HBE cells following COX-2
inhibition ......................................................................................................................39
14. Metabolism of EPA through the n-3 pathway in 16HBE cells following COX-2
inhibition ......................................................................................................................40
15. Relative mRNA expression of Δ5 and Δ6-desaturase enzymes in 16HBE cells
following COX-2 inhibition .........................................................................................41

vii
16. Total body weight and percent survival in cftrtm1Unc
mice ...........................................42
17. LA to AA metabolism in CF-related organs of cftrtm1Unc
mice....................................45
18. LA to AA metabolism in non CF-related organs and the corresponding PUFA
metabolic enzyme expression in cftrtm1Unc
mice ..........................................................47
19. Metabolism of saturated and monounsaturated fatty acids in the lung, ileum and
pancreas of cftrtm1Unc
mice ............................................................................................48
20. Relative mRNA expression of eicosanoid synthesis enzymes in cftrtm1Unc
mice ........50
21. Diagram of polyunsaturated fatty acid and eicosanoid changes in CF ........................56
22. Total fatty acid composition of 16HBE cells with or without DHA
supplementation ...........................................................................................................62
23. Metabolism of LA and LNA through the n-6 and n-3 pathways in 16HBE cells
supplemented with DHA..............................................................................................63
24. Metabolism of AA and EPA through the n-6 and n-3 pathways in 16HBE cells
supplemented with DHA..............................................................................................64
25. Total fatty acid composition of 16HBE cells with or without EPA
supplementation ...........................................................................................................66
26. Metabolism of LA and LNA through the n-6 and n-3 pathways in 16HBE cells
supplemented with EPA ...............................................................................................67
27. Metabolism of AA and EPA through the n-6 and n-3 pathways in 16HBE cells
supplemented with EPA ...............................................................................................69
28. PUFA metabolic enzyme gene expression following DHA, EPA and PA
supplementation ...........................................................................................................70
29. Fatty acid composition of CF-related organs in cftrtm1Unc
mice fed peptamen,
peptamen + DHA or peptamen AF ..............................................................................73
30. Levels of EPA in CF-related organs of cftrtm1Unc
mice fed peptamen, peptamen +
DHA or peptamen AF ..................................................................................................75
31. Brain fatty acid composition of cftrtm1Unc
mice fed peptamen, peptamen + DHA or
peptamen AF ................................................................................................................76

viii
32. PUFA metabolic enzyme gene expression in lung, ileum and liver of cftrtm1Unc
mice
fed peptamen, peptamen + DHA or peptamen AF ......................................................78
33. Histological appearance and morphometry of the small intestine of cftrtm1Unc
mice fed
peptamen, peptamen + DHA or peptamen AF.............................................................80
34. Detection of goblet cells in the small intestine of cftrtm1Unc
mice fed peptamen,
peptamen + DHA or peptamen AF ..............................................................................81
35. Hematoxylin and eosin-stained lung sections obtained from cftrtm1Unc
mice fed
peptamen, peptamen + DHA or peptamen AF.............................................................82
36. Diagram of the biosynthesis and retroconversion of docosahexaenoic acid (DHA) ...86
37. Detection of intracellular superoxide production in 16HBE cells ...............................96
38. Relative desaturase mRNA expression and PUFA composition of 16HBE cells with
or without NAC treatment ...........................................................................................97
39. Relative desaturase mRNA expression and PUFA composition of 16HBE cells with
or without trolox treatment ..........................................................................................98
40. Relative desaturase mRNA expression and PUFA composition of 16HBE cells with
or without mito-TEMPO treatment ..............................................................................99
41. Relative SOD mRNA and protein expression in 16HBE cells with or without mito-
TEMPO treatment ........................................................................................................... 101
42. Proposed mechanism detailing ROS-mediated AMPK stimulation of Δ5 and Δ6-
desaturase expression and activity .............................................................................105

ix
LIST OF TABLES
Table Page
1. Primer sequences used for quantitative real-time PCR ................................................23
2. Total fatty acid levels in the lung, ileum and pancreas of WT versus CF mice ..........44
3. Total fatty acid levels in the liver, heart and kidney of WT versus CF mice ..............46
4. Fatty acid composition of the different mouse liquid diets..........................................71
5. Clinical trials using antioxidant therapy for treatment of CF ....................................111
6. Clinical trials using NSAID therapy for treatment of CF ..........................................112
7. Clinical trials using fish oil (DHA and EPA) therapy for treatment of CF ...............113

x
LIST OF ABBREVIATIONS
4-phenylbutyrate ........................................................................................................ 4-PBA
5-lipoxygenase ........................................................................................................... 5-LOX
Acetyl-CoA carboxylase ............................................................................................... ACC
Adenosine monophosphate-activated protein kinase ................................................. AMPK
Adenosine triphosphate .................................................................................................. ATP
Arachidonic acid .............................................................................................................. AA
ATP binding cassette transporter .................................................................................. ABC
Bovine serum albumin ................................................................................................... BSA
Bronchoalveolar lavage .................................................................................................BAL
Calcium/calmodulin-dependent protein kinase kinase beta ................................... CaMKKβ
Calcium release-activated calcium channels .............................................................. CRAC
Carnitine palmitoyl transferase ................................................................................... CPT-1
Counts per minute ......................................................................................................... CPM
Cyclic adenosine monophosphate ............................................................................... cAMP

xi
Cyclooxygenase-2 ...................................................................................................... COX-2
Cystic fibrosis ................................................................................................................... CF
Cystic fibrosis transmembrane conductance regulator ................................................CFTR
Dihydroethidium ........................................................................................................... DHE
Distal intestinal obstruction syndrome ......................................................................... DIOS
Docosahexaenoic acid ................................................................................................... DHA
Docosapentaenoic acid...................................................................................................DPA
Eicosapentaenoic acid .................................................................................................... EPA
Electron transport chain ................................................................................................. ETC
Elongase 2 ................................................................................................................... Elovl2
Elongase 5 ................................................................................................................... Elovl5
Endoplasmic reticulum .................................................................................................... ER
Epithelial sodium channel ............................................................................................ ENaC
Fatty acid methyl ester ............................................................................................... FAME
Forced expiratory volume in 1 second .......................................................................... FEV1
Forced vital capacity ...................................................................................................... FVC

xii
Free fatty acid ................................................................................................................ FFA
Gas chromatography - mass spectrometry ................................................................ GC-MS
High-performance liquid chromatography ................................................................. HPLC
Human bronchial epithelial ............................................................................................HBE
Human serum albumin ...................................................................................................HSA
Intermediate density lipoprotein ..................................................................................... IDL
Krebs henseleit buffer ................................................................................................... KHB
Krebs ringer hepes buffer ................................................................................... KRB-Hepes
Leukotriene B4 .............................................................................................................. LTB4
Linoleic acid..................................................................................................................... LA
Linolenic acid................................................................................................................ LNA
Liver kinase B1 ............................................................................................................LKB1
Low density lipoprotein ................................................................................................. LDL
Messenger RNA ......................................................................................................... mRNA
Microsomal prostaglandin E2 synthase-1.............................................................. mPGES-1
Mito-TEMPO ................................................................................................................... mT

xiii
Monoacylglycerol ........................................................................................................ MAG
N-acetyl cysteine ........................................................................................................... NAC
Nitric oxide ...................................................................................................................... NO
Non-steroidal anti-inflammatory drugs..................................................................... NSAID
Nucleotide binding domain ........................................................................................... NBD
Omega 3 ........................................................................................................................... n-3
Omega 6 ........................................................................................................................... n-6
Oleic acid ......................................................................................................................... OA
Palmitic acid..................................................................................................................... PA
Peroxisome proliferator-activated receptor alpha ..................................................... PPARα
Peroxynitrite .............................................................................................................. ONOO-
Polyunsaturated fatty acid ........................................................................................... PUFA
Prostaglandin E2 ............................................................................................................ PGE2
Protein kinase A .............................................................................................................PKA
Quantitative real-time PCR ....................................................................................qRT-PCR
Reactive oxygen species ................................................................................................ ROS

xiv
Reduced glutathione.......................................................................................................GSH
Regulatory domain .............................................................................................................. R
Small interfering RNA ............................................................................................... siRNA
Specific pathogen free..................................................................................................... SPF
Sterol regulatory element-binding protein 1 .......................................................... SREBP-1
Superoxide dismutase ....................................................................................................SOD
Transmembrane domain................................................................................................ TMD
Triglyceride ...................................................................................................................... TG
Trolox ............................................................................................................................... TX
Unfolded protein response ............................................................................................. UPR
Very low density lipoprotein ...................................................................................... VLDL

1
CHAPTER I
INTRODUCTION
Objective
Cystic Fibrosis (CF) is the most common lethal autosomal recessive disease in the
Caucasian population, occurring in roughly 1 in 2000-3000 live births [1]. In African
Americans, CF occurs in approximately 1 in 15,000-20,000 births [2], whereas in Asian
populations, disease incidence has been estimated to be as rare as 1 in 350,000 births [3].
CF is caused by mutations in the cystic fibrosis transmembrane conductance regulator
(CFTR) gene, leading to lack of functional CFTR protein at the apical surface of
secretory epithelia [4-6]. There is currently no cure for CF, and in spite of improved
screening and treatment, the US Cystic Fibrosis Foundation estimates the life expectancy
of CF patients to be only 37 years [7].
Numerous studies have revealed the presence of alterations in polyunsaturated
fatty acid (PUFA) composition in CF patients as well as in CF mouse and cell culture
models [8-16]. From these findings, several reproducible fatty acid changes have
emerged as dominant: decreased linoleic acid (18:2 n-6, LA), decreased docosahexaenoic
acid (22:6 n-3, DHA) and variably increased arachidonic acid (20:4 n-6, AA) (Figure 1).
These PUFA alterations are independent of nutritional status and pancreatic insufficiency
[12, 17-20]. Additionally, the magnitude of these changes has been shown to correlate
with disease severity. For example, LA and DHA levels tend to be lower in CF patients
with more severe disease [21, 22]. Previous studies have also shown that high-dose DHA

2
treatment leads to normalization of fatty acid levels in the lung, pancreas and intestine of
two different CF mouse models, and reverses the pathological manifestations of CF [13,
14]. It is therefore believed that CF fatty acid alterations play a key role in
pathophysiology of the disease. However, the mechanism(s) of the PUFA changes, their
connection to CFTR gene mutations and how they contribute to a CF phenotype is
currently unknown. We hypothesized that the fatty acid alterations seen in CF are caused
by altered PUFA metabolism, contributing to increased levels of AA and increased
metabolism of AA to pro-inflammatory eicosanoids. The research presented in this
dissertation focuses on understanding the mechanisms underlying PUFA alterations in
CF, and the role they play in the pathogenesis of disease.
Figure 1: Diagram of polyunsaturated fatty acid metabolism through the n-6 and
n-3 pathways. Specific omega-6 (n-6) and omega-3 (n-3) fatty acid changes have been
described in cystic fibrosis patients, mice and cell culture models. These include
decreased levels of linoleic acid (LA) and docosahexaenoic acid (DHA), and increased
levels of arachidonic acid (AA).

3
Molecular structure and function of the Cystic Fibrosis Transmembrane
Conductance Regulator (CFTR)
CF is a life-shortening genetic disorder that affects multiple organs in the body. It
is caused by a defective gene encoding a protein known as the cystic fibrosis
transmembrane conductance regulator (CFTR) [4-6]. The CFTR gene encompasses
approximately 180,000 base pairs and is located on the long arm of chromosome 7. It
encodes a 1,480 amino acid membrane protein that functions as an epithelial chloride ion
channel and regulates the absorption and secretion of salt and water in various tissues
such as the lung, sweat glands, gastrointestinal tract and pancreas [23].
CFTR is a member of the adenosine triphosphate (ATP)-binding cassette
transporter superfamily of proteins, which utilize nucleotide hydrolysis to transport
substrates across the membrane bilayer [24]. CFTR protein is composed of five distinct
domains: two homologous transmembrane spanning domains (TMD1 and TMD2), each
containing six transmembrane segments that form the hydrophilic channel through which
anions are transported; two nucleotide binding domains (NBD1 and NBD2) that are
exposed to the cytosol and are involved in ATP binding and hydrolysis; and a regulatory
R domain whose phosphorylation by protein kinase A (PKA) regulates channel gating
[25] (Figure 2). Chloride transport by CFTR requires interaction between the multiple
domains. Phosphorylation of the R domain by cAMP-dependent PKA is necessary for
channel activation and induces a conformational change in the protein, leading to reduced
interaction between the R domain and NBD1[26]. This allows for the NBDs to dimerize
and interact in a head-to-tail manner, enclosing two ATP molecules within the interfacial
composite sites. ATP binding signals conformational changes in the TMDs and causes

4
the ion channel to open. Following channel opening, hydrolysis of one ATP molecule
disrupts the NBD interface, triggers NBD dimer dissociation and leads to closing of the
channel [27].
Figure 2: Diagram showing the different domains of the CFTR protein. CFTR is a
member of the ATP-binding cassette (ABC) superfamily of proteins. It is made up of five
domains: two six-membrane spanning domains that form the chloride channel (TMDs),
two nucleotide binding domains (NBDs) that bind and hydrolyze ATP, as well as a
unique regulatory domain (R domain) that can be phosphorylated by protein kinase A.
Diagram adapted from the cystic fibrosis mutation database, 2012.

5
CFTR possesses other functions, in addition to being a chloride channel. CFTR is
known to act as an inhibitor of the epithelial sodium channel (ENaC) [28]. The absence
of functional CFTR in the apical membrane leads to unregulated, excessive sodium and
water absorption. This promotes dehydration of the airway surface liquid, causing a
collapse of the periciliary layer, loss of mucociliary clearance and concentration of mucus
within the airway surface [29]. CFTR can also transport bicarbonate (HCO3-) ions [30].
This function is important in regulating mucus thickness, as well as the pH of the external
environment of epithelial cells and of intracellular organelles. Highly compacted mucins
found in intracellular granules are held together by high concentrations of calcium (Ca2+
)
and hydrogen (H+) cations. HCO3
- can complex with, and sequester, the Ca
2+ and H
+
cations away from the mucin anions, thus promoting mucin unfolding and expansion
[31]. In CF, loss of HCO3- transport through CFTR leads to a HCO3
- poor extracellular
milieu. This results in impaired Ca2+
removal, hinders normal mucin expansion and
promotes the accumulation of mucus on luminal surfaces and in ducts of CF-affected
organs. Lack of HCO3- transport also decreases local pH and impairs bacterial killing
[32].
Furthermore, CFTR is involved in the transport of larger anions, such as the
antioxidant glutathione (GSH) and thiocyanate. CFTR-mediated GSH transport regulates
redox reactions at the airway surface and can reduce mucus viscosity by disrupting
disulfide bonds in mucin proteins [33]. Thiocyanate, on the other hand, is needed for the
production of antimicrobial hypothiocyanite. Failure to transport thiocyanate anions to
the surface of airway epithelium, as seen in CF, leads to a shortage of hypothiocyanite
and allows for Staphylococcus aureus and Pseudomonas aeruginosa bacterial
6
colonization [34]. Lastly, CFTR can regulate other membrane channels, including the
outwardly rectifying chloride channel, inwardly rectifying potassium channels and ATP
channels [35-38].
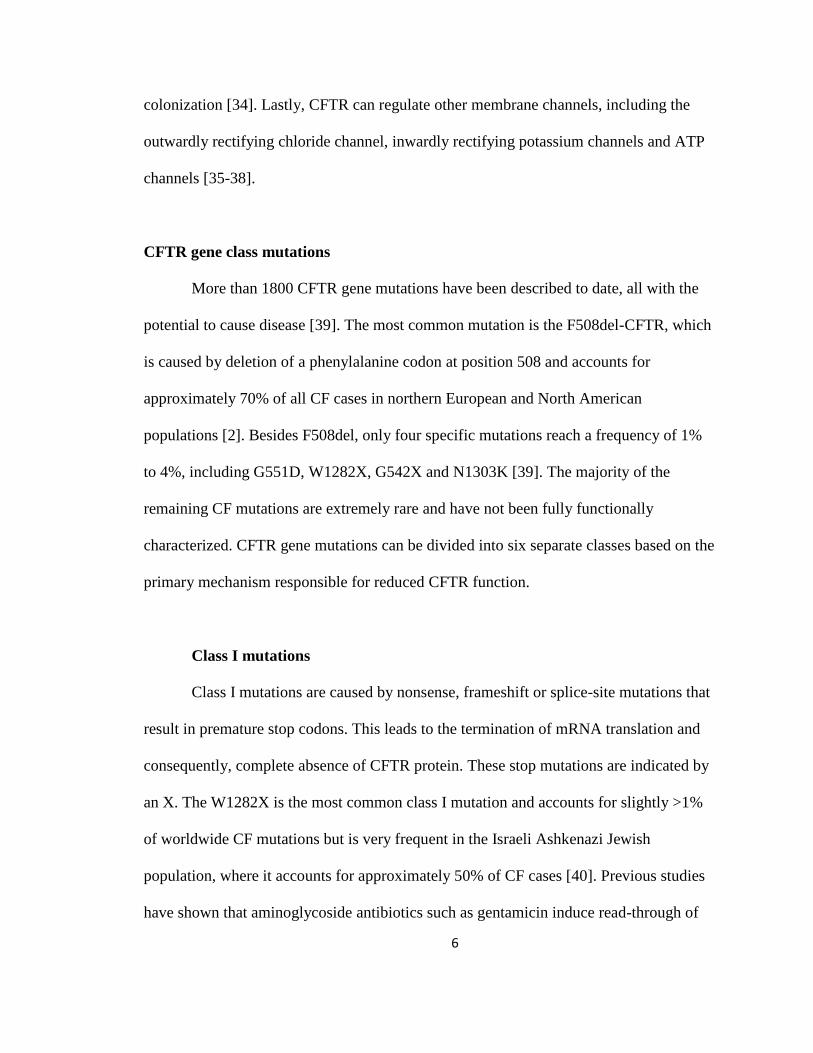
CFTR gene class mutations
More than 1800 CFTR gene mutations have been described to date, all with the
potential to cause disease [39]. The most common mutation is the F508del-CFTR, which
is caused by deletion of a phenylalanine codon at position 508 and accounts for
approximately 70% of all CF cases in northern European and North American
populations [2]. Besides F508del, only four specific mutations reach a frequency of 1%
to 4%, including G551D, W1282X, G542X and N1303K [39]. The majority of the
remaining CF mutations are extremely rare and have not been fully functionally
characterized. CFTR gene mutations can be divided into six separate classes based on the
primary mechanism responsible for reduced CFTR function.
Class I mutations
Class I mutations are caused by nonsense, frameshift or splice-site mutations that
result in premature stop codons. This leads to the termination of mRNA translation and
consequently, complete absence of CFTR protein. These stop mutations are indicated by
an X. The W1282X is the most common class I mutation and accounts for slightly >1%
of worldwide CF mutations but is very frequent in the Israeli Ashkenazi Jewish
population, where it accounts for approximately 50% of CF cases [40]. Previous studies
have shown that aminoglycoside antibiotics such as gentamicin induce read-through of

7
premature stop codons, resulting in formation of functional full-length CFTR protein.
Short-term topical application of gentamicin to the nasal epithelium in CF patients with
class I mutations has been reported to improve CFTR function [41]. Nevertheless, the
safety and efficacy of long-term aminoglycosides as a CF therapy still needs to be
evaluated.
Class II mutations
Class II mutations are associated with defective protein processing. Normal CFTR
protein is folded and glycosylated in the endoplasmic reticulum (ER) and Golgi, allowing
the protein to traffic to the apical cell surface. Class II mutant CFTR protein fails to
complete these processes correctly and instead, is degraded in the ER. These mutations
result in little or no mature CFTR at the cell surface. The most common CF mutation,
F508del, falls within this class. The F508del mutation impairs the conformational
maturation of nascent CFTR and arrests it in an early folding intermediate. As a result,
the mutated protein is misfolded, is recognized by the ER quality control system, and is
targeted for degradation via the ubiquitin-proteasome pathway [42, 43]. A small fraction
of F508del CFTR can escape the ER degradation pathway, exit the ER and make it to the
cell surface. However, this mutated protein is not stable and has aberrant channel gating
as reflected in reduced channel open probability [44]. The F508del mutation affects the
majority of CF patients and is therefore the most important CF therapeutic target.
Numerous attempts have been made to increase levels of functional F508del CFTR
protein at the cell surface. These include: 1) Use of small molecules known as correctors
to rescue the folding and/or trafficking of F508del CFTR and increase its cell surface

8
density. Such correctors include 4-phenylbutyrate (4-PBA) and curcumin [45-48]; 2) low
temperature rescue to promote trafficking of F508del CFTR from the ER to the cell
surface [49]; 3) suppression of the protein degradation process using either protein
chaperones or deubiquitinating enzymes [50, 51]; and 4) use of pharmacological agents
called potentiators, including sulfonamides, tetrahydrobenzothiophenes and
phenylglycine, to increase stability and channel gating of mutant CFTR [52, 53].
Class III mutations
Class III mutations are characterized by defective CFTR regulation. The CFTR
protein is properly processed and traffics to the plasma membrane, but cannot be
activated by ATP or cAMP. G551D is an example of a class III mutation, and it occurs in
approximately 3-4% of CF patients. Since this mutation involves impaired channel
gating, CF potentiators are an attractive therapeutic option. Vertex Pharmaceuticals Inc.
has developed a compound known as VX-770 that has been shown to increase CFTR
open probability and improve clinical outcomes such as lung function and sweat chloride
concentrations in G551D patients [54, 55]. This compound is now FDA approved under
the names Ivacaftor or Kalydeco™.
Class IV mutations
Class IV mutations involve altered chloride ion conductance, leading to CFTR
protein at the apical cell surface that exhibits a reduced rate of chloride transport. R117H
is among the common class IV mutations and is found in approximately 0.5% of CF
patients [39]. These mutations tend to result in mild disease manifestations.

9
Class V mutations
Class V mutations include promoter and splice-site mutations that affect the
efficiency of normal mRNA splicing and reduce the amount of normally processed and
functional CFTR at the cell surface. These mutations produce some correctly spliced
mRNA transcripts. The levels of these transcripts vary among different CF patients and
are inversely correlated with disease severity, such that lower levels of correctly spliced
transcripts are associated with more severe disease and vice versa [56-58]. The 3849 +
10kb C to T mutation is an example of a class V mutation. Therapeutic options for these
mutations include the use of antisense oligonucleotides or small molecules such as
sodium butyrate to decrease abnormal splicing and increase the levels of correctly spliced
transcripts [59, 60].
Class VI mutations
Class VI mutations are associated with defective CFTR stability at the cell surface
and accelerated protein turnover.
Clinical features of Cystic Fibrosis
CF is a multi-organ disease that is characterized by elevated sweat chloride
concentrations (which is the main diagnostic CF test), recurrent pulmonary infections and
chronic bronchiectasis, pancreatic insufficiency, intestinal malabsorption, and male
infertility [61]. The extent and severity of disease is inversely proportional to the degree
of CFTR function in the affected organs.
10
Recurrent pulmonary infections that lead to respiratory failure are the primary
cause of morbidity and mortality in CF patients. CFTR dysfunction in airway epithelia
causes impaired chloride ion efflux, as well as excessive sodium and water reabsorption.
This results in dehydration of the airway surface liquid, loss of mucociliary clearance and
increased production of thickened, viscous mucus [29, 62]. These conditions are
conducive for the growth and retention of bacteria, with bacterial colonization of airways
in CF patients beginning shortly after birth [63, 64]. The most common infecting bacteria
in infants with CF include Haemophilus influenzae and Staphylococcus aureus, while
older patients tend to be colonized by Pseudomonas aeruginosa [65, 66]. Increased
production of thickened mucus leads to airway obstruction and perpetuates a vicious
cycle of phlegm retention, infection and inflammation. This leads to bronchiectasis, air
trapping and progressive lung damage, and is ultimately responsible for at least 80% of
all CF-related deaths [7].
Exocrine pancreatic insufficiency is another clinical manifestation of CF. It is
present in roughly 85-90% of all CF patients [67], with symptoms such as failure to
thrive, greasy and bulky stool, abdominal bloating and poor absorption of fat-soluble
vitamins. Pancreatic insufficiency is triggered by destruction of pancreatic acinar cells as
well as obstruction of pancreatic ducts by thick mucus secretions, resulting in an inability
of the pancreas to supply digestive enzymes to the intestine [68, 69]. This brings about
intestinal malabsorption and contributes to the malnutrition seen in CF patients.
Additional gastrointestinal problems associated with CF include meconium ileus, distal
intestinal obstruction syndrome (DIOS), and constipation. These are all consequences of
increased viscosity of intestinal mucus and prolonged intestinal transit time [70-72].

11
Approximately 13-17% of all CF patients experience complete intestinal obstruction
during the neonatal period and present with meconium ileus at birth [73], while DIOS
and chronic constipation are commonly found in older patients [74, 75].
Approximately one third of CF patients will develop liver disease [76]. CF-related
liver disease usually develops before puberty, but it is often asymptomatic and progresses
slowly. The characteristic liver lesion in CF is focal biliary cirrhosis, caused by bile duct
plugging/obstruction and progressive periportal fibrosis [77]. Although liver cirrhosis is
not very common, it remains the single most important non-pulmonary cause of death
among CF patients [78].
CF also affects the reproductive system. Infertility occurs in about 97% of all
male CF patients and is attributable to congenital bilateral absence of the vas deferens,
with subsequent obstructive azoospermia [79]. Female fertility may be reduced due to
dehydrated cervical mucus that acts as a barrier to sperm passage [80], but reproductive
function is largely normal.
Fatty acid abnormalities in Cystic Fibrosis
Fatty acid abnormalities in CF patients
Alterations in PUFA composition were first identified in CF patients in 1962,
when serum chylomicrons of children with CF were found to contain decreased amounts
of linoleic acid (LA) compared to healthy controls [8]. Subsequent reports confirmed this
finding and reported decreased plasma LA levels in all the main lipid classes in CF
patients [9, 81]. Lower LA levels were also observed in red blood cells, platelets [82],
and in nasal tissue from CF patients [12]. These fatty acid changes were present in both

12
infant and adult CF patients [83]. In 1972, Underwood et al. reported that, in addition to
decreased LA, low docosahexaenoic acid (DHA) concentrations were present in different
tissues of CF patients [84]. Similar findings were shown in later studies describing
decreased plasma DHA levels in pre-adolescent CF children compared to healthy
children [18, 19]. One study found that serum phospholipid DHA concentrations were
significantly lower in patients with severe CFTR mutations, suggesting a possible
connection between the basic gene defect and abnormal fatty acid metabolism in CF
patients [20]. These fatty acid changes are very consistent, such that measurement of
plasma LA and DHA levels is adequate to distinguish CF from non-CF patients [85]. A
third PUFA alteration that has been noted in CF patients is increased arachidonic acid
(AA). This finding is less consistent than the decreased LA and DHA. In most reports,
there is an increase in AA in association with a decrease in LA. For example, increased
AA concentrations were described in nasal biopsy tissues from CF patients compared to
healthy controls [12], and an increase in AA mole fraction was reported in most
phospholipid classes in bronchial secretions of patients with CF [86]. However, some
studies showed little or no increase in the amount of AA in CF patients [10, 20]. When
these fatty acid changes were first described, it was believed that they were a
consequence of fat malabsorption. However, studies comparing well-nourished CF
patients to healthy controls found that the CF fatty acid alterations are independent of
nutritional status [11, 18] and diet [21]. In addition to PUFA alterations, fatty acid
changes involving monounsaturated fatty acids in the omega-7 (n-7) and omega-9 (n-9)
pathways have been observed in red blood cells, platelets and plasma of CF patients.
These include increased palmitoleic acid (16:1n-7), increased oleic acid (18:1n-9) and

13
increased mead acid (20:3n-9) [11, 18, 82], and are an indication of essential fatty acid
deficiency.
Fatty acid abnormalities in CF model systems
Genetically modified CF mice provide a good model to study CF pathogenesis
and experimental therapeutics. CF mice exhibit many features in common with CF
patients, including failure to thrive and growth retardation [87], impaired gastrointestinal
physiology leading to a high incidence of intestinal obstruction [88, 89], bacterial
overgrowth [90], and inflammation [91]. Fatty acid abnormalities are also present in CF
mouse models. Freedman et al. showed that there was a change in the fatty acid
composition of cftr-/-
knockout mice (cftrtm1Unc
), characterized by increased phospholipid-
bound AA and decreased phospholipid-bound DHA. These changes were present in the
lung, pancreas and ileum of the knockout mice compared to wildtype controls [13]. A
further study using the same mouse model demonstrated a decrease in LA in
phospholipids from pancreatic homogenates of cftr-/-
mice, as well as an increase in fatty
acid flux from AA to docosapentaenoic acid (DPA n-6) [92]. Lipid abnormalities
including higher levels of AA and decreased LA have also been reported in the
duodenum, jejunum, ileum and pancreas of CF mice homozygous for the F508del
mutation [14]. Although the link between these PUFA changes and the pathophysiology
of CF is unclear, there is evidence from a cftr-/-
knockout mouse model to suggest that
correcting the lipid imbalances can reverse the pathologic manifestations of CF [13, 93].
Daily treatment of CF knockout mice with large amounts of DHA resulted in increased
DHA and decreased AA concentrations in lung, pancreas and intestine tissue. Moreover,

14
the treated animals exhibited reversal of CF-related pathology, including relief of
pancreatic duct dilation, decrease in stimulated neutrophil accumulation in
bronchoalveolar lavage (BAL) fluid, and normalization of ileal histology [13]. These
findings imply that the use of lipid supplementation may represent a potential therapeutic
avenue to correct the CF fatty acid alterations and alleviate disease symptoms.
In addition, fatty acid abnormalities have been described in cell culture models of
CF. A study done in cultured pancreatic epithelial cells with or without the CFTR gene
product revealed a decrease in LA levels in phospholipids of CF cells, particularly in
phosphatidylcholine, phosphatidylinositol and phosphatidylethanolamine [94].This was
accompanied by increased conversion of LA to AA, as well as increased flux of LA into
triglycerides (TG). Cultured human respiratory epithelial cells also exhibit the
characteristic fatty acid alterations [15, 16], indicating that the defect is intrinsic and not
due to malabsorption.
Rationale for current studies
PUFA alterations have long been described in CF. Furthermore, several studies
have demonstrated that the magnitude of these alterations correlates with disease severity
[20, 82], suggesting that the fatty acid changes play an important role in the
pathophysiology of CF. However, the precise mechanisms underlying the fatty acid
abnormalities are unknown. The link between these fatty acid changes and CFTR
mutations, as well as the mechanism by which DHA can reverse the alterations also
remains unclear. We believe that improving our understanding of the mechanisms
behind, and the role of, fatty acid alterations in CF may assist us in identifying novel drug

15
targets and lipid-based therapies for treatment of the disease. The research presented in
this thesis is aimed at uncovering the mechanisms of PUFA alterations in CF, examining
how DHA works to correct these fatty acid changes and reverse the CF phenotype in a
knockout mouse model, and lastly, investigating the connection between fatty acid
changes and CFTR gene mutations.

16
CHAPTER II
FATTY ACID CHANGES IN CYSTIC FIBROSIS RESULT FROM
INCREASED EXPRESSION AND ACTIVITY OF DESATURASE METABOLIC
ENZYMES
Introduction
Three main PUFA changes have been described in CF, including decreased LA
and DHA, and increased AA (Figure 1). We hypothesized that these fatty acid changes
are brought about by altered PUFA metabolism through the n-6 and n-3 pathways. Since
mammals are unable to synthesize PUFAs from acetyl CoA, they must obtain essential
fatty acids such as LA and LNA from their diet [95]. Once ingested, these essential fatty
acids can be converted to longer and more desaturated products through parallel
metabolic pathways that include desaturation, elongation, and β-oxidation (Figure 1).
These modifications are carried out by the same set of desaturase and elongase enzymes
in both pathways. Δ5 and Δ6-desaturase enzymes catalyze the addition of a double bond
to the fatty acid chain, with the Δ number indicating the position at which the double
bond is introduced. Δ6-desaturase has been shown to catalyze the first and rate-limiting
step of PUFA synthesis [95]. Fatty acid elongation involves the addition of two carbon
units to a fatty acyl-CoA, using malonyl-CoA as the donor and NADPH as the reducing
agent. Elongase 2 (Elovl2) specifically elongates 22-carbon fatty acids while elongase 5
(Elovl5) is involved in the elongation of 18-20 carbon fatty acids [96]. The activities of
the enzymes involved in fatty acid desaturation and elongation appears to be regulated
primarily at the transcriptional level, and not by post-translational protein modifications

17
[97, 98]. Together, the desaturase and elongase enzymes generate end products of PUFA
synthesis such as AA and DHA. We set out to determine whether changes in n-6 and n-3
metabolism could account for the fatty acid alterations in CF. To this end, we evaluated
fatty acid metabolic flux in a cell culture model of CF. Additionally, we determined the
expression (mRNA and protein) and activity of the PUFA metabolic enzymes in our cell
culture model, as well as in a cftr-/-
knockout mouse model.
Experimental Procedures
Materials
Human bronchial epithelial cells (16HBE cells) were a kind gift from Dr. Pamela
Davis (Case Western University, Cleveland, OH). These cells were stably transfected
with plasmids containing the first 131 nucleotides of CFTR in the sense or antisense
orientation. Sense (WT) cells were shown to express normal, functional CFTR while
antisense (CF) cells did not express CFTR and could not transport chloride [99]. IB3 and
C38 bronchial epithelial cells were obtained from ATCC (Manassas, VA). Fatty acid
methyl ester (FAME) standards were purchased from NuChek Prep (Elysian, MN) and
24:5 n-3 and 24:6 n-3 standards were purchased from Larodan Fine Chemicals (Malmö,
Sweden). Radiolabeled fatty acids (14
C-LA, 14
C-LNA, 14
C-AA, 14
C-EPA and 14
C-22:5 n-
3) were purchased from American Radiolabeled Chemicals, Inc (St. Louis, MO). All
solvents used on the HPLC instrument were purchased from Fisher Scientific (Pittsburgh,
PA), while the IN-flow 2:1 scintillation cocktail was purchased from LabLogic Systems,
Inc (Brandon, FL).

18
Cell culture
16HBE cells were cultured as described previously [15, 16]. Briefly, cells were
grown in 6-well plates pre-coated with LHC Basal media (Invitrogen, Carlsbad, CA)
containing human fibronectin (10 µg/mL; Sigma), vitrogen (3 µg/mL; Angiotech
Biomaterials, Palo Alto, CA) and BSA (0.1 mg/mL; Sigma). Sense and antisense cells
were plated at a density of 3×10⁵ and 1×10
5 cells/well respectively. IB3 and C38 cells
were plated at a density of 1×10⁵
cells/well. All cells were grown in minimum essential
medium + glutamax (Invitrogen) with 100 μg/mL streptomycin, 100 U/mL penicillin, and
10% horse serum (Omega Scientific, Tarzana, CA). Horse serum was used because it
contains a high concentration of LA, which allows for the PUFA changes in CF cells to
be manifested. Media was changed every two days and experiments carried out in cells
two days post-confluence.
Mice
CFTR heterozygous mice on a C57BL/6J genetic background (B6.129P2-
Cftrtm1Unc
/J, stock number 002196) were purchased from The Jackson Laboratory (Bar
Harbor, Maine). The mice were housed within a specific pathogen-free (SPF) barrier
facility with a 12-h light/dark cycle. Cftr heterozygotes were bred to obtain both wild-
type (WT) and cftr-/-
(CF) mice. Ear-clip samples of 14-day old mice were used for
genotype analysis. WT and CF mice were weaned at 23 days of age and placed on a
liquid diet known as Peptamen (Nestle Clinical Nutrition, Deerfield, IL) with access to
water ad libitum for 14 days. Peptamen is a complete liquid enteral formulation
composed mainly of medium-chain triglycerides, carbohydrates and hydrolyzed protein.

19
The liquid diet was used to prevent intestinal obstruction in the CF mice. The mice were
monitored daily for clinical signs that could indicate distress, including coat quality,
posture, ambulation and porphyrin staining, and any mice that appeared severely
distressed were euthanized before completion of the experiment. The mice also received
fresh peptamen every day, at which time their body weight was measured. The mice were
sacrificed two weeks post-weaning, and blood as well as various organs (lung, pancreas,
ileum, liver, kidney, heart and brain) collected. All experiments were carried out under
protocols approved by the Vanderbilt Division of Animal Care, and by the Institutional
Animal Care and Use Committee.
Total fatty acid analysis
Fatty acids were extracted and methylated from cells two days post-confluence
using a modified Folch method [100]. Briefly, the cells were washed twice in ice-cold
PBS, scraped using a rubber policeman and pelleted by centrifugation at 100 g for 8 min.
The pellet was resuspended in PBS and heptadecanoic acid (17:0) was added as an
internal standard. Six volumes of chloroform-methanol (2:1) was added to the cells,
vortexed and incubated on ice for 10 min. The mixture was then centrifuged at 1100 g for
10 min, and the lower organic phase transferred to a new glass tube and dried down
completely under nitrogen gas. To methylate the fatty acids, 0.5 mL of 0.5 N methanolic
NaOH (Acros Organics, Geel, Belgium) was added to the dried-down lipids, vortexed
and heated at 100ºC for 3 min. Following this, 0.5 mL boron trifluoride (BF3-methanol;
Sigma) was added to the mixture and incubated at 100ºC for 1 min. The resulting FAMEs
were extracted using 1 mL hexane, followed by 6.5 mL of saturated NaCl solution. The

20
mixture was vortexed and centrifuged at 500 g for 4 min, and the upper hexane layer
transferred to a new glass tube. Total FAMEs contained in the hexane layer were
analyzed by gas chromatography (GC) using an Agilent 7980A GC system (Agilent
Technologies, Santa Clara, CA) equipped with a Supelcowax SP-10 capillary column
(Supelco, Bellefonte, PA) coupled to a mass spectrometer (model 5975c, Agilent
Technologies). The mass of the FAMEs was determined by comparing areas of unknown
FAMEs to that of the 17:0 internal standard. Results were expressed as the molar
percentage (mol %) of each FAME relative to the total FAME mass of the sample.
Fatty acids were also extracted from different mouse tissues and plasma. For lung
tissue, cell suspensions were made to enrich for epithelial cells as previously described
[13]. Briefly, the lung was flushed with Krebs-Henseleit buffer (KHB) containing 0.5%
BSA and then minced and transferred to a tube containing 10 mL KHB with 2,000 units
DNase (Sigma), 0.5 units thermolysin (Sigma) and 1,000 units collagenase (Sigma). The
tissue was incubated in a shaker at 37oC for 30 min. Following incubation, KHB
containing 4% BSA was added to the cell suspension and centrifuged at 500 g for 10 min.
The supernatant was removed and the cells washed once in KHB and resuspended in
PBS. Pancreatic cell suspensions were prepared by mechanical dissociation and addition
of collagenase as described by Bruzzone et al [101]. Briefly, Krebs-Ringer Hepes (KRB-
Hepes) buffer, adjusted to pH 7.4, containing 12.5 mM Hepes, 135 mM NaCl, 4.8 mM
KCl, 1.0 mM CaCl2, 1.2 mM KH2PO4, 1.2 mM MgSO4, 5.0 mM NaHCO3, 5 mM
glucose and 0.01 mg of aprotinin / mL was used as the dissociation medium. The
pancreas was chopped into small pieces and transferred to a glass tube. Two mL KRB-
Hepes containing 1 mg collagenase per mL was added to the tube and shaken vigorously

21
until the tissue suspension appeared homogenous. Fresh KRB-Hepes with 0.1% human
serum albumin (HSA) was added and the tissue centrifuged at 500 g for 5 min. The
digested tissue was washed twice with repeated centrifugations, resuspended in fresh
KRB-Hepes-HSA and filtered consecutively through a 300 µm and then a 70 µm filter.
The pancreatic cells that passed through the filter were centrifuged and resuspended in
PBS. For ileal cells, the ileum was rinsed with PBS, sliced open and cells obtained by
scraping the inner mucosal surface. Additionally, tissue homogenates were prepared from
the kidney, heart, liver and brain by mincing and homogenizing the tissue samples in
PBS. FAMEs were prepared from the pancreas and lung cell suspensions, tissue
homogenates and plasma as described above, and total lipid levels analyzed by GC-MS.
Fatty acid radiolabeling experiments
For fatty acid metabolic flux experiments, the cells were grown until two days
post-confluence. 14
C radiolabeled fatty acids were dried down under nitrogen gas and
resuspended in media containing 10% reduced-lipid fetal bovine serum (Hyclone, Logan,
UT) by thorough vortexing and sonication. The final concentration of radiolabeled fatty
acids was 4.1µM. The media supplemented with radiolabeled fatty acids was added to the
cells for 4 h, washed off twice with PBS and replaced with complete media for an
additional 20 h. The cells were then harvested and lipids extracted and methylated as
described above. To measure metabolic flux, the extracted FAMEs were dried down
under nitrogen, redissolved in 50 µL acetonitrile and analyzed by high-performance
liquid chromatography (HPLC) (Agilent 1200 series; Agilent Technologies, Santa Clara,
CA) using an Agilent Zorbax Eclipse XDB-C18 column, 4.6×250 mm, 5 μm. A guard
22
column of 4.6×12.5 mm, 5 μm was used in conjunction with the analytical column.
Quantification of the radiolabeled peaks was performed by a scintillation detector (β-
RAM Model 4, IN/US Systems) coupled to the HPLC. The counting efficiency of this
detector is > 90% for 14
C with 5 CPM background. A binary solvent system was used to
separate the fatty acids at a flow rate of 1 mL/min. Solvent A comprised HPLC grade
H2O with 0.02% H2PO4, and solvent B comprised 100% HPLC grade acetonitrile. For
separation of n-3 fatty acids, the solvent program started with 76% solvent B and 24%
solvent A for 0.5 min, followed by a linear gradient from 76% to 86% solvent B over 10
min, a hold for 20 min, an additional linear gradient from 86% to 100% solvent B over 2
min, and a hold for 18 min, followed by reconstitution of the starting conditions. For n-6
fatty acids, the solvent program began with 58% solvent B and 42% solvent A for 25
min, followed by a linear gradient from 58% to 61% solvent B over 2 min, a hold for 8
min, another linear gradient from 61% to 100% solvent B over 15 min, and a hold for 20
min, followed by reconstitution of the original conditions. The peaks were identified by
ultraviolet detection at 205 nm and confirmed by comparison with retention times of
unlabeled standards.
Quantitative real-time PCR
Total RNA was isolated from homogenized mouse tissues or from cultured cells
using TRIzol reagent (Invitrogen), following the manufacturer’s instructions.
Complementary DNA was generated from 2 µg of total RNA with random hexamers
using TaqMan reverse transcription reagents (Applied Biosystems, Foster City, CA).
Quantitative real-time PCR (qRT-PCR) was done on mouse cDNA using Taqman gene

23
expression assays, universal PCR master mix, and a CFX96 Real-Time PCR system (Bio-
rad) with Taqman commercial primers and probes (Applied Biosystems). Data was
analyzed using CFX Manager software (Bio-rad). The relative expression of each target
gene was calculated using the comparative CT method and normalized to a reference
gene, GAPDH. For gene expression analysis of cultured cells, qRT-PCR was performed
in a reaction containing 50 ng of reverse-transcribed total RNA, 156 nM forward and
reverse primers, and 10 μL 2× SYBR Green PCR Master Mix (Applied Biosystems) in a
total volume of 20 μL. Each PCR reaction was performed in triplicate in 96-well plates
and RPLP0 was used as an endogenous control. Primer sequences used for the cell
culture experiments are listed in Table 1.
Table 1: Primer sequences used for quantitative real-time PCR
Gene
Name
Product Sequence of Forward and Reverse
Primers (5’ to 3’)
GenBank
Accession
No.
RPLP0 Ribosomal Protein,
Large, P0
ATGGCAGCATCTACAACCC
GACAGACACTGGCAACATTG
NM_001002
FADS1 Fatty acid
Δ5-desaturase
CCTGGAAAGCAACTGGTTTGTG
GAAGGCAGACTTGTGGACATTG
NM_013402
FADS2 Fatty acid
Δ6-desaturase
GCCAAGCCTAACATCTTCCACAAG
GTATTCGTGCTGGTGATTGTAGGG
NM_004265
ELOVL2 Fatty acid
elongase 2
CTGCTCTCAATATGGCTGGGTAAC
CACTGTAAGTTGTAGCCTCCTTCC
NM_017770
ELOVL5 Fatty acid
elongase 5
TCCCTCTTGGTTGGTTGTATTTCC
GCCCCTTTCTTGTTGTAGGTCTG
NM_021814
PTGS1 Cyclooxygenase-1
(COX-1)
CTTGACCGCTACCAGTGTG
GTGAGTGAGCAGGAAGTGG
NM_000962
PTGS2 Cyclooxygenase-2
(COX-2)
TGAAACCCACTCCAAACACAG
GCCATAGTCAGCATTGTAAGTTG
NM_000963
ALOX5 5-lipoxygenase
(5-LOX)
CCCGAGATGACCAAATTCACATTC
AGGGTTCCACTCCATCCATCG
NM_000698

24
Western blotting
Membrane fractions of 16HBE cells were prepared using a subcellular protein
fractionation kit (Thermo Fisher Scientific, Rockford, IL) according to the
manufacturer’s recommendations. Protein samples were run on a 7.5% pre-cast SDS-
PAGE gel and transferred to Immobilon-P PVDF filters. Blots were stained using a
polyclonal Δ6-desaturase antibody (Santa Cruz) and a polyclonal anti-calnexin antibody
(StressGen). After washing, bound antibodies were visualized with a peroxidase-
conjugated goat anti-rabbit secondary antibody using the SuperSignal West Pico substrate
system (Thermo Fisher Scientific) and exposed to CL-X Posure film (Thermo Fisher
Scientific).
Eicosanoid ELISA
Culture media was collected from 16HBE cells two days post-confluence and the
levels of prostaglandin E2 (PGE2) and leukotriene B4 (LTB4) measured by ELISA
(Cayman Chemicals, Ann Arbor, MI). Per cell eicosanoid production was calculated by
dividing the eicosanoid level in the total media sample by the number of cells in the
corresponding well.
Cyclooxygenase-2 (COX-2) inhibition
To inhibit COX-2, 16HBE cells were grown until almost confluent and then
treated with a COX-2 specific small molecule inhibitor known as NS-398 (Sigma) or
DMSO control (vehicle) for 48 h. Alternatively, COX-2 expression in the cells was
abolished by use of a small interfering RNA (siRNA) directed against COX-2. For these

25
experiments, 16HBE cells were transfected with 250 nM silencer select COX-2 siRNA or
250 nM silencer select negative control siRNA (Invitrogen) using Lipofectamine
RNAiMax transfection reagent (Invitrogen) according to the manufacturer’s instructions.
Following COX-2 inhibition or knockdown, the cells were either incubated with 14
C-
radiolabeled precursor fatty acids for PUFA metabolic flux assays or harvested and RNA
isolated for PUFA metabolic gene expression studies.
Results
To determine whether the characteristic PUFA abnormalities were present in our
CF cell culture system, we measured the relative n-3 and n-6 fatty acid levels in sense
(WT) and antisense (CF) cells. Antisense cells exhibited significantly lower levels of LA,
with associated increases in the downstream metabolites 18:3 n-6, 20:3 n-6 and AA. In
addition, levels of DHA were markedly decreased in antisense cells compared to sense
cells (Figure 3). To confirm these findings, we measured the fatty acid composition in a
cell line derived from a CF patient. The IB3 cell line is a compound heterozygote
bronchial epithelial cell line from a CF patient with a ∆F508 mutation and a W1282X
nonsense mutation [102]. The CF phenotype in the IB3 cells has been corrected in the
C38 cell line using WT CFTR in an adenoviral vector. Similar to antisense cells, the IB3
cells were found to have decreased levels of LA and increased AA levels relative to C38
cells (Figure 4).

26
Figure 3: Fatty acid composition of Sense (WT) and Antisense (CF) bronchial epithelial cells. Total fatty acid levels were
analyzed by GC-MS and data represented as molar percentage of total fatty acids (mol %). Levels of linoleic acid (LA) and
docosahexaenoic acid (DHA) were significantly lower in CF cells, while levels of arachidonic acid (AA) were significantly higher in
CF cells compared to WT cells. * P < 0.05; ** P < 0.01; *** P < 0.001; (n = 3).

27
Figure 4: Fatty acid composition of C38 (WT) and IB3 (CF) bronchial epithelial cells. Total fatty acid levels were analyzed by
GC-MS and data represented as molar percentage of total fatty acids (mol %). Levels of linoleic acid (LA) were significantly lower in
CF cells, while levels of arachidonic acid (AA) were significantly higher in CF cells compared to WT cells. There was no difference
in DHA levels between WT and CF cells. * P < 0.05; ** P < 0.01; *** P < 0.001; (n = 3).
28
Higher levels of the downstream metabolites of LA in CF cells suggest that there
is increased metabolism of LA to AA. To evaluate this hypothesis, sense and antisense
cells were incubated with 14
C radiolabeled LA and incorporation into downstream
metabolites measured. Significant increases in metabolism of LA to downstream products
up to and including AA was observed in antisense cells compared to sense cells (Figure
5A). It is known that metabolism through the n-6 and n-3 pathways is carried out by the
same set of enzymes [95]. Therefore we performed a parallel comparison of metabolic
flux through the n-3 pathway. Sense and antisense cells were incubated with 14
C
radiolabeled LNA and its conversion to downstream metabolites was measured. Similar
to the n-6 pathway, there was a significant increase in metabolism of LNA to 18:4 n-3,
20:4 n-3 and EPA (Figure 5B). However, a closer look at the magnitude of conversion of
LNA to EPA vs. LA to AA revealed greater metabolic flux when LNA was used as the
substrate, resulting in a much higher EPA/LNA ratio than AA/LA ratio in both sense and
antisense cells. This is consistent with previous studies reporting that PUFA metabolic
enzymes have a preference for n-3 fatty acids over n-6 fatty acids [103-105].
The increased metabolism in the early steps of the n-3 and n-6 pathways provides
a plausible explanation for the low LA and high AA levels in CF. However, this does not
explain the low DHA levels present in CF. To investigate this, we incubated sense and
antisense cells with 14
C radiolabeled AA and 14
C radiolabeled EPA and measured
conversion to downstream metabolites. There was a significant decrease in metabolism of
both AA and EPA to 22:5n-6 and DHA respectively (Figure 6), indicating a lower rate of
DHA production from precursor fatty acids in CF cells.

29
Figure 5: Metabolism of LA and LNA through the n-6 and n-3 pathways in 16HBE
cells. Sense and antisense cells were incubated with 4.1 μM [14
C] LA (A) or [14
C] LNA
(B) in reduced-lipid cell culture medium for 4 h as described in the experimental
procedures. Levels of radiolabeled LA (18:2n-6), 18:3n-6, 20:3n-6 and AA (20:4n-6) (A)
or radiolabeled LNA (18:3n-3), 18:4n-3, 20:4n-3 and EPA (20:5n-3) (B) were determined
by HPLC and data presented as percent of total counts. Metabolism of both LA and LNA
was shown to be revved up in antisense (CF) cells compared to sense (WT) cells. Bars
represent mean ± SEM (n = 3). * P<0.05, ** P< 0.01, *** P<0.001 for sense vs.
antisense cells.

30
Figure 6: Metabolism of AA and EPA through the n-6 and n-3 pathways in 16HBE
cells. Sense and antisense cells were incubated with 4.1 μM [14
C] AA (A) or [14
C] EPA
(B) in reduced-lipid cell culture medium for 4 h as described in the experimental
procedures. Levels of radiolabeled AA (20:4n-6), 22:4n-6 and 22:5n-6 (A) or
radiolabeled EPA (20:5n-3), 22:5n-3, 24:5n-3, 24:6n-3 and DHA (22:6n-3) (B) were
determined by HPLC and data presented as percent of total counts. Both AA and EPA
metabolism was decreased in antisense (CF) cells compared to sense (WT) cells. Bars
represent mean ± SEM (n = 3). * P<0.05, ** P< 0.01, *** P<0.001 for sense vs.
antisense cells.
31
PUFA metabolism through the n-3 and n-6 pathways is controlled by desaturase
and elongase enzymes (Figure 1), and regulation of these enzymes influences the
production of end products of PUFA synthesis such as AA and DHA. Thus it is possible
that differential expression of these enzymes in sense and antisense cells causes the
PUFA alterations commonly found in CF. To test this, the mRNA expression of all four
enzymes involved (Δ5-desaturase, Δ6-desaturase, elovl2 and elovl5) was measured by
qRT-PCR. Both Δ5-desaturase and Δ6-desaturase were expressed at significantly higher
levels in antisense cells (Figure 7A), while there was no difference in the mRNA levels of
either elovl2 or elovl5 between sense and antisense cells. Protein levels of the rate-
limiting enzyme, Δ6-desaturase, were also increased in antisense cells (Figure 7B). These
findings were confirmed in the IB3/C38 cell line, which showed similar elevations in
desaturase expression in CF cells (Figure 7C). This suggests that the altered levels of LA
and AA in CF are brought about by differences in the transcriptional regulation of
desaturase enzymes.
Although increased expression and activity of the metabolic enzymes can explain
the differences seen in the early steps of PUFA metabolism, it does not explain the
decreased metabolism of AA and EPA. A conceivable explanation for this is decreased β-
oxidation at the second to last step in PUFA metabolism (Figure 1). However, this
explanation cannot account for the decreased metabolism of earlier AA and EPA
metabolites such as 22:4n-6 and 22:5n-3 (Figure 6).

32
Figure 7: Relative mRNA and protein expression of PUFA metabolic enzymes in the n-6
and n-3 pathways. RNA was extracted and cDNA synthesized from sense and antisense
cells (A) or from IB3/C38 cells (C) as described in the experimental procedures. qRT-PCR
was performed using primers for the mRNA sequences of Δ5-desaturase (FADS1), Δ6-
desaturase (FADS2), elongase 2 (ELOVL2), and elongase 5 (ELOVL5). Relative expression
was determined by the ΔΔCT method using ribosomal protein RPLP0 as a control. Both Δ5-
desaturase and Δ6-desaturase expression levels were significantly increased in CF cells
(antisense and IB3) compared to WT cells (sense and C38). Bars represent mean ± SEM (n =
3). * P<0.05, ** P< 0.01, for sense vs. antisense cells. (B) Relative protein expression of Δ6-
desaturase was determined in sense and antisense cells by western blot using an anti-FADS2
(Δ6-desaturase) polyclonal antibody (1:200). An anti-calnexin polyclonal antibody (1:1000)
was used as a loading control. Data shown are representative of a minimum of three different
experiments.

33
Another potential explanation is that AA and EPA are being metabolized via an
alternative pathway, thereby reducing the amount of substrate available for conversion to
22:5n-6 and DHA. This hypothesis is supported by the fact that metabolism of 14
C-
radiolabeled 22:5n-3 to DHA was approximately equal in sense and antisense cells
(Figure 8). This indicates that decreased metabolism of EPA (and AA by inference) likely
occurs at the first metabolic step and is perhaps due to metabolism of EPA and AA by a
different pathway.
Figure 8: Metabolism of 14
C 22:5n-3 in 16HBE cells. Sense and antisense cells were
incubated with 4.1 μM [14
C] 22:5n-3 in reduced-lipid cell culture medium for 4 h as
described in the experimental procedures. Levels of radiolabeled 22:5n-3, 24:5n-3, 24:6n-
3 and DHA (22:6n-3) were determined by HPLC and data presented as percent of total
counts (cpm). 22:5n-3 was metabolized fairly equally in both sense and antisense cells,
with the exception of 24:6n-3. Bars represent mean ± SEM (n = 3). ** P< 0.01 for sense
vs. antisense cells.

34
A possible alternative pathway for AA and EPA metabolism is oxidation to
eicosanoids such as prostaglandins and leukotrienes. This is facilitated by
cyclooxygenase (COX-1 and COX-2) and lipoxygenase (5-LOX) enzymes. Several well
studied prostaglandins produced from AA are pro-inflammatory, while several of those
synthesized from EPA are by comparison less pro-inflammatory, or even anti-
inflammatory (Figure 9). Previous studies have shown that pro-inflammatory eicosanoids
including prostaglandin E2 (PGE2) and leukotriene B4 (LTB4) are increased in CF patients
[106-110]. This correlates with increased expression of cyclooxygenase and lipoxygenase
in sinonasal tissue from CF patients [111, 112].
Figure 9: Diagram of the oxidative metabolism of Arachidonic Acid (AA),
Eicosapentaenoic Acid (EPA) and Docosahexaenoic Acid (DHA). Eicosanoids
produced from AA, with the exception of lipoxins, have pro-inflammatory effects. On the
other hand, EPA and DHA-derived eicosanoids and resolvins have potent anti-
inflammatory properties.

35
To determine whether this alternative eicosanoid synthesis pathway was
upregulated in antisense cells, we measured both the expression and activity of COX and
LOX enzymes (Figure 10). COX-1 is constitutively expressed and is responsible for
housekeeping prostaglandin synthesis, and its mRNA levels were similar in sense and
antisense cells. Conversely, both COX-2 and 5-LOX were markedly overexpressed in
antisense cells and this was accompanied by increased production of PGE2 and LTB4 in
antisense cells compared to sense cells. That the pathways leading to the synthesis of
Figure 10: A. Relative mRNA expression of eicosanoid synthesis enzymes in 16HBE
cells. RNA was extracted and cDNA synthesized from sense and antisense cells as
described in the experimental procedures. qRT-PCR was performed using primers for the
mRNA sequences of cyclooxygenase-1 (COX-1), cyclooxygenase-2 (COX-2), and 5-
lipoxygenase (LOX-5). Relative expression was determined by the ΔΔCT method using
ribosomal protein RPLP0 as a control. Both COX-2 and 5-LOX expression levels were
significantly increased in antisense cells compared to sense cells. B. Eicosanoid
production. Prostaglandin E2 (PGE2) and Leukotriene B4 (LTB4) concentrations were
measured in culture media from sense and antisense cells by ELISA. Results are
expressed as total media eicosanoid per 106 cells. PGE2 and LTB4 production was
significantly higher in antisense cells. Bars represent mean ± SEM (n = 3). ** P< 0.01,
*** P<0.001 for sense vs. antisense cells.

36
eicosanoids from AA and EPA are increased in antisense cells suggests that perhaps these
pathways divert some of the substrate available for metabolism to 22:5n-6 and DHA.
Since PGE2 levels were increased in antisense cells, we decided to measure the
expression levels of the corresponding PGE2 receptors. PGE2 exerts its actions by acting
on specific G-protein coupled receptors including EP1, EP2, EP3 and EP4 receptors
[113]. The mRNA expression levels of the EP2 receptor were greatly upregulated in
antisense cells compared to sense cells (Figure 11). EP2 is linked to stimulation of cAMP
and PKA signaling through activation of Gαs and its overexpression in CF cells may help
promote the inflammatory actions of PGE2.
Figure 11: Relative mRNA expression of PGE2 receptor subtypes in 16HBE cells. RNA was extracted and cDNA synthesized from sense and antisense cells as described in
the experimental procedures. qRT-PCR was performed using commercially available
Taqman primers (Applied Biosystems) for the EP1, EP2, EP3 and EP4 receptors. Relative expression was determined by the ΔΔCT method using ribosomal protein RPLP0
as an invariant control. The EP2 receptor was the most differentially expressed, with
much higher expression in antisense cells compared to sense cells. Bars represent mean ±
SEM (n = 3). * P<0.05, ** P< 0.01, *** P<0.001 for sense vs. antisense cells.

37
To determine whether increased eicosanoid production was responsible for the
decreased metabolism of AA and EPA to 22:5n-6 and DHA, we chose to inhibit
prostaglandin synthesis in our cells and determine if this would normalize PUFA
metabolism. Sense and antisense cells were treated with a COX-2 specific small molecule
inhibitor known as NS-398 [114], or with an siRNA directed against COX-2 (Figure 12).
Figure 12: Relative COX-2 mRNA expression in 16HBE cells following COX-2
siRNA knockdown. RNA was extracted and cDNA synthesized from sense and
antisense cells (control, treated with a scrambled siRNA) along with antisense cells
treated with an siRNA directed against COX-2 as described in the experimental
procedures. qRT-PCR was performed using primers for the mRNA sequences of
cyclooxygenase-2 (COX-2). Relative expression was determined by the ΔΔCT method
using ribosomal protein RPLP0 as a control. The COX-2 siRNA treatment was very
effective and reduced COX-2 mRNA expression in the antisense cells to sense levels.
Bars represent mean ± SEM (n = 3), *** P<0.001.

38
Metabolism of 14
C radiolabeled AA to downstream fatty acids was then
measured. Neither COX-2 inhibition nor knockdown had any effect on AA to 22:5n-6
metabolism, which remained decreased in antisense cells compared to sense cells (Figure
13). Additionally, COX-2 inhibition did not attenuate the difference in metabolism of
14C-EPA to DHA (Figure 14) or
14C-LA to AA (data not shown) between sense and
antisense cells. To determine whether the expression levels of the metabolic enzymes
correlated with the observed PUFA metabolism, we measured desaturase mRNA
expression following COX-2 inhibition. Both Δ5 and Δ6-desaturase remained
overexpressed in antisense cells compared to sense cells even after inhibition of
prostaglandin synthesis (Figure 15).

39
Figure 13: Metabolism of AA through the n-6 pathway in 16HBE cells following
COX-2 inhibition. Sense and antisense cells were treated with vehicle (control), COX-2
inhibitor (10 uM NS-398) or COX-2 siRNA, and then incubated with 4.1 μM [14
C] AA in
reduced-lipid cell culture medium for 4 h as described in the experimental procedures.
Levels of radiolabeled AA (20:4n-6), 22:4n-6 and 22:5n-6 were determined by HPLC
and data presented as percent of total counts (cpm). Conversion of AA to downstream
fatty acids was decreased in the control antisense (CF) cells compared to sense (WT)
cells, and this was unchanged by COX-2 chemical inhibition or siRNA knockdown. Bars
represent mean ± SEM (n = 3).

40
Figure 14: Metabolism of EPA through the n-3 pathway in 16HBE cells following
COX-2 inhibition. Sense and antisense cells were treated with vehicle (control) or COX-
2 inhibitor (10 uM NS-398), and then incubated with 4.1 μM [14
C] EPA in reduced-lipid
cell culture medium for 4 h as described in the experimental procedures. Levels of
radiolabeled EPA (20:5n-3), 22:5n-3, 24:5n-3, 24:6n-3 and DHA (22:6n-3) were
determined by HPLC and data presented as percent of total counts (cpm). Conversion of
EPA to downstream fatty acids was decreased in the control antisense (CF) cells
compared to sense (WT) cells, and this was unchanged by COX-2 chemical inhibition.
Bars represent mean ± SEM (n = 3).

41
Figure 15: Relative mRNA expression of Δ5 and Δ6-desaturase enzymes in 16HBE
cells following COX-2 inhibition. RNA was extracted and cDNA synthesized from
sense and antisense cells treated with vehicle (control), 10 uM NS-398 or COX-2 siRNA
as described in the experimental procedures. qRT-PCR was performed using primers for
the mRNA sequences of Δ5-desaturase (FADS1) and Δ6-desaturase (FADS2). Relative
expression was determined by the ΔΔCT method using ribosomal protein RPLP0 as a
control. Both Δ5-desaturase and Δ6-desaturase expression levels were significantly
increased in antisense (CF) cells compared to sense (WT) cells, even after COX-2
inhibition or knockdown. Bars represent mean ± SEM (n = 3). * P<0.05, ** P< 0.01 for
sense vs. antisense cells. n.s (not significant).

42
To complement our in vitro cell culture experiments, we studied PUFA
metabolism in a well-characterized CF knockout mouse model. This model (cftrtm1Unc
)
was developed by introducing a stop codon in exon 10 of CFTR, thus disrupting the gene
[115]. These mice share many features with human CF patients including failure to
thrive, intestinal obstruction, small intestine bacterial overgrowth [90] and altered
gastrointestinal motility [116], making them an appropriate model to use. Failure to
thrive, indicated by consistently lower body weight and higher post-natal mortality, was
noted in our CF knockout mice, compared to WT mice (Figure 16).
Figure 16: Total body weight and percent survival in cftrtm1Unc
mice. CF mice
weighed less than WT mice throughout the course of the study, indicative of failure to
thrive. Additionally, CF mice had higher mortality rates within the first few days post-
weaning compared to WT mice.
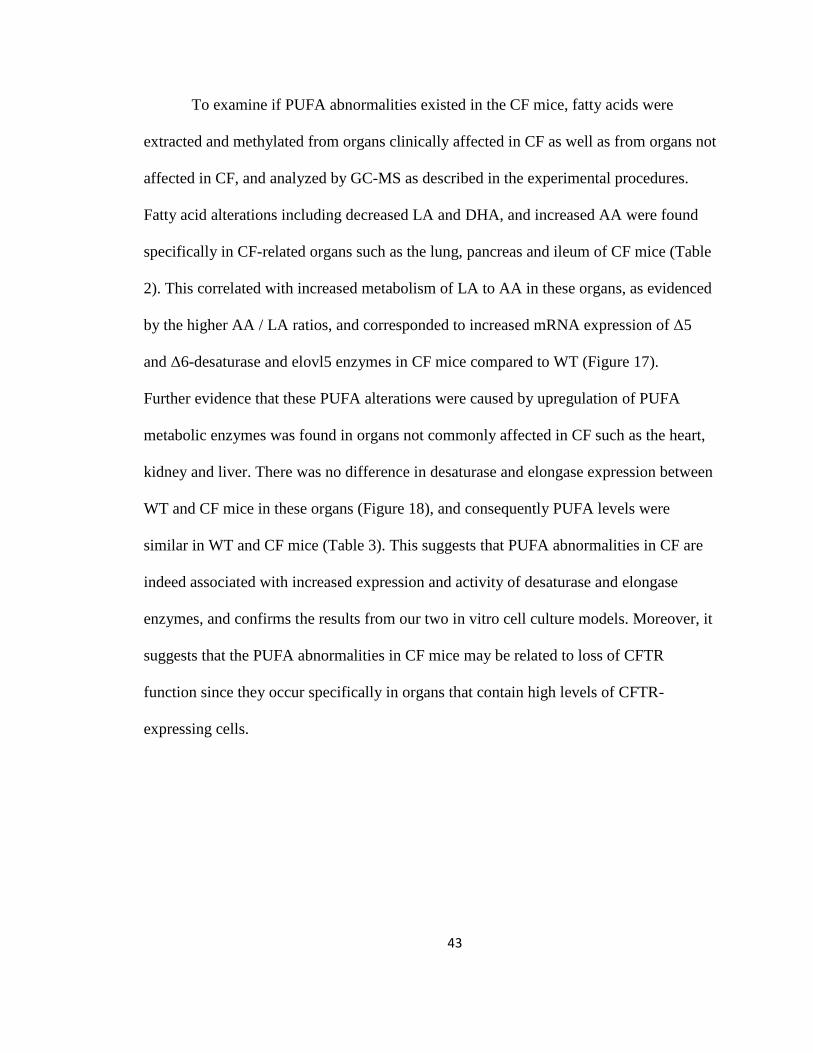
43
To examine if PUFA abnormalities existed in the CF mice, fatty acids were
extracted and methylated from organs clinically affected in CF as well as from organs not
affected in CF, and analyzed by GC-MS as described in the experimental procedures.
Fatty acid alterations including decreased LA and DHA, and increased AA were found
specifically in CF-related organs such as the lung, pancreas and ileum of CF mice (Table
2). This correlated with increased metabolism of LA to AA in these organs, as evidenced
by the higher AA / LA ratios, and corresponded to increased mRNA expression of Δ5
and Δ6-desaturase and elovl5 enzymes in CF mice compared to WT (Figure 17).
Further evidence that these PUFA alterations were caused by upregulation of PUFA
metabolic enzymes was found in organs not commonly affected in CF such as the heart,
kidney and liver. There was no difference in desaturase and elongase expression between
WT and CF mice in these organs (Figure 18), and consequently PUFA levels were
similar in WT and CF mice (Table 3). This suggests that PUFA abnormalities in CF are
indeed associated with increased expression and activity of desaturase and elongase
enzymes, and confirms the results from our two in vitro cell culture models. Moreover, it
suggests that the PUFA abnormalities in CF mice may be related to loss of CFTR
function since they occur specifically in organs that contain high levels of CFTR-
expressing cells.
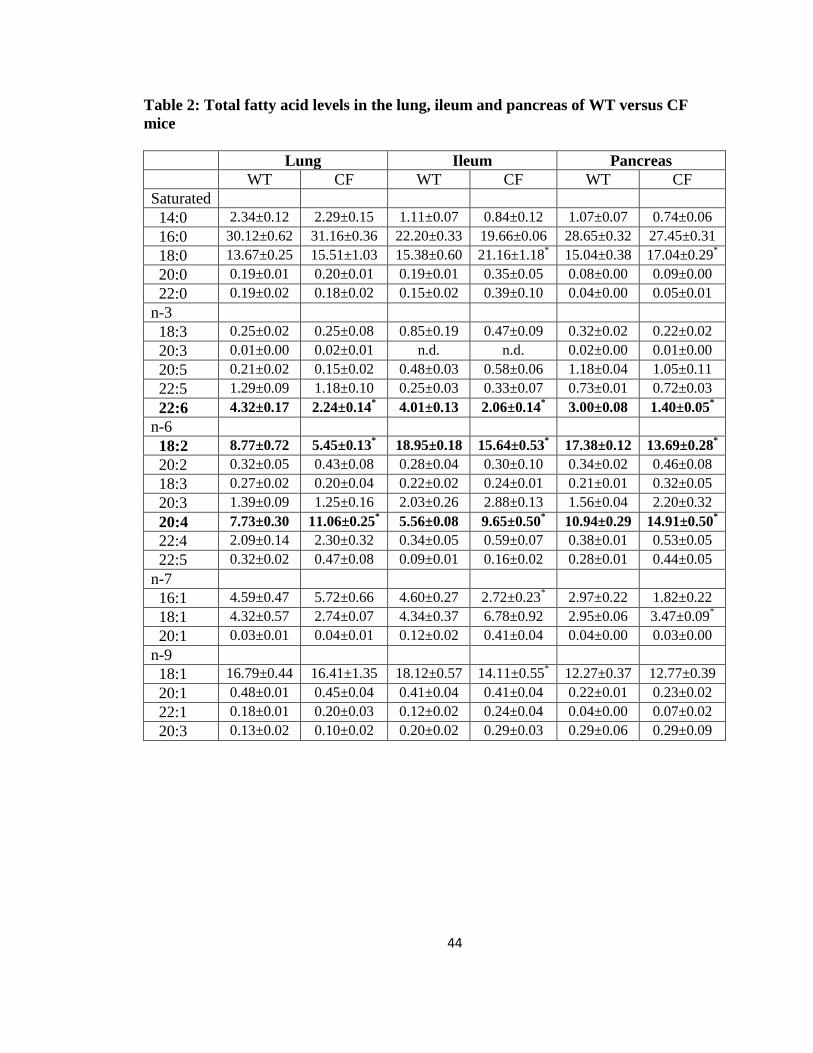
44
Table 2: Total fatty acid levels in the lung, ileum and pancreas of WT versus CF
mice
Lung Ileum Pancreas
WT CF WT CF WT CF
Saturated
14:0 2.34±0.12 2.29±0.15 1.11±0.07 0.84±0.12 1.07±0.07 0.74±0.06
16:0 30.12±0.62 31.16±0.36 22.20±0.33 19.66±0.06 28.65±0.32 27.45±0.31
18:0 13.67±0.25 15.51±1.03 15.38±0.60 21.16±1.18* 15.04±0.38 17.04±0.29
*
20:0 0.19±0.01 0.20±0.01 0.19±0.01 0.35±0.05 0.08±0.00 0.09±0.00
22:0 0.19±0.02 0.18±0.02 0.15±0.02 0.39±0.10 0.04±0.00 0.05±0.01
n-3
18:3 0.25±0.02 0.25±0.08 0.85±0.19 0.47±0.09 0.32±0.02 0.22±0.02
20:3 0.01±0.00 0.02±0.01 n.d. n.d. 0.02±0.00 0.01±0.00
20:5 0.21±0.02 0.15±0.02 0.48±0.03 0.58±0.06 1.18±0.04 1.05±0.11
22:5 1.29±0.09 1.18±0.10 0.25±0.03 0.33±0.07 0.73±0.01 0.72±0.03
22:6 4.32±0.17 2.24±0.14* 4.01±0.13 2.06±0.14
* 3.00±0.08 1.40±0.05
*
n-6
18:2 8.77±0.72 5.45±0.13* 18.95±0.18 15.64±0.53
* 17.38±0.12 13.69±0.28
*
20:2 0.32±0.05 0.43±0.08 0.28±0.04 0.30±0.10 0.34±0.02 0.46±0.08
18:3 0.27±0.02 0.20±0.04 0.22±0.02 0.24±0.01 0.21±0.01 0.32±0.05
20:3 1.39±0.09 1.25±0.16 2.03±0.26 2.88±0.13 1.56±0.04 2.20±0.32
20:4 7.73±0.30 11.06±0.25* 5.56±0.08 9.65±0.50
* 10.94±0.29 14.91±0.50
*
22:4 2.09±0.14 2.30±0.32 0.34±0.05 0.59±0.07 0.38±0.01 0.53±0.05
22:5 0.32±0.02 0.47±0.08 0.09±0.01 0.16±0.02 0.28±0.01 0.44±0.05
n-7
16:1 4.59±0.47 5.72±0.66 4.60±0.27 2.72±0.23* 2.97±0.22 1.82±0.22
18:1 4.32±0.57 2.74±0.07 4.34±0.37 6.78±0.92 2.95±0.06 3.47±0.09*
20:1 0.03±0.01 0.04±0.01 0.12±0.02 0.41±0.04 0.04±0.00 0.03±0.00
n-9
18:1 16.79±0.44 16.41±1.35 18.12±0.57 14.11±0.55* 12.27±0.37 12.77±0.39
20:1 0.48±0.01 0.45±0.04 0.41±0.04 0.41±0.04 0.22±0.01 0.23±0.02
22:1 0.18±0.01 0.20±0.03 0.12±0.02 0.24±0.04 0.04±0.00 0.07±0.02
20:3 0.13±0.02 0.10±0.02 0.20±0.02 0.29±0.03 0.29±0.06 0.29±0.09

45
Figure 17: A. LA to AA metabolism in CF-related organs of cftrtm1Unc
mice.
Increased metabolism of LA to AA was observed in the lung, pancreas and ileum of CF
mice compared to WT mice. B. Relative mRNA expression of PUFA metabolic
enzymes in lung and ileum of cftrtm1Unc
mice. RNA was extracted and cDNA
synthesized from the lung and ileum of WT and CF mice as described in the experimental
procedures. qRT-PCR was performed using commercial Taqman probes for the mRNA
sequences of Δ5-desaturase (D5D), Δ6-desaturase (D6D) and elongase 5 (EL5) .
Relative expression was determined by the ΔΔCT method using GAPDH as a control.
Consistent with the increased LA to AA metabolism, Δ5-desaturase, Δ6-desaturase and
elongase 5 mRNA expression levels were increased in the lung and ileum of CF mice
compared to WT mice. The expression levels of these enzymes was not studied in the
pancreas due to insufficient amount of tissue for RNA extraction. Bars represent mean ±
SEM (n = 6 or 7 mice).
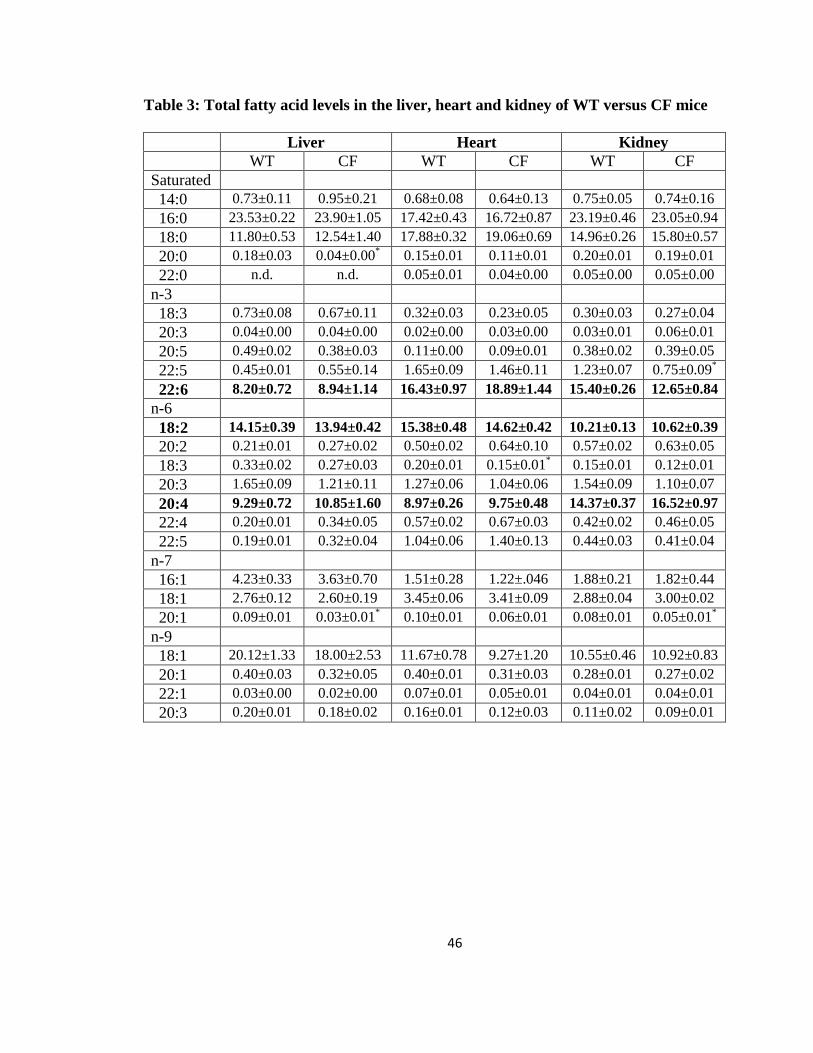
46
Table 3: Total fatty acid levels in the liver, heart and kidney of WT versus CF mice
Liver Heart Kidney
WT CF WT CF WT CF
Saturated
14:0 0.73±0.11 0.95±0.21 0.68±0.08 0.64±0.13 0.75±0.05 0.74±0.16
16:0 23.53±0.22 23.90±1.05 17.42±0.43 16.72±0.87 23.19±0.46 23.05±0.94
18:0 11.80±0.53 12.54±1.40 17.88±0.32 19.06±0.69 14.96±0.26 15.80±0.57
20:0 0.18±0.03 0.04±0.00* 0.15±0.01 0.11±0.01 0.20±0.01 0.19±0.01
22:0 n.d. n.d. 0.05±0.01 0.04±0.00 0.05±0.00 0.05±0.00
n-3
18:3 0.73±0.08 0.67±0.11 0.32±0.03 0.23±0.05 0.30±0.03 0.27±0.04
20:3 0.04±0.00 0.04±0.00 0.02±0.00 0.03±0.00 0.03±0.01 0.06±0.01
20:5 0.49±0.02 0.38±0.03 0.11±0.00 0.09±0.01 0.38±0.02 0.39±0.05
22:5 0.45±0.01 0.55±0.14 1.65±0.09 1.46±0.11 1.23±0.07 0.75±0.09*
22:6 8.20±0.72 8.94±1.14 16.43±0.97 18.89±1.44 15.40±0.26 12.65±0.84
n-6
18:2 14.15±0.39 13.94±0.42 15.38±0.48 14.62±0.42 10.21±0.13 10.62±0.39
20:2 0.21±0.01 0.27±0.02 0.50±0.02 0.64±0.10 0.57±0.02 0.63±0.05
18:3 0.33±0.02 0.27±0.03 0.20±0.01 0.15±0.01* 0.15±0.01 0.12±0.01
20:3 1.65±0.09 1.21±0.11 1.27±0.06 1.04±0.06 1.54±0.09 1.10±0.07
20:4 9.29±0.72 10.85±1.60 8.97±0.26 9.75±0.48 14.37±0.37 16.52±0.97
22:4 0.20±0.01 0.34±0.05 0.57±0.02 0.67±0.03 0.42±0.02 0.46±0.05
22:5 0.19±0.01 0.32±0.04 1.04±0.06 1.40±0.13 0.44±0.03 0.41±0.04
n-7
16:1 4.23±0.33 3.63±0.70 1.51±0.28 1.22±.046 1.88±0.21 1.82±0.44
18:1 2.76±0.12 2.60±0.19 3.45±0.06 3.41±0.09 2.88±0.04 3.00±0.02
20:1 0.09±0.01 0.03±0.01* 0.10±0.01 0.06±0.01 0.08±0.01 0.05±0.01
*
n-9
18:1 20.12±1.33 18.00±2.53 11.67±0.78 9.27±1.20 10.55±0.46 10.92±0.83
20:1 0.40±0.03 0.32±0.05 0.40±0.01 0.31±0.03 0.28±0.01 0.27±0.02
22:1 0.03±0.00 0.02±0.00 0.07±0.01 0.05±0.01 0.04±0.01 0.04±0.01
20:3 0.20±0.01 0.18±0.02 0.16±0.01 0.12±0.03 0.11±0.02 0.09±0.01
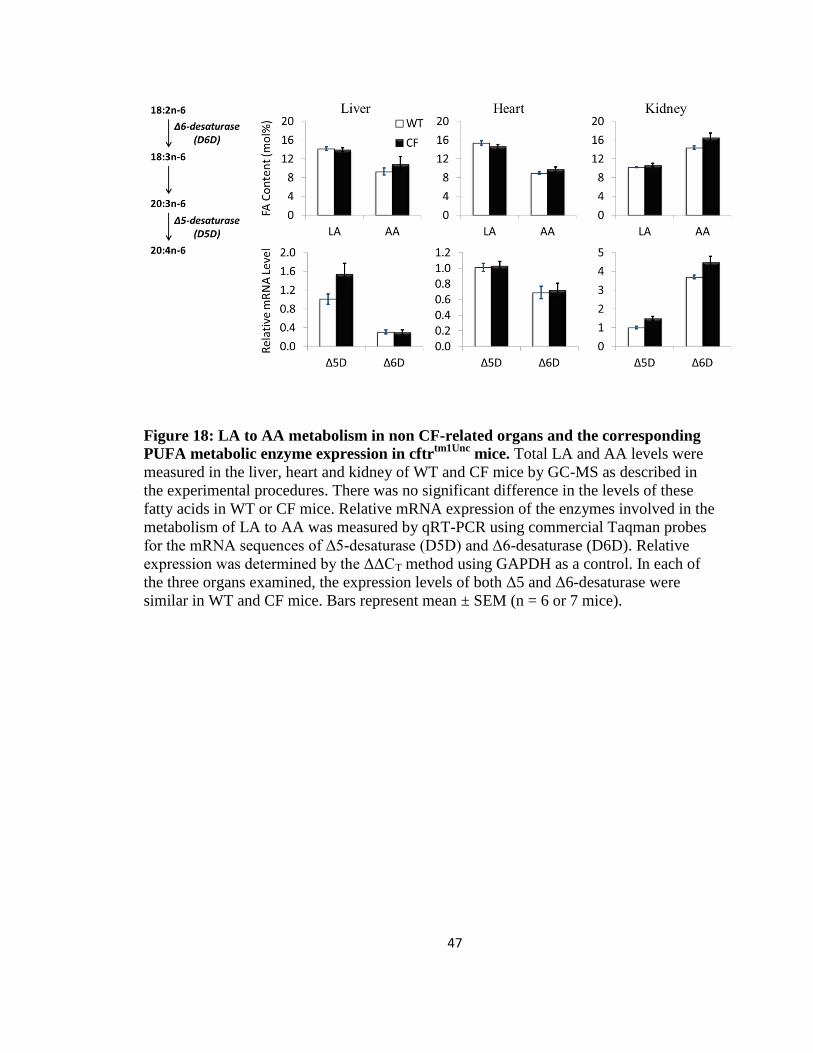
47
Figure 18: LA to AA metabolism in non CF-related organs and the corresponding
PUFA metabolic enzyme expression in cftrtm1Unc
mice. Total LA and AA levels were
measured in the liver, heart and kidney of WT and CF mice by GC-MS as described in
the experimental procedures. There was no significant difference in the levels of these
fatty acids in WT or CF mice. Relative mRNA expression of the enzymes involved in the
metabolism of LA to AA was measured by qRT-PCR using commercial Taqman probes
for the mRNA sequences of Δ5-desaturase (D5D) and Δ6-desaturase (D6D). Relative
expression was determined by the ΔΔCT method using GAPDH as a control. In each of
the three organs examined, the expression levels of both Δ5 and Δ6-desaturase were
similar in WT and CF mice. Bars represent mean ± SEM (n = 6 or 7 mice).

48
In addition to the classic PUFA alterations, changes in the levels of certain
saturated and monounsaturated fatty acids were observed in CF mice compared to WT
mice. The levels of 18:0 were higher in the ileum and pancreas of CF mice, leading to
higher 18:0 to 16:0 ratios (Figure 19). 18:1n-7 was also increased in CF pancreas and
ileum, although the increase was only statistically significant in the pancreas (Table 2).
This suggests that the activity of elongase 6, which is the enzyme responsible for these
reactions, is increased in the ileum and pancreas of CF mice. Conversely, the ratios of
16:1n-7 to 16:0 and 18:1n-9 to 18:0 were decreased in the ileum of CF mice, suggesting a
decrease in the expression and activity of Δ9-desaturase.
Figure 19: Metabolism of saturated and monounsaturated fatty acids in the lung, ileum
and pancreas of cftrtm1Unc mice. Increased metabolism of 16:0 to 18:0, and 16:1n-7 to
18:1n-7, was observed in the ileum and pancreas of CF mice, suggesting increased elovl6
activity. Metabolism of 16:0 to 16:1n-7 was decreased in the ileum and pancreas of CF mice,
while 18:0 to 18:1n-9 metabolism was decreased in the CF ileum, indicating decreased Δ9-
desaturase activity. No significant differences in saturated or monounsaturated fatty acids
were detected in the lung of CF mice compared to WT mice. Data are expressed as mean ±
SEM (n = 6 or 7 mice).

49
Analogous to CF bronchial epithelial cells in culture, lung epithelial cells from CF
mice showed elevated expression levels of COX-2 and 5-LOX. Moreover, the mRNA
expression of microsomal prostaglandin E2 synthase-1 (mPGES-1) was upregulated in the
lungs of CF mice compared to WT (Figure 20). mPGES-1 is an inducible terminal
prostaglandin synthase that works in concert with COX-2 to produce inflammatory PGE2.
The fact that the expression of these enzymes is increased points to the possibility of
increased inflammation in the lungs of CF mice. On the other hand, the mRNA
expression of COX-2, 5-LOX and mPGES-1 did not differ between WT and CF mice in
organs unaffected by CF including heart and liver (Figure 20). In fact, 5-LOX expression
in heart tissue of CF mice was downregulated compared to WT mice while in the liver,
mPGES-1 expression was lower in CF than in WT mice. This suggests that the
production of pro-inflammatory mediators may be increased in CF mice, and specifically
in CF-related organs that exhibit the characteristic PUFA abnormalities.

50
Figure 20: Relative mRNA expression of eicosanoid synthesis enzymes in cftrtm1Unc
mice. RNA was extracted and cDNA synthesized from the lung, heart and liver of WT
and CF mice as described in the experimental procedures. qRT-PCR was performed
using commercial Taqman probes for the mRNA sequences of cyclooxygenase-2
(COX-2), 5-lipoxygenase (5-LOX) and microsomal PGE2 synthase-1 (mPGES-1).
Relative expression was determined by the ΔΔCT method using GAPDH as a control.
COX-2, 5-LOX and mPGES-1 were all significantly overexpressed in the lungs of CF
mice compared to WT mice. The expression levels of these enzymes was either similar or
decreased in the heart and liver of CF mice compared to WT. Bars represent mean ±
SEM (n = 6 or 7 mice).

51
Discussion
Mechanisms of PUFA alterations in CF
It is widely established that there are decreased levels of LA and DHA, and
increased levels of AA in blood and tissue of CF patients, as well as in CF experimental
models [8-16]. These fatty acid alterations are independent of nutritional status, and are
consistent enough such that plasma fatty acid measurements can be used to differentiate
CF versus non-CF patients [85]. Although PUFA abnormalities have been well studied
and documented in the CF literature, the underlying mechanisms responsible for the
PUFA changes are unknown. In this chapter, we show that these changes are caused by
increased expression and activity of the enzymes that metabolize PUFAs, including Δ5
and Δ6-desaturase. Increased expression and activity of both Δ5 and Δ6-desaturase
consume LA in its conversion to AA, leading to the lower LA and increased AA levels
seen in CF. These findings have been confirmed in two different CF cell culture models
(16HBE sense and antisense cells in which CFTR expression is modulated by expression
of a sense or antisense transgene; and IB3 and C38 cells derived from a CF patient with
the common ΔF508 mutation) and in vivo in the cftrtm1Unc
knockout mouse model. In CF
mice, PUFA abnormalities are found specifically in the organs most affected by CF
including lung, pancreas and ileum and they correspond to higher desaturase and
elongase expression (Figure 17). Moreover in organs that express little or no cftr protein
such as heart, kidney and liver, the mRNA expression of Δ5 and Δ6-desaturase is similar
in WT and CF mice (Figure 18). Consequently, there are no differences in PUFA levels
in these organs. This further proves that the fatty acid alterations commonly found in CF
result from dysregulation of PUFA metabolic enzymes.

52
Through our systematic, parallel comparison of the n-6 and n-3 metabolic
pathways (Figure 5), we illustrate that metabolism from LA to AA and from LNA to EPA
is increased in CF cells. The fact that the early metabolic steps in the n-3 pathway are
upregulated excludes relatively decreased activity of the entire n-3 pathway as an
explanation for the low DHA levels in CF. However, our experiments demonstrate that
the later steps of PUFA metabolism from AA to 22:5n-6 and from EPA to DHA are
significantly decreased in CF (Figure 6). While this may account for the low levels of
DHA observed in CF, it cannot be explained by the PUFA desaturase and elongase
expression profiles. The enzymes involved in metabolism in this lower part of the
pathway are elovl2, elovl5 and Δ6-desaturase (Figure 1). Both elovl2 and 5 are expressed
at similar levels in WT and CF cells, while Δ6-desaturase is upregulated in CF cells.
Based on the enzyme expression levels we might expect to see higher DHA levels in CF
and yet this is not the case.
To further assess the step at which metabolism from EPA to DHA is altered in
CF, we studied metabolism of the fatty acid immediately downstream of EPA, 22:5n-3, to
DHA. The overall metabolism of 22:5n-3 to DHA was equivalent in sense and antisense
cells (Figure 8), suggesting that the decreased metabolism of EPA to DHA occurs at the
EPA to 22:5n-3 step. In addition to EPA and AA serving as substrates that can be
metabolized to longer, more desaturated PUFAs, they can also be metabolized to
eicosanoids. Thus, we hypothesized that a portion of EPA and AA is diverted towards
eicosanoid synthesis, reducing the amount of substrate to be converted to DHA and
22:5n-6. If this pathway leading to eicosanoid biosynthesis is upregulated in CF, that
could explain why DHA levels are so low. Consistent with this hypothesis, we found that

53
the enzymes involved in eicosanoid synthesis, COX-2 and 5-LOX, were greatly
overexpressed in the antisense cells and CF mice (Figures 10 and 20), leading to
increased production of PGE2 and LTB4 in antisense cells. Furthermore, we observed that
there was no difference in COX-2 and 5-LOX mRNA levels in the IB3 and C38 cell line
(data not shown), and this correlated with no difference in DHA levels between IB3 and
C38 cells. These results suggest a link between increased eicosanoid synthesis and
decreased metabolism of AA and EPA. We chose to investigate this link and examine the
effect of modulating eicosanoid synthesis on PUFA metabolism. Prostaglandin synthesis
was blocked in our cells using either a COX-2 specific inhibitor or a COX-2 siRNA.
Contrary to the hypothesis, we found that COX-2 inhibition did not correct the decreased
metabolism of AA and EPA to 22:5n-6 and DHA in antisense cells (Figures 13 and 14).
It is possible that the AA and EPA that is processed to eicosanoids is in a different
metabolically active pool than the 14
C radiolabeled AA and EPA that gets metabolized to
longer, more desaturated PUFAs. If this is the case, then although inhibition of COX-2
may have an effect on AA and EPA metabolism, it may not be observed because the fatty
acids are in the “wrong” fatty acid pools for metabolism to eicosanoids. Alternatively, it
is possible that COX-2 inhibition has no effect on PUFA metabolism, as some studies
report that only a small percentage (<5%) of AA and EPA is actually converted to
eicosanoids upon agonist stimulation [117]. Future studies designed to distinguish the
different metabolically active pools of AA and EPA are needed to determine whether
overproduction of eicosanoids contributes to the low levels of DHA in CF.

54
Role of PUFA alterations in CF pathophysiology
Several studies indicate that the degree of PUFA alterations in CF correlates with
disease severity [21- 22, 118]. Moreover, it has been reported that correcting the PUFA
imbalances in a CF knockout mouse model can reverse some of the pathologic
manifestations of disease [13, 14]. These findings imply that PUFA alterations play a key
role in CF pathophysiology. One of the common PUFA changes present in CF is
increased AA levels. In our studies, we show that the increased AA, coupled with
increased expression and activity of COX-2 and 5-LOX results in increased production of
pro-inflammatory PGE2 and LTB4 in CF cells (Figure 21). Additionally, expression of the
EP2 receptor is upregulated in CF cells, which could facilitate the inflammatory actions
of PGE2. In CF mice, we show that AA is increased in CF-related organs such as the
lung, and that this is accompanied by increased COX-2, mPGES-1 and 5-LOX
expression. This points towards increased production of PGE2 and LTB4 in the organs
most affected in CF. We believe that the increased concentration of pro-inflammatory
eicosanoids can contribute to CF development as these eicosanoids regulate numerous of
the physiologic processes that lead to CF, including secretion, gut motility and
inflammation. Elevated prostaglandin levels contribute to excessive mucus secretion
[119], which is a hallmark of CF. This creates an environment that fosters abnormal
bacterial overgrowth and alters gut function. In addition, increased PGE2 levels are
thought to cause uncoordinated smooth muscle contractions, leading to intestinal
dysmotility [120-122]. Eicosanoids are also involved in the regulation of inflammation,
which plays a vital role in CF disease. Early in life, CF patients begin to exhibit
exaggerated inflammatory profiles, particularly in the lungs [123-125]. Over the course

55
of time, these responses become more persistent and eventually lead to a decline in
pulmonary function, destruction of lung tissue and respiratory failure. The increased
conversion of AA to pro-inflammatory eicosanoids may also be responsible for
stimulating increased metabolism of LA to maintain AA levels, leading to the decreased
LA and increased AA seen in CF.
Decreased DHA is another PUFA abnormality found in CF. DHA can be
metabolized to potent anti-inflammatory mediators (Figure 9) [126]. That DHA levels are
low in CF means there is less initial substrate to be metabolized into resolvins and
protectins and this can further shift the inflammatory balance towards a more pro-
inflammatory state and contribute to CF pathogenesis. Additionally, DHA levels can
influence the eicosanoid profile in CF because DHA competes with pro-inflammatory
AA for esterification at the sn-2 position of phospholipids. In this way, DHA can act as
an anti-inflammatory agent by downregulating the levels of phospholipid-bound AA. We
show that DHA levels are significantly decreased in cultured CF cells as well as in CF-
related organs of CF mice compared to WT mice (Table 2). Further experiments are
needed to determine the levels of anti-inflammatory eicosanoids synthesized from AA,
and the levels of DHA-derived resolvins and protectins in CF versus WT mice, in order
to verify whether these fatty acid abnormalities really do contribute to inflammation in
CF. Experiments to test the effect of exogenous resolvin or protectin treatment, as well as
COX-2 and 5-LOX inhibition, on the pathogenesis of CF in our mouse model would also
help to answer these questions.

56
Figure 21: Diagram of polyunsaturated fatty acid and eicosanoid changes in CF.
Increased expression and activity of Δ5 and Δ6-desaturase enzymes leads to increased
metabolism of LA to AA in CF (dark arrows indicate increased metabolism while light
arrows indicate decreased metabolism). This increase in AA levels, coupled with
increased expression and activity of COX-2, mPGES-1 and 5-LOX, leads to increased
synthesis of pro-inflammatory PGE2 and LTB4. This in turn promotes excessive mucus
secretion, bacterial overgrowth and increased inflammation, all of which are hallmarks of
CF disease. In addition, metabolism of EPA to DHA is decreased in CF, leading to low
levels of DHA. This results in less substrate available for conversion to anti-
inflammatory resolvins and protectins, as well as less DHA available to compete with AA
for phospholipid esterification. Taken together, the above PUFA and eicosanoid
alterations contribute to increased inflammation in CF, and may play an important role in
CF pathophysiology.

57
CHAPTER III
EFFECT OF DHA AND EPA SUPPLEMENTATION ON PUFA
METABOLISM AND THE PATHOGENESIS OF CYSTIC FIBROSIS
Introduction
DHA deficiency has been suggested to contribute to the pathophysiology of CF
partly because supplementing CF mice with large amounts of DHA leads to reversal of
CF-related pathology, including relief of pancreatic duct dilation, decrease in stimulated
neutrophil accumulation into BAL fluid and normalization of ileal histology. DHA
supplementation also corrects the fatty acid abnormalities in lung, pancreas and intestine
tissue of CF mice [13]. In the same study, the authors show that this beneficial effect is
only apparent when the mouse diet is enriched with DHA and not other PUFAs such as
EPA or LNA. Therefore it is possible that certain phenotypic manifestations of CF result
from decreased levels of DHA, and that rectifying this by increasing DHA levels and
decreasing AA levels leads to normalization of CF phenotype. Nevertheless, the
mechanism through which DHA corrects CF fatty acid abnormalities and ultimately
reverses the CF phenotype in cftr-/-
mice remains unknown. Additionally, it is unclear
whether other fatty acids besides DHA can elicit a similar therapeutic effect.
The aim of the experiments described in this chapter was to investigate potential
mechanisms by which DHA might correct PUFA alterations in CF and reverse the CF
phenotype, and compare this effect to that of other PUFAs. We examined the effect of
DHA supplementation on PUFA metabolism in 16HBE cells. The effect of additional
fatty acids including EPA, AA, LNA, a monounsaturated fatty acid, oleic acid (OA) and a

58
saturated fatty acid, palmitic acid (PA) were also tested. To address the in vivo
mechanism of DHA function, we studied the effect of DHA and EPA supplementation on
PUFA metabolism and CF pathology in cftrtm1Unc
mice. In these experiments, the mouse
diet was enriched with DHA in free fatty acid (FFA) form or as a triglyceride (TG) in
combination with EPA.
Experimental Procedures
Fatty acid supplementation
16HBE sense (WT) and antisense (CF) cells were seeded onto 6-well plates at a
density of 3×10⁵ and 1×10
5 cells/well respectively. The cells were grown until confluent,
then supplemented with 0, 5, 10 or 20 µM fatty acid for 24 h. The fatty acids used for
supplementation included FFA DHA, EPA, AA, LNA, OA and PA. To prepare the
supplementation media, the FFAs were placed in a glass tube and dried down completely
under nitrogen gas. The dried fatty acids were then resuspended in media containing 10%
reduced-lipid fetal bovine serum by vortexing and sonication, and added to the cells.
After 24 h incubation with or without fatty acid supplementation, the cells were
harvested, lipids extracted and methylated and fatty acid composition analyzed by GC-
MS. In addition, total RNA was isolated from fatty acid supplemented cells and qRT-
PCR used to assess the expression levels of PUFA metabolic enzymes using the primers
shown in Table 1. Fatty acid radiolabeling experiments were also performed in cells
following FFA supplementation. In these studies, after 24 h fatty acid supplementation,
16HBE cells were incubated with 4.1µM 14
C-LA, 14
C-LNA, 14
C-AA or 14
C-EPA for 4h
and then harvested. Metabolism of the radiolabeled fatty acids was analyzed by HPLC

59
coupled to a β-RAM scintillation detector. The methods used for fatty acid extraction,
methylation, HPLC or GC-MS analysis and qRT-PCR are outlined in the previous
chapter.
Mice
Cftrtm1Unc
WT and CF mice were weaned at 23 days of age and placed on one of
the two fatty acid supplementation diets described below:
Diet 1: Peptamen + DHA diet (n = 6 or 7 per group). After weaning, the mice were
maintained on Peptamen (Nestle Clinical Nutrition, Deerfield, IL) and had access to
water ad libitum for seven days. On day 30, the mice were continued on the Peptamen
diet with or without 40 mg per day of FFA DHA, prepared as a stable emulsion in
Peptamen. The mice were maintained on the Peptamen + DHA diet for seven days and
then sacrificed.
Diet 2: Peptamen AF diet (n = 6 or 7 per group). After weaning, the mice were placed on
either the Peptamen diet (control) or on a variation of Peptamen containing a combination
of TG DHA and EPA (Peptamen Advanced Formulation, AF) (Nestle Clinical Nutrition,
Deerfield, IL) for 14 days then sacrificed.
WT and CF mice were housed individually to ensure each mouse received the
correct dosage of the fatty acid supplement. Fresh peptamen was provided daily, at which
time the weight of the mice as well as the volume of Peptamen consumed was measured.
Mice were sacrificed two weeks post-weaning and various organs as well as plasma
collected for fatty acid and gene expression analysis as described in the previous chapter.
60
Histopathology
For sample preparation, lung and ileum tissues were submerged in 10% neutral
buffered formalin and fixed overnight. The tissues were processed routinely, embedded
in paraffin, sectioned at 4 microns, and stained with hematoxylin and eosin. Slides were
evaluated on an Olympus BX41 microscope by a pathologist blinded to the composition
of the treatment groups. To analyze impaction of paneth cell secretions in the intestinal
villi, the slides were scanned on an Aperio Scanscope CS2 (Aperio, Vista, CA) and
scored according to the following criteria:
0 - no impaction of secretory products in the crypts
1 - impacted secretory material in the deep portion of the crypts in <10% of the crypts
2 - impaction of secretory material in the deep portion of the crypts in 10-30% of crypts,
with rare accumulation of material in the bottom third of the villus
3 - impaction of secretory material in 30-70% of the crypts, with accumulation of
material commonly observed up to the top third of the crypt
4 - impaction of secretory material in >70% of the crypts, with frequent dilation of the
crypts and presence of material in the top third of the villus
Additionally, periodic acid schiff staining was performed to identify goblet cells in the
small intestine. The presence (marked, moderate or mild), or absence of goblet cell
hyperplasia was recorded.

61
Results
16HBE sense (WT) and antisense (CF) cells were treated with 20 µM DHA for
24 h and total fatty acid composition measured by GC-MS. The common PUFA
alterations were present in untreated CF cells (Figure 22). These included decreased LA
with increased 18:3n-6, 20:3n-6, AA and EPA, suggestive of increased metabolism of LA
to AA and LNA to EPA. Levels of 22:4n-6, 22:5n-6 and DHA were also significantly
decreased in CF cells compared to WT cells, indicating decreased metabolism in the later
steps of the n-3 and n-6 pathways. The higher levels of 22:5n-3 observed in CF cells were
likely explained by the fact that the initial substrate, EPA, was much higher in CF cells
and not because of increased metabolism. Accordingly, the 22:5n-3/EPA ratio was
markedly lower in CF cells than in WT cells (2.0 ± 0.03 versus 10.5 ± 0.6; P < 0.001).
DHA-treatment caused an increase in DHA levels in both WT and CF cells, but more so
in CF cells. Moreover, supplementing the cells with DHA led to a significant decrease in
AA levels in CF cells, decreasing them to WT levels.
To assess whether this change in AA levels was caused by decreased metabolism
of LA to AA, DHA-treated cells were incubated with 14
C-LA and metabolism of LA to
AA measured (Figure 23A). DHA treatment caused a dose-dependent decrease in the
production of radiolabeled AA, accompanied by a dose-dependent increase in LA. This
was observed in both WT and CF cells, with a greater effect seen in CF cells and
indicated that DHA could suppress the metabolism of LA to AA. Metabolism of 14
C-
LNA to EPA was also decreased following DHA supplementation (Figure 23B).

62
Figure 22: Total fatty acid composition of 16HBE cells with or without DHA
supplementation. WT and CF cells were incubated with or without 20 µM DHA for 24
h, then harvested and total fatty acid composition measured by GC-MS as described in
the experimental procedures. Individual fatty acid concentrations are expressed as molar
percentage (mol %) of total fatty acids. Supplementation with DHA caused an increase in
DHA levels in both WT and CF cells, as well as an increase in EPA levels specifically in
CF cells. A significant decrease in AA levels was also noted in CF cells. Bars represent
mean ± SEM (n = 3), and unlike letters indicate significant differences in pair-wise
comparisons.

63
Figure 23: Metabolism of LA and LNA through the n-6 and n-3 pathways in 16HBE
cells supplemented with DHA. WT and CF cells were supplemented with 0, 5, 10, or 20
µM DHA for 24 h. Following DHA supplementation, the cells were incubated with 4.1
µM 14
C-LA (A) or 4.1 µM 14
C-LNA (B) for 4 h and then harvested. Levels of
radiolabeled LA and AA (A) or LNA and EPA (B) were determined by HPLC as
described in the experimental procedures. Data are expressed as percentage of total
counts (cpm). DHA supplementation suppressed metabolism of LA and LNA in WT and
CF cells, but more so in CF cells. Each point represents mean ± SEM (n = 3).

64
DHA treatment did not correct the decreased metabolism of AA and EPA in CF
cells. Instead it caused a minimal decline in the already low levels of 22:5n-6 (DPA) and
DHA (Figure 24). Additionally, metabolism of 14
C-AA to DPA was significantly reduced
in WT cells, with the greatest effect seen after treatment with 20 µM DHA.
Figure 24: Metabolism of AA and EPA through the n-6 and n-3 pathways in 16HBE
cells supplemented with DHA. WT and CF cells were supplemented with 0, 5, 10, or 20
µM DHA for 24 h. Following DHA supplementation, the cells were incubated with 4.1
µM 14
C-AA (A) or 4.1 µM 14
C-EPA (B) for 4 h and then harvested. Levels of
radiolabeled AA and DPA (A) or EPA and DHA (B) were determined by HPLC as
described in the experimental procedures. Data are expressed as percentage of total
counts (cpm). DHA supplementation caused a modest decline in AA and EPA
metabolism in CF cells while metabolism of AA to DPA was drastically reduced in WT
cells. Each point represents mean ± SEM (n = 3).

65
Unexpectedly, we observed that the levels of EPA increased significantly in CF,
but not in WT cells following DHA treatment (Figure 22). In contrast, in the
corresponding n-6 part of the pathway, levels of AA were decreased following DHA
treatment. The change in EPA levels could not be explained by increased metabolism of
LNA to EPA as this part of the pathway was suppressed by DHA treatment (Figure 23B).
Previous reports have described a process known as DHA retroconversion whereby DHA
is converted to EPA through a series of enzymatic reactions [127-129]. To determine
whether DHA retroconversion was responsible for the increased EPA levels, we
measured retroconversion in our cells [ΔEPA / (ΔEPA + ΔDHA)] and found that this
process was 20X greater in CF than in WT cells.
To investigate the specificity of the DHA effect, 16HBE cells were also
supplemented with increasing concentrations of EPA and fatty acid composition and
metabolism measured. EPA treatment led to an increase in EPA levels in both WT and
CF cells, albeit more so in CF cells (Figure 25). This was accompanied by an increase in
downstream metabolites of EPA including 22:5n-3 and DHA. However, these increases
were more significant in WT compared to CF cells such that the levels of DHA remained
lower in CF cells following EPA supplementation. EPA treatment also caused a decrease
in AA levels in WT and CF cells. In terms of PUFA metabolism, EPA supplementation
resulted in a dose-dependent decrease in conversion of 14
C-LA to AA and 14
C-LNA to
EPA (Figure 26). This effect was greater in CF than in WT cells and was similar to what
was observed following DHA treatment.

66
Figure 25: Total fatty acid composition of 16HBE cells with or without EPA
supplementation. WT and CF cells were incubated with or without 20 µM EPA for 24 h,
then harvested and total fatty acid composition measured by GC-MS as described in the
experimental procedures. Individual fatty acid concentrations are expressed as molar
percentage (mol %) of total fatty acids. Supplementation with EPA caused an increase in
EPA levels in both WT and CF cells, as well as an increase in downstream metabolites of
EPA including 22:5n-3 and DHA. A significant decrease in AA levels was also noted in
both WT and CF cells. Bars represent mean ± SEM (n = 3), and unlike letters indicate
significant differences in pair-wise comparisons.

67
Figure 26: Metabolism of LA and LNA through the n-6 and n-3 pathways in 16HBE
cells supplemented with EPA. WT and CF cells were supplemented with 0, 5, 10, or 20
µM EPA for 24 h. Following EPA supplementation, the cells were incubated with 4.1
µM 14
C-LA (A) or 4.1 µM 14
C-LNA (B) for 4 h and then harvested. Levels of
radiolabeled LA and AA (A) or LNA and EPA (B) were determined by HPLC as
described in the experimental procedures. Data are expressed as percentage of total
counts (cpm). EPA supplementation suppressed metabolism of LA and LNA in WT and
CF cells, but more so in CF cells. Each point represents mean ± SEM (n = 3).
68
Metabolism of 14
C-AA to 14
C-DPA was significantly reduced in EPA-treated WT
cells, with only a modest decrease observed in CF cells (Figure 27). The effect of EPA
supplementation on metabolism of 14
C-EPA to 14
C-DHA appeared to be concentration-
dependent. Specifically, metabolism was increased in both WT and CF cells at low EPA
concentrations (5 µM), but returned to baseline levels when the cells were supplemented
with higher concentrations of EPA (20 µM). From these experiments, we concluded that
there was little difference in the effect of DHA versus EPA on PUFA metabolism. The
action of additional fatty acids (AA, LNA, OA and PA) on PUFA metabolism was tested.
We discovered that AA and LNA supplementation had a similar effect on metabolism as
DHA and EPA, but to a much lesser extent. In contrast, OA and PA did not have any
effect on PUFA metabolism (data not shown). This suggests there is a hierarchy in terms
of the effect of these fatty acids on PUFA metabolism. PUFAs such as DHA and EPA
have the greatest ability to suppress LA to AA metabolism, followed by AA, LNA, OA
and lastly, PA. This order [DHA and EPA > AA > LNA > OA > PA] implies that the
effect of these fatty acids on PUFA metabolism may be regulated by the number of
double bonds in the supplemented fatty acid.
We postulated that the mechanism through which DHA and EPA affected PUFA
metabolism in CF cells was by acting on the expression and/or activity of PUFA
metabolic enzymes. The mRNA expression levels of Δ5 and Δ6 desaturase, elovl2 and
elovl5 were measured in WT and CF cells after DHA and EPA supplementation. In the
absence of DHA or EPA, the expression levels of both Δ5 and Δ6 desaturase were
upregulated in CF cells (Figure 28A and B). However, as little as 5 µM DHA or EPA was
sufficient to reduce desaturase expression in CF cells to the level of WT cells, while

69
elovl2 and 5 expression levels were either slightly decreased or unchanged (Figure 28C
and D). AA and LNA supplementation also reduced the expression of the desaturase
enzymes but to a lesser degree than DHA and EPA (for instance, AA and LNA reduced
Δ6-desaturase mRNA by 48% and 45% respectively, whereas DHA and EPA reduced
expression by 68% and 73% respectively), while OA and PA had no significant effect on
desaturase expression (Figure 28E). Thus we established that the suppression of PUFA
metabolism following DHA and EPA supplementation is attributable to downregulation
of Δ5 and Δ6 desaturase gene expression.
Figure 27: Metabolism of AA and EPA through the n-6 and n-3 pathways in 16HBE
cells supplemented with EPA. WT and CF cells were supplemented with 0, 5, 10, or 20
µM EPA for 24 h. Following EPA supplementation, the cells were incubated with 4.1
µM 14
C-AA (A) or 4.1 µM 14
C-EPA (B) for 4 h and then harvested. Levels of
radiolabeled AA and DPA (A) or EPA and DHA (B) were determined by HPLC as
described in the experimental procedures. Data are expressed as percentage of total
counts (cpm). EPA supplementation caused a minimal decline in AA and EPA
metabolism in CF cells while metabolism of AA to DPA was significantly reduced in WT
cells. Each point represents mean ± SEM (n = 3).

70
Figure 28: PUFA metabolic enzyme gene expression following DHA, EPA and PA
supplementation. WT and CF cells were supplemented with 0, 5, 10 or 20 µM DHA (A-
D, left) or EPA (A-D, right) or 20 µM PA (E) for 24 h. Total RNA was isolated and
cDNA synthesized from the cells as described in the experimental procedures. qRT-PCR
was performed using primers for the mRNA sequences of Δ5-desaturase (FADS1), Δ6-
desaturase (FADS2), elongase 2 (ELOVL2), and elongase 5 (ELOVL5). Relative
expression was determined by the ΔΔCT method using ribosomal protein RPLP0 as a
control. Both DHA and EPA supplementation reduced the expression of desaturase genes
in CF cells to WT levels. There was no significant effect on gene expression after PA
supplementation. Data points represent mean ± SEM (n = 3).

71
In addition to our in vitro cell culture experiments, we studied the mechanism of
DHA and EPA action on PUFA metabolism in the cftrtm1Unc
mouse model. Previous
studies have shown that feeding CF mice a diet containing large amounts of FFA DHA
can decrease AA and increase DHA levels in the mice [13]. We set out to investigate the
mechanisms through which DHA worked to correct PUFA abnormalities in CF mice and
reverse the CF phenotype. To minimize intestinal obstruction and maintain long-term
viability, the mice were weaned onto a peptamen liquid diet. Peptamen served as the
vehicle for fatty acid supplementation. In addition to FFA DHA (Peptamen + DHA), the
cftrtm1Unc
mice were also supplemented with a combination of DHA and EPA in TG form
(Peptamen AF). The main difference between the fatty acid composition of peptamen
versus peptamen + DHA diet was the amount of DHA (0 % in peptamen, 32.5 % in
peptamen + DHA). The peptamen AF diet contained much less DHA (3.8 %) than the
peptamen + DHA diet, and it was the only diet out of the three that contained a
significant amount of EPA (8.2 %) (Table 4).
Table 4: Fatty acid composition of the different mouse liquid diets
Feed Peptamen Peptamen + DHA Peptamen AF
mMol/mL Mol% mMol/mL Mol% mMol/mL Mol%
14:0 0.82 2.5% 0.73 1.7% 2.24 6.2%
16:0 5.22 16.1% 4.75 10.9% 5.81 16.0%
18:0 2.26 7.0% 2.05 4.7% 2.23 6.1%
18:3n-3 2.31 7.1% 2.14 4.9% 1.97 5.4%
20:5n-3 n.d. n.d. n.d. n.d. 2.98 8.2%
22:6n-3 n.d. n.d. 14.19 32.5% 1.38 3.8%
18:2n-6 13.14 40.6% 12.12 27.5% 9.00 24.8%
16:1n-7 0.21 0.6% 0.23 0.5% 1.79 4.9%
18:1n-7 0.44 1.3% 0.40 0.9% 0.46 1.3%
18:1n-9 7.50 23.2% 6.79 15.5% 7.11 19.6%

72
The cftrtm1Unc
mice on the peptamen + DHA diet received peptamen for one week
post-weaning followed by a week of peptamen supplemented with 40 mg/day FFA DHA.
The peptamen contained antioxidants including 3 mg of vitamin E and 34 mg of vitamin
C per 100 mL, which helped to minimize oxidation of the FFA DHA in the diet.
Alternatively, some mice were placed on the peptamen AF diet for two weeks post-
weaning then sacrificed. Fatty acid analysis was performed on cell preparations from the
lung, pancreas and ileum, which are the principal organs clinically affected in CF. At
baseline (peptamen diet), the characteristic PUFA alterations including decreased LA and
DHA and increased AA were present in all three organs of CF mice (Figure 29).
Supplementation with DHA led to a significant increase in DHA levels in both WT and
CF mice such that the levels of DHA in the CF mice were at or above WT levels (Figure
29). A > 50% decrease in AA levels was also observed in the CF mice, normalizing AA
to WT levels. Additionally, a slight increase in LA levels was observed in CF mice
following DHA supplementation. To ensure there was no difference in intestinal
absorption of DHA, we measured plasma DHA levels in mice receiving the peptamen +
DHA diet. The levels of DHA in plasma of WT and CF mice were comparable,
signifying normal intestinal absorption in the CF mice (data not shown). Similar to DHA
supplementation, peptamen AF reversed PUFA abnormalities in the lung, pancreas and
ileum of CF mice. Administration of peptamen AF increased DHA levels in CF mice to
WT levels, although the overall increase was less than with the peptamen + DHA diet
(Figure 29). A reciprocal decrease in AA and increase in LA levels was also observed.
From these experiments we concluded that peptamen AF worked just as well as
peptamen + DHA to normalize PUFA abnormalities in CF mice.
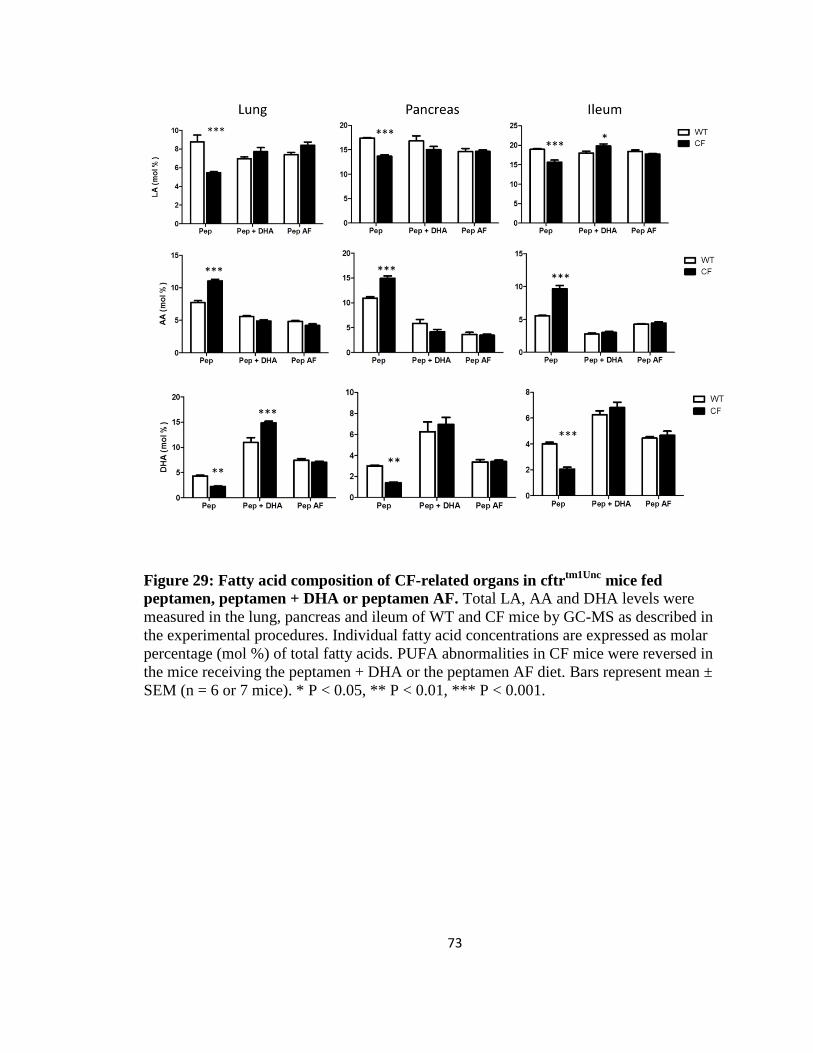
73
Figure 29: Fatty acid composition of CF-related organs in cftrtm1Unc
mice fed
peptamen, peptamen + DHA or peptamen AF. Total LA, AA and DHA levels were
measured in the lung, pancreas and ileum of WT and CF mice by GC-MS as described in
the experimental procedures. Individual fatty acid concentrations are expressed as molar
percentage (mol %) of total fatty acids. PUFA abnormalities in CF mice were reversed in
the mice receiving the peptamen + DHA or the peptamen AF diet. Bars represent mean ±
SEM (n = 6 or 7 mice). * P < 0.05, ** P < 0.01, *** P < 0.001.

74
Unlike the peptamen or peptamen + DHA diet, peptamen AF contained a
significant amount of EPA (Table 4). Hence a substantial increase in EPA levels was
seen in both WT and CF mice maintained on the peptamen AF diet (Figure 30).
Interestingly, there was an increase in EPA levels in the lung and ileum of WT and CF
mice fed the peptamen + DHA diet. This increase was brought about by retroconversion
of the supplemented DHA to EPA. However, there was little difference in the amount of
retroconversion between WT and CF mice, which was different from what we observed
in cultured 16HBE cells, where retroconversion was 20X greater in CF compared to WT
cells. It is possible that species or cell-type differences can explain these dissimilar
observations. No retroconversion was observed in the pancreas of cftrtm1Unc
mice.
The effect of peptamen + DHA or peptamen AF supplementation was also
evaluated in organs not clinically affected in CF. An increase in DHA concentrations
along with a decrease in AA levels was observed in the heart, kidney and liver of WT and
CF mice, similar to what was seen in CF-related organs (data not shown). However, the
brain of WT and CF mice appeared resilient to change, with AA levels remaining
unchanged and only a minimal increase in DHA levels following supplementation
(Figure 31).

75
Figure 30: Levels of EPA in CF-related organs of cftrtm1Unc
mice fed peptamen,
peptamen + DHA or peptamen AF. Total EPA levels were measured in the lung,
pancreas and ileum of WT and CF mice by GC-MS as described in the experimental
procedures. Fatty acid concentrations are expressed as molar percentage (mol %) of total
fatty acids. There was no difference in EPA levels in WT and CF mice fed the control
diet (peptamen). Supplementation with peptamen AF caused a significant increase in
EPA levels in WT and CF mice while retroconversion of DHA to EPA was observed in
the lung and ileum of mice fed the Peptamen + DHA diet. Bars represent mean ± SEM
(n = 6 or 7 mice), and unlike letters indicate significant differences in pair-wise
comparisons.

76
Figure 31: Brain fatty acid composition of cftrtm1Unc
mice fed peptamen, peptamen +
DHA or peptamen AF. Total AA and DHA levels were measured in the brain of WT
and CF mice by GC-MS as described in the experimental procedures. Fatty acid
concentrations are expressed as molar percentage (mol %) of total fatty acids. There was
no difference in AA or DHA levels in WT and CF mice fed the control diet (peptamen).
Supplementation with peptamen + DHA or peptamen AF caused a significant increase in
DHA levels in both WT and CF mice. No change was observed in AA levels following
supplementation with either diet. Bars represent mean ± SEM (n = 6 or 7 mice). ** P <
0.01.

77
PUFA alterations in CF mice are associated with increased expression and
activity of desaturase and elongase enzymes. We hypothesized that both the peptamen +
DHA and peptamen AF diets worked to correct CF PUFA abnormalities by suppressing
these enzymes. The mRNA expression levels of Δ5-desaturase, Δ6-desaturase and elovl5
were measured in the lung, ileum and liver of WT and CF mice with and without
supplementation (Figure 32). All three enzymes were upregulated in lung tissue of CF
mice fed the control peptamen diet compared to WT mice. Unexpectedly,
supplementation with peptamen + DHA did not alter desaturase or elongase expression in
the CF lung. Moreover, supplementation with peptamen AF led to a further increase in
enzyme expression in both WT and CF mice. These results differed from what we
observed in cultured 16HBE cells, where DHA and EPA supplementation led to
downregulation of desaturase enzyme expression. In contrast, supplementation with
peptamen + DHA or peptamen AF caused suppression of Δ5 and Δ6-desaturase in the
ileum of CF mice, normalizing desaturase expression to WT levels. Elovl5 expression
was also slightly decreased following supplementation. A similar pattern was seen in the
liver, whereby supplementation with peptamen + DHA or peptamen AF had a
suppressive effect on desaturase and elongase expression (Figure 32).

78
Figure 32: PUFA metabolic enzyme gene expression in lung, ileum and liver of
cftrtm1Unc
mice fed peptamen, peptamen + DHA or peptamen AF. RNA was extracted
and cDNA synthesized from the lung, ileum and liver of WT and CF mice as described in
the experimental procedures. qRT-PCR was performed using commercial Taqman probes
for the mRNA sequences of Δ5-desaturase , Δ6-desaturase and elongase 5 (Elovl5) .
Relative expression was determined by the ΔΔCT method using GAPDH as a control.
Desaturase and elongase expression levels were increased in the lung and ileum of CF
mice fed the control peptamen diet. While the peptamen + DHA and peptamen AF diets
caused suppression of PUFA metabolic enzymes in the ileum and liver of the mice, the
expression levels of these enzymes in the lung either remained the same or increased in
mice on these two diets. Bars represent mean ± SEM (n = 6 or 7 mice), and unlike letters
indicate significant differences in pair-wise comparisons.

79
The effect of peptamen + DHA and peptamen AF on the phenotypic expression of
CF was also studied in cftrtm1Unc
mice. Histological analysis of the small intestine was
performed using hematoxylin and eosin staining (Figure 33). WT mice maintained on
peptamen, peptamen + DHA or peptamen AF displayed normal intestinal morphology,
characterized by narrow crypts without apparent impaction of secretory products. In
contrast, the crypts of peptamen-fed CF mice were dilated and filled with secretory
material that appeared to emanate from paneth cells at the base of the crypts. Impaction
of secretory material was found in 30-70% of the crypts and was present along the entire
length of the villus. Supplementation with peptamen AF did not correct the intestinal
phenotype in the CF mice, as accumulation of secretory material remained apparent in
majority of the crypts examined. However, CF mice on the peptamen + DHA diet
exhibited partial correction of the intestinal phenotype, with less accumulation of material
in the crypts, no crypt dilation and fewer affected crypts (10-30%). Additional
investigations of the intestinal phenotype revealed marked goblet cell hyperplasia in the
CF, but not WT, mice (Figure 34). Supplementation with peptamen + DHA almost
completely reversed the goblet cell hyperplasia in CF mice, while peptamen AF treatment
caused only a slight decrease in goblet cell hyperplasia. Our results suggest that there is
altered gut motility and secretion in CF compared to WT mice, and that supplementation
with DHA partially corrects this intestinal phenotype while peptamen AF has little effect.
We found no evidence of altered lung morphology in CF mice fed the different
diets compared to WT mice (Figure 35). This was an expected finding as previous studies
have reported that CF mice show normal lung histology and do not develop spontaneous
lung disease [13].

80
Figure 33: Histological appearance and morphometry of the small intestine of cftrtm1Unc
mice fed peptamen, peptamen + DHA or peptamen AF. Tissue was embedded in paraffin
and stained with hematoxylin and eosin (representative images shown, n = 6 or 7 mice).
There was no impaction of secretory products in the crypts of WT mice fed peptamen,
peptamen + DHA or peptamen AF (top row). In contrast, CF mice on the peptamen or
peptamen AF diet exhibited dilated crypts containing secretory product (arrows). Treatment
of CF mice with DHA resulted in less accumulation of secretions in the deep portion of the
crypts as well as a lower percentage of affected crypts. Crypt impaction was scored from 0-4: 0- no impaction of secretory products in the crypts.
1- impacted secretory material in the deep portion of the crypts in <10% of the crypts.
2- impaction of secretory material in the deep portion of the crypts in 10-30% of crypts,
with rare accumulation of material in the bottom third of the villus.
3-impaction of secretory material in 30-70% of the crypts, with accumulation of material
commonly observed up to the top third of the crypt.
4-impaction of secretory material in >70% of the crypts, with frequent dilation of the
crypts and presence of material in the top third of the villus.

81
Figure 34: Detection of goblet cells in the small intestine of cftrtm1Unc
mice fed
peptamen, peptamen + DHA or peptamen AF. Tissue was embedded in paraffin and
periodic acid schiff staining used to detect goblet cells (bright pink). Goblet cell
hyperplasia was scored as marked, moderate, or mild. WT mice fed the three different
diets exhibited normal numbers of goblet cells (no goblet cell hyperplasia), while marked
goblet cell hyperplasia was observed in the peptamen-fed CF mice. Treatment of CF mice
with DHA resulted in mild goblet cell hyperplasia whereas supplementation with
peptamen AF resulted in moderate goblet cell hyperplasia. Representative images shown
(n = 6 or 7 mice).

82
Figure 35: Hematoxylin and eosin-stained lung sections obtained from cftrtm1Unc
mice fed peptamen, peptamen + DHA or peptamen AF. A, C and E were obtained
from WT mice, while B, D and F were obtained from CF mice, treated with peptamen,
peptamen + DHA and peptamen AF respectively. Lung sections revealed normal
architecture with no pathological abnormalities found in either the WT or CF mice fed
the different diets. Representative images shown (20X magnification, n = 6 or 7 mice).

83
Discussion
DHA and EPA supplementation in cultured CF cells
Previous studies have shown that DHA treatment can correct PUFA abnormalities
in CF patients and animal models [13, 14, 130-135]. However, the exact mechanism by
which DHA works remains unclear. In this chapter, we show that supplementing cultured
CF cells with exogenous DHA causes suppression of Δ5 and Δ6-desaturase expression
and activity. This leads to reduced conversion of LA to AA, thus reversing the PUFA
abnormalities. Moreover we demonstrate that a comparable n-3 fatty acid, EPA, has the
same effect as DHA on PUFA metabolism. EPA supplementation leads to a decrease in
desaturase gene expression and normalizes LA to AA, and LNA to EPA metabolism in
CF cells to WT levels. These findings differ from those of Freedman et al [13], which
showed a favorable effect of DHA treatment on CF pathology but no effect with EPA
treatment. It is possible that our experiments produced different results because they were
performed in cultured human CF cells and not in CF mice, as species differences may
play a role. Additional PUFAs including AA and LNA also decrease desaturase activity
in CF cells but not to the same extent as EPA and DHA, while monounsaturated and
saturated fatty acids such as OA and PA do not have any effect on PUFA metabolism.
This suggests that the degree of saturation of the supplemented fatty acid determines its
effect on desaturase expression and PUFA metabolism. Since Δ5 and Δ6-desaturase are
membrane-bound enzymes, it is possible that highly unsaturated fatty acids such as DHA
and EPA effectively suppress these enzymes by altering membrane fluidity and
flexibility. Further work needs to be done to evaluate the impact of exogenous DHA and
84
EPA on the physical properties of cell membranes and how this relates to desaturase
activity.
In addition to reducing conversion of LA to AA and LNA to EPA, DHA and EPA
also reduced metabolism of AA to 22:5n-6. This reduction was likely caused by
decreased Δ6-desaturase and elongase activity and was seen mainly in WT cells, perhaps
due to the fact that AA metabolism was significantly diminished in CF cells to begin
with. Interestingly, DHA and EPA did not reduce metabolism of EPA in the n-3 pathway.
At low concentrations (5 µM exogenous DHA or EPA), metabolism of EPA to DHA was
actually increased. A plausible explanation for this is that the increased concentrations of
these fatty acids may stimulate activity in their own metabolic pathway, which may
effectively negate their suppressive effects on desaturase enzyme expression.
Our experiments demonstrate that DHA and EPA suppress desaturase gene
expression in WT and CF cells, although the effect is much greater in CF cells. It is
conceivable that this differential effect is caused by differences in uptake, as CF cells
seem to incorporate higher amounts of both DHA and EPA compared to WT cells
(Figures 22 and 25). Although the reason behind the increased uptake of exogenous
PUFAs in CF cells is unclear, it could point to increased fatty acid transport into CF cells.
Retroconversion of DHA to EPA
The DHA supplementation experiments reveal a potential mechanism that can
account for the increased EPA and decreased DHA levels in CF. This mechanism
involves the retroconversion of DHA to EPA through a modified peroxisomal β-
oxidation process in which DHA loses two carbons and becomes desaturated [127-129].

85
This is a regulated process that requires saturation of the Δ4 double bond by Δ4 enoyl
CoA reductase and rearrangement of the double bond structure by Δ3, Δ2 enoyl CoA
isomerase (Figure 36). We showed that treating CF cells with exogenous DHA led to an
increase in EPA levels, and that the calculated retroconversion [ΔEPA / (ΔEPA +
ΔDHA)] was much higher in CF cells (20%) than in WT cells (1%). Retroconversion of
DHA to EPA was also observed in vivo, after supplementing cftrtm1Unc
mice with large
amounts of DHA. In these experiments, we found that treating the mice with DHA led to
an increase in EPA levels in several organs including lung and ileum. However, unlike
our cell culture experiments, there was no difference in DHA retroconversion levels
between WT and CF mice. DHA retroconversion is an important process that may have
clinical implications for n-3 dietary therapies used in many diseases, including CF. Future
investigation into the factors that affect retroconversion, including regulation of the
enzymes that catalyze these reactions, may enhance our understanding of this process.
DHA and EPA supplementation in cftrtm1Unc
mice
PUFA alterations are present in CF mice and specifically in clinically affected
organs such as the lung, pancreas and ileum. These fatty acid changes are associated with
increased desaturase and elongase expression and activity. CF mice placed on either the
peptamen + DHA or peptamen AF diet for two weeks exhibited reversal of PUFA
abnormalities. Based on our in vitro cell culture experiments, we hypothesized that the
mouse diets enriched with FFA DHA (peptamen + DHA) or a combination of TG DHA
and EPA (peptamen AF) worked to correct PUFA abnormalities by suppressing
desaturase expression and activity. To evaluate this, desaturase and elongase gene

86
Figure 36: Diagram of the biosynthesis and retroconversion of docosahexaenoic acid
(DHA). DHA is synthesized from EPA through a series of elongation and desaturation
steps. DHA can also be retroconverted back to EPA through a modified β-oxidation
process that involves a different set of enzymes.
expression was measured in the lung, ileum and liver of WT and CF mice following
supplementation. In the ileum and liver, expression of Δ5 and Δ6-desaturase and elovl5
was decreased in CF mice to the level of WT mice. This corresponded with normalization
of PUFA levels in the ileum of CF mice. Interestingly, even though PUFA alterations
were reversed in the lungs of CF mice after DHA and EPA supplementation, the
expression levels of desaturase and elongase enzymes still remained upregulated. This
unexpected result can be explained first by noting the source of DHA or EPA that gets to
the different organs, and second, by examining the overall principal source of PUFAs for
each of these organs. Once ingested, the supplemented DHA and EPA is digested in the

87
small intestine of the mice. FFA DHA in the peptamen + DHA diet can be absorbed as is,
whereas the TG DHA and EPA in peptamen AF has to be hydrolyzed by pancreatic
lipase to release FFAs and monoacylglycerols (MAG). The FFAs and MAGs are
absorbed into the enterocytes and resynthesized into TGs, which then get packaged into
chylomicrons and released into the lymphatic system to be taken to different organs of
the body. Therefore the source of DHA and EPA for the ileum is FFAs or MAGs. In the
liver, the source is mainly intermediate density lipoproteins (IDL) or low density
lipoproteins (LDL) which contain majority of their fatty acids as phospholipids. In the
lung, the main source of DHA and EPA is as TGs from chylomicrons and very low
density lipoproteins (VLDL). Thus, it is feasible that the ileum, liver and lung each
receive a different pool of DHA and EPA, and this may explain why the effect of DHA
and EPA on desaturase expression varies among these organs. Moreover, the primary
source of PUFAs for these organs is different. Our results demonstrate that DHA and
EPA supplementation reduces the expression of desaturase and elongase enzymes in the
liver and ileum of CF mice, where most PUFA metabolism occurs. Therefore because
desaturase and elongase expression is decreased, the synthesis of PUFAs including AA is
also decreased in these organs. Unlike the liver and ileum, the primary source of PUFAs
in the lung is fatty acid uptake from lipoproteins that originate in the GI tract
(chylomicrons) and liver (VLDL). Thus, PUFA levels in the lung tend to be a reflection
of metabolism and synthesis in the liver and ileum, irrespective of metabolic enzyme
expression. This may explain why although desaturase and elongase expression is still
increased in CF lung tissue, the overall AA to LA ratio is decreased.

88
It is also possible that cell-type differences can explain the differential effects of
DHA and EPA supplementation in our in vitro and in vivo experiments. The cell culture
experiments were performed in a population consisting of 100% 16HBE cells, whereas
the mouse experiments were carried out in lung cell preparations enriched for epithelial
cells. While the majority of the mouse lung cells may have been epithelial in nature, there
were likely other cell types present. This mixed population of cells could dampen the
suppressive effect on desaturase expression that would otherwise be observed in a pure
epithelial population following DHA and EPA supplementation.
In contrast to the other mouse organs, minimal fatty acid changes were observed
in brain tissue from mice fed the peptamen + DHA or peptamen AF diet. Previous studies
have reported that the brain is more resistant to changes in dietary fatty acids and
possesses inherent mechanisms to maintain lipid homeostasis in situ [136]. It has also
been proposed that brain AA and DHA profiles are highly protected, perhaps by active
transport of these fatty acids from the circulation or by increased chain elongation and
desaturation to maintain the appropriate levels [137].
Additionally, the effect of peptamen + DHA and peptamen AF supplementation
on the phenotypic expression of CF disease was evaluated in cftrtm1Unc
mice. CF mice
maintained on the peptamen diet exhibited intestinal disease, characterized by marked
goblet cell hyperplasia and dilated crypts filled with secretory material. Interestingly,
supplementation with peptamen + DHA appeared more effective at correcting the
intestinal phenotype in CF mice than the peptamen AF diet (Figures 33 and 34).
Peptamen AF contains a combination of EPA and DHA, with significantly less DHA than
is found in the peptamen + DHA diet (Table 4). Therefore, although both peptamen +

89
DHA and peptamen AF work to decrease AA and increase DHA levels in the ileum, the
increase in DHA is much greater in the peptamen + DHA group (Figure 29). In addition,
the EPA present in peptamen AF may compete with DHA and actually decrease its
incorporation. It is possible that the intestinal phenotype seen in CF mice is mainly a
result of decreased DHA levels rather than increased AA levels, and this may explain
why a beneficial effect is seen only in the CF mice on the peptamen + DHA diet. Further
studies are needed to determine whether increasing the concentration of supplemented
DHA and/or the length of time might help to completely reverse the CF intestinal
phenotype.
There was no evidence of lung pathology in either the WT or CF mice receiving
the different diets (Figure 35). This differs significantly from CF human disease, where
the most significant impact in affected individuals is progressive lung disease that is
characterized by mucus obstruction and goblet cell hyperplasia, excessive airway
inflammation, spontaneous development of bacterial infection and progression to chronic
infection [61]. Several factors may explain the relative absence of lung pathology in CF
mice. It is believed that bacterial colonization of the airways of CF patients plays an
important role in the development of significant lung disease. Thus, the failure of CF
mice to develop lung pathology could be due, at least in part, to the fact that they are
housed in a sterile barrier facility. It is possible that older CF mice raised in a less sterile
environment may exhibit lung disease. In addition, these mice may have modifier genes
which can directly or indirectly partially correct the abnormalities in epithelial ion
transport. These include the presence of non-CFTR chloride conductance genes that can
compensate for loss of CFTR function and prevent the development of lung pathology.

90
Ours is not the first study looking at the effect of DHA supplementation on the
fatty acid profile and phenotype of CF mice. Freedman et al. [13] showed that feeding
cftrtm1Unc
mice a diet supplemented with 40 mg/day free or esterified DHA for 7 days
decreased AA levels and increased DHA levels in the lung, pancreas and ileum of the
mice. DHA supplementation also caused a reversal of pancreatic duct dilation and ileal
hypertrophy in the CF mice. A separate study examined the effect of supplementing
F508del mice with liposomes containing glycerophospholipids enriched with DHA by
gavage (60 mg DHA/kg daily, i.e. at maximum 1.4 mg DHA/d) for 6 wk. This treatment
led to an increase in LA and DHA levels, a decrease in elevated AA, and an increase in
(n-6)/(n-3) fatty acid ratio, depending on the tissue [14]. However, not all published
studies reported a beneficial effect with DHA supplementation. Congenic B6 cftrtm1Unc
mice supplemented with 40 mg/day free DHA for 7, 30 or 60 days failed to show a
significant improvement in lung, pancreas or ileum morphology [138]. A similar study
using congenic B6 cftrtm1Unc
mice fed 40 mg/day free DHA showed no significant
difference in the survival rates of WT and CF mice inoculated with P. aeruginosa-coated
agarose beads [139]. Therefore, it is possible that the response to DHA is dependent, at
least in part, on the genetic background of the various mouse strains used in the different
studies.

91
CHAPTER IV
NEW FINDINGS AND CONCLUSIONS
Introduction
The data presented in the preceding chapters provides a mechanistic explanation
for the PUFA alterations in CF and establishes that these alterations play an important
role in CF pathophysiology. However, the connection between mutations in the CFTR
gene and abnormalities in PUFA metabolism is still unknown. Preliminary experiments
in our lab have shown that treatment of 16HBE sense (WT) cells with a small molecule
inhibitor of CFTR (CFTRinh-172, 20 µM) [140] leads to a significant increase in Δ5 and
Δ6-desaturase gene expression compared to untreated cells, with no change in elovl2 and
elovl5 expression. That similar effects on desaturase gene expression are present in both
antisense cells and CFTRinh-172-treated cells suggests that loss of CFTR function can
regulate desaturase expression and lead to PUFA abnormalities. Moreover, studies in CF
mice show that PUFA alterations are found solely in CF mouse organs that contain a
significant number of CFTR-expressing cells including the lung, pancreas and ileum.
This implies that loss of CFTR function is related to abnormalities in fatty acid
metabolism. We hypothesize that CFTR mutations activate pathways leading to increased
desaturase expression and activity, resulting in altered PUFA metabolism in CF. A
potential pathway that can link CFTR mutations to altered desaturase activity involves
the overproduction of reactive oxygen species.

92
CF is characterized by elevated oxidative stress and impaired antioxidant/oxidant
balance [141]. Mutations in CFTR contribute to abnormal generation of reactive oxygen
species (ROS), in part by altering fluid and electrolyte composition of secretions, leading
to the production of thick, viscous mucus. The accumulation of viscous mucus in the CF
lung causes airway obstruction, bacterial colonization and compromised pathogen
clearance, leading to repetitive infections and chronic inflammation. The hallmark of
chronic inflammatory lung disease in CF is the release of chemokines, including IL-8
[142, 143], and the excessive recruitment of neutrophils to the bronchial lumen [144].
These neutrophils, along with the bacterial pathogens such as Pseudomonas aeruginosa
present in the lung, release large amounts of ROS, including the superoxide anion O2-,
hydrogen peroxide H2O2, and the hydroxyl free radical OH. Elevated levels of lipid and
protein oxidation products found in BAL fluid, exhaled breath condensate, and sputum of
CF patients provide evidence of a pro-oxidative imbalance in CF airways [145-148]. In
addition to increased oxidant production, antioxidant defenses are dramatically reduced
in CF patients compared to healthy subjects [141, 149-151]. Exocrine pancreatic
insufficiency is a common feature in CF which causes malabsorption of fat-soluble
vitamins such as Vitamin A, E and carotenoids. Moreover, CFTR in addition to its role as
a chloride channel can also transport reduced glutathione (GSH) [152-154]. GSH is an
anionic tripeptide (γ-glutamyl-cysteinyl-glycine) that is considered one of the most
important extracellular antioxidants in the lung [155, 156]. Defects in CFTR impair GSH
transport and lead to markedly decreased GSH concentrations in CF patients and mouse
models [157, 158]. Some studies have also shown that at the cellular level, CFTR
mutations can cause mitochondrial depletion of GSH [159, 160]. Taken together, the

93
increased production of oxidants and decreased antioxidant protection bring about
compromised redox homeostasis in CF. PUFAs have been reported to act as potent
antioxidants [161], and therefore it is possible that in response to increased oxidative
stress arising from CFTR mutations, cells respond by upregulating desaturase expression
and activity in an attempt to generate more PUFAs to counteract the oxidative burden.
We set out to determine whether ROS production was increased in our CF cell culture
model and whether treating CF cells with various antioxidants could normalize PUFA
metabolism.
Experimental Procedures
HPLC superoxide (O2-) measurements
16HBE sense (WT) and antisense (CF) cells were cultured until two days post-
confluence as described in the previous chapters. On the day of the study, the cells were
rinsed three times with 3 mL chilled KRB-Hepes buffer and exposed to 10 µM
dihydroethidium (DHE) for 20 min at 37oC in KRB-Hepes buffer containing 0.1%
DMSO. DHE was then washed off from the cells to avoid absorption of any extracellular
oxyethidium formed by autoxidation of DHE. The cells were incubated in KRB-Hepes
buffer at 37oC for an hour, after which the cells were harvested for HPLC analysis of O2
-
anions. The cells were scraped on ice and placed in cold methanol, homogenized and
filtered using a 0.22 µm filter. DHE reacts with O2- to form oxyethidium and this can be
separated from its parent DHE and ethidium by HPLC. The resulting peak intensity of
oxyethidium reflects intracellular production of O2-. Separation of ethidium, oxyethidium
and DHE was carried out using a Beckman HPLC System Gold model with a C-18
94
reverse phase column (Nucleosil 250, 4.5 mm; Sigma-Aldrich, St. Louis, MO), equipped
with UV and fluorescence detectors. Fluorescence detection at 580 nm (emission) and
480 nm (excitation) was used to monitor oxyethidium production. UV absorption at 355
nm was used for the detection of DHE. The mobile phase was composed of a gradient
containing 60% acetonitrile and 0.1% trifluoroacetic acid. DHE, ethidium, and
oxyethidium were separated by a linear increase in acetonitrile concentration from 37%
to 47% over 23 min at a flow rate of 0.5 mL/min.
Antioxidant treatment
16HBE cells were treated with three different antioxidants, namely N-acetyl
cysteine (NAC), trolox (TX) and mito-TEMPO (mT). NAC is an antioxidant that
effectively reduces free radical species directly and also facilitates GSH biosynthesis. TX
is a water soluble derivative of vitamin E, while mT is a mitochondria specific
superoxide scavenger. For NAC treatments, confluent cells were incubated with 10 mM
NAC for 24 h. TX (400 µM) and mT (25 µM) treatments were carried out over a 5 day
period beginning on day 2 post-seeding. Following antioxidant treatment, the cells were
either harvested immediately for RNA isolation or incubated with 4.1 µM 14
C-LA for 4 h
followed by a 20 h chase with complete media for metabolic flux experiments. Total
RNA was isolated from antioxidant-treated cells and cDNA synthesized for assessment
of desaturase, elongase and superoxide dismutase mRNA expression by qRT-PCR. Fatty
acids were extracted and methylated from 14
C-LA radiolabeled cells, and conversion of
radiolabeled LA to downstream metabolites measured by HPLC coupled to a β-RAM
scintillation detector, as described previously.

95
Western blotting
Untreated and antioxidant-treated 16HBE cells were washed twice in ice-cold
PBS and protein extracted using RIPA buffer. Samples were loaded on a 4-12 % gradient
Bis-Tris SDS-PAGE gel (Invitrogen, Carlsbad, CA), run for 15 min at 100 V and 90 min
at 120 V and transferred to Immobilon-P PVDF membranes. Blots were stained using a
primary antibody to Cu/Zn-SOD1 (1:5000) (Cayman chemicals, Ann Arbor, MI), Mn-
SOD2 (1:5000) (Abcam, Cambridge, MA) or β-actin (1:5000) (Sigma, St.Louis, MO).
The bound antibodies were visualized with a secondary HRP-conjugated goat anti-rabbit
antibody using the SuperSignal West Pico substrate system (Thermo Fisher Scientific)
and exposed to CL-X Posure film (Thermo Fisher Scientific).
Results
To determine whether CF cells exhibited increased ROS production, we chose to
measure O2- levels in WT and CF 16HBE cells. CF cells produced more than double the
amount of O2- found in WT cells (Figure 37), indicating that there was increased
oxidative stress in the CF cells. To assess if increased O2- production was driving
overexpression of desaturase enzymes, 16HBE cells were pretreated with various
antioxidants and mRNA expression of desaturase and elongase enzymes measured. Both
Δ5 and Δ6-desaturase levels were higher in control CF cells (untreated) compared to WT
cells. Treatment of CF cells with NAC significantly decreased Δ5 and Δ6-desaturase
expression to WT levels (Figure 38). A similar decrease in desaturase mRNA levels was
observed in CF cells treated with TX and the superoxide scavenger mT (Figures 39 and
40). Antioxidant treatment had no effect on elovl2 or 5 expression levels (data not

96
shown). The effect of antioxidants on desaturase activity was evaluated by measuring the
metabolism of 14
C-LA to AA. Increased conversion of LA to AA was seen in untreated
CF cells compared to WT cells, but treatment with NAC, TX and mT normalized LA to
AA metabolism, resulting in increased levels of LA and decreased AA in CF cells.
Figure 37: Detection of intracellular superoxide production in 16HBE cells. WT and
CF cells were exposed to 10 µM DHE and levels of oxyethidium measured by HPLC as
an indicator of superoxide levels, as described in the experimental procedures. WT cells
produced much less superoxide compared to CF cells. Bars represent mean ± SEM
(n = 3), *** P<0.001.

97
Figure 38: Relative desaturase mRNA expression and PUFA composition of 16HBE
cells with or without NAC treatment. RNA was extracted and cDNA synthesized from
WT and CF cells (A) as described in the experimental procedures. qRT-PCR was
performed using primers for the mRNA sequences of Δ5-desaturase (FADS1) and Δ6-
desaturase (FADS2). Relative expression was determined by the ΔΔCT method using
ribosomal protein RPLP0 as a control. Both Δ5-desaturase and Δ6-desaturase expression
levels were significantly increased in CF compared to WT cells at baseline. NAC
treatment resulted in a significant decrease in CF desaturase expression, bringing Δ5 and
Δ6-desaturase expression to WT levels. (B) Metabolism of LA to AA was determined in
WT and CF cells. Treating CF cells with NAC antioxidant resulted in an increase in LA
and decrease in AA levels, normalizing PUFA metabolism in these cells. Bars represent
mean ± SEM (n = 3). * P<0.05, *** P<0.001 for WT vs. CF cells.

98
Figure 39: Relative desaturase mRNA expression and PUFA composition of 16HBE
cells with or without trolox treatment. RNA was extracted and cDNA synthesized from
WT and CF cells (A) as described in the experimental procedures. qRT-PCR was
performed using primers for the mRNA sequences of Δ5-desaturase (FADS1) and Δ6-
desaturase (FADS2). Relative expression was determined by the ΔΔCT method using
ribosomal protein RPLP0 as a control. Both Δ5-desaturase and Δ6-desaturase expression
levels were significantly increased in CF compared to WT cells at baseline. Trolox
treatment resulted in a significant decrease in CF desaturase expression, bringing Δ6-
desaturase expression to WT levels. (B) Metabolism of LA to AA was determined in WT
and CF cells. Treating CF cells with trolox antioxidant resulted in an increase in LA and
decrease in AA levels, normalizing PUFA metabolism in these cells. Bars represent mean
± SEM (n = 3). * P<0.05, for WT vs. CF cells.

99
Figure 40: Relative desaturase mRNA expression and PUFA composition of 16HBE
cells with or without mito-TEMPO treatment. RNA was extracted and cDNA
synthesized from WT and CF cells (A) as described in the experimental procedures. qRT-
PCR was performed using primers for the mRNA sequences of Δ5-desaturase (FADS1)
and Δ6-desaturase (FADS2). Relative expression was determined by the ΔΔCT method
using ribosomal protein RPLP0 as a control. Both Δ5-desaturase and Δ6-desaturase
expression levels were significantly increased in CF compared to WT cells at baseline.
mito-TEMPO treatment resulted in a significant decrease in CF desaturase expression,
bringing Δ6-desaturase expression to WT levels. (B) Metabolism of LA to AA was
determined in WT and CF cells. Treating CF cells with a mitochondrial-specific
superoxide scavenger mito-TEMPO resulted in an increase in LA and decrease in AA
levels, normalizing PUFA metabolism in these cells. Bars represent mean ± SEM (n = 3).
* P<0.05, ** P<0.01, *** P<0.001 for WT vs. CF cells.

100
Superoxide anions can be detoxified by enzymes known as superoxide dismutases
(SODs). SODs are a family of metalloenzymes that efficiently catalyze the dismutation of
the O2- anion to H2O2 and molecular oxygen [162]. Three forms of SOD enzymes are
present in mammals, each having distinct metal cofactors. SOD1 complexes with copper
and zinc and is found in the cytoplasm, while SOD2 binds manganese and is found in the
mitochondria. SOD3 is extracellular and can bind to cell surfaces by its interaction with
polyanions such as heparin sulfate. We measured the mRNA and protein levels of SOD1
and SOD2 in 16HBE cells and found that while SOD1 was expressed at similar levels in
both WT and CF cells, SOD2 was overexpressed in CF cells (Figure 41). This is likely a
result of the elevated O2- levels in CF cells, which may trigger increased SOD2
expression and activity in order to break down the O2- . Following antioxidant treatment,
the levels of SOD2 in CF cells were significantly decreased.
These experiments suggest that there is a connection between PUFA alterations
and increased O2- production in CF. When O2
- levels are elevated in CF cells, there is
increased conversion of LA to AA. However, the altered PUFA metabolism can be
corrected by treating the cells with different antioxidants. We believe that loss of CFTR
function leads to overproduction of ROS such as O2- in CF cells. This leads to activation
of Δ5 and Δ6-desaturase expression and activity which in turn causes increased
metabolism of LA to AA. Since Δ5- and Δ6-desaturases are regulated at the
transcriptional level, it is plausible that increased ROS production triggers increased
activity of a transcriptional activator of the desaturase genes. Several transcription factors
are known to participate in the PUFA-mediated regulation of Δ5- and Δ6-desaturase
expression [97, 163]. Two of these transcription factors, sterol regulatory element-

101
binding protein (SREBP)-1 and peroxisome proliferator-activated receptor (PPAR)α,
exhibit altered expression and activity in CF [164-166]. Further experiments are needed
to determine if these transcription factors play a role, as identification of the relevant
transcription factor may help to identify specific signaling pathways linking altered
PUFA metabolism to CFTR. Detailed studies looking at pathways such as the AMP-
activated protein kinase (AMPK) signaling pathway, which is activated by ROS and is
known to be involved in fatty acid metabolism, will allow us to develop a complete
mechanistic framework linking CFTR mutations, ROS production and PUFA alterations
in CF.
Figure 41: Relative SOD mRNA and protein expression in 16HBE cells with or without
mito-TEMPO (mT) treatment. RNA was extracted and cDNA synthesized from WT and
CF cells (A) as described in the experimental procedures. qRT-PCR was performed using
primers for the mRNA sequences of SOD1 and SOD2. Relative expression was determined
by the ΔΔCT method using ribosomal protein RPLP0 as a control. There was no difference in
SOD1 levels between WT and CF cells with or without mT treatment. SOD2 mRNA levels
were significantly higher in CF than WT cells at baseline, and mT decreased SOD2 levels in
CF cells. Bars represent mean ± SEM (n = 3). *** P<0.001, for WT vs. CF cells. (B) SOD2
activity was determined by looking at protein expression levels. SOD2 protein levels were
higher in untreated CF cells and mT treatment resulted in a significant decrease in SOD2,
although not to WT levels. Data shown are representative of three different experiments.

102
Conclusions
The data presented in this dissertation focuses on understanding the mechanisms
of PUFA alterations in CF, uncovering how DHA works to correct these alterations and
determining the link between the PUFA changes and CFTR gene mutations. Previous
studies have shown that three main PUFA alterations occur in CF, namely decreased LA
and DHA and increased AA. In this dissertation, we provide a mechanistic explanation
for the PUFA alterations in CF. We show that these changes are a consequence of
increased expression and activity of the enzymes that metabolize PUFAs, including Δ5
and Δ6-desaturase. This leads to increased metabolism in the upper part of the n-3 and
n-6 pathways, and consumes LA in its conversion to AA, resulting in the decreased LA
and increased AA levels that are classically observed in CF. Our findings also
demonstrate that there is greater conversion of LNA to EPA than there is of LA to AA,
indicating that Δ6-desaturase has a higher affinity for n-3 fatty acids over n-6 fatty acids.
That metabolism of LNA to EPA is increased in CF cells rules out the possibility of
relatively decreased activity of the n-3 pathway specifically as an explanation for the low
DHA levels in CF. The decreased DHA levels can potentially be explained by two things.
First, only a small % of LNA that is incorporated into CF cells gets metabolized to DHA.
This, coupled with the decrease in metabolism of EPA to DHA, may account for the low
levels of DHA seen in CF. Second, DHA can undergo a process known as
retroconversion wherein it gets shortened and desaturated back to EPA. DHA
retroconversion is distinctly upregulated in CF cells compared to WT cells and this
contributes to the increased EPA and decreased DHA levels in CF. Additionally, our
studies show that the decrease in metabolism of EPA to DHA occurs at the first
103
metabolic step from EPA to 22:5n-3. It is feasible that reduced metabolism at this step
stems from shunting of EPA to eicosanoid biosynthesis, thus reducing the amount of
substrate available for metabolism to DHA. In support of this theory, both the expression
and activity of the rate-limiting enzymes of eicosanoid synthesis, COX-2 and 5-LOX are
increased in CF cells and in CF knockout mice. Further studies are necessary to confirm
whether increased eicosanoid synthesis contributes to the decreased DHA levels in CF.
With regard to the mechanism by which DHA works to correct PUFA
abnormalities and CF phenotype, we show that treatment of CF cells with exogenous
DHA reverses the PUFA metabolic changes by suppressing expression and activity of Δ5
and Δ6-desaturase enzymes. This leads to decreased conversion of LA to AA and
increases DHA levels, reversing all three PUFA abnormalities found in CF. Moreover,
the related n-3 fatty acid EPA is just as effective as DHA in downregulating desaturase
expression and activity and normalizing PUFA metabolism in CF. Similar effects on
desaturase suppression are observed after supplementing CF mice with high levels of
DHA or a combination of DHA and EPA. The noted benefit of n-3 fatty acid therapy in
CF mice is likely due to its ability to normalize AA levels and subsequently reduce
excessive production of pro-inflammatory eicosanoids. Additionally, n-3 fatty acids can
be metabolized to potent anti-inflammatory resolvins and protectins to help combat the
inflammation present in CF.
Proposed mechanism linking CFTR mutations to PUFA alterations
Loss of CFTR function as seen in CF can result in mitochondrial dysfunction,
characterized by elevated oxygen consumption, increased activity of the mitochondrial

104
electron transport chain (ETC) and altered kinetics of complex I of the mitochondrial
electron transport system [167,168]. Although the mitochondrial ETC is a very efficient
system, electron leakage is common due to the nature of the alternating one-electron
redox reactions that it catalyzes. Thus, electrons can pass to oxygen directly instead of to
the next electron carrier in the chain, leading to the production of superoxide anions. It is
commonly believed that mitochondrial generation of O2- represents the major intracellular
source of ROS under physiological conditions, with complex I and III of the ETC
producing majority of the O2- [169]. Previous studies report that increased activity of the
ETC leads to increased ROS production while inhibition of certain ETC complexes
decreases ROS production [169-172]. Consequently, increased activity of the
mitochondrial ETC caused by dysfunctional CFTR can result in elevated intracellular
ROS levels. This was confirmed in our CF cell culture system with CF cells producing
much higher levels of O2- compared to WT cells. We hypothesize that increased ROS
production, including increased mitochondrial O2-, may bring about the PUFA alterations
commonly seen in CF through the mechanism outlined below (Figure 42).
Increased O2- levels can activate the AMPK signaling pathway by ROS-mediated
opening of calcium release-activated calcium (CRAC) channels [173]. O2- triggers
intracellular calcium release from the ER, which in turn initiates CRAC channel
organization at the plasma membrane. This allows for extracellular calcium entry, leading
to increases in cytosolic calcium that activate the calcium/calmodulin-dependent protein
kinase kinase beta (CaMKKβ). CaMKKβ can then phosphorylate and activate AMPK.
AMPK is a ubiquitous Ser/Thr kinase that exists as a heterotrimer composed of a
catalytic α subunit and regulatory β and γ subunits [174]. The activity of AMPK increases

105
Figure 42: Proposed mechanism detailing ROS-mediated AMPK stimulation of Δ5
and Δ6-desaturase expression and activity. Mutations in CFTR can lead to increased
ROS production through increasing mitochondrial respiration or initiating the unfolded
protein response in the case of ΔF508 mutations. This leads to increased O2- production,
which can activate AMPK via CaMKKβ-phosphorylation. In addition to this pathway,
nitroxidative stress can also activate AMPK through NO and ONOO–, which activate
CaMKKβ and LKB1 respectively. When activated, AMPK can phosphorylate and inhibit
ACC, thereby reducing malonyl-CoA levels and disinhibiting CPT-1. AMPK can also
phosphorylate histone H2B, leading to increased transcription of CPT-1. This increases
fatty acid oxidation and ROS production, generating a positive-feedback loop with
AMPK. Active AMPK can also phosphorylate and activate downstream target proteins
including NO synthase and PPARα. NO synthase phosphorylation induces NO
production and creates a positive-feedback loop with NO through CaMKKβ. PPARα
activation can result in increased transcription of Δ5 and Δ6-desaturase genes, leading to
increased LA to AA metabolism as seen in CF.

106
during conditions of metabolic stress, in response to elevated intracellular [AMP]/[ATP]
ratios [175,176]. Additionally, AMPK can be activated by phosphorylation of the α
subunit at Thr-172 of its activation loop by upstream AMPK kinases, including liver
kinase B1 (LKB1) and CaMKKβ [177,178]. As a cellular metabolic sensor, AMPK acts
on a wide variety of substrates and cellular pathways, switching on catabolic pathways
that generate ATP and switching off ATP-consuming processes.
In CF cells, CaMKKβ-activation of AMPK in response to increased ROS
production can lead to increased mitochondrial fatty acid oxidation as well as increased
mitochondrial biogenesis. Once activated, AMPK can phosphorylate and inactivate the
mitochondrial-associated isoform of acetyl-CoA carboxylase (ACC2), resulting in
decreased malonyl-CoA levels. Malonyl-CoA inhibits carnitine palmitoyl transferase
(CPT-1), therefore a decrease in malonyl-CoA levels relieves CPT-1 inhibition and
allows for long chain fatty acids to enter the mitochondria for β-oxidation [179]. AMPK
can also phosphorylate histone H2B at serine 36, leading to transcriptional activation of
CPT-1 [180]. With increased fatty acid β-oxidation, the delivery of reducing equivalents
(NADH and FADH2) to the ETC and the generation of ROS such as O2- is increased from
either complex I or III of the ETC [181]. This creates a positive feedback loop in which
increased ROS levels activate AMPK, which promotes mitochondrial biogenesis [182]
and fatty acid oxidation, resulting in the production of more ROS and perpetuating the
cycle. Activated AMPK also increases the transcriptional activity of PPARα [183], which
in turn increases the expression of PPARα target genes including both Δ5 and Δ6-
desaturase. In this way, we postulate that increased AMPK activation, via PPARα, leads
to increased metabolism of LA to AA and results in the PUFA abnormalities found in CF.

107
The ROS measurements we performed focus solely on O2- production. However,
it is important to mention that other pro-oxidant molecules may be involved in the
activation of AMPK and subsequent upregulation of desaturase expression and activity.
Nitro-oxidative stress generated by nitric oxide (NO) and peroxynitrite (ONOO-) can also
activate CaMKKβ and LKB1 respectively [184, 185], leading to AMPK activation.
Conversely, AMPK can regulate the levels of reactive nitrogen species by inducing NO
production through phosphorylation and activation of NO synthase [186], generating a
positive feedback loop with NO through CaMKKβ. Several studies establish that the
activity of NO synthase is elevated in lung tissue of CF patients [187], and the
concentration of NO metabolites such as nitrate and peroxynitrite is increased in CF
[188-190].
Mutations in CFTR can also lead to increased ROS production by initiating ER
stress. This mainly applies to the ΔF508 mutation, which is the most common mutation in
CF and is characterized by defective protein processing and misfolding. Deletion of
phenylalanine at position 508 results in accumulation of misfolded ΔF508 protein in the
ER and causes ER stress. The cells respond to the buildup of misfolded protein and adapt
themselves to the stress condition by activating the unfolded protein response (UPR)
[191]. The UPR integrates pathways aimed at improving the ER capacity to effectively
process proteins, either by inducing the transcription of genes encoding ER chaperones,
or by activating ERAD to degrade misfolded proteins [192-194]. It is well documented
that ROS including mitochondrial O2- are generated during ER stress and the UPR,
through enzymatic mechanisms involving mitochondrial electron transport, ER
oxidoreductases and the Nox4 NADPH oxidase complex [195]. Therefore it is likely that

108
induction of the UPR in ΔF508 CF cells contributes to the production of ROS. This can
then trigger phosphorylation of AMPK and result in the PUFA abnormalities seen in CF,
as described above. However, the increase in O2- levels in our cell culture experiments is
probably not due to the UPR since loss of CFTR expression in our culture system is not
caused by ΔF508 protein misfolding.
If our hypothesis is correct and increased ROS production is central to the altered
PUFA metabolism in CF, then reducing ROS levels should help correct the abnormal
PUFA levels. In keeping with this, we observed that treatment of cultured CF cells with
three different antioxidants reduced O2- levels and normalized LA to AA metabolism to
WT levels. Additionally, it is possible that one of the ways through which dietary DHA
and EPA supplementation reversed PUFA alterations in the CF mice was through
decreasing O2- production in these animals. This theory is supported by previous studies
that have reported n-3 fatty acid supplementation results in a decrease in O2- generation
[196, 197].
In addition to altering cellular ROS levels by antioxidant or PUFA
supplementation, there are numerous other ways to test this proposed mechanism.
According to our hypothesis, activation of the AMPK signaling pathway by ROS is
needed to initiate increased transcription of desaturase genes via PPARα. To determine if
this is indeed the case, we can inhibit AMPK in CF cells using the small molecule
inhibitor Compound C or siRNA against the AMPKα catalytic subunit. AMPK inhibition
should result in normalization of Δ5 and Δ6-desaturase expression and activity in CF
cells. Moreover, AMPK inhibition should decrease fatty acid oxidation and activation of
NO synthase, and thus prevent the positive feedback loop responsible for augmenting

109
ROS production in CF cells. The reverse experiment involving the activation of AMPK
in WT cells can be performed to assess if this contributes to altered PUFA metabolism.
To determine if oxidant signals mediate an increase in AMPK activation via CaMKKβ,
we can abrogate CaMKKβ expression using siRNA or pharmacological inhibition with
STO-609. Knockdown of CaMKKβ should prevent activation of AMPK and abolish the
AMPK-PUFA response. Alternatively, we can explore the role of CaMKKβ in ROS-
mediated AMPK activation by modifying Ca2+
levels in CF cells. Because entry of
extracellular Ca2+
is needed to activate CaMKKβ and phosphorylate AMPK, we would
predict that removal of extracellular Ca2+
by growing CF cells in calcium-free media
should prevent CaMKKβ activation and decrease AMPK phosphorylation. This would be
consistent with a signaling pathway that requires Ca2+
influx for AMPK activation. The
role of LKB1 in activating AMPK can also be evaluated using siRNA against LKB1. We
also propose that AMPK activation leads to increased desaturase expression and activity
via the PPARα transcription factor. This part of the mechanism can be assessed through
siRNA-mediated PPARα knockdown in CF cells or by treating WT cells with the PPARα
activator fenofibrate. If PPARα expression induces increased desaturase expression and
activity, then knocking it down in CF cells should normalize PUFA metabolism while
activating it in WT cells should result in increased LA to AA metabolism. The
contribution of ER stress and the UPR towards increased ROS production and altered
PUFA metabolism in ΔF508 cells can be tested by culturing the cells at low temperature
(26oC) or by treating the cells with 4-PBA. These strategies work to correct the folding
defect and allow for ΔF508-CFTR to exit the ER and traffic to the cell surface. If ΔF508
misfolding leads to ER stress thus triggering the UPR and increasing ROS production,

110
then correcting the folding defect should decrease ROS levels and correct the PUFA
abnormalities in ΔF508 cells.
More work is needed to validate and dissect our proposed model in order to
determine whether the link between CFTR mutations and PUFA abnormalities involves
ROS-mediated signaling. Further examination of the contribution of ROS and the AMPK
signaling pathway to PUFA abnormalities and CF pathogenesis will allow us to
determine if these are potential therapeutic targets for the disease and assist us in the
development of better drug regimens to treat CF patients.
Potential impact on therapy
The data presented in this dissertation details in vitro experiments using n-3 fatty
acid supplementation, antioxidants and COX-2 inhibitors to correct PUFA abnormalities
in cultured CF cells. DHA and EPA were found to suppress desaturase expression and
activity, and normalize PUFA metabolism in CF cells to WT levels. Antioxidant
treatment using NAC, TX and mT was found to have a similar effect. In addition, DHA
supplementation on its own or in combination with EPA was shown to drastically
decrease AA levels and increase DHA levels in CF knockout mice. This data suggests
that correction of PUFA alterations in CF using either of these treatments may be
beneficial in ameliorating some of the pathologic manifestations of CF. Several clinical
trials have been carried out to evaluate the effect of antioxidant therapy, non-steroidal
anti-inflammatory drugs (NSAIDs), or n-3 fatty acid supplementation in CF patients
(Tables 5-7). In these trials, pulmonary function tests including forced expiratory volume

111
in 1 second (FEV1) and forced vital capacity (FVC) were the primary clinical measures
used to assess the outcome of the various treatments.
Table 5: Clinical trials using antioxidant therapy for treatment of CF

112
Table 6: Clinical trials using NSAID therapy for treatment of CF
The trials involving antioxidant therapy made use of antioxidants such as β-
carotene, vitamin E, selenium, GSH and NAC (Table 5). Although most trials resulted in
increased plasma antioxidant levels, there was no significant improvement in lung
function parameters. Only one study by Cobanoglu et al. [198] reported improvement in
FEV1 after 6 months β-carotene treatment. Similarly, clinical trials involving NSAID use
produced mixed results (Table 6). Some studies reported a decrease in the annual rate of
FEV1 and FVC decline, while other studies showed no benefit in relation to lung
function. Konstan et al. [199] described some adverse effects including an increased risk
of gastrointestinal bleeding in the CF patients receiving ibuprofen compared to placebo.
In the clinical trials utilizing n-3 fatty acids, the supplemented fatty acids comprised

113
DHA, EPA or a combination of both DHA and EPA (Table 7). The majority of these
trials described an increase in plasma n-3 fatty acid levels in the treatment group over the
controls. However, these trials resulted in little to no improvement in lung function
parameters. Consequently, we concluded that to the best of our knowledge, none of the
CF clinical trials using antioxidants, NSAIDs or n-3 fatty acids have been very
successful.
Table 7: Clinical trials using fish oil (DHA and EPA) therapy for treatment of CF

114
Treatment of CF is quite complex due to the fact that various factors can
contribute to disease progression. Therefore instead of targeting a single causative factor,
it may be more beneficial to target several factors at once. To this end, we propose that a
combined drug ‘cocktail’ may be more efficacious than the use of single drug therapy as
in the clinical trials described above. For example, based on our data we believe that
excessive production of pro-inflammatory eicosanoids and ROS contribute to CF disease.
Hence, we suggest the use of combination drug therapy that includes ibuprofen, n-3 fatty
acids and antioxidants. The purpose of ibuprofen is to inhibit COX enzymes and
decrease the production of AA-derived eicosanoids. Additionally, n-3 fatty acid
supplementation can be given to decrease the production of pro-inflammatory
eicosanoids by decreasing desaturase expression and activity and therefore decreasing
AA levels. DHA and EPA can also compete with AA for esterification at sn-2 position of
phospholipids, thereby decreasing AA levels and reducing the amount of substrate
available to be converted to pro-inflammatory eicosanoids. DHA and EPA can
themselves be metabolized to potent anti-inflammatory mediators such as resolvins and
protectins. Lastly, antioxidants such as vitamin E, NAC or β-carotene can be given to
neutralize the excessive production of free radicals and decrease the levels of ROS.
Together, it is possible that the combination of these three drugs may have a greater
effect at ameliorating CF disease symptoms and improving lung function parameters than
any one of them singly.

115
BIBLIOGRAPHY
1. Riordan, J. R. (2008). CFTR function and prospects for therapy. Annu Rev Biochem
77, 701-726.
2. Walters, S., and Mehta, A. (2007). Epidemiology of cystic fibrosis, In Cystic Fibrosis,
3rd
ed. M. Hodson, D. M. Geddes, and A. Bush, eds. London : Edward Arnold Ltd 21-45.
3. Yamashiro, Y., Shimizu, T., Oguchi, S., Shioya, T., Nagata, S., and Ohtsuka, Y.
(1997). The estimated incidence of cystic fibrosis in Japan. J Pediatr Gastroenterol Nutr
24, 544-547.
4. Kerem, B., Rommens, J. M., Buchanan, J. A., Markiewicz, D., Cox, T. K.,
Chakravarti, A., Buchwald, M., and Tsui, L. C. (1989). Identification of the cystic
fibrosis gene: genetic analysis. Science 245, 1073-1080.
5. Riordan, J. R., Rommens, J. M., Kerem, B., Alon, N., Rozmahel, R., Grzel- czak, Z.,
Zielenski, J., Lok, S., Plavsic, N., Chou, J. L., Drumm, M. L., Iannuzzi, M. C., Collin, F.
S., and Tsui, L. C. (1989). Identification of the cystic fibrosis gene: cloning and
characterization of complementary DNA. Science 245, 1066-1073.
6. Rommens, J. M., Iannuzzi, M. C., Kerem, B., Drumm, M. L., Melmer, G., Dean, M.,
Rozmahel, R., Cole, J. L., Kennedy, D., Hidaka, N., Zsiga, M., Buchwald, M., Riordan, J.
R., Tsui, L. C., and Collins, F. S. (1989). Identification of the cystic fibrosis gene:
chromosome walking and jumping. Science 245, 1059-1065.
7. Anon. (2007). 2006 annual data report to the center directors. Bethesda, MD: Cystic
Fibrosis Foundation Patient Registry.
8. Kuo, P. T., Huang, N. N., and Bassett, D. R. (1962). The fatty acid composition of the
serum chylomicrons and adipose tissue of children with cystic fibrosis of the pancreas. J
Pediatr 60, 394-403.
9. Hubbard, V. S., Dunn, G. D., and di Sant’Agnese, P. A. (1977). Abnormal fatty acid
composition of plasma-lipids in cystic fibrosis. A primary or a secondary defect? Lancet
2, 1302-1304.
10. Christophe, A. B., Warwick, W. J., and Holman, R. T. (1994). Serum fatty acid
profiles in cystic fibrosis patients and their parents. Lipids 29, 569-575.
11. Roulet, M., Frascarolo, P., Rappaz, I., and Pilet, M. (1997). Essential fatty acid
deficiency in well-nourished young cystic fibrosis patients. Eur J Pediatr 156, 952-956.

116
12. Freedman, S. D., Blanco, P. G., Zaman, M. M., Shea, J. C., Ollero, M., Hopper, I. K.,
Weed, D. A., Gelrud, A., Regan, M. M., Laposata, M., Alvarez, J. G., and O’Sullivan, B.
P. (2004). Association of cystic fibrosis with abnormalities in fatty acid metabolism. N
Engl J Med 350, 560-569.
13. Freedman, S. D., Katz, M. H., Parker, E. M., Laposata, M., Urman, M. Y., and
Alvarez, J. G. (1999). A membrane lipid imbalance plays a role in the phenotypic
expression of cystic fibrosis in cftr-/-
mice. Proc Natl Acad Sci, USA 96, 13995-14000.
14. Mimoun, M., Coste, T. C., Lebacq, J., Lebecque, P., Wallemacq, P., Leal, T., and
Armand, M. (2009). Increased tissue arachidonic acid and reduced linoleic acid in a
mouse model of cystic fibrosis are reversed by supplemental glycerophospholipids
enriched in docosahexaenoic acid. J Nutr 139, 2358-2364.
15. Al-Turkmani, M. R., Andersson, C., Alturkmani, R., Katrangi, W., Cluette-Brown, J.
E., Freedman, S. D., and Laposata, M. (2008). A mechanism accounting for the low
cellular level of linoleic acid in cystic fibrosis and its reversal by DHA. J Lipid Res 49,
1946-1954.
16. Andersson, C., Al-Turkmani, M. R., Savaille, J. E., Alturkmani, R., Katrangi, W.,
Cluette-Brown, J. E., Zaman, M. M., Laposata, M., and Freedman, S. D. (2008). Cell
culture models demonstrate that CFTR dysfunction leads to defective fatty acid
composition and metabolism. J Lipid Res 49, 1692-1700.
17. Rogiers, V., Vercruysse, A., Dab, I., and Baran, D. (1983). Abnormal fatty acid
pattern of the plasma cholesterol ester fraction in cystic fibrosis patients with and without
pancreatic insufficiency. Eur J Pediatr 141, 39-42.
18. Aldamiz-Echevarria, L., Prieto, J. A., Andrade, F., Elorz, J., Sojo, A., Lage, S.,
Sanjurjo, P., Vazquez, C., and Rodriguez-Soriano, J. (2009). Persistence of essential fatty
acid deficiency in cystic fibrosis despite nutritional therapy. Pediatr Res 66, 585-589.
19. Thompson, G. N. (1989). Relationships between essential fatty acid levels,
pulmonary function and fat absorption in pre-adolescent cystic fibrosis children with
good clinical scores. Eur J Pediatr 148, 327-329.
20. Strandvik, B., Gronowitz, E., Enlund, F., Martinsson, T., and Wahlström, J. (2001).
Essential fatty acid deficiency in relation to genotype in patients with cystic fibrosis. J
Pediatr 139, 650-655.
21. Olveira, G., Dorado, A., Olveira, C., Padilla, A., Rojo-Martinez, G., Garcia-Escobar,
E., Gaspar, I., Gonzalo, M., and Soriguer, F. (2006). Serum phospholipid fatty acid
profile and dietary intake in an adult Mediterranean population with cystic fibrosis. Br J
Nutr 96, 343-349.

117
22. Maqbool, A., Schall, J. I., Garcia-Espana, J. F., Zemel, B. S., Strandvik, B., and
Stallings, V. A. (2008). Serum linoleic acid status as a clinical indicator of essential fatty
acid status in children with cystic fibrosis. J Pediatr Gastroenterol Nutr 47, 635-644.
23. Rowe, S. M., Miller, S., and Sorscher, E. J. (2005). Cystic fibrosis. N Engl J Med
352, 1992-2001.
24. Holland, I. B. (2003). ABC Proteins: from Bacteria to Man. Amsterdam, Boston:
Academic Press.
25. Riordan, J. R. (2005). Assembly of functional CFTR chloride channels. Annu Rev
Physiol 67, 701-718.
26. Baker, J. R., Hudson, R. P., Kanelis, V., Choy, W., Thibodeau, P. H., Thomas, P. J.,
and Forman-Kay, J. D. (2007). CFTR regulatory region interacts with NBD1
predominantly via multiple transient helices. Nat Struct Mol Biol 14, 738-745.
27. Muallem, D., and Vergani, P. (2009). Review. ATP hydrolysis-driven gating in cystic
fibrosis transmembrane conductance regulator. Philos Trans R Soc Lond B Biol Sci 364,
247-255.
28. Reddy, M. M., Light, M. J., and Quinton, P. M. (1999). Activation of the epithelial
Na+
channel (ENaC) requires CFTR Cl– channel function. Nature 402, 301-304.
29. Matsui, H., Grubb, B. R., Tarran, R., Randell, S. H., Gatzy, J. T., Davis, C. W., and
Boucher, R. C. (1998). Evidence for periciliary liquid layer depletion, not abnormal ion
composition, in the pathogenesis of cystic fibrosis airways disease. Cell 95, 1005-1015.
30. Quinton, P. M. (2001). The neglected ion: HCO3-. Nat Med 7, 292- 293.
31. Quinton, P. M. (2008). Cystic fibrosis: impaired bicarbonate secretion and
mucoviscidosis. Lancet 372, 415-417.
32. Pezzulo, A. A., Tang, X. X., Hoegger, M. J., Alaiwa, M. H., Ramachandran, S., and
Moninger, T. O. (2012). Reduced airway surface pH impairs bacterial killing in the
porcine cystic fibrosis lung. Nature 487, 109‐113.
33. Linsdell, P., and Hanrahan, J. W. (1998). Glutathione permeability of CFTR. Am J
Physiol 275, 323-326.
34. Moskwa, P., Lorentzen, D., Excoffon, K. J., Zabner, J., and McCray, P. B. (2007). A
novel host defense system of airways is defective in cystic fibrosis. Am J Respir Crit
Care Med 175, 174-183.

118
35. Kunzelmann, K. (2003). Control of membrane transport by the cystic fibrosis
transmembrane conductance regulator (CFTR), In The cystic fibrosis transmembrane
conductance regulator. K. L. Kirk, and D. C. Dawson, eds. Georgetown, TX: Landes
Bioscience 55-93.
36. Schwiebert, E. M., Egan, M. E., and Hwang, T. H. (1995). CFTR regulates outwardly
rectifying chloride channels through an autocrine mechanism involving ATP. Cell 81,
1063-1073.
37. Reisin, I. L., Prat, A. G., and Abraham, E. H. (1994). The cystic fibrosis
transmembrane conductance regulator is a dual ATP and chloride channel. J Biol Chem
269, 20584-20591.
38. Vankeerberghen, A., Cuppens, H., and Cassiman, J. J. (2002). The cystic fibrosis
transmembrane conductance regulator: an intriguing protein with pleiotropic functions. J
Cyst Fibros 1, 13-29.
39. The Cystic Fibrosis Mutation Database. (2012). The cystic fibrosis mutation database.
[cited June 2012], available from: The Cystic Fibrosis Mutation Database.
http://www.genet.sickkids.on.ca/app.
40. Kerem, B., Chiba-Falek, O., and Kerem, E. (1997). Cystic fibrosis in Jews: frequency
and mutation distribution. Genet Test 1, 35-39.
41. Wilschanski, M., Yahav, Y., Yaacov, Y., Blau, H., Bentur, L., and Rivlin, J. (2003).
Gentamicin-induced correction of CFTR function in patients with cystic fibrosis and
CFTR stop mutations. N Engl J Med 349, 1433-1441.
42. Jensen, T. J., Loo, M. A., Pind, S., Williams, D. B., Goldberg, A. L., and Riordan, J.
R. (1995). Multiple proteolytic systems, including the proteasome, contribute to CFTR
processing. Cell 83, 129-135.
43. Ward, C. L., Omura, S., and Kopito, R. R. (1995). Degradation of CFTR by the
ubiquitin proteasome pathway. Cell 83, 121-127.
44. Dalemans, W., Barbry, P., Champigny, G., Jallat, S., Dott, K., Dreyer, D., Crystal, R.
G., Pavirani, A., Lecocq, J. P. and Lazdunski, M. (1991). Altered chloride ion channel
kinetics associated with the delta F508 cystic fibrosis mutation. Nature 354, 526-528.
45. Rubenstein, R. C., Egan, M. E., and Zeitlin, P. L. (1997). In vitro pharmacologic
restoration of CFTR-mediated chloride transport with sodium 4-phenylbutyrate in cystic
fibrosis epithelial cells containing delta F508-CFTR. J Clin Invest 100, 2457-2465.

119
46. Rubenstein, R. C., and Zeitlin, P. L. (1998). A pilot clinical trial of oral sodium 4-
phenylbutyrate (buphenyl) in delta F508-homozygous cystic fibrosis patients: partial
restoration of nasal epithelial CFTR function. Am J Respir Crit Care Med 157, 484-490.
47. Egan, M. E., Pearson, M., Weiner, S. A., Rajendran, V., Rubin, D., GlocknerPagel, J.,
Canny, S., Du, K., Lukacs, G. L., and Caplan, M. J. (2004). Curcumin, a major
constituent of turmeric, corrects cystic fibrosis defects. Science 304, 600-602.
48. Pedemonte, N., Lukacs, G. L., Du, K., Caci, E., Zegarra-Moran, O., Galietta, L. V.,
and Verkman, A. S. (2005). Small molecule correctors of defective DF508-CFTR cellular
processing identified by high-throughput screening. J Clin Invest 115, 2564-2571.
49. Denning, G. M., Anderson, M. P., Amara, J. F., Marshall, J., Smith, A. E., and Welsh,
M. J. (1992). Processing of mutant cystic fibrosis transmembrane conductance regulator
is temperature-sensitive. Nature 358, 761-764.
50. Alberti, S., Bohse, K., Arndt, V., Schmitz, A., and Hohfeld, J. (2004). The
cochaperone HspBP1 inhibits the CHIP ubiquitin ligase and stimulates the maturation of
the cystic fibrosis transmembrane conductance regulator. Mol Biol Cell 15, 4003-4010.
51. Hassink, G. C., Zhao, B., Sompallae, R., Altun, M., Gastaldello, S., Zinin, N. V.,
Masucci, M. G., and Lindsten, K. (2009). The ER-resident ubiquitin-specific protease 19
participates in the UPR and rescues ERAD substrates. EMBO Rep 10, 755-761.
52. Pedemonte, N., Sonawane, N. D., Taddei, A., Hu, J., Zegarra-Moran, O., Suen, Y. F.,
Robins, L. I., Dicus, C. W., Willenbring, D., Nantz, M. H., Kurth, M. J., Galietta, L. J.,
and Verkman, A. S. (2005). Phenylglycine and sulfonamide correctors of defective delta
F508 and G551D cystic fibrosis transmembrane conductance regulator chloride-channel
gating. Mol Pharmacol 67, 1797-1807.
53. Yang, H., Shelat, A. A., Guy, R. K., Gopinath, V. S., Ma, T., Du, K., Lukacs, G. L.,
Taddei, A., Folli, C., Pedemonte, N., Galietta, L. J., and Verkman, A. S. (2003).
Nanomolar affinity small molecule correctors of defective delta F508- CFTR chloride
channel gating. J Biol Chem 278, 35079-35085.
54. Accurso, F. J., Rowe, S. M., Clancy, J. P., Boyle, M. P., Dunitz, J. M., Durie, P. R.,
Sagel, S. D., Hornick, D. B., Konstan, M. W., Donaldson, S. H., Moss, R. B., Pilewski, J.
M., et al. (2010). Effect of VX-770 in persons with cystic fibrosis and the G551D- CFTR
mutation. N Engl J Med 363, 1991-2003.
55. Ramsey, B. W., Davies, J., McElvaney, N. G., Tullis, E., Bell, S. C., Drevinek, P.,
Griese, M., Mckone, E. F., Wainwright, C. E., Konstan, M. W., Moss, R., Ratjen, F.,
Sermet-Gaudelus, I., Rowe, S. M., Rodriguez, S., Ordonez, C., and Elborn, J. S. (2011).
A CFTR potentiator in patients with cystic fibrosis and the G551D mutation. N Engl J
Med 365, 1663-1672.

120
56. Augarten, A., Kerem, B. S., Yahav, Y., Noiman, S., Rivlin, Y., and Tal, A. (1993).
Mild cystic fibrosis and normal or borderline sweat test in patients with the 3849+10kb
C→T mutation. Lancet 342, 25-26.
57. Kerem, E., Rave-Harel, N., and Augarten, A. (1997). A cystic fibrosis transmembrane
conductance regulator splice variant with partial penetrance associated with variable
cystic fibrosis presentations. Am J Respir Crit Care Med 155, 1914-1920.
58. Nissim-Rafinia, M., and Kerem, B. (2006). Splicing modulation as a modifier of the
CFTR function. Prog Mol Subcell Biol 44, 233-254.
59. Friedman, K., Kole, J., Cohn, J. A., Knowles, M. R., Silverman, L. M., and Kole, R.
(1999). Correction of aberrant splicing of the cystic fibrosis transmembrane conductance
regulator (CFTR) gene by antisense oligonucleotides. J Biol Chem 274, 36193-36199.
60. Nissim-Rafinia, M., Aviram, M., Randell, S. H., Shushi, L., Ozeri, E., Chiba-Falek,
O., Eidelman, O., Pollard, H. B., Yankaskas, J. R., and Kerem, B. (2004). Restoration of
the cystic fibrosis transmembrane conductance regulator function by splicing modulation.
EMBO Rep 5, 1071-1077.
61. Boat, T. F., Welsh, M. J., and Beaudet, A. L. (1989). Cystic fibrosis, In The
Metabolic Basis of Inherited Disease. C. R. Scriver, ed. New York, NY: McGraw-Hill
2649-2680.
62. Boucher, R. C. (2007). Airway surface dehydration in cystic fibrosis: pathogenesis
and therapy. Annu Rev Med 58, 157-170.
63. Matsui, H., Wagner, V. E., and Hill, D. B. (2006). A physical linkage between cystic
fibrosis airway surface dehydration and Pseudomonas aeruginosa biofilms. Proc Natl
Acad Sci, USA 103, 18131-18136.
64. Smith, J. J., Travis, S. M., Greenberg, E. P., and Welsh, M. J. (1996). Cystic fibrosis
airway epithelia fail to kill bacteria because of abnormal airway surface fluid. Cell 85,
229-236.
65. Khan, T. Z., Wagener, J. S., Bost, T., Martinez, J., Accurso, F. J., and Riches, D. W.
(1995). Early pulmonary inflammation in infants with cystic fibrosis. Am J Respir Crit
Care Med 151, 1075-1082.
66. Rosenfeld, M., Ramsey, B. W., Gibson, R. L. (2003). Pseudomonas acquisition in
young patients with cystic fibrosis: pathophysiology, diagnosis, and management. Curr
Opin Pulmonol Med 9, 492-497.

121
67. Bronstein, M. N., Sokol, R. J., Abman, S. H., Chatfield, B. A., Hammond, K. B., and
Hambidge, K. M. (1992). Pancreatic insufficiency, growth, and nutrition in infants
identified by newborn screening as having cystic fibrosis. J Pediatr 120, 533-540.
68. Zentler-Munro, P. L. (1989). Pancreatic exocrine insufficiency and cystic fibrosis.
Curr Opin Gastroenterol 5, 706-710.
69. Durie, P. R., Forstner, G. G. (1989). Pathophysiology of the exocrine pancreas in
cystic fibrosis. J R Soc Med 82, 2-10.
70. Sinaasappel, M. (1992). Relationship between intestinal function and chloride
secretion in patients with cystic fibrosis. Neth J Med 41, 110-114.
71. Bali, A., Stableforth, D. E., and Asquith, P. (1983). Prolonged small-intestinal transit
time in cystic fibrosis. Br Med J 287, 1011-1013.
72. Escobar, H., Perdomo, M., and Vasconez, F. (1992). Intestinal permeability to 51Cr-
EDTA and orocecal transit time in cystic fibrosis. J Pediatr Gastroenterol Nutr 14, 204-
207.
73. Kerem, E., Corey, M., and Kerem, B. (1989). Clinical and genetic comparisons of
patients with cystic fibrosis, with or without meconium ileus. J Pediatr 114, 767-773.
74. Dray, X., Bienvenu, T., and Desmazes-Dufeu, N. (2004). Distal intestinal obstruction
syndrome in adults with cystic fibrosis. Clin Gastroenterol Hepatol 2, 498-503.
75. Wilschanski, M., and Durie, P. R. (2007). Patterns of GI disease in adulthood
associated with mutations in the CFTR gene. Gut 56, 1153-1163.
76. Colombo, C. (2007). Liver disease in cystic fibrosis. Curr Opin Pulm Med 13, 529-
536.
77. Oppenheimer, E. H., and Esterly, J. R. (1975). Hepatic changes in young infants with
cystic fibrosis: possible relation to focal biliary cirrhosis. J Pediatr 86, 683-689.
78. Cystic Fibrosis Foundation. (2004). 2003 annual data report to the center directors.
Bethesda, MD: Cystic Fibrosis Foundation Patient Registry.
79. Wong, P. Y. (1998). CFTR gene and male fertility. Mol Hum Reprod 4, 107-110.
80. Oppenheimer, E. A., Case, A. L., Esterly, J. R., and Rothberg, R. M. (1970). Cervical
mucus in cystic fibrosis: a possible cause of infertility. Am J Obstetrics Gynecol 108,
673-674.

122
81. Gibson, R. A., Teubner, J. K., Haines, K., Cooper, D. M., and Davidson, G. P. (1986).
Relationships between pulmonary function and plasma fatty acid levels in cystic fibrosis
patients, J Pediatr Gastroenterol Nutr 5, 408-415.
82. Lepage, G., Levy, E., Ronco, N., Smith, L., Galeano, N., and Roy, C. C. (1989).
Direct transesterification of plasma fatty acids for the diagnosis of essential fatty acid
deficiency in cystic fibrosis. J Lipid Res 30, 1483-1490.
83. Lloyd-Still, J. D., Johnson, S. B., and Holman, R. T. (1991). Essential fatty acid status
and fluidity of plasma phospholipids in cystic fibrosis infants. Am J Clin Nutr 54, 1029-
1035.
84. Underwood, B. A., Denning, C. R., and Navab, M. (1972). Polyunsaturated fatty
acids and tocopherol levels in patients with cystic fibrosis. Ann NY Acad Sci 203, 237-
247.
85. Batal, I., Ericsoussi, M. B., Cluette-Brown, J. E., O’Sullivan, B. P., Freedman, S. D.,
Savaille, J. E., and Laposata, M. (2007). Potential utility of plasma fatty acid analysis in
the diagnosis of cystic fibrosis. Clin Chem 53, 78-84.
86. Gilljam, H., Strandvik, B., Ellin, A., and Wiman, L. G. (1986). Increased mole
fraction of arachidonic acid in bronchial phospholipids in patients with cystic fibrosis.
Scand J Clin Lab Invest 46, 511-518.
87. Rosenberg, L. A., Schluchter, M. D., Parlow, A. F., and Drumm, M. L. (2006).
Mouse as a model of growth retardation in cystic fibrosis. Pediatr Res 59, 191-195.
88. Clarke, L. L., Grubb, B. R., Gabriel, S. E., Smithies, O., Koller, B. H., and Boucher,
R. C. (1992). Defective epithelial chloride transport in a gene-targeted mouse model of
cystic fibrosis. Science 257, 1125-1128.
89. Grubb, B. R., and Gabriel, S. E. (1997). Intestinal physiology and pathology in gene
targeted mouse models of cystic fibrosis. Am J Physiol Gastrointest Liver Physiol 273,
258-266.
90. Norkina, O., Burnett, T. G., and De Lisle, R. C. (2004). Bacterial overgrowth in the
cystic fibrosis transmembrane conductance regulator null mouse small intestine. Infect
Immun 72, 6040-6049.
91. Norkina, O., Kaur, S., Ziemer, D., and De Lisle, R. C. (2004). Inflammation of the
cystic fibrosis mouse small intestine. Am J Physiol Gastrointest Liver Physiol 286, 1032-
1041.
92. Ollero, M., Laposata, M., Zaman, M. M., Blanco, P. G., Andersson, C., Zeind, J.,
Urman, Y., Kent, G., Alvarez, J. G., and Freedman, S. D. (2006). Evidence of increased

123
flux to n-6 docosapentaenoic acid in phospholipids of pancreas from cftr-/-
knockout
mice. Metabolism 55, 1192-1200.
93. Beharry, S., Ackerley, C., Corey, M., Kent, G., Heng, Y. M., Christensen, H., Luk,
C., Yantiss, R. K., Nasser, I. A., Zaman, M., Freedman, S. D., and Durie, P. R. (2007).
Long-term docosahexaenoic acid therapy in a congenic murine model of cystic fibrosis.
Am J Physiol Gastrointest Liver Physiol 292, 839-848.
94. Bhura-Bandali, F. N., Suh, M., and Man, S. F. (2000). The deltaF508 mutation in the
cystic fibrosis transmembrane conductance regulator alters control of essential fatty acid
utilization in epithelial cells. J Nutr 130, 2870-2875.
95. Nakamura, M. T., and Nara, T. Y. (2003). Essential fatty acid synthesis and its
regulation in mammals. Prostaglandins Leukot Essent Fatty Acids 68, 145-150.
96. Jump, D. B. (2009). Mammalian fatty acid elongases. Methods Mol Biol 579, 375-
389.
97. Nakamura, M. T., and Nara, T. Y. (2002). Gene regulation of mammalian
desaturases. Biochem Soc Trans 30, 1076-1079.
98. Jakobsson, A., Westerburg, R., and Jacobsson, A. (2006). Fatty acid elongases in
mammals: their regulation and roles in metabolism. Prog Lipid Res 45, 237-249.
99. Rajan, S., Cacalano, G., Bryan, R., Ratner, A. J., Sontich, C. U., van Heerckeren, A.,
Davis, P., and Prince, A. (2000). Pseudomonas aeruginosa induction of apoptosis in
respiratory epithelial cells: analysis of the effects of cystic fibrosis transmembrane
conductance regulator dysfunction and bacterial virulence factors. Am J Respir Cell Mol
Biol 23, 304-312.
100. Folch, J., Lees, M., and Sloane-Stanley, G. H. (1957). A simple method for the
isolation and purification of total lipids from animal tissues. J Biol Chem 226, 497-509.
101. Bruzzone, R., Halban, P. A., and Gjinovci, A. (1985). A new rapid method for
preparation of dispersed pancreatic acini. Biochem J 226, 621-624.
102. Zeitlin, P. L., Lu, L., Rhim, J., Cutting, G., Stetten, G., Kieffer, K. A., Craig, R., and
Guggino, W. B. (1991). A cystic fibrosis bronchial epithelial cell line: immortalization by
adeno-12-SV40 infection. Am J Respir Cell Mol Biol 4, 313-319.
103. Siguel, E. N., and Maclure, M. (1987). Relative activity of unsaturated fatty acid
metabolic pathways in humans. Metabolism 36, 664-669.
104. Lands, W. E. (1992). Biochemistry and physiology of n-3 fatty acids. FASEB J 6,
2530-2536.
124
105. Rodriguez, A., Sarda, P., Nessmann, C., Boulot, P., Leger, C. L., and Descomps, B.
(1998). Delta6- and delta5-desaturase activities in the human fetal liver: kinetic aspects. J
Lipid Res 39, 1825-1832.
106. Lemen, R. J., Gates, A. J., Mathe, A. A., Waring, W. W., Hyman, A. L., and
Kadowitz, P. D. (1978). Relationships among digital clubbing, disease severity, and
serum prostaglandins F2 alpha and E concentrations in cystic fibrosis patients. Am Rev
Respir Dis 117, 639-646.
107. Rigas, B., Korenberg, J. R., Merrill, W. W., and Levine, L. (1989). Prostaglandins
E2 and E2 alpha are elevated in saliva of cystic fibrosis patients. Am J Gastroenterol 84,
1408-1412.
108. Strandvik, B., Svensson, E., and Seyberth, H. W. (1996). Prostanoid biosynthesis in
patients with cystic fibrosis. Prostaglandins Leukot Essent Fatty Acids 55, 419-425.
109. Sampson, A. P., Spencer, D. A., Green, C. P., Piper, P. J., and Price, J. F. (1990).
Leukotrienes in the sputum and urine of cystic fibrosis children. Br J Clin Pharmacol 30,
861-869.
110. Konstan, M. W., Walenga, R. W., Hilliard, K. A., and Hilliard, J. B. (1993).
Leukotriene B4 markedly elevated in the epithelial lining fluid of patients with cystic
fibrosis. Am Rev Respir Dis 148, 896-901.
111. Roca-Ferrer, J., Pujols, L., Gartner, S., Moreno, A., Pumarola, F., Mullol, J., Cobos,
N., and Picado, C. (2006). Upregulation of COX-1 and COX-2 in nasal polyps in cystic
fibrosis. Thorax 61, 592-596.
112. Owens, J. M., Shroyer, K. R., and Kingdom, T. T. (2008). Expression of
cyclooxygenase and lipoxygenase enzymes in sinonasal mucosa of patients with cystic
fibrosis. Arch Otolaryngol Head Neck Surg 134, 825-831.
113. Sugimoto, Y., and Narumiya, S. (2007). Prostaglandin E receptors. J Biol Chem 282,
11613-11617.
114. Futaki, N., Takahashi, S., Yokoyama, M., Arai, I., Higuchi, S., and Otomo, S.
(1994). NS-398, a new anti-inflammatory agent, selectively inhibits prostaglandin G/H
synthase/cyclooxygenase (COX-2) activity in vitro. Prostaglandins 47, 55-59.
115. Snouwaert, J. N., Brigman, K. K., Latour, A. M., Malouf, N. N., Boucher, R. C.,
Smithies, O., and Koller, B. H. (1992). An animal model for cystic fibrosis made by gene
targeting. Science 257, 1083-1088.
116. De Lisle, R. C. (2007). Altered transit and bacterial overgrowth in the cystic fibrosis
mouse small intestine. Am J Physiol Gastrointest Liver Physiol 293, 104-111.

125
117. Majerus, P. W., Neufeld, E. J., and Laposata, M. (1985). Mechanisms for eicosanoid
precursor uptake and release by a tissue culture cell line, In Inositol and
Phosphoinositides: Metabolism and Regulation. J. E. Bleasdale, J. Eichberg, G. Hauser,
eds. Clifton, NJ: Humana Press Inc 443–457.
118. Van Biervliet, S., Vanbillemont, G., Van Biervliet, J. P., Declercq, D., Robberecht,
E., and Christophe, A. (2007). Relation between fatty acid composition and clinical status
or genotype in cystic fibrosis patients. Ann Nutr Metab 51, 541-549.
119. Akiba, Y., Furukawa, O., and Guth, P. H. (2001). Sensory pathways and
cyclooxygenase regulate mucus gel thickness in rat duodenum. Am J Physiol Gastrointest
Liver Physiol 280, 470-474.
120. De Lisle, R. C., Meldi, L., Flynn, M., and Jansson, K. (2008). Altered eicosanoid
metabolism in the cystic fibrosis mouse small intestine. J Pediatr Gastroenterol Nutr 47,
406-416.
121. Ishizawa, M. (1991). Contractile effects of 16-methyl analogues of PGE2 on the
circular and longitudinal muscles of the guinea-pig isolated colon. Prostaglandins 42,
579-586.
122. Isselbacher, K. J. (1987). The role of arachidonic acid metabolites in gastrointestinal
homeostasis: Biochemical, histological, and clinical gastrointestinal effects. Drugs 33,
38-46.
123. Tirouvanziam, R., de Bentzmann, S., Hubeau, C., Hinnrasky, J., Jacquot, J., and
Peault, B. (2000). Inflammation and infection in naive human cystic fibrosis airway
grafts. Am J Respir Cell Mol Biol 23, 121-127.
124. Rosenfeld, M., Gibson, R. L., McNamara, S., Emerson, J., Burns, J. L., and Castile,
R. (2001). Early pulmonary infection, inflammation, and clinical outcomes in infants
with cystic fibrosis. Pediatr Pulmonol 32, 356-366.
125. Konstan, M. W., Hilliard, K. A., Norvell, T. M., and Berger, M. (1994).
Bronchoalveolar lavage findings in cystic fibrosis patients with stable, clinically mild
lung disease suggest ongoing infection and inflammation. Am J Respir Crit Care Med
150, 448-454.
126. Serhan, C. N., Hong, S., Gronert, K., Colgan, S. P., Devchand, P. R., Mirick, G., and
Moussignac, R. L. (2002). Resolvins: a family of bioactive products of omega-3 fatty
acid transformation circuits initiated by aspirin treatment that counter proinflammation
signals. J Exp Med 196, 1025-1037.

126
127. Grønn , M., Christensen, E., Hagve, T. A., and Christophersen, B. O. (1991).
Peroxisomal retroconversion of docosahexaenoic acid (22:6(n-3)) to eicosapentaenoic
acid (20:5(n-3)) studied in isolated rat liver cells. Biochim Biophys Acta 1081, 85-91.
128. Brossard, N., Croset, M., Pachiaudi, C., Riou, J. P., Tayot, J. L., and Lagarde, M.
(1996). Retroconversion and metabolism of [13C] 22:6n-3 in humans and rats after intake
of a single dose of [13C] 22:6n-3 triacylglycerols. Am J Clin Nutr 64, 577-586.
129. Conquer, J. A., and Holub, B. J. (1997). Dietary docosahexaenoic acid as a source of
eicosapentaenoic acid in vegetarians and omnivores. Lipids 32, 341-345.
130. Freedman, S. D., Weinstein, D., Blanco, P. G., Martinez-Clark, P., Urman, S.,
Zaman, M., Morrow, J. D., and Alvarez, J. G. (2002). Characterization of LPS-induced
lung inflammation in cftr-/- mice and the effect of docosahexaenoic acid. J Appl Physiol
92, 2169-2176.
131. Lloyd-Still, J. D., Powers, A. C., Hoffman, D. R., Boyd-Trull, K., Lester, L. A.,
Benisek, D. C., and Arterburn, L. M. (2006). Bioavailability and safety of a high dose of
docosahexaenoic acid triacylglycerol of algal origin in cystic fibrosis patients: a
randomized, controlled study. Nutrition 22, 36-46.
132. Jumpsen, J. A., Brown, N. E., Thomson, A. B., Paul Man, S. F., Goh, Y. K., Ma, D.,
and Clandinin, M. T. (2006). Fatty acids in blood and intestine following
docosahexaenoic acid supplementation in adults with cystic fibrosis. J Cyst Fibros 5, 77-
84.
133. Van Biervliet, S., Devos, M., Delhaye, T., Van Biervliet, J. P., Robberecht, E., and
Christophe, A. (2008). Oral DHA supplementation in DeltaF508 homozygous cystic
fibrosis patients. Prostaglandins Leukot Essent Fatty Acids 78, 109-115.
134. De Vizia, B., Raia, V., Spano, C., Pavlidis, C., Coruzzo, A., and Alessio, M. (2003).
Effect of an 8-month treatment with omega-3 fatty acids (eicosapentaenoic and
docosahexaenoic) in patients with cystic fibrosis. J Parenter Enteral Nutr 27, 52-57.
135. Olveira, G., Olveira, C., Acosta, E., Espildora, F., Garrido-Sanchez, L., Garcia-
Escobar, E., Rojo-Martinez, G., Gonzalo, M., and Soriguer, F. (2010). Fatty acid
supplements improve respiratory, inflammatory and nutritional parameters in adults with
cystic fibrosis. Arch Bronconeumol 46, 70-77.
136. Lien, E. L., Boyle, F. G., Yuhas, R. J., and Kuhlman, C. F. (1994). Effect of
maternal dietary arachidonic or linoleic acid on rat pup fatty acid profiles. Lipids 29, 53-
59.
137. Anderson, G. J., and Connor, W. E. (1988). Uptake of fatty acids by the developing
rat brain. Lipids 23, 286-290.

127
138. Beharry, S., Ackerley, C., Corey, M., Kent, G., Heng, Y. M., Christensen, H., Luk,
C., Yantiss, R. K., Nasser, I. A., Zaman, M., Freedman, S. D., and Durie, P. R. (2007).
Long-term docosahexaenoic acid therapy in a congenic murine model of cystic fibrosis.
Am J Physiol Gastrointest Liver Physiol 292, 839-848.
139. Van Heeckeren, A. M., Schluchter, M., Xue, L., Alvarez, J., Freedman, S., St, G. J.,
and Davis, P. B. (2004). Nutritional effects on host response to lung infections with
mucoid Pseudomonas aeruginosa in mice. Infect Immun 72, 1479 -1486.
140. Ma, T. (2002). Thiazolidinone CFTR inhibitor identified by high-throughput
screening blocks cholera toxin-induced intestinal fluid secretion. J Clin Invest 110, 1651-
1658.
141.Van der Vliet, A., Eiserich, J. P., Marelich, G. P., Halliwell, B., and Cross, C. E.
(1997). Oxidative stress in cystic fibrosis: does it occur and does it matter? Adv
Pharmacol 38, 491-513.
142. Bonfield, T. L., Panuska, J. R., Konstan, M. W., Hilliard, K. A., Hilliard, J. B.,
Ghnaim, H., and Berger, M. (1995). Inflammatory cytokines in cystic fibrosis lungs. Am J
Respir Crit Care Med 152, 2111-2118.
143. Noah, T. L., Black, H. R., Cheng, P. W., Wood, R. E., and Leigh, M. W. (1997).
Nasal and bronchoalveolar lavage fluid cytokines in early cystic fibrosis. J Infect Dis 175,
638-647.
144. Welsh, M. J., Ramsey, B. W., Accurso, F. J., and Cutting, G. R. (2001). Cystic
fibrosis, In The Metabolic Basis of Inherited Disease, 8th
ed. C. R. Scriver, ed. New York,
NY: McGraw-Hill 5121-5188.
145. Montuschi, P., Kharitonov, S. A., Ciabattoni, G., Corradi, M., van Rensen, L.,
Geddes, D. M., Hodson, M. E., and Barnes, P. J. (2000). Exhaled 8-isoprostane as a new
non-invasive biomarker of oxidative stress in cystic fibrosis. Thorax 55, 205-209.
146. Kettle, A. J., Chan, T., Osberg, I., Senthilmohan, R., Chapman, A. L., Mocatta, T. J.,
and Wagener, J. S. (2004). Myeloperoxidase and protein oxidation in the airways of
young children with cystic fibrosis. Am J Respir Crit Care Med 170, 1317-1323.
147. Van Der Vliet, A., Nguyen, M. N., Shigenaga, M. K., Eiserich, J. P., Marelich, G.
P., and Cross, C. E. (2000). Myeloperoxidase and protein oxidation in cystic fibrosis. Am
J Physiol Lung Cell Mol Physiol 279, 537-546.
148. Starosta, V., Rietschel, E., Paul, K., Baumann, U., and Griese, M. (2006). Oxidative
changes of bronchoalveolar proteins in cystic fibrosis. Chest 129, 431-437.

128
149. Wood, L. G., Fitzgerald, D. A., Gibson, P. G., Cooper, D. M., Collins, C. E., and
Garg, M. L. (2001). Oxidative stress in cystic fibrosis: dietary and metabolic factors. J
Am Coll Nutr 20, 157-165.
150. Back, E. I., Frindt, C., and Nohr, D. (2004). Antioxidant deficiency in cystic
fibrosis: when is the right time to take action? Am J Clin Nutr 80, 374-384.
151. Brown, R. K., and Kelly, F. J. (1996). Evidence for increased oxidative damage in
patients with cystic fibrosis. Pediatr Res 36, 487-493.
152. Linsdell, P., and Hanrahan, J. W. (1998). Glutathione permeability of CFTR. Am J
Physiol 275, 323-326.
153. Gao, L., Kim, K. J., Yankaskas, J. R., and Forman, H. J. (1999). Abnormal
glutathione transport in cystic fibrosis airway epithelia. Am J Physiol 277, 113-118.
154. Kogan, I., Ramjeesingh, M., Li, C., Kidd, J. F., Wang, Y., Leslie, E. M., Cole, S. P.
and Bear, C. E. (2003). CFTR directly mediates nucleotide-regulated glutathione flux.
EMBO J 22, 1981-1989.
155. Cantin, A. M., North, S. L., Hubbard, R. C., and Crystal, R. G. (1987). Normal
alveolar epithelial lining fluid contains high levels of glutathione. J Appl Physiol 63, 152-
157.
156.Van Klaveren, R. J., Demedts, M., and Nemery, B. (1997). Cellular glutathione
turnover in vitro, with emphasis on type II pneumocytes. Eur Respir J 10, 1392-1400.
157. Roum, J. H., Buhl, R., McElvaney, N. G., Borok, Z., and Crystal, R. G. (1993).
Systemic deficiency of glutathione in cystic fibrosis. J Appl Physiol 75, 2419-2424.
158. Velsor, L. W., van Heeckeren, A., and Day, B. J. (2001). Antioxidant imbalance in
the lungs of cystic fibrosis transmembrane conductance regulator protein mutant mice.
Am J Physiol Lung Cell Mol Physiol 281, 31-38.
159. Velsor, L. W., Kariya, C., Kachadourian, R., and Day, B. J. (2006). Mitochondrial
oxidative stress in the lungs of cystic fibrosis transmembrane conductance regulator
protein mutant mice. Am J Respir Cell Mol Biol 35, 579-586.
160. Kelly-Aubert, M., Trudel, S., Fritsch, J., Nguyen-Khoa, T., Baudouin-Legros, M.,
Moriceau, S., Jeanson, L., Djouadi, F., Matar, C., Conti, M., Ollero, M., Brouillard, F.,
and Edelman, A. (2011). GSH monoethyl ester rescues mitochondrial defects in cystic
fibrosis models. Hum Mol Genet 20, 2745-2759.
161. Richard, D., Kefi, K., Barbe, U., Bausero, P., and Visioli, F. (2008). Polyunsaturated
fatty acids as antioxidants. Pharmacol Res 57, 451-455.

129
162. Johnson, F., and Giulivi, C. (2005). Superoxide dismutases and their impact upon
human health. Mol Aspects Med 26, 340-352.
163. Jump, D. B., Botolin, D., Wang, Y., Xu, J., Christian, B., and Demeure, O. (2005).
Fatty acid regulation of hepatic gene transcription. J Nutr 135, 2503-2506.
164. Reynders, V., Loitsch, S., Steinhauer, C., Wagner, T., Steinhilber, D., and Bargon, J.
(2006). Peroxisome proliferator-activated receptor alpha (PPAR alpha) down-regulation
in cystic fibrosis lymphocytes. Respir Res 7, 104-109.
165. Xu, Y., Tertilt, C., Krause, A., Quadri, L. E., Crystal, R. G., and Worgall, S. (2009).
Influence of the cystic fibrosis transmembrane conductance regulator on expression of
lipid metabolism-related genes in dendritic cells. Respir Res 10, 26-32.
166. Pall, H., Zaman, M., Andersson, C., and Freedman, S. D. (2006). Decreased
peroxisome proliferator activated receptor alpha is associated with bile duct injury in
cystic fibrosis transmembrane conductance regulator-/-
mice. J Pediatr Gastroenterol
Nutr 42, 275-281.
167. Shapiro, B. L. (1989). Evidence for a mitochondrial lesion in cystic fibrosis. Life Sci
44, 1327-1334.
168. Shapiro, B. L. (1988). Mitochondrial dysfunction, energy expenditure, and cystic
fibrosis. Lancet 2, 289.
169. Cadenas, E., and Davies, K. J. (2000). Mitochondrial free radical generation,
oxidative stress, and aging. Free Radic Biol Med 29, 222-230.
170. Liu, Y., Fiskum, G., and Schubert, D. (2002). Generation of reactive oxygen species
by the mitochondrial electron transport chain. J Neurochem 80, 780-787.
171. Bacsi, A., Woodberry, M., Widger, W., Papaconstantinou, J., Mitrac, S., Petersona,
J. W., and Boldogh, I. (2006). Localization of superoxide anion production to
mitochondrial electron transport chain in 3-NPA-treated cells. Mitochondrion 6, 235-244.
172. Zhao, H. W., Ali, S. S., and Haddad, G. G. (2012). Does hyperoxia selection cause
adaptive alterations of mitochondrial electron transport chain activity leading to a
reduction of superoxide production? Antioxid Redox Signal 16, 1071-1076.
173. Mungai, P. T., Waypa, G. B., Jairaman, A., Prakriya, M., Dokic, D., Ball, M. K., and
Schumacker, P. T. (2011). Hypoxia triggers AMPK activation through ROS-mediated
activation of CRAC channels. Mol Cell Biol 17, 3531-3545.
174. Witczak, C. A., Sharoff, C. G., and Goodyear, L. J. (2008). AMP-activated protein
kinase in skeletal muscle: from structure and localization to its role as a master regulator
of cellular metabolism. Cell Mol Life Sci 65, 3737-3755.

130
175. Sanders, M. J., Grondin, P. O., Hegarty, B. D., Snowden, M. A., and Carling, D.
(2007). Investigating the mechanism for AMP activation of the AMP-activated protein
kinase cascade. Biochem J 403, 139-148.
176. Oakhill, J. S., Steel, R., Chen, Z. P., Scott, J. W., Ling, N., Tam, S., and Kemp, B. E.
(2011). AMPK is a direct adenylate charge-regulated protein kinase. Science 332, 1433-
1435.
177. Woods, A., Dickerson, K., Heath, R., Hong, S. P., Momcilovic, M., Johnstone, S.
R., Carlson, M., and Carling, D. (2005). Ca2+/calmodulin-dependent protein kinase
kinase-beta acts upstream of AMP-activated protein kinase in mammalian cells. Cell
Metab 2, 21-33.
178. Woods, A., Johnstone, S. R., Dickerson, K., Leiper, F. C., Fryer, L. G., Neumann,
D., Schlattner, U., Wallimann, T., Carlson, M., and Carling, D. (2003). LKB1 is the
upstream kinase in the AMP-activated protein kinase cascade. Curr Biol 13, 2004-2008.
179. Merrill, G. M., Kurth, E., Hardie, D. G., and Winder, W. W. (1997). AICA riboside
increases AMP-activated protein kinase, fatty acid oxidation, and glucose uptake in rat
muscle. Am J Physiol 273, 1107-1112.
180. Bungard, D., Fuerth, B. J., Zeng, P. Y., Faubert, B., Maas, N. L., and Viollet, B.
(2010). Signaling kinase AMPK activates stress-promoted transcription via histone H2B
phosphorylation. Science 329, 1201-1205.
181. Boudina, S., and Abel, E. D. (2006). Mitochondrial uncoupling: a key contributor to
reduced cardiac efficiency in diabetes. Physiology 21, 250-258.
182. Zong, H., Ren, J. M., Young, L. H., Pypaert, M., Mu, J., Birnbaum, M. J., and
Shulman, G. I. (2002). AMP kinase is required for mitochondrial biogenesis in skeletal
muscle in response to chronic energy deprivation. Proc Natl Acad Sci, USA 99, 15983-
15987.
183. Kawashima, Y., Musoh, K., and Kozuka, H. (1990). Peroxisome proliferators
enhance linoleic acid metabolism in rat liver. Increased biosynthesis of omega 6
polyunsaturated fatty acids. J Biol Chem 265, 9170-9175.
184. Zou, M. H., Kirkpatrick, S. S., Davis, B. J., Nelson, J. S., Wiles, W. G., Schlattner,
U., Neumann, D., Brownlee, M., Freeman, M. B., and Goldman, M. H. (2004).
Activation of the AMP-activated protein kinase by the anti-diabetic drug metformin in
vivo. Role of mitochondrial reactive nitrogen species. J Biol Chem 279, 43940-43951.
185. Zhang, J., Xie, Z., Dong, Y., Wang, S., Liu, C., and Zou, M. H. (2008).
Identification of nitric oxide as an endogenous activator of the AMP-activated protein
kinase in vascular endothelial cells. J Biol Chem 283, 27452-27461.

131
186. Chen, Z. P., Mitchelhill, K. I., Michell, B. J., Stapleton, D., Rodriguez-Crespo, I.,
Witters, L. A., Power, D. A., Ortiz de Montellano, P. R., and Kemp, B. E. (1999). AMP-
activated protein kinase phosphorylation of endothelial NO synthase. FEBS Lett 443,
285-289.
187. Belvisi, M., Barnes, P. J., and Larkin, S. (1995). Nitric oxide synthase activity is
elevated in inflammatory lung disease in humans. Eur J Pharmacol 283, 255-258.
188. Grasemann, H., Ioannidis, I., and Tomkiewicz, R. P. (1998). Nitric oxide
metabolites in cystic fibrosis lung disease. Arch Dis Child 78, 49-53.
189. Ho, L. P., Innes, J. A., and Greening, A. P. (1998). Nitrite levels in breath
condensate of patients with cystic fibrosis is elevated in contrast to exhaled nitric oxide.
Thorax 53, 680-684.
190. Jones, K. L., Hegab, A. H., Hillman, B. C., Simpson, K. L., Jinkins, P. A., Grisham,
M. B., Owens, M. W., Sato, E., and Robbins, R. A. (2000). Elevation of nitrotyrosine and
nitrate concentrations in cystic fibrosis sputum. Pediatr Pulmonol 30, 79-85.
191. Bartoszewski, R., Rab, A., Jurkuvenaite, A., Mazur, M., Wakefield, J., Collawn, J.
F., and Bebok, Z. (2008). Activation of the unfolded protein response by δF508
CFTR. Am J Respir Cell Mol Biol 39, 448-457.
192. Mori, K. (2000).Tripartite management of unfolded proteins in the endoplasmic
reticulum. Cell 101, 451-454.
193. Ron, D., and Walter, P. (2007). Signal integration in the endoplasmic reticulum
unfolded protein response. Nat Rev Mol Cell Biol 8, 519-529.
194. Schroder, M., and Kaufman, R. J. (2005).The mammalian unfolded protein
response. Annu Rev Biochem 74, 739-789.
195. Célio, X. C., Tanaka, L. Y., Wosniak, J., and Laurindo, F. M. (2009). Mechanisms
and Implications of Reactive Oxygen Species Generation During the Unfolded Protein
Response: Roles of Endoplasmic Reticulum Oxidoreductases, Mitochondrial Electron
Transport, and NADPH Oxidase. Antioxidants & Redox Signal 11, 2409-2427.
196. Chen, L. Y., Lawson, D. L., and Mehta, J. L. (1994). Reduction in human neutrophil
superoxide anion generation by n-3 polyunsaturated fatty acids: role of cyclooxygenase
products and endothelium-derived relaxing factor. Thromb Res 76, 317-322.
197. Matesanz, N., Park, G., and McAllister, H. (2010). Docosahexaenoic acid improves
the nitroso-redox balance and reduces VEGF mediated angiogenic signaling in
microvascular endothelial cells. Invest Ophthalmol Vis Sci 51, 6815-6825.

132
198. Cobanoglu, N., Ozcelik, U., Gocmen, A., Kiper, N., and Dogru, D. (2002).
Antioxidant effect of b-carotene in cystic fibrosis and bronchiectasis: clinical and
laboratory parameters of a pilot study. Acta Paediatr 91, 793-798.
199. Konstan, M. W., Schluchter, M. D., Xue, W., and Davis, P. B. (2007). Clinical use
of Ibuprofen is associated with slower FEV1 decline in children with cystic fibrosis. Am J
Respir Crit Care Med 176, 1084-1089.
200. Wood, L. G., Fitzgerald, D. A., Lee, A. K., and Garg, M. L. (2003). Improved
antioxidant and fatty acid status of patients with cystic fibrosis after antioxidant
supplementation is linked to improved lung function. Am J Clin Nutr 77, 150-159.
201. Homnick, D. N., Spillers, C. R., Cox, S. R., Cox, J. H., Yelton, L. A., DeLoof, M. J.,
Oliver, L. K., and Ringer, T. V. (1995). Single- and multiple-dose-response relationships
of beta-carotene in cystic fibrosis. J Pediatr 127, 491-494.
202. Portal, B., Richard, M. J., Coudray, C., Arnaud, J., and Favier, A. (1995). Effect of
double-blind cross-over selenium supplementation on lipid peroxidation markers in cystic
fibrosis patients. Clin Chim Acta 34, 137-146.
203. Renner, S., Rath, R., Rust, P., Lehr, S., Frischer, T., Elmadfa, I., and Eichler, I.
(2001). Effects of beta-carotene supplementation for six months on clinical and
laboratory parameters in patients with cystic fibrosis. Thorax 56, 48-52.
204. Bishop, C., Hudson, V. M., Hilton, S. C., and Wilde, C. (2005). A pilot study of the
effect of inhaled buffered reduced glutathione on the clinical status of patients with cystic
fibrosis. Chest 127, 308-317.
205. Stafanger, G., and Koch, C. (1989). N-acetylcysteine in cystic fibrosis and
Pseudomonas aeruginosa infection: clinical score, spirometry and ciliary motility. Eur
Respir J 2, 234-237.
206. Konstan, M. W., Byard, P. J., Hoppel, C. L., and Davis, P. B. (1995). Effect of high-
dose ibuprofen in patients with cystic fibrosis. N Engl J Med 332, 848-854.
207. Lands, L. C., Milner, R., Cantain, A. M., Manson, D., and Corey, M. (2007). High-
dose Ibuprofen in Cystic Fibrosis: Canadian Safety and Effectiveness Trial. J Pediatr
151, 249-254.
208. Sordelli, D. O., Macri, C. N., Maillie, A. J., and Cerquetti, M. C. (1994). A
preliminary study of the effect of anti-inflammatory treatment in cystic fibrosis patients
with pseudomonas aeruginosa lung infection. Int J Immun Pharmacol 7, 109-117.
209. Shmarina, G. V., Pukhalsky, A. L., and Kashirskaja, N. J. (2004). Anti-inflammatory
therapy in cystic fibrosis: a comparative study in the treatment with nimesulide (selective

133
cyclooxygenase-2 inhibitor) and clarithromycin (14-memebered ring macrolide
antibiotic). Eur Respir J 24, 3758.
210. De Vizia, B., Raia, V., and Spano, C. (2003). Effect of an 8 month treatment with
omega 3 fatty acids (EPA and DHA) in patients with cystic fibrosis. J Parenter Enter
Nutr 27, 52-57.
211. Kurlandsky, L. E., Bennick, M. R., and Webb, P. M. (1994). The absorption and
effect of dietary supplementation with omega 3 fatty acids on serum leukotriene B4 in
patients with cystic fibrosis. Pediatr Pulmonol 18, 211-217.
212. Tuxen-Mengedoht, M., and Koletzko, B. (1999). Fish oil therapy in cystic fibrosis a
randomized clinical trial. Clin Nutr 18, 107-111.
213. Lawrence, R., and Sorrell, T. (1993). Eicosapentaenoic acid in cystic fibrosis:
evidence of a pathogenic role for leukotriene B4. Lancet 342, 465-469.
214. Katz, D. P., Manner, T., Furst, P., and Askanazi, J. (1996). The use of an
intravenous fish oil emulsion enriched with omega-3 fatty acids in patients with cystic
fibrosis. Nutrition 12, 334-339.
215. Jumpsen, J. A., Brown, N. E., Thomson, A. B., Paul Man, S. F., Goh, Y. K., Ma, D.,
and Clandinin, M. T. (2006). Fatty acids in blood and intestine following
docosahexaenoic acid supplementation in adults with cystic fibrosis. J Cyst Fibros 5, 77-
84.
216. Thies, N. H. (1997). The effect of 12 months’ treatment with eicosapentaenoic acid
in five children with cystic fibrosis. J Paediatr Child Health 33, 349-351.


