Mechanisms of pentachlorophenol induced charge transport ...
140
Portland State University Portland State University PDXScholar PDXScholar Dissertations and Theses Dissertations and Theses 1996 Mechanisms of pentachlorophenol induced charge Mechanisms of pentachlorophenol induced charge transport in lipid membranes transport in lipid membranes William Charles Brown Portland State University Follow this and additional works at: https://pdxscholar.library.pdx.edu/open_access_etds Part of the Natural Resources Management and Policy Commons Let us know how access to this document benefits you. Recommended Citation Recommended Citation Brown, William Charles, "Mechanisms of pentachlorophenol induced charge transport in lipid membranes" (1996). Dissertations and Theses. Paper 1257. https://doi.org/10.15760/etd.1256 This Dissertation is brought to you for free and open access. It has been accepted for inclusion in Dissertations and Theses by an authorized administrator of PDXScholar. Please contact us if we can make this document more accessible: [email protected].
Transcript of Mechanisms of pentachlorophenol induced charge transport ...

Portland State University Portland State University
PDXScholar PDXScholar
Dissertations and Theses Dissertations and Theses
1996
Mechanisms of pentachlorophenol induced charge Mechanisms of pentachlorophenol induced charge
transport in lipid membranes transport in lipid membranes
William Charles Brown Portland State University
Follow this and additional works at: https://pdxscholar.library.pdx.edu/open_access_etds
Part of the Natural Resources Management and Policy Commons
Let us know how access to this document benefits you.
Recommended Citation Recommended Citation Brown, William Charles, "Mechanisms of pentachlorophenol induced charge transport in lipid membranes" (1996). Dissertations and Theses. Paper 1257. https://doi.org/10.15760/etd.1256
This Dissertation is brought to you for free and open access. It has been accepted for inclusion in Dissertations and Theses by an authorized administrator of PDXScholar. Please contact us if we can make this document more accessible: [email protected].

MECHANISMS OF PENTACHLOROPHENOLINDUCED CHARGE TRANSPORT IN
LIPID MEMBRANES
by
WILLIAM CHARLES BROWN
A dissertation submitted in partial fulfillment of therequirements for the degree of
DOCTOR OF PHILOSOPHYin
ENVIRONMENTAL SCIENCES AND RESOURCES: PHYSICS
Portland State University
1996

DISSERTATION APPROVAL
The abstract and dissertation of William Charles Brown for the Doctor of Philosophy in
Environmental Sciences and Resources: Physics was presented May 22, 1996 and accepted
by the dissertation committee and the doctoral program.
COMMITTEE APPROVALS:
Carl Wamser
, Chairman---
Lee CaspersonRepresentative of the Office of Graduate Studies
DOCTORAL PROGRAM APPROVAL:Larry I. awshaw, Director, Environmental
Sciences and Resources Ph.D. Program
***************************************************************************
ACCEPTED FOR PORTLAND STATE UNIVERSITY BY THE LIBRARY
by

ABSTRACT
An abstract of the dissertation of William Charles Brown for the Doctor of Philosophy
in Environmental Sciences and Resources: Physics presented May 22, 1996
Title: Mechanisms of Pentachlorophenol Induced Charge Transport in Lipid
Membranes
Pentachlorophenol (PCP) is one of the prominent environmental pollutant that
has penetrated into food chain and is present in humans. Health concerns have been
raised since daily intake of PCP by the US population is estimated to be 16-19 p.g.
PCP facilitates dissipation of electrochemical potential gradients of hydrogen
ions across energy transducing membranes, which are the energy sources for the
conversion of adenosine diphosphate into adenosine triphosphate. Closely linked to
these dissipative effects is the development of electrical conductivity in lipid
membranes, induced by the presence of PCP.
Three modes of PCP - induced membrane electrical conductivity were
theoretically analyzed and experimentally verifiable formulations of each models were
developed. Experimental studies using the charge - pulse method involved
characterization of the time dependent transmembrane voltage over a wide pH range,
from 1.8 to 9.5, for 30 p.M concentrations of PCP. Lipid membranes were prepared
from dioleoyl phosphatidylcholine.
It was shown that three PCP molecular species were determining the

transmembrane transfer of hydrogen ions: electrically neutral PCP molecules (HA),
negatively charged pentachlorophenolate ions (A") and negatively charged heterodimers
(AHA).
It was found that at pH> 9 the membrane electrical conductivity was
determined by the transmembrane movement of A ions, whenever pH <7 the
conductivity was determined by the AHA species. Two new membrane surface
reactions were proposed as supplementary mechanisms for the generation of AHA in
addition to the formation of AHA by the recombination of HA and A", HA + A ....
AHA. These new reactions are, (i) 2HA .... H+ + AHA, and (ii) H20 + 2A .... OH'
+ AHA. Reaction (i) provides formation of membrane permeable heterodimers
AHA at pH < < 5.5 and reaction (ii) at pH> > 5.5.
The maximum surface density of AHA" heterodimers was 0.09 pmol/cm2• The
rate constant of formation of AHA' by recombination, HA + A" .... AHA' was
estimated to be kf =2.6xl09 cm2 mol'l S·I and the dissociation rate constant for AHA
Further, it was possible to determine the rate constants of transmembrane
translocation for A' and AHA" ions to be ka=6.6xlO·5 S·l and kw=1200 S,I,
respectively.

ACKNOWLEDGEMENTS
This project has taken many years and there are three people who were
absolutely critical to a successful outcome.
Dr. Arnold Pickar set me on my journey and taught me all the fundamentals
whether it was how to make membranes or the nuances of all the classic papers that
are the foundation of this research. Together we constructed much of the equipment
that was and is the basis of this project. He always had time and a quiet patience
when I needed it.
Dr. Pavel Smejtek started me thinking about PCP. His many years of research
on PCP and his insight were the keystones making my studies possible. There was
always a suggestion and a new thought. There were many time this project seemed
hopelessly and endlessly stalled, then a little encouragement and a new view point
would move it forward.
The theoretical and mathematical difficulties surrounding this project never
seemed to end or, at times, have an answer. Dr. Makoto Takeo had a sharp eye and
a penetrating mind. We talked and, sometimes, argued strongly. But that is when
science is at its best. His rigor and his thoughts provided more than a few sharp
edges to cut the Gordian knots.
In the end, it matters most of all that those you love and cherish are still there
when all the years of long nights away from home have consumed themselves. To
my wife Carole, to my children, you can turn the light off, I'm back.
ii

TABLE OF CONTENTS
PAGE
ACKNOWLEDGEMENTS .ii
LIST OF FIGURES vi
LIST OF TABLES vii
I. INTRODUCTION
ENVIRONMENTAL SIGNIFICANCE OF PCP 1
MEMBRANE TOXICITY OF PCP AS ANUNCOUPLER OF OXIDATIVE PHOSPHORYLATION 3
Energy Transducing Organelles 3
Mitochondrion " ..3
Chloroplasts 7
Effect of Lipophilic Uncouplers inMitochondria 9
STUDIES OF PCP IN LIPID BILAYER MEMBRANES 10
Studies of Adsorption of PCP to LipidMembranes and Thermotropic Transitions 10
Studies of PCP - Induced ElectricalConductivity 11
MECHANISMS OF CHARGE TRANSPORT INDUCED INLIPID MEMBRANES BY UNCOUPLERS 13
The Lipophilic Ion Model.. 13
The Class - 1 Uncoupler ModeL 15
The Class - 2 Uncoupler ModeL 17
iii

PAGE
PRELIMINARY CONSIDERATIONS CONCERNING THECHARGE PULSE METHODOLOGy 20
THE PRINCIPAL RESULTS OF CLASS - 2 ANDCHARGE PULSE THEORY AS DETAILED INAPPENDIX C 21
II. MATERIALS AND METHODS 25
SOLUTIONS 25
LIPIDS 26
THE CHARGE PULSE EXPERIMENTAL METHOD 26
THE EXPERIMENTAL APPARATUS 27
MEASUREMENT ROUTINE 29
PRELIMINARY TEST RUNS WITH RC CIRCUITS 31
III. RESULTS 33
GENERAL COMMENTS 33
THE EXPERIMENTAL DATA 33
THEORETICAL ANALySIS 38
7\ AND ITS ASSOCIATED AMPLITUDE .40
7\ 40
13\ 46
GENERAL COMMENTS ON 72 AND 73 AND THEIRASSOCIATED AMPLITUDES .47
7 2 AND ITS ASSOCIATED AMPLITUDE 48
72••••. · ••••••••••••••••.•••.••••••••• · ••••••••. •· ••••••••••••••••••••••••48
iv

PAGE
{32 49
73 AND ITS ASSOCIATED AMPLITUDE 50
73•••••••..••••••••••••••••••••••••••••••••••••••••••••••••••••••••••••••••50
(33 51
74 At·H) ITS ASSOCIATED AMPLITUDE 52
EVALUATIONOFTHERATECONSTANTS 52
III. DISCUSSION 54
A GENERAL MODEL FOR PCP 54
DIFFICULTIES WITH THE SHORTER TIME CONSTANTS 67
COMPARISONS WITH THE RESULTS OF OTHERINVESTIGATORS 69
Previous Investigations , 69
New Advances 72
REFERENCES 74
APPENDICES
APPENDIX A 78
APPENDIX B 90
APPENDIX C 109
APPENDIX D 124
v

LIST OF FIGURES
FIGURE PAGE
1. Mitochondrial Membrane 4
2. PCP-Pentachlorophenol.. 12
3. Lipophilic Ion Model. 13
4. Class - 1 ModeL '" .15
5. Class - 2 ModeL 18
6. Experimental Setup 27
7. Lipophilic Ion and Class - 1 Model Fits to 71 .41
8. Class - 2 Model Fit to 71 45
9. Class - 2 Model fit to .81 .46
10. Class - 2 Model Fit to 72 .49
11. Class - 2 Model Fit to 73 51
12. Class - 2 Model and 71.!eSI Fits to 7 56
13. Dimer (AHA") Surface Density 64
14. Theoretical and Experimental Conductivities 71
VI

TABLE
LIST OF TABLES
PAGE
1. Charge Pulse Measurements of PCP - Modified
Membranes T\, 72, T3 36
2. Charge Pulse Measurements of PCP - Modified
Membranes T4 37
3. Rate Constants As Determined By
The Three Proposed Models 53
4. Influence of ~aha on T\ 57
5. Influence of k2ha on T\ ••••....•..••.•••••....•..•••..•••.....•....••.•••.•••••59
6. Conductivity Due To AHA (%) 60
7. Influence of k f and k.J on T\ and .6\ 61
vii

MECHANISMS OF PENTACHLOROPHENOL-INDUCED CHARGE
TRANSPORT IN LIPID MEMBRANES
1. INTRODUCTION
A. ENVIRONMENTAL SIGNIFICANCE OF PCP
PCP is an effective biocide (Rao, 1978). The environmental significance of
PCP became evident during the 1970's due to its wide spread use since the 1930's as
a major pesticide, disinfectant, and wood preservative (Butte et ai, 1985). PCP is a
common byproduct of bleaching processes used in the pulp and paper industries
(Paasivirta et ai, 1992) as well as an agricultural pesticide or intermediate in herbicide
production (Crosby, 1981). Most of the annual production of PCP, 80%, was used
in the wood industry as an anti-sap stain agent, in wood preservation and for remedial
treatment against fungi attack, or in the treatment of masonry (Crosby, 1981).
An important consideration with respect to the toxic effects of PCP is its
accumulation in ecosystems. Studies of the distribution of toxic chemicals between
biota and soil or water were based on their distribution between water and octanol
as the adsorbing medium because of octanol's similarity to the average properties of
1

biological tissues (Connell, 1988; Hawker and Connell, 1989). A high linear
correlation, for instance, is found between octano1 adsorption of over 50 organic
compounds as a function of their aqueous concentration and similar experiments
involving the lipid tissue of fish (Chiou, 1985). Some of those studies have included
PCP (Veith et al, 1979; Mackay, 1982).
For natural environments such as lake sediments and aquifer materials the
sorption of PCP is very dependent on the organic content of the sediment or aquifer
material. This is presumably linked to PCP's high octanol/water partition coefficient.
PCP has the highest octanollwater partition coefficient of all the chlorinated phenols
which is related to its lower pKa, about 4.75 (Schellenberg et al, 1984). At
physiologically and environmentally relevant pH values, it is the ionic form of PCP
that dominates in aqueous media.
Studies of human exposure to PCP in the U.S.A. suggest that virtually all of
that exposure is through the food chain (99.9%). As a result, through fruits,
vegetables and grains, PCP is ingested by humans at a rate of about 16 JJ.g/day
resulting in a residual of 17 JJ.g/kg of adipose (fat) tissue (Hattemer - Frey and Travis,
1989) with a half life of about 20 days (Uhl et al, 1986). Studies of human exposure
in other countries have confirmed similar conclusions (Geyer et al, 1987; Mussalo
Rauhamaa et al, 1989; Wild et al, 1992; Wild and Jones, 1992).
The physiological effects of PCP have been shown to range from acute --
2

anaesthesia, coma -- to chronic -- rashes, sinusitis and eye disease (IRAC, 1979).
PCP manufacture has been restricted in the United States, United Kingdom, and many
other countries as the result of public pressure to reduce exposure to organic
chemicals. However, due to its continued use and on-going presence in the
environment it continues to be present in humans. The PCP burden in humans today
is ::::: 550 ltg/person. Thus PCP continues to maintain a significant presence.
B. MEMBRANE TOXICITY OF PCP AS AN UNCOUPLER OF OXIDATIVE
PHOSPHORYLATION
1. Energy Transducing Organelles
a. Mitochondrion
PCP has been shown to be similar to other compounds whose
biological effect is associated with the uncoupling of phosphorylation from electron
transport with inhibition of respiration in mitochondrion (p. 5 below).
As Fig. 1 shows mitochondria are characterized by a mitochondrial matrix
surrounded by an inner membrane and an outer membrane with a region between the
two membranes called the intermembrane space. The intermembrane space connects
3

Mitochondrial Membrane
2H'
,....,I--~ 2H'
\ .......1--_'"- 2H'
2H' Co"
Figure 1
The mitochondrial membrane showing the complex reactions leading to the phosphorylation of ADP
beginning with the pumping of 2 protons from the inner membrane to the intermembrane space between the
inner and outer membranes. Eventually a pH difference of -1.4 units and an electrical potential of 140 mY,
implying a total electrochemical potential of 220 mV, is established which allows for the formation of ATP
from ADP by an ATP synthesizing complex, ATPase, as protons passively now back into th~ mitochondrial
complex.
4

to the cytoplasm of the host cell through pores in the outer membrane which allows
passage to molecules with molecular weights up to 5,000.
Unlike the porous outer membrane, the inner membrane is impermeable to
most ions and molecules and has a high ratio of proteins to phospholipids. Therefore,
while molecules and ions are relatively free to move between the host cell cytoplasm
and the inner membrane space, passage through the inner membrane is very restricted.
The restrictive permeability of the inner membrane chemically isolates the
mitochondrial matrix and allows the matrix to carry on its various biochemical
functions. Of particular significance to this proposal are molecular complexes
embedded in the inner membrane which allow protons to be pumped across the inner
membrane from the mitochondrial matrix as part of a larger process which results in
the phosphorylation of ADP (adenosine diphosphate) to form ATP (adenosine
triphosphate) .
As illustrated in Fig. 1, the pumping of protons from the mitochondrial matrix
through the inner membrane into the intermembrane space begins in the mitochondrial
matrix as NADH (nicotinamide adenine dinucleotide) and one proton interact with the
first of a series molecular complexes embedded in the inner membrane, NADH + H+
- NAD+ + 2H+ + 2e". The latter two protons are pumped across the inner
membrane into the intermembrane space. The two electrons are passed through a
5

series of molecular complexes embedded in the inner membrane and eventually
transferred back into the mitochondrial matrix and molecular oxygen: 1/2 0 2 + 2H+
+ 2e" - H20. During the sequential transfer of the two electrons by molecular
complexes embedded in the inner membrane four more protons are pumped across the
inner membrane into the intermembrane space.
The effect of pumping protons across the inner membrane is to decrease the
pH and increase the electrical potential of the intermembrane space relative to the
mitochondrial matrix. Also embedded in the inner membrane is an ATP-synthesizing
complex, ATPase, which provides a channel for protons to passively flow back into
the mitochondrial matrix. When a proton gradient is established by the pumping
action of respiration, protons migrate back into the matrix through the ATPase
channel. As a result of this migration process through ATPase channel, ADP is
phosphorylated into ATP.
To quantify the conversion of metabolic energy into ATP the electrochemical
potential of protons was used by Mitchell (Mitchell, 1961; Mitchell and Moyle, 1969).
It takes into account both the pH difference and electric potential difference across the
inner membrane:
6

(1)
where IIp. is the electrochemical potential difference across the inner membrane, Ill/;
and IlpH is the electric potential and pH difference, respectively, between the
intermembrane space and the mitochondrial matrix, R is the gas constant, T is the
absolute temperature, and F is the faraday. The above definition suggests the
pumping of protons into the intermembrane space from the mitochondrial matrix
causes the electric potential of the intermembrane space to be relatively higher and its
pH relatively lower compared to the mitochondrial matrix.
Typically, during respiration the difference in pH is -1.4 units and the electric
potential difference is 0.14 V. Eq. 1, then, implies an electrochemical potential of
about 0.22 volts or 5.2 kcal/mole of protons.
b. Chloroplasts
Photosynthesis in plants is involved in a similar chemiosmotic scheme
involving a proton gradient and ATP formation (Mitchell, 1966). Within a plant cell
photosynthesis takes place in chloroplasts. Chloroplasts are more complicated than
mitochondria and have three membranes instead of two separating them from the host
7

cell. The inner most membrane, called the thylakoid membrane, functions in a similar
manner as the inner membrane in mitochondrion. Inside the thylakoid membrane is
the thylakoid space and on the other side of the membrane the stroma. The thylakoid
membrane, like the inner membrane of mitochondrion, is relatively impermeable and
can likewise sustain a pH and electric potential difference.
In the case of plants, however, the initial energy is supplied by the absorption
of light. Embedded in the thylakoid membrane are chlorophyll complexes. The
absorption of light results in exciting a chlorophyll electron followed by a series of
step-wise electron transfer reactions resulting in the pumping of protons across the
thylakoid membrane and ultimately resulting in the formation of ATP.
The above process actually involves two forms of chlorophyll and two separate
light absorption events. Proton pumping across the thylakoid membrane results when
electrons are transferred from one light absorbing chlorophyll complex to the other
light absorbing chlorophyll complex.
An important difference, however, between the above photosynthetic coupling
of phosphorylation and the pumping of protons across the inner membrane to the
analogous process in mitochondrion is that the polarity of the electrochemical potential
is reversed. In the photosynthetic version of the chemiosmotic hypothesis protons are
pumped into the thylakoid space.
8

2. Effect of Lipophilic Uncouplers in Mitochondria
When weak lipophilic acids are introduced into the inner membrane space of
mitochondrion, the concentration gradient causes the acid to migrate across the inner
membrane. On the matrix side of the inner membrane the pH is higher and the
neutral acid readily gives up its proton while the resulting negatively charged ion is
driven back across the membrane to pick up another proton. This transport of protons
across the inner membrane into the matrix causes the collapse of the metabolically
generated electrochemical potential of protons (Mitchell and Moyle, 1967; VanDam,
1967) even if respiration continues. As a result, the synthesis of ATP is uncoupled
from the respiration process.
The toxicity of uncouplers lies in their ability to circumvent the formation of
ATP by providing an alternative protonic back flow. PCP, in particular, has been
shown to have biological effects specifically as a weak lipophilic acid uncoupler
(Weinbach and Garbus, 1965; Senger and Ruhl, 1980; Ravanel et al, 1985). At
micromolar concentrations PCP can stop ATP synthesis and the production of
chlorophyll (Senger and Ruhl, 1980).
9

C. STUDIES OF PCP IN LIPID BILAYER MEMBRANES
1. Studies of Adsorption of PCP to Lipid Membranes and Thermotropic
Transitions
A study of PCP has been conducted utilizing sonicated vesicles of the lecithin
membranes dimyristoylphosphatidylcholine (DMPC) and
dipaImitoylphosphatidylcholine (DPPC) by measuring their electrophoretic mobility.
In addition, the effect of PCP on the gel to fluid transition temperature of the
membranes' hydrocarbon chains using photometric methods was conducted (Smejtek
et ai, 1989). The main parameter monitored in this study was the membranes' f
potential, essentially the difference in electrostatic potential between the aqueous side
of the membranes' surface and the bulk aqueous phase suspending the lipid vesicles.
For both types of membranes the magnitude of the f-potentiaI increased step-wise
upon approaching the melting point of the hydrocarbon chains of the lipids as more
PCP was adsorbed in the fluid phase. Also the gel to fluid transition temperature
decreased with PCP concentration. It was concluded from the studies of adsorption
of PCP that PCP is adsorbed at the interface between the polar head and hydrocarbon
chain regions of the membrane.
A further study indicated the adsorption plane for PCP lie 0.4 - 0.6 nm below
10
the water/dielectric interface and that the dielectric constant of the adsorption plane
region was 8 - 10 (Smejtek and Wang, 1990).
Spectrophotometric studies of PCP adsorbed on PC membranes (Smejtek et al,
1987a) indicated that the pKa for PCP adsorbed to phosphatidylcholine (PC)
membranes is shifted from its aqueous value of 4.75 (Drahonovsky and Vacek, 1971)
to at least 5.5. Also the partition coefficient for neutral and ionized PCP was found
to be 1.5x10⁴ m and 3.0xlO-s m, respectively. The results of studies of adsorption
of ionized PCP are very compatible with the environmental studies involving the
absorption of PCP into fish tissue (Mackay, 1982) where the partition coefficient of
ionized PCP was found to be lO-s m. The similarity of results for PCP adsorption in
lipid membranes and in fish tissue supports the environmental relevance of biophysical
studies using artificial lipid membranes.
2. Studies of PCP - Induced Electrical Conductivity
PCP induces electrical conduction in lipid bilayer membranes (Smejtek et al,
1976; Pickar and Amos, 1976; Pickar and Hobbs, 1982) which is related to
transmembrane proton translocation in a manner similar to that described in the
previous section for weak lipophilic acid uncouplers (McLaughlin and Dilger, 1980).
Also involved in such conductance effects is the hydrogen bonding of membrane
11

bound PCP creating a dimer AHA- (Smejtek et aI, 1976; McLaughlin and Dilger,
1980~ Smejtek et aI, 1987b). AHA- is formed from HA and A where HA represents
the neutral PCP molecule and A- the pentachlorophenate. All three forms are
illustrated in Fig. 2.
PCP - Pentachlorophenol
CI
CI
CI
CI
CI
CI
CI
CI
CI
Figure 2
HA
CI
CI
CI
CI
OH
The pentHchlurophenHte (A), molecular (HA) and dimer (AHA) forms of PCP
12

D. MECHANISMS OF CHARGE TRANSPORT INDUCED IN LIPID
MEMBRANES BY UNCOUPLERS
1) The Lipophilic Ion Model
The simplest way to describe the translocation of A- across the membrane
interior is to first neglect both the formation of AHA-, and the interaction between HA
and A-. The kinetic scheme characterizing this lipophilic ion model is shown in Fig.
3 below.
Lipophilic Ion Model
A-
Aqueous
Solution
A
•A
•
Membrane
Figure 3
A
•
Aqueous
Solution
General lipophilic ion model for PCP
13

When an electric potential is imposed across the membrane the resulting
electric field induces ions to flow across the membrane interior. A net flux of ions
will continue to flow across the membrane interior in response to the electric field
until the concentration difference between ions adsorbed on one side of the membrane
compared to the other side causes an equal diffusive back flux of ions to flow in the
opposite direction.
As ions accumulate on one side of the membrane, a net flux of ions will also
flow from their adsorption plane on the membrane into the aqueous solution. On the
other side of the membrane, a deficiency of adsorbed ions will cause additional ions
to flow from the aqueous solution and resulting in their adsorption onto the
membrane. If the driving electric field is still significant, aqueous A" ions continue
to flow across the membrane interior.
The system of differential equations which describe the lipophilic model have
been solved (Benz et al, 1976). A complete mathematical analysis of the lipophilic
model is given in Appendix A.
The lipophilic model is a useful approximation for PCP at pH > > pKa• In
this region the surface density of HA is very low compared to the surface density of
A-. Under these conditions the reaction between HA and A- can be neglected and the
initial surface density of A- on both sides of the membrane can be considered to be
set by the aqueous concentration of PCP.
14

-----... A-
2. The Class - I Uncoupler Model
Fig. 4 illustrates the transport scheme for standard class - 1 uncouplers.
Class - I Model
JH1A •H+ I
i A-
Aqueous
Solution
. Membrane
Figure 4
General class - 1 model for PCP
Aqueous
Solution
The imposition of an electric potential across the membrane induces ions to transport
across the membrane interior in the same manner as described for the lipophilic
model. In the standard class - I uncoupler model, however, the movement of A- ions
between the aqueous solution and their adsorption on the lipid is neglected.
Unlike the lipophilic model the class - 1 uncoupler model includes the presence
of HA. Due to the transmembrane transport of A in response to an external electric
15
field, the reaction A- + H+ ~ HA creates an excess of HA on one side of the
membrane and a deficiency of HA on the other side. As a result of this concentration
difference, HA diffusively migrates across the membrane interior in a direction
opposite that of the accumulating ions. This back flux of HA dissipates the
concentration difference of A- ions caused by the external field and allows more A
ions to be transported across the membrane under the influence of the remaining
electric field.
The differential equations characterizing standard class - 1 uncoup1ers have
been described and solved (Mclaughlin and Dilger, 1980). In addition to the
movement of A- and HA across the membrane interior, the standard class - 1
uncoup1er model includes the reaction of H+ with A- on the surface of the membrane,
(2)
where kR (cm2 mole'\ S·I) and kRR (S'l) are the indicated rate constants.
Appendix B expands the standard mathematical analysis suggested by
McLaughlin and Dilger to include the hydroxyl ion, OR", and the reaction
16

(3 )
where kD (cm2 mole-l sol) and kDD (S-l) are the indicated rate constants.
It has been shown (Kasianowicz et al, 1987) that the removal of H+ from HA
can also be significantly induced by OR" and that the rate of H+ removal is very fast
and dependent only on the aqueous pH and the local PKa of HA and A-.
However, a complete mathematical theory of class - 1 uncouplers including
both the effects of H+ and OH- as characterized by Eqs. 2 and 3 has not previously
been published. Appendix B details such a complete theory involving the above
process.
3. The Class - 2 Uncoupler Model
The standard class - 2 uncoupler model also includes the formation of the
dimer, AHA, formed from HA and A. The resulting transport scheme, illustrated
in Fig. 5, is more complicated.
17

Aqueous
Solution
Class - 2 Model
Membrane
Figure 5
General class - 2 model for PCP
Aqueous
Solution
When an electric potential is imposed across the membrane, the class - 2
uncoupler responds in a manner analogous to a class - I uncoupler. The essential
difference is that in the standard class - 2 uncoupler kinetic scheme the dimer AHA
is the only membrane permeable species.
In order to solve the differential equations that characterize class - 2 uncouplers
it is assumed by most investigators (Smejtek et al, 1976; McLaughlin and Dilger,
1980; Kasianowicz et al, 1984; Kasianowicz et aI, 1987; Smejtek et aI, 1987b) that
the removal of H+ from HA is very fast compared to the transport of A-, AHA or HA
across the interior of the membrane. As a result, the ratio N/Nha on either side of
the membrane is considered a constant dependent only on the aqueous pH and the pK.
18

the membrane is considered a constant dependent only on the aqueous pH and the pK.
of the uncoupler adsorbed in the membrane. Therefore, the surface reaction between
HA and A- with H+ or OH- are not characterized by rate constants and are excluded
from the mathematical analysis. Only the reaction between A- and HA is considered
in the formation of the dimer, that is,
(4)
where kf (cm2 mole-I S·I) and k.I (S·I) are the indicated rate constants.
Appendix C expands the published mathematical theory of class - 2 uncouplers
to include not only the above reaction between A- and HA, Eq. 4, and the surface
reactions between H+ and OR with HA, Eqs. 2 and 3, but H+ and OR with AHA"
as given below,
H+ + AHA - .. 2HA
19
(5 )
E. PRELIMINARY CONSIDERATIONS CONCERNING THE CHARGE
PULSE METHODOLOGY
The theory of the charge pulse experimental method which is used exclusively
in this investigation has been described for lipophilic ions (Benz et al, 1976) and used
to investigate a number of lipophilic ions (Benz et al, 1976; Benz and Uuger, 1977;
Pickar and Benz, 1978). Appendix A also describes the theory of charge pulse
measurements.
The theory of the charge pulse experimental method for class - 1 uncouplers
has also been described Mclaughlin and Dilger (Mclaughlin and Dilger, 1980).
Using their analysis many class - 1 uncouplers have been investigated besides PCP
(Benz and Mclaughlin, 1983; Kasianowicz et al, 1984; Kasianowicz et al, 1987).
However, the theoretical development of the charge pulse experimental method
for class - 1 uncouplers has not included interactions between HA and A" with H+ and
OH", that is, the reactions suggested by Eqs. 2 and 3. Appendix B, therefore, also
expands the theory of the charge pulse experimental method for class - 1 uncouplers
to include both the reactions suggested by Eqs. 2 and 3.
There is no published theory for the charge pulse experimental method
applicable to class - 2 uncouplers. Therefore, Appendix C, additionally, develops the
mathematical theory for the charge pulse experimental method and includes all the
20

reactions of HA, A- and AHA- with H+ and OH-, plus the dimer forming reaction
between HA and A. In other words, the charge pulse theory developed in Appendix
C for class - 2 uncouplers includes all the reactions characterized by Eqs. 2 - 6.
F. THE PRINCIPAL RESULTS OF CLASS - 2 AND CHARGE PULSE
THEORY AS DETAILED IN APPENDIX C
Since PCP has been shown to be a class - 2 uncoupler and was also confirmed
as such by this investigation it will be useful to describe the principal results of the
mathematical analysis of Appendix C.
The differential equations of class - 2 theory involve the transport of HA, A"
and AHA- across the interior of the membrane each characterized by three interior rate
constants, kt,a, ka and kaha, respectively. Furthermore, before the charge is placed on
the membrane the above three adsorbed forms of PCP are characterized by surface
densities on each side of the membrane, in moles per cm2, namely, Nha0, Na°and
Nahao, respectively. Likewise, the surface densities of H+ and OH- within the reaction
layer on each side of the membrane are characterized by Nho and Noho, respectively.
In addition all the surface reactions suggested in Eqs. 2 - 6 are included, along
with their respective rate constants.
21

During the time course of charge pulse experiment, after the initial charge has
been placed on the membrane, the surface densities on either side of the membrane
will change, as A and AHA- move across the interior from one side of the membrane
to the other in response to the electric field now established across the membrane by
the charge pulse. As surface reactions, Eqs. 2 - 6, on either side of the membrane
become significant a difference in pH between one side of the membrane and the other
could also develop.
If YhA, Y8' Yaha , Yh and Y011 represent the difference in surface densities on one
side of the membrane compared to the other, then, class - 2 theory, as developed in
Appendix C, implies that in matrix notation,
dYhadt
dYa Yha 0dt Ya 2kaN~
dYaha =A Yaha - UO 2kahaN~a (7 )CIt
dYhYh 0
dt Yoh 0
dYohCit
where t is time, UO = yOF/RT, yO = the voltage at t = 0 across the membrane due
to the initial charge placed on the membrane, F is Faraday's constant, R is the gas
22

constant and T is the temperature in Kelvin.
The term A in Eq. 7 is a 5x5 matrix with the following columns, 1 through
5, respectively,
- 2kha - k RR - koN~h - k~~ - k2haN~a
kIll~ + k DD - k~~a
kcll~a + 2khahaN~
kIll~ + 2kbahaN~hA
-koN~a
k RR + koN~b - k~~
-2k.. - k~~a - kIll~ - k DD - k rahaN2 - bkaN~
k d + 2kpotl'l~h - bk..N~
- kIll2 + bkaN~
koN~a + 2kpotl'l~ha - bkaN~
k ~~ + k2hdN~..
k~ga + krahaN~ - bkahaN~ha
- 2kaha - k d - khahaN~ - kpotl'l~b - bkahaN~ha
- kbabaN~ba + kahaN~ha
- kpotl'l~ha - bkahaN~ha
23
(8)
(9)
(10)
kRJ!l~ + k2haN~a
- k~h
- khlJ/uJ.N~
-k~~ - khahaN~a
o
- krJ'l~h
k DD + krahaN:
- kpoJ!l~h
o
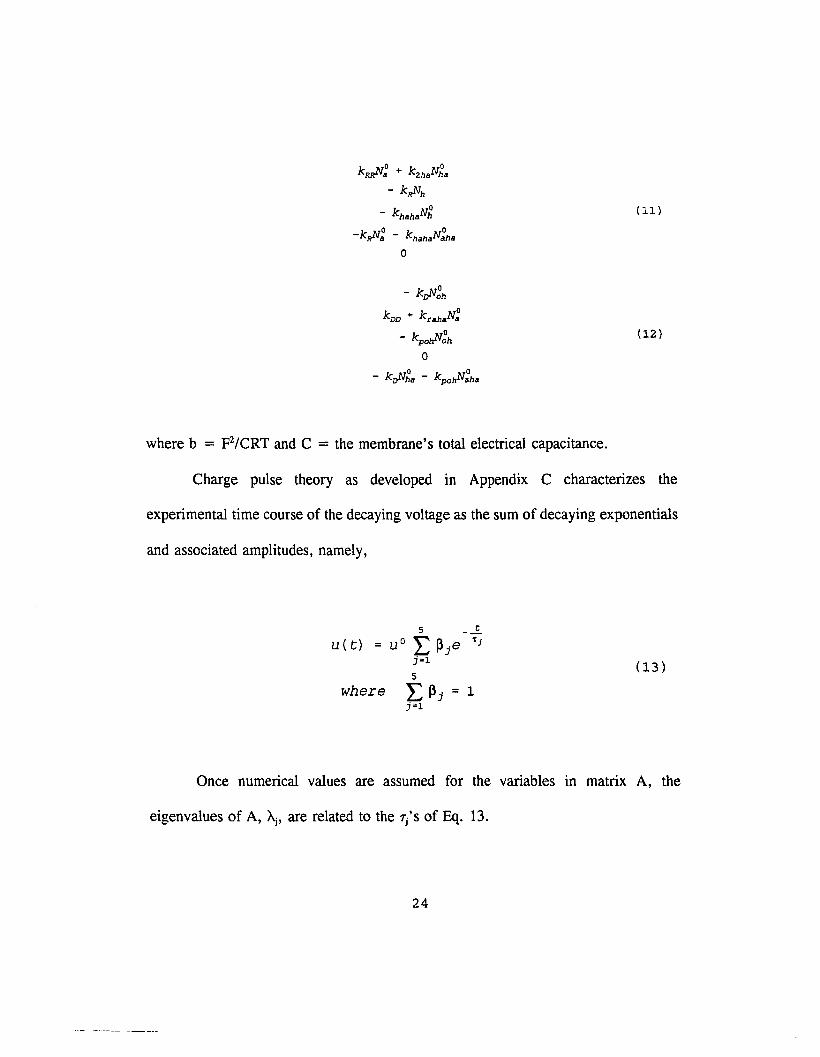
where b = F2/CRT and C = the membrane's total electrical capacitance.
(11)
(12)
Charge pulse theory as developed in Appendix C characterizes the
experimental time course of the decaying voltage as the sum of decaying exponentials
and associated amplitudes, namely,
5 -...E.u (t) = UO I: ~je
1}
j=l (13)5
where I: Pj = 1j=l
Once numerical values are assumed for the variables in matrix A, the
eigenvalues of A, ~, are related to the T/S of Eq. 13.
24

(14)
The associated amplitudes, the f3/s of Eq. 13, are derived from the respective
eigenvectors of matrix A associated with each >,. The detailed relationship is
described at the end of Appendix C.
II. MATERIALS AND METHODS
A. SOLUTIONS
The solutions were buffered aqueous solutions of 30 J.l.M PCP brought to 0.1
M ionic strength with KCl.
Stock solutions of3 mM PCP (99%, Aldrich Chemical Company, Milwaukee,
WI) were prepared in 0.02 M KOH. Stock solutions of buffered 1.0 M KCI were
prepared with B-1 buffer, 0.2M/0.2M/0.05M potassium phosphate/potassium
citrate/boric acid, respectively.
Experimental solutions were then made by mixing the buffered stock KCI
solutions and stock PCP solutions, diluting them with de-ionized water (Millipore Q2
system, Millipore Corp., Bedford, MA) in ratios of 10: 1 and 100: 1, respectively.
Concentrated HCI and KOH were used to bring the final solutions to the desired pH.
25

B. LIPIDS
Lipid solutions of L-Q!-dioleoyl lecithin (1 ,2-dioleoyl-sn-glycerol-3-
phosphocholine) 20 mg lipid/ml chloroform, were obtained from Avanti (Avanti
Polar-Lipids, Alabaster, AL). The chloroform was evaporated and the lipid was
redissolved in n-decane (Aldrich Gold 99+%, Aldrich Chemical Company,
Milwaukee, WI) in equal volume to the chloroform evaporated.
C. THE CHARGE PULSE EXPERIMENTAL METHOD
In the charge pulse experimental method a membrane immersed in an aqueous
solution has an electrical charge placed on it and then is immediately isolated
electrically from its surroundings. The voltage across the membrane, resulting from
the initial electrical charge, is monitored through a very high impedance circuit and
the time course of its decay constitutes the experimental data upon which charge pulse
measurement theory is based. Generally, two electrodes are immersed in the aqueous
solution on either side of the membrane to both apply the initial electrical charge and
to monitor the subsequent decaying voltage.
The experimental setup for this series of experiments is illustrated below in
Fig. 6.
26

EXPERIMENTAL SETUP
High ImpedanceAmplifier
5VAl:lueousSOlution
Figure 6
Experimental setup: Square pulse, 20 V pop, closed FET allowing 5 V across membrane for 50 us
charging the membrane to =::: 10 mY; the high impedance amplifier input resistance was 10 GO with
amplification of 20.
C. THE EXPERIMENTAL APPARATUS
The membrane was formed across a hole, about 1 mm in diameter, in a teflon
cup separating the two saline solutions. By means of a syringe the lipid was drawn
into a 0.1 x 100 mm capillary tube. One end of the tube was then placed near the
hole and the syringe used again to blow lipid into the hole where the membrane
formed. Cylindrical silver - silver chloride electrodes (6 mm diameter, 2 mm length,
27

Annex Instruments, Santa Ana, CA) were used to both place the initial charge on the
membrane and monitor the resulting voltage decay. The charging procedure began
when a square pulse of 50 ns and an amplitude of 20 V was generated by a 5010
Tektronix Programmable Function Generator. The pulse was directed to the gate of
a FET switch (Signetics 2N4392) causing it to close and allow 5 V DC on the FET's
drain to appear across the cell - membrane system for the duration of the square pulse
(50 ns), after which the FET again opened to once more isolate both the function
generator and the 5 V DC from the membrane and the rest of the circuit through an
open resistance of 5x10¹⁰ O. This generally resulted in a potential across the
membrane of about 10 mV before the membrane was electrically isolated. The
electrodes then follow the time course of the subsequent voltage decay across the
membrane which is recorded by a Nicolet 4094 Digital Oscilloscope.
Before the 50 ns current pulse was introduced the membrane was monitored
using a 100 mV peak to peak, 1 kHz AC voltage generated by a Hewlett Packard
4284A Precision LCR Meter. The measurement routine began after the membrane
had stabilized and reached a capacitance of approximately 400 nF/cm2• At this
capacitance the dissolving decane had presumably been completely drained from
between the membrane surfaces.
The membrane was isolated from the Oscilloscope by a high impedance
operational amplifier with an input impedance of 1012 0 (Burr-Brown OPA102BM)
28

which also amplified the signal by a factor of 20.
Theoretically, the time resolution of the charge pulse method is limited only
by the external circuitry measuring the decaying voltage across the membrane. The
Nicolet 4094 Digital Oscilloscope had a minimum limit of 0.5 p.s per point and thus
the lower time limit was a few p.s.
The upper time resolution of the charge pulse experiment is limited by the
input impedance of the high impedance amplifier isolating the membrane after it has
been charged. In these experiments the input resistance of the isolating impedance
was 1012 n which when combined with a membrane capacitance of about 10 nF
implied a RC time of 104 s, well beyond any of the observed results.
D. MEASUREMENT ROUTINE
After the membrane was formed it was allowed to stabilize, generally, around
400 Nf/cm2 which, given the area of the membrane, was 6 - 8 Nf as monitored by the
LCR Meter.
The entire measurement routine was under the control of a DEC PDP 11/03
computer which removed the LCR Meter from the circuit after it was determined by
the experimenter that the membrane had stabilized charge pulse measurements could
begin using the experimental configuration shown in Fig. 6. At this point, therefore,
29
the membrane was electrically isolated through the high impedance operational
amplifier.
A 50 ns pulse from the function generator momentarily closed the FET switch
so that the membrane could be charged. Immediately after the pulse passed the switch
opened isolating the membrane, once more, through the operational amplifier. The
monitoring of the time course of the membrane's voltage decay was begun before the
50 ns pulse was allowed to activate the FET switch so that a zero voltage base line
could be established.
For each membrane two records were made. One record was made with the
Nicolet set for a time resolution of I ms per point (total sweep time 16 seconds) or
lower if a sufficiently long time constant was not observed. This record was taken
to measure the slow processes. A second record was then made at the shortest time
resolution the Nicolet oscilloscope was capable of making, 0.5 p.s per point (total
sweep time 8 ms). This record was taken to measure the fast processes.
Analysis of the digitized data was carried out by a DEC PDP 11/23 computer
using a program based on a sequential deconvolution of the transient signal. The
program used a semi-log graph of transmembrane voltage vs. time to display the data.
This allowed the computer to generate a least squares fit to the voltage trace in order
to determine the relevant time constant and its associated amplitude. Once the longest
30

time constant and its amplitude was determined, it was subtracted from voltage trace
and shorter time constants and amplitudes determined in a similar fashion. This
method of successively peeling away time constants and their amplitudes was useful
and accurate to the extent that the time constants were exponential and sufficiently
separated. To facilitate this analysis the program was capable of expanding any part
of the voltage record and, if necessary, even resolving individual data points.
E. PRELIMINARY TEST RUNS WITH RC CIRCUITS
Preliminary test runs were made using the above routine to insure the
apparatus had sufficient resolution. Membranes were simulated utilizing three parallel
RC circuits each consisting of resistor and capacitor in parallel. All three parallel
circuits were linked in series with each other, so they would generate three time
constants. An additional single resistor was put in series to simulate the aqueous
solution.
The overall capacitance of the circuit was adjusted to 10 nF and its overall
resistance adjusted to 100 kO which was approximately the bulk capacitance and
resistance of the membranes to be considered under the assumed experimental
conditions.
31

It was found that the above apparatus could accurately discriminate time
constants of a few p.s even if their amplitudes were only a few percent of the whole.
Also, time constants differing by a factor of 2 could be accurately determined even
if their amplitudes also only differed by the same factor.
32

III. RESULTS
A. GENERAL COMMENTS
Charge pulse measurements were taken over a wide range of pH values, from
pH 1.8 to 9.5 to be compared to the theoretical analyses developed in Appendices A,
Band C.
In each case at least three time constants were observed. At pH 5.0 and 5.5
four time constants were observed. Except for the shorter observed time constants,
T3 and T4' the least squares fit to the data for each membrane showed little error. The
goodness of the fit was better than 1% for the longest time constant, T1' and better
than 3% for the next longest time constant, T2' For the shorter time constants the
fitting error with respect to each membrane was larger, typically 10% - 20%.
B. THE EXPERIMENTAL DATA
Table 1 below summarizes the results for the three time constants observed at
all pH values. Table 2 summarizes the results for the fourth time constant observed
at pH 5.0, 5.5 and 6.0. The data in both tables is an average of 3 - 5 membranes.
33

Charge Pulse Measurements of PCP-Modified Lipid Membranes 7\, 72' 73
pH 7\ (3\ 72 (ms) (32 73 (33
(s) (p.s)
1.8 1.94 0.890 31.5 0.0996 366 0.0107
± 0.81 ±0.O42 ±16.3 ±0.0423 ±52.9 ±0.0020
2.9 1.74 0.866 27.8 0.120 432 0.0139
±0.36 ±0.019 . ±13.6 ±0.021 ±11O +0.0020
3.7 0.398 0.862 65.8 0.126 437 0.0123
±0.179 ±0.078 ±20.8 ±0.070 ±116 ±0.0083
4.5 0.113 0.869 35.4 0.131 None Observed
±0.OO7 ±0.039 ±2.9 ±0.039
5.0 0.0693 0.716 16.1 0.245 535 0.0260
±0.OO90 ±0.075 ±5.4 ±0.081 ±91 ±0.0151
5.5 0.0478 0.721 19.1 0.197 526 0.0164
±0.OO63 ±0.065 ±1.3 ±0.064 ±32 ±0.008
34
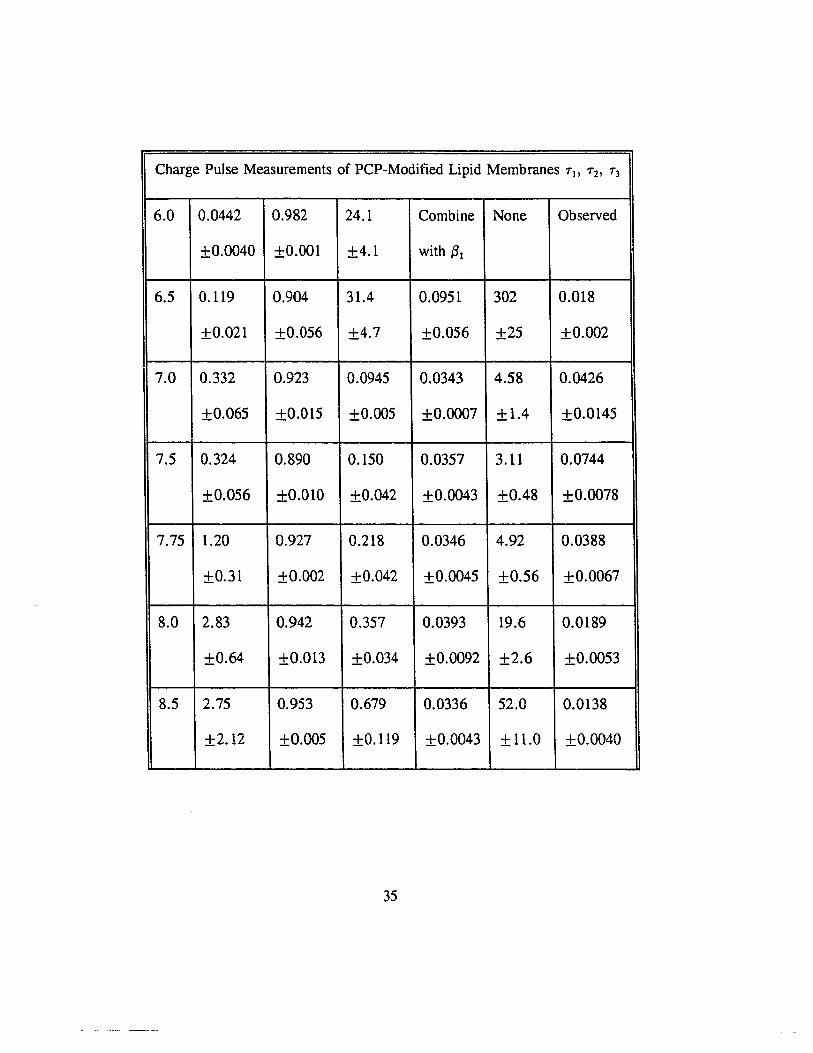
Charge Pulse Measurements of PCP-Modified Lipid Membranes TI. T2. T3
6.0 0.0442 0.982 24.1 Combine None Observed
±0.OO40 ±O.OOl ±4.1 with {31
6.5 0.119 0.904 31.4 0.0951 302 0.018
±0.021 ±0.056 ±4.7 ±0.056 ±25 ±0.OO2
7.0 0.332 0.923 0.0945 0.0343 4.58 0.0426
±0.065 ±0.015 ±0.OO5 ±0.OOO7 ±1.4 ±0.0145
7.5 0.324 0.890 0.150 0.0357 3.11 0.0744
±0.056 ±0.01O ±0.042 ±0.OO43 ±0.48 ±0.OO78
7.75 1.20 0.927 0.218 0.0346 4.92 0.0388
±0.31 ±0.002 ±0.042 ±0.0045 ±0.56 ±0.0067
8.0 2.83 0.942 0.357 0.0393 19.6 0.0189
±0.64 ±0.013 ±0.034 ±0.OO92 ±2.6 ±0.0053
8.5 2.75 0.953 0.679 0.0336 52.0 0.0138
±2.12 ±0.OO5 ±0.119 ±0.OO43 ±11.0 ±0.0040
35

Charge Pulse Measurements of PCP-Modified Lipid Membranes TI. T2. T3
9.0 5.29 0.955 0.916 0.0318 81.6 0.0127
±2.30 ±0.OO7 ±0.153 ±0.OO41 ±10.8 ±0.OO40
9.5 7.18 0.945 13.8 0.0327 691 0.0217
±2.2 ±0.015 ±3.4 ±0.0125 ±266 ±0.OO82
Table 1
36

Charge Pulse
Measurements of PCP-
Modified Lipid
Membranes
T4
pH T4 {34
(p.s)
5.0 38.5 0.0166
±25.6 ±0.OO8
5.5 12.3 0.0461
±3.8 ±0.0239
6.0 32.1 0.0271
±14.3 ±0.OO5
Table 2
Experimental conditions both tables: 30 I'M PCP, 0.1 M KCI, phosphate/citrate/borate buffer
(0.02/0.02/0.005 M), 25° C.
37
C. THEORETICAL ANALYSIS
The results summarized in Table I were evaluated with respect to the charge
pulse methodology in terms of the three models described in Appendices A, B, and
C: the lipophilic ion model, the class - I uncoupler model, the class - 2 uncoupler
model.
For each of the three models, theoretical curves for the time constants and
associated amplitudes as a function of pH were constructed by assuming values of
each of the relevant rate constants and surface densities in matrix A of Eq. 7. This
allowed determination of the eigenvalues and eigenvectors associated with matrix A
upon which theoretical curves could be constructed as detailed in Appendices A, B
and C. These curves were then compared to the experimental data in Table 1.
As shown in the Appendices not all the rate constants and surface densities of
matrix A were considered independent. Boundary conditions allowed kRR, koo and
Naha° to be dependent variables. Boundary conditions also implied that No = total
amount of PCP adsorbed onto the membrane = 2Nao + 4Naha
0 + 2Nha0 is a constant,
resulting from the assumption that no PCP passes into the aqueous solution or is
adsorbed from the aqueous solution during the time course of the experiment. The
value of No was taken from the partition coefficient for PCP measured by Smejtek et
38

al (Smejtek et al, 1976) and assumed to be 100 pmol/cm2•
In a separate investigation Smejtek et al (Smejtek et al, 1987a) also determined
the pKa of PCP on the adsorbed surface of the membrane to be 5.5, the value also
adopted here. The pKa allowed the determination of the ratio Nao/Nhao as a function
of pH. The ratio Nuo/Nhao along with a value for No and Naha°as a function of Naoand
Nhao, allowed Nao to be calculated as a function of pH and the various rate constants.
Appendix C contains all the relevant details of these calculations.
In addition, Smejtek et al (Smejtek et al, 1987a) determined the depth at which
the adsorption of PCP took place was between 0.4 and 0.6 nm. It was assumed that
the effective thickness of the reaction layer was equal to the adsorption depth of PCP
in the membrane which was set at 0.5 nm. This made it possible to determine the
surface densities for both the H+ and OH- ions on the membrane surface as a function
of pH.
As a result, boundary conditions made it possible to evaluate all the surface
densities and two of the rate constants (lG~R and koo) in matrix A before the curve
fitting routine was begun.
Theoretically, then, the remaining eleven rate constants could be determined
from the 5 experimentally observable time constants and their associated 5 amplitudes
that Appendix C implies should be present if also included is the boundary condition
39
on the amplitudes that I;j (3j = I, j = I - 5, Appendix C, Eq. C32.
Experimentally the eleven rate constants above were varied until the best least
squares fit was obtained for all the observed time constants and amplitudes. As
Tables I and 2 illustrate not all the theoretically presumed time constants and
amplitudes were observed, a problem which will be discussed in the Discussion
section.
Each of the three observed time constants shall now be examined in tum.
C. 7 1 AND ITS ASSOCIATED AMPLITUDE
As Fig. 7 demonstrates, neither of the 7 1'S suggested by the lipophilic ion or
class - I models yielded a reasonable fit to the observed values of 71' .
40

Lipophilic Ion and Class - 1 Model Fits to 'tl
Class· 1 Model
----.... .......
~
2 3 4 5 6 7 8 9 10 11 12 13
pH
lOS
104
103
3102
'"EE= 10\
100
10-\ ~
10-2
Lipophilic Ion Model
I I
• •a ••
'II I .I.
II
Figure 7
Theoretical curves for the class· I and lipophilic ion models as a function of pH compared to the
experimental values of 7]
The theoretical lipophilic long time constant associated with the movement of
A- across the interior of the membrane due to the initial external voltage placed across
the membrane can be expressed, Eq. A44, Appendix A,
41
(15)
where b = F2j(CRT). F is Faraday's Constant, R is the gas constant, T is the
temperature in Kelvin and C is the bulk electrical capacitance per unit area of the
membrane which normalizes the given rate constant with respect to the membrane's
bulk electrical capacitance and surface area.
The lipophilic movement of A across the interior because of the externally
applied voltage is limited by the back diffusion of A" in the reverse direction due to
the increasing concentration difference.
Due to the back diffusion of A" or a low adsorbed initial concentration of A"
such lipophilic movement may be insufficient to equilibrate the external voltage. In
this case, a net flow of A- across the membrane interior can be supported if A- is
removed from the high concentration side and supplied to the low concentration side.
In the lipophilic case A" is supplied from and diffuses into the aqueous solution.
In the case of class - I uncouplers, the removal of excess A- is accomplished
by the formation of HA from A". HA back diffuses across the membrane and the
breakup of HA to supply A" to the low A- concentration side.
For the class - I model 7 1, then, becomes the serial or sequential sum of four
times, hereafter called flux times: the time required for A- to move across the
interior, for HA to form from A, for HA to diffuse back across the membrane
42

interior and for A- to form from HA.
formation/dissociation of HA.
Eqs. 3 - 4 characterize the
If the characteristic nux time for the formation/ dissociation of HA is
considered very short compared to the movement of A- and HA across the membrane
interior, Tl becomes
~ classl =1 + 1 (16)
where bNu normalizes the given rate constant with respect to the membrane's bulk
capacitance and surface area.
At pH values greater than the point in Fig. 7 where the two models diverge
(::= pH 4), given the experimental conditions, both Eqs. 15 and 16 are dominated by
bkaNaU. Eventually, however, as Nau decreases and Nhao increases with decreasing pH,
the first term 2kJ begins to dominate Eq. 15 while the second term, bkru,Nha°, begins
to dominate Eq. 16. Thus their eventual divergence.
43

The class - 2 model also includes the dimer AHA". Thus, the flux times
involve, sequentially, the heterodimer's formation, its movement across the
membrane's interior, the dimer's dissociation into A- and HA and diffusion of HA
back across the interior. All the Eqs. 3 - 8 are, therefore, involved.
The class - 2 theoretical curve shown in Fig. 8 below clearly fits the
experimental better than those of Fig. 7.
The results showed that throughout the pH range an increase in ~ decreased
T( while an increase in kd had the opposite affect on TI' Both k,. or k.-aha inversely
affected Tl above the pKa, with the effects of l<raha restricted to pH values greater than
8. Below the pKa the inverse effect of k2ha was very strong.
In analyzing all the rate constants both here and below for significance, each
was varied by a factor of 2 and then 1/2 to judge the effect on the parameter in
question.
44

Class - 2 Model Fit to 11
101
4
3 ,2 • .-
I~ 10°
.L
'"..,E
E= 43
2
10-1
2 3 4 5 6 7 8 9 10 11 12 13
pH
Figure 8
Theoretical T 1 curve for the class - 2 model as a function of pH compared to the observed values of 7 1
45

2. (31
In Fig. 9 below the class - 2 theoretical curve for the amplitude, (3\, is
compared to the experimental values.
Class - 2 Model Fit to ~1
100
OJ"0
.~c..E<
2 3 4 5 6 7 8 9 10 11 12 13
pH
Figure 9
Theoretical (3, curv~ lor thtl class - 2 Illodel as a function of pH compared to the observed values of (31
46

Particularly signiticant is the sharp decrease in amplitude around the pK. of
PCP where the concentration of AHA" is at a maximum. The decrease in amplitude
is dependent almost exclusively on kr and kd• The theoretical amplitude at 5.5 is
lowered from 0.73 to 0.40 when kf is doubled and ko is halved. When kf is halved
and ko is doubled the theoretical amplitude at 5.5 is increased to 0.92. These changes
correspond to changes in the dimer surface density suggesting that changes in Nw0
have a dramatic and inverse affect on the amplitude near the pK•.
The theoretical decrease in {3\, described above when kf was doubled and k.J
halved, was taken up by a time constant in the range of lo-t s which depended almost
exclusively on k.ma.
At pH 6.0 the difference between 1'1 and 1'2 and their respective amplitudes
(presumably == 0.8 and 0.2, respectively) made it difficult to experimentally separate
the amplitudes with sufficient accuracy. Therefore, as noted, the amplitudes were
combined and the data point at pH 6.0 excluded from Fig. 9.
D. GENERAL COMMENTS ON 1'2 AND 73 AND THEIR ASSOCIATED
AMPLITUDES
Difficulties arose with respect to 1'2 and 1'3 above the pK. of PCP. None of the
47

theoretical time constants derived from the matrix matched quantitatively or
qualitatively their respective associated data in Table 1. Since the theoretical
amplitudes of Tz and T3 were very small away from the pK. of PCP compared to their
experimental counterparts, the theoretical amplitudes were of marginal use in
identifying relevant time constants.
Although the theoretical time constants below the PK. of PCP could be made
to agree with their respective experimental time constants, in the case of TZ (pH <
pKJ the associated amplitude was too small by many orders of magnitude.
E. Tz AND ITS ASSOCIATED AMPLITUDE
1. Tz
The data for Tz seems widely separated above and below pH 7.0, as Fig. 10
clearly shows. The theoretical curve shown in Fig. 10 was dependent on ko. The
value of ko was adjusted to give the best fit to Tz below pH 7.
No theoretical adjustment could explain the dependence of Tz on pH ~ 7.0 or
the sudden increase in amplitude below pH 7.0.
48

Class - 2 Model Fit to "(2
104
103
:[ 102
"E101 -i=
100
10-1
1 1 .. I
I*I
II..-:I:
.. .1
2 3 4 5 6 7 8 9 10 11 12 13
pH
Figure 10
Theoretical T2 curve for the class - 2 Illudel as a function of pH compared to the observed values of T2•
The:: the::ure::tical curve was based on T2-1 = kDNba°.
2. {32
The amplitude for the theoretical curve in Fig. 10 was of the order of 10-10
below the pKa • Therefore, no graph of f3 2 is shown.
49

F. "3 AND ITS ASSOCIATED AMPLITUDE
As indicated in Table I in two cases, pH 6.0 and 4.5, no time constants were
observed in the presumed range of a few hundred J.1.s. Given the small amplitudes of
all the "3 measurements, such missing data points might be expected.
Like "2 there is a similar discontinuity in "3 above and below pH 7.0. The
discontinuity is similar in that at and above pH 7.0 the pH dependence of "3 is very
strong, while below pH 7.0 "3 is comparatively constant.
The theoretical curve in Fig. 11 below depended essentially on ~a'
50

Class - 2 Model Fit to 't3
2 3 4 5 6 7 8 9 10 11 12 13
pH
103
4 •
3
2
£ 102
<>E 4
E::: 3
2
101
43
2
T T .. J[.. -.-T.--'l'.L'---'.Lr-~
Figure 11
I
Theoretical 73 curve fur the da'is - 2 mudel as a function of pH compared to the observed values of 7 3,
2. {33
The amplitudes for the theoretical curve in Fig. 11 ranged from 6xl<J4 at pH
9.5, 0.27 at pH 5.5 and 5xlO-3 at 1.8. Although they matched the observed
amplitudes in a few instances, given their wide range little significance could be given
to them. Therefore, no plot is shown.
51

G. 74 AND ITS ASSOCIATED AMPLITUDE
Although a fourth time constant was observed around the pI<" no theoretical
counterpart was found. The significance of 74 and {34 was not clear.
H. EVALUATION OF THE RATE CONSTANTS
Not all the rate constants were sensitive to the curve fitting routines described
above. In particular, kmha and kpoh could only be found in their upper limit where they
both degraded the theoretical fit for 7 1, In a similar way the theoretical curves were
insensitive to ~a, except in this case only a lower limit could be found.
The curve fitting routine for 71 was particularly sensitive to k", k,.aha' k2ha, kr
and k.I. To a lesser extent, but still significant, a reasonable evaluation of the
parameters kR and kaha could be made, the latter also affecting the theoretical curve for
73 dramatically. The rate constant kD was entirely determined from its effect on the
theoretical curve for 72 below the pKa •
The rate constants, as evaluated by the lipophilic, class - 1 and class - 2
models are given below in Table 3.
52

Rate Constants As Determined By The Three Proposed Models
Lipophilic ion model
ka
1.93xl0··
Class - I model
ka kha kD kDD kR kRR
1.93xl0·s 2.76xI0· ==2xl0" ==200 ==4xl012 ==6xl0'
Class - 2 model
ka kha kD kDD kR kRR
6.65xlO·s > 200 2.43xlOl' ==2xlO·8 ==6xlO '2 ==4xlO's
kaha khaha k2ha kpoh kraha kf kd
1.24xlOJ < 1010 8.80xlO6 < 1014 8.00xlOs 2.58x10⁹ 71.9
TABLE 3
Estimated values of the rate constants providing the best least squares fit to the observed data as
illustrated in Figs. 8 - 11
53

III. DISCUSSION
A. GENERAL MODEL FOR PCP TRANSPORT
The results for T( are particularly significant because the mechanisms involving
TI experimentally carry over 70% of the membrane's conductivity due to PCP and
exceeds 85 % of the conductivity only one pH unit in either direction away from the
pKa• Therefore, understanding those mechanisms is of primary concern.
From the theoretical curves of the three proposed models, Figs. 7 and 8,
clearly the class - 2 model is the most viable description.
A further insight can be gathered by considering the flux times implied by the
class - 2 model, namely, the flux times involved in the formation of the dimer, its
transport across the membrane interior, its dissociation and, finally, the transport of
HA back across the membrane.
The formation of the dimer involves three rate constants, kr, k2ha and ~, Eqs.
4 - 6. All three processes act in parallel and therefore their characteristic times add
reciprocally,
(17)
54

In a similar way the dissociation of the dimer involves 1<0, khaha and kvoh and
should likewise be added reciprocally. However, only k.J is given below since only
upper limits could be established for the other two rate constants, suggesting they have
little effect on rl'
-1 bk a1: dissociacion = flaha
The flux time across the interior of the membrane becomes simply
-1 bk a1: incerior = ahaNaha
(18)
(19)
The flux time for the back flow of HA, involving the kw. process in a fashion
similar to the kal1a process, is neglected since the results showed that changing kw. did
not affect 7"1 significantly.
Therefore, combining Eqs. 17 - 19, a rough esti mate of the characteristic time
for class - 2 movement of the dimer becomes,
1: class2-AHA = 1: fo.r:macion + 1: incerior + 1:dissociacion
ss
(20 )
---- --------------------------------------
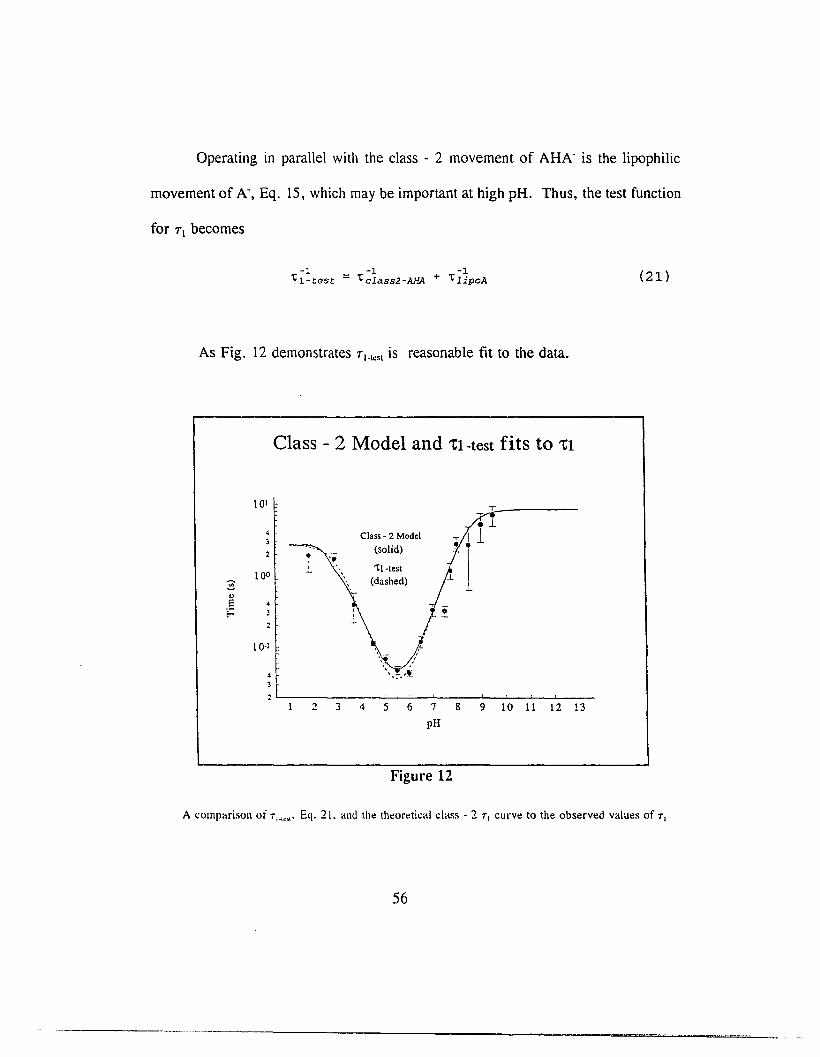
Operating in parallel with the class - 2 movement of AHA is the lipophilic
movement of A", Eq. 15, which may be important at high pH. Thus, the test function
for Tl becomes
-1 -1 -1't 1 -test = 'tclass2-AHA + 'tlipOA
As Fig. 12 demonstrates TI.tesl is reasonable fit to the data.
Class - 2 Model and 'tl-test fits to 'tl
101
Class" 2 Model
• (solid)"
100 -'- 'tl·test
3 (dashed).,E
E=
10.1 ,
2 3 4 5 6 7 8 9 10 11 12 13
pH
Figure 12
(21 )
A comparison of T;."". Eq. 21. and th~ th~or~tical class· 2 T 1 curv~ to the observed values of T 1
56

At pH 9 Tclm2-AfiJ\ and TlipuA are comparable, 15 s and 12 s, respectively.
Above pH 9 TlipOA dominates and below pH 9 Tclass2-AHA dominates.
This implies that above pH 9, PCP acts very much like a lipophilic ion with
A. dominating the conduction. Below pH 9, the class - 2 movement of AHA. starts
to dominate the conduction as the concentration of dimer begins to increase.
It was noted above that the ~aha process also influences 71 at high pH. Table
4 below illustrates ~aha' S effect with the third column of Table 4 being the value of
k,.aha implied by the theoretical curve of Fig. 8.
Influence of kooa on 71
pH 2kraha ~ahj2 k,.aha.
6.0 63.9 ms 64.0 ms 64.0 ms
7.0 0.310 s 0.315 s 0.314 s
8.0 2.05 s 2.29 s 2.20 s
9.0 5.43 s 7.45 s 6.63 s
10.0 6.51 s 9.66 s 8.32 s
57

11.0 6.44 s 9.99 s 8.54 s
12.0 6.66 s 9.99 s 8.56 s
13.0 6.66 s 9.99 s 8.56 s
Table 4
Efft!ct on T 1 of changing knw• by a factor of 2 and 1/2 bt!tween pH 6 - 13
At high pH the surface concentration of AHA- is very low due to the lack
of HA. The involvement of the l<raha process at high pH would suggest, given Eq.
6, that sufficient AHA" is supplied by the collision of A" ions to significantly affect
the conduction of PCP, even at pH 13, in a region where the conduction would
otherwise be exclusively lipophilic conduction of A".
In a similar fashion, at low pH, where the concentration of AHA- would be
considered very low due to the lack of A", the k2ha process enhances the dimer
conduction. In this case, as Eq. 5 implies, collisions between HA molecules
supply the necessary AHA" ions. Table 5 illustrates this effect.
58
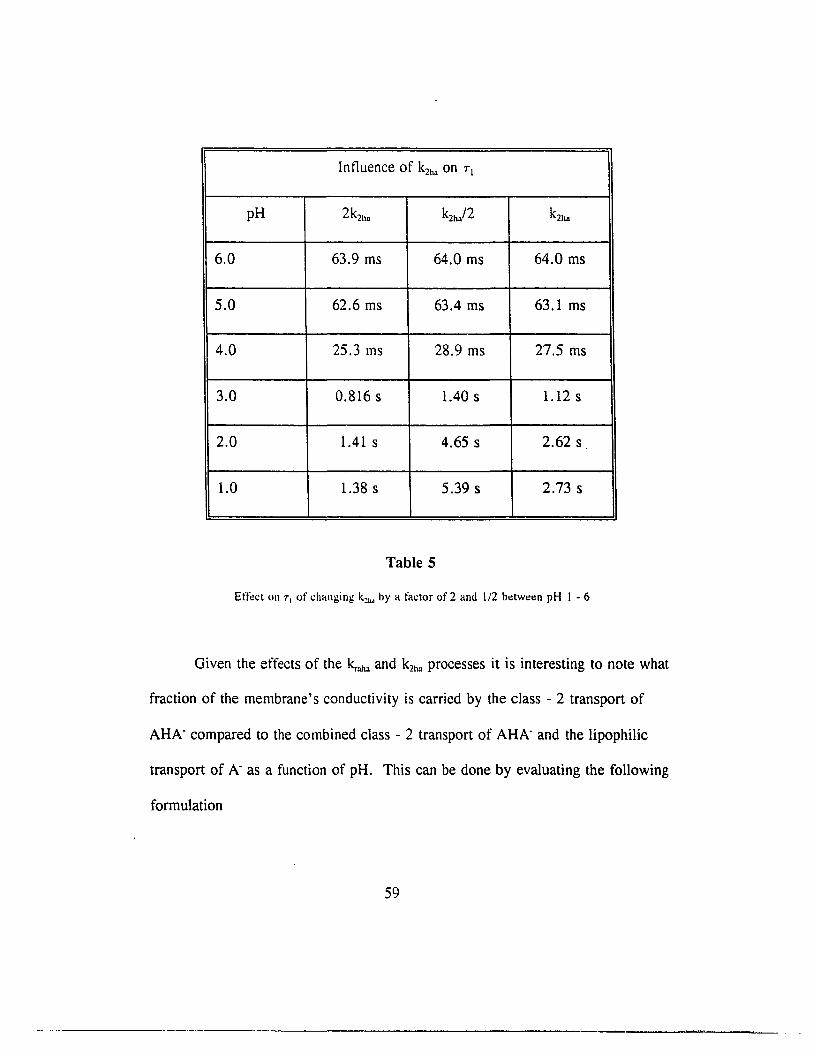
Intluence of k2ha on TI
pH 2k2ho k2ho/2 k2ha
6.0 63.9 ms 64.0 ms 64.0 ms
5.0 62.6 ms 63.4 ms 63.1 ms
4.0 25.3 ms 28.9 ms 27.5 ms
3.0 0.816 s 1.40 s 1.12 s
2.0 1.41 s 4.65 s 2.62 s
1.0 1.38 s 5.39 s 2.73 s
Table 5
Effect on T, of changing k~"" by a factor of 2 and 1/2 between pH 1 - 6
Given the effects of the ~aha and k21ill processes it is interesting to note what
fraction of the membrane's conductivity is carried by the class - 2 transport of
AHA- compared to the combined class - 2 transport of AHA" and the lipophilic
transport of A" as a function of pH. This can be done by evaluating the following
formulation
59
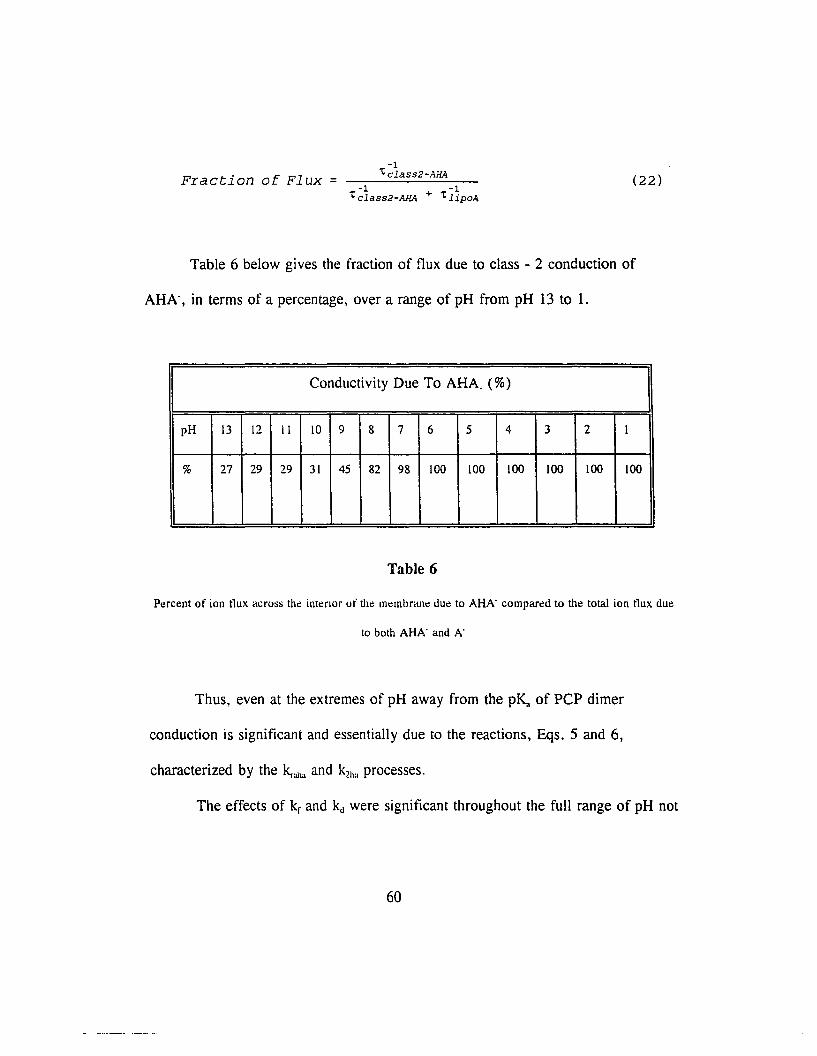
Fraction of Flux =-1
't c1ass2-AHA
-1 -1't class2-AHA + 't lipoA
(22 )
Table 6 below gives the fraction of flux due to class - 2 conduction of
AHA, in terms of a percentage, over a range of pH from pH 13 to 1.
;Conductivity Due To AHA. (%) J
pH 13 12 II 10 9 8 7 6 5 4 3 2 1
% 27 29 29 31 45 82 98 lOa 100 100 100 100 100
Table 6
Percent of ion tlux across the interior of the membrane due to AHA" compared to the total ion tlux due
to both AHA" and A"
Thus, even at the extremes of pH away from the pK,. of PCP dimer
conduction is significant and essentially due to the reactions, Eqs. 5 and 6,
characterized by the lcraha and k2ha processes.
The effects of kr and kd were significant throughout the full range of pH not
60

only on 71 but also on (31 as Table 7 illustrates.
Influence of kr and k.J on 71 and (3\
pH 2kr k,./2 kr/2 2kd kf k.J
7 {3 7 (3 7 (3
13.0 8.53 s 1 8.63 s 1 8.56 s 1
12.0 8.52 s 1 8.63 s 1 8.56 s 1
11.0 8.48 s 1 8.61 s 1 8.54 s 1
10.0 8.06 s 1 8.50 s 1 8.32 s 1
9.0 5.37 s 1 7.55 s 1 6.63 s 1
8.0 1.27 s 0.98 3.57 s 1 2.20 s 1
7.0 0.178 s 0.85 0.604 s 0.99 0.314 s 0.99
6.0 52.5 ms 0.47 0.110 s 0.94 64.0 ms 0.79
61
---- _.- ----

5.0 51.7 ms 0.47 0.108 s 0.94 63.1 ms 0.78
4.0 0.160 s 0.83 0.502 s 0.99 0.275 s 0.95
3.0 0.743 s 0.84 1.62 s 0.99 1.12 s 0.97
2.0 2.52 s 0.97 2.74 s 0.99 2.62 s 0.98
1.0 2.70 s 0.99 2.80 s 1 2.73 s 1
Table 7
Effect of doubling and halving kr and k.i on T, between pH 1 - 13
The effects of kr and k<l on T( become more understandable when
considering their effect on the surface density of the dimer. From Appendix C,
oNaha= kfN~N~a + krahaN~N~ + k2haN~aN~a
k d
(23 )
where ~oh and khaha have been neglected.
Their effect, then, results from the influence they have on the surface
density of the dimer.
62

The decrease in (31 may seem a contradiction given the maximum value of
kfNa~hau/k.J near the pKa • A theoretical analysis of this problem shows the
decreasing amplitude of (31 is taken up, theoretically at least, by (33 discussed
below. It follows from the model that 73 is exclusively identified with the
lipophilic transport of AHA across the membrane interior before the class - 2
chain of kinetically coupled reactions has had time to establish itself. Thus, it is
precisely the increased surface density of AHA around its pKa that allows the
lipophilic mode of transport to depress (31'
The decrease in (31 has a logical theoretical and physical basis. However,
even a casual inspection of the experimental data in Table I shows the decreasing
amplitude of (31 is taken up by (32' not {33' This is a question which remains
unanswered.
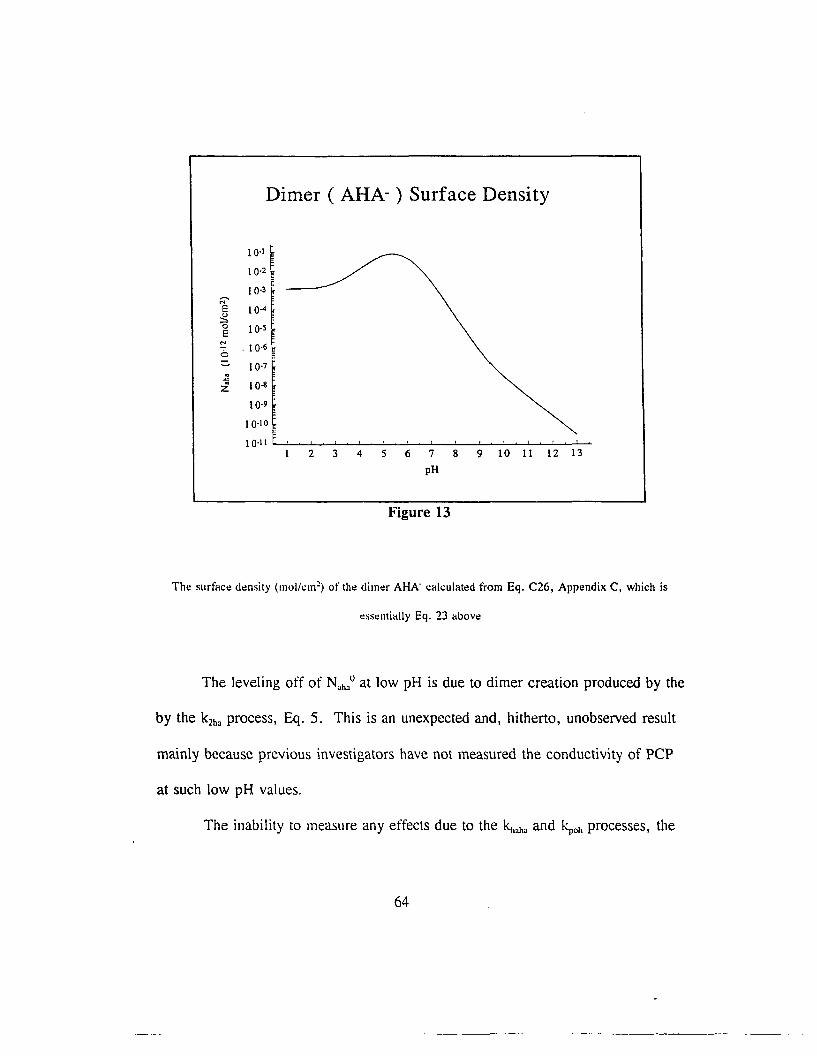
It is useful to calculate the surface density of AHA as a function of pH,
which has been done in Fig 13.
63
Dimer ( AHA- ) Surface Density
10-\
10-2 .
10-3~
N
E 10-4
:50 10-sE
N. 10-6
6:::. 10-7
G.c
Z 10-8
10-9
10-10
10-\12 3 4 5 6 7 8 9 10 11 12 13
pH
Figure 13
The surface density (mol/cm~) of the dimer AHA- calculated from Eq. C26, Appendix C, which is
t:sst:lI1ially Eq. 23 above
The leveling off of N.lu°at low pH is due to dimer creation produced by the
by the k2h• process, Eq. 5. This is an unexpected and, hitherto, unobserved result
mainly because previous investigators have not measured the conductivity of PCP
at such low pH values_
The inability to measure any effects due to the khah• and ~Oh processes, the
64
lack of measurable effects due to the kD process on T1 or {3\ and the very marginal
effect of the kR process is not without implication. All these rate constants involve
the interaction of H+ and OH- directly with HA, A or AHA-. Presumably these
direct reactions would be very fast as suggested by work of McLaughlin's
laboratory (McLaughlin and Dilger, 1980; Kasianowicz et al, 1987), certainly less
than a few JJ.s which was the lower limit of this investigation.
B. BOUNDARY CONDITIONS AND THE UNIQUENESS OF THE
DETERMINED RATE CONSTANTS
In the previous section the determination of all the surface densities and two
of the rate constants were derived from the data of other investigators or from the
boundary conditions implied by the class - 2 model. The remaining eleven time
constants were presumably to be determined from one additional boundary
condition on the amplitudes and from ten observed time constants and their
associated amplitudes. As discussed above and shown explicitly in Table 3 only
upper or lower limits could be given to three of the rate constants, km, kt.w and
~, and one rate constant, kR• was known only marginally. Thus, of the eleven
remaining rate constants, four were essentially eliminated from the curve fitting
65

routine since they had no effect on the results. Physically they likely characterized
processes that were too fast and/or of such low amplitude that the experimental
apparatus was unable to detect their effect. One of the remaining seven rate
constants was determined from 72' ko, and another from 73' kw (discussed below).
As a result, five rate constants were left, ku, kc, k.J, kraha and k2ba to be
analyzed in terms of 7 1 and {31. Mathematically, this would imply that the five rate
constants could be found explicitly only in terms of two ratios and, therefore,
considerable ambiguity would remain.
Experimentally, however, the situation was more favorable. At very low
pH only the k2hn process was effective in determining 1'1 as Tables 4, 5 and 7
illustrate. The same Tables show that at high pH !<rllhll was significant and Table 6
shows the significance of k~ at high pH. The influence of the 1<,. process, transport
of A- across the membrane interior, was effective at lower pH values than was the
lcraha process and thus the two could be separated. The main effect of the kc and k.J
processes was around the pK" where they effected both 7, and {31 and could thus be
separated. Experimentally, then, data from 1'1 and {31 was able to distinguish the
five remaining rate constants. Physically, this separation of the rate constants
follows from the fact that k2hn, !<raba' ka, and the pair kf - ~ are derived from very
different processes effective over different pH ranges.
66

B. DIFFICULTIES WITH THE SHORTER TIME CONSTANTS
The essential difficulties with T2 and T3 are contained in Figs. 10 and 11.
None of the models discussed here, including the class - 2 model, fit the data even
qualitatively. The theoretical curves shown in Figs. 10 and 11, derived in the
same manner as the other theoretical curves, from the eigenvalues of matrix A,
Eq. 7, also corresponded within a few percent in the range shown to the following
formulations,
(24 )
(25 )
The value of ko was adjusted to fit the low pH data for T2' Since ko had
little effect on any other theoretical parameter the adjustment was simple.
However, given the difficulties surrounding T2 and its interpretation, the estimated
numerical value of ko and its implications are suggestive rather than persuasive.
With T3 and Eq. 25, however, the adjustable limits of kw were not as
67

arbitrary since even adjustments of 10% marginally began to affect TI'
Eq. 25 is, in fact, the theoretical formulation for the lipophilic movement of
AHA- across the membrane interior as would be derived in Appendix A. This
observation is the rationale for the above comment that, theoretically, the decrease
in (3\ around the pKa is due to the contribution of the lipophilic ion mode of
transport of AHA-.
The major qualitative problem, shown in Figs. 10 and 11, is the pH
dependence of the observed shorter time constants at pH > pICa. It appears that
there are two processes involved, one at higher pH which is strongly pH dependent
and the other at low pH which is pH independent.
No resolution to this problem was found. The possibility of protonic
leakage was considered despite investigations (Gutman et al, 1995; Deamer and
Volkov, 1995) showing that protonic leakage does not depend on pH. The idea
that aqueous channels spontaneously open up across the membrane allowing a net
flux of protons to be transported through the channels due to concentrations
differences on either side of the membrane or due to an imposed electric field,
such as a charge pulse experiment would induce, is mathematically modeled in
Appendix D. Computed results based on the theory outlined in Appendix D, in
fact, degraded the theoretical fit for TI and showed no pH dependence.
68
-------_ - _._ ---

The suggestion that the hydrolysis of water, H+ + OH- 09 H20, might be
limiting in the context of membrane surfaces was also modeled in Appendix D with
no useful experimental results.
C. COMPARISONS WITH THE RESULTS OF OTHER INVESTIGATORS
I. Previous Investigations
As indicated previously (section I C) the class - 2 nature of PCP has been
invoked by investigators. Some of those results have been used in this study
(Smejtek et al, 1976; Pickar and Hobbs, 1982; Smejtek et al, 1987a; Smejtek et ai,
1989, Smejtek and Wang, 1990). The results presented here provide greater
insight into the nature of PCP - induced membrane electrical conductivity.
Barstad et al (Barstad et aI, 1993) attempted to measure the formation
constant of AHA dimers in various lipid membranes but their results were
somewhat inconclusive because the dimer surface density proved too small to
measure directly. The lower detection limit of their spectrophotometric method
was == 10-11 mol/cm2• The results here, as illustrated in Fig. 13, imply that the
maximum dimer surface density reached 9x 10-14 mol/cm2•
69

However, Smejtek et al (Smejtek et aI, 1976) did directly measure the
steady state conductivity induced by PCP (25 J,tM) between pH 4 and 7 in
phospholipid-cholesterol membranes. The conductivity per unit area was assumed
to be
Their results for phosphatidylcholine (egg lecithin) membranes are
(26 )
reproduced below along with the theoretical conductivity curve using Eq. 26 and
the kinetic constants contained in the present work. The agreement between
predicted and experimental electrical conductivity is quite remarkable considering
the different kinds of lipids and methods used in these two types of studies
70

Theoretical and Experimental Conductivities
Theoretical Conductivity
o
101
54
3
2
100
Experimental Conductivity
4.0 4.5 5.0 5.5
pH
6.0 6.5 7.0
Figure 14
Theoretical conductivity (S/cm~ based on Eq. 26 and the results of this investigation for 30 J4M PCP
compared with the experimental results of Smejtek et al (Smejtek et al, 1976) for 25 J4M PCP
Pickar and Hobbs (Pickar and Hobbs, 1982) used alternating current
methods at pH 5.4 to investigate the effects of PCP on the electrical conductivity
of egg-lecithin membranes and concluded that processes that involved the creation
of A- independent of the dimer AHA', KRR , Eq. 2, dominated over the destruction
of A- as the result of dimer formation, keNy O, Eq. 4. Conversely, they concluded,
that processes that involved the destruction of A- ions independent of the dimer
71
--------------~~--~~=.~.=_ ..-~.=--=_.=---"'-"-=="--==---

AHA-, kRNbO, Eq. 2, were dominated by creation of A due to dimer dissociation,
k.i. Eq. 4. Their investigation did not include the OH- ion and thus was based on
Eqs. 2 and 4. They suggested that, in terms of the parameters defined in this
report, kRR > > krNbao and k.J > > kRNbO which implies the A species was long
lived compared to the dimer AHA-. At pH 5.4 the first inequality is not supported
by this report.
However, if their suggestion is expanded to include the OH- ion, the
implication is that kRR + kDNba° > > krNba°and k.i > > kRNbo + kDD, a result that
includes Eq. 3. The first inequality is now true at any pH and the second is true
for any pH > 3. Therefore, it would seem, based on this report, that their
assumptions masked the effects of the OH- ion but also that their essential
conclusion is supported here.
2. New Advances
The class - I and class - 2 models presented in Appendices B and C,
respectively, expand previous models by including the effects of both H+ and OH-.
The inclusion of both H+ and OH- was made possible by a mathematical
approach to class - 1 and class - 2 modeling using matrix theory and taking
72

advantage of the resulting eigenvalues and eigenvectors to determine the time
constants and amplitudes of interest. Also new in both cases is the development of
charge pulse measurement theory utilizing the matrix approach.
Theoretically, then, all the effects suggested by Eqs. 2 - 3 and Eqs. 2 - 6
can be analyzed using the expanded models of Appendices B and C, respectively.
And also, as a consequence, the surface densities of HA, A and AHA- can
potentially be determined explicitly as a function of pH and compared to the results
of A" and AHA membrane sorption studies.
Experimentally, the situation is more difficult since even the theory suggests
that many of the theoretical time constants and amplitudes would likely be too
small to observe.
However, several new aspects of PCP - induced membrane conduction did
emerge from this investigation that have not been previously reported.
The reactions involving the kcw and k2ha processes, Eqs. 5 and 6, have not
been proposed in the literature. The determination of these rate constants and their
effect, demonstrated by Tables 3, 4 and 5, have now been shown to be significant
even at pH values far from the pKa of PCP where the surface concentration of
AHA" formed by the conventional recombination of HA and A" would seem to
exclude any conduction at all.
73
._------------------------------'------------

Literature Cited
1. Barstad, A., D. Peyton and P. Smejtek. 1993. AHA heterodimer of a class-2uncoupler: pentachlorophenol. Biochimica et Biophysica Acta 1140:262-270.
2. Benz, R., P. Uiuger, and K. Janko. 1976. Transport kin e tic s 0 fhydrophobic ions in lipid bilayer membranes: Charge pulse relaxation studies.Biochim. biophys. Acta 455:701-720
3. Benz, R. and P. Uiuger. 1977. Transport kinetics of dipicrylamine throughlipid bilayer membranes. Effects of membrane structure. Biochim. biophys.Acta 468:245-258.
4. Benz, R., and S. McLaughlin. 1983. The molecular mechanism of action ofthe proton ionophore FCCP (Carbonylcyanide p-Trifluoromcthoxyphenylhydrazone). Biophys. J. 41 :381-398.
5. Butte, W., J. Denker, M. Kirsch, T. Hopner, and . 1985.Pentachloropheol and tetrachlorophenol in Wadden sediment and clams Myaarenaria of the Jadebusen after a 14-year period of waste discharge containingPCP. Environ. Pollut. (Series B)9:29-39.
6. Chiou, C. 1985. Partition coefficients of organic compounds in lipid-watersystems and correlation with fish bioconcentration factors. Environ. Sci.Technol. 19:57-62.
7. Connell, D. 1988. Bioaccumulation behavior of persistent organic chemicalswith aquatic organisms. Rev. Environ. Contam. Toxicol. 101: 117-154.
8. Crosby, D. and . 1981. Environmental chemistry of pentachlorophenol. Pureand Appl. Chern.: 1051-1080.
9. Deamer, D., and A. Volkov. 1995. Proton Permeation of Lipid Bilayers,161-177. In E. Disalvo and S. Simon (eds.), Permeability and Stability ofLipid Bilayers. CRC Press, inc., Ann Arbor, MI.
10. Drahonovsky, J., and Z. Vacek. 1971. Dissoziationkonstanten andaustauscherchromatographie chlorierter phenole. Coil. Czech. Chern.Commun. 36:3431-3440
11. Geyer, H. J., I. Scheunert, and F. Korte. 1987. Distribution andbioconcentration potential of the environmental chemical pentachlorophenol
74
(PCP) in different tissues of humans. Chemosphere 16:887-899.
12. Gutman, M., E. Nachliel and Y. Tsfadia. 1995. Propagation of protons atthe water membrane interface microscopic evaluation of a macroscopicprocess, 259-276. In E. Disalvo and S. Simon (eds.), Permeability andStability of Lipid Bilayers. CRC Press, Inc., Ann Arbor, MI.
13. Hattemer-Frey, H. A. and C. C. Travis. 1989. Pentachlorophenol:Environmental partitioning and human exposure. Arch. Environ. Contam.Toxicol. 18:482-489.
14. Hawker, D., D. Connell, and . 1989. A simple water/octanol partitionsystem for bioconcentration investigations. Environ. Sci. Technol. 23:961-965.
15. fARC and . 1979. Monographs on the evaluation of the carcinogenic risk ofchemicals to humans: Pentachlorophenol. IARC 20:303-325.
16. Lagas, P. 1988. Sorption of chlorophenols in the soil. Chemosphere17:205-216.
17. Kasianowicz, J., R. Benz, and S. McLaughlin. 1984. The kinetic mechanismby which CCCP (Carbonyl Cyanide m-Chlorophenylhydrazone) transportsprotons across membranes. J. Membrane BioI. 82: 179-190.
18. Kasianowicz, J., R. Benz and S. McLaughlin. 1987. How do protons crossthe membrane-solution interface? Kinetic studies on bilayer membranesexposed to the protonophore S-13 (5-chloro-3-tert-butyl-2'-chloro-4'nitrosalicylanilide). 1. Membrane BioI. 95:73-89.
19. Mackay, D. 1982. Correlation of bioconcentration factors. Environ. Sci.Technol. 16:274-278.
20. McLaughlin. S., and J. Dilger. 1980. Transport of protons across membranesby weak acids. Physiol. Rev. 60:825-863.
21. Mitchell, P. and J. Moyler. 1967. Respiration-driven proton translocation inrat liver mitochondria. Biochem. Journal 105:1147-1162.
22. Mitchell, P. 1961. Coupling of phosphorylation to electron and hydrogentransfer by a chemiosmotic type of mechanism. Nature 191: 144-148.
23. Mitchell, P. 1966. Chemiosmotic coupling of oxidative and photosyntheticphosphorylation. BioI. Rev. (Cambridge) 41(3) :445-502.
75

24. Mitchell, P. and J. Moyle. 1969. Estimation of membrane potential and pHdifferences across the cristae membrane of rat liver mitochondrion. Eur. J.of biochem. 7:471-48~4.
25. Mussalo-Rauhamaa, H., H. Pyyslow, and V. Antervo. 1989. The presenceof chlorophenols and their conjugates in Finnish human adipose and livertissues. Sci. Total. Environ. 83: 161-172.
25. Nagle, J. 1987. Theory of passive proton conductance in lipid bilayer. J.Bioenerg. Biomembr. 19:413-426.
26. Nagle, J., and S. Tristram-Nagle. 1983. Hydrogen bonded chain mechanismsfor proton conduction and proton pumping. J. Membr. Biol. 74:1-14.
27. Paasivirta, S., H. Tenhola, H. Palm, and R. Lammi. 1992. Free andbound chlorophenols in Kraft pulp bleaching effluents. Chemosphere24: 1253-1258.
28. Pickar, A. and J. Hobbs. 1982. The influence of sterols onpentachlolophenol-induced charge transfer across lipid bilayers studied byalternating current methods, 221-236.
29. Pickar, A. and W. Amos. 1976. Alternating current studies of chargetransfer transport in lipid bilayers: pentachlorophenol in lecithin - cholesterolmembranes. Biochim. biophys. Acta 455:36-55.
30. Pickar, A. and R. Benz. 1978. Transport of oppositely charged lipophilicprobe ions in lipid bilayer membranes having various structures. J. Membr.Biol.44:353-376.
31. Rao, K. 1978. Pentachlorophenol. Ed. K. Rao. Plenum Press, New York,N.Y.
32. Ravanel, P., G. Taillandier, M. Tissut, and J. Benoit-Guyod. 1985.Effects of chlorophenols on isolated plant mitochondria activity: A qualitativestructure activity relationship study. Ecotoxical. Environ. SaL 9:300-320.
33. Schellenberg, K., C. Leuenberger, and R. P. Schwarzenbach. 1984.Sorption of chlorinated phenols by natural sediments and aquifer materials.Environ. Sci. Technol. 18:652-657.
34. Senger, H., and D. Ruh!. 1980. The influence of pentachlorophenol on thebiosynthesis of 5aaminolevulinic acid and chlorophyll. Int. J. Biochem.12: 1045-1048.
76
35.
36.
37.
38.
39.
40.
41.
42.
43.
44.
45.
Smejtek, P., K. Hsu, and W. Perlman. 1976. Electrical conductivity inbilayer membranes induced by pentachlorolphenol. Biophys. J. 16:319-336.
Smejtek, P., and S. Wang. 1990. Adsorption todipalmitoylphosphatidylcholine membranes in gel and fluid states:pentachlorophenolate, dipicrylamine, and tetraphenylborate. Biophys. J.58: 1285-1294.
Smejtek, P., S. Wang, and W. Barstad. 1987. Adsorption of ionized andneutral pentachlorophenol to phosphatidylcholine membranes.905:213-221Biochimica et Biophysica ACTA.
Smejtek, P., A. Barstad, and K. Hsu. 1987. Dielectric properties ofadsorption/ionization site of pentachlorophenol in lipid membranes. Biochimicaet Biophysica ACTA 902: 109-127.
Smejtek, p., W. Barstad, and S. Wang. 1989. Pentachlorophenol-inducedchange in I-potential and gel-to-fluid transition temperature in model lecithinmembranes. Chem.-BioI. Interactions 71:37-61.
Ubi, S., P. Schmid, and C. Schlatter. 1986. Pharmacokinetics ofpentachlorophenol in man. Arch. Toxical. 58:182-186.
VanDam, K. 1967. The inhibitory effect of uncouplers of oxidativephosphorylation on mitochontrial respiration. Biochem. Biophys. ACTA131(2):407-411.
Veith, G., D. De Foe, and B. Bergstedt. 1979. Measuring and estimatingthe bioconcentration factor in fish. 1. Fish Res. Bd. Can. 36: 1040-1048.
Weinbach, E., and J. Garbus. 1965. The interaction of uncoupling phenolswith mitochondria and with mitochondrial protein. J. BioI. Chem.240: 1811-1819.
Wild, S. R. and K. C. Jones. 1992. Pentachlorophenol in the UKenvironment. II. Human exposureand an assessment of pathways. Chemosphere24:847-855.
Wild, S., S. Harrad, and K. Jones. 1992. Pentochlorophenol in the UKenvironment I: A budget and source inventory. Chemosphere 7:833-845.
77

APPENDIX A
LIPOPHILIC IONS
Part I
Derivation of Fully Linearized Kinetic Equations for Lipophilic Ions
Following Benz, et al, (Benz, et al, 1976) the basic differential equations
describing the transmembrane transport of lipophilic ions are:
dN'_4 = l' c - l' 111' - "'111' + k"N"tit ~ ......." ..... ""
dN"_. = ,," c - ,," 111" - ""N" + "'111'dt "fa ....,... • 4 .... "
Al
A2
where t is time, ka', ka" and Na', No" are the transmembrane rate constants (S·I) and
adsorbed anion surface densities (moles per unit area), respectively, for A. kaqm' and
kaqm" are the rate constants (m/s) associated with movement of A" from the aqueous
solution to its adsorption on the membrane, k.naq' and km.q" are the rate constants (S'I)
associated with the movement of A from its adsorption on the membrane into the
78

aqueous solution and c is the molar aqueous concentration of A".
To transform Eqs. Bl and B2 into a more useful linear form, it is first
assumed that the single and double primed rate constants for A" are related in the
following way:
.., -. CIt
k = Ie e 2 = Ie + -1 uG. • 2 •
../I --.. CItk = k e 2 = Ie - -k u... • 2"
1 - ..
k ' --Ie e-4-" 1 - CIt=k +--k u"9111 CIfaI .. 4 "P
1 - ..k:'- = Ie_e --4-" = 1 - _l_-_CItIe u....- -.- "9111 4 cpo
1 - ..
k' = k e --4-11
= Ie - 1 - CIt" U""'f""'f ""'f 4""'f
1 - ..,, " __ Ie e-4-" 1 - II=Ie + --k u""'f """l ""'9 4""'f
A3
A4
AS
A6
A7
A8
where u is the reduced external electric potential imposed across the membrane, u =
VF/RT, where V is the actual imposed external voltage across the membrane, F is
Faraday's constant, T is the temperature in Kelvin, and R is the gas constant. The
term Cl! is the fraction of the reduced voltage, u, which appears across the interior of
79

the membrane and (l - ex)/2 is the fraction of u which appears across each aqueous -
membrane interface.
The above linearization assumes the reduced externally imposed electric
potential, u, is < < 1 so that the exponential can be expanded, eX - 1 + x. The next
step is to formulate a new parameter:
Y = N' - NilII .. II A9
Because of the small voltage restriction it is assumed that during the time
course of the experiment none of the surface densities depart significantly from their
equilibrium states, and that cross terms between Ya and u are insignificant and can be
set to zero.
Also let N°a be the equilibrium surface densities on each side of the membrane
before the external electric potential is applied, that is, half the sum of the single and
double primed surface densities at t = O. Then at equilibrium
AIO
Allow
80

then adding Eqs. Al - A2 and allowing t -+ 00
Comparing Eqs. AlO and A12 it follows that
In general adding Eqs. Al - A2 yields
dr-=2k c-Ic rtIl "9lIlI ....,
with the general solution
Comparing Eqs. Al3 and A15
81
All
Al2
Al3
A14
A15

A15
Comparing Eqs. A13 and AI5
AI6
Using Eqs. A3 - A9, Eq. AW, and Eq. A16, Eqs. Al - A2 are reduced to the
following:
AI7
which is now fully linearized.
For a membrane of electric capacitance C, the time course of the reduced
potential in the charge pulse experimental method is
du = ~(l - u(k' M' + k" c - k" N" - k' c) + u(k"N" - k'1I1"')dt CRT 2 -r·c ... ~·c """" "" ,..·oJ
using the above linearizations
82
AlB

where b = F2/CRT.
A19
In general, Eqs. AI? and A19 comprise a complete set of linearized
differential equations with constant coefficients characterizing the lipophilic mode of
ion transport.
In the case where a ::; 1 Eqs. A17 and A19 reduce to
or
dY" .N:- = -(2k + k \Y - Zit utit """"l' " •
du = -bk Y _ bk lVoutIt oS • ....
As u(t -+ 00) du/dt -~ O. From Eq. A19
du I 1 - u ""ItIt ,~" =b(-Z-k-r - u1c)(N. - N"J ,~"
- b«l - u~k + u2k\~U(H) = 02 -r ; •
A20
A21
A22
U(H) =
83
A2l
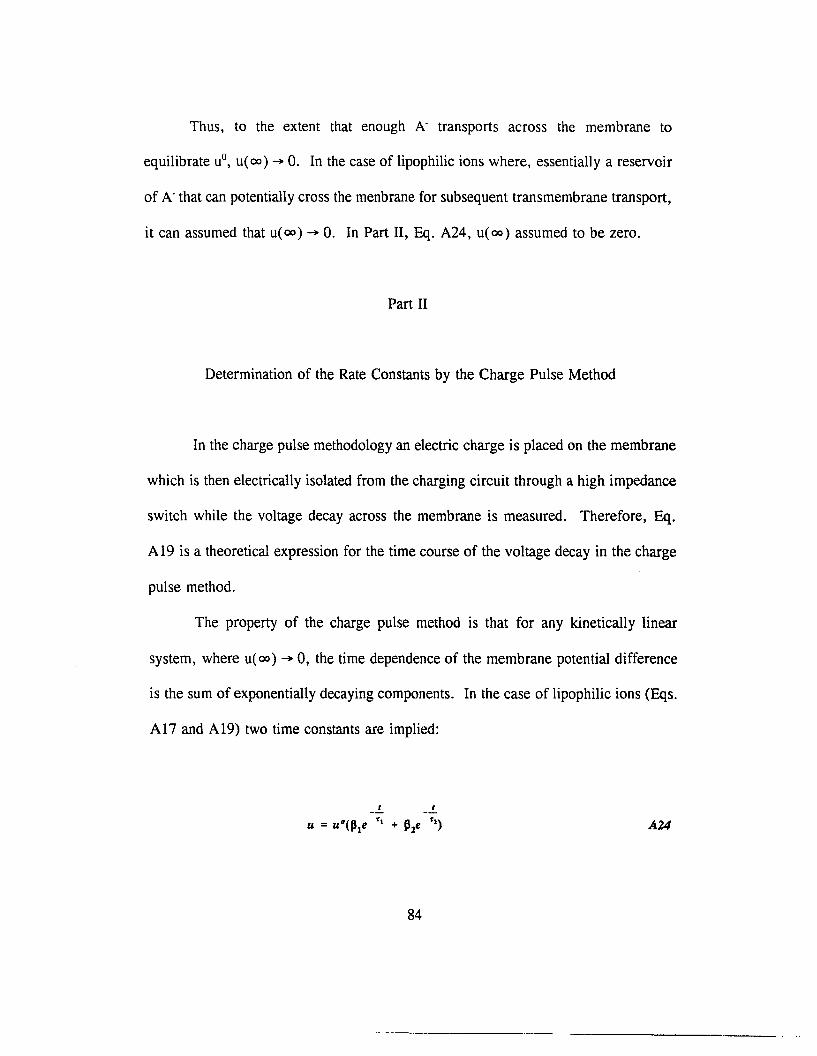
Thus, to the extent that enough A" transports across the membrane to
equilibrate UD, u( 00) ~ O. In the case of lipophilic ions where, essentially a reservoir
of A- that can potentially cross the menbrane for subsequent transmembrane transport,
it can assumed that u( 00) ~ O. In Part II, Eq. A24, u( 00) assumed to be zero.
Part II
Determination of the Rate Constants by the Charge Pulse Method
In the charge pulse methodology an electric charge is placed on the membrane
which is then electrically isolated from the charging circuit through a high impedance
switch while the voltage decay across the membrane is measured. Therefore, Eq.
A 19 is a theoretical expression for the time course of the voltage decay in the charge
pulse method.
The property of the charge pulse method is that for any kinetically linear
system, where u( 00) ~ 0, the time dependence of the membrane potential difference
is the sum of exponentially decaying components. In the case of lipophilic ions (Eqs.
Al7 and A19) two time constants are implied:
I I
" = ""(Pie T, + P2e T1
)
84
AU

where UO is the imposed reduced voltage across the membrane at t = 0 and the (3's
and r's are the amplitudes and associated time
constants, respectively, of the observed voltage decay. Obviously,
lJ1 + 131 = 1
In matrix notation Eqs. A17 and A19 become
A25
-2ko - k-.
b 1 - Uk - buk,.2 ...
A26
The eigenvalue solution to Eq. A26 generates eigenvalues which are identical
to the above reciprocal time constants in Eq. A24. Defining ~ to be the ith
eigenvalue implied by Eq. A26, and therefore the ith reciprocal time constant, Ti'!,
given in Eq. A24, the eigenvalues of Eq. A26 are determined from the following
determinant equation:
del
}. -2k -k,. -.1 - exb--k - bexk2 -.sf 0
(1 - ex)kIlUfN: - 2exk.N:
}. _ b (1 - 11)1k 1\1" _ hk N°2 -'('0 • ,.
85
=0 A27

where
Expansion of the above determinant in powers of r.. yields
1,1 - Qll + Q2 = 0
QI = 21. + k..." + Q4
The expression Q4 above is derived from Eq. A19.
From the time derivative of Eq. A24 and from Eq. A25 and A31,
Q4 - "-:III = 1 - 1
1 Z
86
A28
A29
A30
A31
A32
_________________~__~__~_~"~~~~=-~w-n _~ ~ _ ~
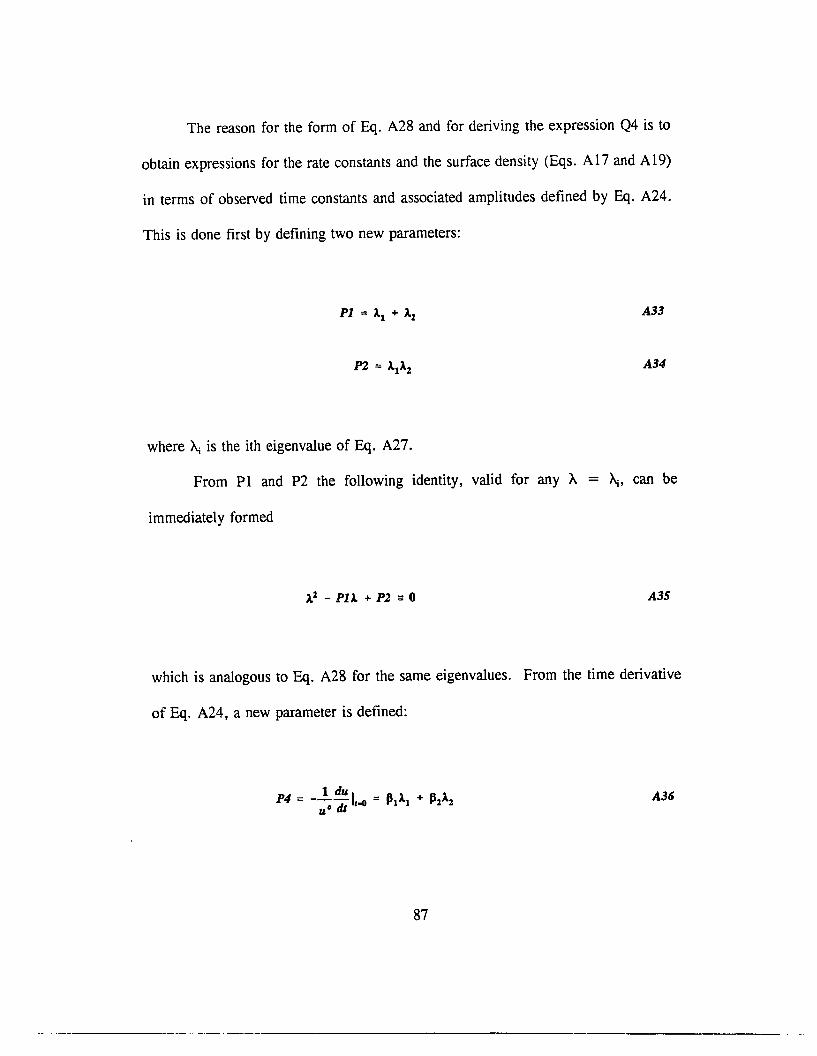
The reason for the form of Eq. A28 and for deriving the expression Q4 is to
obtain expressions for the rate constants and the surface density (Eqs. A17 and A19)
in terms of observed time constants and associated amplitudes defined by Eq. A24.
This is done first by defining two new parameters:
A33
A34
where ~ is the ith eigenvalue of Eq. A27.
From PI and P2 the following identity, valid for any A = ~, can be
immediately formed
1.2 - PIl + P2 == 0 A35
which is analogous to Eq. A28 for the same eigenvalues. From the time derivative
of Eq. A24, a new parameter is defined:
A36
87
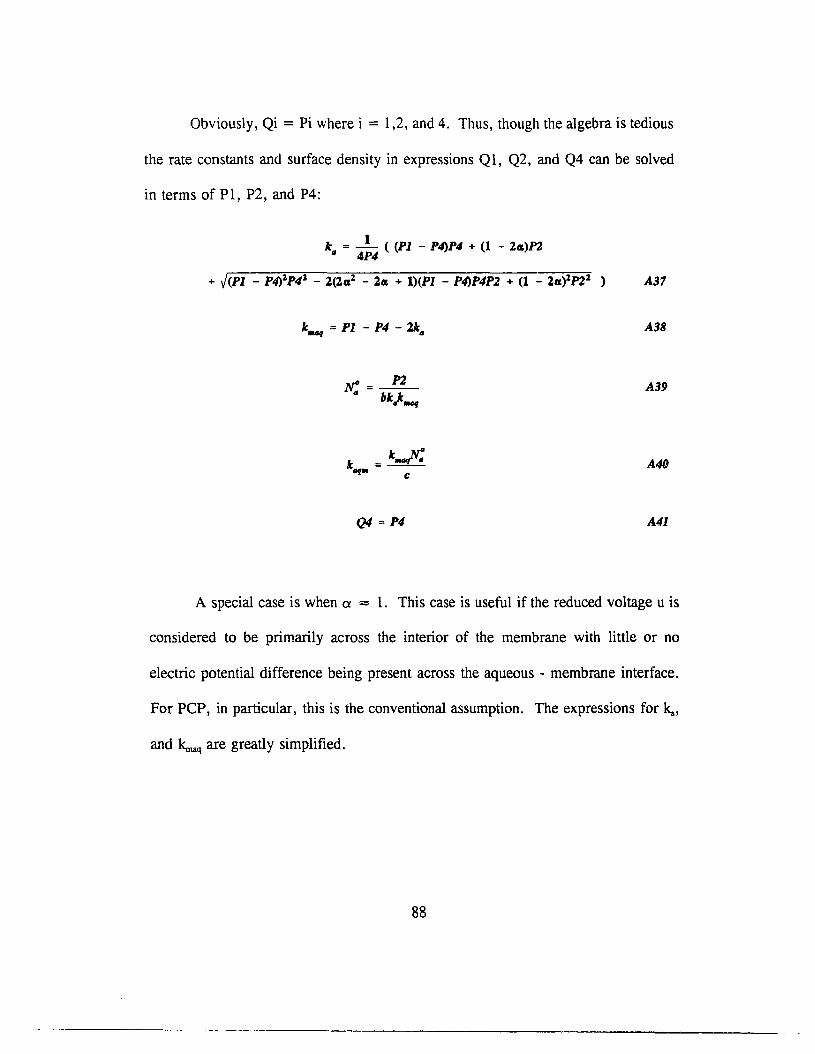
Obviously, Qi = Pi where i = 1,2, and 4. Thus, though the algebra is tedious
the rate constants and surface density in expressions QI, Q2, and Q4 can be solved
in terms of PI, P2, and P4:
k = _1_ ( (PI - P4)P4 + (1 - 211)P2.. 4P4
+ J(Pl - P4)'1.p4'1. - 2(211'1. - 211 + I)(Pl - P4)P4P2 + (1 - 2m}"P2'1. ) A37
k = PI - P4 - 21 A38-..q ..
k 7\1:k = -....,._._, A40"9aI c
A special case is when a == 1. This case is useful if the reduced voltage u is
considered to be primarily across the interior of the membrane with little or no
electric potential difference being present across the aqueous - membrane interface.
For PCP, in particular, this is the conventional assumption. The expressions for lea,
and ~q are greatly simplified.
88

k = _P_IP._'4_-_P_'41._-_P2_.. 2P4
k = P2""" P4
A42
A43
Generally, for the case of PCP, it is not only assumed that ex = 1 but that k.naq
= 0 since it is assumed that PCP does not diffuse into or adsorb from the aqueous
solution during the time course of the experiment. Following the methods described
above only one time constant is found:
or-I =2k + bk N°.. .. .. A44
It should be noted that the classic lipophilic theory derived here follows the
development first given by Benz et al (Benz et ai, 1976) has been questioned on
theoretical grounds (M. Takeo, private communication).
89
---- -- - -----
APPENDIX B
CLASS - I UNCOUPLERS
Part I
Derivation of Fully Linearized Kinetic Equations for Class - 1 Uncouplers
The basic differential equations describing transmembrane transport of class -
1 uncouplers for a weak acid (HA) with its conjugate anion (A) include surface
reactions involving A" and HA, respectively. Also included are the following surface
reactions with respect to H+ and OH", their respective rate constants being noted to
the right.
OH- + HA ~ A - + 11;.0 B2
where the units for kRR and koo are S"I and kR and ko are cm2 S"l moles·l •
The complete set of differential equations describing class - 1 uncouplers
becomes, then,
90

dN"1uJ _ k· M" k M"N" k M" - k M"MII - k M" k· M'& - - RIr'!J4 + Jr'a h + DD"IJ D"1ur'oh W'!J4 + M'!J4
dN'_" = k M' - k M'M' - k M' + k M' M' + kilN" - k'M'dJ RIr'!J4 Jr'"Hh DD"" O"/ttJ"oh "" ""'a
dN"-" = k M" - k M"N" - k M" + k M"M" - k"N" .;. k'M'dJ RIr'!J4 Jr'" h DO"" O"/ttJ"oh IJ" ""'IJ
dN'_It =1ctu!'f.. - leJ!i:Jl~
dJ
dN"dJ" =1ctu!'::' + leJ!i~'N~'
dN'~ = k 111' - Ie 111' 111'dJ DDH
• 0' ' I"," 011
dN"~ = Ie 111" - k 11111 111"dJ DD". 0""....'.10
B3
B4
B5
B6
B1
B8
B9
BI0
where ~ is the rate constant (S-I) associated with the movement of HA across the
membrane interior, Nha', Nha " with the surface densities (in moles per unit area) of
HA. Nh', Nh", and Noh" Noh" are associated with the surface densities (in moles per
unit area) of H+ and OH-, respectively,
The transformation Eqs, B3 to BlO into a more useful linear form proceeds in
91

the same manner as in Appendix A with the formation of four new parameters.
I 1/ BllY!J4I =Ny - Ny
Y =N' - N" B12.. .. "
I " B13Y. = Nil - Nil
I " B14Y"" = N"" - N""
OR, respectively, on each side of the membrane before the external electric potential
is applied, where, if they do not cross the membrane interface,
~' ~"N:' =
lie + lie B152
N!=rt' +~'.. .. B16.. 2
,,' Pr.."~= N" + " B17
2
, "N;' =
N;" + N;. BI82
92

Using Eqs. Bll - B18, Eqs. B3 - BlD are reduced to the following:
B19
B.
B21
B22
For a membrane of electric capacitance C, the decaying time course of the
reduced potential in the charge pulse experimental method is
d b dY dY dY~ =b(kl/N" - k'.,.,J,. = _(_a + ----!! - _.)tit •• .. '.,J 2 tit tit tit
using the above linearizations
du- = -bi Y - bk ""'utit • • "".
93
823
824

where b = F2/CRT.
Eq. B23 can be used to solve for u,
b b bu = -y + -Y" - -~" + u ..
2" 2" 2B25
This result will be useful later to eliminate u from Eq. B20 in terms of Ya and the
initial reduced voltage, uo.
Under equilibrium conditions, before the external voltage is applied across the
membrane, Eqs. B7 - BlO immediately suggest two boundary conditions. Before the
external voltage is applied across the membrane, N' = N", regardless of the specific
surface density in question. Adding Eqs. B7 and B8, the following result is easily
obtained,
Likewise, adding Eqs. B9 and BlO,
94
B26

NO 11/'k = _'ur_",oJt k
DD lI!. D/I
B27
A third boundary condition can be found by adding Eqs. B3 - B6 resulting in
d(N' + Nil + N' + N'/.,.lui lui /I /1'=0
dt
If No = the total adsorbed concentration of HA and A at t = 0, then,
By examining Eq. Bl at pH = pKa of PCP it is seen that
Combining Eqs. B29 and B30,
As t - 00, from Eq. B25,
95
------ --_..---_.-.
B28
B29
B30
B31

B32
Thus, to the extent that the initial voltage across the membrane, uo, is
equilibrated by concentration gradients of A-, OR and/or H+ ions across the
membrane, u( 00) -+ O. Particularly for small voltages, Uo < 1, there would be, at
least, a large reservoir of H+ ions. In part II below, therefore, u( 00) is taken to be
zero.
96
--------------------

Part II
Determination Of The Rate Constants by the Charge Pulse Method
Proceeding as in Appendix A, with the assumption that u( 00) = 0, the four
linearly independent equations, Eqs. B19 - B22 in the charge pulse methodology imply
4 time constants:
B33
B34
The matrix equation suggested from Eqs. B19 - B22, when Eq. B26 is used
to eliminate u, takes the form
dY""tit
dY"Ylla 0
tit Y" _ UO 2kJl~=A B35
dY" Yh 0tit Yoh 0
dYoll
tit
where A is a 4x4 matrix whose columns are shown below
97

-2ku - kRR - krfi:.
kRR + koN:.kRR
o-krfiolt
(1)
ok~. + kDD
-2k - bk "10
- k - k "1"• ({('om DD R"0"
(2)
ks!': krJl:'bk NO - 1c;¥.O -bk.N: -1c~II /I II
-ks!': 0
0 k~
(3) (4)
The eigenvalue solutions, Ai (i = 1-4), to the determinant of matrix A are the
reciprocal time constants suggested in Eq. B33, that is, ~ = Tj-l.
Finding the associated amplitudes is a more involved process which utilizes the
eigenvectors of matrix A.
The first step is to make a change of variables such that the constant term in
Eq. B3S is eliminated. This is done by solving Eq. B35 for Yha , Ya, Yhand Y011 in
the case where the LHS of the equation is set to zero. This can be done by Gaussian
elimination using determinants,
98

c = det I A I II det I A I
B36
where matrix A' is matrix A with the ith column replaced by the constant term in Eq.
B35, namely,
o
and i is, respectively, ha, a, h and oh. The proper change of variable is, then,
I B37Y... = Y... - e...
I B38Yc = Y" - Cc
I B39Y, = Y, - C,
I B40Yo' = Yo' - co,
where the primed variables are the new variables.
With respect to the new primed variables the constant term in Eq. 35 is
99

eliminated and, thus, the differential equations have a simple solution
,~ -). tY, = LJ rt.lj e J
1
,dY, = _~ II 1 e -1, t = dr,~ LJ '1 J ~
1
B41
B42
where i, j = ha, a, h and oh, respectively, and the RHS of Eqs. B41 and B42 are
summed over j. Thus, each Y'j is a linear conbination of eigenvectors involving the
eigenvalue >--; that appears in the exponential term.
The a's in Eqs. B41 and B42 are derived from the eigenvectors of matrix A.
Each eigenvalue is associated with a unique column eigenvector. These column
eigenvectors are used to make up a 4x4 matrix of their own where the jth column of
this new matrix is the column eigenvector associated with the jth eigenvalue. Thus,
aij (i = 1 - 4) is the jth column eigenvector of matrix A in Eq. B35 associated with
the jth eigenvalue.
In matrix form Eq. B4l is
y' y'!til !t 12 !t 13 lX 14
e -).1'lui I
y' y' !t21 !t Z2 (E23 CX 24e -).1'.. Z
B43y' y' (E31 (En (E33 CX 34
e -).),It 3, y' !t41 (E42 CX 43 CX44 e -)..'
YDIt 4
100

where the columns of the Q! matrix are the respective column eigenvectors of matrix
A associated with each eigenvalue.
Combining Eqs. B37 - B40 with Eq. B43
YAI.. It ll 1t12 1t 13 1t 14e -11, CluJ
Y. «21 «22 «23 «24 e -12' Ca+ B44
YAI «31 an «33 a 34e -13, Cia
YoAl a 41 1t42 (143 (144 -1 , Colae •
However, the eigenvectors associated with matrix A are not entirely unique.
Each eigenvector can be multiplied by an arbitrary constant and still be a correct
eigenvector for a given eigenvalue. To satisfy Eqs. B41 and B42, therefore, a unique
multiplying constant must be found for each eigenvector. This can be done by letting
Q!ij', j = 1 - 4, be the elements of the ith normalized column eigenvector of matrix A
and Cii be the required constant such that Q!ij = CiiQ!i/' where Ej Q!i/ = 1 and Cii has
the effect of multiplying the ith column of the Q!' matrix by a constant Cjj • Therefore,
101

where at t = 0
I I I I C ->'1'f/w Cl: 11 Cl: 12 Cl: 13 Cl: 14 11e CluJ
f"I I I I C ->'2'
CoCl: 21 Cl:22 Cl:23 Cl:24 22e+ B45
y. I I I I C ->'3' CIICl: 31 lX]2 Cl:33 a34 33e
yo. I I I I C ->',' COlia 4l lX42 Cl: 43 (14444e
I I I I11:114214 314 41 ell
I I I I4 214nUn 4 u C22
I I I I C4314324334)4 33
I I I I C44441442443444
B46
Eq. B46 can be solved for Cji (i = I, 2, 3, 4), since ()i/ is known, in a manner
similar to Eq. 36.
where ()" is (x' where
C = det I a." III det I a.' I
102
B47
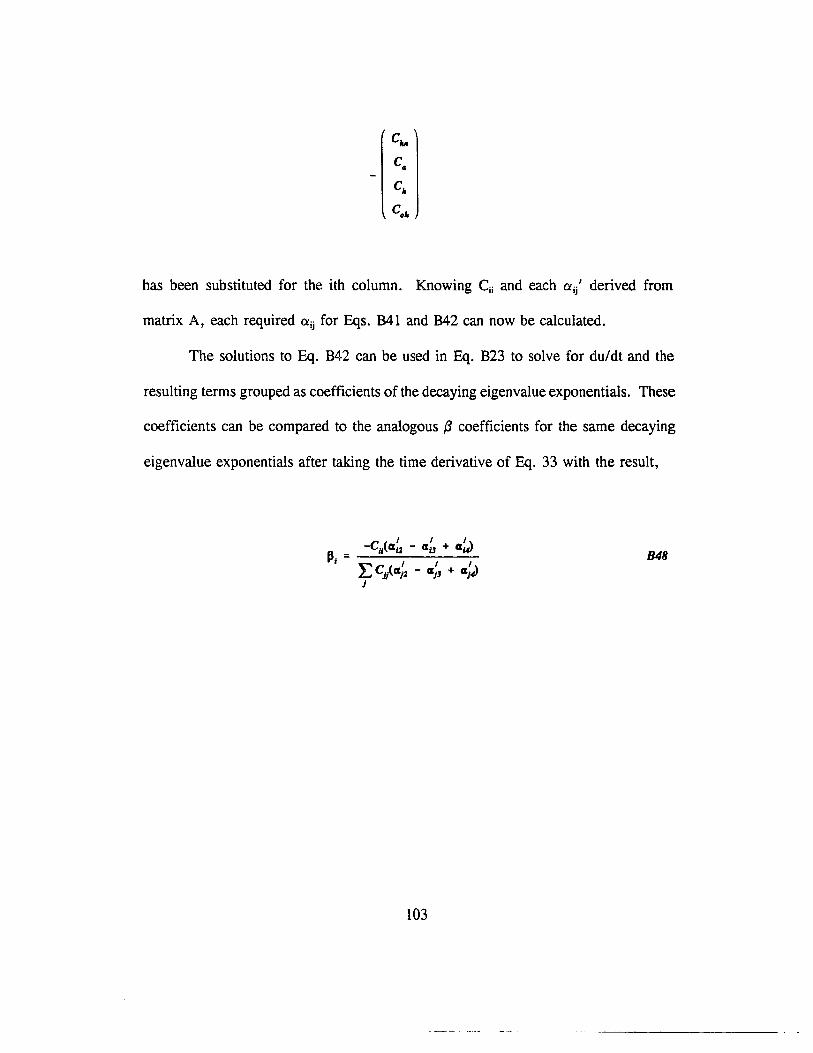
has been substituted for the ith column. Knowing Cjj and each Ol;/ derived from
matrix A, each required Oljj for Eqs. B41 and B42 can now be calculated.
The solutions to Eq. B42 can be used in Eq. B23 to solve for du/dt and the
resulting terms grouped as coefficients of the decaying eigenvalue exponentials. These
coefficients can be compared to the analogous {3 coefficients for the same decaying
eigenvalue exponentials after taking the time derivative of Eq. 33 with the result,
B48
103

Part III
The Conventional Class - 1 Theory
The conventional class - 1 theory was developed by Benz and McLaughlin
(Benz and McLaughlin, 1983) and has become the standard model for analyzing
presumed class - 1 complexes. The approach of Benz and McLaughlin differs
significantly from the approach developed here.
The conventional approach does not include the OR ion. With respect to the
initial differential equations describing the transmembrane transport of class - 1
uncouplers, Eqs. B3 - BIO, then, Eqs. 89 and BIO are excluded. As a result, in Eqs.
B3 - B6, kD and kDD must be set to zero.
The conventional approach also assumes that the reactions characterized by
Eqs. B7 - B8, involving the time derivatives of Nh' and Nh" are fast enough that Nh' -
Nh" = 0, that is, the pH on either side of the membrane never departs from its
equilibrium value. This does not imply, however, that kR and kRR can be otherwise
neglected. Thus their place in Eqs. B3 - B6 must be maintained.
Eqs. B19 and B20 then become
dY" ~A 0--;Ii = kRRY"" - (21" + kR'~"JY" - 2k"N"u
104
B48
849

With the deletion of the equation for dYh/dt, Eq. B2l, u IS no longer a
dependent parameter.
du = b(lt"N" - Jc '1lJ'I.. = - hJc Y - bJc !\TOtIt ". ...•• ' • .. .. ...u BSO
Eqs. B48 - B50 form a complete set of differential equations characterizing the
conventional class - 1 model. In place of Eq. B33 then,
dY/ul
cit -2ku - JcRR Jc~:
-~~][::]dY" ku -21. - k~ B51cit
du 0 -hJc" -hk NO u• •-cit
In the charge pulse method the eigenvalues, A; i = 1 - 3, of the 3x3 matrix in
Eq. B51 are the reciprocal time constants of the presumed time course of u, where
B52
and
105

B53
The amplitudes can be found by first taking the time derivative of Eq. B52 and
comparing it to Eq. 50 at t = 0,
B54
Finally, the second time derivative of Eqs. B52 and B50 can be compared
resulting in
B55
Eqs. B53 - B55 can be solved simultaneously for all the {3's.
Experimentally, it is often the case that kRNhO, kRR > > k", ~a, in other words,
the surface reactions involving the formation or dissociation of HA are very fast
compared to the movement of A- or HA across the interior.
In this case it can be assumed that HA and A reach equilibrium on each side
of the membrane quickly that is N I IN I = N /I IN /I = N 0/N °= 10 (pK· pH) = 'V, 'ha a ha a ho a I'
106

As a result, Eqs. B48 and B49 become dependent equations since now Yha = ",y•.
Let
BS6
Since No = N.' + Nha ' + N." + Nha" it follows immediately, given Eq. B56, that
/I No NovN = - --;
/I 2( 1 + y ) 1 + y
2Noy =--v/I 1 + y
B57
Adding Eqs. B48 and B49 and regrouping the result in terms of v it follows that
l; 1= [
- 2( kG + yk"" )
1 + y
- 2bk..No
1 + y
B58
As before it is assumed that the eigenvalues of the 2x2 matrix in Eq. B58 are
the reciprocal time constants of
B59
107

where
III + ~1 + 1 B60
The time derivative of Eq. B59 can be compared to du/dt part of Eq. B58 at
t = 0 with the result
B61
Eqs. B60 and B61 can be used to solve for 131 and 132,
108

APPENDIX C
CLASS - 2 UNCOUPLERS
Part I
Derivation of Fully Linearized Kinetic Equations for Class - 2 Uncouplers
The basic differential equations describing transmembrane transport of class
2 uncouplers for a weak acid (HA) with its conjugate anion (A-) also includes
reactions involving the dimer AHA" formed from A" and HA.
As with the class - 1 uncoupler surface reactions with respect to H+ and OH
are involved. In addition to Eqs. Bl and B2, H+ and OR" also react with AHA',
where again the respective rate constants are noted to the right.
H+ + AHA - ... 2HA k baba... , k:aba... Cl
OH- + ABA ... 2A - + ~o C2
Also, there is the formation of the dimer by the recombination of A" and HA,
109
---------_. -- -----------------------_.

C3
where k.J has units of S-l and the units for kmM, k2ha , ~Oh' ~aha' and kr are cm2 S-I mol-I.
The complete set of differential equations describing the membrane kinetic
scheme of class - 2 uncouplers becomes, then,
dNfudt: = -kgNfu + k~~ + k~ - kzll'~~ + 2klJaJu!l1P'e. - ~tuP£.Nfu
+ kclfllluJ - k~/..N'. + ktuPf:. - ktuPf,.
dN"114 _ k· N" k· N"N" k N" k N"1\1" 2k N" 1\1" J. N" 7'J"~ - - RR'"''''' + R.... r. + DD.... - Ir'/wr'M + 1I4Jur'1J1wJ"" - ""Vu("""'''''
+ 21 N' 7'J' - k N'7'J' + Ie 1\1' - k N' 7'J' + lc "N" - 1e'7'J'po" IJ1uI' ' or. N1t4" 'a" G .. ' """ j . Iu¥' • G G" a' ' G
dN"__" = k N" - k N"N" - k N" + 1 N"7'J"tit RR'"'1I4 R" .. " DIr'G Ir''''''''''
+ 21e N" 1\1" - 1 7\1"N" + 1 7\1" - kN" N" - lel/N" + k'7'J'poll IJ1wJ' ' .11 ,..".. , G G d" """ r .".. .G G G a' ' ..
dN'~ =" 711' 7\1' - Ie N' 7'J' + k N'1\1' - Ie N ' 7'J'tit "'2W ' ,.". '114 ""'"' alia' ' • rtlfu(' , a' • G ,.,11 IJ1wJ' ' ..11
110
C4
CS
C6
C7
C8

dN"MO = Ie N"7I1" - k 711" 711" + Ie N"N" - 1c N" 711"
tIt 2h4 ..... 'hG /uWI"'ur'" rdha 0.. 10" """"0"
dN"~ = k N" - k NlIN" + k N"N" + k N" Nil
tIt DO" 0 D' ' ..... '." rdIG" ' ... 10""""'Dle
C9
CIO
ClI
C12
C13
where k.wa' and kw" are the rate constants (S·I) associated with the movement of AHA-
across the membrane interior and Naha', Naba" are the surface densities (in moles per
unit area) of AHA.
The transformation Eqs. C4 to Cl3 into a more useful linear form proceeds
in the same manner as in Appendix B with the formation of an additional parameter.
C14
III
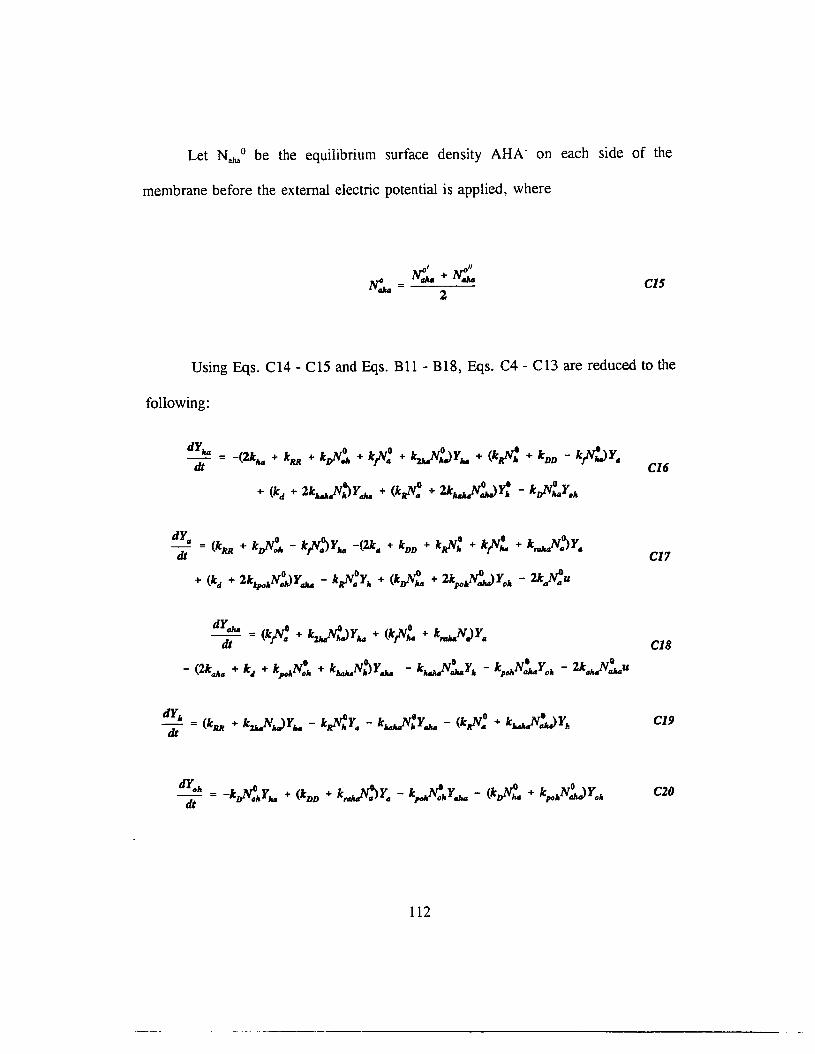
Let Nw0 be the equilibrium surface density AHk on each side of the
membrane before the external electric potential is applied, where
CIS
Using Eqs. C14 - CI5 and Eqs. B11 - BI8, Eqs. C4 - C13 are reduced to the
following:
dYIuJ 0 0 0 . ",t . Art----;u = -(21114 + kM + kr/Y"" + kl'. + ku,.N;)Y,.. + (kR'.' + kDD - kt·;JY.
+ (k4 + 2k~Yw + (k,;v: + 2.k""""N:s.JY: - k~:"YGIl
dY. 0 0,. 0 0 0,.---;Ii = (kRR + kr/Yola - 1c1'.JYIuJ -(2k. + kDD + kJIV. + kll1l4 + 1ctv1uJNiJJY.
+ (kd + 2kq".N~Y... - k,//:Y. + (1c~ + 2kJlO.~.w>YG. - 21c..N:u
d:tJ1I4 =(k~ + ~,.,JYIuJ + (1cI':" + kJ)Y.
dY. . ",0 "... 0.,....--;ji = (kRR + kJ~Y,.. - kR"II Y.. - kw.,J••YOI1I4 - (kJ!l. + kw.,l.;I.jY"
112
CI6
CI7
CI8
CI9
C20
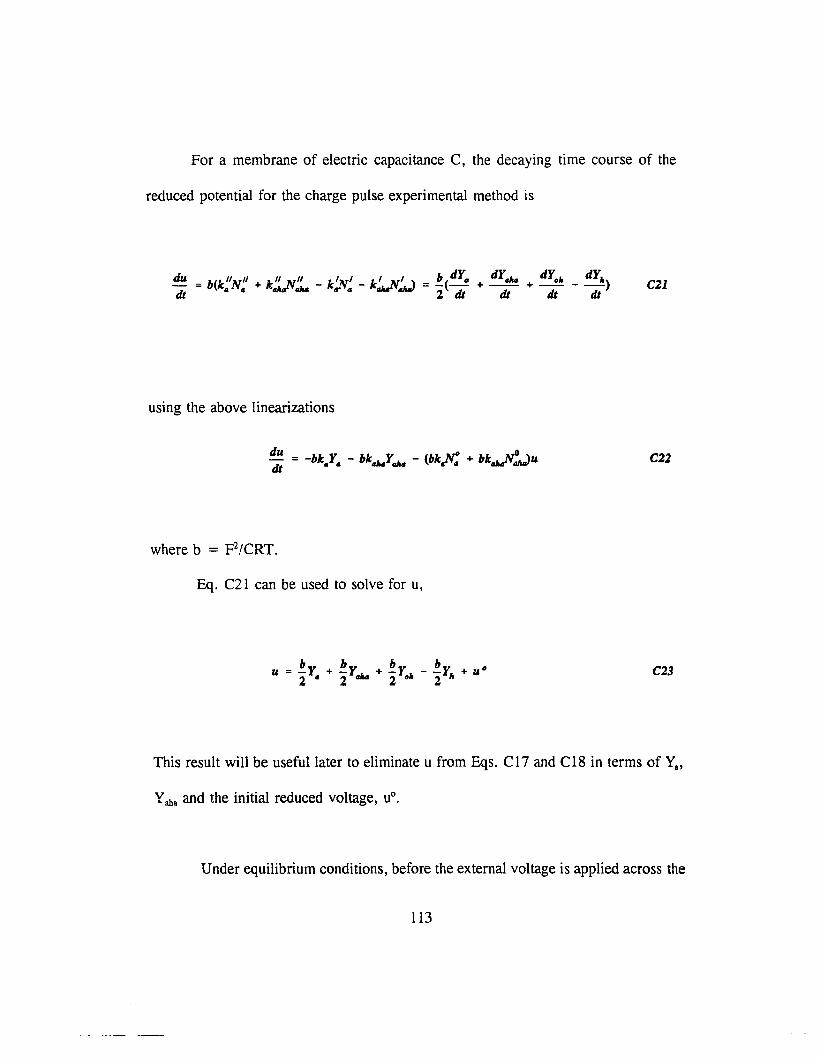
For a membrane of electric capacitance C, the decaying time course of the
reduced potential for the charge pulse experimental method is
d b dY dY dY dY~ = b(k"N" + ,," N'!~_ - ,,'1IJ1 _ k' 1IJ1 \ = _(_'" +~ +~ - _') C21dt "'" ........ '- ,r'," "'Mal 2 dt dt dt dt
using the above linearizations
where b = F2!CRT.
Eq. C21 can be used to solve for u,
u =.!Y + !!..Y_L_ + .!Y L- !!..Y:" + u"2" 2- 2°· 2
C22
C23
This result will be useful later to eliminate u from Eqs. Cl7 and CI8 in terms of VB'
Yaha and the initial reduced voltage, uo.
Under equilibrium conditions, before the external voltage is applied across the
113

membrane, Eqs. C8 - C 13 immediately suggest four boundary conditions. Before the
external voltage is applied across the membrane, N' = Nil, regardless of the specific
surface density in question. Adding Eqs. ClO and Cll, the following result is easily
obtained,
CU
Likewise, adding Eqs. C12 and C13,
C25
Adding Eqs. C8 and C9
C26
Adding Eqs. C4 - C9 after multiplying Eqs. C8 and C9 by 2 the result is
d(2N: + 4~""" + 2N:J-~----==--~ = 0
tit
114
C27

or if No = total HA, A and AHA- adsorbed at t = 0,
C28
Combining Eqs. B30 and C26 with C28, a useful expression for Nao is found
where
C29
As t -+ 00 Eq. C23 becomes,
( ) - biN' Nil I biN' Nil Iu... -"2 a - a 1- +"2 tI1uJ - tI1uJ ,~-
b I I "I -!!.I N' - N," I +u 0+"2 No" - No" 1- 2 " ",-
C30
To the extent UO is equilibrated by the above concentration gradients u( 00) -+
O. Particularly for small voltages, UO < 1, there would be, at least, a large reservoir
of H+ ions. In Part II below, u( 00) is taken to be zero.
115
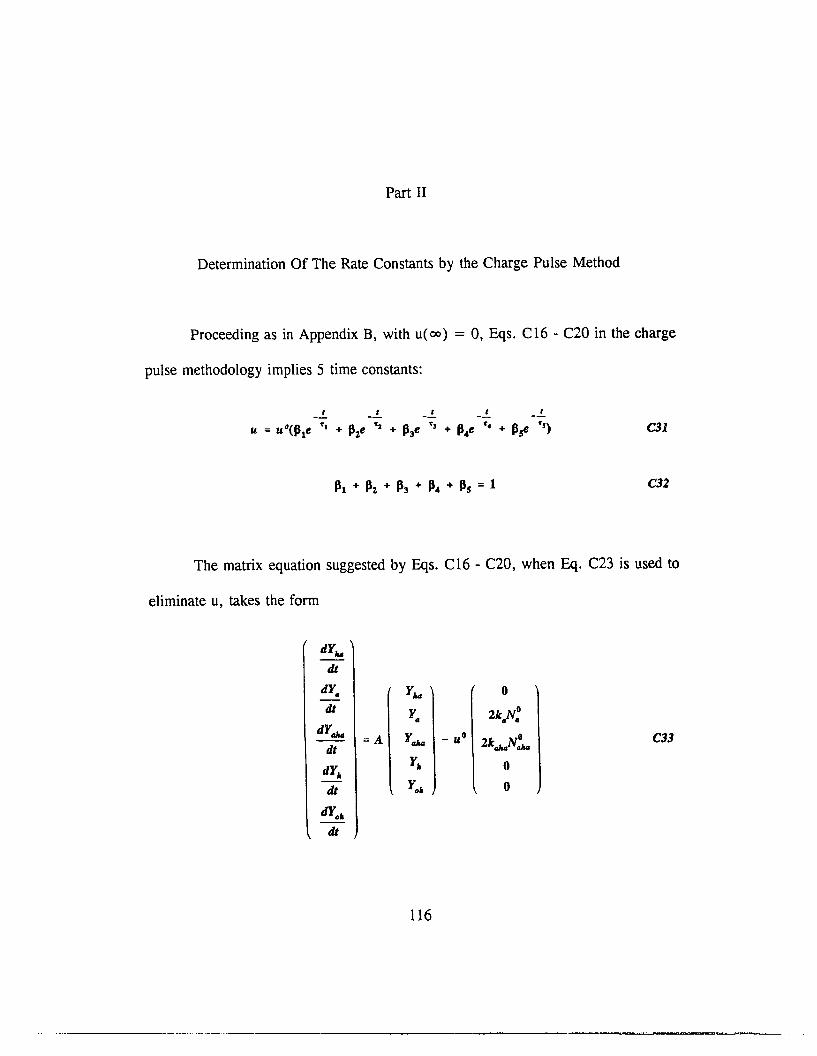
Part II
Determination Of The Rate Constants by the Charge Pulse Method
Proceeding as in Appendix B, with u(oo) = 0, Eqs. C16 - C20 in the charge
pulse methodology implies 5 time constants:
C31
C32
The matrix equation suggested by Eqs. C16 - C20, when Eq. C23 is used to
eliminate u, takes the form
dYIuJtit
dYe YIuJ 0tit y. 2k.l':
dY.=A y..... - U O 0
dt 2kw NduJ
dY"Y" 0
tit Yo" 0
dYo"tit
C33
116
---------_ .._--_._---------------------~-~=~-~~~-

where A is a 5x5 whose columns are shown below,
-21"" - kRR - "~,, - k;V: - k~o 0
k~" + kDD - ";V,..,,~ + 2k,..,..N:
o 0kJ1l. + 2k...,..N.
- ieII':"
(1)
(2)
1e;V. + lczJl:"
1e;V:" + ",.N: -ble~.,..000
-2kw - led - k,..,..N" - "/H"No" - ble.,..N"""
-le~.,.. + k"""N~
-le,o/lN:'" - bk.JI"""
(3)
117

kJUlt. +~-k~
-k~
-k,;v: - k,..Jl:'"o
(4)
kDD +k~
o-kJHANot.
o-koN:' - kpoit~aIH
(5)
The eigenvalue solutions, Ai i = 1-5, to the determinant of A in C33 are, as
in Appendix B, the reciprocal time constants suggested in Eq. C3l, that is, A; = Tj·\.
Finding the associated amplitudes follows the same analogous processes as
were used in Appendix B which utilizes the eigenvectors of matrix A.
The first step is to make a change of variables such that the constant term in
Eq. C33 is eliminated. This is done by solving C33 for Yha' Y" Yaha, Yh and Yoh in
the case where the LHS of the equation is set to zero. This can be done by Gaussian
elimination using determinants,
118

c=detIA'\I det I A I C34
where A' is matrix A with the ith column replaced by the constant term in Eq. C33,
namely,
o2k;V:uo
- 2kG1uJN~uo
oo
and i is, respectively, ha, a, aha, h and oh. The constants Cha, Ca, Ch and Coo imply
a change of variables of the same form, but different value, of course, as found in
Appendix B, Eqs. B37 - B40, respectively, and will not be repeated here. An
additional change of variable is found involving Cw ,
where the primed variable is the new additional variable.
C35
With respect to the new primed variables the constant term in Eq. C33 is
119
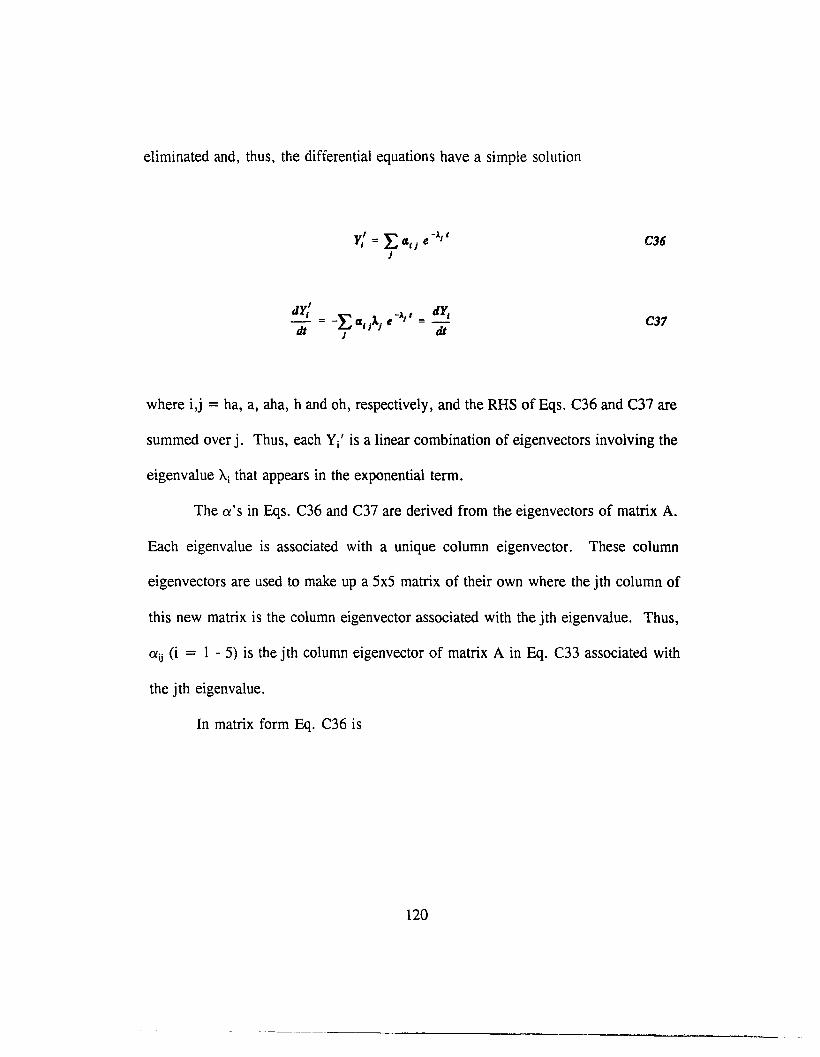
eliminated and, thus, the differential equations have a simple solution
,~ -1 IY, = L t£'J e 1
J
,dY, = _~ t£ 1 e -1,' = dY,dJ T'J 'j tIt
C36
C37
where i,j = ha, a, aha, h and oh, respectively, and the RHS of Eqs. C36 and C37 are
summed over j. Thus, each Y/ is a linear combination of eigenvectors involving the
eigenvalue Ai that appears in the exponential term.
The a's in Eqs. C36 and C37 are derived from the eigenvectors of matrix A.
Each eigenvalue is associated with a unique column eigenvector. These column
eigenvectors are used to make up a 5xS matrix of their own where the jth column of
this new matrix is the column eigenvector associated with the jth eigenvalue. Thus,
O!ij (i = 1 - 5) is the jth column eigenvector of matrix A in Eq. C33 associated with
the jth eigenvalue.
In matrix form Eq. C36 is
120

,y'Ylta 1 IXn 1112 1113 1114 IX1! e -'-I'
y' y' IXl1 112,2 (1:0 (124 4 25e -J.,f• 2
y' y' IX]l 1132 (13] 4 34 IX]! e-~ C37dIM 3
y' y' IX41 1142 4 43 1144 IX45 e -1.'" 4,
Y!1I!1 1152 Cln 1154 IX5! e -lsi
Y."
where the columns of the a matrix are the respective column eigenvectors of matrix
A associated with each eigenvalue.
Combining Eqs. B37 - B40 and Eq. C35 with Eq. C36
Y", 1111 Cl12 1113 IX14 ClUe -lIt C",
y.. "21 0:2,2 IX:o Cl24 Cl25 e -'-I' C..
y...... IX'I Cl32 IX33 (134 (135 e-~ + C...... C39
y" IX41 Cl42 1143 1144 (145 e -11 C"
Yo" IXS1 Cl52 lin (154 IX!! e -1/ Co"
However, the eigenvectors associated with matrix A are not entirely unique.
Each eigenvector can be multiplied by an arbitrary constant and still be a correct
eigenvector for a given eigenvalue. To satisfy Eqs. C36 and C37, therefore, a unique
multiplying constant must be found for each eigenvector. This can be done by letting
ai/ ,j = 1 - 5, be the elements of the ith normalized column eigenvector of matrix A
and Cii be the required constant such that aij = Ciia;/, where Ej ai/ = 1 and C jj has
121

the effect of multiplying the ith column of the ct' matrix by a constant Cjj. Therefore,
I I I I I C -11'
Y""CEll CE12 CE 13 CE14 CE 1S ue
C""
Y..I I I C e-1.I C.CEl1, CEn CE1] CEZ4 CE15 21
Y.... I I I I C e-ly + C.... C40CE31 CE31 CE33 CE34 CE3S 33
Y" I I I I -11 C"CE41 CEu CE4] CE44 CE45 C44e
Yo" I I I I -lsi CO"CE51 CE52 CE53 CE54 CESS Csse
where at t = 0
I I I I ICEll CEI2 CE13 «14 "15 Cll C""
I I I I I Cn C.~I CEn CE1] CEu ~
I I I I I C,3 - C.... C41"31 CE31 CE33 CE34 435
I I I I I C44 C"CE41 CEU 114] 4 44 C1t45I
CO"I I I I I CssCE51 IXS% «53 IX54 CESS
Eq. C41 can be solved for C ij (i = 1, 2, 3, 4, 5), since Cl.i/ is known, in a manner
similar to Eq. C34.
122

where ex" is ex' where
C = det I «/I IU det I fl.' I
C42
has been substituted for the ith column. Knowing Cii and each ex/ derived from
matrix A, each required (Xij for Eqs. C36 and C37 can now be calculated.
The solutions to Eq. C37 can be used in Eq. C21 to solve for du/dt and the
resulting terms grouped as coefficients of the decaying eigenvalue exponentials. These
coefficients can be compared to the analogous {3 coefficients for the same decaying
eigenvalue exponentials after taking the time derivative of Eq. C3l with the result,
C43
123
APPENDIX 0
A. PROTON WIRES
1. Introduction
It has been suggested (Nagle and Tristram-Nagle, 1983; Nagle, 1987) that
thermal fluctuations in bilayer structure cause transient pores to form that are
penetrated by the aqueous bulk phase. The pores have been called 'proton wires'.
The model assumes that there is significant hydrogen bonding between the water
molecules filling the pore. The protons, then, move along the hydrogen bonded
chains (wires) from one side of the membrane to the other.
The following analysis does not deal with the frequency of pore formation or
how long they may endure. It is only assumed that on the average they exist in
sufficient number and for a sufficient time for protons to transport through the pores
as they respond to either proton concentration (pH) differences and/or electrical
potential differences between one side of the membrane and the other. In the case of
a proton wire the interior is not hydrocarbon chains but hydrogen bonded water
molecules.
A further simplification is made that the protons involved in transporting across
the interior are those protons on the adsorption surface and protons diffusing onto the
124

membrane adsorption surface from the bulk aqueous phase are not significant. In this
case, the transport of protons across the membrane interior can be characterized by
two rate constants ~' and kt," where
Dl
D2
Integrating this concept into class - 1 and class - 2 theory two terms are added
to each of the initial differential equations for dNh'/dt and dNh" Idt, namely, kt,'Nh' and
kt,"Nh". Eqs. B7, B8, ClO and Cll become, respectively,
D3
D4
D5
D6
125

The analysis would continue as outlined in Part I of Appendix B and C, respectively,
leading to a new formulation for matrix A, Eq. B35 and C33. This will be outlined
specifically for the class 2 model below.
2. The Proton Wire Model For Class - 2 Uncouplers
For the class - 2 model, using Eqs. D1 - D2 and D5 - D6, and proceeding as
in Appendix C, Eq. C19 becomes
~~ = (ku + lc:J~) Yba - k~Y. - k~Yaba
- (2kb + k.zl~ + k~~) Yb - 2kzll:u
D7
The decaying time course of the reduced potential is altered and C21 is now
~~ = b (k~'N~' + k~~ + k~ - kX - k~~ - k~'N~')
= E. (dY. + dYaba + dYoII _ dYb )
2 dt dt dt dt
and in place of Eq. C22,
dudt = -bk.Y. - bkabaYaba + bkllYb
- (bk.N: + bkJaba - bkzll:) U
126
DB
D9

where, still,
DI0
Using Eqs. D7 - 09 in place of Eqs. C19, C2l and C22, Eq. C33 is altered
dYuCitdY.dt
dYab•
CitdYh
dtdYob
Cit
o2k,p:
- U o 2ku.N:z..
-2k1P~
o
DII
where row 4 in matrix A, Eq. C33, has changed from
to
kl/R+2k2h.zv:. bktP:-k~: bktP: -khab.N:
-2kh -bktP:-k~ -kzwaN:z.1l bk~
DI:l
D13
From here the analysis can proceed as in Part II, Appendix C, specifically for
the charge pulse method with a new rate constant, ~, now included.
127

B. INCLUSION OF H20 - H+ + OR IN THE CLASS - 2 MODEL
Assume that on the adsorption surface of a lipid membrane that the reaction
H20 - H+ + OR is not so fast that it can be neglected. Let the reaction H20 -+ H+
+ OR be characterized by the rate constant kow and the reverse reaction H+ + OH-
-+ H20 be characterized by the rate constant kHoH•
The Eqs. ClO - Cl4 become, respectively,
where [H20] is the bulk concentration of water and thus kDw[H20] is a constant. Eqs.
C19 and C20 become
d1"lJ _ ..yO , ..yO 0dt - (kg + k2.11.-'wlJ.) 1"1l.ta - krWb 1".. - kzw,.aNlJ 1"aba
- (kJ!l~ + kb&/>aN:z... + kBOJ!l~) 1"1.1 - kBOJ!l~ 1"01.1
128
D1B

d:: = -krJI~bYba + (kDD + kr~) y. - kpo~Yaba
- kB~bYb - (krJI:' + kpo1P~. + kBemN~) Yab
D~9
As a result columns 4 and 5 of matrix A, Eq. C33, are now, respectively,
kuN: + ~,..N:'
- kJ!1~
-k~~
-k~: - kb~. - k~~
-kB~
-krll~
km;N~. + kraJJfi:
-kpcdl:b
-k~~b
-krJI:' - kJa/a - k~
where, again, the analysis can proceed as in Part II, Appendix C, specific to the
charge pulse method with a new rate constant kHOH '
129