Mechanics of
138
r P S 8 z- /9?7°</ i U.S. Department of Transportation FederalRailroad Administration Mechanics of Ballast Compaction Volume 4 : Laboratory Investigation of the Effects of Reid Compaction Mechanisms * FRA/ORD-81/16.4 * DOT-TSC-FRA-81-3, IV n 1_ T C T Ctri i^*ti iroc Final Report This document is available March 1982 to the U.S. public through the National Technical C. M. Panuccio Information Service, D. R. McMahon Springfield, Virginia 22161 E. T. Selig vj i 11dv_K oc jiruciures s V
Transcript of Mechanics of
r
P S 8 z - / 9 ? 7 ° < /
i
U.S. Department of TransportationFederal Railroad Administration
M e c h a n ic s o f
B a lla st C o m p a c t io n
Volume 4 : Laboratory Investigation of the Effects of Reid Compaction Mechanisms
* FRA/ORD-81/16.4 * DOT-TSC-FRA-81-3, IV
n 1 _ T C T Ctri i *ti iroc
Final Report This document is available March 1982 to the U.S. public through
the National TechnicalC . M. Panuccio Information Service,D . R. McMahon Springfield, Virginia 22161E. T . Selig
vj i 11 dv_K oc jiruciuressV

NOTICEThis document is disseminated under the sponsorship of the Department of Transportation in the interest of information exchange. The United States Government assumes no liability for its contents or use thereof.
NOTICEThe United States Government does not endorse products or manufacturers. Trade or manufacturers' names appear herein solely because they are considered essential to the object of this report.

Technical Report Documentation Page
1. R ep o rt N o . .
FRA/ORD-81/16.42. G overnm ent A c c e s s io n N o. 3. R e c ip ie n t ’ s C a ta lo g N o.
4. T i t le and S u b tit le
MECHANICS OF BALLAST COMPACTIONVolume 4: Laboratory Investigation of the Effects of
Field Compaction Mechanisms
5. R e p o rt D ate
March 19826 . P e rfo rm in g O rg a n iz a tio n C ode
DTS-7318 . P e rfo rm in g O rg a n iz a tio n R ep o rt N o .
DOT-TSC-FRA-81-3,IV7. Author^ s)
C.M. Panuccio, D.R. McMahon and E.T. Selig9. P e rfo rm in g O rg a n iz a tio n N am e and A d d re ss
Department of Civil Engineering *State University of New York at Buffalo Parker Engineering Building Buffalo NY 14214
10. Work U n it N o . (T R A IS )
RR21Q/R230911. C o n tra c t o r G ra n t N o .
DOT-TSC-111513. T y p e o f R e p o rt and P e r io d C overed
Final Report Jan 76-Sep 79
12. S p o nso rin g A g e n c y fla m e and A d d re ss
U.S. Department of Transportation Federal Railroad Administration Office of Research and Development Washington DC 20590
14. S po nso rin g A g e n c y C odeRRD-1215. S upp lem e n ta ry N o te s U.S. Department of Transportation*Under contract to: Research and Special Programs AdministrationTransportation Systems Center___________________ Cambridge MA 02142______ ;_____________________________16. A b s tra c t
This report describes a preliminary series of laboratory tests which attempt to simulate some of the effects of maintenance procedures and traffic on the physical state of ballast as measured by the ballast density test, plate load test, and lateral tie push test. The first part of the report examines ballast compaction with a commercial vibratory plate. The second part considers manual tie tamping. The third part investigates the effect of cyclic loading of ballast with a surface plate, which represents plates on crib and shoulder compaction machines. Vibratory compaction and traffic were shown to be effective means of compacting ballast. However, more research is needed to quantify the effects of the controlling variables.
This report is Volume 4 of the Final Report on the subject contract.
17. K ey Words
Ballast, compaction, density, bearing test, lateral tie push test, tamping, trackbed
18. D is tr ib u t io n S ta tem ent
D O C U M E N T IS A V A I L A B L E T O TH E T H R O U G H T H E N A T I O N A L T E C H N IN F O R M A T IO N S E R V IC E . SPRINGF V IR G IN IA 22161
U.S. PUBLIC C A L E L D , •
19. S e c u rity C la s s if . (o f th is re p o rt)
Unclassified20. S e c u rity C la s s if . (o f th is page)
Unclassified21» N o. o f P ages
13622. P r ic e
Form DOT F 1700.7 ( 8 - 7 2 ) R e p r o d u c t io n o f c o m p le te d p a g e a u th o r iz e d
\

PREFACE
This report describes a laboratory investigation of ballast physical state changes associated with simulated field compaction techniques. The work is part of a contract to evaluate ballast compaction and recommend guidelines for using compaction to improve track performance. This study was conducted by the Research Foundation of the State University of New York at Buffalo (SUNYAB) under contract to the U.S. Department of Transportation, Transportation Systems Center, in Cambridge, Massachusetts, sponsored by the U.S. Department of Transportation, Federal Railroad Administration, Office of Research. The contract number was DOT/ TSC/1115. The technical monitor was Andrew Sluz.
Principal Investigator for the study was Ernest T. Selig, Professor of Civil Engineering at SUNYAB. Technical direction of the work described in this report was also provided by Carmen M. Panuccio, Research Engineer. The laboratory work was principally the responsibility of Donald R. McMahon, who was a Graduate Research Assistant at SUNYAB during this part of the research. Help in conducting the laboratory tests was provided by C. A. Thomas, Undergraduate Research .Assistant, and H. E. Stewart, Graduate Research Assistant. Technical advice on instrumentation and measurement techniques was provided by B. C. Dorwart and J. I. Johnson, Graduate Research Assistants.
iii

AT
A p p io i im a l a C o n v a r t i o n t to M a t i i c M a a a u ia s
_ Sya*al W kaa Y « i K i m M ultiply ky T a Fla k l i a k t l
L E N G T H
in inches •2.B cantimataro cmft loot 30 cantimatars cmyd yards 0.9 matars mmi miles 1.9 kilometers km
A R E A
in1 square Inches 6.6 squara cantimatars cm3tlJ iq u ir i foot 0.09 squara matars m2VdJ square yards o.a squara matars m2mi2 - sq uirt mi Its 2.6 squara kilometers km2
tcro t 0.4 bactaras ha
M A S S ( w t i g h t )
OX ounces 29 grams 0lb pounds 0.46 kilograms kg
abort tons 0.9 tannas t(2000 lb)
V O L U M E
tap Itatpo ont 6 milliliters mlTbsp tabltspoont. 16 m illiliter* ml<1 ox fluid ouncas 30 m illilitsre mlc cups 0.24 titers 1P« pints 0.47 liters 1qt quarts 0.96 liters 1O *1 gallons 3.9 liters 1ft3 cubic leal 0.03 cubic'maters m2yd1 cubic yards 0.76 cubic maters m3
T E M P E R A T U R E ( • « « e l |
°F Fahrenheit 6/9 (aftar Celsius “ ctemperature subtracting
32)tsnperature
M <n * 2.54 t t . ic t ly j . Fiw u ine i exact convey* ioi>b and nxxe d u tiile O tab les , see NBS M isc . Publ. 286.U nits o l Weights tnd Measures. Puce $2.26 . SD C atalog No. C 13.$0:286.
• 1
METRIC CONVERSION FACTORS<0 COre A p p i o i i n i l i C t a u a u i a a i f r a a i M a U i c M a a m i a t
C4M S yaik al M a llip ly k y T a f i a t S y a t a l
NL E N G T H
a1 mm miltimelere 0.04 indie* In
cm cantimatavt 0.4 inches in\ m matera ) . i last ft
•a m matars 1 .1 yards ydkm kilcmatara 0.9 milea mi
A R E A
cm2 aquara cantimatars. 0.19 square inches I . 1m m2 squsrs mstsrs 1 .2 equate yards Yd!km2 squars kilomatara 9.9 aquara miles mi2'■+H ha haclaraa 110.000 m2) 2.6 seres
e» MASS Iwiahtl• grains 0.036 ouncas 01kg kilograms 1 .2 pounds lb1 tonnaa (1000 kg) 1 .1 short Ions
o•4V O L U M E
a»ml m illiliters 0.03 fluid ouncas fl oa
M 1 litsrs 2 .1 pints pt1 liters 1 .M quarts qt1m*
litsrscubic matars
0.2936
gallons cubic last
gotft2
m* cubic matars 1 .3 cubic yards«a
u> T E M P E R A T U R E ( • l a d 1
« • c Celsius 9/6 (than Fahrenheit * Ftemperature add 32) temperature
• FCO • F 32 99.9 212
- 4 0 0 1 4 0 • ° 1 120 190 200 1- 4r 1 f * I T — 1 1 * T — 1 f t 1
- 4 0• C
- 2 0 6 2 0 |40 37
SO 90 i6o• c
< t

ADDITIONAL CONVERSION FACTORS
TO CONVERT
Units Symbollength in.
ftarea ,. 2. sq xn. (in. )
sq ft. (ft )
force(weight)
b lb
pressure lb/sq in. (psi)
pressure/length lb/cu in. (pci)
volume cu ft (ft3)
density lb/ft3 (pcf)
From To Multiply By Symbolinchesfeet
milliQietersmeters
25.40.305
ram
msquareinches
squarecentimeters
6.45 2cm
squarefeet
squaremeters
0.0929 2m
pounds newtons 4.45 N
poundspersquareinch
kilonewtons per square meter
6.89 kN/m^
poundspercubicinch
meganewtons per 0.2716 cubic meter
3MN/m
cubicfeet
cubic meters 0.03 3m
poundspercubicfoot
megagrams per cubic meter
0.016 Mg/m3
v/vi

TABLE OF CONTENTS
Section Page
1. INTRODUCTION2. COMPACTION CONSIDERATIONS
2.1 Current Methods of Measurement2.2 Old Trackbed and Manual Tie Tamping2.3 Crib Compaction Apparatus
3. INVESTIGATION OF SIMULATED TRACKBED3.1 Apparatus and Procedures3.2 Test Results3.3 Comparison with Field Data
4. INVESTIGATION OF MANUAL TIE TAMPING .4.1 Apparatus and Procedures4.2 Test Results4.3 Comparison with Field Data
5. INVESTIGATION OF CRIB COMPACTION PLATE5.1 Apparatus and Procedures5.2 Test Results5.3 Comparison with Field Data
6. SUMMARY AND CONCLUSIONS '6.1 Simulated Trackbed6.2 Manual Tie Tamping6.3 Crib Compaction Plate REFERENCES
APPENDIX A - REPORT OF NEW TECHNOLOGY
1668
102222293537374263686875107112112113114 119 121
vii

Figure Page2.1 TYPICAL BALLAST CRIB AND SHOULDER COM- 11
PACTION MACHINE (REF. 9)2.2 SCHEMATIC DIAGRAM OF THE LOCATION AND SIZE 13
OF BAiLAST CRIB AND SHOULDER COMPACTIONPLATES
2.3 , BALLAST AREA INFLUENCED BY SINGLE CRIB COM- 20PACTION PLATE
3.1 SCHEMATIC DIAGRAM OF LARGE TEST BOX (REF. 1) 233.2 GRADATION CURVE FOR CRUSHED LIMESTONE BAL- 24
LAST3.3 ILLUSTRATION OF WATER REPLACEMENT APPARATUS 27
SET UP FOR BALLAST DENSITY TEST (REF. 1)3.4 ASSEMBLED PLATE LOAD TEST APPARATUS (REF. 1) ■ 283.5 RELATIONSHIP BETWEEN BALLAST DENSITY AND NUMBER 31
OF COMPACTOR PASSES FOR A SIMULATED TRACK BED3.6 RELATIONSHIP BETWEEN STRENGTH AND NUMBER OF COM- 32
PACTOR PASSES FOR A SIMULATED TRACK BED3.7 STRENGTH-DENSITY RELATIONSHIP FOR THE SIMULATED 34
TRACK BED4.1 ASSEMBLED LATERAL TIE PUSH TEST APPARATUS (REF. 1) 404.2 TYPICAL LTPT LOAD-DISPLACEMENT CURVES 454.3 THE EFFECT OF THE HEIGHT OF A TAMPING RAISE ON ' 49
LATERAL TIE RESISTANCE4.4 RELATIONSHIP BETWEEN LATERAL TIE RESISTANCE ON A 52
COMPACTED BASE WITH NO SHOULDER BALLAST AND CRIB, DEPTH
4.5 THE EFFECT OF AN OVERFILLED CRIB ON LATERAL TIE RES.IS- 54 TANCE FOR A COMPACTED BASE AND' NO SHOULDER
LIST OF ILLUSTRATIONS
viii
o
Figure Page
4.6 RELATIONSHIP BETWEEN LATERAL TIE RESISTANCE 56 ON A COMPACTED BASE WITH NO CRIB OR SHOULDER BALLAST AND TIE WEIGHT Q
4.7 0BALLAST DENSITY FOR DIFFERENT TAMPING RAISES AND 57 BALLAST PLACEMENT CONDITIONS
4.8 BALLAST BEARING INDEX AT 0.2 IN.-(5.1 MM) DEFOR- 60 MATION FOR DIFFERENT TAMPING RAISES AND BALLAST PLACEMENT CONDITIONS
4.9 . COMPARISON OF LTPT DATA AFTER TAMPING 625.1 SCHEMATIC DIAGRAM OF THE TEST SETUP 695.2 SCHEMATIC DIAGRAM OF PLATE LOAD TEST (PLT) APPAR- 76
ATUS SETUP5.3 TYPICAL LOAD-DISPLACEMENT CURVE FOR CRIB COMPACTION 79
PLATE WITH DEFINITION OF TERMS5.4 RELATIONSHIP BETWEEN MEAN STATIC LOAD AND STATIC 81
DEFORMATION IN THE SMALL TEST BOX5.5 STATIC DEFORMATION AS A FUNCTION OF INITIAL BOX 83
DENSITY FOR 12 IN. LAYER DEPTH IN SMALL TEST BOX5.6 TYPICAL CUMULATIVE CYCLIC DEFORMATION-CYCLES OF 85
LOADING RELATIONSHIPS AT FREQUENCY = 1/2 HZ IN SMALL TEST BOX FOR 12-IN. (0.305 M) BALLAST DEPTH
5.7 THE EFFECT OF VARIOUS STATIC AND CYCLIC LOADING 88 CONDITIONS ON CUMULATIVE CYCLIC DEFORMATION
5.8 THE EFFECT OF VARIOUS LOADING CONDITIONS AND CYCLES 91. OF LOADING ON BALLAST DENSITY
5.9 THE EFFECT OF VARIOUS LOADING CONDITIONS AND.CYCLES 92 OF LOADING ON THE BALLAST BEARING INDEX AT 0.2 IN.(5.1 MM) DEFORMATION
5.10 THE RELATIONSHIP BETWEEN BALLAST BEARING INDEX AT 94 0.2 IN. (5.1 MM) DEFORMATION AND LOAD RATIO FOR VARIOUS STATIC LOAD RATIOS
ix

Figure page5.11 THE RELATIONSHIP BETWEEN CUMULATIVE CXCLIC DEFOR- 96
MATION AND LOAD RATIO FOR DIFFERENT BALLAST DEPTHS5.12 THE RELATIONSHIPS BETWEEN THE CYCLIC COMPONENT OF 97
DEFORMATION AND BALLAST DEPTH5.13 THE EFFECT OF BALLAST DEPTH ON THE BALLAST BEARING 99
INDEX AFTER 300 CYCLES OF LOADING5.14 THE RELATIONSHIP BETWEEN CUMULATIVE CYCLIC DEFOR- 101
• MATION AND LOAD RATIO FOR DIFFERENT LATERAL BOUNDARY EFFECTS
5.15 THE EFFECT OF TEST BOX SIZE ON THE BALLAST BEARING 103 INDEX AFTER 300 CYCLES OF LOADING
5.16 THE RELATIONSHIP BETWEEN CUMULATIVE CYCLIC DEFOR- 105 MATION AND LOAD RATIO FOR VARIOUS FREQUENCIES .
5.17 THE EFFECT OF FREQUENCY ON THE BALLAST BEARING INDEX ■ 106 AFTER 300 CYCLES OF LOADING
x

LIST OF TABLES
2.1 CHARACTERISTICS OF BALLAST CRIB AND SHOULDER 14COMPACTION EQUIPMENT
4.1 TEST PROGRAM FOR MANUAL TIE TAMPING IN CRUSHED 43LIMESTONE BALLAST
4.2 COMPARISON OF BALLAST PHYSICAL STATE TEST DATA 645.1 LOW FREQUENCY TESTS FOR SINGLE OSCILLATING PLATE 77
ON LIMESTONE BALLAST5.2 BEST FITTING EQUATIONS FOR CUMULATIVE CYCLIC DEFOR- 86
MATION VS. CYCLES OF LOADING
Table Page
xi
BBI = Ballast Bearing Index, psi
BBI„ = Modified Ballast Bearing Index, pci K
BDT = Ballast Density Test
CCD = Cumulative Cyclic Deformation, in.
CNR = Canadian National Railroad
DCDT = Direct Current Displacement Transducer
Er = Elastic Recovery, %
f = frequency, Hz
FAST = Facility for Accelerated Service Testing; Pueblo, Colorado
ICG = Illinois Central Gulf Railroad
ISL = Initial Static Load or tie resistance at zero in. tie displacement, lb
LR = Load Ratio of cyclic load to static load
LTPT = Lateral Tie Push or Pull Test
LVDT = Linear Variable Differential Transducer
MGT = Million Gross Tons
MTS = Materials Testing System
PLT = Plate Load Test
SLR = Load Ratio of Static Load to 1490 lb (6631 N)
USCS = Unified Soil Classification System
x = Number of cycles
y = Cumulative cyclic deformation, in.
Ap = Total or peak displacement per cycle in inches
A = Rebould displacement per cycle after complete unloading in inches R----£— - —Cye-l-i-e—s train, percent---------------------------- -------:
Y = correlation coefficient xy
LIST OF ABBREVIATIONS AND SYMBOLSAASHTO = American Association of State Highway and Transportation Officials

EXECUTIVE SUMMARY
The first part of this report describes an investigation of tamping
and compaction of ballast using laboratory-simulated field conditions. A'
track bed was constructed in the laboratory and tie tamping and compaction
operations were performed in order to ej&mine the effects on the resulting
physical state of the ballast. The ballast physical state was measured
using the three in-situ tests developed at SUNYAB. These were the plate
load test (PLT), which measures vertical ballast stiffness, the ballast den
sity test (BDT), and the lateral tie push test (LTPT), which measures the
resistance offered by the ballast to an individual tie displaced laterally.
In general, tamping machinery is used for track maintenance work, while ties
are manually tamped only for spot work. However, all of the tie tamping in
this project was performed manually, because mechanical tamping equipment
could not be used in the laboratory.
Simulation of a railroad track ballast bed that has been conditioned by
traffic, but which has not been recently subjected to maintenance operations,
was attempted in the laboratory by filling a large test box with a 12-in.-
(0.305-m-) thick layer of limestone ballast and compacting it with a vibra
tory plate compactor. An increase in ballast density of about 12 pcf from
the loose state was observed after only 25 to 50 passes with the vibratory com
pactor. Most of the ballast bearing stiffness increase occurred within approxi
mately 500 passes of the vibratory plate compactor. The laboratory ballast
density and stiffness values after 1000 compactor passes compared favorably
well with field test results for a track bed after long periods of traffic.
Several lateral tie push tests were performed when a standard railroadtie was placed on the compacted bed with no crib or shoulder, and the effects
xiii
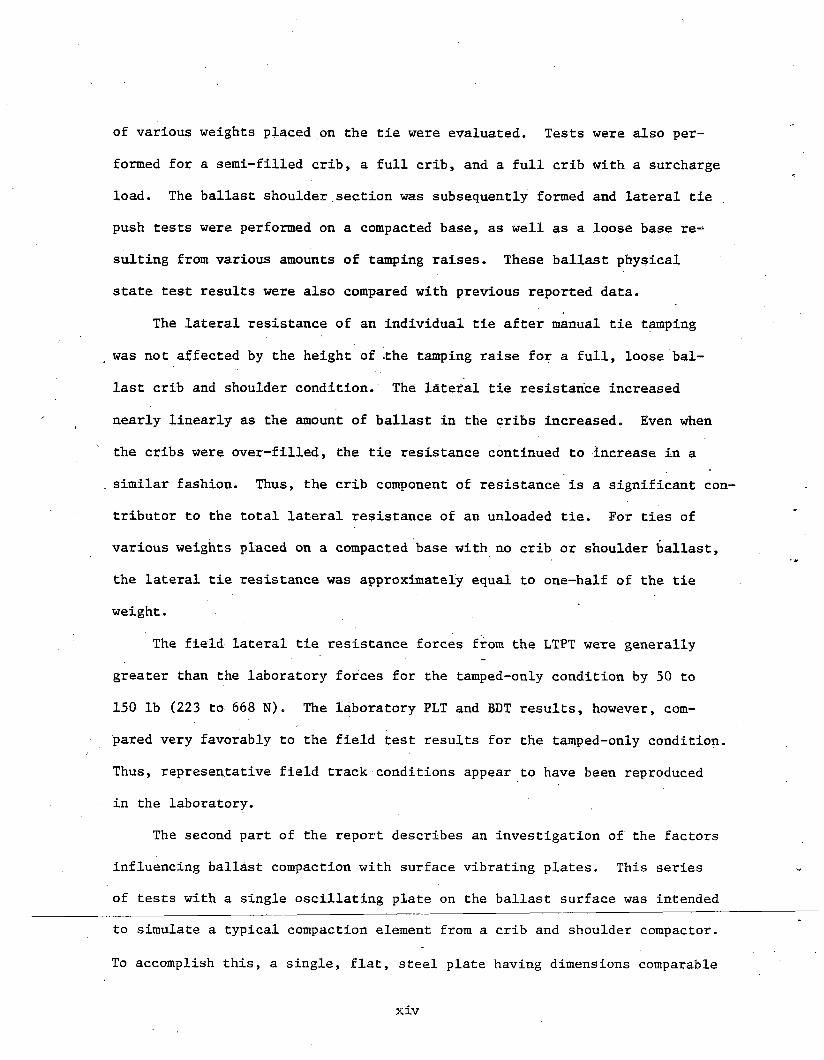
of various weights placed on the tie were evaluated. Tests were also per
formed for a semi-filled crib, a full crib, and a full crib with a surcharge
load. The ballast shoulder section was subsequently formed and lateral tie
push tests were performed on a compacted base, as well as a loose base re
sulting from various amounts of tamping raises. These ballast physical
state test results were also compared with previous reported data.
The lateral resistance of an individual tie after manual tie tamping
was not affected by the height of .the tamping raise for a full, loose bal
last crib and shoulder condition. The lateral tie resistance increased
nearly linearly as the amount of ballast in the cribs increased. Even when
the cribs were over-filled, the tie resistance continued to increase in a
similar fashion. Thus, the crib component of resistance is a significant con
tributor to the total lateral resistance of an unloaded tie. For ties of
various weights placed on a compacted base with no crib or shoulder ballast,
the lateral tie resistance was approximately equal to one-half of the tie
weight.
The field lateral tie resistance forces from the LTPT were generally
greater than the laboratory forces for the tamped-only condition by 50 to
150 lb (223 to 668 N). The laboratory PLT and BDT results, however, com
pared very favorably to the field test results for the tamped-only condition.
Thus, representative field track conditions appear to have been reproduced
in the laboratory.
The second part of the report describes an investigation of the factors
influencing ballast compaction with surface vibrating plates. This series
of tests with a single oscillating plate on the ballast surface was intended
to simulate a typical compaction element from a crib and shoulder compactor.
To accomplish this, a single, flat, steel plate having dimensions comparable
xiv

to those for ballast compactors was fabricated and attached to a cyclic load
actuator. The plate was first loaded statically. Then an alternating load
was applied at a low enough frequency to eliminate vibration. The load-dis
placement response was recorded for a loose, crushed limestone ballast in
small test boxes under controlled loading conditions. The effects of the
following factors on the compaction of ballast were investigated: 1) magni
tude of static load, 2) magnitude of cyclic load, 3) ballast depth, 4) cycles
of loading, 5)' frequency, and 6) lateral boundary effects. In addition, BDT
and PLT tests were performed on the compacted zone after the required number
of loading cycles was achieved. These two physical state tests permit a com
parison with field experience.
The cumulative cyclic deformation (settlement) of the plate increased as
the ratio of cyclic to static load was increased for a given static load. The
cumulative cyclic deformation also increased as the static load increased for
a constant ratio of cyclic to static load. The ballast density increased by
only about 3 pcf from the loose state after application of 300 load cycles.
The final density state appeared to be independent of the loading conditions.
The plate bearing stiffness value at a given deformation increased as the sta
tic load was increased for a given ratio of .cyclic to static load. Similarly,
as the ratio of cyclic to static load was increased for a given static load,
the bearing stiffness increased. When the sample ballast depth was decreased,
both the static deformation and the cumulative cyclic deformation decreased.
When the lateral boundary constraints of the box were removed by using a larger
box, the deformations increased for a given set of loading conditions, but
the amount of compaction was essentially unchanged. Within the frequency
range of 0.1 to 2 Hz, the ballast physical state resulting from compaction
with the oscillating plate was essentially independent of frequency.
xv
The physical state for the loose ballast condition in the lab prior to
compaction with the oscillating plate was comparable to the observed physical
state in the field under two conditions. These conditions were under the cen
ter of the tie after reballasting and in the crib near the rail after tamping.
However, the ballast stiffness in the crib after crib compaction in the field
was much greater than that achieved in any of the lab tests. The conclusion
was drawn that the vibration effects from the high frequency used in the
field contributed significantly to the amount of compaction achieved by an
oscillating plate.
xvi

1. INTRODUCTION
The track system response is directly affected by the physical
state of the ballast material within the track bed. Changes in the
physical state, as well as track geometry, are primarily attributed to
train traffic loading conditions, environmental influences (such as tem
perature and weather), and track maintenance operations. These features
have a profound impact upon the ballast state with regard to vertical
track stiffness and lateral track stability.
-The first two factors are time dependent, and consequently an
interactive effect is induced upon the ballast behavior, such that iso
lation and quantification of either variable is difficult to assess.
However, track maintenance is a relatively short term condition, which
easily provides for measurement of the changes in the ballast state with
respect to different maintenance practices.
One such maintenance practice commonly used to rectify track geo
metry irregularities resulting from train loadings is an out-of-face
surfacing and lining operation which utilizes a ballast tamping-leveling-
lining machine. This operation generally requires raising the track [1
in. (25.4 mm) to 3 in. (76.2 mm)] and subsequently leaves the ballast
in the cribs and under the ties in a rather loose and unstable state as
compared to a dense state from traffic-induced compaction. Slow orders
are usually initiated in order to minimize the possibility of lateral
track buckling. Traffic can proceed at normal operating speeds once a
sufficient amount of tonnage has passed and the track has achieved a
stable condition.
1

However, while the lateral resistance to track buckling increases
with traffic, a progressive deterioration of track geometry also simul
taneously occurs.. When track line, surface and change in cross level
approach intolerable limits, then damage to the track system, components
of the train, and to the transported goods results. Also, a reduction in
train speed is required to prevent possible derailments. Thus, another
out-of-face surfacing and lining operation is necessary, and the process
is repeated.
The addition of ballast crib and shoulder compaction machines to
normal track maintenance operations supposedly reduces the number of slow
orders, lengthens cycle times for major track maintenance, and initially
increases track stability. This machine follows the ballast tamping-
leveling-lining machine and densifies the ballast in the crib zones near
the rails and on the shoulder. Limited use of these compaction machines
has been made in the United States and, thus, the implications on the
long-term effects of extending the time for programmed track maintenance
cycles and increased track stability are not well established.
In addition, different ballast compaction machines possess signi
ficantly different characteristics, which compound an evaluation of their
effectiveness in compacting ballast. These characteristics include the
size, shape and location of the crib and shoulder plates, the static down
pressure, the generated force, and the application time.
The compacted state of the ballast in the cribs and under the tie
is changed by three different processes: 1) tamping, 2) crib and shoulder
compaction, and 3) train traffic. Only a limited amount of reliable field
2
data are available, and laboratory data are nonexistent to quantify the
differences in ballast physical state caused by these compaction processes.
The objective of this current research is the laboratory simulation
of the three field compaction processes previously mentioned. A simulated
used track bed was constructed and tie tamping operations were performed
upon a typical track structure in order to examine the resulting physical
state of the ballast. In addition, the effects of crib compaction on
the ballast state were also investigated. Where applicable, the changes
in the ballast physical state were evaluated using three in-situ tests
developed at SUNYAB, which have been described by Selig, et al. (Ref. 1).
These tests are the plate load test (PLl) which measures vertical ballast
stiffness, the ballast density test (BDT), and the lateral tie push test
(LTPT) which measures the resistance offered by the ballast to an individual
tie displaced laterally.
Since the ballast in an old track bed is compacted in the center
of the track as well as in the area under the rails, it was decided that
the entire track bed should be compacted. The simulated track bed for
the present study was formed by running a vibratory plate compactor over
a 12-in. (0.305-m) deep layer of limestone ballast in a large test box.
At certain intervals during the compaction, ballast density tests and
plate load tests were performed in an effort to determine the degree of
compaction achieved. The results of these tests are analyzed in Section
3 and compared to related field test results in order to evaluate the
effectiveness of this compaction technique.
In addition to creating a simulated track bed, the laboratory test
3

track section was also subjected to a tamping operation. In everyday practice
of railroad maintenance operations, two methods are available by which ties
can be tamped. One method is by mechanical means and the other is manual.
A discussion of the specifications of different types of mechanical tampers
and details of the tamping operation are provided by Selig, et al. (Ref. 2).
In general, tamping machinery is used for large scale track rehabilitation
work,while ties are manually tamped only on small track work jobs. The major
advantages in using a mechanical tamper over manual tamping are that mechan
ical tamping 1) is much faster, and 2) provides more uniform tamping from
tie to tie. However, all of the tie tamping in this project was performed
manually, since it is more easily adaptable to laboratory conditions. The
effectiveness of this tamping procedure was evaluated by the LTPT, PLT, and
BDT and compared to available field data in^Section 4.
Since very little is known about the effectiveness of ballast compaction
machines, an investigation of the factors influencing this method of ballast
compaction was conducted. Vibrating compaction plates placed on the crib
surface are the principal means in densifying the ballast. Thus, the
simplest approach is a simulation of a single crib compaction plate on a
volume of ballast equivalent to that which would be compacted in the crib
by one plate.
A single flat steel plate having dimensions comparable to those in the
reviewed specification sheets of ballast compactors (Ref. 2) was fabricated
and attached to a structural cyclic load actuator. The load-displacement
response was recorded for a loose crushed limestone ballast in small test
-boxes— under con.tro±Ted~Ioadd_TTg~conditions. The effects of the toiiowmg
4

fa-ctors on the compaction of ballast were investigated: 1) magnitude of
static load, .2) magnitude of cyclic load, .3) ballast depth, 4) cycles
of loading, 5) frequency, and 6) lateral boundary effects. In addition,
BDT and PLT tests were performed on the compacted zone after the required
number of loading cycles was achieved. These two physical state tests are
\ the only available methods by which comparison can be made to field data
and, thus, infer the reliability of this laboratory simulation. The results
of this investigation are presented in Section 5.
5
2. COMPACTION CONSIDERATIONS
2.1 CURRENT METHODS OF MEASUREMENT
The key element affecting track system response is the changes in the
physical state of the ballast material with respect to tamping, crib and
shoulder compaction, and train traffic. The changes in ballast state are*most commonly measured by single and panel section lateral tie pull or push
tests (LTPT). This method is at best only an indirect indicator of the
ballast state, since the resistance is a function of the amount of ballast-
tie interaction. However, this test is directly relevant in determining
the availability of lateral tie resistance to prevent track buckling.
For the LTPT on individual ties, the spikes, tie plates and rail anchors
are removed from the tie. Then by using the rails as a reaction, the load
required to move the tie a certain distance in a direction perpendicular
to the rails is measured.
Panel section tests encompass the same basic testing technique. In
stead, a short segment of track consisting of several ties spiked to the rails
is detached from the main track. The" rails are of equal length and usually
cut in the same crib. A yoke is attached to one rail at the center of the
panel section. The total force required to move the panel section is
measured, and the resulting displacement of each tie is recorded. This method
is. favored over the single tie test because the rail-tie-ballast interaction
is believed to more closely duplicate the actual lateral resistance of track
to buckling.
SUNYAB has been actively involved with ballast physical state changes
obtained from single lateral tie push tests. A laboratory evaluation of
6

the factors affecting lateral tie resistance was conducted by Ciolko (Ref.
3). Panuccio and Dorwart (Ref. 4) correlate field LTPT results with train
traffic loading and track maintenance operations. In the latter case, the
tamping and crib and shoulder compaction operations are emphasized.
The SUNYAB in-situ ballast density test (BDT) and the plate load test
(PLT) methods are believed to be direct measures of the ballast physical
state and presently the most effective and reliable means of evaluating
the amount of ballast compaction. Laboratory evaluations were performed
by Chen (Ref. 5) for the BDT and by Wayne (Ref. 6) for the PLT. Panuccio
and Dorwart (Ref. 4) and Yoo (Ref. 7) correlate field test results for the
PLT and BDT, respectively.
The in-situ ballast density test essentially measures the density of
a small, volume of material at specific locations in the crib or under the
tie. This basic method involves excavating of a hole approximately 7 in.
(178 mm) in diameter and 5 in. (127 mm) deep, lining with a flexible membrane^
and measuring the volume of water required to fill the hole. The weight of
the excavated ballast material is measured and the density computed. This
technique has been referred to as the water replacement method and is a
direct measure of the amount of compaction.
The plate load test is performed at the same test locations as the
density test. This test involves the static loading of a 5-ini (127 mm)-diameter
rigid plate and simultaneously measuring the deformation resulting from
that loading. This method gives a relative measure of the ballast stiffness
and of the effect of compaction on the ballast physical state.
7
The preceding discussion of SUNYAB's ballast physical state tests was
presented in capsule form, however, further discussion will ensue in the
following chapter. The details of the final test apparatus and test pro
cedures for the lateral tie push test, the in-situ ballast density test,
and the plate load test are described by Selig, et al. (Ref. 1).
2.2 OLD TRACKBED AND MANUAL TIE TAMPING
Immediately after track lining and surfacing, i.e. , raising and tamping,
the ballast in the cribs, on the shoulders and under the ties is in the
loosest physical state that exists for field conditions. As traffic passes
over a section of recently surfaced track, the track structure slowly settles
The track bed ballast, as well as the surrounding crib and shoulder ballast,
densifies and obtains varying degrees of stiffness. In a relative sense,
the ballast achieves its most stable condition immediately before the track
is subjected to another out-of-face maintenance operation.
For the ballast located directly underneath the tie, i.e., the track
bed, a smooth surface is formed at the tie-ballast interface. This smooth
surface is the product of traffic loading, which causes a high degree of
ballast particle interlocking and mechanical degradation of the ballast
particles. Thus, if a tie was carefully removed from an old track structure,
i.e., one that has been subjected to several million gross tons (MGT) of
traffic since its last maintenance cycle, the ballast surface under the tie
would be very smooth and the crib ballast would be compacted to such a state
that it would almost remain in place.
From the previous discussion, the ballast at,a given location in the
track structure attains two distinctly different states of compaction. One
8
condition occurs with the tamping operation while another condition is achieved
with the application of several MGT of train traffic. The ballast under the
tie in the track bed will undoubtably demonstrate the greatest differences
in stiffness and density for the two conditions.
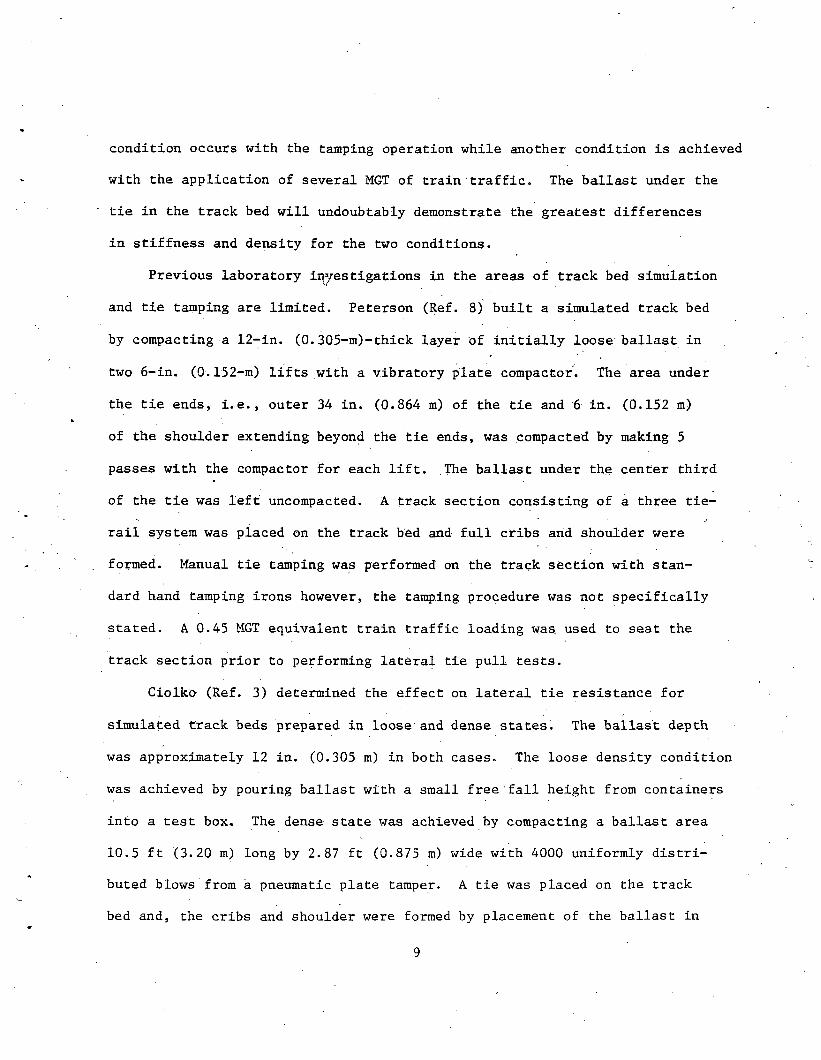
Previous laboratory investigations in the areas of track bed simulation
and tie tamping are limited. Peterson (Ref. 8) built a simulated track bed
by compacting a 12-in. (0.305-m)-thick layer of initially loose ballast in
two 6-in. (0.152-m) lifts with a vibratory plate compactor. The area under
the tie ends, i.e., outer 34 in. (0.864 m) of the tie and 6 in. (0.152 m)
of the shoulder extending beyond the tie ends, was compacted by making 5
passes with the compactor for each lift. The ballast under the center third
of the tie was left uncompacted. A track section consisting of a three tie-
rail system was placed on the track bed and full cribs and shoulder were
formed. Manual tie tamping was performed on the track section with stan
dard hand tamping irons however, the tamping procedure was not specifically
stated. A 0.45 MGT equivalent train traffic loading was used to seat the
track section prior to performing lateral tie pull tests.
Ciolko (Ref. 3) determined the effect on lateral tie resistance for
simulated track beds prepared in loose and dense states. The ballast depth
was approximately 12 in. (0.305 m) in both cases. The loose density condition
was achieved by pouring ballast with a small free fall height from containers
into a test box. The dense state was achieved by compacting a ballast area
10.5 ft (3.20 m) long by 2.87 ft (0.875 m) wide with 4000 uniformly distri
buted blows from a pneumatic plate tamper. A tie was placed on the track
bed and, the cribs and shoulder were formed by placement of the ballast in
9

a loose state. No tie tamping per se was performed prior to testing.
These two previous laboratory investigations apparently attempted to
achieve and evaluate only relatively different ballast physical state con
ditions ,both in the crib and under the tie, which were probably sufficient
for their purposes. However, to more effectively simulate field conditions,
such as the common tie tamping procedure performed on a highly trafficked
or compacted track bed, the laboratory sample preparations must closely
duplicate the resulting field ballast physical states for proper evaluation.
It is these objectives that this current study will attempt to fulfill.
Ciolko's (Ref. 3) large test box,designed to represent a section of a
typical track stucture,was available and the same crushed limestone ballast
was used, provides the required laboratory apparatus and materials. In
addition, a vibratory plate compactor was employed as a.means to quickly
and effectively achieve the compacted track bed condition. Manual tie
tamping was accomplished with the standard track tools and the recom
mended field procedure. The BDT, the PLT, and the LTPT, were also available to
evaluate the simulated field conditions.
2.3 CRIB COMPACTION APPARATUS
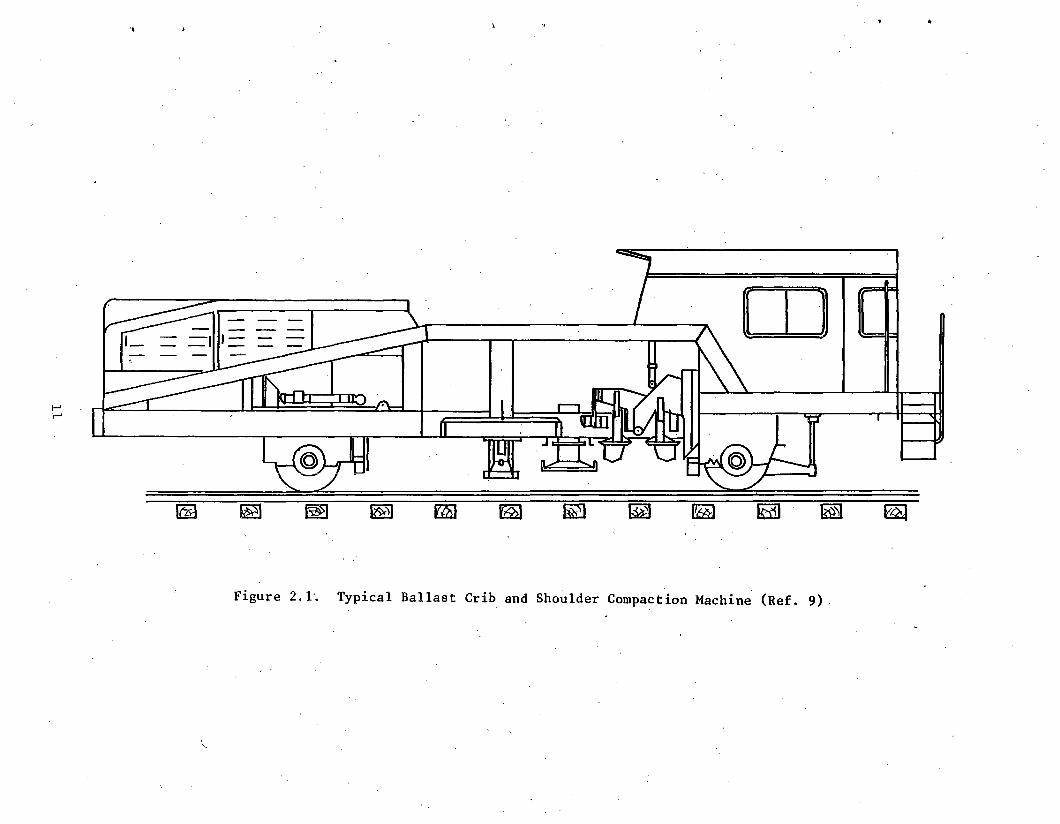
Characteristics of Field Equipment. Ballast compactors (Fig. 2.1),
when used, are the final operation in programmed track maintenance after
lining-leveling and tamping. Generally, a set of eight crib compaction
plates compact the ballast in the- same crib area as the tamping tools.
The center of the plates both inside and outside the rails in the crib are
located 9 in. (229 mm) to 11 in. (279 mm) from the rail centerline. Simul-
taneously, another longer pair of compaction plates, with or without an10
ESI
Figure 2.1. Typical Ballast Crib and Shoulder Compaction Machine (Ref. 9)

attached shoulder pressure plate, compacts the ballast at the tie end or on
the shoulder (Fig. 2.2).
The compaction plates are initially set into vibration, hydraulically
lowered onto the ballast until a predetermined static down pressure is
achieved, vibrated for a preset application time, and then raised. The op
erator then positions the crib compaction plates over the next tie and the
cycle is repeated automatically.
Each compaction plate generates two components of force to the ballast.
The first is a hydraulically applied static load. The second is a cyclic
load induced by the vibratory motors. Vibrating motors of the crib, shoulder,
or tie end compaction plates are one of two types (Ref. 10):
1) a rotating eccentric mass producing a constant generated dynamic force at a given frequency, or
2) an eccentric shaft producing a constant amplitude of oscillation.An adequate comparison of the two methods is prohibited, since reliable
field measurements of the relative degree of ballast compaction are not
available.
The available manufacturer's specifications on ballast crib and shoulder
compaction equipment are shown in Table 2.1. Included are characteristics
of the compacting plates, such as type, shape, and size, range of application
or cycle time, frequency of vibration, as well as the rated static and
dynamic forces. Major differences in equipment occur with the type and out
puts of the vibratory motors. The reliability of the rated dynamic force
is questionable, since this value depends upon the physical state of the
-ballast—and— the -subsequent--in-terae-t-ion -w-i-frh—the—compac ting—plates-;-------------
12

a) CROSS - SECTIONAL VIEW •
b) TOP VIEW
Figure 2.2. Schematic Diagram of the Location and Size of Ballast Crib and Shoulder Compaction Plates
13

Table 2.1. Characteristics of Ballast Crib and ShoulderCompaction Equipment
Crib ComDaction PlatesReference Manufacturer ModelNumber Application Time (Sec.) Frequency f (Hz ) Size Sated Force (lb)Static Dynamic
9 PlasserandTheurer VDM800U Variable1-15 38.5 114.7 in2 1729 110111 Plasser-Amerlcan VDM800R Variable 1-20 Used 3 35-38 -6 in. x 12 in. — —12 Plasser VDM800 VariabieT 38.5+ 9. 8 in. x 8.5 in. — —
13 Plasser'andTheurer CPM800R Variablet 38.5 -10 in. Length — —14 Plasser-American CPM800R VariabieT 38.5 14 in. x 8-7/8 in. -• —15 Plasser-American CPM8Q0 VariabieT 3 and 5 Used . 38.8 14.5 in. x 5.5 in. 1250 1600
10 PlasserandTheurerMainlinerUniversal06-16CTM VariabieT 38.5 =10 in. T Length — —
13 PlasserandTheurer.Windhoff903 SW Used 3 - — —
10 S, 12 Windhoff 3V 102 Variablet Used 4-8 48
BV 102S Variablet 43BV 103' _ Variablet 48FD 41 Variable2-20 48
15 Tamper CSC Variable —11 Tamper CSC 1-9 Used 3-4 -53.3
16 Macisa D-912 Variable 0 - 10 50
D-912R,D-9 VariabieT0-10 ■ 50+
17 Macisa — 3-20 46.7
]_7 Penn Caticrai VariabieTw/Jackson Vib— —racorsJackson ““ - ~ 20
10.25 in- x 9.4 in.
~12 in.x 7-1/2 in. —
3 in. x 10 in-
3 i n .--------------------- 2 7 5x 12 in.
2203+
22032203-i-1542-3745
0-5500
0-5500+2200-3750
-6900--
Assumed
14

Table 2.1. Characteristics of Ballast Crib and ShoulderCompaction Equipment (continued)
Tie End or Shoulder Compaction PlatesModel Frequency Rated Force (lb)Ref erence Number f(Hz.) Size Shape Static Dynamic9 VDM800U 35 52.8 in. x 9.3 in. Flat 2203 2423
35 51.2 in. Flat 2203 1729x 7.9 in.= 6 ft11 . VDM800R 35-38 . in. length Flat
12 VDM800 35t 57.1 in. x 7.9 in. Flat ■ — —
13 ' CPM800R 35t 4.5 ft. x 8 in. Flat — —
14 CPM800R 35t 4.5 ft x 8 in. Flat — —
15 CPM800 24.5 85 in. x 3 in. Flat 1500 1700
10 Mainliner 35i 4.5 ft. Flat — —
-Universal 06-16 CTM . - x 3 in.
13 903 SW — — — -- —iO 4 12 BV102 48 53.2 in. x 12.6 in. Flat 2203+
3V102S 48 Flat ~ 2203+3V103 48 ” Flat — . 2203+FD 41 — -- — ~ —
16 CSC — — —■ — —11 CSC =53.3 =5 ft.in Flat — —length16 D-912 50 _ ' Flat __ 0-6600, D-912R, D-9 50 + " Flatt 0-660017 Matisa 46.7 — Flat — 3300-550117 Penn Central . 72 13 in. _ ___
v/Jackson 7ib- x 13 in.racors17 Jackson 60-75 24 in. x 36.5 in.* Tie End Acts on a Horizontal Shoulder Section, Shoulder Acts on the Sloped Shoulder Section “* Assumed
15
The manufacturer’s literature on ballast compactors suggesteu cne fol
lowing major advantages for use of this machine in conjunction with normal
track maintenance operations:
1. Increase in the lifetime of cross level, line, and surface, and
thus maintenance intervals. ¥
2. Reduction in the number of loose ties; which are a cause of track
deterioration, increased rail end wear, and increased rail failures. '
3. Reduction in the number of slow orders after compaction compared to
after tamping only.
4. Compaction plates deliver uniform force to the ballast; therefore,
uniform compaction, track resistance, and settlement.
5. Under the tie, compaction increases vertical track stiffness and
provides a uniform bearing surface (pressure distribution) which is less
likely to deteriorate than after tamping alone.
6. Increase in lateral and longitudinal track resistance and track
stability, both immediately and long term.
7. Vibrating frequency is equal to frequency of ballast, thus obtaining
optimum compaction, i.e., increase in ballast density.
However, Powell (Ref. 18) reports that crib and shoulder compaction
is effective in increasing the lateral resistance after tamping, only if
a sufficient amount of ballast is present in the crib, i.e., a full crib.
Some of the other listed items also are questionable.
The benefits listed indicate that track structure will respond more
favorably for the short and long term conditions with the use of crib and____
16

shoulder compaction following tamping than with tamping only. These findings
are primarily supported by European studies, which from available published
literature apparently lack sufficient quantities of reliable experimental
data. Also, the implication that the same benefits would be derived on
American railroads is misleading, since existing axle loads, track structures
and track maintenance practices are distinctly different from those in Europe
Laboratory Representation.' In the summary of available manufacturers’
literature on ballast compaction machines in Table 2.1, emphasis was con
centrated upon the characteristic features of the compaction plate equipment.
The compiled data indicated the range of variables to be considered in
designing the laboratory simulation of a single crib oscillating plate.
The first factors to be determined for the crib plate were represen
tative cross-sectional dimensions and ballast surface contact shape. The
plate shapes illustrated in Table 2.1 are composed of the three following
types: 1) a V-shape with a large or small apex angle located either in
the center or offset from the center of the plate, 2) a flat plate with
flared ends, and 3) a spherical shape with a large or small radius of cur
vature. Experimental data regarding the effectiveness of plate shape on
the compaction of ballast are nonexistent. Therefore, the conventional
flat crib plate was selected for this study.
Since the crib plate shape was determined, the physical dimensions of
the plate were taken into consideration next. From Table 2.1, the plate
lengths varied from 10 to 14.5 in. (0.254 to 0.369 m) , and the {!>late widths
varied from 5.5 to 9.4. in. (140 mm to 239 mm). The plate areas ranged from
80 to 115 in.^ (0.052 m^ to 0.074 m^). However, the plate widths and areas
17

are assumed to be cross-sectional features of the plate and probably smaller
than the actual widths and areas which come into contact with the crib bal
last- An evaluation of all available data produced a reasonable estimate
of equivalent flat crib plate contact area to be 116 in. (0.075 m ). This
value is close to the single crib compaction plate area of a Plasser and
Theurer VDM 800 U. For this plate area, reasonable estimates of the plate
length and width for use in this study were 14.5 in. (0.368 m) and 8 in.
(0.203 m) , respectively. These dimensions were also very close to those
measured on the FRA ballast compactor at the FAST site in Pueblo, Colorado.
That machine was a Plasser-American CPM 800 R with plate dimensions of 14
in. (0.356 m) by 8-7/8 in. (0.225 m )[Ref. 14].
The next factors taken into consideration were the magnitudes of the
applied static and cyclic loads per crib compaction plate. The reported
values from Table 2.1 were 275 to 1729 lb (1224 to 7694N) for static load
and 1101 to 6900 lb (4899 to 30,705 N) for single amplitude cyclic load.
However, an uncertainty exists as to the methods used to obtain these rated
load values. Thus, the effect of these variables on the compaction of bal
last must be thoroughly examined. The Plasser and Theurer VDM 800 U does
appear to have reasonable values of static load, i.e., 1729 lb (7694 N),
and cyclic load, i.e., 1101 lb (4899 N), when the weight of the machine is
considered.
The final characteristics to be considered for the crib plate are the
frequency and application time for the cyclic load. Operating frequencies
of 38.5 to 75 Hz and application times of 3 to 5 seconds are common. For
these conditions, the range of an equivalent number of loading cycles would
18

be from 116 to 375. Since the structural load actuator used in this study
is capable of applying cyclic loads at low frequencies only, i.e., less than
2 Hz, field frequencies and application times will be simulated for an equiv
alent number of loading cycles, rather than frequency and time. For this
study, 300 cycles was considered a realistic estimate. The assumption was
also made that the cyclic load could reasonably be represented by a sine
wave loading function.
Given the size of the crib compaction plate, the equivalent volume of
ballast material affected by the crib plate must be determined. This con
dition is illustrated in Fig. 2.3 for a 22-in. (0.559-m) tie spacing and a
full ballast crib. Both the lateral boundaries and depths for in the crib
and- under the tie have been assumed to be representative of field conditions.
The ballast depth under the base of the tie was assumed equal to a depth
which would be disturbed, by insertion of the tamping tools. Thus, a likely
choice for a ballast depth is 12 in. (0.305 m). Since the effective depth
over which the compaction plate acts is not known, several tests will be
performed with ballast depth as a variable.
The crib plate definitely affects the ballast within the crib zone and
somewhat underneath the tie. Based on a 5-in. (0.13-m) depth under the tie,
an equivalent surface area was obtained by proportioning the volumes of
material within the crib zone and under the tie. The computed surface area2 ?was approximately 362 and 410 in. (0.234 and 0.264 m ) for tie spacings of
20 and 22 in. CO.508 and 0.559 m), respectively. Thus, a test chamber,
which is 20 in. (0.508 m) square and 12 in. (0.305 m) deep, was considered
representative of an equivalent volume of ballast affected by a single crib
19
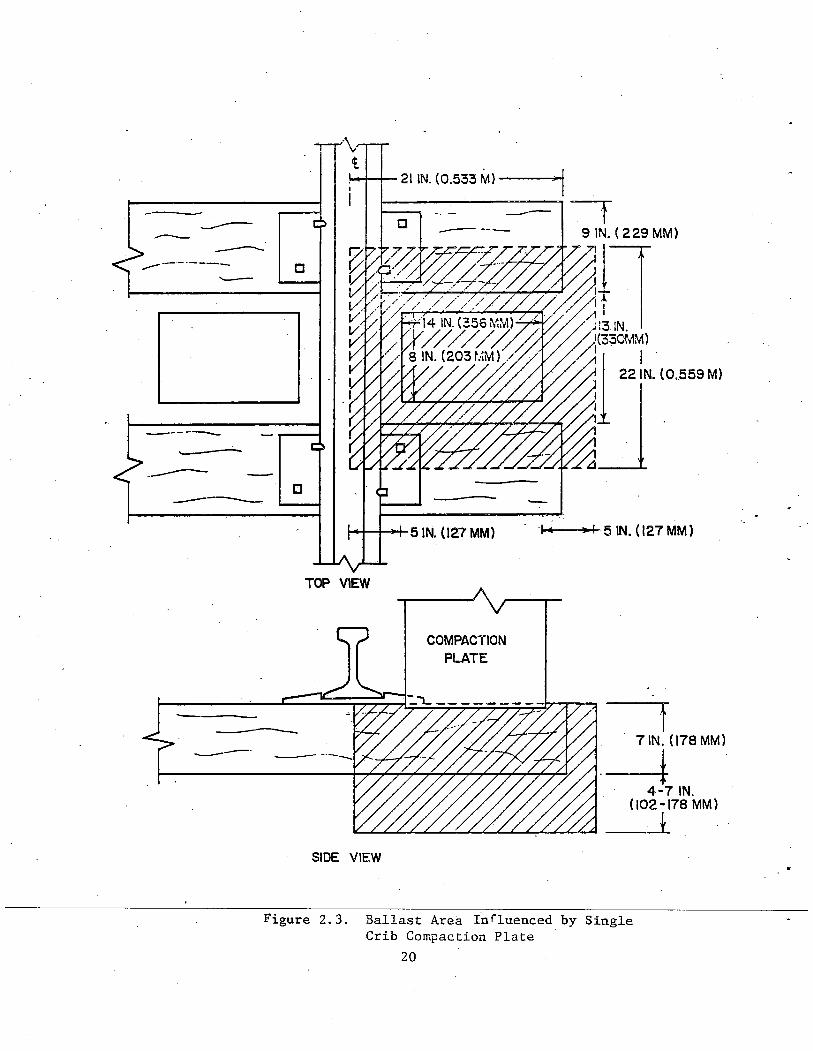
Figure 2.3. Ballast Area Influenced by Single Crib Compaction Plate
20

compaction plate. Since the 20-in. by 20-in. (0.508-m) box would have
relatively rigid sides, testing in a larger box will be considered in order
to identify the differences in lateral boundary conditions.
The ballast material selected for this study is a uniformly-graded,
crushed limestone. This appears to be a common material used for railroader
ballast on U.S. track. Also, since the tamping tools leave the crib bal
last near the rails in a loose state, test specimens will be prepared ini
tially at a loose density.
Each of the previously mentioned factors will have an effect on the
amount of compaction the ballast material has achieved with the crib com
paction plate. In order to identify the changes in physical state, the
plate load and in-situ ballast density tests will be utilized.
21

3. INVESTIGATION OF SIMULATED TRACKBED3.1 APPARATUS AND PROCEDURES
Test Box. A schematic diagram of the large test box used is the same
as that reported by Ciolko (Ref. 3) and is shown in Fig. 3.1. The box is
constructed of 3/4 in. (19.1 mm) and 1/2 in. (12.7,mm) plywood and is rein
forced by 2 in. by 2 in. (50.8 by 50.8 mm) steel angle iron. Two steel A-
frames are attached to each side of the test box and are located in such a
position that placement of the two 6 ft (1.83 m)-long 132 RE rails will
set the rails into proper track gage.
3allast Materials Tested. The. ballast material selected for testing
was the same crushed limestone used by Ciolko (Ref. 3). The limestone,
obtained from local quarries, was classified in the USCS system as GP, by
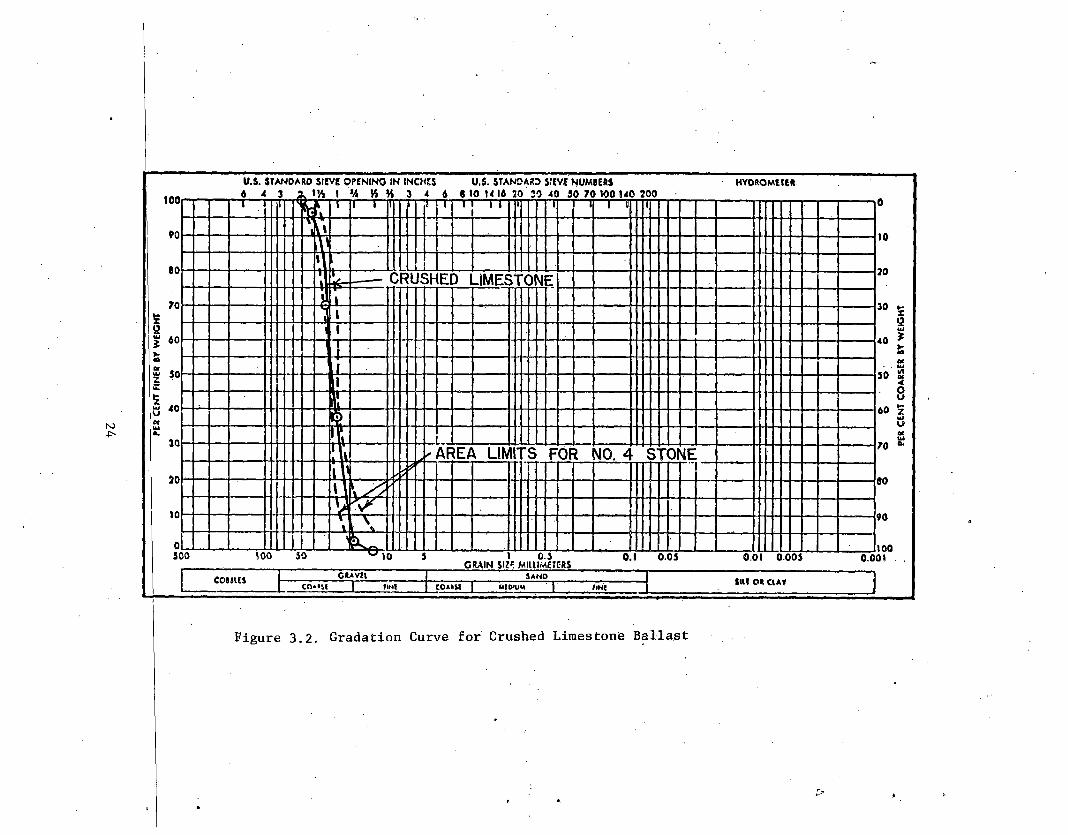
AASHTO as Al, and by AREA as No. 4. The gradation curve is shown in Fig.
3.2, along with AREA specification limits on the No. 4 stone. The particle
shape was angular with a specific gravity of 2.7 and absorption of 0.4%.
Sample Preparation Technique. In this study, the ballast was first
prepared for the simulated track bed test series. The resulting ballast -
physical state would provide a suitable track bed condition for the ensuing
ballast preparation techniques used in the manual tie tamping series, in
Chapter IV. However, the sample preparation techniques for the two test
series will be discussed separately.
Ballast was shovelled into the test box for a full 12-in. (305-mm)
depth leaving it in a loose condition. The initial ballast physical state
and its variability along the entire track bed was expected to primarily
"aftect the Initial rate of change of the physical state properties with the
22

MU)
Figure 3.1. Schematic Diagram of Large Test Box (Ref. 1)
hO■P-
U.S. STANOA 6 A 3 2R0 SIEVE OPENING IN INCHES U.S. STANDARD SIEVE NUMBERS HYDROMETER k * f t l M K H 3 4 6 8 10 14 16 20 30 40 50 70 100 140 200
90
80
70£o£ 80V80a2 30 cw ioOexUi4. 10
20100
T rii i i r n 1 i 1 0
103030 £ OUI40 *
aex . wso 2 * 0 o60 zUiUatui70 “• 80
90irtrt
1\\\\11tl\\1 — - c USH E D LIMESTON 1l|j) 14 1I •’ i i-
_1Li\ijir*jSt% ' AREA LIM TS FOR NO. 4 S’rONE4 fi \y V\ r \
1J00 100 50 '“'10 5 CRAIN SIZ* 0.5 0.1 0.05 0.01 0.005 MIlllMETERS 0.001 .coitus guvii SAND HU OR CIA*CO»IU | (IHt COMSI 1 MID'L/W 1 (INC
Figure 3.2. Gradation Curve for Crushed Limestone Ballast
o
amount of applied compaction effort, but not the final "stabilized" con
dition achieved after large amounts of compaction. Prior to compaction,
rubber mats were placed on top of the ballast over the entire track bed.
These rubber mats served: to prevent the ballast particles from "bouncing"
out of the ^ed during vibratory compaction, and to prevent particle degrad-¥
ation. The simulated track bed was then created with 1000 passes from the
vibratory plate compactor over the entire length of the test box.
Vibratory Plate Compactor. The mechanical compactor used to prepare
the simulated track bed is a portable vibratory plate compactor, model S-50,
manufactured by Stone Construction Equipment, Inc. (Ref. 19). The steel
base plate dimensions are 3/8 in. (9.53 mm) thick by 24 in. (0.61 m) in.
width and 21 in. (0.53 m) in length. At operating speed with the clutch
engaged, the engine rotates an eccentric shaft which causes the base plate
to vibrate. The rotation propels the machine forward, as well as imparting
a compaction force to the ballast. The manufacturers' specifications
(Ref. 19) rate the operating frequency at 83.3 Hz and the generated dynamic
force at 5000 lb (22.3 kN).
Test Procedures and Program. After the ballast was initially prepared
in a loose density state by the previously described technique, the vibratory
plate compactor was used to compact the ballast. At certain intervals during
the compaction process, ballast density tests and plate load tests were
performed in order to monitor the changes in physical state of the ballast.
The individual locations of these tests were selected such that the
following requirements were fulfilled: 1) all tests were performed in the
center zone of the compacted track bed, 2) at a given number of passes, the
25
(
BDT's and PLT's were spaced at sufficient distances apart so as not to inter
fere with an adjacent test, and 3) after the completion of next successive
series of compactor passes, BDT's and PLT's were performed at locations which
would not have been influenced by previous testing. The plaster of paris
used for the PLT and BDT was removed from tlv* track bed at the completion
of a test, and the resulting void was filled with fresh ballast.
The BDT apparatus (Fig. 3.3) consisted of a 7.5 in. (191 mm) inside
diameter surface ring 6 in. (152 mm) high with top and bottom plates, a
thin flexible rubber membrane, and a micrometer point gage. The circumfer-
ence of the test hole is initially stabilized with a plaster of paris mix
ture to prevent the ballast particles from caving into the hole during exca
vation. A water volume measuring device (not shown) is used in conjunction
with the point gage to measure the volume of"water required to replace the
volume of excavated ballast material. The head of water within the surface
ring is sufficient to conform the membrane to the ballast surface in the
sampling hole both before and after excavation. The ballast density is
calculated by dividing the weight of the excavated ballast by the volume of
the hole.
The primary components of the PLT loading system (Fig. 3.4) were a
20-ton (178 kN) capacity hydraulic load jack connected to a hand pump and
an electronic load transducer. The latter was a four-arm bridge strain
gage type load cell having a 10-ton (89-kN) capacity. The load cell is
rigidly fixed and coaxially aligned with the moving head of the hydraulic
load jack, and thus both provide direct measures of the applied load. The
load cell output signal was connected to an X-Y recorder.
The deformation system is- comprised, of a direct current displacement
transducer (DCDT) and a dial indicator which are also in coaxial arrangement.
26

TOPSECTION
BOTTOMSECTION
MICROMETER POINT GAUGE
CLAMP
O-RINGSEAL
^ UNDISTURBED BALLAST
RUBBERLINER
Figure 3.3. Illustration of Water Replacement Apparatus Set Up for Ballast Density Test- (Ref. 1)
27

ho00
ST R U C T U R A L LOAD
FR A M E
P L T H YD RAU LIC JA C K A S S E M B L Y
o•ii!li !!• o
J J ’//r , f k
> I )
ex >6oo5obooboo<>oo6bDooc»Dooc c?oi>oiQO&OOQ QOoOOdoO&CkOOOQONO TE '. SHOULDER AND
T IE REM OVED FROM
TH IS END
DEFORMATION SU PPO R T SY S T E M
LOAD BEARING P L A T E ON P L A S T E R -1
OF PARIS
-HYDRAULIC LOAD JACK ATTACH ED TO HYDRAULIC HAND PUMP
RAIL C LA M Pat
•jgocOOOoOoOoO^WOOD TIE (REM O VED )
>3a’c>ooQ'ooo‘c>w=>'c>De>ooc>5c)s5'!SZ>J5b4" S P A C ER FO R UNDER T IE T E S T
LOAD C E L L
D IS PLA C EM EN T REFERENCE BLOCK
D.C.D.T. AND DIAL INDICATOR
Figure 3.4. Assembled Plate Load Test Apparatus (Ref. 1)
z>

The DCDT is powered by a 6 volt battery and is also connected to the X-Yrecorder. The deformation system is mounted on a modified camera tripodequipped with a displacement lever arm. The lever arm is inserted into aslot in the deformation reference block, which is seated on the 5-in. (127-mm) diancster 1-in. (25.4-mm) thick steel bearing plate. The bearing plate
* *is initially set in a level position on a thin layer of plaster of paris.
. The hydraulic hand pump was used to displace the load jack piston and . subsequently the plate such that the rate of deformation was about 0.25 in. (6.4 mm) per minute until a deformation of 0.3 in. (7.6 mm) was reached.At this point, the jack pressure was then released to unload the plate.This loading process was repeated a maximum of five times in the. same manner except that the test was stopped at the peak load achieved during the first loading cycle rather than at'0.3 in. (7.6 mm) deformation.
From the recorded results for each plate test, the parameter Ballast Bearing Index (BBI) was determined. The BBI is equal to the plate load at0.1, 0.2 or 0.3 in. (2.5, 5.1 or 7.6 mm) displacement divided by the plate area.3.2 TEST RESULTS
At each test interval during the compaction of the track bed, i.e., after 2 passes, 5 passes, etc., a minimum of two plate load tests and one in-situ ballast density test were performed. These physical state tests would determine the number of passes required to achieve an old track bed condition using the vibratory plate compactor.
In-Situ Ballast Density Tests. Generally, the ballast density increased .as the number of passes with the vibratory plate compactor increased
29
(Fig. 3.5). An apparently "stable" density condition is quickly produced with 25 to 50 passes. The density value achieved was approximately 110 pcf ,(1.76 Mg/m ). After 50 passes, there was only a slight increase in density with additional passes from the compactor. This is particularly evident by noting that the final average ballast density at 1000 passes was 111 pcf (1. 78 Mg/m" ) .
There existed a large difference in the initial density values at zero passes (Fig. 3.5)., This can quite possibly be attributed to the sample preparation technique, which may have produced a non-uniform density distribution along the. length of the track bed. This technique could have also been responsible for some of the scatter in the density measurements with the higher number of compactor passes. The data scatter might also be influenced slightly by any nonuniformity of 'the compaction procedure and the associated ballast density test sampling locations. However, for the duplicate density tests performed at 50 and 200 passes, reasonably reproducible density measurements were obtained.
Plate Load Test. The BBI values obtained from plate load tests at each given number of passes were averagedat 0.1, 0.2 and 0.3 in. (2.5,5.1 and 7.6 mm) deformation. These average, values were plotted against the number of passes in Fig. 3.6. Examination of Fig. 3.6 reveals that the ballast stiffness continued to increase with the number of compactor passes until 500 passes was reached. At this point, the BBI values essentially stabilized at the three deformation levels.
The maximum average BBI value at 0.1 in. (2.5 mm) deformation was approx-xmately 192 psi (634 kN/m ), while at 0.2 in. (5.1 mm) this value was
3C

BALL
AST
DENSITY
(PCF)
NUMBER OF PASSESFigure 3.5. Relationship Between Ballast Density and Number of Compactor Passes for a Simulated Track Bed

BALL
AST
BEARING
INDE
X, BBI (PSI)
350 T 1------- i— I I I T I I I 1------1— ! T T T T T T T
d _ » o
j______i___ i__i i i .i Mi______i___ i__i .i » iin ____ i___ i__i » a i mI 10 100 1000
NUMBER OF PASSES
F igure 3.6.' r>
Relationship Between Strength and Number of Compactor Passes for a Simulated Track Bed
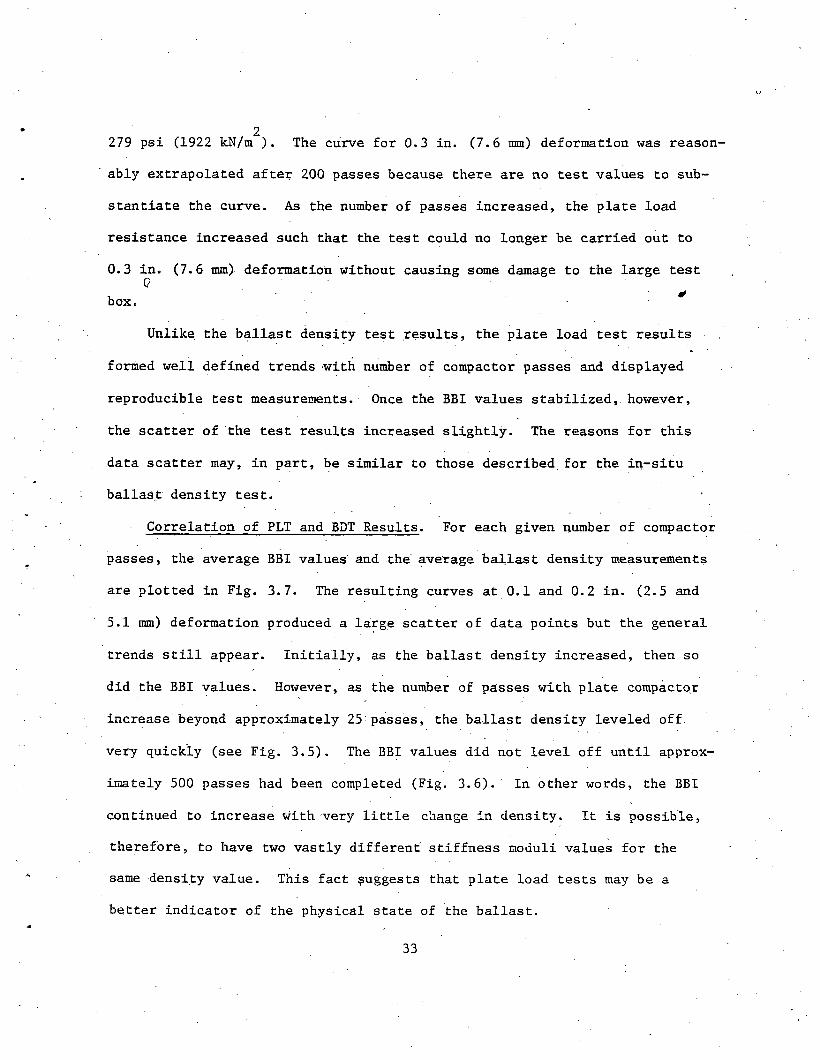
279 psi (1922 kN/m ). The curve for 0.3 in. (7.6 mm) deformation was reason ably extrapolated after 200 passes because there are no test values to substantiate the curve. As the number of passes increased, the plate load resistance increased such that the test could no longer be carried out to0.3 in. (7.6 mm) deformation without causing some damage to the large testQbox.
Unlike the ballast density test results, the plate load test results formed well defined trends with number of compactor passes and displayed reproducible test measurements. Once the BBI values stabilized, however, the scatter of the test results increased slightly. The reasons for this data scatter may, in part, be similar to those described for the in-situ ballast density test.
Correlation of PLT and BDT Results. For each given number of compactor passes, the average BBI values and the average ballast density measurements are plotted in Fig. 3.7. The resulting curves at 0.1 and 0.2 in. (2.5 and5.1 mm) deformation produced a large scatter of data points but the general trends still appear. Initially, as the ballast density increased, then so did the BBI values. However, as the number of passes with plate compactor increase beyond approximately 25-passes, the ballast density leveled off very quickly (see Fig. 3.5). The BBI values did not level off until approximately 500 passes had been completed (Fig. 3.6). In other words, the BBI continued to increase with very little change in density. It is possible, therefore, to have two vastly different stiffness moduli values for the same density value. This fact suggests that plate load tests may be a better indicator of the physical state of the ballast.
33

AVERAGE BALLAST BEARING INDEX, BBI (PSI)
J*
Co
Hft)ntd(DP-
U>■p-
00
£mmCD>rr> co — Iom2 :COH-<T)On
— ■ ro roQl 0 01 0 CJl0 0 0 0 0 0
30
0
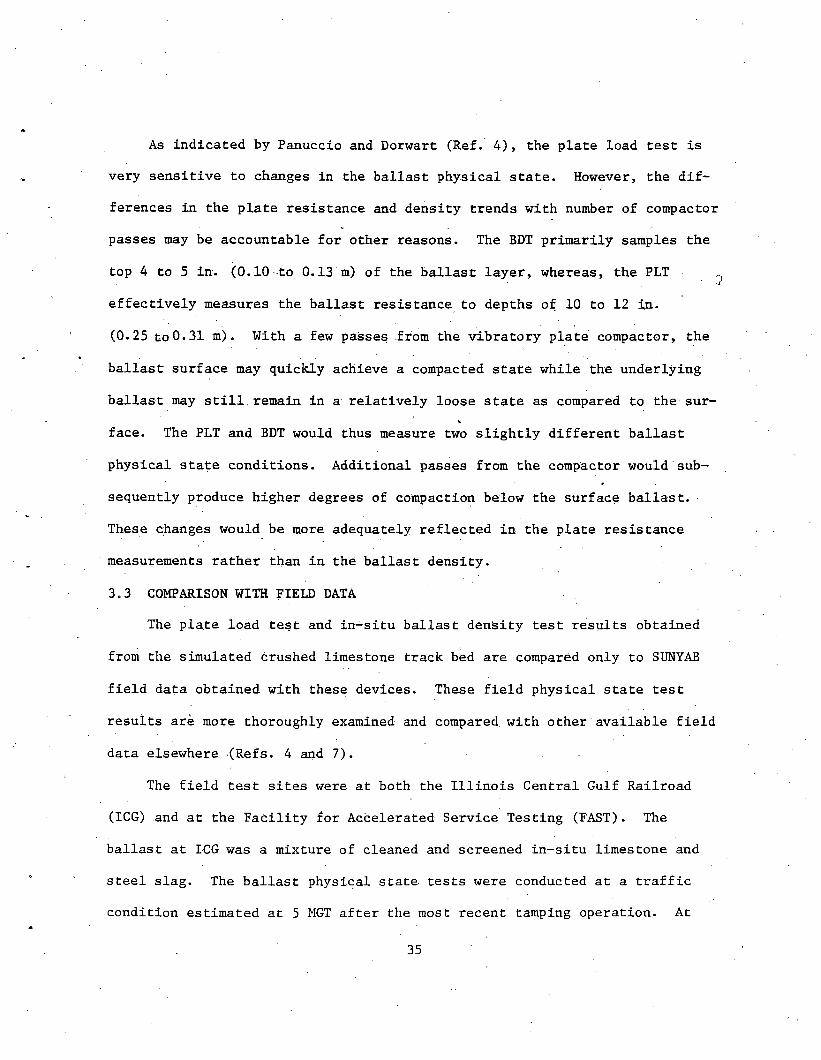
As indicated by Panuccio and Dorwart (Ref. 4), the plate load test is very sensitive to changes in the ballast physical state. However, the differences in the plate resistance and density trends with number of compactor passes may be accountable for other reasons. The BDT primarily samples the top 4 to 5 in. (0.10 to 0.13 m) of the ballast layer, whereas, the PLT effectively measures the ballast resistance to depths of 10 to 12 in- (0.25 to 0.31 m). With a few passes from the vibratory plate compactor, the ballast surface may quickly achieve a compacted state while the underlying ballast may still.remain in a relatively loose state as compared to the sur- face. The PLT and BDT would thus measure two slightly different ballast physical state conditions. Additional passes from the compactor would subsequently produce higher degrees of compaction below the surface ballast. These changes would be more adequately reflected in the plate resistance measurements rather than in the ballast density.3.3 COMPARISON WITH FIELD DATA
The plate load test and in-situ ballast density test results obtained from the simulated crushed limestone track bed are compared only to SUNYAB field data obtained with these devices. These field physical state test results are more thoroughly examined and compared with other available field data elsewhere (Refs. 4 and 7).
The field test sites were at both the Illinois Central Gulf Railroad (ICG) and at the Facility for Accelerated Service Testing (FAST). The ballast at ICG was a mixture of cleaned and screened in-situ limestone and steel slag. The ballast physical state- tests were conducted at a traffic condition estimated at 5 MGT after the most recent tamping operation. At
35

FAST, these tests were conducted after 135 MGT of traffic on a crushed limestone ballast. The ballast gradations are similar in all cases.
The comparable field test location for the simulated track bed is in the center of the track and under the tie. For the plate load tests, the
average BBI value at 0.2-in. (5.1-mm) deformation was 107 psi (737 kN/m^) at ICG and 307 psi (2115 kN/m^) at FAST. The simulated track bed at 1000
3compactor passes produced a value of 279 psi (1922 kN/m ) which is in fairly good agreement with the FAST data.
The in-situ ballast density test results at FAST yielded an averagedensity of 109.7 pcf (1.76 Mg/nr). At ICG, the corresponding average was
3101.2 pcf (1.62 Mg/m ), which is a value based upon an equivalent limestone3density. An average density of 111.0 pcf (1.78 Mg/m ) was obtained after
1000 passes from the simulated track bed, which again demonstrates good agreement with the FAST data.
In general, these comparisons indicate that a representative track bed was successfully constructed in the laboratory with the sample preparation techniques used.
36
4.1 APPARATUS AND PROCEDURESTest. Box. In addition to the features described in Section 3.1, the
test box (Fig. 3.1) was designed such that the actual field track structurewas also closely duplicated. The tie tested was 9 in. (229 mm) wide by 7Q
in. (178 mm) deep by 102 in. (2.59 m) long and weighed 208 lb (926 Nf. Thedepth of the box is 19 in. (483 mm) which allows for the tie to be used on
• •top of a 12-in. (305-mm) layer of.ballast. This depth of ballast beneath the tie, which was used for the simulated track bed, is a standard used by the railroad industry. The width of the test box is 35 in. (0.89 m) . When the tie is placed in the center of the box, two 13-in. (0.330-m)-wide cribs are present on each side of the tie. This dimension yields an equivalent tie spacing of 22 in. (0.56 m), which also is a standard employed by several . different railroads. The test box is long enough, i.e., 186 in. (4.73 m), to accommodate the testing of 12 in. (305 mm) or less flat shoulder width and variable shoulder slopes. In this study, the width was 12 in. (305 mm) and the slope was 3 horizontal to 1 vertical.
Tamping Equipment. The manual tie tamping was performed using two standard hand tools that are commonly used in railroad trackwork. One of these tools is a ballast fork, which is used for tie tamping and shovelling or "forking1' ballast. The ballast fork is similar to a combined short handle shovel and farmer's pitchfork. The end of the ballast fork primarily consists of a series of ten parallel metal prongs. One advantage of using a ballast, fork instead of a shovel to move ballast is that the fork enables the user to sift the fine grained materials out of the ballast.
4. INVESTIGATION OF MANUAL TIE TAMPING '
37
The other hand tool used in the tie tamping test series is a lining bar. A lining bar is a round steel rod which is blunt on one end and wedge- shaped or pointed on the other. This bar serves an almost unlimited number of functions in everyday railroad trackwork.
Sample Preparation. Once the simulated track bed was prepared aftertf1000 passes from the vibratory plate compactor, the track section was ready
for the tamping operation. The tie was positioned in the center of the test box such that both cribs were of equal width. The cribs were filled and shoulder section formed by shoveling the crushed limestone ballast (Fig. 2.2). into place in a relatively loose density state. Most of the particles in the crib that extended Appreciable distances above the top of the tie were removed by running the ballast fork over the tie surface.The rails were set into position, thus leaving a space between the rails and the tie.
In order to tamp the ballast underneath the tie, the tie first had to be raised. This was accomplished by shoving the pointed end of the lining bar at approximately a 45° angle to the horizontal into the shoulder ballast and under the tie end. A spacer, having a thickness equivalent to a standard tie plate, was inserted between the rail and the tie. By utilizing the shoulder ballast as a fulcrum, a sufficient downward force was applied to the free end of the lining bar to move the tie and spacer upward until contact was securely made with the rail base. This process subsequently created a void under the tie. Using the ballast fork, the crib ballast f
outside the rail was cleared from the edge of the tie until this void was Visible! Ballast was then shoved, with the fork,fromChe crib into the
38
void until the void was packed as tightly as possible. This process was repeated in the opposing crib outside of the rail and on both sides of the tie just inside the rail. The lining bar was withdrawn from the shoulder ballast and the tie remained in place. The spacer was then removed. This tamping sequence was also performed at the other end of the tie for the same four locations. Additional ballast was used to reform the cribs and shoulders. Thus, tamping was performed at a total of eight locations under the tie, the same eight locations that are tamped mechanically by a tamping machine.
Test Procedure and Program. The changes in the physical state of the ballast for the manual tie tamping test series were evaluated by the ballast density test (BDT), the plate load test (PLT), and the lateral tie push test (LTPT). The BDT and the PLT apparatus were previously described in Section3.
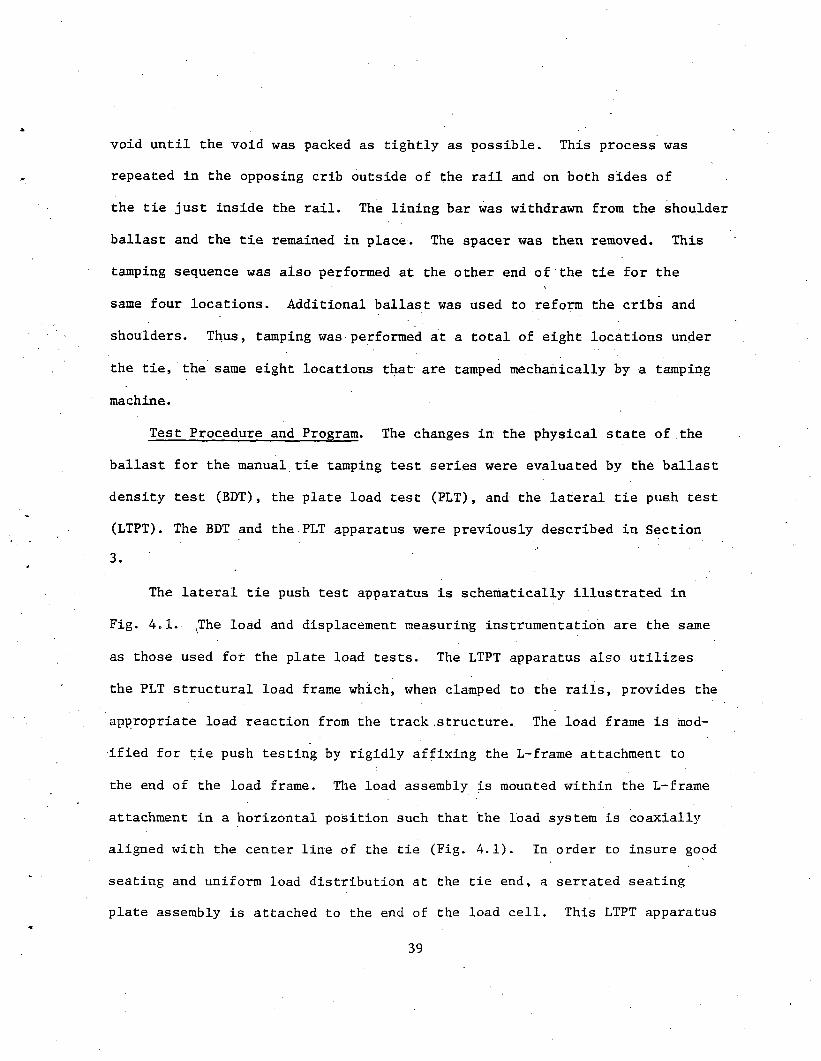
The lateral tie push test apparatus is schematically illustrated in Fig. 4.1. The load and displacement measuring instrumentation are the same as those used for the plate load tests. The LTPT apparatus also utilizes the PLT structural load frame which, when clamped to the rails, provides the appropriate load reaction from the track structure. The load frame is modified for tie push testing by rigidly affixing the L-frame attachment to the end of the load frame. The load assembly is mounted within the L-frame attachment in a horizontal position such that the load system is coaxially aligned with the center line of the tie (Fig. 4.1). In order to insure good seating and uniform load distribution at the tie end, a serrated seating plate assembly is attached to the end of the load cell. This LTPT apparatus
39

DISPLACEMENT REFERENCE STAND
D. C. D. T. AND DIAL INDICATOR
RAIL CLAMP
F
STRUCTURAL LOAD FRAME
•yK77~riri:
WOOD TIE
■P-OREMOVED RAIL SPIKESy PLATES AND ANCHORS
DEFORMATION SUPPORT - SYSTEM
SERRATED SEATING PLATE
LOAD CELL
4 SPACER DISC
HYDRAULIC LOAD JACK
L - FRAME ATTACHMENT
JACK SUPPORT SYSTEM
Figure 4.1. Assembled Lateral Tie Push Test Apparatus (Ref. 1)
r>
provides the closest direct measurement of the ballast resisting forces acting upon a laterally displaced tie.
The tie displacement is measured by the DCDT and dial indicator connected in coaxial alignment and mounted horizontally on the deformation sup-port frame. This frame is rigidly clamped to the same end of the tie that
* *the load system acts upon. The end of the DCDT's moveable core is springloaded against the .reference plate of the displacement reference stand.The tripod-type reference stand is securely seated on the ballast shoulder and provides a reference datum point for the tie displacement measurements.
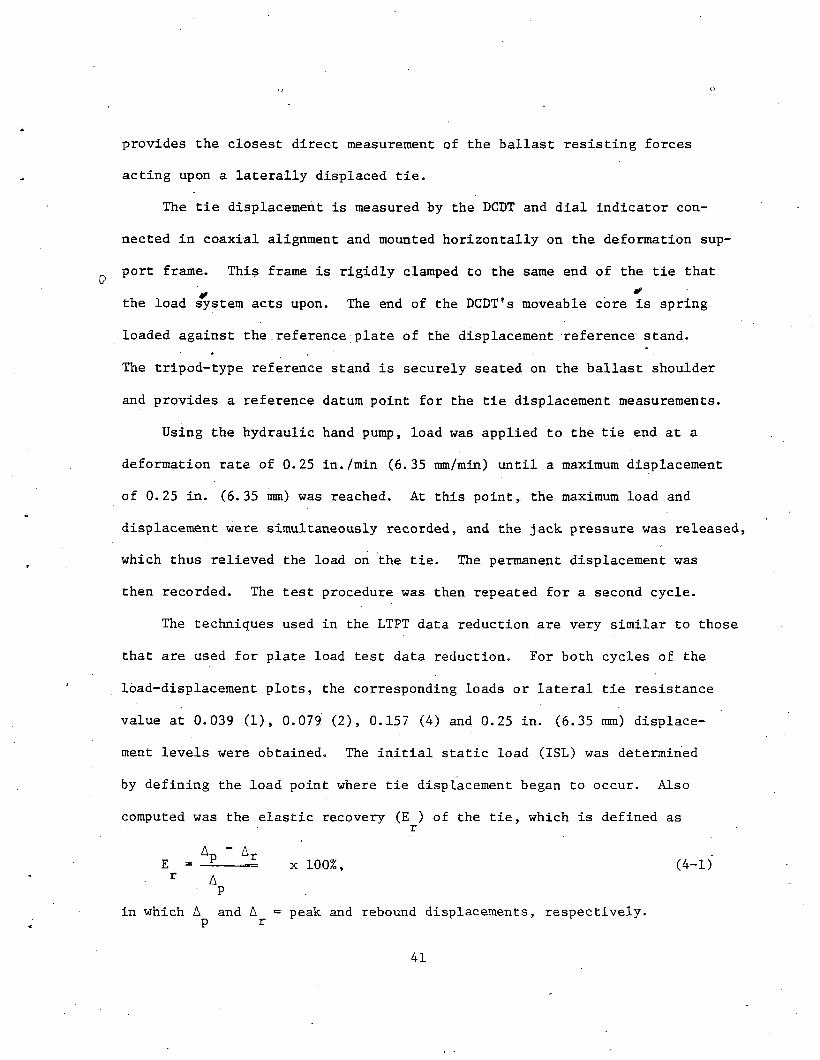
Using the hydraulic hand pump, load was applied to the tie end at a deformation rate of 0.25 in./min (6.35 mm/min) until a maximum displacement of 0.25 in. (6.35 mm) was reached. At this point, the maximum load and displacement were simultaneously recorded, and the jack pressure was released, which thus relieved the load on the tie. The permanent displacement was then recorded. The test procedure was then repeated for a second cycle.
The techniques used in the LTPT data reduction are very similar to those that are used for plate load test data reduction. For both cycles of the load-displacement plots, the corresponding loads or lateral tie resistance value at 0.039 (1), 0.079 (2), 0.157 (4) and 0.25 in. (6.35 mm) displacement levels were obtained. The initial static load (ISL) was determined by defining the load point where tie displacement began to occur. Also computed was the elastic recovery (E ) of the tie, which is defined as
E ; r
in which
^p ^rAP
A and A P r
x 100%,
peak and rebound displacements, respectively.
(4-1)
41

The test program for the manual tie tamping series is listed in Table4.1. The effects on lateral tie resistance of the following factors wereinvestigated: 1) different tie weights, 2) varying crib ballast depths withno shoulder, 3) overfilled cribs with no shoulder, and 4) height of and procedure used for the tamping raise. Several duplicate tests were incor- porated into the test program for checks on reproducibility of results.
For each individual test series within the test program, the simulated track bed remained compacted until the tie tamping operation was performed. After completing all testing on the tamped tie, the crib and shoulder ballast was excavated, and the tie was removed. Approximately 2 to 3 in. (51 to 76 mm) of the remaining loose surface ballast was also removed such that the original track bed was exposed. In order to "smooth" out the surface of the simulated track bed which had been somewhat disturbed as a result of tamping operations, the rubber mats were placed over the ballast and the vibratory plate compactor with the added steel base plate was run over the track bed for 50 passes. The procedure for tie and ballast placement conditions was then repeated for the next tamping test series.4.2 TEST RESULTS
Typical LTPT Load-Displacement Curves. Several of the lateral tie push test (LTPT) load-displacement curves on individual ties are shown in Fig.4.2. Each curve is labeled with the appropriate test identification number, the ballast conditions that existed during testing, and the number of the applied loading cycles. These load-displacement curves are representative test results for most of the factors that were investigated.
42
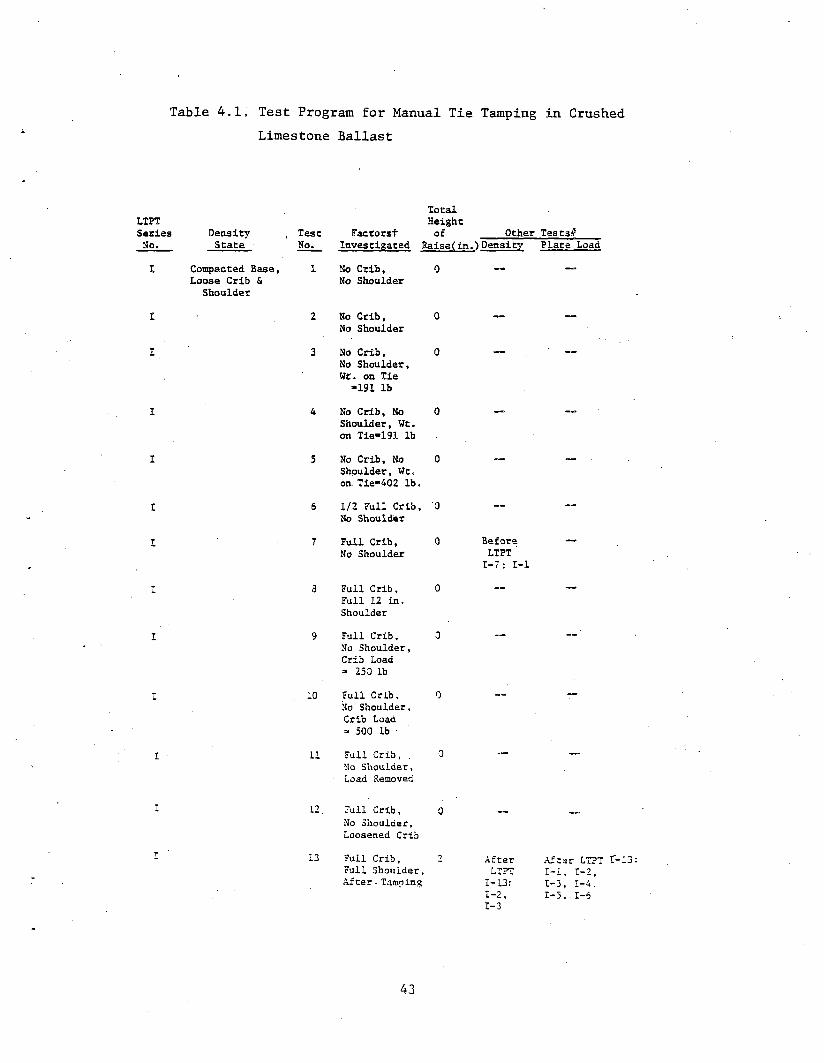
Table 4.1. Test Program for Manual Tie Tamping in CrushedLimestone Ballast
TotalLTPT HeightSeries Density , Test Factorst of Other Tests#Ho. State Ho. Investigated Raise/in.V Density Plate Load
X Compacted Base, Loose Crib & Shoulder
1 No Crib,Ho Shoulder
0 -- —
I 2 No Crib,No Shoulder
0 — —
I 3 No Crib,No Shoulder, He. on Tie -191 lb
0
I 4 No Crib, No Shoulder, Wt. on Tie-191 lb
0
I 5 No Crib, No Shoulder, Wt. on Tie-402 lb.
0
I 6 1/2 Full Crib, Ho Shoulder
0 — —
I 7 Full Crib, No Shoulder
0 BeforeLTPT1-7: 1-1
T 3 Full Crib, Full 12 in. Shoulder
0
i 9 Full Crib,No Shoulder, Crib Load = 250 lb
0
I , 10 Full Crib,No Shoulder, Crib Load - 500 lb ■
0
i 11 Full Crib, . No Shoulder, Load Removed
0
r 12. "all Crib,No Shoulder, Loosened Crib
0 ~ —
T 13 Full Crib,Full Shoulder, After■Tamping
2 AfterLTPT1-13:
After LTPT I-i, 1-2, 1-3, 1-4.- 1-J* L- J , I—H ,
1-2, 1-5..1-61-3
43

Table 4.1, Test Program for Manual Tie Tamping in CrushedLimestone Ballast (continued)
LTPTSeries Density Test Factors'!
TotalHeightof Other Tests#
No. State No. Investigated Raise(in) Density Platfe LoadII Compacted Base
Loose Crib & Shoulder
1 No Crib,No Shoulder
0 — —
II 2 Full Crib, No Shoulder
0 BeforeLTPTII-3+ :II-l
Before LTPT II-3 ? II-l
II 3 Full Crib,Full Shoulder, After Tamping
3 After LTPT II-3: II-2, II-3
After LTPT I1-3: II-2, II-3, II-4 II-5, II-6, II-7
III Compacted Base Loose Crib & Shoulder
1 Full Crib, Full Shoulder 0
Before LTPT III-l: III-1
Before LTPT III-l; III-l
III 2 Full Crib,Full Shoulder, After Tanning
0.5 "—
IH 3 Full Crib,Full Shoulder,
■ After Tamping0.5* * — —
III 4 Full Crib,Full Shoulder, After Tamping
0.5*"
III 5 Full Crib,Full Shoulder,
■ After Tamping0.5* — —
t All LTPT had 2 Cycles of Load
# Performed on Condi ti nns F.stahli sherl_for_the—Given—LTPT—Test—No.— But—Iminediate-l-y-Before or After That LTPT is Run.
+ After Tamping and Before Filling Crib
* In Addition to Preceding Raise44
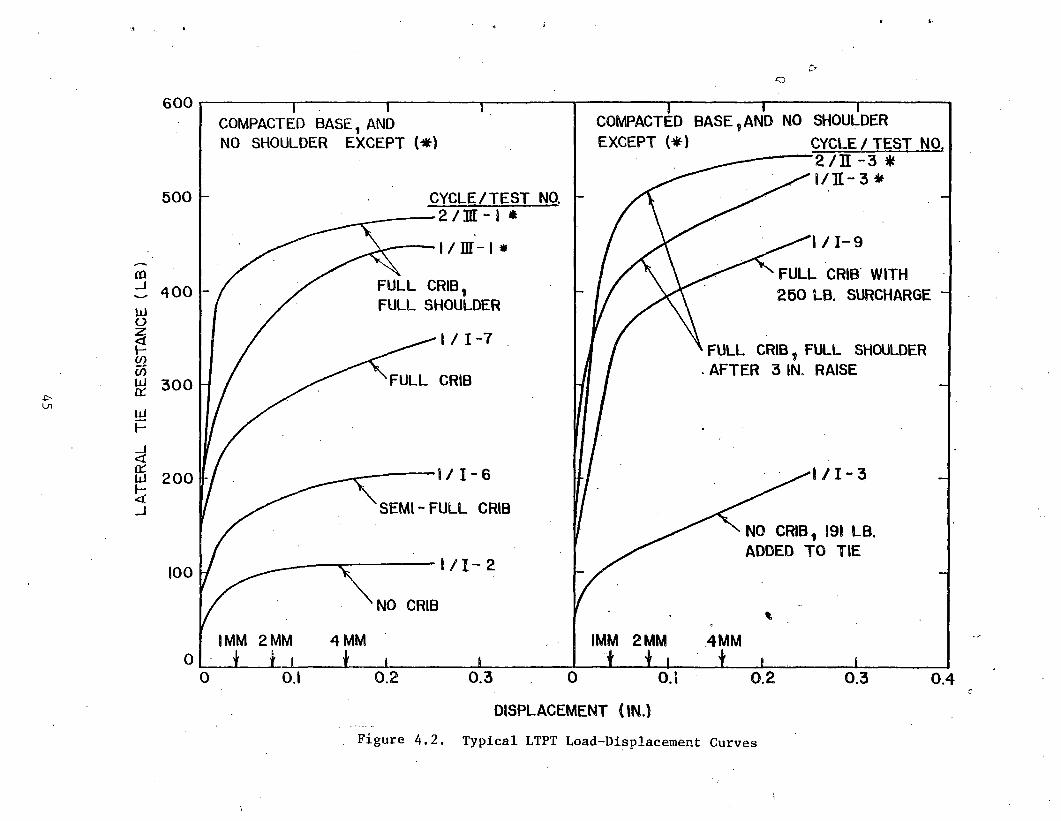
LA
TE
RA
L
TIE
R
ES
IST
AN
CE
(
LB
)
o
DISPLACEMENT (IN.)Figure 4.2. Typical LTPT Load-Displacement Curves
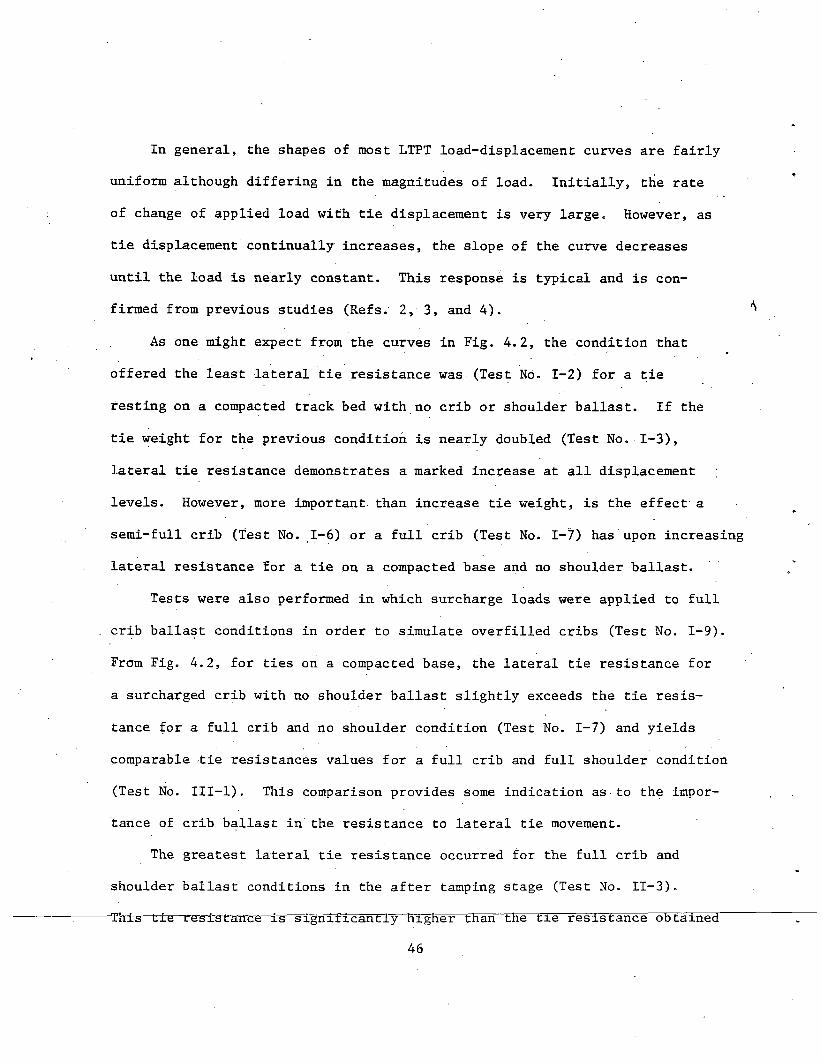
In general, the shapes of most LTPT load-displacement curves are fairly uniform although differing in the magnitudes of load. Initially, the rate of change of applied load with tie displacement is very large. However, as tie displacement continually increases, the slope of the curve decreases until the load is nearly constant. This response is typical and is confirmed from previous studies (Refs.' 2, 3, and 4).
As one might expect from the curves in Fig. 4.2, the condition that offered the least lateral tie resistance was (Test No. 1-2) for a tie resting on a compacted track bed with no crib or shoulder ballast. If the tie weight for the previous condition is nearly doubled (Test No. 1-3), lateral tie resistance demonstrates a marked increase at all displacement levels. However, more important than increase tie weight, is the effect a semi-full crib (Test No. 1-6) or a full crib (Test No. 1-7) has upon increasing lateral resistance for a tie on a compacted base and no shoulder ballast.
Tests were also performed in which surcharge loads were applied to full crib ballast conditions in order to simulate overfilled cribs (Test No. 1-9). From Fig. 4.2, for ties on a compacted base, the lateral tie resistance for a surcharged crib with no shoulder ballast slightly exceeds the tie resistance for a full crib and no shoulder condition (Test No. 1-7) and yields comparable tie resistances values for a full crib and full shoulder condition (Test No. III-l). This comparison provides some indication as to the importance of crib ballast in the resistance to lateral tie movement.
The greatest lateral tie resistance occurred for the full crib and shoulder ballast conditions in the after tamping stage (Test No. II-3).■This tie nresirstmiee is significantly higher than the tie resistance obtained
46
under similar conditions with the tie resting on a compacted base (Test No.III-l). This result is understandable and expected. Underneath the tie at the tie-ballast interface, a compacted base will have a smooth ballast surface while a freshly tamped base would exhibit a rougher surface. Thus, the differences in lateral tie resistance would be primarily attributed to the differences in the base component of resistance. From Fig. 4. 2, it is apparent that the second cycle of loading usually offers slightly greater lateral tie resistance than does the first cycle. This is most likely the result of a densified ballast shoulder condition due to load cycling.
The LTPT loads at several displacement levels and the percent elastic recovery (E ) were determined for all tests performed. However, Panuccio and Dorwart (Ref. 4) have concluded that the Ef and the initial static load (ISL) values do not offer any potential as possible means of evaluating factors investigated by the LTPT. These values will, therefore, not be elaborated upon further. Also, LTPT series Number 1-4 and 1-12 will not be discussed since the actual test conditions existing during the time of testing are questionable.
The tie for each test condition (Table 4.1) generally received two cycles- of loading. With the exception of tests performed with a full ballast shoulder, the lateral tie resistances from cycle one and cycle two will be averaged to present the general trends. In some of the cases with no shoulder, cycle number two produced slightly greater tie resistance load values than cycle number one. It is assumed that this difference is the result of a slightly changed ballast physical state condition occuring in the cribs or under the tie during cycle 1. This difference also may have
47
o ccu rred w ith th e . in d iv id u a l sam ple p r e p a r a t io n fo r each t e s t c o n d it io n . Thus, u s in g th e average l a t e r a l t i e r e s i s t a n c e a t each d isp la c e m e n t l e v e l a p p e a r s , a c c e p t a b le . A ls o , as p r e v io u s ly in d ic a t e d , th e v a r ia t io n o f l a t e r a l t i e r e s i s t a n c e betw een both c y c le s i s more pronounced fo r a f u l l b a l l a s t sh o u ld er c o n d it io n and, t h e r e f o r e , th e r e s u l t s f o r th e two lo a d in g c y c le s w i l l be a n a ly zed s e p a r a te ly .
E f f e c t o f H eig h t o f R a is e . The t e s t t i e was r a is e d by th e sam ple p rep a r a tio n p roced u re d e sc r ib e d in s e c t io n 4 .1 . In each c a s e , th e t i e i n i t i a l l y r e s t e d on th e com pacted b a se surrounded by f u l l c r ib s and sh o u ld e r . T h is c o n d it io n w i l l r e p r e s e n t a zero tr a c k r a i s e . For t e s t s e r i e s I and I I , th e t i e s r e c e iv e d f u l l r a i s e s o f 2 and 3 in . (51 and 76 mm), r e s p e c t iv e ly . In t e s t s e r i e s I I I , th e t i e was r a is e d and tamped in a s e r i e s o f fo u r 0 .5 - i n . (12.7-m m ) in crem en ts u n t i l a f u l l 2 - i n . (51-mm) r a i s e was a c h ie v e d . A fte r a g iv e n in crem en t, th e c r ib s w ere r e f i l l e d and th e sh o u ld e r s reform ed p r io r to t e s t i n g .
The l a t e r a l t i e r e s i s t a n c e a s a fu n c t io n o f th e h e ig h t o f th e tam ping r a i s e i s shown in F ig . 4 .3 . In c lu d ed in t h i s f ig u r e are th e f i r s t c y c le lo a d s a t 0 .0 3 9 7 and 0 .1 5 7 . in . (1 and 4 mm) d isp la c e m e n t l e v e l s and th e secon d c y c le lo a d s a t 0 .1 5 7 (4 mm) d isp la c e m e n t .
The f i r s t apparent r e s u l t i s th a t a l l t e s t s con d u cted in th e a f t e r tam ping c o n d it io n y ie ld e d s i g n i f i c a n t l y g r e a te r t i e r e s i s t a n c e v a lu e s than th e t e s t con d u cted w ith a com pacted b a se c o n d it io n , i . e . , zero t i e r a i s e .T h is tren d i s e x h ib it e d a t a l l d isp la c e m e n t l e v e l s and b oth c y c le s o f lo a d in g (R ef. 2 0 ) . The rea so n , w hich has been p r e v io u s ly d is c u s s e d , i s b e l ie v e d to
-be—th e—d-if-f-erence~in the su r fa c e r oughn e s s —o f th e b a l l a s t u n derneath—th e t i e . '
48

LATE
RAL
TIE R
ESISTA
NCE
(LB)
F ig u r e 4 „ 3 . The E f f e c t o f th e H eigh t o f a Tamping R a ise bn L a te r a l T ie R e s is ta n c e
49
An ex a m in a tio n o f F ig . 4 .3 r e v e a ls t h a t fo r t e s t s e r i e s I I I , th e in c r e m en ta l tam ping r a i s e s produced f a i r l y c o n s i s t e n t l a t e r a l t i e r e s i s t a n c e s a t a l l d isp la c e m e n t l e v e l s fo r b o th c y c le 1 and 2 t i e lo a d in g s . T h is r e s u l t , in p a r t , in d ic a t e s u n ifo r m ity o f th e m anual t i e tam ping p roced u re and subseq u en t r e p r o d u c ib i l i t y o f th e t e s t r e s u l t s . In a com parison to th e r e s u l t s o f th e two t e s t s perform ed wiiSh f u l l 2 -and 3 - i n . (51 - and 76-mm) tam ping r a i s e s , a 3 - in . (76-mm) f u l l r a i s e produced r e s u l t s com parable to th e in c r e m en ta l r a i s e , w h ile th e 2 - in . (51-mm) f u l l r a i s e y ie ld e d s l i g h t l y g r e a te r t i e r e s i s t a n c e v a lu e s . T hese f in d in g s ap p ear to be c o n s i s t e n t a t a l l d i s p lacem en t l e v e l s and fo r b oth lo a d in g c y c le s (R ef. 2 0 ) . An e x p la n a t io n fo r th e d i f f e r e n t r e s u l t s o b ta in e d from th e f u l l 2 in . (51 mm) r a i s e i s n o t r e a d i ly a v a i la b le , e x c e p t fo r a p o s s ib le a s s o c ia t io n w ith norm al t e s t i n g v a r i a b i l i t y . An o v e r a l l a sse ssm e n t o f th e t e s t r e s u l t s p r e se n te d in F ig . ,4 .3 in d ic a t e s th a t l a t e r a l t i e r e s i s t a n c e o f a s i n g l e t i e does n o t appear to be a fu n c t io n o f th e h e ig h t o f th e tam ping r a i s e nor o f th e method used to a c h ie v e th e r a i s e , i . e . , f u l l or in l i f t s .
For a l l t e s t s r e c e iv in g a tam ping r a i s e , th e av era g e secon d c y c le l a t e r a l t i e r e s i s t a n c e o f 551 lb (2452 N)- was g e n e r a l ly 64 lb (285 N) or 13 p e r c e n t g r e a te r than th e a v era g e f i r s t c y c le t i e r e s i s t a n c e v a lu e s a t 0 .1 5 7 in .(4 mm) d isp la c e m e n t. T h is tren d i s c o n s i s t e n t fo r th e d a ta s e t s shown in F ig . 4 .3 . D e n s i f ic a t io n o f th e b a l l a s t sh o u ld e r d u rin g t e s t i n g ap p ears to be th e most p la u s ib le e x p la n a t io n fo r th e s e n u m e r ic a lly sm a ll lo a d in c r e a s e s .
E f f e c t o f C rib D epth. S e v e r a l t e s t s w ere perform ed in w hich th e d epth o f th e c r ib b a l l a s t was v a r ie d w h ile a l l o th e r c o n d it io n s w ere k ep t c o n s ta n t .For a l l t e s t s , th e t i e was p la c e d upon th e com pacted tr a c k bed and no sh o u ld er
50

b a l l a s t was form ed. Crib b a l l a s t was g e n e r a l ly p rep ared in a l o o s e d e n s it y s ta te ..
The th r e e fo l lo w in g c r ib b a l l a s t d epth c o n d it io n s w ere in v e s t ig a t e d :1) z e r o or no c r i b , 2 ) 3 .5 in . (89 mm) o f b a l l a s t or s e m i - f i l l e d c r ib , and3 ) a f u l l 7 in . (178 mm) c r ib s e c t io n . The im p ortan ce o f b a l l a s t c r ib d epth on th e l a t e r a l t i e r e s i s t a n c e i s shown in F ig . 4 .4 .: No*£e, th a t th e f i r s tand seco n d c y c le lo a d s w ere averaged fo r each t e s t c o n d it io n a t each d i s p lacem en t l e v e l , and th e lo a d s from both c y c le s o f lo a d in g g e n e r a l ly y i e l d s im i la r r e s u l t s . T h is a v e r a g in g w i l l , th e r e fo r e , n o t in f lu e n c e th e d a ta a n a l y s i s .
As e x p e c te d , t i e r e s i s t a n c e in c r e a s e s w ith th e in c r e a s in g amounts o f c r ib b a l l a s t . For a l l d isp la c e m e n t l e v e l s , th e r e la t io n s h ip betw een l a t e r a l t i e r e s i s t a n c e and c r ib depth appears to be n e a r ly l i n e a r . A f u l l c r ib o f f e r s th r e e tim es more and a s e m i - f i l l e d c r ib o f f e r s a p p ro x im a te ly two tim es more l a t e r a l r e s i s t a n c e than a no c r ib b a l l a s t c o n d it io n . T h is tren d i s c o n s i s t e n t a t each d isp la c e m e n t l e v e l (R ef. 2 0 ) .
In c o n ju n c tio n w ith th e f i r s t c y c le l a t e r a l t i e r e s i s t a n c e f o r a zero tr a c k r a i s e in F ig . 4 . 3 , th e c o n tr ib u t io n s o f th r e e com ponents o f t i e r e s i s ta n ce can be d eterm in ed w ith F ig . 4 .4 fo r a lo o s e c r ib and s h o u ld e r , and a compact b a se . At 0 .1 5 7 in . (4 mm) d isp la c e m e n t, sh o u ld e r r e s i s t a n c e i s 16 p e r c e n t , c r ib r e s i s t a n c e i s 56 p e r c e n t , and b a se r e s i s t a n c e i s 28 p e r c e n t o f th e t o t a l r e s i s t a n c e . The c o n s is t e n c y in th e t e s t r e s u l t s i s a ls o demons t r a t e d a t a l l d isp la cem en t l e v e l s and, more im p o r ta n t ly , in d ic a t e s th a t c r ib b a l l a s t i s th e main component o f th e t o t a l l a t e r a l t i e r e s i s t a n c e .
E f f e c t o f O v e r f i l l H e ig h t . In ord er to d eterm in e th e e f f e c t o f
51

LATE
RAL
TIE R
ESISTA
NCE (
LB)
A
CRIB DEPTH (IN.)
F ig u re 4 .4 . R e la t io n s h ip Between L a te r a l T ie R e s is ta n c e nn a Compaoi-pH Ragp w ith No S h ould er B a l la s t and C rib Depth
52

o
o v e r f i l l i n g a r a i lr o a d tr a c k c r ib w ith b a l l a s t , two t e s t s w ere perform ed in w hich a su rch a rg e lo a d p ro v id ed by c o n c r e te c y l in d e r s was u n ifo rm ly d i s t r i b u ted w it h in each c r ib a lo n g th e e n t ir e le n g th o f th e t i e . The f i r s t t e s t was co n d u cted w ith a su rch a rg e lo a d o f 250 lb (1113 N) added to each c r ibw h ile th e secon d t e s t used a 500 lb (2225 N) lo a d . The l a t e r a l t i e push
¥t e s t s w ere perform ed w ith th e t i e r e s t in g on a com pacted b a s e . No sh o u ld er b a l l a s t was used and th e c r ib s w ere f u l l w ith l o o s e l y p la c e d b a l l a s t .
The su rch a rg e lo a d s w ere co n v erted to a volum e o f b a l l a s t in o rd er to d eterm in e th e c r ib b a l l a s t o v e r f i l l h e ig h t th a t each su r c h a r g e lo a d r e p r e s e n te d . G e n e r a lly , th e b a l l a s t in th e c r ib i s in a l o o s e s t a t e and has a b a l l a s t d e n s it y o f a p p ro x im a te ly 100 p c f ( 1 .6 Mg/m ) . When t h i s d e n s it y i s d iv id e d by th e s u r fa c e a rea o f th e c r ib , from end o f t i e to end o f t i e , th e su rch a rg e lo a d s o f 25Q lb (1113 N) and 500 lb (2225 N) y ie ld e d e q u iv a le n t o v e r f i l l h e ig h t s o f 3 .1 in .' (79 mm) and 6 .2 in . (158 ram), r e s p e c t iv e ly .Thus, th e a v era g e l a t e r a l t i e r e s i s t a n c e fo r b oth th e f i r s t and secon d lo a d in g .c y c le s can now be more c o n v e n ie n t ly i l l u s t r a t e d as a fu n c t io n o f c r ib b a l l a s t
/h e ig h t (F ig . 4 . 5 ) . The l e f t s id e o f F ig . 4 .5 i s th e same a s F ig . 4 . 4 , w h ile th e r ig h t s id e shows th e e q u iv a le n t o v e r f i l l h e ig h t s . In g e n e r a l fo r each d isp la c e m e n t l e v e l , , th e r e la t io n s h ip betw een two p aram eters ap p roach es l i n e a r i t y
W eight o f T ie . S e v e r a l t e s t s w ere perform ed w ith th e t i e r e s t in g on th e com pacted b ase w ith no c r ib or sh o u ld er b a l l a s t and d i f f e r e n t u n ifo rm ly . d is t r ib u t e d dead lo a d s were a p p lie d to th e top o f th e t i e . L a te r a l t i e r e s i s ta n c e was d eterm in ed fo r 1) an un load ed t i e w e ig h in g 208 lb (926 N ),. 2) 191 lb (350 N) added to th e unloaded t i e , and 3) 402 lb (1789 N) added to th e u n load ed t i e . '
53

LATE
RAL
TIE R
ESISTA
NCE (
LB)
HEIGHT OF CRIB BALLAST (IN.)
F igu re 4 .5 . The E f f e c t o f an O v e r f i l le d Crib on L a te r a l T ie R e s is ta n c e fo r a Compacted B ase and No S h ould er

The r e la t io n s h ip of. l a t e r a l t i e r e s i s t a n c e as a fu n c t io n o f t i e w e ig h t i s shown g r a p h ic a l ly in F ig . 4 .6 . G e n e r a lly , th e l a t e r a l t i e r e s i s t a n c e in c r e a s e s l i n e a r l y w ith in c r e a s in g t i e w e ig h t.
For t h e s e t e s t s , th e smooth b a l l a s t s u r fa c e u n d ern eath th e t i e i s th e o n ly component o f r e s i s t a n c e , so c y c l i c lo a d in g o f th e t i e i s e x p e c te d to y i e l d f a i r l y r e p r o d u c ib le r e s u l t s . The d i f f e r e n c e s th a t e x i s t a re p r im a r ily a t t r ib u t e d to th e n o n u n ifo rm ity o f th e com pacted tr a c k bed c o n d it io n a lo n g th e le n g th o f th e t i e . . N e v e r th e le s s , lo a d v a lu e s f o r b o th c y c le s o f lo a d in g a t each d isp la c e m e n t l e v e l w ere averaged s in c e th e l a t e r a l t i e r e s i s t a n c e s f o r t h i s c o n d it io n a re c o n s id e r e d as p a r t o f th e norm al d a ta s c a t t e r .
The l in e a r r e la t io n s h ip s shown in F ig . 4 .6 a l s o p a ss through th e o r ig in , w hich i s r e a so n a b le c o n s id e r in g th e fundam ental law o f s l i d i n g f r i c t i o n a l r e s i s t a n c e . The l a t e r a l t i e r e s i s t a n c e under th e s e c o n d it io n s i s eq u a l to h a l f o f th e t i e w e ig h t a t 0 .1 5 7 in . (4 mm) d isp la c e m e n t . T h is v a lu e o f0 .5 i s a f a i r l y r e l i a b l e av era g e b eca u se th e range i s 0 .4 3 to 0 .5 4 fo r0 .0 3 9 4 to 0 .2 5 in . (1 to 6 .3 5 mm) d isp la cem en t l e v e l s , r e s p e c t iv e ly (R ef, 20)
D e n s ity and P la t e Load T e s t s . For com p arative p u r p o se s , th e a v era g e b a l l a s t d e n s i t y (F ig . 3 .6 ) and th e a v era g e BBI v a lu e s (F ig . 3 .7 ) a t 0 and a t 1000 p a s s e s from th e s im u la te d tr a c k bed t e s t s w ere u sed a s r e fe r e n c e s t a t e s fo r th e BDT's and PLT’ s perform ed d u rin g th e manual t i e tam ping s e r i e s
The i n - s i t u b a l l a s t d e n s it y t e s t r e s u l t s from th e manual t i e tam ping s e r i e s a r e shown g r a p h ic a l ly in F ig . 4 .7 fo r each s p e c i f i c t e s t l o c a t io n .In th e c e n te r o f th e tr a c k , th e b a l l a s t d e n s i t i e s in th e c r ib and under th e t i e a re com parable to th e a v erage d e n s i t i e s o b ta in e d from th e s im u la te d tr a c k bed a f t e r 0 and 1000 p a s s e s , r e s p e c t iv e ly . The t e s t r e s u l t s a re 1 1 2 .8 p c f
55
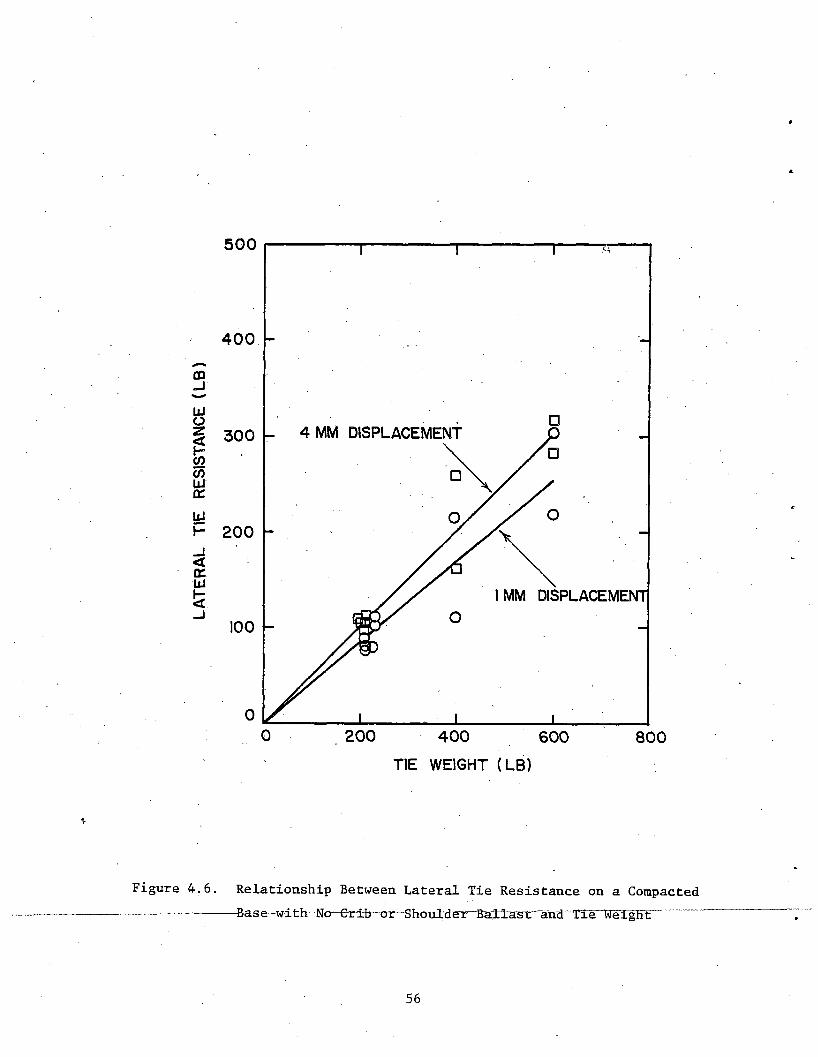
F ig u re 4 ,6 . R e la t io n s h ip Betw een L a te r a l T ie R e s is ta n c e on a Compacted ------------------------ B a se -w ith No C rib - or S h o u ld e r B a l ia s t 'a n d T ie W eight
56

o
Ln
130
d) UNDER-TIE
1 2 0 -
Ll_O0->-ttozUioI—to<<00
n o&
J Q
AVE. AT 1000^ PASSES FROM SIMULATED TRACK BED
1 0 0 -
90
80
TAMPING RAISE3 IN.<y 2 IN.
A
b) IN-CRIB[ALL CRIBS FULL EXCEPT (*)]
&'^7
AVE. AT 0'PASSES FROM SIMULATED TRACK BED
TAMPING
JL _ ^ JL
F igu re 4 .7 . B a l la s t D e n s ity fo r D i f f e r e n t Tamping R a is e s and B a l la s t P lacem en t C o n d itio n s

3 3( 1 .8 Mg/m ) under th e t i e and 1 0 0 .3 p c f ( 1 .6 Mg/mJ ) in th e c r ib . The undert i e d e n s ity i s e x p e c te d to be s im i la r s in c e th e c e n te r o f th e tr a c k i s n o t d i r e c t l y a f f e c t e d by th e manual tam ping p r o c e s s . The b a l l a s t d e n s i t y in th e c r ib , in p a r t , r e f l e c t s th e r e p r o d u c ib i l i t y o f th e lo o s e s t a t e b a l l a s t p la c e ment c o n d it io n s .
For t e s t s perform ed n ear th e r a i l s in th e zo n es o f tam ping, two n o ta b le f e a tu r e s i l l u s t r a t e d in F ig . 4 .7 f o r th e u n d e r - t ie and in - c r ib t e s t s a r e :1) b a l l a s t d e n s i t i e s a r e s i g n i f i c a n t l y low er th an th e r e s p e c t iv e c e n te r o f tr a c k v a lu e s , and 2) s im i la r r e s u l t s a re produced fo r th e two d i f f e r e n t tam ping r a i s e s . N ote f o r th e t e s t s in th e c r ib a f t e r a 3 - in . (76-mm) r a i s e , th e two b a l l a s t d e n s i t i e s d i f f e r e d som ewhat. But th e d e n s i t y fo r a p a r t i a l l y f u l l c r ib i s r e p r e s e n t a t iv e o f th e lo o s e c r ib b a l l a s t and n o t th e com pacted tr a c k bed. T h e r e fo r e , th e in d iv id u a l b a l l a s t d e n s i t i e s and th e r e s u l t in g a v era g e o f 9 3 .0 p c f (1 .4 9 Mg/nr*) fo r th e 3 - i n . (76-mm) r a i s e a r e , th u s , com parable to th e 9 4 .3 p c f (1 .5 1 Mg/m^) d e n s i t y a c h iev ed fo r th e2 - in . (51-mm) r a i s e .
A lthough th e d e n s i t i e s in th e c r ib n ear th e r a i l s a r e low er than th e c e n te r o f tr a c k d e n s ity and th e a v era g e d e n s i t y a t 0 p a s s e s from th e sim ula t e d tr a c k b ed , i t i s u n c e r ta in i f th e tam ping p r o c e s s s o l e l y produced a lo o s e r d e n s ity s t a t e . T h is r e s u l t may have been th e p rod u ct o f th e r e b a ll a s t i n g tech n iq u e used or s im p ly a s s o c ia t e d w ith th e normal amount o f d a ta s c a t t e r . The l a t t e r i s based upon th e f a c t th a t a d e n s it y o f 9 3 .7 p c f
3(1 .5 Mg/m ) was a c h iev ed from one t e s t a t 0 p a s s e s fo r th e s im u la te d tr a c k bed t e s t s ( s e e F ig . 3 . 6 ) . The range o f 90 to 96 p c f (1 .4 4 to 1 .5 4 Mg/m'*) w ould , how ever, be t y p ic a l o f a lo o s e d e n s ity s t a t e c o n d it io n .
.58

The b a l l a s t d e n s i t i e s under th e t i e in th e zon es o f tam ping w ere ap p rox- im a te ly eq u a l and have an a v era g e o f 1 0 1 .3 p c f (1 .6 2 Mg/m ) . T h is v a lu e i s s i g n i f i c a n t l y g r e a te r than th e c r ib b a l l a s t d e n s i t y in th e tamped zon e , but com parable to th e c e n t e r - o f - t r a c k d e n s ity in th e c r ib . D e n s ity sam p lin g in to th e top s u r fa c e o f th e com pacted tr a c k bed i s n o t a m ajor in f lu e n c in g f a c t o r . T h is b a l l a s t i s in e v i t a b ly d is tu r b e d by th e tam ping p r o c e s s to a depth o f a p p r ix im a te ly 1 - 1 /2 in . (38 mm) b elow th e com pacted tr a c k bed su r f a c e . T h is , in a d d it io n to th e h e ig h t o f th e t i e r a i s e s , w ould y i e l d t y p ic a l sam pling d ep th s f o r th e b a l l a s t d e n s ity t e s t . In g e n e r a l , th e s e t e s t r e s u l t s tend to in d ic a t e th a t th e manual t i e tam ping p r o c e s s e x e r c is e d in t h i s s tu d y l e f t th e b a l l a s t under th e t i e in a lo o s e r s t a t e , than th a t w h ich e x is t e d b e fo r e tam ping.
The p la t e lo a d t e s t r e s u l t s th a t were o b ta in e d from th e manual t i e tamp in g s e r i e s a re p r e se n te d f o r th e BBI v a lu e s a t 0 .2 in . (5 .1 mm) d e fo rm a tio n as s tr e n g th p r o f i l e s in F ig . 4 .3 s in c e th e s e v a lu e s b e s t r e p r e s e n t th e g e n e r a l tr e n d s .
The r e s u l t s o f th e p la t e lo a d t e s t s perform ed under th e t i e in th e cen t e r o f th e tr a c k a re v e r y h ig h b eca u se v ery l i t t l e b a l l a s t m igrated under th e c e n te r o f t i e d u rin g th e tam ping p r o c e s s . In e s s e n c e ,: th e c e n te r o f tr a c k p la t e t e s t s were perform ed on th e com pacted tr a c k b ed . The s c a t t e r o f d a ta p o in ts in th e c e n te r o f tr a c k i s a l s o on the same ord er o f m agnitude as th e d a ta in F ig . 3 .7 a f t e r about 500 p a sse s fo r th e s im u la te d tr a c k bed. From F ig . 4 . 8 , th e range o f th e BBI v a lu e s a t 0 .2 in . ( 5 .1 mm) d efo rm a tio n i s from 236 p s i (1262kN/m^) to 318 p s i (2191 kN/m^). The a v era g e V alue o f 264 p s i (1819 kN/m^) i s c o n s i s t e n t w ith th e 279 p s i (1922 kN/m^) av era g e o b ta in e d
59

BA
LL
AS
T
BEA
RIN
G
IND
EX
, B
BI
(P
S!)
F ig u re 4 .8 . B a l la s t B earin g Index a t 0 .2 in . (5 .1 mm) D eform ation fo r D if f e r e n t Tamping R a ise s and B a l la s t P lacem en t C o n d itio n s
60
a f t e r 1000 p a s s e s fo r th e s im u la ted tr a c k bed.G e n e r a lly , th e p la t e lo a d t e s t r e s u l t s w ere f a i r l y c o n s i s t e n t fo r each
d i f f e r e n t amount o f tam ping r a i s e under th e t ie - u n d e r th e r a i l s , i . e . , th ea rea m ost a f f e c t e d by th e tam ping p r o c e s s . The BBI v a lu e s a f t e r a 2 in .(51 mm) r a i s e w ere s l i g h t l y g r e a te r than th o s e o b ta in e d a f t e r a 3 in . (76
*mm) r a i s e . The a v era g e BBI a t 0 .2 in . (5 .1 mm), d e fo rm a tio n a f t e r a 2 in .(51 mm) r a i s e was a p p ro x im a te ly 128 p s i (882 kN/m'2’) but f o r a 3 in . (76 mm) r a i s e i t was a p p ro x im a te ly 116 p s i (800 kN/m^). T h is r e s u l t appears l o g i c a l b e c a u se , a f t e r a 2 - in . (51-mm) r a i s e , th e r e i s a th in n e r la y e r o f lo o s e b a l l a s t betw een th e bottom o f th e t i e and th e com pacted tr a c k bed than th e r e i s a f t e r a. 3 - in . (76-mm) r a i s e . However fo r b oth c a s e s , th e c l o s e p r o x im ity o f th e com pacted tr a c k bed i s e x p e c te d to s l i g h t l y in f lu e n c e th e r e s u l t in g b a l l a s t s t i f f n e s s .The manual tam ping p r o c e s s d id red u ce th e av era g e b a l l a s t s t i f f n e s s 'u n d e r th e r a i l s to 46 p e r c e n t o f th e c e n te r o f th e tr a c k b a l l a s t s t i f f n e s s . The r e s u l t s o f th e s e p la t e lo a d t e s t s con firm s th e g e n e r a l tren d s t a t e d fo r th e b a l l a s t d e n s i t y t e s t s (F ig . 4 .7 a ) .
For p la t e lo a d t e s t s perform ed in th e c r ib under th e r a i l s , th e a v erageBBI a t 0 .2 in . ( 5 .1 mm) d efo rm a tio n in F ig . 4 .8 b i s a p p ro x im a te ly 52 p s i (
2(385 kN/m ) . T h is i s a p p ro x im a tley 43 p ercen t o f th e r e s p e c t iv e u n d e r - t ie v a lu e s . There i s v e r y l i t t l e s c a t t e r among th e t e s t r e s u l t s in th e c r ib s and th e two tam ping r a i s e s y ie ld e d n e a r ly i d e n t i c a l r e s u l t s fo r th e f u l l c r ib b a l l a s t c o n d i t io n s . The p la t e r e s i s t a n c e a f t e r tam ping i s low er than th e BBI v a lu e o f 74 p s i (510 kN/m ) a t zero p a s s e s on th e s im u la te d tr a c k bed . T h is a ls o fo l lo w s th e same tren d e x h ib ite d f o r th e b a l l a s t d e n s i t y t e s t s in th e tamped zon es o f th e "crib (F ig . 4 .7 b ) . A lthough th e r e s u l t s o f th e s e two
61

LATE
RAL
TIE R
ESISTA
NCE
(LB)
b a l l a s t p h y s ic a l s t a t e t e s t s are c o n s i s t e n t , i t i s s t i l l in c o n c lu s iv e to s t a t e th a t th e tam ping p r o c e ss s o l e l y produced a lo o s e r c r ib b a l l a s t c o n d it io n .
One p la t e lo a d t e s t , i . e . , PLT I I - 5 , was perform ed in th e tamped zone o f th e c r ib p r io r to r e b a l la s t in g . F ig . 4 .8 shows th a t th e BBI v a lu e o f 129 p s i (889 kN /nr) a t 0 .2 in . ( 5 .1 mm) d efo rm a tio n i s s i g n i f i c a n t l y g r e a te r than th e BB v a lu e s in th e c r ib , bu t i t i s a p p ro x im a te ly e q u a l to th e u n d e r - t ie v a lu e s . T h is r e s u l t i s ex p ec ted b ecau se th e b a l l a s t t e s t c o n d it io n s are s im i la r f o r b o th t h i s t e s t and th o se under th e t i e . In each c a s e , approxim a te ly 4 in . (0 .1 0 2 m) o f lo o s e b a l l a s t o v e r l i e s th e com pacted tr a c k b ed , t h e r e f o r e , th e p la t e r e s i s t a n c e s a re com parable.
A c o r r e la t io n o f th e p la t e lo a d and b a l l a s t d e n s i t y t e s t s r e s u l t s f o r th e manual t i e tam ping s e r i e s fo l lo w th e same tr e n d s e s t a b l i s h e d fo r th e s im u la te d tr a c k bed ( s e e F ig . 3 . 8 ) .4.3 COMPARISON WITH FIELD DATA
. The b a l l a s t p h y s ic a l s t a t e t e s t r e s u l t s o b ta in e d from a v a i la b le f i e l d in v e s t ig a t io n s w ere compared to th o se o b ta in ed in t h i s s tu d y to p r o v id e an in d ic a t io n o f th e r e l i a b i l i t y o f th e la b o r a to r y t e s t p ro ced u res u sed h e r e . P e r t in e n t l a t e r a l t i e push t e s t r e s u l t s are g r a p h ic a l ly compared in F ig .4 .9 , w h ile p la t e lo a d t e s t and i n - s i t u b a l l a s t d e n s i t y t e s t r e s u l t s a r e prov id ed in T able 4 .2 . For c o n v e n ie n c e , th e b a l l a s t b e a r in g in d ex a t 0 .2 - i n . (5.1-m m ) d e fo rm a tio n fo r th e PLT and l a t e r a l t i e r e s i s t a n c e a t 0 .1 5 7 - in .(4-mm) d isp la c e m e n t f o r th e LTPT were c o n s id e r e d r e p r e s e n t a t iv e fo r compara t iv e p u rp o ses.
A com parison o f d a ta from SUNYAB f i e l d t e s t i n g a t both I l l i n o i s C en tra l G ulf R a ilro a d (ICG) and a t FAST was done by P an u ccio and Dorwart (R ef. 4 ) and
63
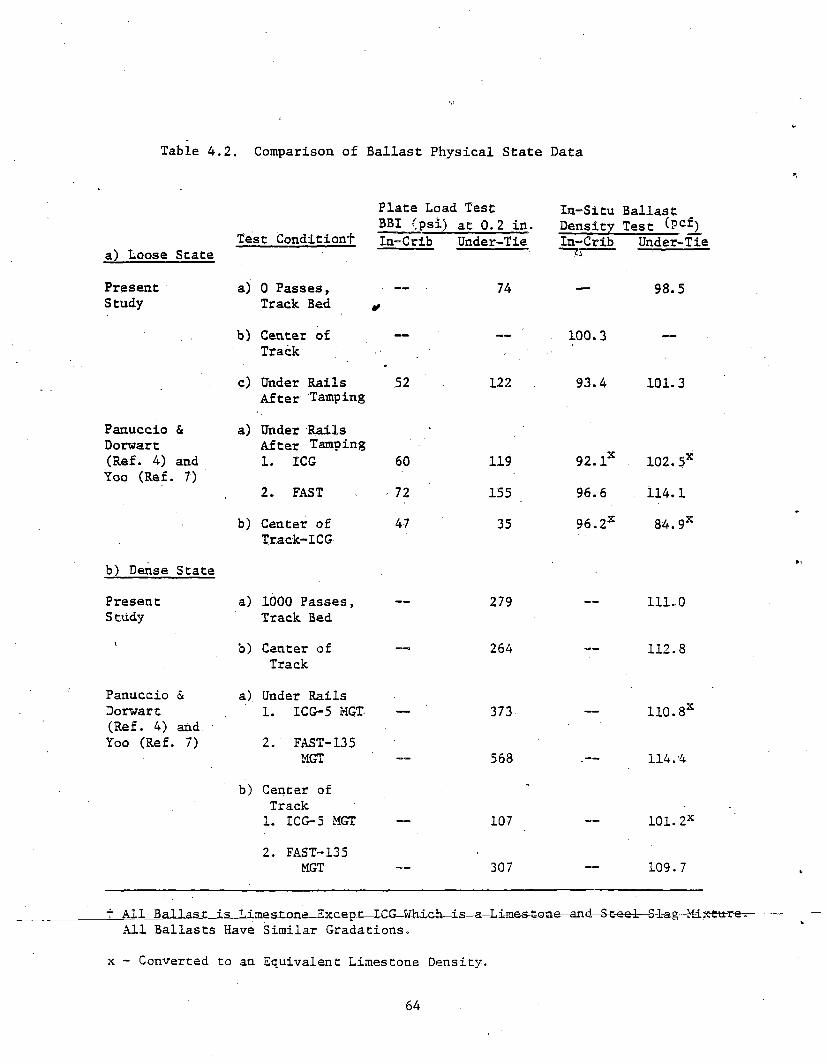
Table 4 .2 . Comparison o f B a l la s t P h y s ic a l S ta te D ata
P la te Load[ T est I n -S itu B a l la s tBBI ( p s i ) a t 0. 2 in . D e n s ity T e st (Pc ^)T est C o n d itio n t In-C rib U nder-Tie In-C rib U nder-Tiea) L oose S ta te A
P resen t a) 0 P a s s e s , . —_ ' 74 9 8 .5Study Track Bed yb) C enter o f — 100. 3
Trackc) Under R a ils 52 122 . . 9 3 .4 1 0 1 .3
A fte r TampingP anuccio & a) Under R a ilsDorwart A fte r Tamping(R ef. 4) and 1. ICG 60 119 9 2 .1X 1 0 2 .5XYoo (R ef. 7)
2 . FAST 72 155 9 6 .6 1 1 4 .1b) C enter o f 47 35 9 6 .2X 84. 9X
Track-ICGb) Dense S ta teP r e se n t a) 1000 P a s s e s , — — 279 11 1 .0Study Track Bed
\ b) C enter o f — 264 112 .8Track
P anuccio & a) Under R a ilsDorwart 1. ICG-5 MGT — 373- — 1 1 0 .8X(R e f. 4) and ■Yoo (R ef. 7) 2. FAST-135
MGT “ 568 .— 1 1 4 .4b) C enter o f -
Track1. ICG-5 MGT - ™ 107 ~ 1 0 1 .2X2. FAST-135
MGT — 307 — 1 0 9 .7
f All Ballast is T.imsstnng Exoppr TCG—Which—is—a—Limes-tone-^and-Steel— Sl-ag—Mixru-re-r All Ballasts Have Similar Gradations.
x - Converted to an Equivalent Limestone Density.
64

Yoo (R ef. 7 ) . The form er r e p o r t in c lu d e s b oth PLT and LTPT d a ta , w h ile th e l a t t e r in c lu d e s th e BDT m easurem ents.
The b a l l a s t a t ICG was a m ix tu re o f s t e e l s la g and lim e s to n e . At ICG, th e b a l l a s t p h y s ic a l s t a t e t e s t s were perform ed in th r e e d i f f e r e n t tr a c k c o n d it io n s : 1) tamped o n ly , 2) tamped and com pacted, and 3) tamped p lu s 5 m i l l io n g r o ss to n s o f t r a f f i c . A lim e s to n e b a l l a s t was t e s t e d a t FAST fo r th e tamped o n ly , 0 .1 MGT, and 135 HGT c o n d i t io n s . The tr a c k s t r u c t u r e si . e . , t i e w eig h ts, and, b a l l a s t c r ib and sh o u ld e r c o n d i t io n s , w ere s im i la r f o r b oth th e la b o r a to r y and f i e l d t e s t s .
A com parison o f th e average f i r s t c y c le LTPT lo a d -d is p la c e m e n t cu rv es a f t e r tam ping fo r t h i s p r o je c t (F ig . 4 .9 a ) and th e f i e l d cu rv es ( F ig . 4 .9 b ) in d ic a t e s th e la b o r a to r y v a lu e s o f l a t e r a l t i e r e s i s t a n c e range from 50 to 159 lb (223 to 668 N) low er than th e f i e l d r e s u l t s . The r e a so n f o r t h i s d i f f e r e n c e i s n o t r e a d i ly a p p a ren t, b eca u se b oth th e t e s t ap p aratu s and th e t e s t p roced u re w ere th e sam e. However, an ex a m in a tio n o f th e ra n g es o f th e l a t e r a l t i e r e s i s t a n c e v a lu e s a t 0 .1 5 7 in . (4 mm) d isp la c e m e n t in d ic a t e s more fa v o r a b le agreem en t.
At b oth f i e l d s i t e s , p la t e load t e s t s w ere perform ed a t v a r io u s lo c a t io n s w ith in th e tr a c k s t r u c t u r e (T able 4 -.2 ). A fte r th e tam ping o p e r a t io n a t ICG,th e a verage BBI a t 0 .2 in . ( 5 .1 ram) d eform ation under th e t i e and under the
2r a i l was 119 p s i (820 kN/m ) . The same t e s t c o n d it io n s a t FAST y ie ld e d a2v a lu e o f 155 p s i (1068 kN/m ) . The la b o r a to r y t e s t s produced a com parable
av era g e BBI o f 122 p s i (841 kN/m^).P la t e lo a d t e s t s were a ls o perform ed in th e c r ib a rea under th e r a i l s
w hich i s where th e tam ping t o o l s o p e r a te , i . e . , a p p ro x im a te ly 6 in . (0 .1 5 3 m)
65
from th e b a se o f th e r a i l . The BBI v a lu e a t 0 . 2 - in . (5.1-m m ) d efo rm a tio n2 owas 60 p s i (413 kN/m ) a t ICG and 70 p s i (482 kN/m^) a t FAST. The a v erage
BBI o f 53 p s i (365 kN/m ) in th e la b o r a to r y gave a com parable r e s u l t . Fort h i s p a r t ic u la r t e s t c o n d i t io n , th e BBI v a lu e s from th e la b o r a to r y manualt i e tam ping o p e r a tio n showed v e r y good agreem ent w ith th e r e s u l t s o b ta in e da f t e r m ech an ica l t i e tam ping from b oth f i e l d s i t e s .
The i n - s i t u b a l l a s t d e n s i t y t e s t r e s u l t s d em on stra te th e same c o n s is t e n c ya s th e p la t e lo a d t e s t s under th e r a i l s f o r th e a f t e r tam ping c o n d it io n(T ab le 4 . 2 ) . In th e c r ib , th e b a l l a s t d e n s i t y fo r t h i s p r o j e c t was 9 3 .4p c f (1 .4 9 Mg/m^) w hich i s com parable to th e 9 2 .1 p c f (1 .4 7 Mg/m^) f o r ICGand th e 96.6" p c f (1 .5 5 Mg/m ) f o r FAST. Under th e t i e , t h i s p r o je c t y ie ld e d
3a d e n s i t y o f 1 0 1 .3 p c f (1 .6 2 Mg/m ) w hich i s re a so n a b ly c lo s e to th e 1 0 2 .5Op c f (1 .6 4 Mg/m ) o b ta in e d a t ICG but s i g n i f i c a n t l y l e s s than th e 1 1 4 .1 p c f
(1.-83 Mg/m^) o b ta in ed a t FAST. The r e a so n s f o r th e FAST r e s u l t b e in g g r e a te r may be a t t r ib u te d to th e tr a c k lo a d in g h is t o r y and o th e r f a c t o r s a t FAST w hich are a d eq u a te ly d is c u s s e d by Yoo (R e f . 7 ) . In g e n e r a l , th e manual t i e tam ping o p e r a tio n s a t i s f a c t o r i l y d u p l ic a t e s th e f i e l d b a l l a s t d e n s ity c o n d it io n s .
P la te lo a d t e s t s - were a l s o con d u cted under th e t i e in th e c e n te r o f the t r a c k , i . e . , c e n te r e d betw een th e r a i l s . For t h i s t e s t l o c a t i o n , a s im i la r d is c u s s io n was p r e v io u s ly fo c u se d in C hapter 3 upon th e end r e s u l t s obta in e d from th e s im u la te d o ld tr a c k bed c o n d it io n s . A fte r 5 MGT o f t r a f f i c a t ICG, th e average BBI a t 0 .2 in . ( 5 .1 mm) d efo rm a tio n was 107 p s i (737 kN/m^) , and th e d e n s ity was 1 0 1 .2 p c f (1 .6 2 Mg/m^). A fte r 135 MGT o f t r a f f i c a t FAST, th e BBI was 307 p s i (2115 kN/m ^), and th e d e n s ity was 1 0 9 .7
66

p c f (1 .7 6 Mg/m ) . In th e la b o r a to r y , th e co rresp o n d in g a v era g e BBI v a lu e was 264 p s i (1819 kN/m^), and th e b a l l a s t d e n s i t y was 1 1 2 .8 p c f (1 .S 0 Mg/m^) w hich a re com parable to th e FAST r e s u l t s a t 135 MGT. N o te , h ow ever, th a t th e la b o r a to r y c e n te r o f tr a c k BBI v a lu e s a r e low compared to th o s e o b ta in e d under th e r a i l s f o r 5 MGT a t ICG and 135 MGT a t FAST (T a b le 4 . 2 ) .
G e n e r a lly , th e p la t e lo a d t e s t and i n - s i t u b a l l a s t d e n s i t y t e s t d a ta o b ta in e d in t h i s p r o j e c t were in f a i r l y good agreem ent w ith a l l o f th e f i e l d t e s t d a ta . The LTPT d a ta from t h i s p r o je c t fo llo w e d th e same g e n e r a l tren d in th at, th e l a t e r a l t i e r e s i s t a n c e o b ta in e d in th e la b o r a to r y was com parab le, b u t somewhat l e s s than th e r e s i s t a n c e s o b ta in e d in th e f i e l d .
67

5 . INVESTIGATION OF CRIB COMPACTION PLATE
5 .1 APPARATUS AND PROCEDUREST e s t B o x es. The b a l l a s t t e s t sam p les w ere p rep ared in 1 2 - in . (305-mm)
deep sm a ll and ^arge t e s t b o x e s , w h ich w ere 20 i n . (0 .5 0 8 m) and 36 in .(0 .9 1 4 m) sq u a re , r e s p e c t iv e ly . The w a l ls o f each t e s t box a re c o n s tr u c te d o f 3 / 4 - in . (19-mm) plywood and r e in fo r c e d w ith 2 - in . (51-mm) s t e e l a n g le ir o n . The a n g le ir o n p ro v id ed th e a d d it io n a l l a t e r a l s t i f f n e s s to en su re th e c o n ta in e r was r i g i d . The b ottom o f th e t e s t b oxes a re a l s o 3 /4 in .(19-rmm) plywood and a l l b o l t h o le s a re co u n ter sunk su ch th a t thie c o n n e c to r s w ere f lu s h w ith th e plywood s u r f a c e . T h is l a t t e r f e a t u r e in c o n ju n c t io n w ith th e s t i f f n e s s o f th e b a se p r e v e n ts th e t e s t box d e fo rm a tio n from in f lu e n c in g th e t e s t r e s u l t s .
For th e t e s t s w ith th e 9 i n . (229. mm) and 6 in . (152 mm) b a l l a s t d e p th s , 1 8 -3 /4 in . (0 .4 8 m) d iam eter c o n c r e te sp a c e r d is k s w ere f a b r ic a t e d and p la c e d in s id e th e t e s t box p r io r to f i l l i n g w ith b a l l a s t . T hese w ere th e same d is k s th a t Wayne (R ef. 6) u sed .
Crib Compaction P la t e . The c r ib p la t e i s c o n s tr u c te d o f 7 /1 6 in . (11 mm) th ic k s t e e l p la t e h av in g an 8 - i n . (203-mm) w id th and 1 4 - 1 / 2 - i n . (368-mm ) le n g th . The p la t e was r e in fo r c e d a g a in s t bend in g by w e ld in g 3 - i n . (76-mm) ch a n n e l s e c t io n s in a r e c ta n g u la r array on th e p l a t e . Two narrow s t e e l p la t e s w ere w elded on th e o p p o s it e f la n g e o f th e ch a n n e ls to p r o v id e a com-, p a t ib le a ttach m en t to th e b ottom lo a d in g head o f th e MTS a c tu a to r (F ig . 5 . 1 ) .
Two 1 8 - in . (0 .457-m ) lo n g aluminum S6 I-beam s e c t io n s w ere p la c e d v e r t i c a l l y to a c t as s t r u c t u r a l f i l l e r s betw een th e bottom o f th e a c tu a to r and th e top o f th e com paction p l a t e . The h e ig h t and c le a r a n c e b etw een th e I -
68
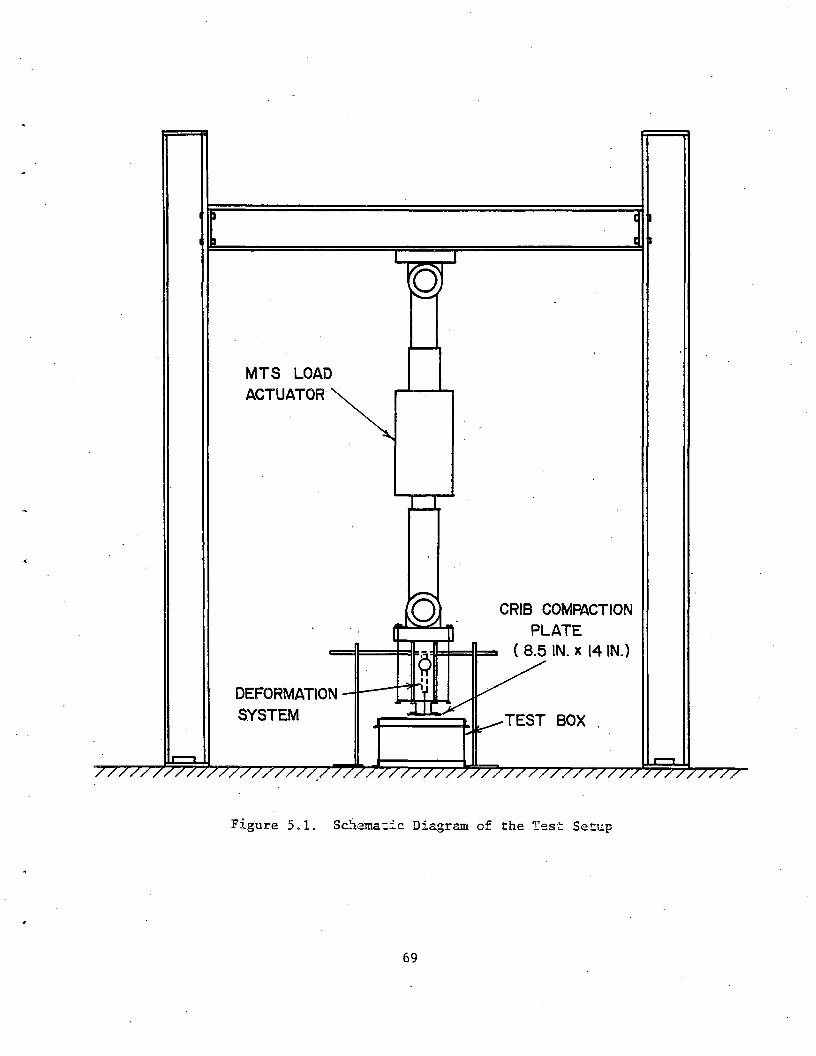
F ig u re 5 .1 . S chem atic Diagram o f th e T e s t Setup
69
beams was s u f f i c i e n t fo r p lacem en t o f th e d efo rm a tio n m easu rin g sy stem .The c r ib com paction p la t e and th e I-beam co u ld e a s i l y be a tta c h e d a s a r ig id u n it to th e MTS a c tu a to r by fo u r th rea d ed ro d s.
Load and D eform ation S y ste m s. The lo a d a p p ly in g and m easu rin g sy stem w ere p ro v id ed f o r by th e S tr u c tu r a l and M a te r ia ls T e s t in g System , Model 9 0 2 .- 38 (R ef. 2 1 ) . The th r e e b a s ic com ponents o f th e sy stem u sed a r e th e s t r u c t u r a l a c tu a to r , th e e le c t r o n ic c o n t r o l p a n e l and th e h y d r a u lic power su p p ly . The lo a d s a re programmed through th e c o n tr o l p a n e l and a re h y d r a u l ic a l ly a p p lie d through th e s t r u c t u r a l a c tu a to r . The c o n t r o l p a n e l i s ca p a b le o f o p e r a t in g on e i t h e r lo a d c o n tr o l or s t r o k e (d isp la c e m e n t) c o n t r o l . The maximum lo a d c a p a b i l i t y o f th e a c tu a to r i s 250 k ip s (1 ,1 1 2 kN) s t a t i c fo r c e and + 250 k ip (1 ,1 1 2 kN) dynam ic fo r c e . The maximum s tr o k e c a p a c ity i s + 4 in c h e s (102 mm). A lso lo c a t e d on th e c o n tr o l p a n e l i s th e fu n c t io n g e n e r a to r w hich c o n tr o ls th e ty p e o f c y c l i c waveform a p p l ie d , i . e „ , s in e w ave, and th e a p p lie d f r e quency. L ocated on th e s t r u c t u r a l a c tu a to r i s a lo a d c e l l tr a n sd u c e r fo r r e c o r d in g th e a p p lie d lo a d s and a l in e a r v a r ia b le d i f f e r e n t i a l tra n sfo rm er (LVDT), w hich m easures th e d isp la c e m e n t . The MTS o p e r a te s on th e "C losed Loop C ontrol" c o n c e p t. T h is e n t a i l s c o n s ta n t ly making an a d ju stm en t to e i t h e r th e load or th e s tr o k e b ased on th e feed b a ck s ig n a l .
The MTS a c tu a to r was su spend ed from an H-fram e c o n s tr u c te d o f heavy s t r u c t u r a l s t e e l s e c t io n s (F ig . 5 . 1 ) . Ample sp a ce i s p ro v id ed fo r th e c r ib com paction p la t e ap p aratu s and th e t e s t b o x e s .
The lo a d in p u t was record ed by w ir in g th e Y -a x is o f th e X-Y r e co rd er in t o the MTS lo a d tra n sd u cer c o n d it io n e r m odule. T h is module c o n v e r ts an
~kS~ cu rren t to~~DC~eurrent whictT“d r iv e s th e r e c o r d e r pen on th e lo a d a x i s .70
O r ig in a l ly , th e p lan was to u se th e LVDT lo c a t e d on th e s t r u c t u r a l a c tu a to r to m easure th e b a l l a s t d efo rm a tio n under th e a p p lie d s t a t i c and c y c l i c lo a d in g c o n d it io n s . However, d e fo rm a tio n s in th e com p action p la t e a tta ch m en ts and th e s t r u c t u r a l H-fram e proved to be s i g n i f i c a n t w ith r e - -
sjpect to th e m easured b a l l a s t d e fo r m a tio n s . Thus, a new sy stem was d e v ised , w ith an in d ep en d en t d isp la cem en t tr a n sd u c e r , i . e . , DCDT, to e l im in a t e t h i s e r r o r .
The DCDT i s con n ected in a s e r i e s arrangem ent w ith a m ech a n ica l d i a l in d ic a t o r h a v in g 1 in . (2 5 .4 mm) t r a v e l . The d isp la c e m e n t g a g es a re r i g i d l y f ix e d and a l ig n e d on a su p p ort tr a c k such th a t t h e i r p is t o n s move f r e e l y .T h is i s a l s o th e same d efo rm a tio n m easuring sy stem th a t i s u sed f o r th e p la t e lo a d t e s t .
The d efo rm a tio n system i s lo c a t e d betw een th e I-beam s o f th e assem b led c r ib com p action p la t e "apparatus (F ig . 5 . 1 ) . A s e a t in g h o le i s lo c a t e d a t th e c e n te r o f th e p l a t e , such th a t th e DCDT r e c o r d s th e a v era g e p la t e d i s p lacem en t and i s n o t in f lu e n c e d by p la t e r o t a t io n . The s i m p l i c i t y o f t h i s sy stem s p r o v id e s f o r e a sy assem bly and a lig n m e n t.
The DCDT was powered w ith a DC cu r r e n t p ro v id ed by a sta n d a rd 6 - v o l t la n te r n b a t t e r y . The v o lt a g e g e n era ted from th e DCDT co re movement powered th e pen a lo n g th e X -a x is on th e X-Y r e c o r d e r .
Sample P r e p a r a t io n . The te c h n iq u e used s a t i s f i e d two r e q u irem en ts:1) th e b a l l a s t sam ple would have a r e p r o d u c ib le i n i t i a l box d e n s i t y , and2) th e sam ple had to be in a lo o s e d e n s ity s t a t e . The same cru sh ed lim e s to n e ( s e e F ig . 3 .2 ) was u sed fo r th e s e t e s t s .
A la r g e m eta l scoop was f i l l e d w ith b a l l a s t and was h e ld w ith th e open
71

end o f th e sco o p r e s te d on th e b a se o f th e t e s t box. The scoop was g r a d u a lly t i l t e d su ch th a t th e b a l l a s t was g e n t ly d e p o s ite d u n ifo rm ly a c r o s s th e a rea o f th e box. T h is p roced u re was c o n tin u e d u n t i l th e b a l l a s t was l e v e l w ith th e s id e s o f th e t e s t box . The sam ple was l e v e l e d even w ith s id e s o f th e box by runnin g a s t r a ig h t edge a c r o s s th e to p . Any b a l l a s t p a r t i c l e s th a t ex ten d ed above th e bottom o f th e s t r a i g h t edge w ere rem oved. Any la r g e v o id s c r e a te d by t h i s p r o c e ss w ere f i l l e d su ch t h a t th e b a l l a s t was e n t i r e l y below th e s t r a ig h t ed g e . T h is p r o c e ss r e s u l t e d in a v ery f l a t , even b a l l a s t s u r fa c e .
T his te c h n iq u e was s u c c e s s f u l in f u l f i l l i n g th e two m ajor o b j e c t iv e s .3The o v e r a l l a v era g e i n i t i a l box d e n s i t y o f 26 t e s t s i s 8 2 .1 p c f (1 .3 1 2 Mg/m )
and th e stan d ard d e v ia t io n i s 0 .9 9 2 p c f (0 .0 1 6 Mg/m^). The sta n d a rd d e v ia t io n i s v ery low w hich means th a t r e p r o d u c ib i l i t y o f th e sam ple p r e p a r a tio n tech n iq u e i s good . A lso , th e b a l l a s t was p rep ared in a lo o s e s t a t e , when compared to lo o s e s t a t e b a l l a s t d e n s i t i e s o f o th e r p u b lish e d la b o r a to r y r e p o r ts (R e fs . 3 , 5 , and 6 ) .
The 6 - in . (152-mm) and 9 - in . (229-mm) la y e r d epth sam ples w ere p repared in a s im i la r fa s h io n to th a t o f th e 1 2 - in . (305-mm) deep sam p les ■ p r e v io u s ly d e s c r ib e d . The d i f f e r e n c e was th a t th e c o n c r e te sp a c e r d is k s w ere p la ced in th e bottom o f th e t e s t box p r io r to f i l l i n g w ith b a l l a s t .The tech n iq u e u sed to prep are th e la r g e 3 - f t (0 .9 1 5 -m ) sq u are t e s t box sam p les was e x a c t ly th e same as th e sm a ll t e s t box p r e p a r a tio n te c h n iq u e . However, th e i n i t i a l box d e n s i t i e s w ere n o t record ed fo r th e la r g e t e s t box s e r i e s .
L e v e lin g o f th e b a l l a s t s u r fa c e was an im p ortan t s te p to in s u r e proper o p e r a tio n o f th e MTS s t r u c t u r a l a c t u a to r . The a c tu a to r o f f e r s o n ly a x ia l
72

r e s i s t a n c e or a p p l ie s o n ly an a x ia l lo a d . An uneven b a l l a s t s u r fa c e would have c r e a te d a b end in g moment in th e a c tu a to r as th e lo a d was a p p lie d . An a p p lie d b end in g moment o f s i g n i f i c a n t m agnitude th u s h as th e c a p a b i l i t y o f damaging th e a c tu a to r .
T e s t P rocedure and Program. A fte r th e b a l l a s t was p rep a red , th e sam ple was s u b je c te d to s t a t i c and c y c l i c lo a d in g u t i l i z i n g th e s i n g l e c r ib comp a c t io n p la t e . The proced u re fo r a t y p ic a l t e s t i s as f o l lo w s :
1 . W ith th e MTS s t r u c t u r a l a c tu a to r in f u l l y r e t r a c te d p o s i t i o n , th e b a l l a s t t e s t box c o n ta in in g th e prepared t e s t sam ple was c a r e f u l ly c e n te r e d under th e c r ib com paction p la t e a p p a ra tu s.
2 . The DCDT was con n ected to th e X -a x is and th e M TS.load tra n sd u cer c o n d it io n e r m odule was w ired in t o th e Y -a x is o f th e X-Y r e c o r d e r . The MTS d i g i t a l d is p la y was s e t to read th e a p p l ie d . lo a d .
3 . C a lib r a te th e d isp la c e m e n t in p u t by m oving th e b r a ss rod an eq u a l d is t a n c e , u s u a l ly 0 .4 in . (1 0 .1 mm), in t o and o u t o f th e DCDT h o u sin g s e v e r a l t im e s .
4 . Axes w ere in s c r ib e d on th e lo a d -d isp la c e m e n t c u r v e , and th e p lo twas la b e le d w ith th e d a te , t e s t s e r i e s number, r e c o r d e r v o l t a g e range s e t t i n g s , and t e s t c o n d i t io n s . ,
5. The MTS was sw itch ed to lo a d c o n t r o l , and a sm a ll s e a t in g lo a d , a p p ro x im a te ly 100 lb (445 N ) , was a p p lie d by th e com paction p la t e to th e b a l l a s t sam ple.
6 . The d efo rm a tio n system was p o s it io n e d and th e DCDT was s e t so th a t i t was f u l l y r e tr a c te d .
7. At t h i s p o in t , th e d ia l gage rea d in g on th e d efo rm a tio n sy stem and73

the MTS digital display reading were recorded. These readings represented
the initial point of the static loading portion of the load-deformation curve.
8. On the MTS control panel, the frequency and the type of waveform
(sine) desired were programmed through the function generator. The cyclic
load wa?) programmed through the Span I control on the command input module¥
and the load transducer conditioner module. The number of cycles was also
specified.
9. The load on the ballast was increased gradually until the programmed
initial static load was achieved.
10. The deformation dial gage reading and the digital display reading
on the MTS control panel were recorded after the deformation ceased at the
static load level.
11. The programmed cyclic load was applied. The recorder pen remained
in the down position for 15 to 20 cycles, or until the permanent deformation
for each cycle became very small. The pen was then lifted and placed down
on a regular interval basis, usually every 25 cycles.
12. When the given number of loading cycles was reached, the program
was stopped and both the dial gage reading and the MTS digital display
reading were recorded.
13. The static load was gradually reduced to approximately 100 lb
(445 N), wherein the final digital display and dial gage readings were re
corded.
14. The deformation system was removed, and the small load on the
ballast was removed.
In order to evaluate the changes in the physical state of ballast with
74

the crib compaction plate, the pla:te load test (PLT) and the in-situ ballast
density test (BDT)' were employed. Complete descriptions of the test apparatus
and test procedures have been provided in Section 3.
However, the PLT loading system (Fig. 5.2) was adapted to the loading
head of the MTS structural actuator, which primarily provided the dead
weight reaction. The height of this system was approximately equal to that
of the assembled crib compaction plate apparatus. Thus, the two systems
were easily interchangeable and no modification was required to the remaining
test equipment. The stroke of the MTS actuator was sufficient to properly
position either apparatus with respect to the test specimen height.
The test program was designed in such a manner so that the effects of
variations, on the static and cyclic loads could be examined. Other effects
that were tested were the influence of the layer depth and the effect of
lateral boundary conditions. A summary of the tests performed with the
variables for each test are shown in Table 5.1. Also listed is the physical
state test that was performed following each compaction test.5.2 TEST RESULTS
Load-Displacement Curves. A typical load-displacement curve illustrated
in Fig. 5.3 shows that the ballast was first loaded statically to a predeter
mined level and then cycled about that level with a predetermined cyclic load
for a given number of cycles. The MTS normally required several cycles
before it actually reached the full programmed cyclic load. Following
cycling, the ballast was unloaded. Examination of these curves (Ref. 22)
revealed two important points: 1) the programmed cyclic load was rarely
achieved, and 2) the mean static load (F . ), i.e., the mid-pointstatxc mean75

Figure 5.2. Scaematic Diagram of Plate Load Test (PLT) Apparatus Setup
76
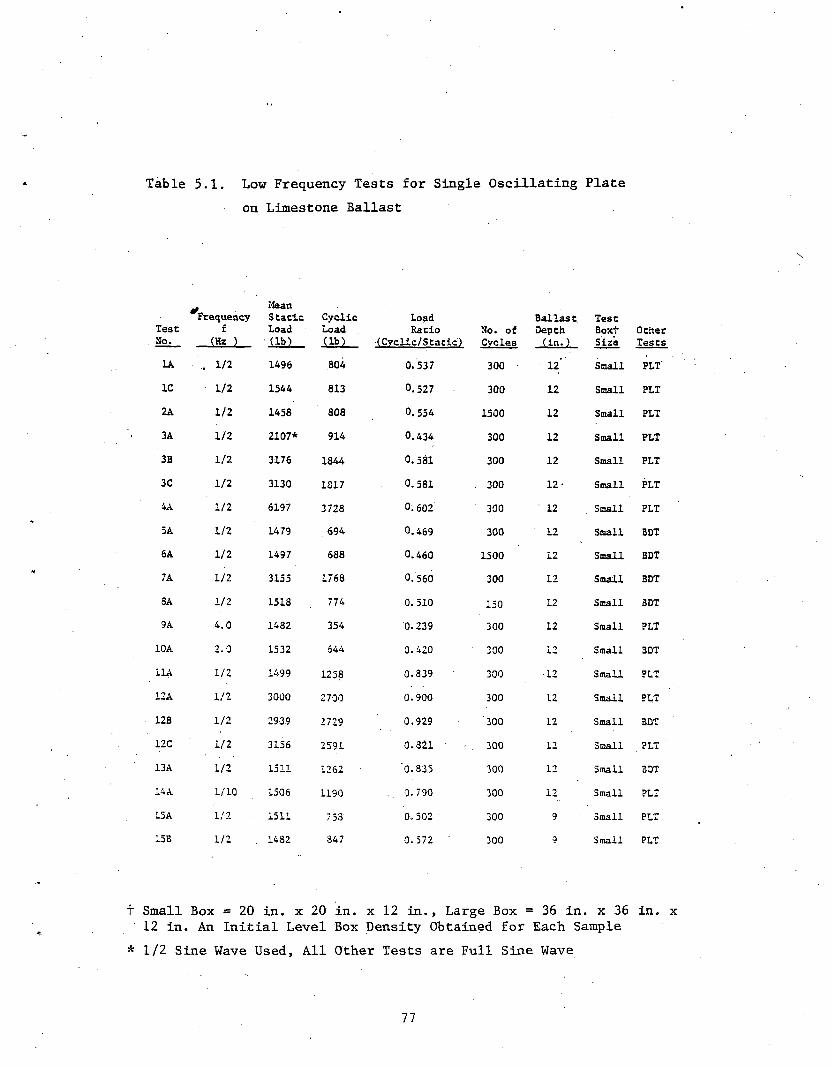
Table 5.1 Low Frequency Tests for Single Oscillating Plateon Limestone Ballast
TestSo.
^Frequencyf
(Hz )
MeanStaticLoad(lb)
CyclicLoad(lb)
LoadRatio So. of
(Cyclic/Stacic) CvclesBallast Depth (in.)
TestBoxtSire
OtherTests
1A . 1/2 1496 804 0.537 300 12" Small PLT1C 1/2 1544 813 0.527 300 12 Small PLT2A 1/2 1458 808 0. 554 1500 12 Small PLT3A 1/2 2107* 914 0.434 300 12 Small PLT3B 1/2 3176 1844 0.581 300 12 Small PLT3C 1/2 3130 1817 0.581 . 300 1 2 - Small PLT4A 1/2 6197 3728 0. 602 300 12 Small PLT5A 1/2 1479 694 0.469 300 12 Small BDT6A 1/2 1497 688 0.460 1500 12 Small BDT7A 1/2 3155 1768 0.560 300 12 Small BDT3A 1/2 1518 774 0.510 150 12 Small BDT9A 4.0 1482 354 0.239 300 12 Small PLT10A 2.0 1532 544 0.420 300 12 Small 3DT11A 1/2 1499 1258 0.339 300 •12 Small PLT12A 1/2 3000 2700 0. 900 300 12 Small PLT
■ 12B 1/2 2939 2729 0.929 '300 12 Small BDT12C 1/2 3156 2591 0.321 300 12 Small PLT13A 1/2 1511 1262 '0.83.5 300 12 Small BDT14A 1/10 1506 1190 . . 0.790 300 12 Small PLTL5A 1/2 1511 7 53 0.502 300 9 Small PLT13B 1/2 1432 847 0.572 300 9 Small PLT
Small Box = 20 in. x 20 in. x 12 in., Large Box = 36 in. x 36 in.12 in. An Initial Level Box Density Obtained for Each Sample
* 1/2 Sine Wave Used, All Other Tests are Full Sine Wave
77
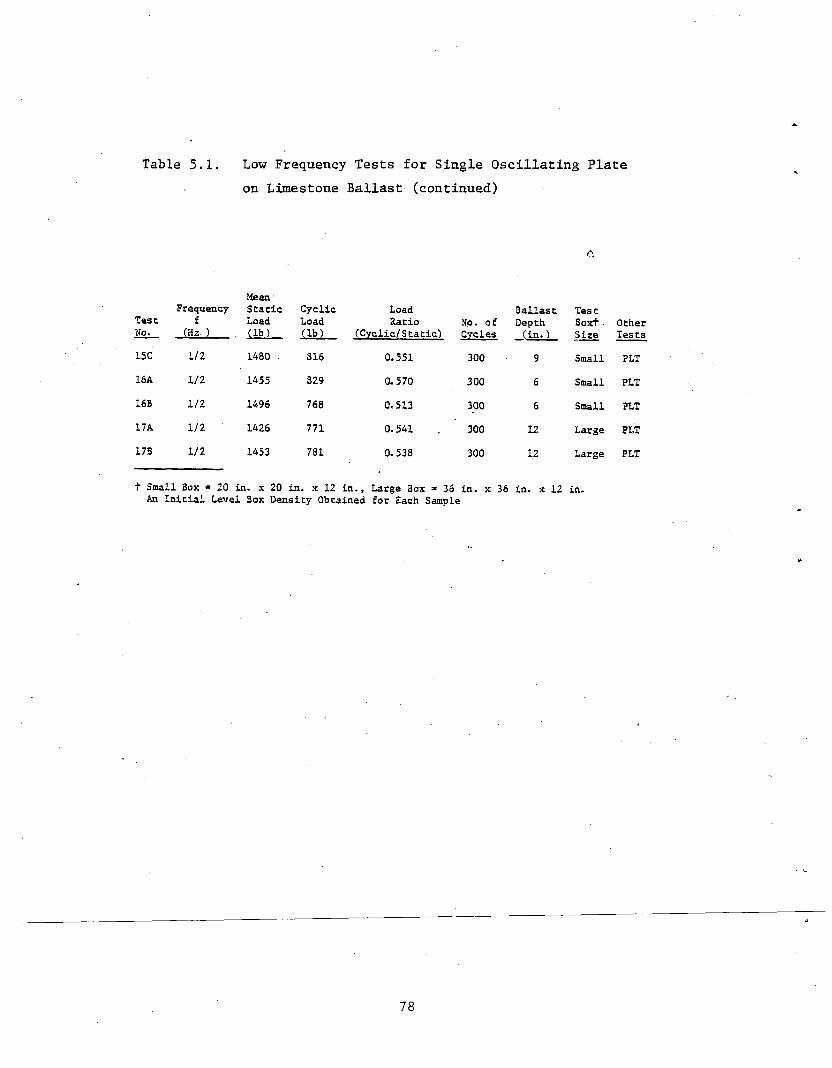
Table 5.1. Low Frequency Tests for Single Oscillating Plateon Limestone Ballast (continued)
<Ti
TestNo.
Frequencyf
(Hz. )
MeanStaticLoad(lb)
CyclicLoad(lb)
LoadRatio
(Cyclic/Static)No. of Cycles
BallastDepth(in.)
Test Boxi ■ Size
OtherTests
ISC 1/2 1480 . 316 0.551 300 9 Small PLT16A 1/2 1455 829 0.570 300 6 Small PLT16B 1/2 1496 768 0.513 300 6 Small PLT17A 1/2 1426 771 0.541 300 12 Large PLT17B 1/2 1453 781 0.538 300 12 Large PLT
t Small Box * 20 in. x 20 in. x 12 in., Large Box » 36 in. x 36 in. x 12 in.An Initial Level Box Density Obtained for Each Sample
78

Figure 5.3. Typical Load-Displacement Curve for Crib Compaction Plate with Definition of Terms
79
between the lower and upper cyclic peak, did not coincide with the initial
static load (^stat£c initial^" However, these features do not pose a significant problem, and have been taken into consideration during the data
reduction process (Ref. 22).
From Fig. 5.3, the intercept of the load-displacement curve was easily
defined by a linear extrapolation of the static loading portion of the curve,
and proportioning the recorded static load outputs for zero lb load, which
subsequently defined zero displacement. The average cyclic load was obtained
as one-half the total cyclic load output (peak to peak). As previously
stated, this would subsequently define the mean static load during cycling
and the associated mean static deformation could then be determined. The
cumulative cyclic deformation (CCD) was determined as the deformation from
the beginning of the first cycle to the unloading side of the cycle in
question at the mean static load.
Static Load. For all of the test performed in the small test box with
a 12 in. (305 mm) ballast depth, the mean static deformation increased as
the mean static load was increased (Fig. 5.4). The shape of the overall
average curve is concave upwards. The expected shape of this curve is
concave downwards. The reason for the departure from the expected behavior
is that the static deformation for the 6197 lb (27,577 N) load is low. This
may have been caused by the limited depth of the test box. In other words,
the effect of the bottom boundary influenced this test.
The average curves for the 3090 lb (13, 751 N) and the 1519 lb (6760 N)
tests are also shown in Fig. 5.4. These load values represent the average
for- 2ach particular load-level. To compute the 309U lb (T3~, 751 N) average
30

MEAN
STATI
C LO
AD (L
B)
Figure 5.4. Relationship Between Mean Static Load and Static Deformation in the Small Test Box
81
curve, the average deformations at 1519 lb (6760 N), 2107 lb (9376 N) and
3090 lb (13, 751 N) were plotted. This latter curve is nearly linear, but
has lower static deformations at-1519 lb (6760 N) average curve. This dif
ference cannot be explained by the average initial box density, which for
the 1519 lb (6760 N) tests was 81.9 pcf (1.312 Mg/m^) and for the 3090 lb
(13,751 N) tests was 82.1 pcf (1.315 Mg/m^). However, note the results from
one of the 3090 lb (13,751 N) tests produced extremely low static deformations,
which when not considered, yields much better agreement between the two
average curves.
The relationship between the mean static deformation and initial box
density for different mean static loads is shown in Fig. 5.5. The general
trend is for the static deformation to increase as the initial box density
decreases for a given mean static load. The static deformation increases
with an increasing mean static load at a given initial box density. These
are both expected trends. However, the range of the initial densities from
81.0 pcf (1,298 Mg/m^) to 83.5 pcf (1,338 Mg/m^) is considered acceptable
for the loose state, and, thus, the static deformations can be combined for
the respective mean static loads.
The tests conducted with a mean static load of 1519 lb (6760 N) have a
low particle contact stress and, therefore, the effect of the bottom box
boundary would be insignificant in comparison to the effect on the test with
a mean static load of 6197 lb (27,577 N). If the bottom boundary affected
the 1519 lb (7770 N) test it would also influence the 3090 lb (13, 751 N)
tests. This could be a partial explanation for the average 3090 lb (13,751 N)
test curve in Fig. 5.4 not being co-linear with the average 1519 lb (6760 N)
82
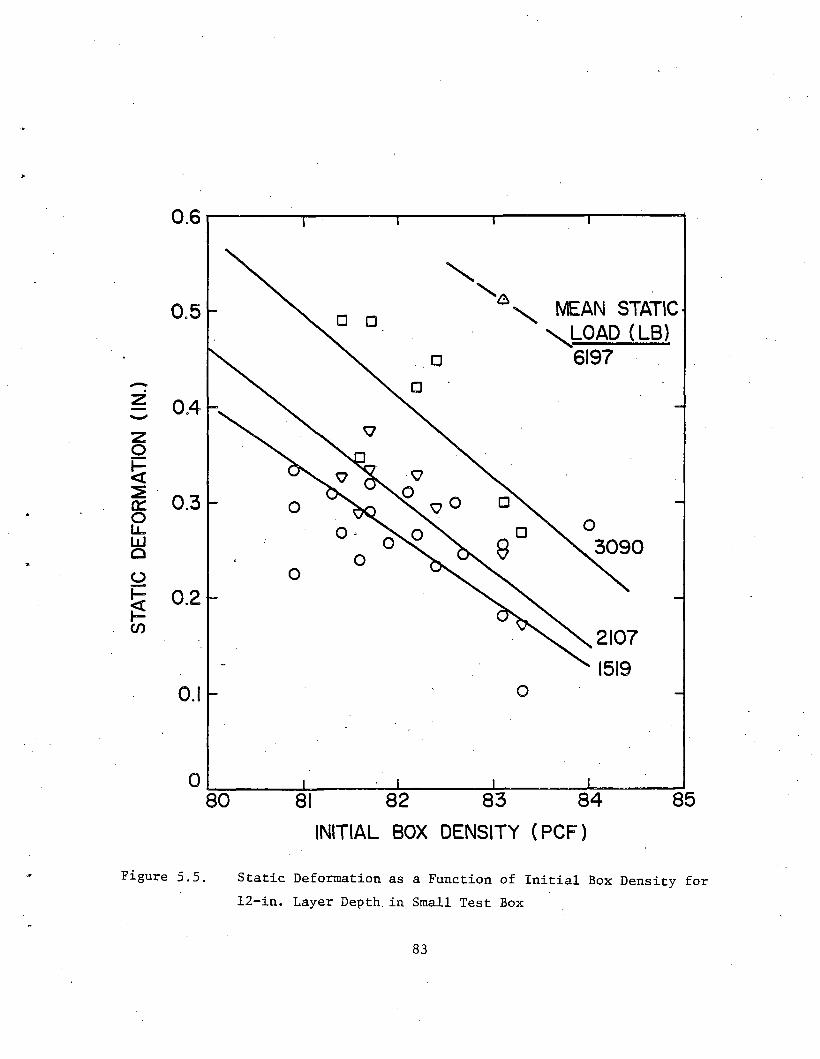
STATIC DE
FORM
ATIO
N (IN.)
Figure 5.5. Static Deformation as a Function of Initial Box Density for 12-in. Layer Depth, in Small Test Box
83

test curve. The effects of ballast depth will be discussed in more detail
in the section on layer depth.
Cyclic Load. The cumulative cyclic deformation (CCD) occuring with the
number of loading cycles are plotted in Fig. 5.6 for several individual tests
conducted at a frequency of 1/2 Hz in the small tesCi. box. These tests repre
sent different static and cyclic loading conditions, and are also divided
according to different load ratios. The load ratio (LR) for a test is defined
as the single amplitude cyclic load divided by the mean static load, i.e.
LR = . ‘ (5-1)Fmean staticThe load ratios for each individual test are also listed in Table 5.1.
The solid lines in Fig. 5.6 are linear regression equations for
log-log plots, which are compiled in Table 5.2 together with the correlation
coefficients. These coefficients show that there is very good correlation
between the cumulative cyclic deformation and the number of cycles on a log-
log plot. The curves on these plots are, also, somewhat parallel.
The comparison of the cumulative cyclic deformation for various load
ratios and mean static loads is more clearly illustrated in Figs. 5.7 for
300 cycles. The relationships for 10 and 100 cycles were shown to be sim
ilar (Ref. 22). These plots are based upon a dimensionless quantity called
the static load ratio (SLR), which is defined as,
SLR = ^mean static 1490
(5-2)
The load of 1490 lb (6631 N) is the average of the lowest mean static
.loads used during testing.84
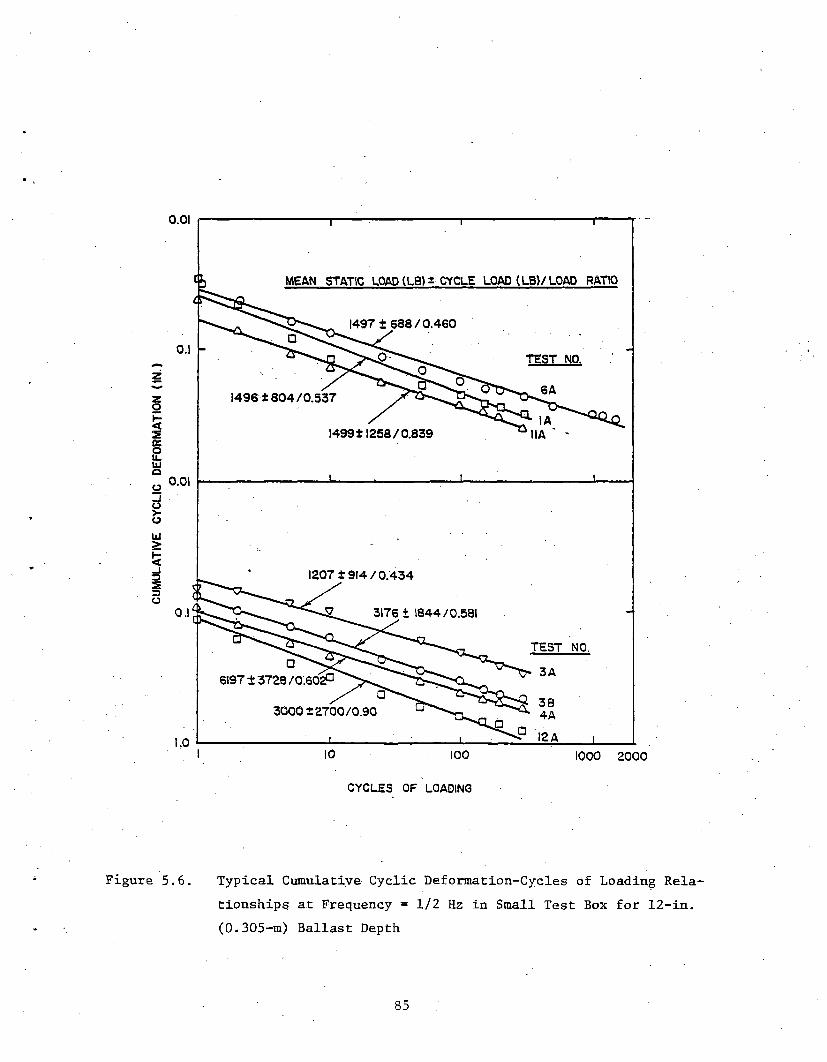
CU
MU
LATI
VE
C
YC
LIC
D
EFO
RM
ATI
ON
(IN
.)
Figure 5.6. Typical Cumulative Cyclic Deformation-Cycles of Loading Rela tionships at Frequency = 1/2 Hz in Small Test Box for 12-in. (0.305-m) Ballast Depth
85

Table 5.2. Best Fitting Equations for Cumulative CyclicDeformation vs. Cycles of Loading
Standard Conditions: 1490 lb + 790 lb, LR = 0.53, f = 1/2 Hz, 300 Cycles,12-in) Depth, Small Test Box
Tes t PrimaryNo. Variable(s)
CorrelationEquation Coefficient, y
8A Cycles ” 150 y S 0.0 4 x° * 296 0; 9961A " - 300 y as 0.037x°"386 0.9541C " - 300 y a 0.039x0,372 0.9715A " » 300 y a 0.034X0-353 0.9822A " =• 1500 y « 0.056x°‘339 0.9926A " - 1500 y 3 0.036x0,324 0.98911A Cyclic Load =■ i 1260 lb y a „ ... 0.356 0.053x- 0.97413A It y.. a 0.065X0,371 0.9753A Static Load » 2107 lb y - 0.058x0-275 0.98614A f * 0.1Hz, Cyclic Load=±1190 lb 7 = 0.085x0-329 0.98210A f =» 2.0Hz, " =» =644 lb y a 0.015X0’343 ■ 0.9879A f => 4.0Hz, " =t354 lb y a 0.008x°-441 0. 99315A Depth. = 9 in. y 3 0.041X0-306 0.96415B " . =» 9 in. y a 0.028x°'334 0.99815 C " “ 9 in. y 3 0.029x°-349 0.99416A " 3 6 in. y = 0.018x°’35 0. 99216B " => 6 in. y = O.Ollx0- 44 0.99717A Box Size » 3 ft x 3 ft y a 0.069x°‘33/ 0.900173 Box Size = 3 ft x 3 ft 7 - 0.04 lx0’ 406 0.97633 Stacie Load * 3176 lb y a 0.077x°‘32 0.9973C " =■ 3130 lb 7 a 0.053X0-366 0.9977A " =■ 3155 lb — Z-' o. o56x° '3'l7 0.987
86
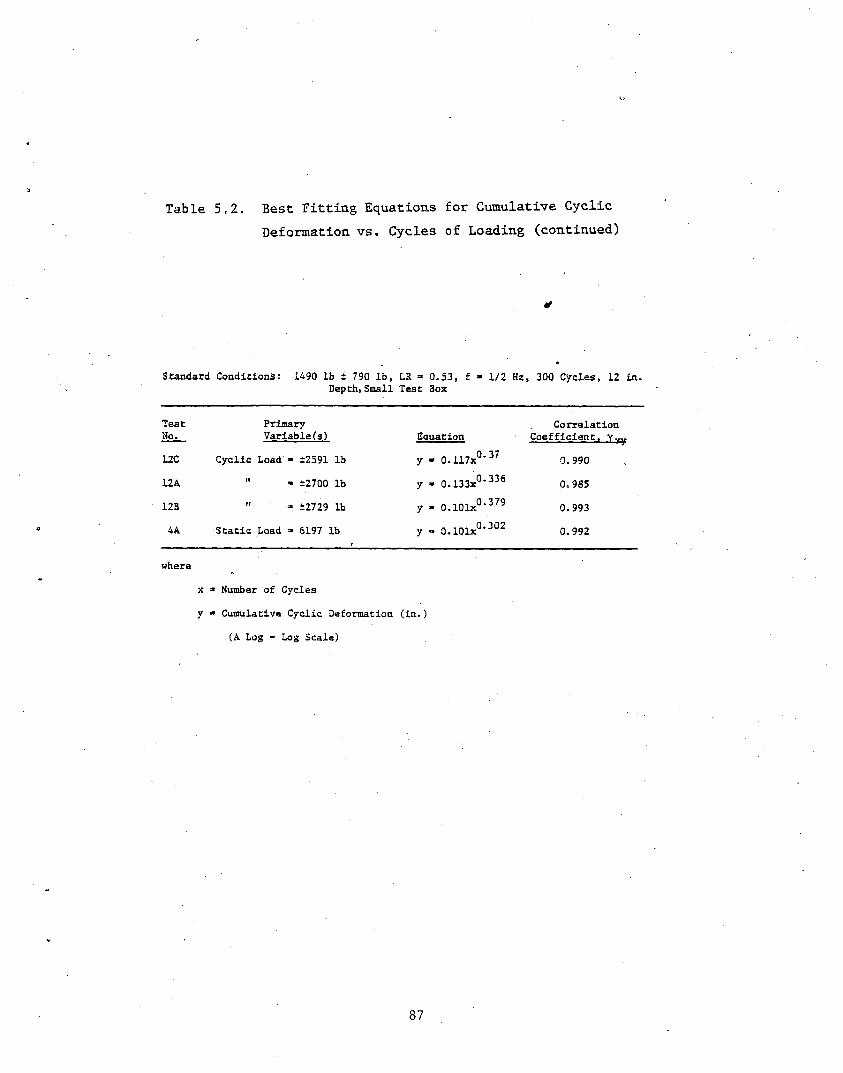
Table 5.2. Best Fitting Equations for Cumulative CyclicDeformation vs. Cycles of Loading (continued)
¥
Standard Conditions: 1490 lb ± 790 lb, LR • 0.53, f • 1/2 Hz, 300 Cycles, 12 in.Depth,Small Test Box
Test Primary CorrelationNo. Variable(s) Equation Coefficient,12C Cyclic Load ■ ±2591 lb y - 0.117X0'37 0.99012A " - ±2700 lb y - 0.133X0-336 0.98512B " =■ ±2729 lb y - O.lOlx0-379 0.9934A Static Load =* 6197 lb y =* O.lOlx0,302 0.992
where
x » Number of Cyclesy =» Cumulative Cyclic Deformation (in.)
(A Log - Log Scale)
87

CUMU
LATIV
E CY
CLIC
DEFOR
MATIO
N (IN
.)
Figure 5.7. The Effect of Various Static and Cyclic Loading Conditions on Cumulative Cyclic Deformation
88
The general trend from Fig. 5.6 shows that the cumulative cyclic defor
mation increases as the static load ratio increases for a given load ratio.
For a given static load ratio, the cumulative cyclic deformation increases
with the load ratio. These trends are what is expected. The one exception
to this trend occurred at 300 cycles for an SLR - 4, in which the cumulative
cyclic deformation was less than the curve for an SLR - 2. However, the
SLR - 4 represents only one data point, whereas the SLR - 1 and SLR ^ 2
represent several data points each.
The curves in Fig. 5.7 recognized as valid the origin on the graph by
using (0,0) as another data point. The assumption was made that no cyclic deformation could occur at a load ratio of zero. Therefore, including (0, 0)
as an actual data point for each set of curves appeared logical. For the
data points of an SLR - 1, the regression analysis yielded a straight- line
through the origin for all cycles. However, for an SLR - 2, the line was
slightly curved concave upward at low load ratios. For the straight line
portion of the SLR - 2 curves and the SLR - 1 curves, the correlation co
efficients are good (Ref. 22). For an SLR - 1.4 and 4, there.is only one
data point to represent each of the two conditions. A linear relationship
was assumed for these two cases and a partial line was drawn to show the
trend.
In order to quantitatively analyze the changes in the physical state
of the ballast after compaction, either plate load tests or in-situ ballast
density tests were performed.
The in-situ ballast density test was performed on the ballast in aloose, uncompacted state which provided a reference point for the other
89

tests. Ballast density tests were also conducted after compacting the bal
last with a static load of 1479 lb (6582 N) and a cyclic load of 694 lb
(3088 N) for 150, 300 and 1500 cycles. The resulting ballast density is
plotted with the number of loading cycles in Fig. 5.8. A linear relationship
exists between the ballast density and the cycles of loading. However,
after 300 cycles of loading [load = 1479 + 694 lb (6582 + 3088 N) ], the bal-
last density has increased by only 3 pcf (0.048 Mg/m ) which is a rather
small increment. For other loading conditions shown in Fig. 5.8, there
was very little difference in the ballast density after 300 cycles, with
one exception to this trend. This was a test with a static load of 3155
lb (14,040 N) and a cyclic load of 1768 lb (7868 N) for 300 cycles. The
ballast density test gave a result that is significantly greater than the
others and does not follow the trend set by the other tests. The initial
box density was somewhat higher for this test but that really doesn't offer
a valid explanation for the exceptionally high value. At this point, it is
uncertain as to why this test yielded such a high density.
As was done with the ballast density test, ballast in the loose uncom
pacted state was subjected to a plate load test. The effect of the change
in ballast stiffness with loading conditions would, thus, be. shown in
relation to the loose state test.
The loading condition of 1490 lb (6631 N) static load and 790 lb
(3516 N) cyclic load was performed twice with 300 cycles and once with 1500
cycles. The relationship of the BBI at 0.2 in. (5.1 mm) deformation with
the log of cycles of loading appears to be linear (Fig. 5.9). Because of
this relationship, the BBI and log of cycles of loading is assumed to have
90

i
CYCLES OF LOADING5.8. The Effect of Vsirious Lending Conditions end Cycles otf Los ding on Bellest Density
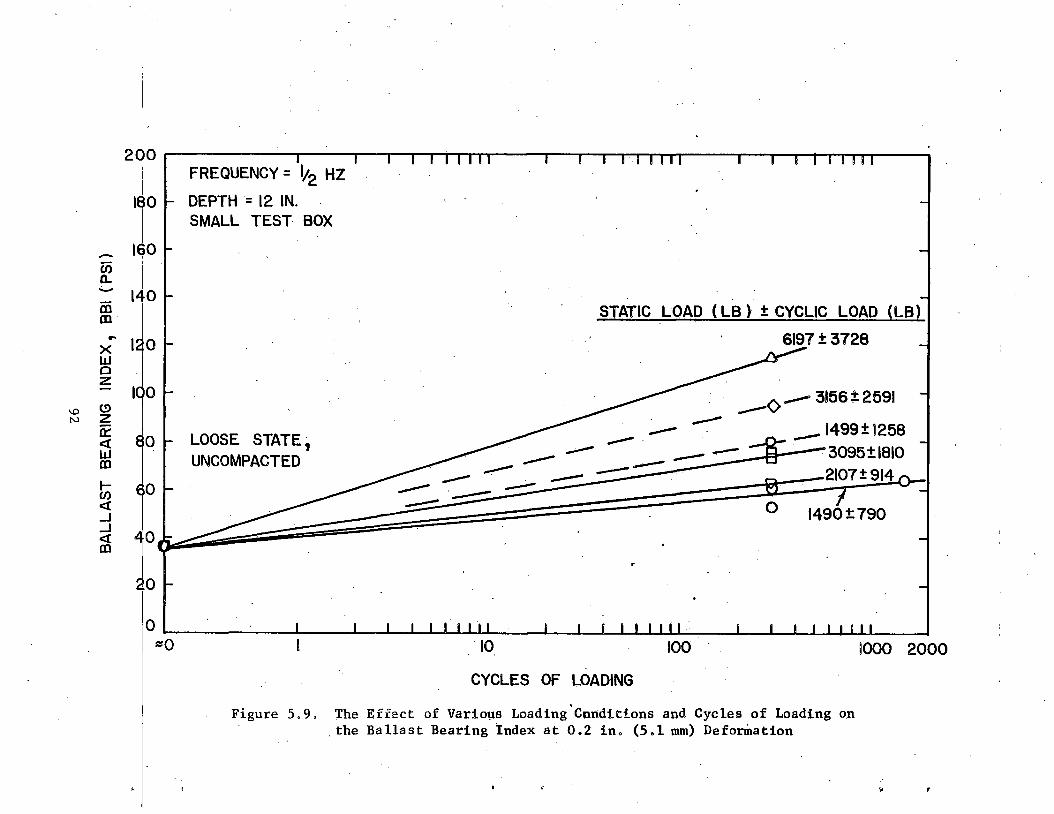
BALL
AST
BEARIN
G IND
EX, B
BI (PS
I)
200FREQUENCY = l/2 HZ
|$0 |- DEPTH = 12 IN.SMALL TEST BOX
160 -
1 I I I I 11 T---1— T IT 1— I— S 1111
140 -
loo -LOOSE STATE, UNCOMPACTED
STATIC LOAD (LB) t CYCLIC LOAD (LB)6197 + 3728
3156 ±2591 ~1499+1258 3095±1810
SOOO 2000CYCLES OF LOADING
Figure 5.9. The Effect of Various Loading Conditions and Cycles of Loading on the Ballast Bearing Index at 0.2 in. (5.1 mm) Deformation
r

a linear relationship for all deformation levels and all other loading conditions.
One particularly interesting feature is that the BBI for the test'with a static load of 1499 lb (6671 N) and a cyclic load of 1258 lb (5598 N) is greater than the tests with an average mean static load of 3095 lb (13,773 N) and an average cyclic load of 1810 lb (8055 N). This implies that the load ratio has a greater influence on the stiffness pf the ballast than does the static load ratio. This result is more clearly illustrated in Fig. 5.10.
Ballast Depth. Experiments were performed testing the effect of various ballast depths in order to simulate the field condition in which loose, dis-- turbed ballast is compacted on a dense compacted track bed. After tamping, the cribs may be filled or partially filled to various depths with loose, uncompacted ballast. It was this condition that these experiments were designed to simulate.
The average initial box densities and the applied static loads each are nearly equal for the various layer depth tests (Ref. 22), thus, a comparison of static deformations can be made. The average static deformation for 12 in. (305 mm) layer depth for the 1519 lb (6760 N) tests is0.275 in. (6.99 mm), but the overall average at 1519 lb (6760 N) is 0.26 in. (6.6 mm) based on Fig. 5.4. The average static deformation for the 9 in.(229 mm) layer depth tests is 0.185 in. (4.7 mm) and for the 6 in. (152 mm) layer depth test is 0.132 in. (3.4 mm). The general trend for static deformations is that as the ballast layer depth decreases, so does the static deformation for a given static load.
Wayne (Ref. 6) found that a stress redistribution in the ballast occurred93
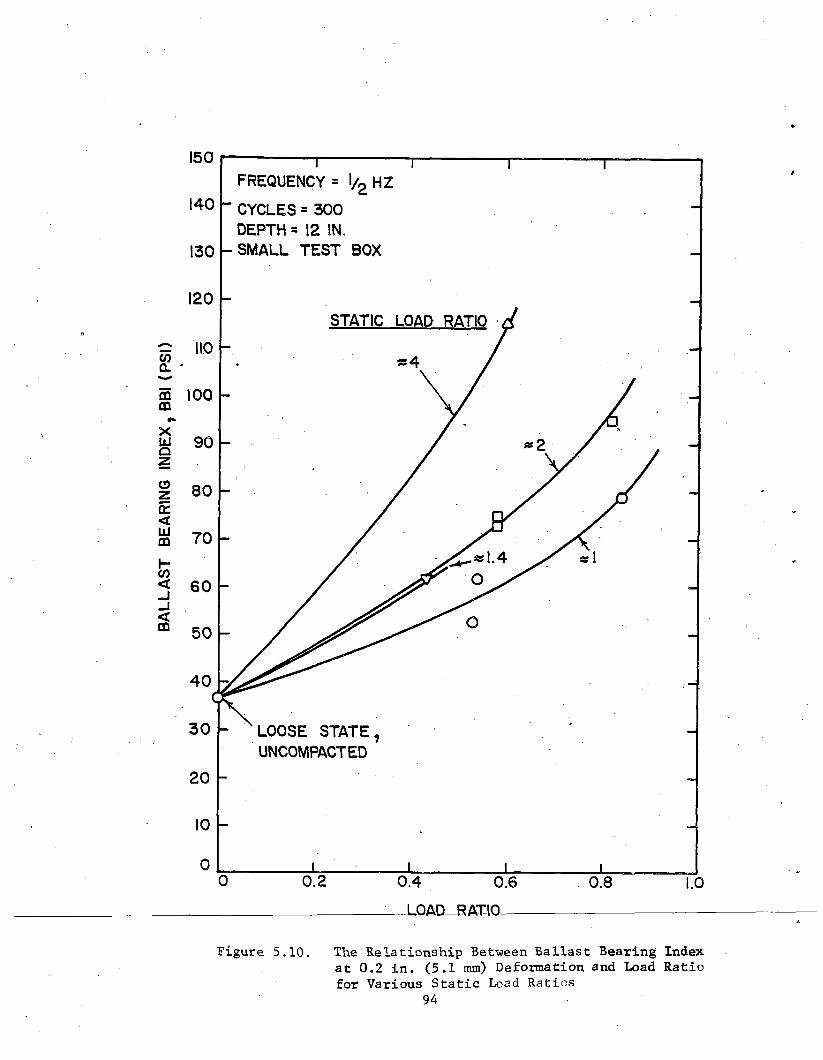
The Relationship Between Ballast Bearing Index at 0.2 in. (5.1 mm) Deformation and Load Ratio for Various Static Lead Ratios
94
Figure 5.10.

at a depth of 12 in. (305 mm) as well as at the lesser depths and the depth at which no bottom boundary effect takes place is definitely greater than 12 in. (305 mm). This is reasonable considering that the ratio of plate size to ballast depth is approximately equal to 1.0 for a 12 in. (305 mm) ballast depth.
The regression equations for cumulative cyclic deformation as a function of the cycles of loading for 9 in. (229 mm) and 6 in. (152 mm) ballast depths are listed in Table 5.2 along with the corresponding correlation coefficients. The coefficients in Table 5.2 show that there is a good correlation between the cumulative cyclic deformation and the cycles of loading on a log-log scale for each of the individual tests.
In Fig. 5.11, the cumulative cyclic deformation-load ratio relationship for the three different ballast depths are plotted at 10, and 300 cycles.The trends are assumed to be linear and passing through the origin. The complete lines in Fig. 5.11 represent the 12 in. (305 mm) layer depth of which.the line for 300 cycles is the same as that appearing in Fig. 5.7 for an SLR of approximately 1.0. Fig. 5.11 demonstrates that the same trend appears for cyclic deformation as appears for static deformation, i.e., that deformation decreases as ballast - depth decreases.
This trend is more clearly illustrated in Fig. 5.12, in which cumulativecyclic deformation is plotted as a function of ballast depth for a load ratio= 0.54. From this figure, it appears that the amount of compaction decreaseswith decreasing ballast depth. Also plotted in Fig. 5.12 is the cycliccompaction strain (e ) which is defined as,c
£ = --- CCD----- x 100% . (5-3)c Ballast depth
95

CUMU
LATIV
E CY
CLIC
DEFOR
MATIO
N (IN
.)
1.0 T T0.9
0.8
STATIC LOAD * 1490 LBFREQUENCY = l/2 HZ SMALL TEST BOX
0.7
0.6BALLAST DEPTH/CYCLES OF LOADING
0.5 12 IN./300
0 0.2 0.4 0.6 0.8 1.0LOAD RATIO
Figure 5.11. The Relationship Between Cumulative Cyclic Deformation and Load Ratio for Different Ballast Depths
96

CYCLIC
COM
PACTIO
N ST
RAIN,
6^%)
CU
MULAT
IVE C
YCLIC
DEFOR
MATIO
N (IN.
)
6 9 12
B A L L A S T D E P T H (IN.)-
Figure 5.12. The Relationships Between the Cyclic Component of Deformation and Ballast Depth
97
To represent in terms of a percentage, the quantity is multiplied by 100.The values of cyclic compaction strain for the 9 in. (229 mm)' and the 12 in. (305 mm) layer tests are approximately equal, but the values drop off slightly as the depth decreases to 6 in. (152 mm), which generally indicates comparable levels of compaction.
The changes in the physical state of the ballast at various depths after 300 cycles of loading are shown in Fig. 5.13. The BBI at all three deformations differs only slightly for the 12 in. (305 mm) and the 9 in.(229 mm) layer depths. However, the BBl’s. for the 6 in. (152 mm) layer depth increase significantly, as much as twice the BBI values obtained at the 9 in. (229 mm) or 12 in. (305 mm) layer depth tests. The BBI for the 6 in. (152 mm) layer test may be affected significantly by the bottom boundary.
Lateral Boundary Effects. The lateral boundary effects were tested using the large test box, which has dimensions of 36 in. (0.914 m) by 36 in. (0.914 m) with a 12 in. (305 mm) depth. This box represents essentially a free field condition because the ballast particles are unrestrained from lateral movement. The small box, which has dimensions of 20 in. (508 mm) by 20 in. (508 mm) with a 12 in. (305 mm) depth, was used for all of the tests except those that tested for lateral boundary effects. The lateral constraints in the small box tests were closer to the compaction plate than they were in large box tests. The small box tests were an attempt to simulate, not necessarily duplicate, the effect of in-situ ties which are close to the vibrating ballast compactor plates.
The initial box density was not measured for the large box test series.98
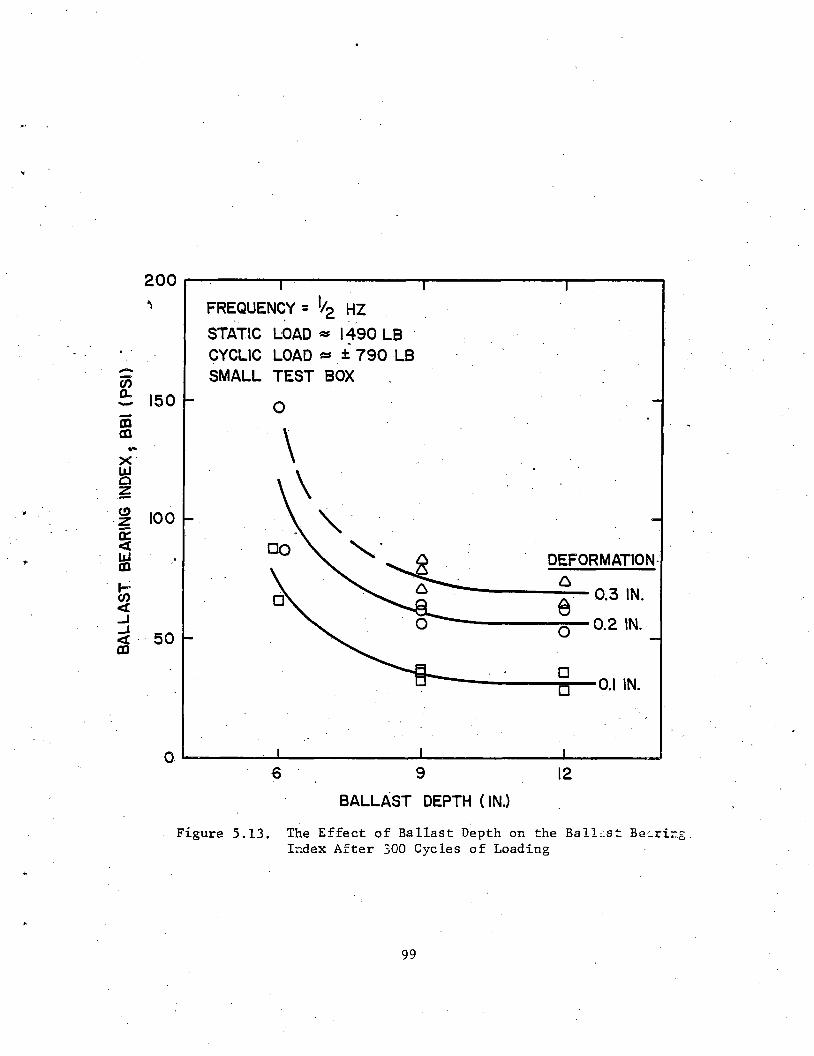
BALL
AST
BEARIN
G IND
EX s B
BI (PS
I)
6 9 12BALLAST DEPTH ( IN.)
Figure 5.13. The Effect of Ballast Depth on the Ballist BeLrin Index After 300 Cycles of Loading
99
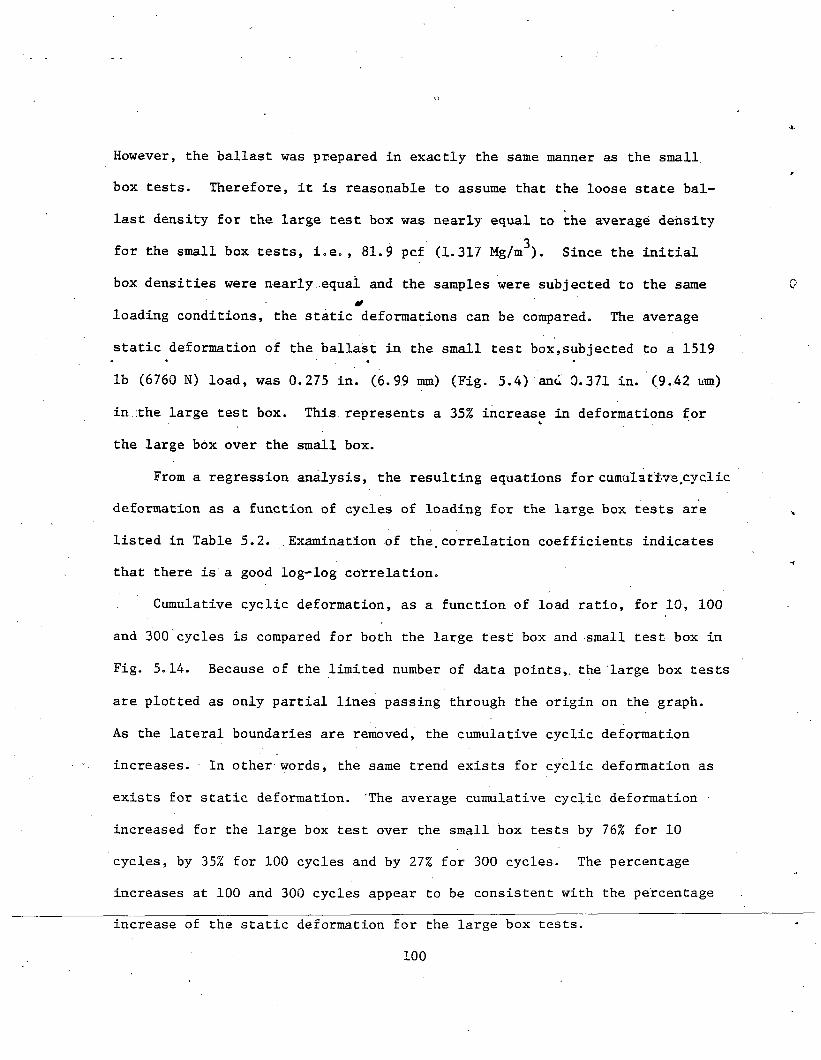
However, the ballast was prepared in exactly the same manner as the small, box tests. Therefore, it is reasonable to assume that the loose state ballast density for the large test box was nearly equal to the average density
3for the small box tests, i.e. , 81.9 pcf (1.317 Mg/m ). Since the initialbox densities were nearly equal and the samples were subjected to the same
*loading conditions, the static deformations can be compared. The average static deformation of the ballast in the small test box,subjected to a 1519 lb (6760 N) load, was 0.275 in. (6.99 mm) (Fig. 5.4) and 0.371 in. (9.42 mm) in.the large test box. This represents a 35% increase in deformations for the large box over the small box.
From a regression analysis, the resulting equations for cumulative,cyclic deformation as a function of cycles of loading for the large box tests are listed in Table 5.2. Examination of the,correlation coefficients indicates that there is a good log-log correlation.
Cumulative cyclic deformation, as a function of load ratio, for 10, 100 and 300 cycles is compared for both the large test box and small test box in Fig. 5.14. Because of the limited number of data points,, the large box tests are plotted as only partial lines passing through the origin on the graph.As the lateral boundaries are removed, the cumulative cyclic deformation increases. In other words, the same trend exists for cyclic deformation as exists for static deformation. 'The average cumulative cyclic deformation increased for the large box test over the small box tests by 76% for 10 cycles, by 35% for 100 cycles and by 27% for 300 cycles. The percentage increases at 100 and 300 cycles appear to be consistent with the percentageincrease of the static deformation for the large box tests.
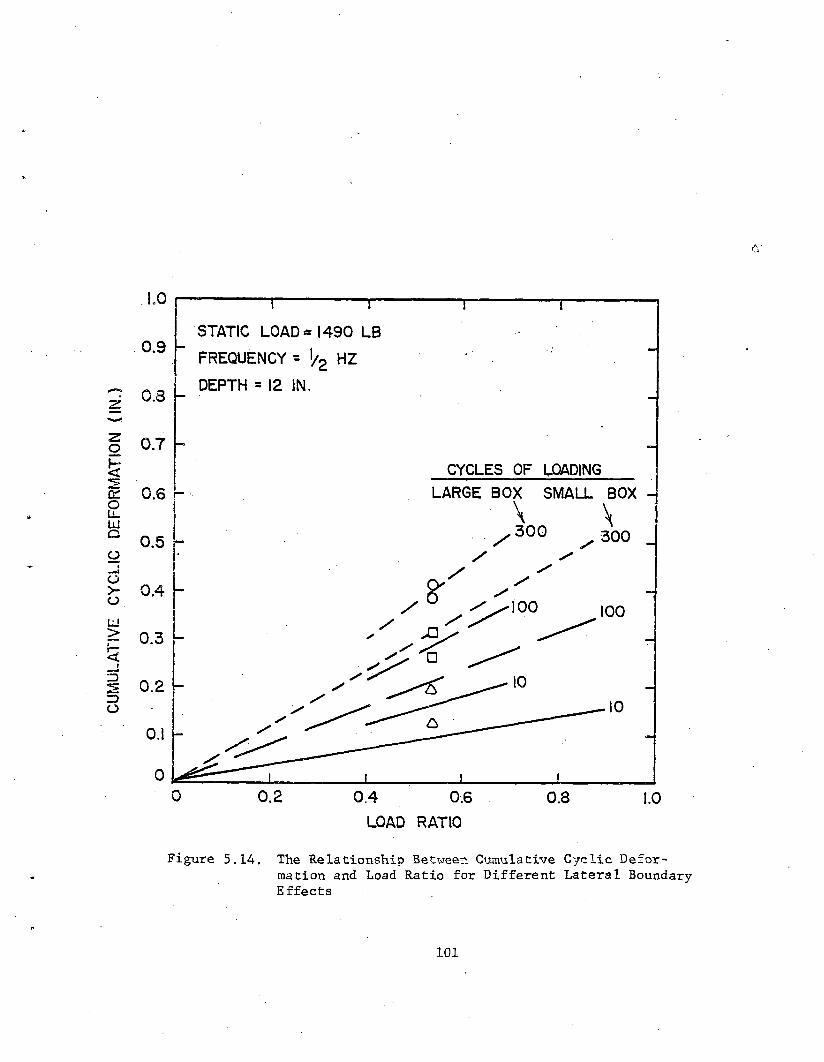
CUMU
LATI
VE C
YCLI
C DE
FORM
ATIO
N (IN
.)
Figure 5.14. The Relationship Between Cumulative Cyclic Deformation and Load Ratio for Different Lateral Boundary Effects
101

The deformations, both static and cyclic, that occurred in the large test box increases by about 31% over the deformations obtained in the small test box. However, there was very little change in the plate load test results between the two test box sizes, which is evident in Fig. 5.15. Both box sizes yield similar BBI results at vail three deformation levels. Also, the lateral dimensions of the test box do not influence these results according to Wayne (E.ef. 6). Since the stiffness values for the two test box sizes are similar (Ref. 22), then so is the degree of compaction of the ballast in the zone under the oscillating plate.
The conclusion that can be drawn from this test series is that if no lateral constraints are applied, the tendency is for the ballast particles to move laterally rather than to densify to a greater degree than occurred in the small test box. Thus, the net effect of compaction for the two test box sizes is the same.
Frequency. Most of the tests were conducted at a frequency of 1/2 Hz. However, in order to investigate the effect that frequency has on both the amount of deformation as well as the ballast physical state, three tests were performed in which the frequency was varied but all other parameters remained constant. The different frequencies used for the three tests were 0.1, 2.0 and 4.0 Hz. For all three of these tests, nearly the same mean static load was used; an average of approximately 1490 lb (6631 N). The resulting static deformations were previously included in the discussion of static loads and were of the same order of magnitude as other tests conducted with this mean static load.
102
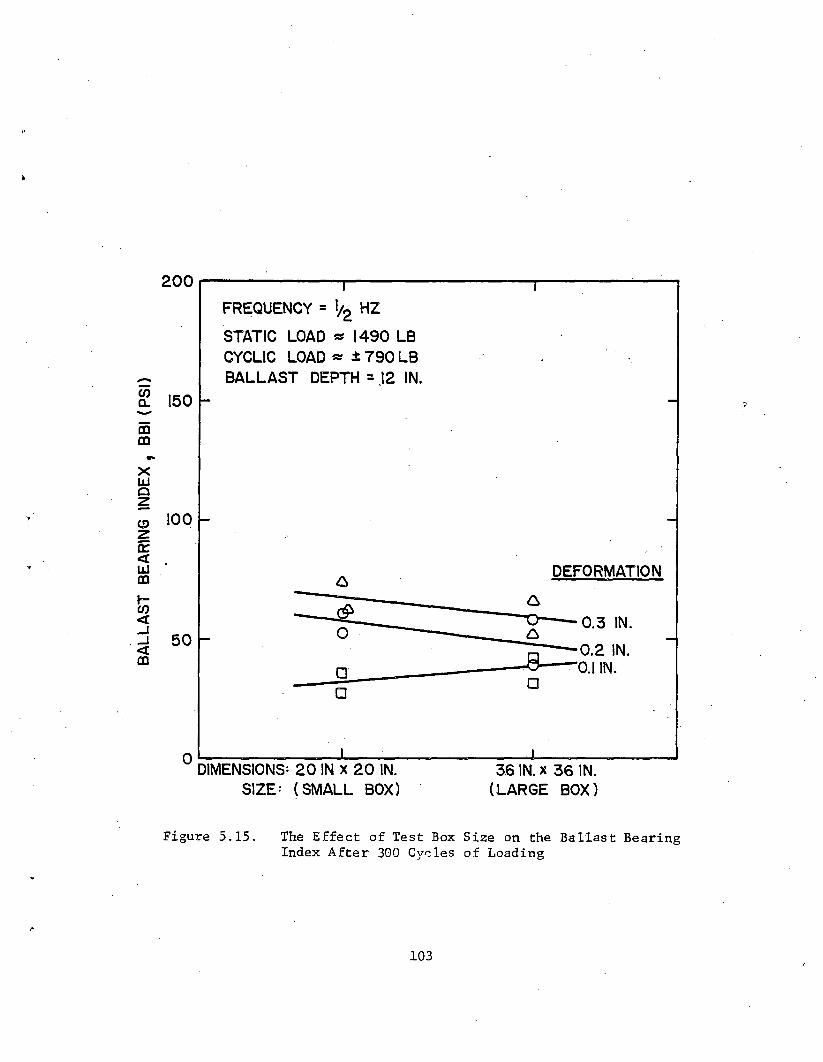
fr-
SIZE- ( S M A L L B OX) ( L A R G E B O X )
Figure 5.15. The Effect of Test Box Size on the Ballast Bearing Index After 300 Cycles of Loading
103
The effects of frequency on cumulative cyclic deformation is best represented as a function of load ratio for 10 and 300 cycles in Fig. 5.16.The lines representing the 1/2 Hz test are the same reference lines for an SLR ~ 1.0 for^J0 and 300 cycles illustrated in Figs. 5.11 and 5.14. Examination of Fig. 5.16 reveals that the cumulative cyclic deformations at a given number of cycles for both frequencies of 2.0 Hz and 4.0 Hz is less than that for a frequency of 0.5 Hz, while cumulative cyclic deformations for a frequency of 0.1 Hz was greater than that for a 0.5 Hz. The general trend shows that between the frequencies of 0.1 and 2.0 Hz, the cumulative cyclic deformation decreases as the frequency increases. However, when the frequency was increased from 2.0 Hz to 4.0 Hz, the cumulative cyclic deformation increased, but not to the same order of magnitude that resulted from the 0.5 Hz tests. The limited number of data points makes it difficult to establish conclusive trends concerning the effect of frequency on the amount of cumulative cyclic deformation. The need for further examination of the frequency effect exists to substantiate the results obtained in these tests.
The effect that frequency has on the physical state of the ballast is shown in Fig. 5.17. The loose,' uncompacted state is included as a reference point. Test 14A which had a frequency of 0.1 Hz is compared to test 11A which had a frequency of 0.5 Hz because the load ratios for the two tests are nearly equal, i.e. 0.79, and the static load ratios are the same. The overall comparison of the three deformation levels shows that physical states resulting from the two tests is nearly the same. In order to compare test 9A with a frequency of 4.0 Hz to a test at 0.5 Hz, the BBI for a load ratio of 0.239 at a frequency of 0.5 Hz were obtained from curves similar to and
104
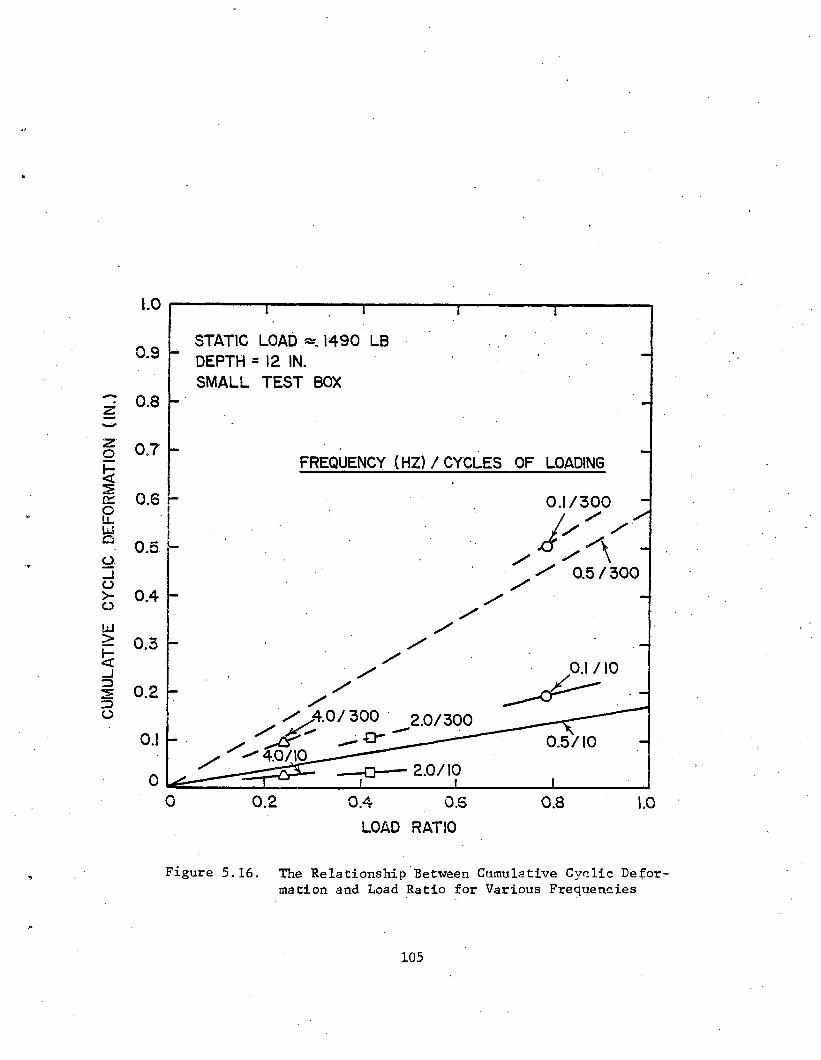
CUMU
LATI
VE C
YCLI
C DE
FORM
ATIO
N (IN
.)
w
Figure 5.16. The Relationship Between Cumulative Cyclic Defor mation and Load Ratio for Various Frequencies
105
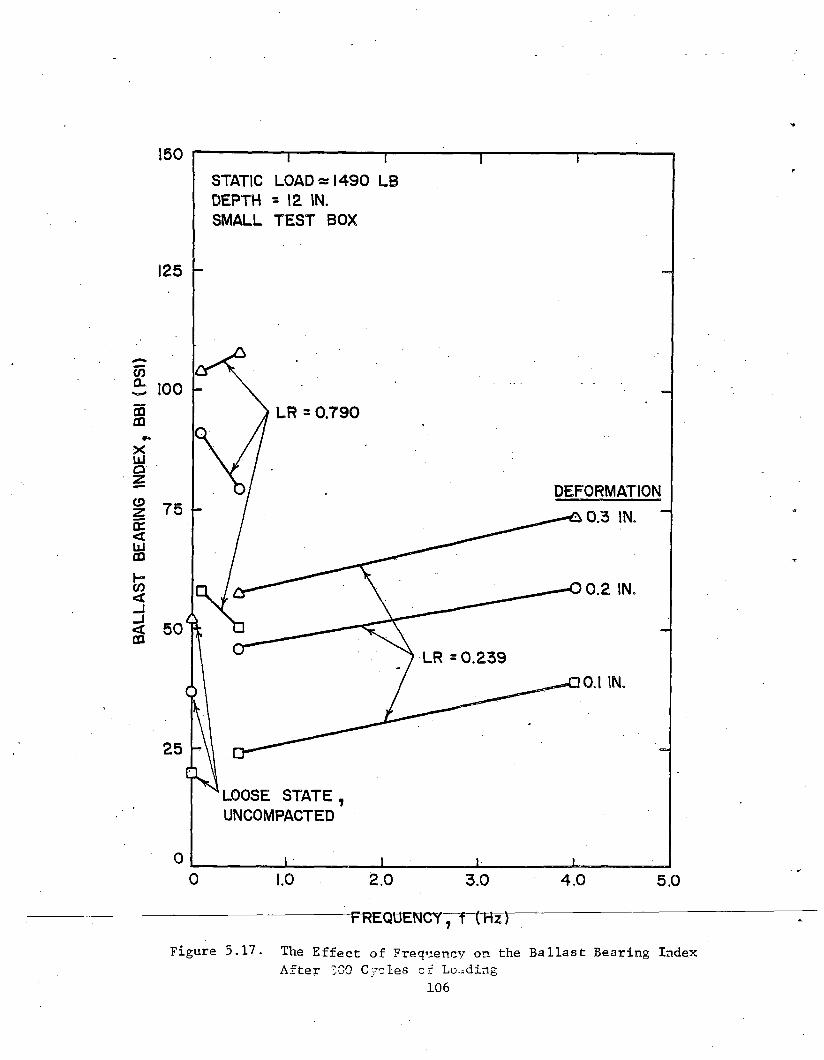
150
125
100
7 5
5 0
2 5
0
i i i rSTATIC L O A D « 1 4 90 L B D E P T H = 12 IN.S M A L L T E S T B O X
L R = 0 . 79 0
D E F O R M A T I O N
L O O S E S T A T E , U N C O M P A C T E D
1.0 2.0 3.0 4.0- - - - - - - - - - F R E Q U E N C Y y f ( H z )5.17. The Effect of Frequency on the Ballast Bearing
After 500 Cycles of Loading106
5.1

including Fig. 5.10. Fig. 5.17 suggests that there is an increase in plate load resistance (BBI) for all three deformation levels as the frequency is increased.
An in-situ ballast density test was performed on the sample that was compacted at a frequency of 2.0 Hz (Fig. 5.8) which gave a final density of
388.57 pcf (1.419 Mg/m ). Nearly all of the ballast density tests results, regardless of the loading conditions, yield a result very close to 88.5 pcf (1.418 Mg/m^) after 300 cycles of loading. Although neither the amount of cumulative cyclic deformation or the ballast density test result indicate that a higher frequency causes a greater amount of compaction to occur, theplate load test suggests, for frequencies greater than 0.5 Hz, that frequency may have an. effect.- However, it is difficult to make*valid conclusions on these trends with the limited amount of data available.5.3* COMPARISON WITH FIELD DATA
There are two field studies on ballast compaction that are available and are comparable to this study. One is an investigation of ballast properties by SUNYAB at the Illinois Central Gulf Railraod (ICG) [Ref. 23 and 24]. There is a tangent dual main line, of which the Northbound was being subjected to a major maintenance program that included track undercutting, tie tamping and,crib and shoulder ballast compaction. The first process was the track undercutting in which all of the ballast material in the cribs, shoulders and beneath the track was removed. All of the fines were removed from this material and were deposited along the side of the track. The clean limestone ballast was then dumped in the center of the track. The track was raised and the ties were tamped. Additional slaa ballast was
107
deposited to fill the cribs and shoulder section before the ballast compactor was used. In-situ ballast density tests and plate load tests were performed at various stages of the above program.
3The lowest density state of 84.9 pcf (1.36 Mg/m ) was found under thetie in the center of the track for the tamped but uncompacted stage. Theballast in the cribs in the center of the track at the same stage was found
3to have an average density of 91.8 pcf (1.47 Mg/m ). The lowest density state is comparable to the loose state of 85.5 pcf (1.37 Mg/m^) obtained in this study. The method of placement of the ballast may account for the difference between the density under the tie and in the crib. The ballast under the tie more or less migrated there from the cribs during the maintenance operations. The energy used in placing the ballast there was very low, thus the density is low. The ballast in the crib, on the other hand, was dumped from a height of a few feet. Thus, the energy associated with that ballast placement was greater and the density measurement yielded a higher value. Incidently, these density values have been modified to represent a 1 0 0% limestone sample, since the raw data was for a limestone and slag mixture. The limestone at ICG was approximately the same gradation as the limestone used in this project but it was less angular.
In order to compare the effects of the ballast compaction at ICG and the simulated compactor, the change in crib ballast density must be examined. The compactor used at ICG operated at a frequency of 38 Hz and was applied for approximately 3.5 seconds. Thus, the ballast was subjected to 133. cycles of loading. The average density in the crib after tamping in the area that is to be compacted was 92 pcf (1.474 Mg/nr). The average density,taken-in- the same area after tamping and compaction, was 96.4 pcf
3(1.544 Mg/m ). This represents an increase in ballast density of 4.4
108

pcf (0.07 Mg/m ) due to the use of the ballast compactor. This increaseOis greater than the increase of 3. pcf (0.048 Mg/m ) obtained with the
simulated compactor. A large part of this difference may depend on the frequency used since it is the parameter with the greatest difference between the two machines. It has been shown in Fig. 5.8 that varying the cyclic and static loads produces only a small change in the resulting ballast density.
The plate load test data was compared’by either the B3I, previouslydefined, or the Modified Ballast Bearing Index (BBI. ). The BBI,_ parameterK Kis equal to the BBI at a given deformation level divided by that deformation, i.e. 0.1, 0.2, or 0.3-in. (2.5, 5.1, or 7.6-mm). An average BBIg is subsequently determined from the three computed values.
Examination of the plate load tests results shows that the lowest average BBIjr occurred in the center of the track beneath the tie. This value was 177 pci (48.1 MN/m ) which is very close to the 185 pci (50.2
3MN/m ) obtained in this laboratory experiment for the loose state. Thisvalue is also consistent with the ballast density test performed in thesame area. The average BBI^ in the center of the track in the crib was
3236 pci (64.1 MN/m ) which is consistent with the ballast density measurements in that it is an increase over the below-tie value. As was stated earlier, the ballast in the cribs near the rails, where the compactor plates are placed, was a mixture of slag and limestone ballasts. Thepercentage of slag increased towards the outside of the track. The average
3BBI outside the rail was 697 pci (189.3 MN/m ) and the average BBI,,K *-3inside the rail was 488 pci (132.5 MN/m )t but the average'value of all tests was 572 pci (155.4 MN/m^). The large difference between the
109

inside of the rail and the outside of rail results may not be entirely dueto the difference in ballast types. Wayne (Ref. 6) states that averageBBI values for loose states of limestone and slag are of the same order Kof magnitude and the same holds true for the dense state values of the two materials.
o Since the BBI is a function of the static load ratio, the load ratioand the cycles of loading at a given frequency, the resulting BBI of ttieKcompactor was estimated if it were operating at a frequency of 0.5 Hz. That
3 . *estimate is 305 pci (82.8 MN/m ), which is significantly different from3average BBI^ value obtained at ICG of 572 pci (155.4 MN/m ). This fact
further reinforces the notion that the operating frequency is a significantfactor in changing the physical state of the ballast. The only test thatmatches the static and cyclic loads of the ballast compactor is Test IIAwhose static load is 1,499 lb (6,671 N) and whose cyclic load is 1,258 lbs(2,541 N). The resulting average BBI after 300 cycles is 420 pci (114.1K
3 3MN/m ) which is close to the inside of rail value of 488 pci (132.5 MN/m3but is much lower than the average value of 572 pci (155.4 MN/m ).
The second field study which is comparable to this laboratory project was conducted by the Canadian National Railroad (CNR). [Ref. 17]. This study was concerned with plate load test results taken on the track shoulder, under the tie, on the crib surface, and in the crib at a depth equal to the depth of the tie. The plate load test procedure was essentially the same as the SUNYAB procedure with one major exception. Rather than using a load cell to record loads and a DCDT to record deformations on an X-Y recorder,CNR recorded dial gauge readings for deformations and hydraulic jack pressure
for loads at various points in the test. These recordings were plotted
to obtain a load-deformation curve. They also used pea gravel rather than
110

plaster as a seating material. The CNR report provides BBI values at 0.3in. (7.6 mm) deformation. These field plate load test data from the cribnear the rail were selected as most appropriate for comparison with the labresults. The CNR ballast was crushed stone.
The BBI at 0.3 in. (7.6 mm) deformation on the undisturbed track was2264 psi (1,819 kN/m ). Exactly how many million gross tons of traffic had
passed over this track since its last track surfacing program is not known.After surfacing and lining only, the BBI at 0.3 in. (7.6 mm) deformation was
263 psi (434 kN/m ). This is nearly the same as the laboratory loose state2condition which is 52 psi (358 kN/m ). The BBI at 0.3 in. (7.6 mm) defor-
2mation after crib and shoulder compaction was 306 psi (2,108 kN/m ). TheBBI at 0.3 in. (7.6 mm) deformation after undercutting and crib compaction
2was 412 psi- (2,839 kN/m ); and after undercutting and crib and shoulder com-2paction was 333 psi (2,294 kN/m ). After, undercutting, the track.bed was
filled with either slag or new crushed rock. The above results are averagevalues that represent many tests. The study does not differentiate the-test results for the different ballast types. All of the above values aresignificantly greater than any of the values obtained in the laboratorytests. The greatest value of BBI at 0.3 in. (7.6 mm) deformation obtained
2in the laboratory was 140 psi (965 kN/m ). The static load for this test was 6,197 lb (27,577 N) and the cyclic load was 3,728 lb (16,590 N). All of the CNR values are also greater than the results obtained from ICG.
Exactly why the BBI values in the CNR study are so much greater is difficult to ascertain, but there appear to be factors that are different in the two studies which influence the plate load test results. A more detailed study on plate load test comparisons is discussed by Panuccio and Dorwart (Ref. 4).
Ill
y6. SUMMARY AND CONCLUSIONS
*>
A summary of the three field compaction mechanisms simulated in the laboratory for a crushed limestone ballast are presented.6.1 SIMULATED TRACK BED
An old railroad track bed, i.e., one that has not been recently sub- ^jected to maintenance operations, was simulated in the laboratory by filling a .large test box with 12 in. (0.305 m) of limestone ballast and compacting it with a vibratory plate compactor. The change in the physical state of the ballast during the compaction phase was monitored by plate load tests and in-situ ballast density tests which were performed at certain intervals during the compaction process. The main conclusions from thi's investigation are: 41
1. The in-situ ballast density tests that were performed during the compaction of the track bed yielded an average maximum dry density of ap- proximately 110 pcf (1.76 Mg/m ) after only 25 to 50 passes with the vibratory compactor. This was an increase of about 12 pcf from the loose state.
2. The Ballast Bearing Index (BBI) values obtained from the plate load tests On the compacted track bed leveled off after approximately 500 passes with the vibratory plate compactor. The average maximum BBI value at 0.2 in. (5.1 mm) deformation was approximately 279 psi (1922 kN/m^).
3. The laboratory ballast density and stiffness values after 1000 compactor passes compared favorably well with field test results for an old track bed condition.
112
/

6.2 MANUAL TIE TAMPINGSeveral lateral tie push tests were performed when a standard railroad
tie was placed on the compacted bed with no crib or shoulder, and the effects of various weights placed on the tie were evaluated. Tests were also performed for a semi-filled crib, a full crib, and a full crib with a surcharge foad. The ballast shoulder section was subsequently formed and lateral tie push tests were performed on a compacted base, as well as a loose base resulting from various amounts of tamping raises. These ballast physical state test results were also compared with previous reported data.
The following summarizes the important test results obtained from these tests: ' .
1. The lateral tie resistance of an individual tie-after manual tie tamping does.not appear to be affected by the height of,the tamping raise nor the type of raising operation, i.ev, full or in lifts. This is for a full loose ballast crib and shoulder condition.
2. The lateral tie resistance increases nearly linearly as the amount of ballast in the cribs increases. Even when the cribs are overfilled, the tie resistance continues to increase in a similar fashion. The crib component of resistance is a. significant contributor to the total lateral resistanceof an unloaded tie.
3. For ties of various equivalent weights placed on a compacted base with no crib or shoulder ballast, the lateral tie resistance is approximately equal to one-half of the tie weight.
4. The in-situ ballast density test and the plate load test data for both in the crib and under the tie locations produced fairly consistent
113

results with respect to manual tie tamping. In general, both the ballast density and ballast stiffness under the rails, i.e„, the zones of tamping, were reduced after tamping was performed and each of these physical state test values were comparable for different heights of the^raises.
The field LTPT results from ICG and FAST were generally greater than the laboratory tests for the after-tamping condition by 50 to 150 lb (223 to 668 N). This difference cannot presently be explained; however, the range of lateral tie resistance values at 0.157 in. (4 mm) displacement were comparable for the two conditions. The laboratory PLT and BDT results, however, compared very favorably to the field test results for the tamped-only condition. Thus, this track1 condition appears to be reproducible in the laboratory. • . -6.3 CRIB COMPACTION PLATE' '' """
This part of the 'study Was" conducted iii order' to examine the effect that various parameters have "on ballast compaction. The ballast compaction was performed in the laboratory on a limestone ballast with a simulated ballast compactor that consisted of a single plate oscillating at a low frequency.The compaction effort included both static and cyclic loading. Apparatus and experimental design considerations for this project were a result of a review of manufacturer's literature on ballast compactors which provided the specifications for the plate shape and size as well as the range of static and cyclic loads to be used. The frequency and application time of ballast compactors was considered in determining the equivalent number of
3cycles of loading. A test box with a volume of 2.78 cubic feet (0.0787 m )3was used for most of the tests, but a 9 cubic foot (0.25 m ) test box was
114

used to test for lateral boundary effects. The effects of ballast depth and loading frequency were also examined. The amount of compaction for each test was evaluated by one of the physical state tests developed at SUNYAB,i.e., plate load tests or ballast density tests.
The following list is a summary of the results from the tests:1. As the static load was increased, the static deformation also increased.
Eowever, the overall relationship was not linear. The bottom boundary is believed to have influenced the tests with large static loads.
2. When the initial box density increased, the resulting static deformation, for a given static load, decreased.
3. The. cumulative cyclic deformation increased asthe load ratio was increased for a given static, load ratio. The cumulative cyclic deformation increased as the static load ratio increased for a constant load ratio.
4. The ballast density increased priljf _a small;amount from the-loose stateof about 85.5 pcf (1.37 Mg/m^) to about 88.5 pcf (1.418.Mg/m^) for;!the dense state after 300 cycles. The final density state appeared to be independent of the loading conditions. . . .
5. The BBI value at a given deformation increased as the static loadratio was increased for a given load ratio. Similarly, as the load ratio was increased for a given static load ratio, the BBI value increased.
6. When the sample ballast depth was decreased, both the static deformation and the cumulative cyclic deformation decreased when comparing similar loading conditions.
7. The BBI's differed only slightly for the 12 in. (305 mm) and 9 in. (229 nnu)
115
layer depths, but they increased dramatically for the 6 in. (152 mm)f .layer depths.
8. When the lateral boundary constraints were removed, both the staticdeformation and the cyclic deformation increased for a given set of loading conditions, but the BBI values were nearly the same. This Q
shows that the amount of compaction was essentially the same for thetwo test box sizes.
9. When the effects of different frequencies were tested, it was found that the density was no different after compacting at 2.0 Hz than it was after compacting at 0.5 Hz after the same number of cycles and similar loading conditions.
10. For equivalent load ratios, the BBI's resulting from the 0.1 Hz test <was essentially the same as the 0.5 Hz test. The test performed at a frequency of 4.0 Hz resulted in greater BBI’s than the 0.5 Hz testat an equivalent load ratio.The test results were also compared to results that were obtained from
physical state tests performed in the field. Of the tests performed on the Illinois Central Gulf Railroad, the only results for the loose state that agreed with this experiment were located under the tie in the center of the track. Both the ballast density test and plate load test results compare favorably to the loose state tests for this project. The BBI values in the area that was under direct contact with the vibrating plate increased much more than any BBI values in the lab tests. The CNR conducted a study in
*
which plate load tests were performed on the track in different maintenancestages. The loosest state that occurred in that study was after surfacing «
116
and lining in the crib near the rail where tamping occurred. The plate load resistance at that stage in the field was nearly equal to the loose ballast results in the lab tests before compaction with the oscillating plate.However, the field BBI values after crib compaction were significantly greater than any values obtained in the lab tests after compaction with the plate.The conclusion based on both the ICG and CNR comparisons is that the higher frequencies in the field operation significantly affect the amount of ballast compaction. . '
x. '! t •-j""1, '
117/118
I j
~ s ; l o b !>c-j t. ’ V i Z r o J - i ' - i - . . t t t - L V ' . , o ,»? . j : ; s - . r r o O tr-r.r. 1 : , . . , . •
* o q s ; - ; X a f i Ji? T . S . . - . - Z f t e - . J o - f o O o n - r;rrj»- j s ? i ' ; : t t / 'T ~ ? i i J ~
. o A X t i o E t f ; ; r ' l y s n i j -jto I . r . _ . j : o . r y o C ,-s d j i K o o r o B q j i O ' i . '■1
r . £ , r ’ ’ , 3 n&:r. £ ~ ; ‘ o s s O y :: q .o .o t .C i o n l . O & f i i o y D o r . E , .K t . <
, 7 t f l , V 7 £ , u i d i i “. . " A Y Z ' b o t q;!-; I i : v i J b o J o s o o r ,
'•, a?>i b v X i s i - I I s n no"? h o o j S 3 X . I 9 A:>c! 7 ! i , . 3 i , '■ ?
* V I , y ' r i : . i .o .C i :X < Z f b f V - J o , s n i i : i n . s r 6 I D r . ~ o i t\?:
- 3 ; . ' I " , y q . ; 'o . ' t 9 , I 00 ’ (.■ " r i ■=•.?..3fl : ‘ "V '
■ 1 0 A .:" 0; ) , 0 ■ . f * ’ - l - ' . ‘J 7 - a ' U . ^ O O J > . ‘. ? /rj .
. '■; . t : .I/I r ' X i:. f !\& J 7 , .1. B 0 . . Z ' Or d l+ l ''■(■ b-~i :■'■■' ,.>;•/ ( _ ’y-\0 2 C; j oo *s o - fo : Zsv-o r. 3 t o . 3 . : . r r
,c , o o o / r t , * nr raq'js-riG-'io. ^' ' vO.rooosT''
%

REFERENCES
1. Selig, E.T., Yoo, T.S. and Panuccio, C.M., "Mechanics of Ballast Compaction: Vol. 2. Field Methods for Ballast Physical State Measurement,"Final Report, State University of New York at Buffalo, Contract No. DOT/ TSC/1115, Submitted to Transportation Systems Center, U.S. DOT, Cambridge, Massachusetts, September, 1980.
2. Selig, E.T., Yoo, T.S. and Panuccio, C.M., "Mechanics of Ballast Compaction: Vol. 1. Technical Review of Ballast Compaction and RelatedTopics," Final Report, SUNYAB, Contract No. DOT/TSC/1115, Submitted to Transportation Systems Center, U.S. DOT, Cambridge, Mass., September, 1980.
3. Ciolko, A.T., "The Lateral Tie Push Test for Ballast Evaluation," M.S.Project, Submitted to Department of Civil Engineering, SUNYAB, April,1977.
4. Panuccio, C.M. and Dorwart, B.C., "Correlation Studies for the SingleLateral Tie Push Test and the Plate Load Test," Internal Report, Ballast Compaction Study, Dept, of Civil Engineering, SUNYAB, August, 1978.
5. Chen, H.M., "A Study of Ballast Density Measurement," M.S. Project Submitted to Dept, of Civil Engineering, SUNYAB, February, 1977.
6. Wayne, R.C., "The Plate Load Test for Ballast Evaluation," M.S. ProjectSubmitted to Dept, of Civil Engineering, SUNYAB, February, 1977.
7. Yoo, T.S., "Field Measurements of In-Situ Ballast Density," Internal Report, Dept, of Civil Engineering, SUNYAB, October, 1978.
8. Petersen, H.C., "Railroad Ballast Lateral Stability Test," M.S. ThesisSubmitted to Civil Engineering Department, University of Illinois at Urbana-Champaign, September, 1975.
9. Plasser, "Technical Description of the Consolidating Machine VDM 800 U,"Manufacturer's Literature.
10. Plasser Information, "Consolidating Machines," Manufacturer's Literature.
11. Panuccio, C.M., "Trip to Canadian National Railway Site," Internal Report,SUNYAB, June-July, 1976.
12. Office for Research and Experiments of the International Union of Railways,"Optimum Adaptation of the Conventional Track to Future Traffic: Studyof the Change in the Track Level as a Function of the Traffic and of the Track Components," ORE Question D117, Report No. 2, UTRECHT, April, 1973.
13. Plasser and Theurer, Manufacturer's Literature on Track Maintenance Equipment Specifications.
119
Mechanics of Ballast Compaction: Volume 4, Laboratory Investigation of the Effects of Field Compaction Mechanisms, 1982 US DOT, FRA, CM Panuccio, Dr McMahon, ET Selig

US. Department of TransportationResearch a n d Special Programs AdministrationKendall SquareCambridge. Massachusetts 02142
Official Business Penalty for Private Use $300

Postage and Fees Paid Research and Special Programs Administration DOT 513