Mechanical Properties of Permanent Foaming Fixatives for ...
82
Florida International University Florida International University FIU Digital Commons FIU Digital Commons FIU Electronic Theses and Dissertations University Graduate School 3-5-2020 Mechanical Properties of Permanent Foaming Fixatives for Mechanical Properties of Permanent Foaming Fixatives for Deactivation & Decommissioning Activities Deactivation & Decommissioning Activities Tristan Maximilian Simoes-Ponce Florida International University, tsimo011@fiu.edu Follow this and additional works at: https://digitalcommons.fiu.edu/etd Part of the Applied Mechanics Commons, Energy Systems Commons, and the Other Mechanical Engineering Commons Recommended Citation Recommended Citation Simoes-Ponce, Tristan Maximilian, "Mechanical Properties of Permanent Foaming Fixatives for Deactivation & Decommissioning Activities" (2020). FIU Electronic Theses and Dissertations. 4439. https://digitalcommons.fiu.edu/etd/4439 This work is brought to you for free and open access by the University Graduate School at FIU Digital Commons. It has been accepted for inclusion in FIU Electronic Theses and Dissertations by an authorized administrator of FIU Digital Commons. For more information, please contact dcc@fiu.edu.
Transcript of Mechanical Properties of Permanent Foaming Fixatives for ...
Florida International University Florida International University
FIU Digital Commons FIU Digital Commons
FIU Electronic Theses and Dissertations University Graduate School
3-5-2020
Mechanical Properties of Permanent Foaming Fixatives for Mechanical Properties of Permanent Foaming Fixatives for
Deactivation & Decommissioning Activities Deactivation & Decommissioning Activities
Tristan Maximilian Simoes-Ponce Florida International University, [email protected]
Follow this and additional works at: https://digitalcommons.fiu.edu/etd
Part of the Applied Mechanics Commons, Energy Systems Commons, and the Other Mechanical
Engineering Commons
Recommended Citation Recommended Citation Simoes-Ponce, Tristan Maximilian, "Mechanical Properties of Permanent Foaming Fixatives for Deactivation & Decommissioning Activities" (2020). FIU Electronic Theses and Dissertations. 4439. https://digitalcommons.fiu.edu/etd/4439
This work is brought to you for free and open access by the University Graduate School at FIU Digital Commons. It has been accepted for inclusion in FIU Electronic Theses and Dissertations by an authorized administrator of FIU Digital Commons. For more information, please contact [email protected].

FLORIDA INTERNATIONAL UNIVERSITY
Miami, Florida
MECHANICAL PROPERTIES OF PERMANENT FOAMING FIXATIVES FOR
DEACTIVATION & DECOMMISSIONING (D&D) ACTIVITIES
A thesis submitted in partial fulfillment of
the requirements for the degree of
MASTER OF SCIENCE
in
MECHANICAL ENGINEERING
by
Tristan Simoes-Ponce
2020

ii
To: Dean John L. Volakis
College of Engineering and Computing
This thesis, written by Tristan Simoes-Ponce, and entitled Mechanical Properties of
Permanent Foaming Fixatives for Deactivation & Decommissioning (D&D) Activities,
having been approved in respect to style and intellectual content, is referred to you for
judgment.
We have read this thesis and recommend that it be approved.
_______________________________________
Leonel Lagos
_______________________________________
Cesar Levy
_______________________________________
James Connor Nicholson
_______________________________________
Benjamin Boesl, Major Professor
Date of Defense: March 5, 2020
The thesis of Tristan Simoes-Ponce is approved.
_______________________________________
Dean John L. Volakis
College of Engineering and Computing
______________________________________
Andrés G. Gil
Vice President for Research and Economic Development
and Dean of the University Graduate School
Florida International University, 2020

iii
ABSTRACT OF THE THESIS
MECHANICAL PROPERTIES OF PERMANENT FOAMING FIXATIVES FOR
DEACTIVATION & DECOMMISSIONING (D&D) ACTIVITIES
by
Tristan Simoes-Ponce
Florida International University, 2020
Miami, Florida
Professor Benjamin Boesl, Major Professor
The Department of Energy is investigating fixative technologies that encapsulate
and/or immobilize residual contamination in voids during deactivation and
decommissioning (D&D). These technologies must have adequate mechanical and
adhesion properties to withstand seismic activity that may occur. One solution is the
implementation of polyurethane foams used as permanent foaming fixatives (PFF),
specifically intumescent foams that contain expandable graphite, making them fire
resistant when exposed to extreme heat conditions.
Tensile, compression, seismic, and tensile adhesion testing was done on six
commercial-off-the-self polyurethane foams to determine if the expandable graphite and
other filler intumescent technologies improve its mechanical limits. It was found the
expandable graphite loading allowed intumescent foam to have the highest tensile and
compressive stresses of the six tested foams, with better adhesion on rougher surfaces than
smoother surfaces. Shear adhesion testing showed a near-fit linear relationship with surface
area and no dependency on volume. Seismic stressor testing showed adhesion decreased
by 19.8% compared to the control.

iv
TABLE OF CONTENTS
CHAPTER PAGE
CHAPTER I – INTRODUCTION ...................................................................................... 1
1.1 Problem Statement .................................................................................................... 1
1.2 Motivation ................................................................................................................. 1
1.3 Objective ................................................................................................................... 3
CHAPTER II – LITERATURE REVIEW ......................................................................... 5
2.1 Background of Polyurethanes ................................................................................... 5
2.1.1 Chemistry of Polyurethanes ............................................................................... 6
2.1.2 Mechanics of Polyurethanes ............................................................................... 7
2.1.3 Adhesion Mechanisms of Polyurethanes.......................................................... 11
2.1.4 Introduction to Intumescent PU Foam ............................................................. 13
2.2 Previous Mechanical Testing on Polyurethane Foams ........................................... 14
2.2.1 Tensile Testing ................................................................................................. 16
2.2.2 Compression Testing ........................................................................................ 17
2.2.3 Impact Testing .................................................................................................. 19
2.2.4 Adhesion Testing .............................................................................................. 20
2.3 Radiological Shielding Tests by SRNL .................................................................. 21
CHAPTER III – METHODOLOGY ................................................................................ 23
3.1 Hypothesis ............................................................................................................... 23
3.2 Objectives ................................................................................................................ 23
3.2.1 Objective 1 – Effects of Filler on Mechanical Performance ............................ 24
3.2.2 Objective 2 – Adhesion Characterization ......................................................... 24
3.3 Methods ................................................................................................................... 25
3.3.1 Objective 1 Methods......................................................................................... 25
3.3.2 Objective 2 Methods......................................................................................... 26
CHAPTER IV – RESULTS .............................................................................................. 30
4.1 Objective 1 – Effects of Filler on Mechanical Performance ................................... 30
4.1.1 Sample Fabrication ........................................................................................... 30
4.1.2 Objective 1 Results ........................................................................................... 35
4.2 Objective 2 - Adhesion Characterization ................................................................ 44
4.2.1 Sample Fabrication ........................................................................................... 44
4.2.2 Objective 2 Results ........................................................................................... 47
CHAPTER V – CONCLUSION ............................................................................................... 63
REFERENCES ............................................................................................................................ 66

v
LIST OF TABLES
TABLE PAGE
Table 1: Tensile testing mixing components ratios .......................................................... 30
Table 2: Amounts to produced required sample ............................................................... 33
Table 3: Tensile testing results ......................................................................................... 36
Table 4: Compression testing results (cylindrical) ........................................................... 38
Table 5: ASTM D1621 results (cylindrical) ..................................................................... 39
Table 6: Compression testing results (rectangular) .......................................................... 40
Table 7: Compression result values (cubic) ...................................................................... 41
Table 8: Adhesion testing mixing amounts of parts ......................................................... 44
Table 9: Tensile adhesion testing results .......................................................................... 49
Table 10: ImageJ results ................................................................................................... 50
Table 11: Peak loads and temps (November testing) ........................................................ 55

vi
LIST OF FIGURES
FIGURE PAGE
Figure 1: Section 4 of ASTM E3191 [12] .......................................................................... 3
Figure 2: Section 5 of ASTM E3911 [12] .......................................................................... 4
Figure 3: (a) Worldwide PU consumption forecasted up to 2020 [15]; (b) Global
consumption of PUs in 2016 [23] ....................................................................................... 6
Figure 4: (a) PU chemical reaction equation; (b) water interacting with isocyanate
chemical equation [23] ....................................................................................................... 7
Figure 5: (a) Open-celled PU foam; (b) closed-celled PU foam [36] ................................. 9
Figure 6: Examples of different foam cell shapes: (a) tetrahedron, (b) triangular prism,
(c) rectangular prism, (d) hexagonal prism, (e) octahedron, (f) rhombic dodecahedron,
(g) pentagonal dodecahedron, (h) tetrakaicahedron, (i) icosahedron [36] ........................ 10
Figure 7: PU adhesion mechanisms [61] .......................................................................... 12
Figure 8: Micrographs displaying incremental EG loading in PU matrix [67] ................ 14
Figure 9: Shipping 9977 packaging containers [72] ......................................................... 15
Figure 10: Stress vs. density graph [75]............................................................................ 17
Figure 11: (a) Effects of increasing temperature in compression; (b) effects of
increasing strain on compression [75] .............................................................................. 18
Figure 12: Cyclic loading effects on flexible PU foams [78] ........................................... 18
Figure 13: Energy absorption vs. density graph [79] ........................................................ 19
Figure 14: (a) Adhesion graph; (b) different adhesion failure mechanisms [83] ............. 21
Figure 15: Effect of climate on adhesion graph [83] ........................................................ 21
Figure 16. SRNL radiation shielding testing with a 10 cm distance between the source
and identiFINDER [84].................................................................................................... 22
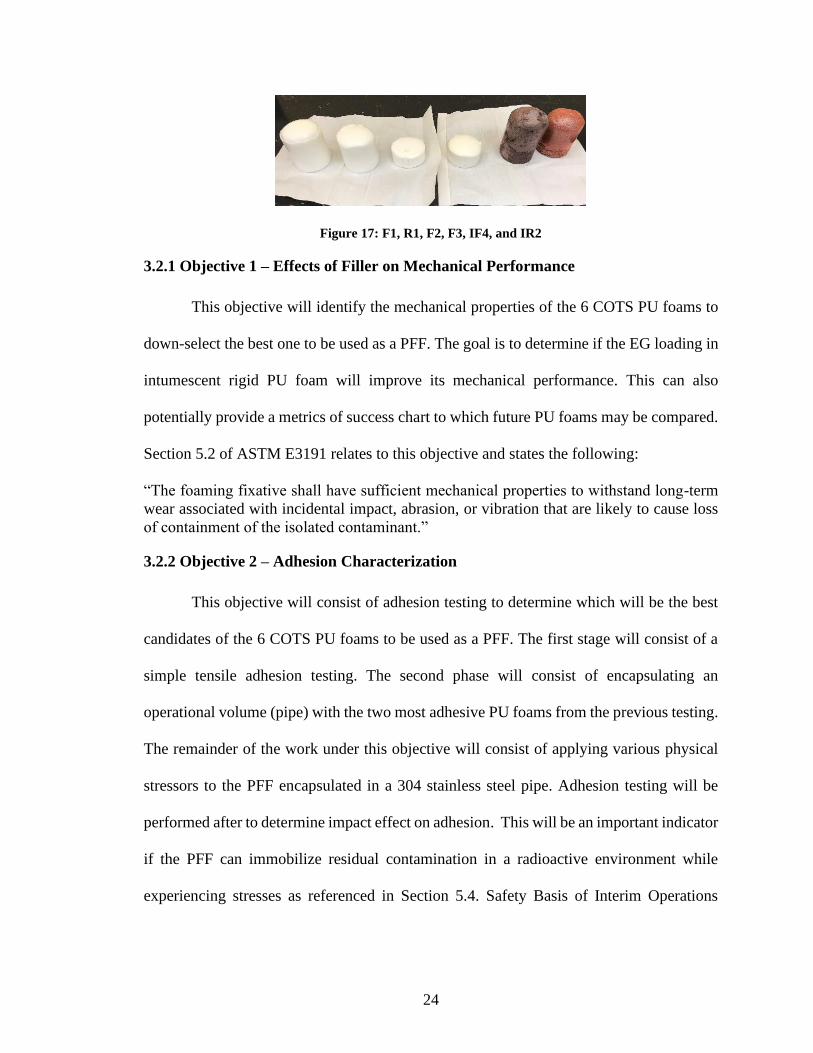
Figure 17: F1, R1, F2, F3, IF4, and IR2 ........................................................................... 24

vii
Figure 18: Shear adhesion experimental design ............................................................... 29
Figure 19: (a) Rigid 3D mold; (b) I-R2 cured in mold; (c) I-R2 excess shaven off ......... 31
Figure 20: (a) Flexible 3D mold; (b) foam cured in mold; (c) foam extracted ................. 32
Figure 21:F1, F2, F3, I-F4, R1, and I-R2 .......................................................................... 32
Figure 22: Compression Molds ......................................................................................... 33
Figure 23: Cylindrical and rectangular samples of foams ................................................ 34
Figure 24: Cubic samples: R1 (left) and I-R2 (right) ....................................................... 34
Figure 25: SEM samples: F1, R1, F2, F3, R1, I-F4 and I-R2 ........................................... 34
Figure 26: (a) Flexible foam flexing; (b) rupturing during tensile testing ........................ 35
Figure 27: Tensile testing graphs ...................................................................................... 36
Figure 28: Flexible foam compression testing .................................................................. 37
Figure 29: Compression testing graph (cylindrical) ......................................................... 38
Figure 30: Compression testing graph (rectangular) ........................................................ 39
Figure 31: Compression testing results (cubic) ................................................................ 41
Figure 32: Compression testing on different cubic concrete specimens [96] ................... 42
Figure 33: Flexible foam compression testing aftermath ................................................. 43
Figure 34: (a) Intumescent foam; (b) rigid foam; (c) flexible foam ................................. 43
Figure 35: (a) Foam curing in 3D mold; (b) foam excess outside of mold; (c) foam
extracted from mold .......................................................................................................... 45
Figure 36: Adhesion sample with four hinges .................................................................. 46
Figure 37: F1, R1, F2, F4, I-R2 and I-F2 .......................................................................... 46
Figure 38: (a) Different volumes of pipe encapsulated with R1 and I-R2 foam;
(b) rough and smooth internal piping ................................................................................ 47
Figure 39: Flexible foam tensile testing process............................................................... 48

viii
Figure 40: Tensile adhesion graph .................................................................................... 48
Figure 41: Scanned coupons: F1, R2, F2, F3, I-R2 and I-F4 ............................................ 49
Figure 42: (a) Intumescent foam; (b) rigid non-intumescent foam; (c) non-intumescent
flexible foam ..................................................................................................................... 50
Figure 43: Shear adhesion testing ..................................................................................... 51
Figure 44: September adhesion testing on I-R2 foams ..................................................... 52
Figure 45: Aftermath of adhesion testing ......................................................................... 52
Figure 46: (a) P40 grit inside pipe; (b) roughing up pipe; (c) using a level to ensure
balance .............................................................................................................................. 53
Figure 47: A: Foam before curing; B: foam after curing .................................................. 54
Figure 48: November testing on I-R2 Foam ..................................................................... 54
Figure 49: Comparison of adhesion testing ...................................................................... 56
Figure 50:(a) 3D bucket piece, (b) sample inside of bucket piece.................................... 57
Figure 51: Shear adhesion results of 2-inch samples ........................................................ 57
Figure 52: Comparison of both volumes .......................................................................... 58
Figure 53: Comparison of both 4-inch diameter volumes ................................................ 59
Figure 54: Surface area vs. loading graph ........................................................................ 60
Figure 55: (a) Water submersion; (b) drop test; (c) muffle furnace ................................. 61
Figure 56: Physical stressors findings............................................................................... 62
1
CHAPTER I – INTRODUCTION
1.1 Problem Statement
There is a high operational requirement across the Department of Energy’s Office
of Environmental Management (DOE-EM) complex for a fixative that can immobilize
residual contamination and/or encapsulate three-dimensional void volumes (pipes, glove
boxes, drums, etc.) during deactivation and decommissioning (D&D) activities. DOE sites
such as Hanford [1] and Idaho National Laboratory [2] can benefit from this technology
since both sites contain hundreds of miles of contaminated piping. Savannah River Site
(SRS) can also implement this technology since it contains multiple contaminated
gloveboxes [3] and hot cells [4] with equipment that cannot be readily removed.
Application of this fixative must be simple, cost-effective, and safe in order to ensure
worker’s safety.
Basis of Interim Operation (BIO) documents postulate contingency scenarios
involving seismic and thermal activity that can occur at DOE sites during D&D. These
events insinuate that current and future fixative technologies must have sufficient
mechanical and adhesion properties to withstand earthquakes, blunt trauma, free fall, etc.
in order to prevent a potential release of residual contamination [5]. The likelihood of these
events remain high due to many DOE facilities remaining dormant for around 60 years
before completion of the final disposition stages [6].
1.2 Motivation
The relevancy of immobilizing residual contamination cannot be taken lightly.
Gross decontamination is the process of removal of radiological contamination by physical

2
means and is usually implemented first during the cleanup process [7]. It is very common
after gross decontamination efforts for sites to remain dormant for multiple years before
the final disposition stages. During this timeframe, loose contamination could potentially
be mobile. This is especially relevant for facilities where high amounts of radioactive dust
exist. A fixative can be applied to immobilize any airborne contamination [8]. Whatever
fixative technology is chosen for implementation must have excellent long-term adhesion
capabilities in order to immobilize residual contamination.
Release of residual contamination is an issue that has recently been broadcasted
nationwide by media outlets. Towards the end of 2018, radioactive dust was found in
communities around Hanford Nuclear Site, Rocky Flats and Los Alamos National
Laboratory [9]. Microscopic particles of plutonium, thorium, and uranium were found in
household dust, automotive air cleaners, and hiking trails. These particles present hazards
that can exceed lifelong doses and can make areas around sites uninhabitable. Also
occurring in 2018, cleanup missions at Hanford were stopped after plutonium dust was
released from a building during demolition activities, became airborne, and coated nearby
workers’ cars. Some of this material may have been deposited in the Columbia River,
which would cause a nationwide catastrophe depending on the amount released to the
water[10]. The recent disaster that contaminated 35% of the area at the Waste Isolation
Pilot Plant (WIPP) in 2014 was a result of using organic zeolite to protect nuclear waste
tanks. The organic zeolite should have been replaced by a stronger, less volatile material
that could have prevented one of the most expensive nuclear accidents in U.S. history with
recovery costs nearing 2 billion dollars [11].

3
1.3 Objective
Discussions with representatives from the Savannah River National Laboratory
(SRNL) have led to a possible solution that satisfies these operational requirements by
implementing commercial-off-the-shelf (COTS) closed-celled polyurethane (PU) foams as
permanent foaming fixatives (PFF). American Society for Testing and Materials (ASTM)
E3191: Standard Specification for Permanent Foaming Fixatives Used to Mitigate Spread
of Radioactive Contamination was recently developed for the intended use of this
technology. Figure 1 defines the attributes of a permanent foaming fixative (PFF) is per
ASTM E3191 [12].
Figure 1: Section 4 of ASTM E3191: Standard Specification for Permanent Foaming Fixatives Used
to Mitigate Spread of Radioactive Contamination [12]
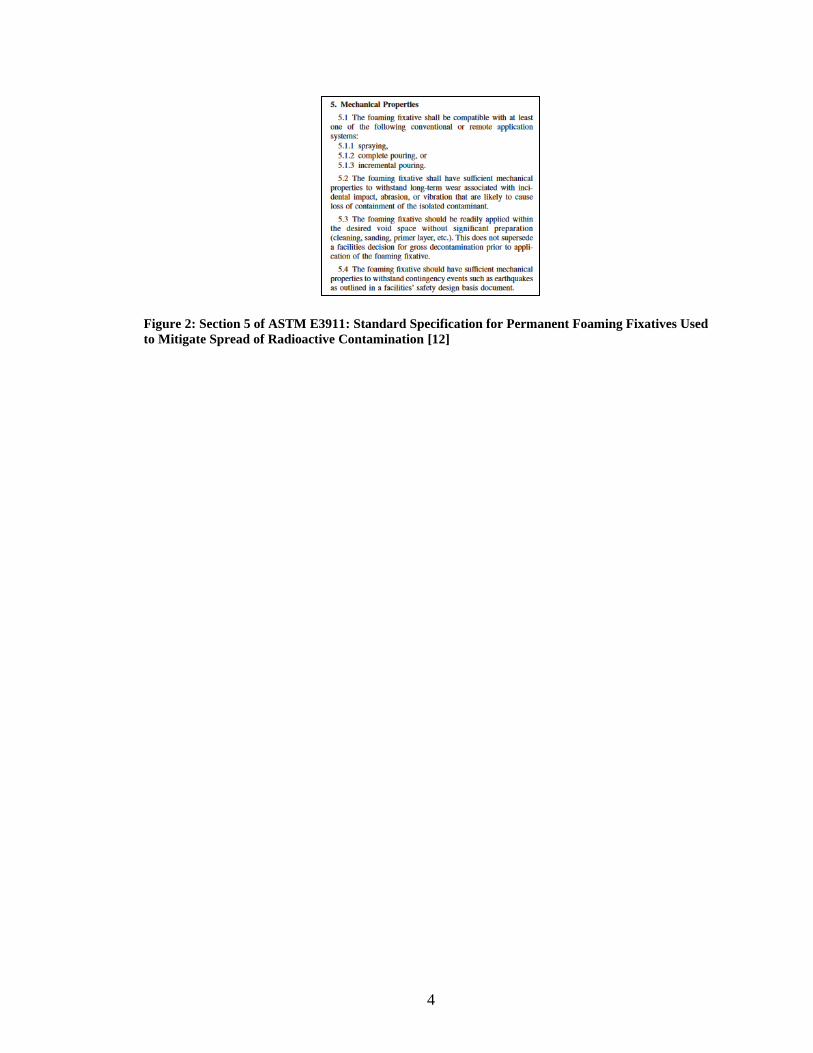
It is intended for this research to lead to more substantive advancements in the
concept of PFFs to improve safety in D&D activities across the entire DOE-EM complex. It
is the intent of the work presented in this thesis to better identify and define operational
parameters for PFFs, and to be considered as a reference for updating Section 5 of ASTM
3191 which details mechanical properties of PFFs (Figure 2).
4
Figure 2: Section 5 of ASTM E3911: Standard Specification for Permanent Foaming Fixatives Used
to Mitigate Spread of Radioactive Contamination [12]

5
CHAPTER II – LITERATURE REVIEW
2.1 Background of Polyurethanes
The first ever urethane was fabricated in 1849 by Wurtz [13]. The polyurethane
industry was revolutionized by the invention of the diisocyanate polyaddition technique by
Bayer in 1937. Polyurethanes became relevant during World War II as a replacement for
rubber due to rubber becoming scarce. Over the next couple of decades, PUs have become
one of the most researched and valuable materials in the world [14].
Polyurethanes are versatile polymeric materials whose properties can be altered by
manipulation of the fabrication process [15]. Desired results can be achieved by changing
the amounts of diisocyanate, polyester diol, surfactants, catalysts, and blowing agents [16].
Polyurethanes display excellent mechanical strength, toughness, abrasion, corrosion and
chemical resistance and low temperature resistance. Polyurethanes exhibit combined
properties of metals (toughness) and rubber (elasticity), which makes them suitable
replacements for other materials [17]. Polyurethanes are malleable materials which allows
for them to be encapsulated in a variety of complex volumes by extrusion or injection
molding [18]. Polyurethanes are primarily utilized in automotive, textiles, arts and craft,
cushioning, structural support, and buoyancy industries [19]. The most common forms of
PUs are thermoplastic PUs, flexible PUs, rigid PUs, waterborne, binders, coatings,
adhesives, sealants, and elastomers [20]. Polyurethane foams can either be thermosetting
or thermoplastic polymers. Thermoplastics can be recycled while thermosets are harder to
recycle because they are heavily crosslinked, or chemically bonded together [21].
Polyurethane rigid foams have become the most heavily consumed commercialized version

6
of polyurethanes within the past couple years due to its insulative properties and its ability
to reduce outside noise (Figure 3a and b)[22].
Figure 3: (a) Worldwide PU consumption forecasted up to 2020 [15]; (b) Global consumption of PUs
in 2016 [23]
2.1.1 Chemistry of Polyurethanes
Polyurethanes are produced from an exothermic reaction between a polyester diol
(an alcohol with two or more hydroxyl groups in a molecule) and a isocyanate (highly
reactive and low molecular compound) (Figure 4a) [24]. Polyurethane’s expansion
capabilities depend on various processes that occur during the chemical reaction. Initially
during the latent phase, the reactants are mixed, and polymerization occurs (reaction
between isocyanate and polyol), which can last up to 30 seconds. Saturation is achieved
when the blowing gas dissolves in this mixture and bubbles start to form [25]. Cell growth
and expansion ensues when the chemical blowing agent, which is typically water, reacts
with the isocyanate (Figure 4b) [23] and ends when steady-state is reached. Foam viscosity
starts to increase, and all liquid constituents become solid. The cross-linking between the
polyol and isocyanate solidify all the cell faces and walls, which gives the polymer its
mechanical performance [26].

7
Figure 4: (a) PU chemical reaction equation; (b) water interacting with isocyanate chemical equation
[23]
Surfactants and catalysts are reactants that are also implemented in the
polymerization process. Surfactants used in PUs are copolymers that are composed of
silicone backbone and poly grafts [27]. They lower the surface tension in order to promote
creation of bubbles, stabilize cells, and can influence cell sizes and growth [28]. Catalysts
promote the reaction between the isocyanate, polyols, and blowing agents. They are
primarily responsible for influencing the expansion of cells [29]. Catalysts also monitor
heat growth caused by the isocyanate. The exothermic reaction is vital in determining the
density and other properties of PUs. Catalysts, like tertiary amines (compounds that contain
a lone nitrogen atom), speed up the expansion process with recorded curing temperatures
of 130-140 ˚C in the middle of the PU. This causes the viscosity of the fluid to become
very high within a couple seconds which prohibits further pouring of other reactants [30].
2.1.2 Mechanics of Polyurethanes
Manipulating the fabrication results can alter the mechanical performance of PUs
[31]. Both flexible and rigid PU foams have similar chemistry, but what distinguishes both
are the amounts of reactants involved [32]. Changing the functionality of the polyol without
8
changing the molecular weight can increase the foam hardness while reducing other
properties like tensile strength, tear strength and elongation [24]. Increasing the molecular
weight of the polyol can induce the opposite effect [24]. The isocyanate molecule dictates
reactivity of the chemical reaction taken place. Different isocyanate yields different results.
Aromatic isocyanate can produce higher glass transition temperatures, modulus and tensile
strength, but can negatively affect elongation and impact properties [33]. Aliphatic
isocyanates produce rubbery materials with enhanced elastic properties [34]. Higher
isocyanate content can produce harder segments, which make the foam rigid [35]. The
higher isocyanate amounts yield higher cross-linking which makes the atoms closer
together in contrast to flexible PU foams [33].
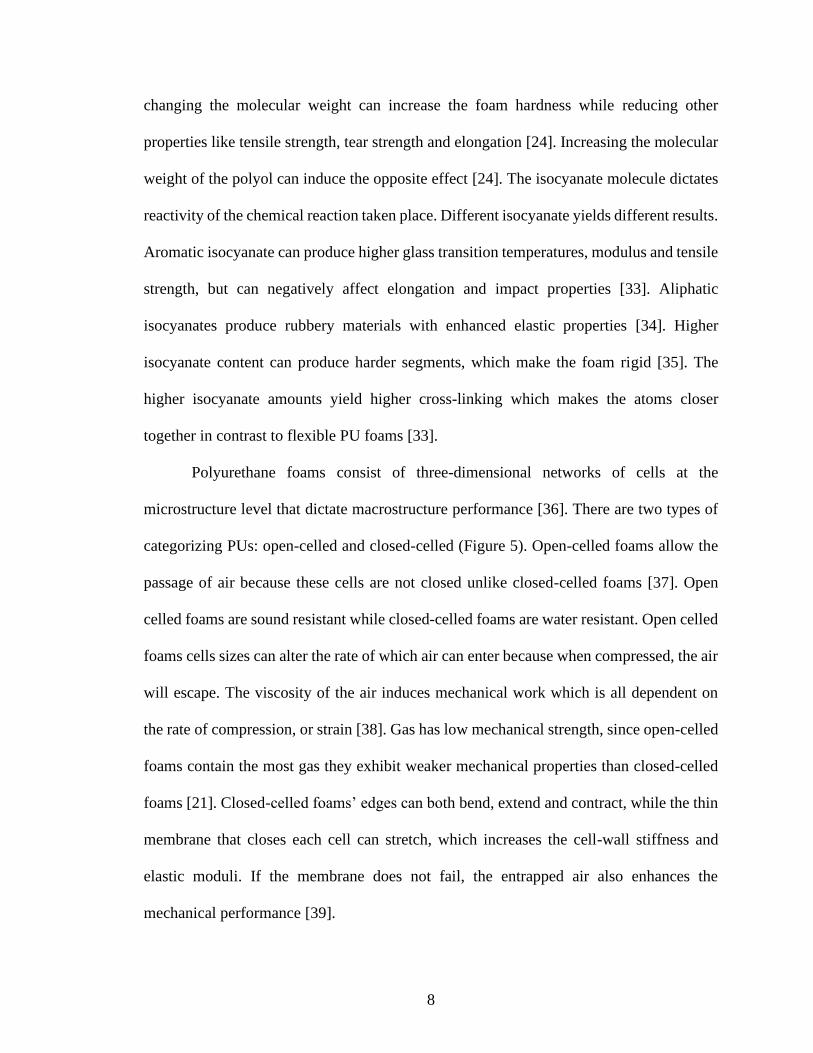
Polyurethane foams consist of three-dimensional networks of cells at the
microstructure level that dictate macrostructure performance [36]. There are two types of
categorizing PUs: open-celled and closed-celled (Figure 5). Open-celled foams allow the
passage of air because these cells are not closed unlike closed-celled foams [37]. Open
celled foams are sound resistant while closed-celled foams are water resistant. Open celled
foams cells sizes can alter the rate of which air can enter because when compressed, the air
will escape. The viscosity of the air induces mechanical work which is all dependent on
the rate of compression, or strain [38]. Gas has low mechanical strength, since open-celled
foams contain the most gas they exhibit weaker mechanical properties than closed-celled
foams [21]. Closed-celled foams’ edges can both bend, extend and contract, while the thin
membrane that closes each cell can stretch, which increases the cell-wall stiffness and
elastic moduli. If the membrane does not fail, the entrapped air also enhances the
mechanical performance [39].

9
Figure 5: (a) Open-celled PU foam; (b) closed-celled PU foam [36]
Another microscale property that can affect the mechanics is the relative density
[40]. It describes the void fraction of the cellular network and it is the ratio of the density
of the foam to that of the bulk material of which the foam is made up [41]. Increasing the
relative density can enhance Young’s Modulus, and plastic collapse stress [42]. Equation
1 shows the equation for relative density (ρf/ ρs).
𝑃𝑓
𝑃𝑠= 𝐶(
𝜌𝑓
𝜌𝑠)𝑛 (1)
N ranges from 1 to 2 and a value of 2 represents an open-celled foam. Other values
relate to closed-celled foams that can undergo stretching and struts while bending. C is a
constant, P represents any mechanical property and ρ is the density. The subscripts f and s
relate to the properties of a fully dense solid and the foam [43].
The cell shape is a vital attribute that can dictate mechanical performance [44].
Cells of PU foams elongate in the direction of rise which makes the material anisotropic
[45]. Equation 2 shows the anisotropy ratio, R, and is the ratio of the unit cell parallel (h)
and perpendicular to the direction of elongation (l) [43].
𝑅 =ℎ
𝑙 (2)

10
Equation 1 then becomes Equation 3 when incorporating Equation 2. According to
Equation 3, the mechanical properties linearly increase in the direction of expansion and
decreases in other directions.
𝑃𝑓
𝑃𝑠= 𝐶(
𝜌𝑓
𝜌𝑠)𝑛 ∗ 𝑓(𝑅) (3)
Cell shapes also play a role in mechanical performance and are influenced by
surface tension at the interface and competitive cell growth. A bigger cell will be
surrounded by smaller cell due to the pressure difference during expansion. 3D cells consist
of different geometric shapes that each contain different number of vertices, contact
neighbors, intersections, connectivity, and edges (Figure 6) [36]. All these features can
influence the relative density as well as contributing to different of constants for stress
calculations. Monoclinic materials require 13 constants to compute stresses using Hooke’s
law, which is defined as the stress equaling to Young’s modulus times strain, while
orthotropic requires 9 [46].
Figure 6: Examples of different foam cell shapes: (a) tetrahedron, (b) triangular prism, (c)
rectangular prism, (d) hexagonal prism, (e) octahedron, (f) rhombic dodecahedron, (g) pentagonal
dodecahedron, (h) tetrakaicahedron, (i) icosahedron [36]

11
2.1.3 Adhesion Mechanisms of Polyurethanes
Adhesion is defined as the molecular interaction at an interface between two or
more dissimilar materials. Polyurethane foams are being investigated for their adhesive
potential to adhere onto adherends (i.e. substrates, surfaces, etc.), such as stainless steel in
DOE facilities [47]. Polymer-metal hybrids are sought after especially in the aerospace and
automobile industries where high performances and light components are desired [48]. The
overall objective for this hybrid is to achieve strength, durability, impact resistance, and
abrasion [49]. Factors that influence adhesion joint strength are amount of moisture, types
of environment, materials and mechanical stress [50].
There are multiple ways of adhesion to occur for dissimilar materials in polymer-
hybrids. The most common is adhesive bonding/direct bonding [51]. This bonding relies
heavily on the surface roughness of the adherend to allow for mechanical interlocking [52].
Mechanical interlocking depends on the number of cavities and pores on an adherend’s
surface [53]. An adherend’s roughness affects the strength of bonded joints due to the
increased contact area cavities and pores induce [54] . A high-surface roughness area may
increase stress concentration and reduce joint adhesion strength due to the adhesive being
unable to penetrate wholesomely into voids [55]. Adhesion reactivity depends heavily on
the isocyanate chemical instead of the polyol. The isocyanate molecule is difunctional
meaning there are two molecules, which makes it more reactive than a polyol [56]. The
primary physical-chemical reaction occurs via covalent bond between the isocyanate group
and the iron oxide layer of the stainless steel’s surface [57]. Adhesion capabilities also
depends on the amount of wettability the adhesive wets, or covers, on the adherend’s
surface. Complete wetting happens when the summation of surface energy of the liquid-

12
vapor and solid-liquid interface is less than the energy of the surface energy of the solid-
vapor [58]. Electrostatic interactions occur when dissimilar materials interact and cause a
net electrostatic charge due to electrostatic differences [59]. One other adhesion
mechanism is the ability of the polymer chains to diffuse at the adhesive joint. The
formation of new polymer chains to be made thru the adhesion interface requires two
macromolecules have intimate contact [60]. Figure 7 illustrates all the different adhesion
mechanisms that can occur [61].
Figure 7: PU adhesion mechanisms [61]
There are three stages that occur during the adhesion of PU and a stainless-steel
substrate. The first is known as the powder-coating process when negatively charged
particles of the foam are attracted to the positively charged particles on the steel substrate
by electrostatic interactions, followed by mechanical interlocking into available pores [59].
Cross-linking allows for polar and secondary interactions to occur, with covalent bonds
being formed with the adherend [62]. The next stage is known as the over molding process.
Polymer chains start to diffuse due to high temperatures. This process continues until
temperatures stabilize and steady state is achieved [61].

13
2.1.4 Introduction to Intumescent PU Foam
Polyurethane foams, especially rigid PU foams, are severely flammable and can
release carbon monoxide and hydrogen cyanide when exposed to thermal stressors [63].
Incorporating filler in the PU foam’s matrix such as nano carbon-based particles, for
example, expandable graphite (EG) can mitigate the transfer of heat and oxygen, thus
increasing the thermal insulation [64]. When heated to temperatures around 572 ⁰F, EG
melts into a viscous liquid and chemical reactions occur, causing fluids with low thermal
conductivity that get trapped in solid bubbles. Acids begin to catalyze and dehydration
occurs, leading to polymer aromatization and graphitization [65]. The phosphate molecule
begins to cross-link and flammable gases and blowing agents begin the expansion phase.
Expandable graphite then can increase its volume by hundreds of times its’ initial volume
and provide an insulating soft char layer. This process is known as intumescing and is used
as passive fireproofing steel structures [66].
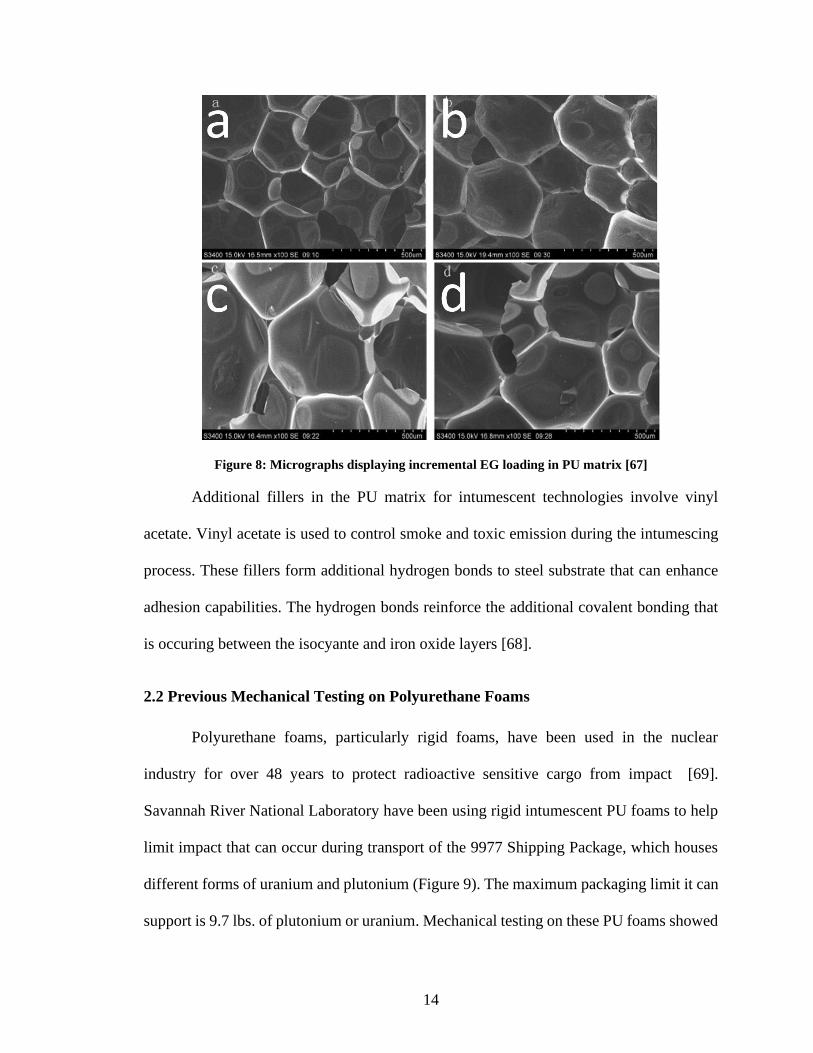
The EG loading affects the cell morphology as the cells appear to be initially
spherical and then turn into polyhedral forms (Figure 8). It is seen with each loading of
EG increase (from a to b to c to d) in Figure 8, that unstable cell growth begins to occur.
Cell collapse happens due to the cell walls rupturing amongst each other as evident in
parts c and d in Figure 8. Higher loadings result in higher densities which is a function of
higher crosslinking. Compression testing showed an increase in compression from 31.62
to 32.08 psi when testing samples with higher EG loading. Diethyl phosphate was used to
regulate cell growth the EG loading induces [67].
14
Figure 8: Micrographs displaying incremental EG loading in PU matrix [67]
Additional fillers in the PU matrix for intumescent technologies involve vinyl
acetate. Vinyl acetate is used to control smoke and toxic emission during the intumescing
process. These fillers form additional hydrogen bonds to steel substrate that can enhance
adhesion capabilities. The hydrogen bonds reinforce the additional covalent bonding that
is occuring between the isocyante and iron oxide layers [68].
2.2 Previous Mechanical Testing on Polyurethane Foams
Polyurethane foams, particularly rigid foams, have been used in the nuclear
industry for over 48 years to protect radioactive sensitive cargo from impact [69].
Savannah River National Laboratory have been using rigid intumescent PU foams to help
limit impact that can occur during transport of the 9977 Shipping Package, which houses
different forms of uranium and plutonium (Figure 9). The maximum packaging limit it can
support is 9.7 lbs. of plutonium or uranium. Mechanical testing on these PU foams showed

15
the glass transition temperature was 278.6 °F, above which the foam was found to be more
elastic [70]. The foam showed no degradation without any applied stresses around 150 °F.
The intumescing phase did not start until the ignition temperature (600 °F) was reached.
The thermal properties of the foam were not affected by water submersion or humidity
effects due it being closed-celled. Crush strength testing on the foam showed a 5% increase
in the normal direction of expansion compared to testing in the parallel direction [71].
Dynamic crush testing on 15 lbs./ft3 FR-3700 foam at temperatures of -18.4 to 75.2 °F
ensured delivery of acceptable results. Cooling down the foam with no external loading
from high temperatures showed no effects on mechanical performance and aging studies
by both Sandia National Laboratory (SNL) and General Plastics on 20-year-old foam
samples showed no effects in crush strength [71].
Figure 9: Shipping 9977 packaging containers [72]

16
Savannah River National Laboratory also conducted a variety of impact testing on
the 9977 shipping packages with the rigid intumescent PU foam inside motivated by
Normal Conditions of Transport (NCT) and Hypothetical Accident Conditions (HAC) per
the Department(s) of Transportation [72]. The impact testing ensured selection of materials
in the package would not cause any chemical, galvanic, or any other reactions that might
affect the packages performance [73]. Impact testing included free drop testing from 4 feet,
which showed negligible surface damage and deformation. Crush testing utilized a 1750
lbf load placed on top of the package for 24 hrs. Vibration testing was performed on a large
shake table to simulate truck transport and forklifting. The shipping 9977 package was also
subjected to randomized vibrations to simulate 20,000 miles of shipping for over 20 hours.
Puncture testing involved a steel cylinder of 13 lbs., (1.25 in. diameter) being dropped from
a height of 3.28 ft. (1 m). Negligible damages were observed on the package’s lid. Water
spraying testing showed 13.6 lbs. of water entered the drum’s cavity. Fourteen vent plugs
helped prevent water from reaching the PU foam. Fire testing was done over 30 minutes
of exposure at an average temperature of 2681 °F. X-rays were taken before and after
testing, and all post-testing data showed no loss of confinement occurred [73].
2.2.1 Tensile Testing
Rigid PU foams are heavily favored due to their high strength-to-weight ratios for
low densities [74]. Sandia National Laboratory (SNL) conducted uniaxial tension tests for
different density rigid PU foams under various temperatures. Tensile testing was performed
only at 70 and 165.2 °F at a strain rate of 10-2 s-1. Failure stress at 165.2 °F was around

17
20% lower than the failure experienced at 21 °F and strain was 14% more. SNL also proved
that denser foams performed better in terms of tensile moduli and failure (Figure 10) [75].
Figure 10: Stress vs. density graph [75]
2.2.2 Compression Testing
For compression testing, SNL complied with ASTM D695 and determined that a
rigid polyurethane foam (12 lbs./ft3) lost compressive strength and modulus with increasing
temperature and strain rates (Figure 11) [75]. Another study by SNL on rigid foams
undergoing uniaxial compression at various temperatures -85 to 356 °F showed foams
failed drastically when subjected to the coldest temperatures at small strain rates (0.01 s-1)
[76]. Sandia National Laboratory deduced that the aspect ratio, ratio between height and
diameter, did not affect the results drastically. The studies also showed that rigid urethane
foams can be used before the urethane bonds decomposed around 287.6 °F [77]. The rigid
foams performance was also a function of density as the denser foams (26 lbs./ft3)
performed better than the less dense foam (4.5 lbs./ft3) [75].

18
Figure 11: (a) Effect of increasing temperature in compression; (b) effects of increasing strain on
compression [75]
Sandia National Laboratory has performed mechanical testing on flexible foams
as well [78]. When cooled to temperatures below their glass transition temperatures -31
°F, they behaved like rigid polyurethane foams and were able to plastically deform. SNL
ultimately concluded that flexible foams would return to their original shape if operated
at room temperature but if they experienced large loading, their performance would likely
weaken afterwards (Figure 12) [78].
Figure 12: Cyclic loading effects on flexible PU foams [78]

19
2.2.3 Impact Testing
Drop weight impact testing by SNL was performed on standing right circular
cylinder foam specimens with geometries that were chosen to simulate in an operational
environment that involved shock mitigation [79]. The strain rates used were 70 s-1 which
caused all the specimens to fail prematurely. Increasing strain rates also produced increased
stresses similarly to the compression testing results. Peak stresses occurred at 1 millisecond
(ms) and impact contact lasted less than 4 ms. Failure occurred around 60% of the peak
stress of 6 MPa. SNL concluded results are geometry and density dependent and how the
specimens are supported and impacted affected the results [80]. Figure 13 shows different
density foams and their corresponding energy absorptions, from which SNL was able to
conclude that an optimum foam density exists, in which energy absorption is at its peak
[79].
Figure 13: Energy absorption vs. density graph [79]

20
Planar impact testing was performed by Ben Gurion University of the Negev with
the intention to analyze the dynamic responses of PU foams [81]. Testing consisted of
using a gas gun and Velocity interferometer system for any reflector (VISAR) monitoring
to measure the impact velocity profiles ranging from 101575 to 1.429x10⁶ in/min on the
PU foam’s surface. Results included compression stresses from 52.21 to 7396.92 psi with
strain rates ranging from 4x10³ - 6x10⁵ s-1. The foam started to crush around an impact
velocity of 333071 in/min and a pressure of 464.12 psi. As density decreased,
compressional loadings caused the shock and temperatures to increase [82]. Similar
VISAR experiments were performed by Los Alamos on PU foams whose densities ranged
from 0.012-0.032 lbs./in3. The max velocity was 8503937 in/min, with dissipation rates
depending on the foam’s densities. The shock input pressures ranged from 433662 to
1171906 psi, which also showed a dependency on density [82].
2.2.4 Adhesion Testing
A peel test was done by Mahmood at Martin-Luther University by cutting
rectangular thermoplastic strips of 0.65 in3 [83]. The test used a peel angle of 90˚ at room
temperature. The peeling rate used was 0.39 in/in. The peel force (N/mm) was recorded to
compute the max force required to peel the PU foam from the thermoplastic substrate. The
peel forces were found to be 28.5-34.2 lbf/in. Increasing the roughness of the surface by
3.93x10⁻⁸ in. caused a 1.96x10⁻⁵ in. thickness increase of PU material which demonstrates
the effect of mechanical interlocking. A cohesive failure occurred when the thermoplastic
material was stronger than the peel force. Figure 14a shows the produced adhesion graph
and Figure 14b displays different failure adhesion mechanisms [83].

21
Figure 14: (a) Adhesion graph; (b) different adhesion failure mechanisms [83]
Different climate treatment without humidity drastically reduced the peel strength
(Figure 15). The diffusion of water potentially caused adhesion failure due to it affecting
the hydrogen bonding at the interface. This was achieved in testing without humidity. High
humidity and high temperature also had similar effect but low temperatures did not [83].
Figure 15: Effect of climate on adhesion graph [83]
2.3 Radiological Shielding Tests by SRNL
Scientists at Savannah River National Laboratory (SRNL) have recently been
interested in conducting research and experiments on rigid and flexible polyurethane foams

22
to determine their ability to immobilize radioactive contamination. Rigid foams are known
for reducing energy costs and for being great insulation materials, while flexible foams are
used in a wide variety of products such as bedding and shock absorbers due to their
flexibility. Savannah River National Laboratory initiated testing on a wide variety of COTS
foams to determine which properties would be deemed compatible with the safety basis
requirements in a radioactive environment. The properties deemed relevant were the
foaming characteristics, temperature profiles, and loading of high-density additives to
shield gamma emitting isotopes such as Am-241, Cs-137, and Co-60.
Savannah River National Laboratory created and cured the following four foam
samples with and without additives. All the foam samples were within about ±5% of their
expected expansion volume. Foams with the additives experienced a slight temperature
difference compared to the unmodified foams. The temperature difference was within the
margin of error, and all foams cooled to room temperature within 15 minutes. Using an
identiFINDER, an experiment using the various additives was conducted by SRNL to test
the foams’ abilities to shield radiation. The results demonstrated the following effective
shielding of the gamma isotopes with the highest density additives: 98% of Am-241, 16%
of Cs-137, and 9.5% of Co-60 [84].
Figure 16. SRNL radiation shielding testing with a 10 cm distance between the source and
identiFINDER [84].

23
CHAPTER III – METHODOLOGY
3.1 Hypothesis
There are two hypotheses that will be proven or refuted over the course of this thesis:
1. Commercial-off-the-shelf (COTS) intumescent polyurethane rigid foams will have
better mechanical limits than non-intumescent commercial-off-the-shelf rigid
foams due to the increased and consistent cell size and relative density the
expandable graphite loading, or other fillers induces.
2. Commercial-off-the-shelf rigid polyurethane foams will have better adhesion than
non-rigid commercial-off-the-shelf foams due to higher cross-linking, slower
curing times, and higher reactivity due to high isocyanate content. Commercial-off-
the-shelf intumescent rigid foams may have better adhesion than non-intumescent
commercial-off-the-shelf rigid foams due to having extra fillers like vinyl acetate
that form additional hydrogen bonds.
3.2 Objectives
The following objectives will support both hypotheses stated in the previous
sections with the main interest of updating Section 5 of ASTM E3919. 6 COTS PU foams
will be tested (Figure 17). There will be a combination of flexible, rigid, and intumescent
PU foams. The naming convention will be as follows: I denotes intumescence, F denotes
flexible, and R denotes rigid.
24
Figure 17: F1, R1, F2, F3, IF4, and IR2
3.2.1 Objective 1 – Effects of Filler on Mechanical Performance
This objective will identify the mechanical properties of the 6 COTS PU foams to
down-select the best one to be used as a PFF. The goal is to determine if the EG loading in
intumescent rigid PU foam will improve its mechanical performance. This can also
potentially provide a metrics of success chart to which future PU foams may be compared.
Section 5.2 of ASTM E3191 relates to this objective and states the following:
“The foaming fixative shall have sufficient mechanical properties to withstand long-term
wear associated with incidental impact, abrasion, or vibration that are likely to cause loss
of containment of the isolated contaminant.”
3.2.2 Objective 2 – Adhesion Characterization
This objective will consist of adhesion testing to determine which will be the best
candidates of the 6 COTS PU foams to be used as a PFF. The first stage will consist of a
simple tensile adhesion testing. The second phase will consist of encapsulating an
operational volume (pipe) with the two most adhesive PU foams from the previous testing.
The remainder of the work under this objective will consist of applying various physical
stressors to the PFF encapsulated in a 304 stainless steel pipe. Adhesion testing will be
performed after to determine impact effect on adhesion. This will be an important indicator
if the PFF can immobilize residual contamination in a radioactive environment while
experiencing stresses as referenced in Section 5.4. Safety Basis of Interim Operations

25
(SBIO) documents will be heavily referenced as well as having discussions with SRNL
representatives to determine realistic seismic stressors that can occur at DOE sites. This
objective is motivated by Section 5.4 of ASTM E3191, which states the following:
“The foaming fixative should have sufficient mechanical properties to withstand
contingency events such as earthquakes as outlined in a facilities’ safety design basis
document.”
3.3 Methods
The following methods will be used to help satisfy both objectives.
3.3.1 Objective 1 Methods
The following will outline the several sections of Objective 1. All testing methods
are inspired by rigid PU foam testing performed at the Institut Teknologi Sepuluh
Nopember [85]
3.3.1.1 Tensile Testing
Residual contamination can be trapped inside the PFF and tension may cause
subsequent release of the residual contamination due to induced delamination. Tensile
testing will be performed to characterize the foam’s mechanical properties that involve
Young’s Modulus, strain, peak stress and peak load. These properties can be calculated by
analyzing the produced stress-strain curves. An MTS Systems Corporation (MTS)
Criterion 43 Tensile Tester was utilized for this task. The standards to be considered are
ASTM D3574-E Flexible Cellular Materials – Slab, Bonded, and Molded Urethane Foams
(flexible) [86] and ASTM D1623 Tensile and Tensile Adhesion Properties of Rigid
Cellular Plastics (rigid) [87]. ASTM D3574-E specifies a pull rate of 20 in/min while
ASTM D1623 states to use a pull-rate of 0.05 in/min.

26
3.3.1.2 Compression Testing
Residual contamination may be trapped inside permanent foaming fixative and any
static loading can cause a release of the contamination. Compression testing will be
performed to characterize the foam’s mechanical properties that characterizes compression
stress, compression strain, compression modulus and maximum compression modulus. An
MTS Criterion 43 Tensile Tester will be utilized for this task. The standards that will be
utilized are ASTM 3574-C Flexible Cellular Materials – Slab, Bonded, and Molded
Urethane Foams (flexible) and ASTM D1621 Compressive Properties of Rigid Cellular
Plastics (rigid) [88]. ASTM 3574-C for the flexible foams states to pre-flex the foams twice
at a rate of 10 in/min and then compress the foam for 2 in/min and dwell for a minute.
ASTM D1621 states to compress the rigid foam at a rate of 10% of its initial thickness until
the foam is compressed 13% of its original thickness. Testing will stop if the rigid foam
reaches this strain criteria or until it reaches the load limit of the MTS which was set to
8992.35 lbf.
3.3.1.3 Cell Size Evaluation
After completion of mechanical testing, scanning electron microscopy (SEM) will
be utilized to evaluate the cell sizes of each of the PU foam samples. This can help compare
cell sizes to the results obtained from mechanical testing since cell sizes influences
mechanical properties.
3.3.2 Objective 2 Methods
The following methods will be done in support of satisfying objective two.

27
3.3.2.1 Tensile Adhesion Testing
Adhesion capabilities will ultimately decide whether a permanent foaming fixative
can immobilize residual contamination. Any sort of incidental impact can cause the foam
to delaminate from the substrate thereby releasing residual contamination. ASTM D1623:
Test Method for Tensile and Tensile Adhesion Properties of Rigid Cellular Plastics will be
used to conduct adhesion testing.
Using the MTS Criterion Series 43 Tensile Tester, the tensile adhesion strength will
be calculated to see the amount of force or stress required to pull the foam off the 304
Stainless Steel substrate in 3 to 6 minutes. ASTM D1623 suggests using a rate of pull of
.05 in/min for each inch of test section gauge length. The 304 stainless steel coupons will
be 2 inches by 2 inches by .125 inch thickness so each PU foams’ dimensions will be 2
inch by 2 inch by 2 inch, making the rate of pull 1 in/min per the standard.
3.3.2.2 Adhesion Interface Evaluation
After completion of tensile adhesion testing, SEM will be used on the same 1 in.
tall pipe samples to evaluate the adhesion interface of each of the 6 COTS PU foams to
help further down-select the best suitable candidates. Each PU foam cures at different rates,
which may influence how well each adheres to the pipe wall. Blowing agent eruptions,
entrapped air, and pipe frictions are other factors can influence adhesion [89].
3.3.2.3 Shear Adhesion Testing
Shear adhesion testing will be done to compare the adhesion loads required to
compress the 2 best permanent foaming fixative off an operational volume, which is a 304-
stainless steel pipe. If the permanent foaming fixative leaves material in the internal walls

28
of the pipe, it will be concluded that the shear strength will be less the adhesive strength.
The opposite can be said if the permanent foaming fixative does not leave any material
then the shear strength will be greater than the adhesion strength. The pipe samples will be
4 in. in internal diameter and 4 in. in length. Two samples will be made in total for
preliminary testing. Testing will also be done on different internal roughness pipe samples
to confirm that the primary adhesion mechanism is mechanical interlocking for PU foams.
The two best foaming candidates of the tensile adhesion testing will be the foams used for
experimentation.
Figure 18 shows a cross-sectional view of how the permanent foaming fixative will
be compressed out of the 304 stainless steel pipe and the dimensions of all components
involved. An MTS 43 Criterion tensile tester will be used with compression plates.
Component 1 of Figure 18 will have a diameter of 3.5 in. and a height of 6 in. Component
2 will have a height of 4 in., an inner diameter (ID) of 4 in, and an outer diameter of 4.5 in.
Component 3 will have a height of 6 in., an inner diameter of 4.25 in, an outer diameter of
5.5 in., and a counter bore diameter of 4.5 in. with a depth of 1.5 in. All components will
be made from 304 stainless steel.

29
Figure 18: Shear adhesion experimental design
Once determining the default adhesion loads required to compress the PFF is
completed, conducting physical stressors on pipes will be done to evaluate effect on
adhesion. Testing protocols will comply with Normal Conditions of Transport [72] and
Hypothetical accident conditions described in the United States Nuclear Regulatory
Commission (NRC). These seismic stressors will involve drop test, water submersion and
extreme heat conditions [90]. Drop testing will be performed at heights of 4, 8, and 12 ft.
Water submersion will be accomplished at a water depth of 3 ft. and submerged for 8, 12,
and 24 hrs. Extreme heat conditions will be evaluated by placing the samples in a muffle
furnace at a temperature of 1475 ⁰F for 30 minutes.

30
CHAPTER IV – RESULTS
4.1 Objective 1 – Effects of Filler on Mechanical Performance
The objective is to compare the mechanical limits of the 6 COTS PU foams to
determine the effects of fillers. Four of the foams were non-intumescent and did not contain
the fillers and EG the two intumescent foams had. One of the intumescent foams was rigid
while the other was flexible. The goal was to show intumescent rigid foams will have the
best mechanical limits due to the consistent cell sizes the EG loading induced.
4.1.1 Sample Fabrication
The following sections displays the sample fabrication for the tensile and
compression testing. The SEM samples’ fabrication process was also documented.
4.1.1.1 Tensile Testing Sample Fabrication
Table 1 shows how much of each component was used to develop the tensile testing
samples. The intumescent foams were not included because there is no fixed amount to
apply them due to their rapid hardening and dispersing. Overcompensation of amounts of
components were used to ensure quality performance.
Table 1: Tensile testing mixing components ratios
Tensile Testing
Foam
Identifier
Volume
(mL)
A
(mL)
B
(mL)
Ratio
(A:B)
F1 50 10 10 1
R1 86 16 8 2
F2 50 12 24 0.5

31
F3 50 11.5 13.5 0.85
A mold was 3D printed for the rigid polyurethane foams with dimensions that
comply with the Type B tensile dye of ASTM D1623 Tensile and Tensile Adhesion
Properties of Rigid Cellular Plastics [87]. The mold was taped around all its edges and
placed on wax paper to ensure the sample can be removed (Figure 19). Using the I-R2 foam
dispenser gun, foam was poured inside the mold and the I-R2 foam cured and expanded
within a minute. Once the foam started to expand, a 12-inch by 12-inch 304 stainless steel
coupon was placed on top of the mold sandwiching the foam inside the mold. After 5
minutes passed, the large 304 stainless steel coupon was taken off and a saw was used to
trim any excess foam from the top surface (Figure 19a-c). The foam was then extracted
from the mold to produce the tensile testing sample.
Figure 19: (a) Rigid 3D mold; (b) I-R2 cured in mold; (c) I-R2 excess shaven off
A total of five samples were produced. Two of the samples created will be used as
test dummy samples due to imperfections and impurities. The other rigid foam
documentation (R1) are shown in the Appendix. The same process was applied for the
flexible foams using the amounts of both Part A and B prescribed in Table 1. The 3D mold
used is shown in Figure 20a and complies with ASTM 3574 Flexible Cellular Materials –

32
Slab, Bonded, and Molded Urethane Foams Test E dimensions [86]. Figure 20b and 20c
also shows the process of curing and extraction from the mold.
Figure 20: (a) Flexible 3D mold; (b) foam cured in mold; (c) foam extracted
A total of five samples were produced for F3. All of the other flexible foam
documentation are shown in the Appendix. Figure 21 shows all the tensile testing foam
samples of the 6 COTS PU foams.
Figure 21: F1, F2, F3, I-F4, R1, and I-R2
4.1.1.2 Compression Testing Sample Fabrication
Table 2 shows how much of each component was used to develop the compression
samples. The intumescent foams are not included because there is no fixed amount to apply
them due to rapid hardening. Overcompensation of amounts of components were used to
ensure quality performance.

33
Table 2: Amounts to produced required sample
Foam
Identifier
Compression (Cylinder) Compression (Rectangular)
Volume
(mL)
A
(mL)
B
(mL)
Ratio
(A:B)
Volume
(mL)
A
(mL)
B
(mL)
Ratio
(A:B)
F1 102 7 7 1 65 5 5 1
R1 102 10 5 2 65 6 3 2
F2 102 12 24 0.5 65 9 18 0.5
F3 102 23.5 27.5 0.85 65 15 17.5 0.86
Two molds (Figure 22) were used with the dimensions of each cavity in each mold
complying with standards ASTM 3574-C (flexible) and ASTM D1621 Compressive
Properties of Rigid Cellular Plastics (rigid) [88]. The area of each specimen were 3.87 in2
with a height of .78 inches. Both rectangular and circular specimens will be considered to
evaluate if geometry can influence the results.
Figure 22: Compression molds
The same process was used for the intumescent foams, and any excess foam was
shaved off. The other foams used the amounts in Table 2 and were mixed, poured, and
allowed to cure overnight. Figure 23 shows all the foam samples in both rectangular and
cylindrical form.

34
Figure 23: Cylindrical and rectangular samples of foams
Compression testing was also performed on the cubic samples after they were used
for tensile adhesion testing. Figure 24 showcases the rigid foam samples (R1 and I-R2).
Figure 24: Cubic samples: R1 (left) and I-R2 (right)
4.1.1.3 SEM Sample Fabrication
Each PU foam was encapsulated in a 1-inch tall 304 stainless steel pipe with an
inner diameter of 0.5 inches and outer diameter of 0.66 inches. The samples were gold
coated to allow for the electrons to interact with the polymers. Figure 25 shows the 6 PU
foam samples encapsulated. Different magnification factors will be used ranging 25-100x
to obtain a realistic view on the cell sizes.
Figure 25: SEM samples: F1, R1, F2, F3, R1, I-F4 and I-R2

35
4.1.2 Objective 1 Results
The section highlights the results and findings of all testing related to Objective 1.
4.1.2.1 Tensile Testing Results
Figure 26 shows the process of tensile testing for a flexible foam. Flexible foams
would typically elongate until sudden rupture occurred. No sign of permanent deformation
occurred. Rigid foams displayed the opposite behavior as they did not stretch and exhibited
minor permanent deformation before failure occurred. This is due to the higher crosslinking
that allowed for the atoms to be permanently locked near each other [33]. The flexible
foams had an average gauge length of 1.37 in. and cross-sectional area of 0.1 in2. The rigid
foams had to be shaved down because they were too thick for the grips of the machine, and
had an average gauge length of 1 in. and cross-sectional area of 0.35 in2.
Figure 26: (a) Flexible foam flexing; (b) rupturing during tensile testing
Figure 27 displays the produced stress-strain curves, and shows the flexible foams
stretched to approximately triple their length. The flexible foams behaved in an elastic-
brittle fashion due to brittle fracture occurring at the end of the linear elasticity region [36].
The rigid foams had negligible strain and experienced the highest stresses and loadings,
which can be desirable in an operational environment. The rigid foams behaved liked
elastic-plastic materials since elastic yielding initially occurred then was followed by rapid

36
stress increase due to cell wall re-alignment [91]. Most of the rigid foams failed once
reaching the elastic limit portion of the stress-strain curve. The elastic moduli for I-R2 and
R-1 foam were computed to be 5.34 ksi and 3.09 ksi, respectively.
Figure 27: Tensile testing graphs
Both ASTM E3574 and D1623 state that one should calculate the stresses and
loadings that occur at failure as well as the failure strain. The rigid foams, R-1 and IR-2,
had the highest stresses of 73.99 psi and 103.65 psi. The loadings that coincided with these
stresses were 206.6 lbf and 289.42 lbf, respectively. The flexible foams had the highest
strain values with F-1 extending to 215% its original gauge length. Table 3 displays all
findings from this test.
Table 3: Tensile testing results
Foam
Sample Peak Load (lbf)
Peak Stress
(psi)
Strain at
Break (in/in)
F-1 4.84 32.24 2.15
F-2 3.70 24.63 1.67
F-3 9.13 60.85 2.11
IF-4 3.11 20.73 0.23
R-1 73.99 206.60 0.11
IR-2 103.65 289.42 0.12

37
4.1.2.2 Compression Testing Results
Figure 28 illustrates the compression testing for a flexible foam cube.
Figure 28: Flexible foam compression testing
Some of the dimensions for cylindrical and rectangular samples varied slightly and
were calibrated appropriately so all the samples had the same dimensions. The rigid foams,
I-R2 and R1, showed elastomeric behavior [91]. The rigid foams first experienced an initial
elastic regime at low stresses, followed by a nearly plateau-like region where the loading
was nearly constant until densification occurred, in which stresses rapidly increased. In the
initial linear elastic part, the rigid foams were compressed uniformly due to membranes in
the cell walls being deformed and internal fluids building pressure [36]. For the plateau
part, they started to plastically deform as the cell walls were compressed together [14].

38
Figure 29: Compression testing graph (cylindrical)
Table 4 shows the results for all parameters that ASTM 35474-C requires. It only
asked for values at 50% deflection, but 80% deflection values were also obtained. The rigid
foams, R-1 and I-R2, performed better as evident in Table 4 and Figure 29 by achieving
higher loading and stresses than flexible foams. The flexible foams became slightly shorter
while the rigid foams were able to restore some thickness once uncompressed.
Table 4: Compression testing results (cylindrical)
Foam
Sample
50%
Deflection
Stress (psi)
50%
Deflection
Load (lbf)
80%
Deflection
Stress (psi)
80%
Deflection
Load (lbf)
Thickness
Decrease
%
Final
Thickness
(in)
F-1 2.77 10.67 22.59 86.92 -0.15 0.79
F-2 17.00 65.40 637.69 2453.21 0.14 0.79
F-3 13.77 52.98 178.83 687.94 13.86 0.68
IF-4 3.75 14.43 845.83 3253.91 11.63 0.70
R-1 278.53 1071.49 1064.88 4096.61 71.75 0.22
IR-2 360.67 1387.48 1404.37 5402.60 71.76 0.22
Table 5 highlights the results that ASTM D1621 required. As previously stated, the
three stages these rigid foams went through were the linear elastic region, plateau region,
and densification. Anything that happened after the initial linear elastic region resulted in

39
permanent deformation. The modulus computed, which is the measure of stiffness a
material can exhibit before plastic deformation, was greater for the intumescent rigid foam
than the non-intumescent rigid foam.
Table 5: ASTM D1621 results (cylindrical)
Rigid
Foam
10%
Stress
(psi)
10%
Load
(lbf)
Modulus
(psi)
R1 198.12 762.18 2103.95
I-R2 297.25 1143.52 3928.05
Compression testing results for rectangular specimens were similar to the
cylindrical findings. Figure 30 displays the produced stress-strain graph. Based on visual
inspection, I-R2 and R1 foams had the best highest stress-strain curves amongst the other
foam candidates. Besides the initial linear portion, the I-R2 foam had the best results once
again.
Figure 30: Compression testing graph (rectangular)
Table 6 confirms that the I-R2 foam had the best results. It had the highest stresses
at 80% deflection of 1214.59 psi, which equated to 4672.54 lbf. The other rigid foam, R1,

40
was the second best with a stress value of 911.10 psi and 3505.02 lbf at 80% deflection.
The computed compression modulus ASTM D1621 was then calculated for the R1 and I-
R2 foams. The compression moduli for R1 and I-R2 were computed to be 1415.50 psi and
1553.82 psi, respectively. The values varied compared to the values computed in Table 4,
which may show an influence in geometry.
Table 6: Compression testing results (rectangular)
Foam
Sample
50%
Deflection
Stress (psi)
50%
Deflection
Load (lbf)
80%
Deflection
Stress (psi)
80%
Deflection
Load (lbf)
Thickness
Decrease
%
Final
Thickness
(in)
F-1 3.01 11.59 34.95 134.46 1.76 0.77
F-2 17.85 68.67 1063.59 4091.65 0.62 0.78
F-3 17.67 67.98 257.98 992.45 0.34 0.78
IF-4 0.01 0.03 0.12 0.47 15.50 0.67
R-1 266.10 1023.67 911.10 3505.02 71.22 0.23
IR-2 311.41 1197.99 1214.59 4672.54 72.90 0.21
Figure 31 shows the compression results for the cubic samples. The cubic samples
were previously used for the adhesion testing, but none suffered structural degradation. All
the cubic samples were 2 in. thick and had a cross-sectional area of 4 in2 which satisfied
both ASTM 3574-C and ASTM D1621 dimension requirements. The minimum thickness
and cross-sectional areas for ASTM 3574-C are 0.78 in. and 3.87 in2, respectively, while
the minimum thickness and cross-sectional area for ASTM D1621 are 1 in. and 3.87 in2,
respectively. Upon visual inspection on Figure 31, R1 performed better than I-R2 in terms
of stresses and strains.

41
Figure 31: Compression testing results (cubic)
Table 6 shows that the R-1 foam performed better than the I-R2 foam. The I-R2
samples had significant cracking from tensile adhesion testing that could have affected the
results.
Table 7: Compression result values (cubic)
Foam
Sample
50%
Deflection
Stress (psi)
50%
Deflection
Load (lbf)
80%
Deflection
Stress (psi)
80%
Deflection
Load (lbf)
Thickness
Decrease
(%)
Final
Thickness
(in)
F-1 1.32 5.28 32.82 131.30 3.40 1.93
F-2 8.08 32.30 72.08 288.33 1.24 1.97
F-3 16.97 67.87 201.38 805.50 1.29 1.97
IF-4 21.87 87.46 120.51 482.03 32.41 1.35
R-1 373.89 1495.57 2041.56 8166.24 68.42 0.63
IR-2 245.11 980.43 893.71 3574.84 74.75 0.50
Compression testing on cylinder specimens gives more accurate results than cubic
and rectangular specimens since the stress distribution is proportional to its geometry [92].
Shear stress is introduced as the platens compress the specimen’s top surface. A cube and
rectangular specimens’ four unloading surfaces resist volumetric expansion, due to
interference between load transferring mechanisms from the top to bottom surfaces. This

42
effect causes more compressive strength. A factor of 0.8 is normally used to relate
cylindrical and cubic compression strength, but this ratio increases when the aspect ratio
(h/d) of the cylindrical samples is large [93]. An aspect ratio of 1 of a cylinder will be able
to experience higher loadings than a cylinder that has an aspect ratio of 2 [94]. Due to the
cubic samples being larger in height and in area than the rectangular and cylindrical
samples, the data may not be comparable; so, the cylindrical findings will be used.
Downscaling the cubic dimensions to have the same areas and heights as the other
geometric specimens will yield higher stresses due to lesser contact area and larger
interference in the load transferring mechanisms (Figure 32) [95].
Figure 32: Compression testing on different cubic concrete specimens [96]
Overall, there is no criteria on what compression amount will cause the release of
residual contamination, so overcompensation was used by assuming 80% deflection. All
the rigid foams did not reach the 13% thickness due to the machine limit criteria being
reached first (9000 lbf). The flexible foams, however, showed degradation while
preflexing, which could cause the release of residual contamination (Figure 33). The
intumescent flexible foam, I-F4, did not return to its original height after preflexing which
can cause additional concerns.

43
Figure 33: Flexible foam compression testing aftermath
4.1.2.3 Cell Size Evaluation Results
The SEM pipe samples had to be gold coated twice to prevent static charging on
the sample surface. The samples were gold coated using a Pelco SC-7 auto sputter coater.
Figure 34 shows all the foam’s images at 50x magnification and was examined in the center
of the top surface. This area is least likely to be affected by the shear stress the friction of
the pipe wall’s induce [89]. Intumescent foams had the most consistent cell sizes (Figure
34a) [4] while non-intumescent foams did not (Figure 34b-c). The smaller cells would
collapse first under stress, causing failure in non-intumescent rigid foams. Smaller
consistent spherical cell sizes and thicker cell walls are desired for better mechanical
properties [97] which relates to the relative density of the foam [36]. The intumescent cell
size diameter was roughly 0.019 in. while the non-intumescent rigid foam’s was 0.035 in.
The flexible foam’s cell size diameter was approximated to be 0.009 in.
Figure 34: (a) Intumescent foam; (b) rigid foam; (c) flexible foam

44
4.2 Objective 2 - Adhesion Characterization
The objective is to compare the mechanical limits of the 6 COTS PU foams to
determine the effects of fillers. Four of the foams were non-intumescent and did not contain
the fillers and EG the two intumescent foams had. One of the intumescent foams was rigid
while the other was flexible. The goal was to show intumescent rigid foams will have the
best mechanical limits due to the consistent cell sizes the EG loading induced.
4.2.1 Sample Fabrication
The following sections displays the sample fabrication for the tensile adhesion and
shear adhesion testing samples. The SEM samples’ fabrication process was also
documented.
4.2.1.1 Tensile Adhesion Testing Sample Fabrication
Table 8 shows how much of each component was used to develop the adhesion
tensile testing samples. The intumescent foams are not included because there is no fixed
amount to apply due to rapid hardening. Overcompensation of amounts of components
were used to ensure quality performance.
Table 8: Adhesion testing mixing amounts of parts
Adhesion (Tension)
Foam
Identifier
Volume
(mL)
A
(mL)
B
(mL)
Ratio
(A:B)
F1 131 15 15 1
R1 131 20 10 2
F2 131 16 32 0.5

45
F3 131 35 41 0.85
A mold was 3D printed with dimensions that complied with Type C specimens in
ASTM D1623. The inner dimensions of the rectangular mold were 2.25 inches by 2 inches
by 2 inch. The two 304 stainless steel coupons would be placed on the inner walls of the
mold while the foam would be dispersed and cured between them (Figure 35). The same
process for the tensile testing die was applied as the mold was placed on top of wax paper
and a larger 304 stainless steel coupon was used to prevent the foam from pouring out of
the mold for the intumescent foams. The other non-intumescent foams used the required
amounts as highlighted in Table 8. Once the foams cured and hardened inside the mold, it
was extracted from the mold.
Figure 35: (a) Foam curing in 3D mold; (b) foam excess outside of mold; (c) foam extracted from
mold
A total of three samples were produced of each type of PU foam. For the tensile
testing machine to grip the adhesion sample, some sort of attachment had to be applied for
the machine to grip. Hinges were selected as the sample-machine interface, and to ensure
the shear strength of the glue used to attach the hinges to the samples was greater than the
tensile strength, the outer surfaces of the coupons were sanded thoroughly with 120 grit
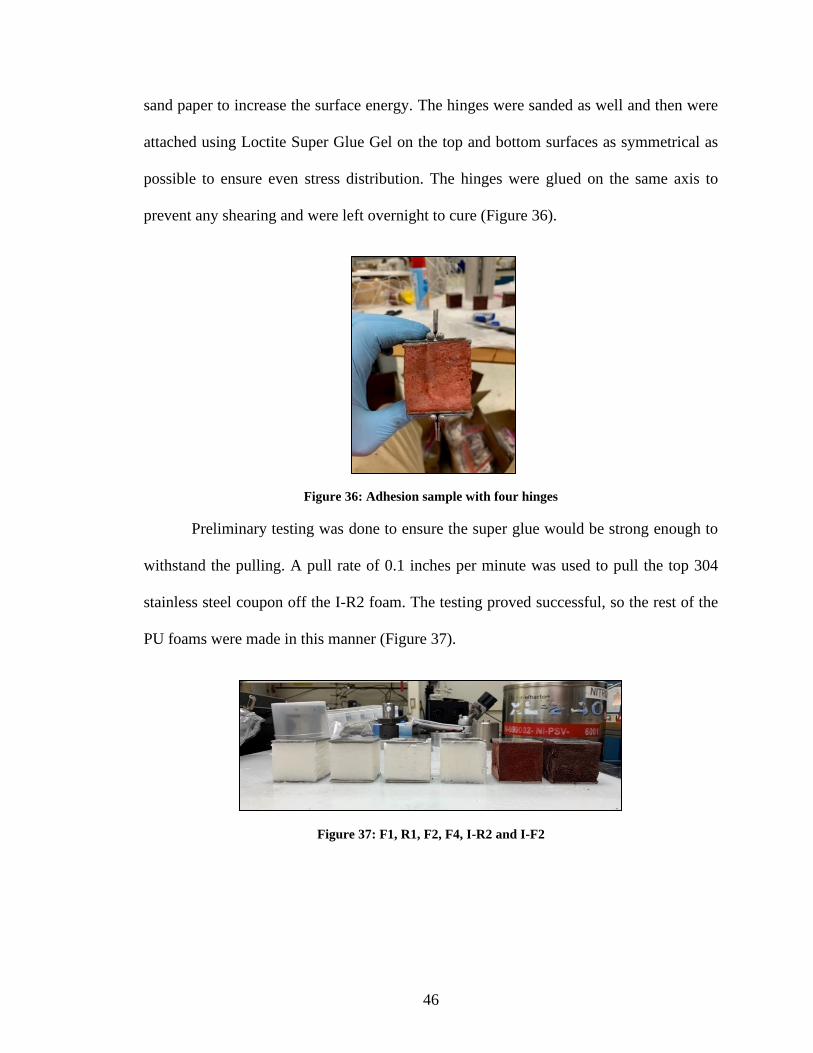
46
sand paper to increase the surface energy. The hinges were sanded as well and then were
attached using Loctite Super Glue Gel on the top and bottom surfaces as symmetrical as
possible to ensure even stress distribution. The hinges were glued on the same axis to
prevent any shearing and were left overnight to cure (Figure 36).
Figure 36: Adhesion sample with four hinges
Preliminary testing was done to ensure the super glue would be strong enough to
withstand the pulling. A pull rate of 0.1 inches per minute was used to pull the top 304
stainless steel coupon off the I-R2 foam. The testing proved successful, so the rest of the
PU foams were made in this manner (Figure 37).
Figure 37: F1, R1, F2, F4, I-R2 and I-F2

47
4.2.1.2 SEM Sample Fabrication
The same samples produced in section 4.1.1.3 were used to evaluate the adhesion
interface.
4.2.1.3 Shear Adhesion Testing Sample Fabrication
Volumes of 50 and 100 in3 were tested to determine the effects on adhesion. Testing
was also be done on both internal smooth and rough pipe to determine the impact of
mechanical interlocking. Figure 38 shows the R1 and I-R2 foam encapsulated in both 50
and 100 in3 volumes.
Figure 38: (a) Different volumes of pipe encapsulated with R1 and I-R2 foam; (b) rough and smooth
internal piping
4.2.2 Objective 2 Results
4.2.2.1 Tensile Adhesion Testing Results
Figure 39 illustrates the process of adhesion testing for a flexible foam. Flexible
foams also stretched the most compared to rigid foams before the stainless-steel coupon
delaminated.

48
Figure 39: Flexible foam tensile testing process
Figure 40 illustrates the results of adhesion testing. The noisy data for the flexible
foams is due to using a load cell that can go up to 8992 lbf. The rigid foams experienced
higher stresses (13.3 psi) before failure while the flexible foams experienced higher strains
(25.4%) before failure.
Figure 40: Tensile adhesion graph
Table 9 shows the results from this testing that ASTM D1623 requires. The results
confirmed that the rigid polyurethane foams would be more suited to be used as permanent
foaming fixatives due to their higher isocyanate content [56]. This allows for them to reach
higher stresses before delamination occurs which can cause the release of residual
contamination in an operational scenario.

49
Table 9: Tensile adhesion testing results
Foam
Name
Peak Stress
(psi)
Peak load
(lbf)
Strain at Break
(in/in)
F1 2.82 11.29 0.254
F2 2.26 9.05 0.142
F3 4.17 16.67 0.092
I-F4 0.38 1.54 0.091
R1 13.30 53.18 0.005
I-R2 5.89 23.57 0.003
ImageJ was used on images of the scanned surfaces of the stainless-steel coupons
that were pulled off (Figure 41). Analysis of the surfaces helped show how much foam still
adhered onto the coupon. For samples that had significant residue, the failure was due to
shearing of the material rather than delamination as the failure mode.
Figure 41: Scanned coupons: F1, R2, F2, F3, I-R2 and I-F4
Table 10 shows the ImageJ results and illustrates that the intumescent foam, I-F4,
adhered the most to the surface (61.45%). This is another advantage intumescent
technology has over non-intumescent technology. R1 had better results than I-R2 due to
slower curing times (20 min. compared to 1 min). I-R2 has catalysts and surfactants like
polyamide amine, which multiplied the polymer chains over a short period time. Upon
further inspection of Figure 41, the stainless-steel plates were smooth and had no
roughness. An adhesion study on intumescent coatings on steel substrate showed that the
primary adhesion mechanism of intumescent technology is mechanical interlocking instead
of wetting [64]. This can further explain why the R1 performed better than I-R2 in this test.

50
Table 10: ImageJ results
4.2.2.2 Adhesion Interface Evaluation
Intumescent rigid foam left voids at the interface in the SEM pipe samples due to
faster curing (1 min) which is due to curing agents like polyamide amine. Most cells in the
I-R2 sample did not collapse to shear stress around the interface. This was due to its
stronger mechanical properties that the consistent cell sizes induced [97]. Non-intumescent
rigid foam adhered well to the substrate due to slower curing times. The cells around the
walls collapsed due to either shearing, blowing agents eruptions or entrapped air [89].
Flexible foams had the worst adhesion. Flexible foams left the largest voids due to the
formation of carbon dioxide and urea which caused it to cure and expand quickly (2 min)
[23]. The lesser crosslinking also made the flexible foams more vulnerable to shear stress,
blowing agent eruptions and entrapped air [56].
Figure 42: (a) Intumescent foam; (b) rigid non-intumescent foam; (c) non-intumescent flexible foam
Foam Average (%)
F-1 4.05 0.16
F-2 0.00 0.00
F-3 0.26 0.01
IF-4 61.45 2.46
R-1 7.38 0.3
I-R2 2.84 0.11
Average ( )

51
4.2.2.3 Shear Adhesion Testing Results
Figure 43 shows the experimental design Figure 28 proposed. The machine shop at
SRNL machined the components to the dimensions prescribed in Figure 18. A rate of 0.4
inches per minute was used since this is 10% of the pipe’s height. This procedure is not
standardized, but followed some protocols described in ASTM D1621. The I-R2 and R1
foams were the foam of choice due to both displaying promising mechanical and adhesion
performances.
Figure 43: Shear adhesion testing
Figure 44 showcases the breaking loads of the I-R2 foam in the 4-inch diameter, 4-
inch-tall stainless-steel pipes (50.24 in3). The data spread from 85 lbf. to almost 4000 lbf.
Samples 7 and 10 were the samples that had smooth internal roughness that SNRL
machined, which explains that the primary adhesion mechanism of the I-R2 is mechanical
interlocking.

52
Figure 44: September adhesion testing on I-R2 foams
Figure 45 shows the pipe samples after shear adhesion testing. Samples 2, 3, and 4
left no foam material on the substrate and suffered adhesive failure [83]. The other samples
suffered cohesive failure in which the adhesive strength was greater than the shear strength.
The foam behaved as if it was in compression when this occurred. Samples 14, 5, and 11
also left minimal material on the wall but experienced larger loadings compared to samples
2, 3, and 4.
Figure 45: Aftermath of adhesion testing
Due to wide scatter of loads as shown in Figure 44, duplicate testing was performed
to obtain better data. Samples 4, 2, and 3 were observed to be compressed from the bottom

53
of the pipe, which could be why adhesive failure occurred. PU foams are anisotropic
materials, which means the cells elongate parallel to the direction of rise [45]. This means
that the top surface may have better mechanical properties than the bottom due to the higher
densities and consistent cell sizes the elongation of cells causes[45] . Figure 46 shows how
the roughness was normalized by grinding a default 80 grit sander on the internal surface
of each pipe. A 40 grit was also used to roughen it up as well as a 120 grit to smoothen it.
Figure 46: (a) P40 grit inside pipe; (b) roughing up pipe; (c) using a level to ensure balance
A forward-looking infrared radar (FLIR) thermal imaging camera was used to
detect the maximum curing temperatures. Heat is one external stimuli that can affect the
adhesion of adhesives [51]. All the samples curing temperatures were monitored in hopes
of finding a correlation between adhesion and curing temperature. Figure 47 shows a FLIR
image that was taken. The red colors highlights the hottest temperatures while the blue
represents the coldest.

54
Figure 47: A: Foam before curing; B: foam after curing
Figure 48 displays the new breaking loads conducted with all samples being
compressed from the top. The data looks more precise compared to Figure 44. The rough
(P40) and smooth (P120) samples performed the best with breaking loads of almost 3500
lbfs. The smooth grit (P120) left rough marks internally, which explain why the I-R2 foam
performed better in this case. The average breaking loading came out to be 2994.66 ±
135.64 lbf.
Figure 48: November testing on I-R2 Foam
Table 11 shows the peak loading and max curing temperatures. No correlation
could be made with this information. The thought process was that the curing temperatures

55
would affect the hardening process since heat is an external stimuli that can affect adhesion
[61]. This could have potentially affected the mechanical interlocking process, but no
relationship was able to be determined from these findings.
Table 11: Peak loads and temperatures (November testing)
An outlier test using Tukey fencing was then done to determine any outliers in the
data in both Figures 44 and 48. Samples 7 and 10 were eliminated due to being smoothly
made from SRNL. The outlier test then was able to eliminate samples 2, 3, and 4 since they
fell outside the lower limit. Figure 49 shows the new calculated average after the November
testing with the outlier compared to the September testing. The results were computed by
dividing the average loadings by the internal surface area (inner circumference time’s
height). The average loading for the September testing was 2239.90 ± 1276.73 lbf and the
average for the November + outlier testing was 3024.75 ± 469.39 lbf. The internal surface
and volume were computed to be 50.28 in2 and 50.27 in3, respectively, for the 4-inch inner
diameter and 4 inch tall stainless steel pipes. The percent number above each bar represents
the relative error (standard deviation divided by the average). The fabrication technique
provided promising results as the relative error went from 57.7% to 15.5%.
Once the average for the I-R2 sample was determined, shear adhesion was done on
the non-intumescent R2 foam. Figure 49 also shows the stresses of both foams. The R1
foam experienced a lesser average breaking load of 2239.90 ± 1276.73 lbfs compared to
the 3024.75 ± 469.39 lbf loading the I-R2 experienced. All the R1 foams experienced
adhesive failure and did not leave material on the inner pipe’s surface. This demonstrates

56
that the I-R2’s primary adhesion mechanism is mechanical interlocking and will be more
suited to be used in an operational environment where internal contamination would be
high.
Figure 49: Comparison of adhesion testing
Due to the sample set of I-R2 having a large standard deviation, the shear adhesion
testing was downscaled to accommodate stainless steel pipes having an inner diameter of
2 inches. A bucket piece was 3D printed and is showcased in Figure 50. The samples tested
had the same aspect ratio of 1 in order to be consistent with previous shear adhesion testing.
The samples had an inner diameter 2 inches with a height of 2 inches. The same sample
fabrication was done as with the bigger samples.

57
Figure 50: (a) 3D bucket piece, (b) sample inside of bucket piece
Figure 51 highlights the findings of the 2-inch samples. The data appears to be consistent
as the majority of the samples appeared to be in 1300 lbf. range. The average loading was 1302 ±
9.32 lbf. The sample that took 331.47 lbf to fail was compressed from the bottom while the rest
were compressed from the top. It also experienced adhesive failure while the other samples failed
in a cohesive manner [83].
Figure 51: Shear adhesion results of 2-inch samples
The average breaking load for the 4-inch-tall 4-inch inner diameter samples was
3024.75 ± 469.39 lbf while the average breaking load for the 2-inch-tall 2-inch diameter

58
sample set was 1302 ± 9.32 lbf. It is almost a 1:2 ratio due to the diameters being multiples
of each other. This demonstrates that shear adhesion potentially can be a function of cross-
sectional area if the aspect ratios are the same. The 2-inch sample had a smaller standard
deviation compared to the 4-inch set due to more pressure from the foam being exerted on
the walls since the cross-sectional area was smaller. The I-R2 foam expands and cures
faster due to catalysts and surfactants like polyamine amide, allowing it to have more
intimate and uniform contact with the smaller sample set [61]. Figure 52 shows the
comparison between the two sample sets. The smaller sample set’s stress was computed by
dividing the average breaking load by the internal surface area of 12.56 in2. The samples
are labeled by their respective internal volumes with 6.28 in3 representing the 2-inch tall
and 2-inch diameter samples and 50.27 in3 being the 4-inch tall and4-inch diameter
samples.
Figure 52: Comparison of both volumes

59
4.2.2.3.1 Effects of Volume
Adhesion testing was done on pipes that were double the length of the previous test
samples in order to determine a relationship of volume and breaking loads. The 8-inch-tall
4-inch diameter samples’ volume was computed to be 100.54 in3 and surface area was
100.56 in2. The average failure loading for the 8-inch-tall 4-inch diameter samples were
5305.53 ± 421.27 lbf compared to the 3024.75 ± 469.39 lbf. for the 4-inch-tall 4-inch
diameter samples. The 4-inch-tall 2-inch diameter samples’ volume was computed to be
12.56 in3 and surface area was 25.13 in2. The average loading for the 4-inch-tall 2-inch
diameter samples were 1406.79 ± 281.32 lbf compared to the 1302.24 ± 9.32 lbf. for the
2-inch-tall 2-inch diameter samples. The computed stresses of the four volumes are shown
in Figure 53. Three of the volumes’ stresses were similar and average 56.25 psi. The 2-
inch tall 2-inch diameter pipe had the smallest volume and largest stress of 103.68 psi. This
high stress can be due to compressive stress occurring towards the center of the foam during
the curing process since the curing space is smaller compared to the other volumes.
Figure 53: Comparison of both 4-inch diameter volumes

60
All the four volumes equated to four different surface areas. Adhesion is ultimately
a function of inner surface area of the pipe, since this is where all the shear stresses are
located. One foam cartridge of I-R2 yields 100 in3 of foam material. Dispensing this
amount in a 4-inch inner diameter pipe will fill up to 8 inches of height while filling a 2
inch diameter pipe will fill up 31 inches worth. The surface area for the 4-inch inner
diameter pipe is 100 in2 while the 2-inch pipe creates 200 in2. Different volumes will yield
different surface areas. Plotting the surface areas of all the volumes tested and the breaking
loads yielded Figure 54. The graph appears nearly linear and a linear trend line was made
to develop a relationship of surface area and breaking loads. This can be helpful in
predicting failures in PFFs. The slope of the linear trend line is 50.79 psi, which represents
the minimum stress the PFF shall withstand.
Figure 54: Surface area vs. loading graph
4.2.2.3.2 Effects of Physical Stressors
Evaluating the effects of physical stressors on adhesion was lastly executed. Figure
56 highlights the process of executing the three events that SBIO documents postulate [5].

61
Figure 55a shows the water submersion testing that was done at a depth of 3 ft. at 8, 12 and
24 hours. Figure 55b shows how the samples were dropped at heights of 4, 8, and 12 ft.
onto a steel plate. Figure 55c demonstrates the foam being place in a muffle furnace at
1400 °F.
Figure 55: (a) Water submersion; (b) drop Test; (c) muffle furnace
The findings are displayed in Figure 56. The water submersion samples’ stresses
ranged from 91.10 to 106.3 psi. This was computed by dividing the breaking loads by the
surface areas. The samples that had longer exposure to water failed worse and one of the
samples of the 24-hr. collection had water inside of it. These foams are closed celled foams
so they should block the transport of water but water still permeated the sample [37]. The
fire testing proved to be the worst due to the I-R2 completely intumescing and delaminating
off the substrate. The muffle furnace’s temperature did not reach 1400 °F because of safety
reasons but instead achieved 1000 ° F for 30 minutes. This presents an issue if a fire ever
occurs for a long period and in this test, smoke was observed to be coming out of the muffle
furnace. This smoke can be another hazard due to contamination being transported by the
smoke. The drop test values ranged from 79.60 to 112.96 psi. A few of the sample sets
experienced adhesive failure for the 8 and 12 ft. drop. The collision impact may have
negatively affected the adhesion interface. A few other samples were compressed from the

62
bottom and none of them failed in an adhesive manner. The sample failed at 102.03 psi
compared to the default value of 103.68 psi. This implies that adhesive failure could
potentially occur if compressed from the bottom.
Figure 56: Physical stressors findings

63
CHAPTER V – CONCLUSION
In conclusion, both hypotheses were proven over the course of this thesis. The
intumescent foam, I-R2, had the best mechanical properties and limits compared to the
other non-intumescent foams. SEM imaging confirmed this by showing that the I-R2 foam
had the most consistent spherical cell sizes (0.019 in). This feature relates to the
macroscopic properties since the relative density dictates mechanical performance and is a
function of cell size. The rigid foams had the best adhesion properties compared to the
flexible foams due to its higher crosslinking and isocyanate content. SEM images also
confirmed that the rigid foams had the best adhesion interface compared to the flexible
foams with lesser voids and cell collapse caused by shearing from the pipe walls. The I-R2
foam adhesion mechanism was proven to be mechanical interlocking and outperformed the
R1 foam during adhesion testing in operational volumes. The I-R2 foam also experienced
adhesive failure more often than the R1 foam which is an advantage in an operational
environment. The I-R2’s shear adhesion testing findings showed to a near-fit linear
relationship with surface area and did not show a dependency with amount of volume.
These findings will allow for future recommendations for future balloting of ASTM
E3191: Standard Specification for Permanent Foaming Fixatives Used to Mitigate Spread
of Radioactive Contamination. Intumescent technology will have additional benefits that
aid in D&D efforts that non-intumescent technologies do not offer. For Section 5.1 of
ASTM E3191, which describes sufficient mechanical properties PFFs shall have, the I-R2
foam had a compressive strength of 2.00 kpsi (83% deflection) and a tensile strength of
289 psi. Concrete and grout, which are materials that are used in D&D activities, have
average compressive strengths of 3.25 kpsi and 2.00 kpsi, respectively. Some concretes

64
have tensile strengths that are as low as 300 psi [98]. Concrete, however, is brittle unlike
I-R2 and will be challenging to apply in pipes. Using a PFF that has similar or better
properties to materials already being used in the workforce will ensure quality performance
and workers’ trust. The PFF shall also have consistent spherical cell sizes to optimum
mechanical performance (ex: 0.019 in). For Section 5.4 of ASTM E3191, which details
mechanical properties to withstand physical or seismic activity, the I-R2 exhibited high
stresses and loading before failure occurred. On average, the I-R2 had an averaged 68.14
psi amongst the four volumes tested. The average stresses the I-R2 experienced from the
physical stressor testing was 83.09 psi compared to the baselined value of 103.68 psi. This
is a 19.8% decrease in performance when subjected to stressors. The recommendation is to
have a foam that can either withstand 50 psi or more (Figures 53 and 54), in addition to
being closed celled to prevent fluid transport. These findings will be subjected to the sites’
discretion. Due to all the types of adhesion failure that occurred, the I-R2 is best suited to
be used as a mechanical plug. ASTM C1892: Nominal Joint Strength of End-Plug Joints
in Advanced Ceramic Tubes at Ambient and Elevated Temperatures states the adhesion
testing done was testing the push out force and nominal joint strength when failure
happened [99].
Future work will need to be done to ensure quality performance in PFFs. Applying
additional seismic activity like an earthquake activity can ensure this technology can
withstand multiple seismic events. Due to the I-R2 underperforming during the muffle
furnace test, additional measures must be taken. Either combining an insulated material
like concrete or configuring the expandable graphite content can help ensure adhesion
performance in extreme heat conditions. The smaller volumes had a tighter data spread

65
than the larger volumes due to more internal pressure being exerted on the inner walls. This
can be a means of improving the pressure-carrying capabilities and failure mechanisms by
confining the foam, so it can build compressive stress as in the case of the 2-inch-tall 2-
inch diameter sample set (6.28 in3) in Figure 53. Aging and radioactive material exposure
studies should be considered to determine effects on adhesion and immobilization
capabilities. All these findings and considerations are promising and can push forward the
implementation of this technology in the future.

66
REFERENCES
1. Cary, A. Plutonium-contaminated Hanford 'canyon' is deteriorating. Environment
is at risk. study says. 2019; Available from: https://www.tri-
cityherald.com/news/local/hanford/article232328877.html.
2. Falconer, F.L., Idaho National Engineering Laboratory (INEL) Environmental
Restoration (ER) Program Baseline Safety Analysis File. 1995.
3. Abitz, R., Duncan, A., Kane, M., Dewberry, R., and Santos, J., Planning for the
Decontamination of the Plutonium Fuel (PuFF) Facility Savannah River Site
(SRS), South Carolina. 2010.
4. Renovations Extend Life of Savannah River National Laboratory Facility. 2017;
Available from: https://www.energy.gov/em/articles/renovations-extend-life-
savannah-river-national-laboratory-facility.
5. Foppe, L.T., Comparison of Risk-Dominant Scenario Assumptions for Several
TRU Waste Facilities in the DOE Complex. 1999. p. 6-7.
6. Backgrounder on Decommissioning Nuclear Power Plants. 2018.
7. Administration, O.S.a.H. Decontamination. 1985.
8. Demmer, R., Fox, D., Reese, S., and Banford, A., Fixatives Used for
Decommissioning and Maintenance of Radiological Facilities. 2017. p. 1-3.
9. Vartbedian, R., Must Reads: Hidden danger: Radioactive dust is found in
communities around nuclear weapons sites. 2018, Los Angeles Times.
10. Vertabedian, R., Nation's most ambitious project to clean up nuclear weapons
waste has stalled at Hanford. 2019, Los Angeles Times.
11. Vartabedian, R. Nuclear accident in New Mexico ranks among the costliest in
U.S. history. 2016 [cited 2019; Available from:
https://www.latimes.com/nation/la-na-new-mexico-nuclear-dump-20160819-
snap-story.html.
12. ASTM E3191-18: Standard Specification for Permanent Foaming Fixatives Used
to Mitigate Spread of Radioactive Contamination. p. 1-2.
13. Ionescu, M., Chemistry and Technology of Polyols for Polyurethanes. 2005,
Rapra Technology Limited: Shawbury, UK.

67
14. Zia, K.M., Anjum, S., Zuber, M., Mujahid, M., and Jamil, T., Synthesis and
molecular characterization of chitosan based polyurethane elastomers sing
aromatic diisocyanate. 2014, Int. J. Biol. Macromol. p. 26-32, 66.
15. Akindoyo, O.J., et al., Polyurethane types, synthesis and appications- a review.
2016. p. 2-3, 5-7.
16. Taheri, N. and S. Sayyahi, Effect of clay loading on the structural and mechanical
properties of organoclay/HDI- based thermoplastic polyurethane
nanocomposites. 2016, e-Polym. p. 65-73.
17. Rafiee, Z. and V. Keshavarz, Synthesis and characterization of
polyurethane/microcrystalline cellulose bionanocomposites. 2015, Prog. Org.
Coat. p. 190-193.
18. Zia, K.M., H.N. Bhatti, and I.A. Bhatti, Methods for polyurethane and
polyurethane composites, recycling and recovery: A review. 2007, React. Funct.
Polym. p. 675-692.
19. Chattopadhay, D. and K. Raju, Structural engineering of polyurethane coatings
for high performance applicatons. 2007, Prog. Polym. Sci. p. 352-418.
20. Szycher, M., Handbook of polyurethanes. 1999, CRC Press: Boca Raton, Fl.
21. Silvertsen, K., Polymer foams. 2007. p. 1-10.
22. Anisur, M.R., Kibria, M., Mahfuz, M., Saidur, R., and Metselaar, I., Energy
Sustainability Through Green Energy. 2015, Latent Heat Thermal Storage
(LHTS) for Energy Sustainability. p. 76-86.
23. Gama, N., A. Ferrerira, and A. Barros-Timmons, Polyurethane Foams: Past,
Present, and Future. 2018. p. 1-5, 9,11-12.
24. Ashida, K., Polyurethane and Related Foams Chemistry and Technology. 2007,
Taylor & Francis Group: Boca Raton, Fl. USA.
25. Elwell, M., Ryan, A., Grunbauer, H., and Van Leishout, H., Studies of Structure
Development during the Reactive Processing of Model Flexible Foam Systems
Using FT-IR Spectroscopy, Synchroton SAXS, and Rheology. 1996, American
Chemical Society. p. 2960-2968.
26. DeBell, J.M., W.C. Goggin, and W.E. Gloor, German plastic practice. 1946,
DeBell and Richardson: Cambridge, Mass.

68
27. Lee, S.-T. and N.S. Ramesh, Polymeric Foams: Mechanisms and Materials. 2004,
CRC Press: New York, NY, USA.
28. Titow, W.V., PVC Technology. 2001: Shawbury, UK. p. 146.
29. Szycher, M., Szycher's Handbook of Polyurethanes;. 2006: New York, NY.
30. Buist, J.M. and Lowe, A., The Chemistry of Polyurethanes and Their
Applications. 1965, Annals of Work Exposures and Health. p. 143-145.
31. Defonseka, C., Practical Guide to Flexible Polyurethane Foams. 2013, Smithers
Rapra: Shawbury, UK.
32. Krol, P., Linear Polyurethanes: Synthesis Methods, Chemical Structures,
Properties and Applications. 2008, VSP: Leiden, The Netherlands.
33. Javni, I., W. Zhang, and Z.S. Petrovickansaspetrovic, Effect of different
isocyanates on the properties of soy-based polyurethanes. 2003, J. Appl. Sci. p.
2912-2916.
34. Motokucho, S., Nakayama, Y., Morikama, H., and Nakatani, H., Environmental-
friendly chemical recycling of aliphatic polyurethanes by hydrolysis in a
CO2/water system. 2018, J. Appl. Polym. Sci. p. 135.
35. Shufen, L., Zhi, J., Kaijun, Y., Shuqin, Y., and Chow, W., Studies on the thermal
behavior of polyurethanes. 2006, Polym. Plast. Techno. Eng. p. 95-108.
36. Gibson, J.L. and F.M. Ashby, Cellular solids- Structural Properties. 2 ed. 1999.
37. Klempner, D. and V. Sendijarevic, Polymeric foams and Foam Technology. 2004,
Hanser.
38. Throne, J., Thermoplastic Foam Extrusion. 2004, Hanser.
39. de Vries, D.V.W.M., Characterization of polymeric foams. 2009. p. 5.
40. Roberts, A.P. and E.J. Garboczi, Elastic moduli of model random three-
dimensional closed-cell cellular solids. 2001, Acta Mater. p. 49, 189-197.
41. Roberts, A.P. and E.J. Garboczi, Elastic properties of model random three-
dimensional open-cell solids. 2002, J Mech Phys Solids. p. 33-55.
42. Vries, D.V.W.M.d., Characterization of polymeric foams. 2009: Eindhoven
University of Technology. p. 4-9.
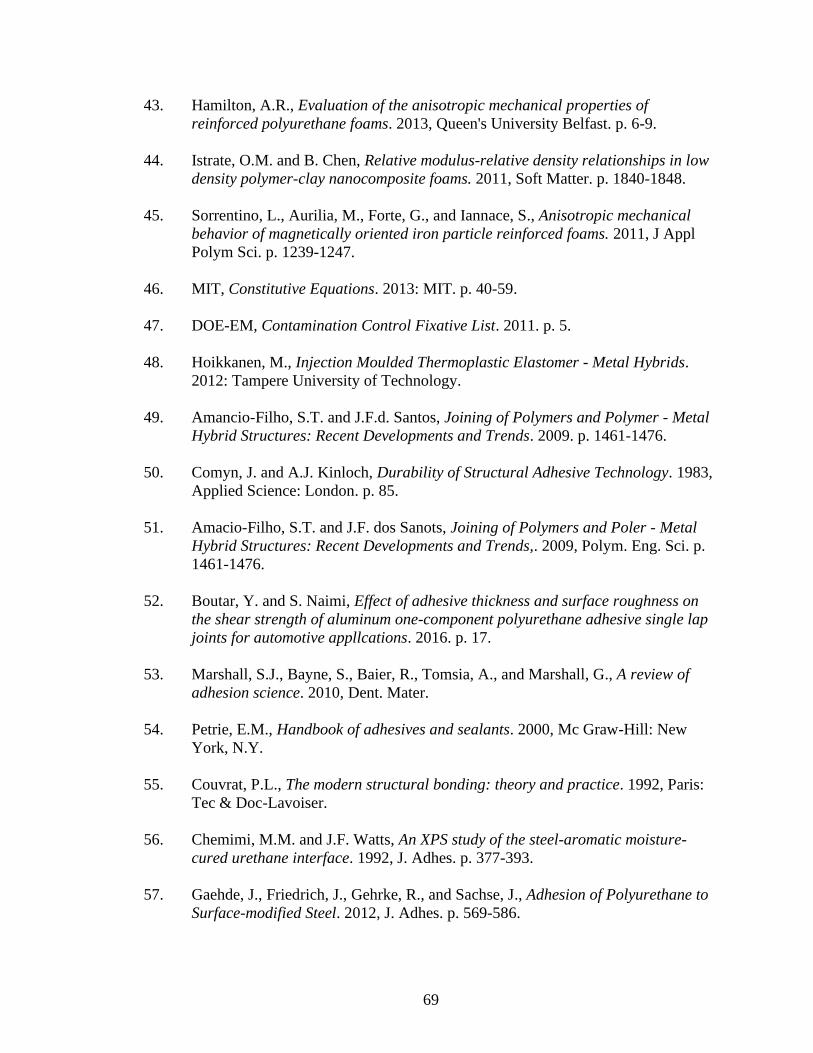
69
43. Hamilton, A.R., Evaluation of the anisotropic mechanical properties of
reinforced polyurethane foams. 2013, Queen's University Belfast. p. 6-9.
44. Istrate, O.M. and B. Chen, Relative modulus-relative density relationships in low
density polymer-clay nanocomposite foams. 2011, Soft Matter. p. 1840-1848.
45. Sorrentino, L., Aurilia, M., Forte, G., and Iannace, S., Anisotropic mechanical
behavior of magnetically oriented iron particle reinforced foams. 2011, J Appl
Polym Sci. p. 1239-1247.
46. MIT, Constitutive Equations. 2013: MIT. p. 40-59.
47. DOE-EM, Contamination Control Fixative List. 2011. p. 5.
48. Hoikkanen, M., Injection Moulded Thermoplastic Elastomer - Metal Hybrids.
2012: Tampere University of Technology.
49. Amancio-Filho, S.T. and J.F.d. Santos, Joining of Polymers and Polymer - Metal
Hybrid Structures: Recent Developments and Trends. 2009. p. 1461-1476.
50. Comyn, J. and A.J. Kinloch, Durability of Structural Adhesive Technology. 1983,
Applied Science: London. p. 85.
51. Amacio-Filho, S.T. and J.F. dos Sanots, Joining of Polymers and Poler - Metal
Hybrid Structures: Recent Developments and Trends,. 2009, Polym. Eng. Sci. p.
1461-1476.
52. Boutar, Y. and S. Naimi, Effect of adhesive thickness and surface roughness on
the shear strength of aluminum one-component polyurethane adhesive single lap
joints for automotive appllcations. 2016. p. 17.
53. Marshall, S.J., Bayne, S., Baier, R., Tomsia, A., and Marshall, G., A review of
adhesion science. 2010, Dent. Mater.
54. Petrie, E.M., Handbook of adhesives and sealants. 2000, Mc Graw-Hill: New
York, N.Y.
55. Couvrat, P.L., The modern structural bonding: theory and practice. 1992, Paris:
Tec & Doc-Lavoiser.
56. Chemimi, M.M. and J.F. Watts, An XPS study of the steel-aromatic moisture-
cured urethane interface. 1992, J. Adhes. p. 377-393.
57. Gaehde, J., Friedrich, J., Gehrke, R., and Sachse, J., Adhesion of Polyurethane to
Surface-modified Steel. 2012, J. Adhes. p. 569-586.

70
58. Baldan, A., Adhesively-bonded joints and repairs in metallic allots, polymers and
composite materials: Adhesives, adhesion theories and surface pretreatment.
2004, J. Mater Sci. p. 1-49.
59. Ramarathnam, G., Joining of Polymers to Metal. 1992, Weld. Res. Suppl. p. 483-
490.
60. Hopmann, C., Wunderle, J., Neus, A., Ochotta, P., Bobzin, K., and Schultz, C.,
Influence of surface treatment on the bond strength of plastics/metal hybrids.
2015, Zeitschrift Kuntstofftechnik.
61. Puentes-Parodi, J., Adhesion of Polyurethane-Steel Hybrids and Influence of
Annealing on its Durability and Lifetime. 2018. p. 1-40.
62. Dillingham, G. and C. Moriarty, The Adhesion of Isocyanate-based Polymers to
Steel. 2003, J. Adhes. p. 269-285.
63. Chattopadhyay, D.K. and D.C. Webster, Thermal stability and flame retardancy
of polyurethanes. 2009, Prog. Polym. Sci. p. 1068-1133.
64. Ullah, S., A study of bonding mechanism of expandable graphine intumescent
catings on steel substrates. 2011. p. 2-3.
65. Wang, J. and Y. Chen, Flame-retardant mechanism resulting from an intumescent
system. 2005: Journal of Fire Sciences. p. 23, 55-74.
66. Mesquita, L.M.R., P.A.G. Piloto, and M.A.P. Vaz, An experimental study of
intumescent fire protection coatings. Polytechnic Institute of Braganca:
Branganca, Portugal. p. 1.
67. Zhang, L., Zhang, M., Zhou, Y., and Hu, L., The study of mechanical behavior
and flame retardancy of castor oil phosphate-based rigid polyurethane foam
containing expanded graphite and triethyl phosphate. 2013: ScienceDirect. 98 p.
2784-2794.
68. Nasir, K. and R. Sulong, An investigation into waterborne intumescent coatings
with different fillers for steel application. 2016. p. 10.
69. Pagni, A., Pour in Place Polyurethane Foam as an impact Mitigation and Flame
Retardant Material Used in Nuclear Material Transportation Containers - The
Mechanism of Intumescence. 2014, General Plastics. p. 1-4.
70. Caplugs LLC.

71
71. FR-3700 Last-A-Foam. General Plastics Manufacturing Company: Tacoma,
Washington.
72. Technology, S.R.P. and S.R.N. Laboratory, Safety Analysis Report for Packaging
Model 9977. 2007. p. 0, 2-i, 2-10, 2-18, 2-28, 2-48-73.
73. Packaging Transportation of Radioactive. 2004, DOE Order 460.1B:
Washington, DC.
74. Traeger, R.K., Physical Properties of Rigid Polyurethane Foams. 1967: Sandia
Laboratory. p. 2-5, 10-12.
75. Lu, W.-Y., Mechanical Characterization of Rigid Polyurethane Foams. 2014,
Sandia National Laboratory: Albuqyeque, New Mexico. p. 11-12, 14, 38, 54, 60,
68.
76. Lu, W.-Y., Korellis, J., Lee, K., and Grishaber, R., Hydrostatic and uniaxial
behavior of a high density polyrurethane foam (FR-3720) at various
temperatures. 1993.
77. Nicholas, L. and G.T. Gmitter, Cellular plastics. 1965. p. 85.
78. Neilsen, K.M., Lu, W.Y., Werner, T., Scherzinger, M., and Lo, S.C., Flexible
Foam Model. 2018, Sandia National Laboratories. p. 10-16, 39.
79. Goods, S.H., Neuschwanger, C.L, Henderson, C., and Skala, D.M., Mechanical
Properties and Energy Absorption Characteristics of a Polyurethane Foam. 1997.
p. 20-25.
80. Timoshenko, S. and D.H. Young, Elements of Strength of Materials. 1962,
Nostrand & Co. Inc: New York, NY.
81. Zaretsky, E., Asaf, Z., Ran, E., and Aizik, F., Impact response of high density
flexible polyurethane foam. 2012, Department of Mechanical University, Ben
Gurion University: Israel. p. 2-6.
82. Dattelbaum, D.M., Robbins, D.L., Gustavsen, R.L., Sheffield, S., and Stahl, D.B.,
Shock compression of polyurethane foams. 2012, Los Alamos National
Laboratory: Los Alamos, NM. p. 1-4.
83. Mahmood, N., Investigations on the Adhesion of Polyurethane Foams on
Thermoplastic Material Systems. 2005. p. 30-31.

72
84. Nicholson, J.C., Peters, B., Wilson, J., and Washington, A.L., Fabrication and
Evaluation of Radiation Hardened Polyurethane Foams for D&D Activities.
2016. p. 10-20.
85. Wiyono, P., P. Suprobo, and H. Kristijanto, Characterization of Physical and
Mechanical Properties of Rigid Polyurethane Foam. 2016, Institut Teknologi
Sepuluh Nopember: Indonesia. p. 1-8.
86. ASTM D3574: Standard Test Methods for Flexible Cellular Materials-Slab,
Bonded, and Molded Urethane Foams. p. 4-5, 7-8.
87. ASTM D1623: Standard Test Method for Tensile and Tensile Properties of Rigid
Cellular Plastics. ASTM. p. 4-7.
88. ASTM D1621: Standard Test Method for Compressive Properties of Rigid
Cellular Plastics. p. 3-5.
89. Schiller, C. and M. Glos, Aesthetics and adhesion behavior of PU foam based
composites with rigid facer materials. p. 1-5.
90. Commission, U.S.N.R., 71.73 Hypothetical accident conditions. 2017.
91. Ridha, M., Mechanical and failure properties of rigid polyurethane foam under
tension. 2007: National University of Singapore. p. 7-9.
92. Day, K.W., Concrete Mix Design, Quality Control and Specification. 2006,
Taylor & Francis e-Library.
93. Azad, M., R. Serwan, and K. Taghreed, Relationship between cube and cylinder
compressive strengths of mortar used for ferrocement. 2015. p. 249-250.
94. Al-Sanhawneh, E.I., Size effect and strength correction factors for normal weight
concrete specimens under uniaxial compression stress. 2013, Contempt. Eng. Sci.
p. 57-68.
95. Celik, A.O., Kiline, K., Tuncan, M., and Tuncan, A., Distributions of compressive
strength obtained from various diameter cores. 2012: ACI Mater J. p. 597-606.
96. Jihad Hamad, A., Size and shape effect of specimen on the compressive strength
of HPLWFC reinforced with glass fibers. 2015. p. 6.
97. Marinzuli, G., R. Surace, and A.D. Ludovico, A preliminary study on adhesion on
steel cylinder filled with aluminum foam. 2013. p. 6.

73
98. Langton, C., Cementitious grout for high level waste tank closure. 2018,
Savannah River National Laboratory.
99. Materials, A.S.f.T.a., C1892: Nominal Joint Strength of End-Plug Joints in
Advanced Ceramic Tubes at Ambient and Elevated Temperatures.