Effect of Painting on the Mechanical Properties of Injection-Molded Plastics

Mechanical properties and compostability of
in jection-moulded biodegradable compositions By
Mara Georgieva Burns
A di ssertation
submitted in partial fulfilment of the requirements
for the degree
Master of Science
Institute of Applied Materials
Department of Chemical Engineering
University of Pretoria
Pretoria
Supervisor: Professor W. W. Focke
September 2007
©© UUnniivveerrssiittyy ooff PPrreettoorriiaa

i
Mechanical properties and compostability of injection-moulded
biodegradable compositions
by
Mara Georgieva Burns
Supervisor: Prof. W. W. Focke
Department of Chemical Engineering for the degree Master of Science
ABSTRACT
The aim of this project was to prepare starch-based thermoplastic compounds for
biodegradable, injection-mouldable seedling tubes and golf tees. Sappi Forest Products
needed partially biodegradable tubes to be able to increase the productivity of their
seedlings.
The golf tee market is currently dominated by the USA, China, India and Europe and
there are only a couple of South African manufacturers, who cannot cope with the
market demand. Biodegradability, brittleness and low cost are what the market is
looking for in the golf tees application. Brittleness is required to prevent damage to golf
clubs. When the material is too hard and non-brittle, it catches under the plate of a
rotary lawn mower and this causes a drag mark on the greens. Daily manual removal of
the pieces is necessary, which is very labour-intensive. Preferred are highly
biodegradable tees that would shatter on contact with lawn mower blades.
During the development of the seedling tubes compositions, it was found that
reasonable mechanical properties in starch compounds could only be obtained with
high-amylose starch. In order to further improve the material properties, blends with
synthetic polymers were investigated. In this work thermoplastic starch as the main
ingredient was blended with two different grades of polyamides – Euremelt 2138, EMS

ii
Grilon BM13 SBG and also with polyvinyl butyrate (PVB) via extrusion. The addition of
polymers was 20 wt% for the polyamides and 22 wt% for PVB respectively. It was found
that low-molecular-weight polyamide Euremelt, the copolymer EMS Grilon and PVB
form mechanically compatible blends with thermoplastic starch (TPS). The polyamides
are expensive, but the recycled PVB provides a cost advantage.
Polybutylene succinate adipate (PBSA), a fully biodegradable synthetic polyester, is
used as the main ingredient in golf tees applications. For cost reduction purposes urea
and starch fillers were introduced into the blends. One of the blends was prepared with
40 wt% urea, the other with 20 wt% urea and 20 wt% starch. Both contained 10 wt% of
stearic acid as a lubricant.
After extrusion, all compositions were injection-moulded into dumb-bell test specimens
and their mechanical properties were investigated. The characterisation was further
extended with X-ray diffraction analysis (XRD), scanning electron microscopy (SEM)
and optical microscopy analysis. ASTM standard G160 was used to study the
biodegradability of the blends through a burial test.
The specimens for tensile strength testing were aged in a humidity chamber at a relative
humidity (ℜH) of 60% at 30ºC and under extreme drying conditions over phosphorous
pentoxide in a desiccator at 0% ℜH, 25ºC. Starch containing blends were particularly
affected by the ageing conditions, whereas polyester compositions remained stable in
both environments.
The XRD and optical microscopy results point to higher crystallinity and better
homogeneity of TPS and EMS Grilon than Euremelt and PVB in seedling tube
compositions.
Cross-linking reactions of the starch through urea reduced the crystallinity in the golf
tees. The polyester filled with urea only had higher crystallinity than the one with both
starch and urea.

iii
In seedling tubes applications, where starch is the main component, the higher
crystallinity of the TPS-EMS blends brought about increased tensile strength and slower
decomposition. The best decomposition was achieved in the less-crystalline TPS-PVB
blend, with an 80% reduction in the elongation at break at the end of the 60-day
compostability test.
When starch is introduced as filler in urea-filled polyester blends, it reduced the
crystallinity of the blend and, surprisingly, also its degradability. Only 15%
decomposition occurs in this composition. The polyester forms a more crystalline
structure when only urea is used as filler. The higher weight loss (30%) is partly due to
the leaching of urea but also indicates better compostability for this compound.
Keywords: Injection moulding, compostability, biodegradability, starch, urea, seedling
tubes, golf tees.

iv
ACKNOWLEDGEMENTS
The author would like to thank:
Professor Walter Focke – for his overall supervision and guidance. Thank you!
Dr Thilo van der Merwe – for his help during extrusion, injection moulding and the
whole organisation of the experimental part of the project at the CSIR in Pretoria.
Joseph Sebakedi – for his assistance with the Injection Moulder Engel at the CSIR in
Pretoria.
Dr Sabine Verryn – for her assistance with the interpretation of the XRD results.
Alan Hall – for his assistance with the interpretation of the SEM results.
I would also like to dedicate my thesis to Judy and Ian Smith, who have always been
there for me in difficult times, and to my mom, with whom I still have a very strong
relationship, and my adored dad, who passed away in 1992.

v
TABLE OF CONTENTS
ABSTRACT ..................................................................................................................... I
LIST OF FIGURES AND SPECTRA.............................................................................VII
LIST OF TABLES ...........................................................................................................X
LIST OF ABBREVIATIONS...........................................................................................XI
1 INTRODUCTION.............................................................................................. 1
2 LITERATURE SURVEY ................................................................................... 5
2.1 MECHANISMS OF DEGRADATION ........................................................................... 5
2.1.1 Starch-based compositions for seedling tubes applications 8
2.1.2 Polyester compositions for golf tees applications 25
3 EXPERIMENTAL DETAILS ........................................................................... 32
3.1 MATERIALS....................................................................................................... 32
3.2 APPARATUS...................................................................................................... 32
3.3 TEST METHODS ................................................................................................ 36
3.3.1 Tensile testing 36
3.3.2 X-ray diffraction (XRD) analysis 39
3.3.3 Compostability 39
3.4 PLANNING ........................................................................................................ 43
3.4.1 Seedling tubes 43
3.4.2 Golf tees 44
4 RESULTS AND DISCUSSION....................................................................... 46
4.1 TENSILE TESTING .............................................................................................. 46
4.1.1 Seedling tubes compositions 46
4.1.2 Golf tee compositions 51
4.2 XRD RESULTS .................................................................................................. 53
4.2.1 Seedling tubes compositions 53
4.2.2 Golf tee compositions 55

vi
4.3 COMPOSTABILITY .............................................................................................. 56
4.3.1 Seedling tubes compositions 56
4.3.2 Golf tees compositions 63
4.4 SEM RESULTS.................................................................................................. 68
5 CONCLUSIONS............................................................................................. 70
5.1 SEEDLING TUBES .............................................................................................. 70
5.2 GOLF TEES ....................................................................................................... 72
6 REFERENCES............................................................................................... 74
APPENDICES............................................................................................................... 81
APPENDIX A: EXTRUSION..................................................................................... 82
APPENDIX B: INJECTION MOULDING................................................................... 86
APPENDIX C: TENSILE TEST DATA ...................................................................... 90
APPENDIX D: XRD SPECTRA ................................................................................ 94
APPENDIX E: COMPOSTABILITY TENSILE TEST DATA .................................... 106
APPENDIX F: SEM................................................................................................ 110

vii
LIST OF FIGURES AND SPECTRA
Figure 1.1: Dr Grant’s golf tee ...................................................................................... 2
Figure 1.2: Indication of the time required for composting of various bio-based and
synthetic polymeric materials ..................................................................... 4
Figure 2.1: Biodegradable polymers (BDP) (Webber, 2000) ........................................ 7
Figure 2.2: Chemical structure of amylose and amylopectin ........................................ 8
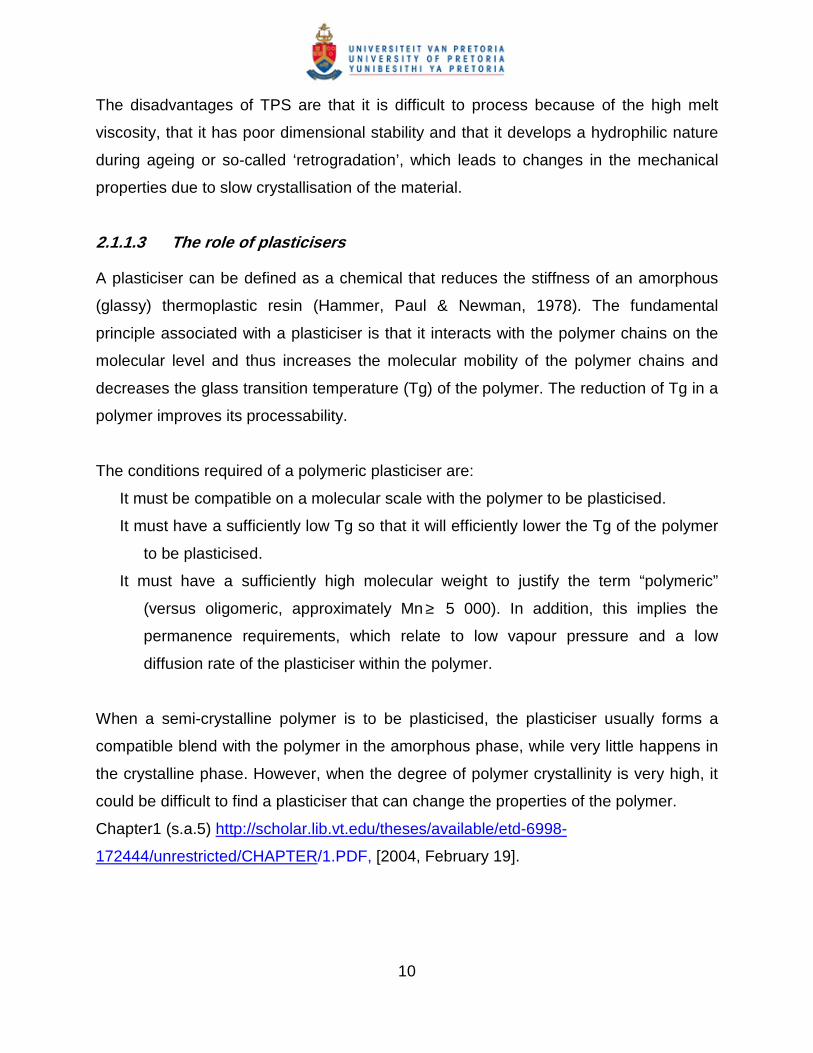
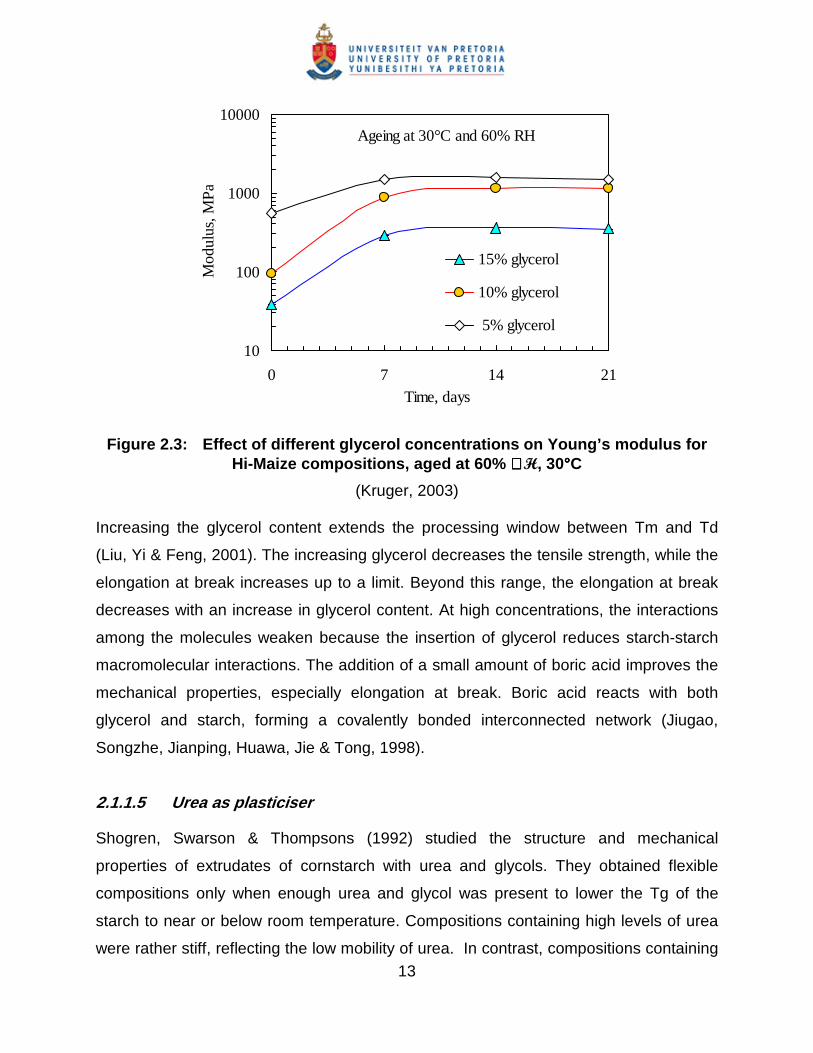
Figure 2.3: Effect of different glycerol concentrations on Young’s modulus for Hi-Maize
compositions, aged at 60% ℜH, 30°C ..................................................... 13
Figure 2.4: Compatibility of blends (Kaplan, 1976)..................................................... 23
Figure 2.5: Biodegradable polyesters family .............................................................. 25
Figure 3.1: Papenmeier mixer (K model).................................................................... 33
Figure 3.2: CTM extruder ........................................................................................... 34
Figure 3.3: Injection moulder Engel 3040, 800 kN ..................................................... 34
Figure 3.4: Stress-strain curve for traditional semi-crystalline thermoplastics ............ 38
Figure 3.5: Stress-strain curve for thermoplastic starch (TPS)................................... 38
Figure 3.6: Cracked tensile specimens, incorporating Stygel and Euremelt 2138 in
different proportions ................................................................................. 45
Figure 4.1: Tensile strength of seedling tubes compositions at 60% ℜH and 0% ℜH
................................................................................................................. 46
Figure 4.2: Young’s modulus seedling tubes compositions at 60% ℜH and 0% ℜH 47
Figure 4.3: Elongation at break for seedling tube compositions at 60% and 0% ℜH. 47
Figure 4.4: Work-to-break for seedling tube compositions at 60% and 0% ℜH ......... 48
Figure 4.5: Moisture content in TPS 15G and TPS 30G at 60% ℜH, 30°C and 0%
ℜH, 25°C................................................................................................. 48
Figure 4.6: Tensile properties of golf tees compositions at 60% and 0% ℜH ............ 52
Figure 4.7: Moisture change in starch-filled golf tees compositions over 30 days...... 53
Figure 4.8: Visual observations of seedling tubes compositions at day 0 and day 60 of
the composting......................................................................................... 58
Figure 4.9: Observation of the plant roots growing through a PVB tube placed in the
greenhouse .............................................................................................. 59

viii
Figure 4.10: Tensile properties of seedling tubes compositions under controlled
composting conditions.............................................................................. 61
Figure 4.11: Optical microscopy results of TPS Eu (top left), TPS EMS (top right) and
TPS PVB (bottom) at a magnification of x40............................................ 63
Figure 4.12: Visual observation of golf tees compositions U20/Hi20 at day 0 and day 60
of the composting..................................................................................... 64
Figure 4.13: Visual observation of golf tees compositions U40 at day 0 and day 60 of
the composting......................................................................................... 65
Figure 4.14: Tensile properties of golf tees compositions under controlled composting
conditions................................................................................................. 66
Figure 4.15: Weight loss of golf tees compositions under controlled composting
conditions................................................................................................. 67
Spectrum D1: Raw Starch diffractogram....................................................................... 95
Spectrum D2: TPS 9/Eu and raw materials................................................................... 96
Spectrum D3: TPS 10/EMS and raw materials ............................................................. 97
Spectrum D4: TPS 11/PVB and raw materials .............................................................. 98
Spectrum D5: TPS 9/Eu, 10/EMS and 11/PVB and TPS 15G, TPS 30G aged at 60%
ℜH, 30C .................................................................................................. 99
Spectrum D6: TPS 9/Eu, 10/EMS, 11/PVB aged at 0% ℜH, 25°C ............................. 100
Spectrum D7: TPS 9/Eu, 10/EMS and 11/PVB aged at 60% ℜH, 30°C and 0% ℜH,
25°C....................................................................................................... 101
Spectrum D8: U40....................................................................................................... 102
Spectrum D9: U20/Hi20 ageing at 60% ℜH, 30°C...................................................... 103
Spectrum D10: U40 and U20/Hi20 aged spectrums.................................................... 104
Spectrum D11: U20/Hi20 and raw materials ............................................................... 105
Figure F1: Microphotograph of TPS 15G crystal structures: crystals of vitamins,
produced by microorganisms, soil or sand structures. Picture taken at day
45 of composting inside the cut specimen at magnification X1000 ........ 111
Figure F2: Microphotograph of TPS 15G collapsed hife and crystal structure. Picture
taken at day 45 of composting, inside the cut specimen, at magnification
x3 700 .................................................................................................... 112

ix
Figure F3: Microphotograph of TPS 30G microorganism activity, slime effect. Photo
taken from the outside degradation layer at day 13 of the computability
test. Magnification x3 700. ..................................................................... 113
Figure F4: Microphotograph TPS Eu spores. Picture taken at day 13 of compostability
test, outside degradation layer at magnification x7 000. ........................ 114
Figure F5: Broken Starch granule in TPS EMS bottom right. Photo taken at day 7 of the
compostability test at magnification x500, inside of the degradation layer
............................................................................................................... 115
Figure F6: Start of the degradation/pitting at the starch granule in TPS EMS. Photo
taken from the inside degradation layer, day 13 of the degradation process
and magnification x7 000 ....................................................................... 116
Figure F7: Slime effect in TPS PVB. Photo taken at day 7 of the composting at x3 700
magnification.......................................................................................... 117
Figure F8: Aerobic and anaerobic layers of biodegradation in TPS PVB. Photo taken at
day 45 of the composting at x20 magnification. ..................................... 118
Figure F9: Hife in TPS PVB. Photo taken at day 45 of the composting, outside
composting layer and magnification of ................................................... 119
x3 700 119
Figure F10: U20/Hi20 at day 60 of composting. Starch granules still visible under the
slime mucus. Photo taken from the inside composting layer at
magnification x3 700. ............................................................................. 120
Figure F11: Complete degradation in the outer aerobic layer in U20/Hi20 composition.
Photo taken from the outside decomposing layer at day 60 of the test and
magnification x1 400. ............................................................................. 121
Figure F12: Complete degradation in the inner layer of U40 composition, compostability
day 60 and magnification x3 700............................................................ 122

x
LIST OF TABLES
Table 1.1: Current golf tees and methods of production ............................................. 4
Table 2.1: Amylose and amylopectin content of different types of starch ................... 9
Table 3.1: Raw materials and producers/suppliers ................................................... 32
Table 3.2: Settings of the Siemens D-501 automated diffractometer........................ 35
Table 3.3: Biodegradability standards requirements (Nolan-ITU, 2002) ................... 41
Table 4.1: Moisture content during ageing of seedling tubes and golf tees............... 50
Table 4.2: Estimation of microbial staining for all samples (ASTM G160)................. 60
Table 4.3: Changes in tensile strength...................................................................... 60
Table 4.4: Changes in elongation at break................................................................ 62
Table A1: Sample’s compositions ................................................................................. 83
Table A2: Extrusion of Seedling trays compositions ..................................................... 84
Table A3: Extrusion characteristics of Golf tees compositions, performed at Berstoff .. 85
Table B1: Injection moulding parameters of Seedling trays compositions, performed at
Engel........................................................................................................ 87
Table B2: Injection moulding parameters of Golf Tees compositions, performed at Engel
................................................................................................................. 89
Table C1: Values obtained from tensile testing of Seedling trays compositions at 60%
ℜH, 30ºC for 30 days .............................................................................. 91
Table C2: Values obtained from tensile testing of Golf tees compositions at 0% ℜH and
60% ℜH, for 30 days ............................................................................... 93
Table E1: Observed compostability parameters according to ASTM G160................. 107
Table E2: Values obtained from tensile testing of Seedling trays compositions during
composting for 60 days .......................................................................... 108
Table E3: of values obtained from tensile testing of Golf tees compositions during
composting for 60 days .......................................................................... 109

xi
LIST OF ABBREVIATIONS
AAC Aliphatic-aromatic copolyesters
ABS Acrylonitrile-butadiene-styrene
ASTM American Society for Testing and Materials
BDP Biodegradable polymers
CEN European Standardization Committee
DIN German Institute for Standardization
DMS Dynamic mechanical spectra
DMTA Dynamic mechanical thermal analysis
DSC Differential scanning calorimetry
ISO International Standard Organization
ISR Institute of Standards Research
NMR Nuclear magnetic resonance
PBAT Polybutylene adipate/terephthalate
PBS Polybutylene succinate
PBSA Polybutylene succinate adipate
PCL Polycaprolactone
PET Polyethylene terephthalate
PHA Polyhydroxyalkanoates
PHB Polyhydroxy butyrate
PHH Polyhydroxyhexanoate
PHV Polyhydroxyvalerate
PLA Polylactic acid
PP Polypropylene
PTMAT Polymethylene adipate/terephthalate
PVB Polyvinylbutyral
PVOH Polyvinyl alcohol
ℜH Relative humidity
SEM Scanning electron micrograph
Tan δ = loss factor (loss tangent)

xii
Tg Glass transition temperature
TMA Thermo-mechanical analysis
TPS Thermoplastic starch
XRD X-ray diffraction analysis
1
1 INTRODUCTION
The objective of this project was to develop injection-mouldable, low-cost biodegradable
blends suitable for seedling tubes and golf tees.
Sappi Forest Products and their Research Centre at Ngodwana Nursery expressed
interest in biodegradable seedling tubes. They requested such tubes to improve their
productivity with the planted seedlings. As the seedlings would not have to be pulled out
of the tubes before planting and less root damage would be caused, a larger number of
plants would survive.
The requirements for the tube material were that they should be able to withstand 100%
relative humidity (ℜH) for seven days at 38ºC, followed by about three months spray
watering, three times a week. Once planted, the tube should not restrict the growth of
the plant’s roots.
The current seedling tubes are made from polypropylene (PP), which can be
injection-moulded with a very thin wall thickness. The material has low cost, but is non-
biodegradable. Thermoplastic starch is biodegradable, but when used by itself, yields
weak and moisture susceptible articles. Blends of thermoplastic starch (TPS) and
polymers are considered to strengthen and increase the water resistance of the TPS
material for this application.
This study is continuation of the work done by Sita (2007) who considered blends of
TPS with PVB and polyamides. Starch blends are susceptible to retrogradation: the
structural changes that include helix formation and crystallization that occur above the
glass transition temperature. In an attempt to overcome this problem TPS was blended
with polyamides and polyvinyl butyral (PVB) as modifying agents. The PVB was based
on material recycled from automotive windscreens. Blending with polyamides and
polyvinyl butyral improved moisture resistance, ageing behaviour, processability and
mechanical properties. The mechanical properties were found to vary nonlinearly with

2
blend composition. This is attributed to the complex phase behaviour of the starch
blends. The purpose of this study was then to evaluate practical applications of the
blends systems investigated by Sita (2007).
The market for golf tees has also been growing over the past few years. With the
development of the sport of golf, the demand to improve the design of golf tees is also
likely to increase.
George Franklin Grant patented the golf tee in 1899 (see Figure 1). He was one of the
first African-American golfers in the post-Civil War period in the USA and one of the first
African-American dentists. George Grant was born in Oswego, New York, in 1847 and
was the son of former slaves. He graduated from Harvard Dental School in 1870.
Figure 1.1: Dr Grant’s golf tee
By all accounts, Dr Grant was not the most skilled golfer, but he enjoyed the
recreational aspects of the game. He found the method of teeing up the ball, i.e.
pinching damp sand into a launching pad, both inconsistent and tedious. This was
messy and towels and water had to be provided to wash the golfer’s hands. Original
sand boxes can still be found on some old golf courses. George Grant was also
interested in the physics of golfing and in improving the game of golf. He received US
Patent No. 368,920 on 12 December 1899 for his improved golf tee.

3
The first commercial golf tee was the Reddy Tee invented at Maplewood Golf Club in
1921 by another American dentist, William Lovell. First manufactured in wood and
painted with red tops so that they were easily seen, they were soon produced in a
variety of styles and materials. The “Reddy Tee”, made of white celluloid by Nieblo
Manufacturing Company, was patented in 1924. Although plastic tees are available,
simple wooden tees similar to those made in the 1920s are still the most common type.
History George F. Grant (s.a.6) http://www.ourgolf.com/history/georgegrant.htm, [2004,
March 4].
Scottish Golf History (s.a.7) http://www.scottishgolfhistory.net/tee_term.htm, [2004,
March 4].
Bellis, M Inventors, http://inventors.about.com/library/inventors/blgolfteehtm,htm, [2004,
March 4].
Currently the market is dominated by the USA, China, India and Europe. South African
suppliers usually import the golf tees because there are only a couple of local
manufacturers, who cannot deal with the market demand.
In the interviews done with pros in golf shops around Johannesburg, we were informed
that in South Africa there are about 579 golf courses. An average golf course sells
3 500 to 4 000 golf tees per month (wood and plastic). Hence, 25 to 30 million golf tees
are sold every year. This is a big market, which is covered mainly by imports.
Our research led to the following South African suppliers/manufacturers: Bandit Top,
Flight Simaki, Thigh less, Golf Trends and Polytron. The requirements for the golf tees
are specific to the customers’ needs and may include biodegradability, brittleness, low
cost, printability and colour (see Table 1.1).
Wood is biodegradable, costs the same as plastics, but could damage golf clubs, as it is
hard. Polypropylene and ABS (acrylonitrile-butadiene-styrene) are non-biodegradable.

4
They are low cost commodity products and easily converted into products by injection
moulding.
Brittleness is required to prevent golf club damage. When the material is hard and non-
brittle, it catches under the plate of a rotary lawn mower and this causes a drag mark on
the greens. It also blunts the lawnmower blades. Daily manual removal of the pieces is
necessary, which is very labour-intensive.
Time in months
Figure 1.2: Indication of the time required for composting of various bio-based and synthetic polymeric materials
(Webber, 2000)
Table 1.1: Current golf tees and methods of production
Material Biodegradability Brittleness Cost Method of
production
Wood Biodegradable within
6 months
Brittle Low Wood-turning lathe
PP Non-biodegradable Not brittle Low Injection moulding
ABS Non-biodegradable Brittle Low Injection moulding
Thermoplastic Starch TPS Blends PHBV Biopol Proteins Polylactide Polycaprolactone Medium Chain PHA Aliphatic(Co)polymers Cellulose paper Newspaper Polyesteramides Aliph./Arom.Copolyesters Cellulose diacetate
Wood
1 2 3 4 5 6

5
Webber (2000) published measurements of composting times for different materials
performed in actively aerated and mechanically turned composting facilities (Figure 1.2).
It was found that it takes one to six months for wood to degrade, while TPS, TPS blends
and some biodegradable polyesters degrade within four months (Webber, 2000).
2 LITERATURE SURVEY
Polymeric materials such as conventional non-degradable polymer systems are used
for high-volume applications such as packaging in the medical, automobile and
agricultural areas. They can be very harmful to our environment since they do not
degrade easily after their life-cycle has been completed and litter to the environment.
Recycling is a better choice, but comes at a higher cost and most countries cannot
afford to recycle all their polymer wastes. After recycling, the polymers’ properties are
poor compared with their original ones. Moreover, not all polymers can be recycled.
This leads to the need for new degradable polymers, which can replace existing
synthetic polymers. Replacement of these polymer systems requires that the
degradable polymers have properties sufficiently comparable to those of the
conventional polymers. Creating new environmentally friendly polymers or modifying
existing degradable polymers can achieve these desirable properties. The term
‘degradable polymers’ relates to the polymeric materials that disintegrate under
environmental conditions in a reasonable and demonstrable period (Narayan,
Barengerg, Brash & Redpath, 1990).
Chapter1 (s.a.5) http://scholar.lib.vt.edu/theses/available/etd-6998-
172444/unrestricted/CHAPTER/1. PDF, [2004, February 19].
2.1 MECHANISMS OF DEGRADATION
Degradation of polymers occurs by any of the following mechanisms (Swift & Glass,
1990):
Oxidative degradation: The lifetime of most polymers is determined by this mechanism.
It relates to the slow oxidative degradation of polymers exposed to atmospheric oxygen.
This mechanism also operates during high-temperature processing.

6
Biodegradation: This is promoted by enzymes and may be either aerobic or anaerobic.
It provides for complete breakdown of the polymer.
Photodegradation: This requires irradiation, e.g. sunlight, and it rarely leads to complete
breakdown, although small fragments may be produced for subsequent biodegradation.
Environmental erosion: This requires weather elements such as wind, rain, temperature
and sunlight. It also cannot remove the polymer completely.
Chemical degradation: This requires chemical reactions using additives, e.g. metals and
functional groups, which produce smaller fragments of the polymer.
However, complete removal from the environment is only possible through
biodegradation
Chapter1 (s.a.5) http://scholar.lib.vt.edu/theses/available/etd-6998-172444/unrestricted/
CHAPTER/1.PDF, [2004, February 19].
The presence of hydrolysable and/or oxidisable linkages in the polymer main chain, the
presence of suitable substituents, correct stereo configuration, balance of
hydrophobicity and hydrophilicity, and conformational flexibility contribute to the
biodegradability of the polymers (Huang & Edelman, 1995).
Biodegradable polymers are divided into three classes:
1. Natural polymers originating from plant or animal sources (e.g. cellulose, starch,
protein, collagen, etc.)
2. Certain synthetic polymers (e.g. polycaprolactone and poly-lactic acid,
polyesters)
3. Biosynthetic polymers produced by fermentation processes by micro-organisms
(e.g. poly-hydroxy alkanoates).
Chapter1 (s.a.5) http://scholar.lib.vt.edu/theses/available/etd-6998-
172444/unrestricted/CHAPTER/1.PDF, [2004, February 19]

7
Biodegradable polymers
Figure 2.1: Biodegradable polymers (BDP) (Webber, 2000)
Bio-based polymers
Polymers extracted directly from biomass
Synthesized from bio-derived monomers
Polymers produced directly
by organisms
Polysaccharides Proteins Lipids Polylactate PHA
Starch Potato Maize Wheat Rice
Derivatives
Animals Casein Whey
Collagen Gelatine
Plants Zein Soya
Gluten
Cross-linked tri- glyceride
Other polyesters
Cellulose Cotton Wood
Other derivatives
Gums Guar
Locust bean Alginates
Carrageenan Pectins
Derivatives
Chitosan Chitin
Xanthan Curdlan Pullan
Bacterial cellulose

8
2.1.1 Starch-based compositions for seedling tubes applications
The following compositions are available for seedling tubes:
• Thermoplastic starch products(TPS)
• Starch synthetic aliphatic polyester blends
• Starch PBS/PBSA polyester blends
• Starch polyvinyl alcohol (PVOH) blends
• Starch polyvinylbutyral (PVB) blends
• Starch polyamide blends.
2.1.1.1 Starch as raw material
Starch is a natural polymer found in plants. It consists of amylose (linear polymer) (1-4
bonds) and amylopectin (branched chains) (1-4 and 1-6 bonds between the glycose
repeat units) (see Figure 2.2).
Figure 2.2: Chemical structure of amylose and amylopectin
(African Products, s.a.1)
According to the ratio of amylose to amylopectin, there are a couple of types of starch
(see Table 2.1).

9
Table 2.1: Amylose and amylopectin content of different types of starch
Type of starch Amylose, wt% Amylopectin, wt%
High amylose (Hi-Maize) 70 30
Maize (Amyral/Stygel) 26 74
Cassava (tapioca) 17 83
Waxy maize 1 99
Starch is an abundant and cheap, fully biodegradable polymer, which is also an
annually renewable resource and it is environmentally friendly.
The disadvantages of raw starch are that it disintegrates in water, it is not thermoplastic
and cannot be melt-processed because the degradation temperature is lower than the
crystalline melting point.
Starch can be modified chemically or mechanically to suit different applications. The
chemical modification processes include acid modification, oxidation, cross-bonding,
acetylation, cationisation and dextrinisation (African Products, s.a.2).
2.1.1.2 Thermoplastic starch
To be able to make thermoplastic material out of starch, a reduction in the hydrogen
bonding between the starch molecules is needed. Raw starch can be easily converted
into thermoplastic starch (TPS) or gelatinised starch with the help of a plasticiser such
as water, glycerol, urea, amides, etc. Gelatinisation is a mechanical modification and
can transform the crystalline form into an amorphous plasticised gel. It allows the
macromolecules some freedom to move, reducing the bonding between adjacent starch
molecules and reducing their crystallinity. Gelatisation can be achieved by gently
heating and shearing the starch, water and plasticiser in a conventional polymer
extrusion compounding process.
10
The disadvantages of TPS are that it is difficult to process because of the high melt
viscosity, that it has poor dimensional stability and that it develops a hydrophilic nature
during ageing or so-called ‘retrogradation’, which leads to changes in the mechanical
properties due to slow crystallisation of the material.
2.1.1.3 The role of plasticisers
A plasticiser can be defined as a chemical that reduces the stiffness of an amorphous
(glassy) thermoplastic resin (Hammer, Paul & Newman, 1978). The fundamental
principle associated with a plasticiser is that it interacts with the polymer chains on the
molecular level and thus increases the molecular mobility of the polymer chains and
decreases the glass transition temperature (Tg) of the polymer. The reduction of Tg in a
polymer improves its processability.
The conditions required of a polymeric plasticiser are:
It must be compatible on a molecular scale with the polymer to be plasticised.
It must have a sufficiently low Tg so that it will efficiently lower the Tg of the polymer
to be plasticised.
It must have a sufficiently high molecular weight to justify the term “polymeric”
(versus oligomeric, approximately Mn ≥ 5 000). In addition, this implies the
permanence requirements, which relate to low vapour pressure and a low
diffusion rate of the plasticiser within the polymer.
When a semi-crystalline polymer is to be plasticised, the plasticiser usually forms a
compatible blend with the polymer in the amorphous phase, while very little happens in
the crystalline phase. However, when the degree of polymer crystallinity is very high, it
could be difficult to find a plasticiser that can change the properties of the polymer.
Chapter1 (s.a.5) http://scholar.lib.vt.edu/theses/available/etd-6998-
172444/unrestricted/CHAPTER/1.PDF, [2004, February 19].

11
2.1.1.4 Water and glycerol as plasticisers
The glass transition temperature (Tg) is the most important parameter in determining
the mechanical properties of amorphous polymers. It can also control the rates of kinetic
processes such as recrystallisation and physical ageing. The Tg of dry starch is
experimentally inaccessible due to the thermal degradation of starch polymers at
elevated temperatures.
The plasticisation of starch by water has been demonstrated through the decrease of
the Tg of native and amorphous wheat starch and of amorphous and partially
recrystallised waxy maize starch.
If water is the only plasticiser used, the resulting product is brittle when equilibrated with
ambient humidity, similar to an extruded ready-to-eat breakfast cereal, whereas in the
presence of other plasticisers, a rubbery material can be prepared.
Starch materials are visco-elastic and their properties are classified as a function of
plasticiser content: a glassy behaviour at very low plasticiser content, a rubbery
behaviour at higher plasticiser content, and gel-like behaviour at very high plasticiser
content. An increase in the water and glycerol contents decreases the Tg.
Even though water was observed to be a more efficient plasticiser in the studies by
Myllarinen, Partanen, Seppala & Forssell (2002), glycerol also affected the Tg. Above
20 wt% glycerol, amylose films featured much higher elongation, but were still stronger
than films with a low glycerol content. Amylopectin produced very weak and non-
flexible films.
Graaf, Karman & Janssen (2003) studied the glass transition temperatures in different
types of starches. Tg was found to decrease in the order: Tg waxy maize> Tg wheat>Tg
potato> Tg pea. With regard to the glycerol content, Tg reduces with an increase in the
plasticiser in the order: Tg 15 wt%G>Tg 20 wt%G>Tg 25 wt%G. Products containing
higher amounts of amylopectin (waxy maize) have higher Tg’s than materials with less

12
amylopectin (pea starch). The lower molecular mass of amylose and its lack of
branches result in a greater free volume of pea starch so that the chains can move
more easily. This explains the lower Tg of amylose compared with that of the branched
amylopectin. Thus materials with a higher amylose weight fraction will have a lower Tg
and will be more flexible. Glycerol has a greater impact on materials containing more
amylopectin. Graaf et al. (2003) explain this by the fact that the Tg’s of amylopectin and
glycerol differ more greatly from each other than those of amylose and glycerol.
Graaf et al. (2003) presented plots of the DMTA (dynamic mechanical thermal analysis)
curves for different types of starches. He noticed broadening of the tan δ peaks at a
constant glycerol content of 15 wt% when the amylose/amylopectin ratio increases. He
attributed this to increased heterogeneity with an increase in the amylose/amylopectin
ratio. Hence the author suggests that an increasing of the glycerol content decreases
this broadening or heterogeneity.
Using DMTA Forssell, Mikkila, Moates & Parker (1997) showed mechanical loss peaks
corresponding to the glass transition of both phases: amylose and amylopectin.
Amylopectin crystallisation did not occur within one week of storage in mixtures
containing less than 20 wt% water. This may indicate that glycerol interacts strongly
with starch, inhibiting the rate of crystallisation of amylopectin.
Glycerol containing TPS is tough and strong owing to hydrogen bonding with the starch
(Van Soest & Vliegenthart, 1997). Kruger (2003) investigated the effect of plasticiser
levels on the mechanical properties of TPS. He prepared samples containing Hi-Maize
and a combined total of 30 wt% glycerol and water (Figure 2.3). The glycerol levels
were 5, 10 or 15 wt%, with the balance being water. The lower the glycerol content, the
higher are the Young’s moduli of the compositions.
13
10
100
1000
10000
0 7 14 21Time, days
Mod
ulus
, MP
a
15% glycerol
10% glycerol
5% glycerol
Ageing at 30°C and 60% RH
Figure 2.3: Effect of different glycerol concentrations on Young’s modulus for Hi-Maize compositions, aged at 60% ℜℜℜℜH, 30°°°°C
(Kruger, 2003)
Increasing the glycerol content extends the processing window between Tm and Td
(Liu, Yi & Feng, 2001). The increasing glycerol decreases the tensile strength, while the
elongation at break increases up to a limit. Beyond this range, the elongation at break
decreases with an increase in glycerol content. At high concentrations, the interactions
among the molecules weaken because the insertion of glycerol reduces starch-starch
macromolecular interactions. The addition of a small amount of boric acid improves the
mechanical properties, especially elongation at break. Boric acid reacts with both
glycerol and starch, forming a covalently bonded interconnected network (Jiugao,
Songzhe, Jianping, Huawa, Jie & Tong, 1998).
2.1.1.5 Urea as plasticiser
Shogren, Swarson & Thompsons (1992) studied the structure and mechanical
properties of extrudates of cornstarch with urea and glycols. They obtained flexible
compositions only when enough urea and glycol was present to lower the Tg of the
starch to near or below room temperature. Compositions containing high levels of urea
were rather stiff, reflecting the low mobility of urea. In contrast, compositions containing

14
high levels of glycols were soft and weak. Samples extruded with a mixture of urea and
glycols exhibited enhanced elongation at break. Urea lowers the Tg to below room
temperature where the system is at thermodynamic equilibrium. Urea also disrupts
starch hydrogen bonding, so no retrogradation occurs.
All samples became brittle at very low humidity and soft at high humidity. However, urea
is a solid with a high melting point and little internal flexibility and hence would not be
expected to add much flexibility to gelatinised starch. Since the glycols are solvents for
urea, it was hypothesised that when a combination of the two was used, the urea would
form a hydrogen-bonded complex with the starch which would then be solvated by the
glycol. It was suspected, therefore, that this mixture might be a better plasticiser for
starch than any of the others on their own. Mixtures of glycols and urea as plasticiser
seem to give compositions initially having elongations (and hence toughness) greater
than for similar levels of glycols alone, but they lose these with time (Shogren et al.,
1992; Shogren, Fanta & Doane, 1993). Tensile strength decreased and elongations
increased in the order: triethylene glycol (2.4 MPa), glycerol (1.5 MPa) and propylene
glycol (too soft to test).
It is interesting to carry out the reaction of starch with urea in the presence of a mineral
acid or mineral acid salts. The extent of the reaction increases on the nature and
concentration of the catalyst as follows: (a) sulphuric acid > nitric acid > phosphoric
acid; and (b) ammonium sulphate > ammonium nitrate > ammonium chloride
> magnesium sulphate. Khalil, Farag, Alt & Hebeish (2002) suggested that the acid
performs two main functions. Firstly, it prevents cross-linking. Secondly, it degrades
starch molecules via hydrolysis, thereby lowering the molecular size of the starch and
thus enhancing its solubility.
Other plasticisers include sucrose, glucose, xylose and fructose. Kalichevsky,
Jaroszkiewicz, Abllet, Blanshard & Lillford (1992) studied the effect of fructose and
water mixtures on the dynamic mechanical properties of waxy maize. Two glass

15
transitions were detected and fructose had a greater plasticising effect at low water
content (Forssell et al., 1997).
2.1.1.6 Crystallization, ageing and mechanical properties of TPS in relation to
changes in B-type crystallinity
Starch is semi-crystalline, with a crystallinity of 20 – 45%. Native starch has a high
degree of supermolecular organisation within the granules. The amylopectin molecules
are organised in a radial pattern. Amylose and the branching points of amylopectin form
amorphous regions in the starch granules. Amylopectin is the main crystalline
component in granular starch. The crystalline regions, consisting of double helices of
the amylopectin outer chains, are arranged as thin lamellar domains. Additional
crystallinity may arise from co-crystallisation with amylose and from amylose
crystallisation into single-helical structures, which form complexes with fatty acids or
lipids (Van Soest & Vliegenhart, 1997; Zobel, 1988).
Several types of crystal structure are observed in the granules, denoted V-, A-, or B-
type, which differ in the packaging density of the single or double helices and in water
content. Starches are labelled according to the type of crystallite present in the
granules. Most cereal starches give A pattern; potato and other root starches give B
pattern (Hoseney, 1994; Rao & Hartel, 1998). Hence cereal and potato are termed
A-type and B-type. Starches such as pea, which contain both A- and B-crystallites, are
termed C-type. The relative abundances of the crystal structure are influenced by the
amylose/amylopectin ratio, molecular mass, degree of branching and length of the
amylopectin outer chains.
Processing-induced crystallisation of amylose:
Crystal structures have characteristic X-ray diffraction patterns, owing to differences in
the crystal lattice and the degree of hydration. The processing parameters, amylose
content and additives mainly determine the formation of single helices. During
processing, an increase in the input of mechanical energy, which is related to the
extrusion screw speed or the processing time during kneading, causes an increase of

16
the amount of single-helix-type crystallinity (Van Soest & Vliegenthart, 1997). Due to
high shear conditions the starch granules are molten or physically broken up into small
fragments and therefore no bi-refringence is observed (Van Soest, Hulleman, De Wit &
Vliegenhart, 1996a). Neat starch granules show bi-refrigence, i.e. it rotates a plane of
polarised light to producing interference crosses. These are characteristic for each
starch type and it is one of the features used in identifying a starch source. When the
radial orientation of a crystalline micelle is disturbed, the bi-refringent cross disappears
(The Starch Granule (s.a.8) http://www.eco-foam.com/processing.asp, [2004, February
19]).
Processing-induced crystallisation of amylose is caused by the rapid recrystallisation of
single-helical structures of amylose during cooling after processing. Three types of
crystallinity have been observed in this situation, and identified as VH-, VA -, and EH-
type crystals. Thus Van Soest et al. (1996a) divide crystallinity as found in the starch
into A-, B- and C-type due to incomplete melting during processing, and into V- or E-
type due to processing-induced amylose crystallisation.
The presence of isophospholipids and complex-forming agents also induces amylose
crystallisation. Complex-forming agents, such as isopropanol, show a strong interaction
with starch and are incorporated into the amylose crystals.
The amount of crystallised amylose is proportional to the amylose content, and in waxy
starch materials, which contain little or no amylose, no single-helix-type crystallinity is
observed. The relative amounts of the various amylose single-helical structures and the
rate of change are determined by temperatures and humidity (Van Soest & Vliegenthart,
1997).
Crystallisation during storage:
In glycerol-containing starch plastics, both amylose and amylopectin recrystallise in the
B-type crystal structure. During storage structural changes occur. First, double helices
and aggregates of double helices (short-range ordering) are formed and then

17
crystallisation (long-range ordering) occurs. The crystallisation rate is influenced by the
amylose content, starch source and storage conditions. Amylose crystallisation is fast
compared with that of the amylopectin outer chains, which can be either intramolecular
or intermolecular.
Golding (1998) suggests that the annealing temperature may have an effect on
crystallisation. Jasberg & Shogren (1994) aged high-amylose starch at various
temperatures. They classified the ageing below the Tg as physical ageing, which they
found resulted in no change of crystallinity. Above the Tg the ageing was classified as
retrogadation, which brings about structural changes and crystallisation.
The intramolecular amylopectin B-crystallisation weakens the materials by inducing
internal stresses and reducing the intermolecular interactions, thus explaining the
observed deterioration of starch plastics during storage. Hizukuri, quoted by van Soest
(1996a) proposed that the amylopectin molecules tend to form a more compact cluster
structure, which during ageing according to Hammer et al., (1978) results in an
increased internal stress in the TPS materials. Spontaneous cracks are formed at the
crystalline junction zones.
The intermolecular B-crystallisation of both amylopectin-amylopectin and amylose-
amylopectin increases the strength and stiffness of the materials because of physical
cross-linking of the amorphous amylose and amylopectin.
The aggregation and crystallisation of helices between adjacent amylopectin molecules
is less effective in reinforcing the matrix than the aggregation and crystallisation of
amylose molecules, because the shorter length of the amylopectin outer chains results
in smaller interaction domains (Hammer et al., 1978).
During ageing, the plasticiser content of starch plastics affects the rate of crystallisation.
Higher amounts of plasticiser cause an increase in the mobility of the starch chains and
lower Tg’s.
18
The rate of crystallisation increases with increasing water content. Jang & Pyun (1997)
examined the effect of moisture level on the crystallinity of wheat starch aged at
different temperatures. They concluded that the optimum temperature for crystallisation
was T = (Tg+Tm)/2.
Conversely, glycerol reduces the crystallisation rate at constant water content owing to
the starch-glycerol interaction and a reduction in both starch mobility and water
stabilisation. However, due to the hygroscopicity of glycerol, the water content usually
increases, thereby lowering Tg and increasing the crystallisation rate (Van Soest and
Vliegenthart, 1997).
Brittleness:
One of the main problems with starch materials is their brittleness. When stored, the
brittleness even increases due to the retrogradation and volume-relaxation processes.
During retrogradation and volume relaxation, part of the starch recrystallises. This
process can be divided into two parts. The recrystallisation of the amylose component is
an irreversible and very fast process. However, the reversible crystallisation of
amylopectin is slower. So the retrogradation can be referred to as the long-term
recrystallisation of the amylopectin component (Graaf et al., 2003).
Crystallisation – stress-strain:
The influence of crystallisation on the stress-strain behaviour of thermoplastic potato
starch was monitored by Van Soest and co-workers (1996a,b,c). The materials were
stored for an initial storage period of two weeks at 60% ℜH and 20°C. After this initial
period they were stored for two weeks at various relative humidities, namely 55, 60, 70
and 90% ℜH, to obtain information about the dependence of the properties on storage
humidity. Subsequently, all materials were reconditioned at 60 ± 5% ℜH for two weeks
to level out the differences in water content after storage at different ℜH’s, after which
mechanical testing and XRD were performed. Directly, within a few hours after
extrusion, a small amount of EH-type crystallinity is formed, which is metastable and

19
rearranges during storage for more than several days at 60% ℜH into a six-fold helical
crystal structure, labelled as VH (H-hydrated). These types of structure are formed by
the crystallisation of amylose.
TPS material, stored at 55% ℜH, has a Tg of 35 ± 5°C, which is above storage
temperature. No B-type crystallinity is observed in these materials. Materials stored at
60% ℜH show only a slight increase in B-type crystallinity after the initial storage period
of two weeks. The E-modulus and tensile strength are slightly increased, while the
elongation at break decreases. The properties change drastically at 70% ℜH and even
more at 90% ℜH. The B-type crystallinity increases as well with the time. The E-
modulus and tensile strength increase with an increase in the ℜH, while the elongation
at break decreases when TPS is aged for two weeks. The percentage crystallinity
increases with an increase in the ℜH (Van Soest et al., 1996a,b,c).
Shrinkage:
The samples made by injection moulding change in size during storage. In the injection
direction there is an obvious shrinkage and in the direction perpendicular to it (the
width), an increase of size is detectable. During the injection moulding the polymer in
the mould experiences elongational flow and consequently the chains of the polymers
are orientated in the injection direction. Therefore the chains are in a stretched
conformation and lie parallel to each other. When the injection is stopped, reorientation
starts and the chains realign in a helix configuration. This explains the shrinkage in the
injection direction and the swelling in the width. Besides that, retrogradation will also
cause shrinkage by the forming of hydrogen bonds between the chains, with repulsion
of water molecules.
As expected, shrinkage takes place faster at increasing glycerol fraction. This is due to
a decrease in the local viscosity and an increase in the mobility of the chains, which
makes a faster relaxation possible.

20
The shrinkage of waxy maize takes much more time than that of other starches. The
large amount of amylopectin makes the chains more entangled, which causes many
interactions and limited freedom to move compared with starch with higher amylose
content (Graaf et al., 2003).
2.1.1.7 The Role of lubricants
Lubricants are substances that help in the processing of plastics. They improve flow
properties and reduce the adherence of the melt to machine parts. Thermoplastic
materials have high molecular weight and their melts are highly viscous. Lowering of
the melt viscosity of the material can be achieved by increasing the processing
temperatures or by the use of lubricants, which decrease the internal and external
friction of the melt with the machine parts. Increasing the processing temperature has
limitations since above specific temperatures, the material starts to depolymerise and
loses its strength.
Lubricants coat the surface of the polymer particles, helping them to flow more easily in
the colder parts of the processing machine. With an increase in temperature, the
lubricant melts and penetrates the polymer. The rate of penetration is dependent on the
solubility of the polymer. The solubility of the lubricant depends on its structure and
polarity in relation to that of the polymer (Ritchie, 1972).
2.1.1.8 Blends
Starch is highly hydrophilic and starch-based components disintegrate readily on
contact with water. These problems can be overcome through chemical modification as
the starch has free hydroxyl groups which readily undergo a number of reactions such
as acetylation, esterification and etherification (Nolan-ITU, 2002; African Products,
s.a.1).
Another way of improving the processability of the TPS is to use polymer blends. Along
with the ongoing search for new materials, modifications of existing polymers by
blending have shown promise in economically tailoring materials to have desirable

21
properties. Ideally, two or more polymers may be blended together to form products that
show desirable combinations of properties. However, most of the polymer pairs are not
thermodynamically miscible and so exist in two different phases. This separation into
two phases creates an interface, which might lead to poor performance of the blend
system. A typical case of high interfacial tension and poor adhesion between the two
phases leads to a lower degree of dispersion and to gross separation during later
processing or use. Poor adhesion hinders the formation of highly structured
morphologies. It also leads to very weak and brittle mechanical properties due to poor
stress transfer between phases (Paul & Newman, 1978).
Polymer multi-component systems are categorised as follows: (a) polymer blends,
(b) copolymers and (c) reinforced composites. Better dispersion can be expected in the
case of a copolymerisation, where a chemical bond is present, than in a blend system
consisting of same polymer pairs. Still, it has been observed that nearly all copolymers
exhibit some degree of phase separation (Kollinsky & Markert, 1971). Thus to define the
interaction between the polymer pairs at the molecular level, the term ‘compatibility’ has
been used in the technical literature. However, compatibility is not synonymous with
miscibility since it is used to characterise the relative ease of fabrication or performance
of the two polymers in a blend. Blend components that can resist gross phase
segregation and/or show desirable blend properties are said to possess some degree of
compatibility, though they may not be miscible at all from a thermodynamic point of view
(Paul & Newman, 1978).
Blends of biodegradable synthetic aliphatic polyesters and starch are often used to
produce high-quality sheets and films for packaging by flat-film extrusion using chill-roll
casting or by blown film methods since it is difficult to cast films from 100% starch in a
melted state. Around 50 wt% of the synthetic polyester at US$4 – 5.00/kg can be
replaced with natural polymers such as starch at US$1.50/kg, leading to a significant
reduction in cost. Another advantage is that the polyesters can be modified by
incorporating a functional group capable of reacting with starch polymers (Nolan-ITU,
2002).

22
Biodegradable polyesters are expensive. Starch is also not fully compatible with these
polyesters. In order to retain processability, water resistance and desirable properties,
less than 50 wt% of starch is used. The starch blends therefore remain expensive and
have only found niche-market applications.
Polyvinyl butyral (PVB) is used in the manufacture of safety glass, in vehicle
windscreens and buildings. In the event of the glass shattering, the PVB interlayer acts
as an energy absorber, holds broken glass fragments together and prevents shard
formation. The PVB used in safety glass comprises typically 55 – 70 wt% PVB, with 30
to 45 wt% plasticiser. Large quantities of PVB are recovered from scrap windscreens,
but there is very little interest in recycling this waste due to contamination with glass.
Consequently, it is disposed of in landfill or incinerated (Sita, Burns, Häβler & Focke,
2006)
Chen, David, Mac Knight and Karasz (2001) investigated the miscibility and morphology
of blends of biodegradable poly(3-hydroxybutyrate)(PHB) and poly(vinyl butyral)PVB by
differential scanning calorimetry (DSC) and scanning electron microscopy (SEM). PHB
has semycrystalline structure. PVB contains vinal butyral (VB) and vinyl alcohol (VA).
DSC shows two Tg’s, indicating immisibility. However, partial miscibility is observed in
50/50 (w/w) blends, containing PVB with 25-36 wt% VA content.
Interesting is the invention of Buhler, Schmid and Schultze (1995), discribing highly
transparent, single-phase, biodegradable starch mixture, consisting of selected
biodegradable polyamides and starch, having an amylose content of 50 wt%. The
composition contains emulsifiers, urea and chemically modified starch and plasticizer.
No polymeric compatibilizer has been involved. Preferred polyamides are based on
caprolactam, laurolactam, ω – aminocaproic acid, hexamethylene diamine with adipic
acid.

23
2.1.1.9 Compatibility of the blends
To increase the compatibility between two phases of a blend, a compatibiliser could be
used. These are usually copolymers, which are compatible with the two phases in the
blend system.
Temperature
Figure 2.4: Compatibility of blends (Kaplan, 1976)
Figure 2.4 is a representation of a two-phase system, which illustrates compatible,
incompatible and semi-compatible systems by using DMS. Heterogeneous systems can
be defined as compatible, although they show a large degree of phase separation and
two distinct glass transitions. The compatibility or homogeneity of a polymer blend can
be defined in terms of the dimensions of the separate phases using different
measurement techniques. These are differential scanning calorimetry (DSC), dynamic
mechanical spectra (DMS), thermo-mechanical analysis (TMA), and nuclear magnetic
resonance (NMR). (Kaplan, 1976) defines compatibility by a compatibility number:

24
Experimental Probe SizeNc =
Domain Sizes of Phases
The experimental probe size is defined as the scale of resolution of an instrumental
technique. The domain size is the average dimension of the dispersed phase in the
polymer blend (See Figure 2.4).
Thus, when Nc→∞ the system is compatible
when Nc→1, the system is semi-compatible
when Nc→0, the system is incompatible.
When Nc approaches zero, the dimension of each existing phase is much greater than
the probe size of the instrument. The instrument detects two transitions, corresponding
to each phase. Two distinct Tg's are observed.
When Nc ∞→ , the probe size is much greater than the phase dimensions. The
instrument reports a single Tg,
For the semi-compatible case, the tan δ curve damping is much broader,
corresponding to a plateau. The detection of a single or double transition in a two-phase
system by a DMS instrument gives an indication of the dimensions of the phases
present in the system. The dimension that corresponds to a dynamic mechanical
thermal analysis is approximately 15 nm. The NMR technique, can detect in the
dimensional range of 2.5 to 5 nm.
Chapter1 (s.a.5) http://scholar.lib.vt.edu/theses/available/etd-6998-172444/unrestricted/
CHAPTER/1.PDF, [2004, February 19].

25
2.1.2 Polyester compositions for golf tees applications
Polyesters play a predominant role as biodegradable plastics due to their hydrolysable
ester bonds. The polyester family is made up of two major groups – aliphatic (linear)
polyesters and aromatic (aromatic rings) polyesters (Figure 2.5).
Figure 2.5: Biodegradable polyesters family
PHA = polyhydroxyalkanoates, PHB = polyhydroxybutyrate
PHH = polyhydroxyhexanoate, PHV = polyhydroxyvalerate
PLA - polylactic acid, PCL = polycaprolactone
PBS = polybutylene succinate, PBSA = polybutylene succinate adipate
AAC = aliphatic-aromatic copolyesters, Mod PET = modified polyethylene terephthalate
PBAT = polybutylene adipate/terephthalate
PTMAT = polymethylene adipate/terephthalate
Naturally produced – Renewable; Synthetic – Renewable; Synthetic – Non-renewable
Biodegradable
Polyesters
Aliphatic Aromatic
PBS PCL PHA PLA Mod PET AAC
PBSA PHB PHV PHH PBAT PTMAT
PHB/PHV PHB/PHH

26
Aromatic polyesters have excellent material properties, but they are very resistant to
microbial attack. Aliphatic polyesters, on the other side, are biodegradable, but lack
good mechanical properties. Aliphatic polyesters have better moisture resistance than
starches, which have many hydroxyl groups. These aliphatic polyesters are much more
expensive and lack mechanical strength compared with conventional plastics such as
polyethylene. All polyesters degrade, with hydrolysis being the main mechanism.
Synthetic aliphatic polyesters are synthesised from diols and dicarboxylic acids via
condensation polymerisation, and are known to be completely biodegradable in soil and
water. As mentioned earlier, these polyesters are blended with starch-based polymers
for cost reduction. Hoshino, Sawada, Yokota, Tsuiji, Fukuda & Kimura (2001) measured
the rate of soil degradation of poly-(3-hydroxy-butyrate-valerate) (PHB/PHV), PCL, PBS,
PBSA and PLA during soil burial for 12 months. Samples were collected every three
months for measurement of weight loss. The rate of degradation of PBSA, PHB/PHV
and PCL was found to be similar. The degradation rate of PBS and PLA was found to
be slower (Nolan-ITU, 2002).
2.2.2.1 PHA polyesters (Biodegradable Polyesters: Packaging goes green (s.a.4)
http://www.plasticstechnology.com/articles/200209fa3.html, [2004, June 06])
(Nolan-ITU, 2002)
Polyhydroxyalkanoates (PHAs) are the major group of naturally produced aliphatic
polyesters. The two main members of the PHA family are polyhydroxybutyrate (PHB)
and polyhydroxyvalerate (PHV). Such polymers are actually synthesised by microbes,
with the polymer accumulating in the microbes’ cells during growth.The PHB
homopolymer is a stiff, brittle polymer with high crystallinity and mechanical properties
like those of polystyrene, but it is less brittle. PHB copolymers are preferred for general
purposes as the degradation rate of PHB homopolymer is high at its normal melt-
processing temperature.
The common commercial PHA consists of a copolymer, PHB/PHV, together with a
plasticiser and inorganic fillers such as titanium dioxide and calcium carbonate. PHB
27
and its copolymers with PHV can be melt-processed much more easily. They are fully
biodegradable and suited to applications with short usage and high degradation rate
requirements. The products of this degradation are non-toxic. The applications of PHA
are blow- and injection-moulded bottles and films.
Goodbole, Gote, Latkar & Chakrabarti (2003) stydied the properties of PHB blended
with starch. The blend films had a single glass transition temperature for all the
proportions tested. The nature of the blends was found to be crystaline. The tensile
strength was optimum for the PHB:starch ratio of 0.7:0.3(wt/wt).
Shin, Kim & Kim (1997) found that bacterial PHB/PHV (92/8 w/w) was degraded nearly
to completion within 20 days of cultivation by anaerobic digested sludge, while synthetic
aliphatic polyesters such as PLA, PBS and PBSA did not degrade at all in 100 days.
PHB/PHV exhibited a similar degradation behaviour to cellophane, which was used as a
control material.
Under simulated landfill conditions, PHB/PHV degraded within six months. Synthetic
aliphatic polyesters also showed significant weight losses through one year of
cultivation (Purushothaman, Anderson, Narayana & Jayaraman, 2001).
The commercial candidates from this group are Biopol PHBV, developed by Metabolix,
and Nodax PHBV, marketed by Procter & Gamble. The crystallinity of PHAs can be
manipulated to match the performance of engineered thermoplastics.
.
2.2.2.2 PLA (renewable) polyesters (Nolan-ITU, 2002)
Polylactic acid (PLA) is a linear aliphatic polyester produced by poly-condensation of
naturally produced lactic acid or by the catalytic ring-opening of the lactide group. Lactic
acid is produced via starch fermentation. The ester linkages in PLA are sensitive to both
hydrolysis and enzymatic activity.

28
PLA is often blended with starch to increase biodegradability and reduce costs. The
brittleness of the starch-PLA blend can be corrected using plasticisers such as glycerol,
sorbitol and triethyl citrate, which reduce this effect. PLA is fully biodegradable when
composted at temperatures of 60°C and above. The fi rst two weeks of degradation of
PLA is via hydrolysis to water-soluble compounds and lactic acid. Rapid metabolisation
of these products into CO2, water and biomass by a variety of microorganisms occurs
after hydrolysis, causing weight loss and formation of a porous structure. Increased
hydrolysis takes place in an alkaline environment, in contrast to other biopolymer
materials. The enzymes causing the degradation are pronase, proteinase K, ficin,
esterase and trypsin. PLA does not biodegrade at temperatures lower than 60°C due to
its glass transition temperature being close to 60°C (Nolan-ITU, 2002) (Shimao, 2001).
Grafting of the PLA chains with maleic anhydride through free radical reaction
conducted by reactive extrusion improves the poor mechanical performances of
PLA/starch compositions (Dubois and Narayan, 2002).
2.2.2.3 PCL and PBS (synthetic aliphatic) polyesters
Polycaprolactone (PCL) is a biodegradable synthetic aliphatic polyester. It is made by
the ring-opening polymerisation of caprolactone. It has a low melting point, low viscosity
and good processability. PCL is fully biodegradable when composted. The low melting
point of PCL makes the material suitable for composting due to the temperatures
obtained during composting exceeding 60°C. The biol ogical degradation is done by
fungi; the rate of hydrolysis depends on its mole mass and crystallinity. Chemical
hydrolysis occurs more slowly than with PLA. PCL was previously not widely used due
to cost reasons, which have been overcome by blending the polymer with cornstarch
(Shimao, 2001). Blends containing up to 45 wt% starch and PCL can be biodegradable.
However, this material is not strong enough for most applications as the melting onset
temperature is only 60°C. It actually softens at te mperatures above 40°C. These
drawbacks limit the applications of the starch-PCL blends.
Rutkowska, Krasowska, Heimovska, Smiechowska & Janik (2000) studied the influence
of different processing additives on the biodegradation of PCL film in compost with

29
activated sludge. They found that PCL without additives completely degraded after six
weeks in compost with activated sludge. The introduction of processing additives gave
the materials better tensile strength but made them less vulnerable to microorganism
attack (Nolan-ITU, 2002; Janik, Justrebska & Rutkowska, 1998; Rutkowska et al.,
2000). An improvement of the mechanical properties and interfacial adhesion between
PCL/starch is reported by Dubois and Narayan (2002). The compatibilization was
achieved via grafting PCL chains onto a polysaccharide backbone using dextran.The
compatibilized composition displayed much more rapid biodegradation measured by
composting testing.
Polybutylene succinate (PBS) is a biodegradable synthetic aliphatic polyester with
similar properties to PET. PBS is generally blended with other compounds, such as
starch (TPS) and adipate copolymers, to form PBSA. It has excellent mechanical
properties and can be easily processed via conventional melt techniques. In Japan it is
produced under the name of Bionelle by Showa Highpolymer. In Korea the name is Sky
Green BDP and the producer is SK Polymers. In the USA the Bionelle products are
used in commodity tubes, agricultural films, traffic cones and industrial trays. Some
grades are modified with diisocyanate chain extenders to improve the stiffness and
thermal properties. SK Chemicals Sky Green BDP products offer LDPE-like properties.
They are used in films, disposable cutlery, food tubes, hairbrush handles and paper
coatings. Aliphatic versions biodegrade more rapidly and offer better processing and
tensile properties than the aromatic-aliphatic grades, which cost less.
(Biodegradable Polyesters: Packaging goes green (s.a.4)
http://www.plasticstechnology.com/articles/200209fa3.html, [2004, June 07]).
PBS biodegrades via a hydrolysis mechanism. Hydrolysis occurs at the ester linkages
and this results in a lowering of the polymer's molecular weight, allowing for further
degradation by micro-organisms. SK Chemicals (Korea), a leading manufacturer of PBS
polymers, quotes a degradation rate of one month for 50% degradation for 40 micron-
thick film in garden soil (Nolan-ITU, 2002). To improve the phase stability of PBS/A -
starch blends a small amount (5% by weight) of compatibiliser (maleic anhydride

30
functionalised polyester) can be added. At a higher starch content (>60 wt%), such
sheets can become brittle, which can be overcome by the addition of a plasticiser,
making them more flexible. Ratto, Stenhouse, Auerbach, Mitchell & Farrell (1999)
investigated the properties of PBSA and cornstarch blends. PBSA is biodegradable and
exhibits excellent thermoplastic properties. The aim of the study was to obtain a mixture
that maximised these properties while minimising cost. Cornstarch was blended with
PBSA at concentrations of 5 – 30 wt% by weight. The tensile strength of the blends was
lower than that of the polyester alone, but there was not a significant drop in strength
with increasing starch content. The melt temperature and processing properties were
not affected by the starch content.
The blends of PBSA and cornstarch were investigated for biodegradability by measuring
CO2 production in a soil burial test. Even a 5 wt% starch addition showed a large
reduction in the half-life from that of the pure polyester. The half-life was found to
decline with increasing starch content until a minimum at about 20 wt% starch content
was reached (Nolan-ITU, 2002; Ratto et al., 1999).
Lim, Jung & Jin (1999) studied the properties of an aliphatic polyester blended with
wheat starch. The polyester was synthesised from the poly-condensation of
1,4-butanediol and a mixture of adipic and succinic acids. The wheat starch-polyester
blends were found to have melting points near that of the polyester alone. The addition
of a plasticiser made the blends more flexible and processable than the polyester itself.
The plasticised blends retained a high tensile strength and elongation at the break, even
at high concentrations of starch. The wheat starch-aliphatic polyester blend studied by
Lim et al. (1999) demonstrated excellent biodegradability. Soil burial tests revealed
complete biodegradation within eight weeks. All these properties make the blends ideal
as commodity biodegradable plastics.
2.2.2.4 Aliphatic-aromatic copolyesters(AAC) and Modified PET (Biodegradable
Polyesters: Packaging goes green (s.a.4); (Nolan-ITU, 2002)
http://www.plasticstechnology.com/articles/200209fa3.html, [2004, June 07]
31
Aliphatic-aromatic copolyesters have the biodegradable properties of aliphatic
polyesters with the mechanical properties of aromatic polyesters. For reduction of their
cost, AACs are often blended with TPS.
The properties of AACs, such as transparency, flexibility and anti-fogging performance,
are very close to those of the blow moulding low-density polyethylene. They meet the
requirements for film used in food wrapping of fruit and vegetables, with the advantage
of being compostable.
The rate of the biodegradation in soil or compost can be influenced by the composition
of the copolyester, moisture content, temperature, surface area and the method used to
manufacture the finished product. In an active microbial environment, the polymer
becomes invisible within 12 weeks. Commercial members of the family are Ecoflex F
from BASF AG and Eastar Bio Copolyester 14766 from Eastman Chemicals. These
copolyesters are based on butanediol, adipic acid and terephtalic acid. The Eastman
version is highly linear in structure, whereas BASF’s products have long-chain
branching.
Modified PET contains comonomers introducing ether, ester or amide groups. They
provide 'weak' linkages, susceptible to biodegradation via hydrolysis and following
enzymatic attack on these bonds. The modified PET materials include PBAT
(polybutylene adipate/terephthalate) and PTMAT (polytetramethylene adipate/
terephthalate). Specifically modified polymer can be created for a specific
biodegradable application, varying the comonomers used. In the semi-crystalline
category, Du Pont offers modified PET incorporating three different aliphatic monomers.
Biomax 6962 has a 1.35 g/cc density and a melting point of 195oC versus 250oC for
PET. The mechanical properties include high stiffness and can vary in elongation.
Dupont has targeted fast-food disposable packaging, waste tubes, agricultural film,
flower pots and bottles.

32
3 EXPERIMENTAL DETAILS
3.1 MATERIALS
Table 3.1: Raw materials and producers/suppliers
Raw material Grade Supplier/Producer
Starch Hi-Maize African Products
Dimer acid polyamides Euremelt 2138 Vantico AG/Supplier
Huntsman Advanced Materials/Producer
Linear polyamide
copolymer
Grilon BM 13 SBG
Natur
EMS
Polyvinylbutyral (PVB) Recycled material Vest Design Seven
Poly (ethylene-co-vinyl
acetate)
Elvax 210 Du Pont
Glycerol *CP Crest Chemicals
Polybutylene succinate
adipate (PBSA)
SGPE/ (film grade) SK Chemicals (Korea)
Urea *CP Obaru
Stearic acid *CP Protea Industrial Chemicals
Stearic alcohol *CP Protea Industrial Chemicals
Precipitated silica Vulcasil S Bayer
* CP = chemically pure
3.2 APPARATUS
Mixing:
A mixer was used for the mixing of the starch and the plasticiser. Figure 3.1 shows the
high-speed Papenmeier mixer used.

33
Procedure:
• Mix the starch and stearyl alcohol in a Papenmeier (TGHK 63) high-speed mixer.
• Slowly add water and glycerol to the mixture. The temperature should not exceed
65ºC.
• Mix for 20 minutes at the slow speed (ca. 1 200 r/min).
• Cool down to ambient temperature.
• Add the silica and mix for 1 minute.
Figure 3.1: Papenmeier mixer (K model)
Extrusion:
Starch mixes were gelled using a 25 mm single-screw laboratory extruder with an L/D
ratio of 25 (Figure 3.2). The conditioned TPS granules were used to prepare blends with
PVB and polyamides in the same laboratory extruder. The temperature profile along the
barrel was 105 – 120ºC at the feed section, 110 – 145ºC at the compression and
metering zones and ca. 100ºC at the die zone. The higher temperatures were required
for blends containing higher amounts of starch.
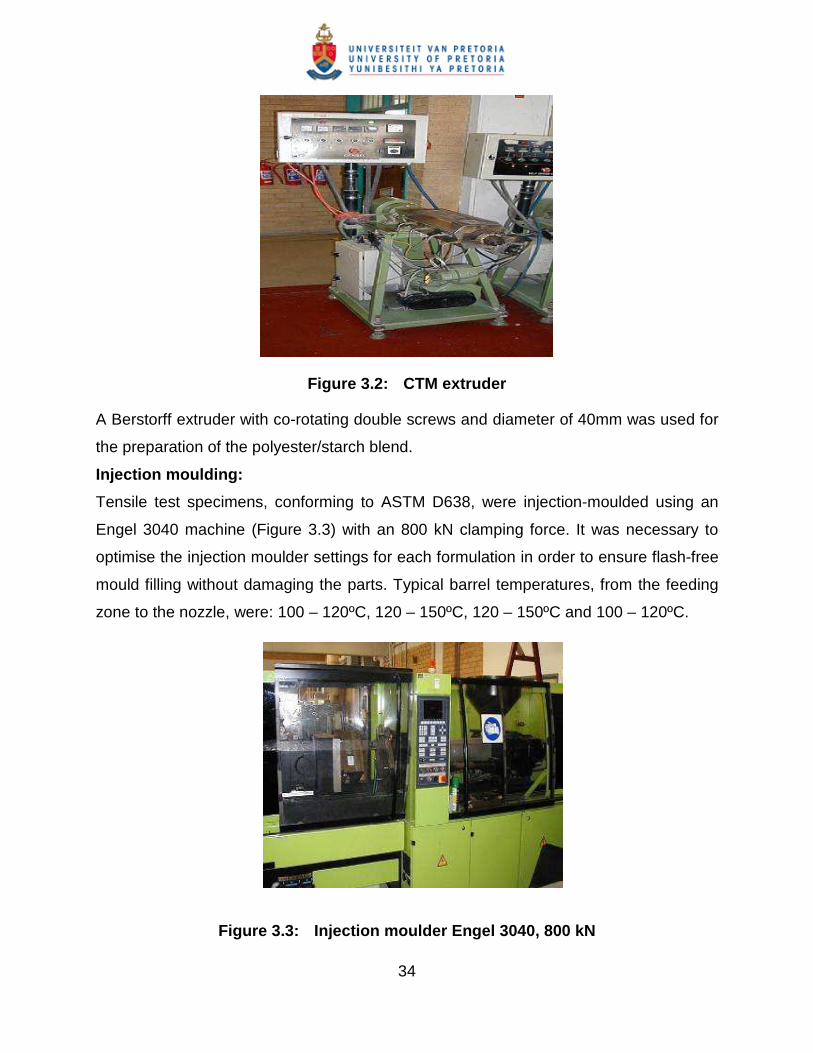
34
Figure 3.2: CTM extruder
A Berstorff extruder with co-rotating double screws and diameter of 40mm was used for
the preparation of the polyester/starch blend.
Injection moulding:
Tensile test specimens, conforming to ASTM D638, were injection-moulded using an
Engel 3040 machine (Figure 3.3) with an 800 kN clamping force. It was necessary to
optimise the injection moulder settings for each formulation in order to ensure flash-free
mould filling without damaging the parts. Typical barrel temperatures, from the feeding
zone to the nozzle, were: 100 – 120ºC, 120 – 150ºC, 120 – 150ºC and 100 – 120ºC.
Figure 3.3: Injection moulder Engel 3040, 800 kN

35
Moisture analysis:
Moisture analyser model: Mettler LP16 balance was used for determining the moisture
in the specimens.
Humidity cupboard:
• The samples were aged in a Labcon Humidity Cupboard at 60% ℜH and 30ºC.
• For low relative humidity, desiccators filled with P2O5 were used.
• For the compostability tests, a Labcon Humidity Cupboard at 60% ℜH, 30ºC was
used
X-Ray Diffraction (XRD):
An automated Siemens diffractometer was used (Table 3.2).
Table 3.2: Settings of the Siemens D-501 automated diffractometer
Instrument Siemens D-501
Radiation Cu Kα (1.542 A)
Temperature 25ºC
Specimen Flat-plate, rotating
(30 r/min)
Power Settings 40 kV, 40 mA
Soller slits 2ºC (diffracted beam side)
Divergence slits 1ºC
Receiving slits 0.05ºC
Monochromator Secondary, graphite
Detector Scintillation counter
Range of 2θ 5-70º2θ
Step width 0.04º2θ
Time per step 1.5 s
36
Scanning Electron Microscope (SEM):
Low magnification scanning electron microscopy (SEM) images of gold-coated samples
of the fracture surfaces were obtained on a JEOL 840 SEM.
3.3 TEST METHODS
The main international organisations that have established standards for biodegradation
are:
• American Society for Testing and Materials (ASTM)
• European Standardization Committee (CEN)
• International Standards Organization (ISO)
• Institute of Standards Research (ISR)
• German Institute for Standardization (DIN)
• Organic Reclamation and Composting Association (ORCA) (Belgium) (Phillips,
1998; Technical committee standards list (s.a.9)
http://www.iso.ch/iso/en/stddevelopment/tc/tclist, [2004, March 4].
3.3.1 Tensile testing
Standards for the tensile properties of plastics:
• ASTM D 638
• DIN 53441
• DIN 53444
• DIN 53452 (Phillips, 1998; Technical committee standards list (s.a.8)
http://www.iso.ch/iso/en/stddevelopment/tc/tclist, 2004, March 4).
The test method used in this evaluation was ASTM D 638. The tensile testing was done
for two different conditions of aged samples: 0% ℜH, ambient temperature, and 60%
ℜH, 30ºC. The tensile tests were performed at a speed of 50 mm/min on a Lloyd
machine.

37
The tensile strength, elastic modulus and work-to-break give an indication of the
brittleness of the composition, but this is best evaluated from the elongation at break
(strain) of the specimen.
Tensile testing is a common technique used to determine the mechanical properties of
materials. In this case the aspects of importance were:
Tensile stress:
Ao
F=σ
Where σ = tensile stress in Pa
F = tensile force in N
Ao = the original cross-section (of the unloaded specimen) in m2.
Strain (elongation at break):
lo
l∆=ε
Where ε = elongation at break
lo = original length (of the unloaded specimen) in m
=∆l change in length of the loaded specimen at failure.
Modulus of elasticity:
Hooke’s law provides the simplest relationship between stress and strain:
Eσ ε=
E is known as “Young’s modulus”
The graphs of the TPS and TPS blends do not show the presence of yield stress, which
is the onset of plastic deformation, typical of most conventional plastics (Figure 3.4).

38
Figure 3.4: Stress-strain curve for traditional semi-crystalline thermoplastics
(Cheremisinoff, 1993)
In contrast to traditional plastics, starch plastics have only continual plastic deformation
prior to failure, with no region of elastic deformation (Figure 3.5: Meadows, 1998).
Figure 3.5: Stress-strain curve for thermoplastic starch (TPS)
(Meadows, 1998)
39
3.3.2 X-ray diffraction (XRD) analysis
The diffraction of X-rays by matter is a method that has been applied to crystalline
materials. X-rays can be described as waves of electromagnetic radiation of short
wavelengths and high energy. The range is from 10-4 nm to 10 nm. The X-rays used in
diffraction are in the region of 0.05 to 0.25 nm (visible light = 600 nm) (Skoog & Leary,
1992).
When X-rays interact with the matter they are scattered. In a crystal, the scattering
centres or atoms are located at fixed distances and distributed in a regular way. The
diffraction angles (θ) are related to the interplanar distance of the crystal sheets. When
we use an X-ray with a known wavelength and have the angle of the incident beam θ,
then d (the distance between successive planes), can be determined by the Bragg’s
equation:
2d= nλ/sinθ
Where θ = the angle of the incident beam with the crystal surface
n = an integer
λ = the wavelength of the incoming X-ray
d = the interplanar distance in the crystal, which is characteristic for each
crystal matter (Skoog & Leary, 1992; Jenkins, Gould & Gedcke, 1981;
Williams, 1987).
3.3.3 Compostability
Standards for the compostability of plastics (see Table 3.3) include:
• ASTM G-160
• ASTM D-5338
• ISO 846
• ISO 14855
• ISO 14852

40
• CEN 13432
• DIN V 54 900
(ASTM D 5338, 1992; ISO 846, 1978; ASTM G 160, 1998; ASTM G 160 (s.a.3),
http://www.astm.org, [2004, March 4].
The ASTM defines biodegradable as ”capable of undergoing degradation into carbon
dioxide, methane, water, inorganic compounds or biomass in which the predominant
mechanism is the enzymatic action of microorganisms, which can be measured by
standardized tests in a specified period of time, reflecting available disposal conditions”
It is important that the time limit be specified.
A polymer is ‘compostable’, when it is biodegradable under composting conditions or
conditions in which:
The polymer chains break down under the action of microorganisms (bacteria, fungi,
algae).
Total mineralisation is obtained (conversion into CO2, H2O, inorganic compounds
and biomass under aerobic conditions).
The mineralisation rate is high and is compatible with the composting process.
Those materials that have a degree of biodegradation equivalent to that of cellulose
(maximum permissible tolerance 5%) are considered to meet the compostability criteria.
According to ASTM D-5338, for biodegradable plastic materials to be acceptable in
composting plants, both biodegradability and disintegration are important. Disintegration
is the physical falling apart of the biodegradable plastic material, or more precisely of
the product that has been made from it, into fine visually indistinguishable fragments at
the end of a typical composting cycle.

41
Table 3.3: Biodegradability standards requirements (Nolan-ITU, 2002)
Standard Biodegradation Requirements
DIN V 54 900 60 wt% 6 months
ASTM D 5338 60 wt% 6 months
CEN 13432 90 wt% 6 months
OECD 207 60
wt%(chemicals)
28 days
The test method used in this evaluation was ASTM D-160: Standard Practice for
Evaluating Microbial Susceptibility of Non-metallic Materials by Laboratory Soil Burial.
This method was chosen over the rest owing to the simplicity of the apparatus used and
because it simulates what happens to a material when buried.
A soil container with a depth of at least 12.7 cm should be used. The external
environment should consist of apparatus able to maintain a temperature of 30 ± 2ºC and
85 to 95% ℜH. A Labcon Humidity Cupboard set at 30ºC was used.
Test specimens should have the shape and size of tensile test specimens. According to
the standard, a minimum of three must be used. The exposure period for soil burial
must be a minimum of 60 days.
Microbiological susceptibility may be evaluated through:
1. Visual observation. Digital pictures were taken throughout the period of 60 days
and more detailed observations were performed with the SEM.
2. Microbial staining can be evaluated as follows:
None – 0
Trace (less than 10% coverage) – 1
Light (10 to 30% coverage) – 2
Moderate (30 to 60% coverage) – 3
Heavy (60% to complete coverage) – 4
42
3. Property changes – Tests for physical and mechanical changes, such as tensile
strength, flexibility and weight loss, or other tests may be performed as described
in appropriate ASTM or other test methods. Tests must be conducted on both
unexposed and exposed specimens for the purpose of comparison in
determining the extent of microbial degradation of the test material.
For calculating the change in property for each replicate specimen, one of the following
equations can be used:
,, e ie i oC X X= −
Where Xe,I = the measured property of each exposed specimen
Xo = the mean of the property from initial measurements on unexposed
specimens.
The following equation can be used to determine the mean value of a property change:
∑=
=n
iieC
nC
1,
1
Where n = number of exposed specimens.
The following equation can be used to determine the standard deviation in a property
change (Van Soest et al., 1996c):
∑=
−−
=n
iiC CC
nS
1
2)()1(
1
43
3.4 PLANNING
3.4.1 Seedling tubes
Details of this part of the study are given in Sita et al. (2006) and are summarised here.
Blends of TPS and recycled PVB from automotive windscreens were investigated.
Mechanically compatible blends are formed at low to intermediate starch content.
However, SEM and DMA revealed that all the blend compositions investigated had a
phase-separated nature. The tensile properties are negatively affected by ageing in a
high-humidity environment and they deteriorate rapidly when the samples are soaked in
water. However, synergistic property enhancement was observed for a compound
containing 22 wt% TPS. It featured a higher tensile strength, shows better water
resistance and is significantly less affected by ageing. The work-to-break in tensile
mode was significantly higher. This is attributed to plastic deformation of the lower-
modulus matrix polymer near the interface with the stiffer starch-rich domains.
TPS with high amylose content yielded the best tensile properties during ageing and
was least prone to shrinkage and cracks, which was why it was chosen for further work.
Table A1 from Appendix A provides information on the sample compositions chosen for
evaluation in this study based on Sita’s (2007) results.
The three different compositions incorporating TPS Hi-Maize are given in Appendix A,
Table A1. They were called TPS Eu, TPS EMS and TPS PVB. Hi-Maize and Stygel
blends, containing 15 wt% glycerol, were prepared and blended with Euremelt 2138 (a
polyamide derived from renewable resources) and EMS polyamide. The use of recycled
PVB as TPS blend component is advantageous as it reduces the cost of the blend,
which is a major stumbling block in the use of biodegradable materials as the
polyamides. PVB further improves the mechanical properties, facilitates the moulding of
TPS and also improves the material’s water resistance. The compositions studied were:
• TPS Eu: 80 wt%TPS (15 wt% G) + 20 wt% Euremelt 2138 + 2 wt % urea
• TPS EMS: 80 wt%TPS (15 wt% G) + 20 wt% EMS + 2 wt% urea
• TPS PVB: 78 wt% TPS (30 wt% G) + 22 wt% PVB + 3 wt% EVA + 2 wt% urea

44
TPS 15 wt% glycerol and 30 wt% glycerol were also studied.
• TPS 15G containing 15 wt% glycerol was prepared with 15 wt% water, 3 wt%
silica, 1 wt% stearic alcohol and 66 wt% Hi-Maize.
• TPS 30G containing 30 wt% glycerol was prepared with 5 wt% water, 3 wt%
silica, 1 wt% stearic alcohol and 61 wt% Hi-Maize.
An effort was made to incorporate urea as plasticiser in the compositions, with the
purpose of aiding the biodegradation process. It was found that urea is not a very good
plasticiser since there was a tendency for these compositions to block the extruder,
which was followed by gas evolution and spitting of the material through the die.
Thermal degradation was occurring, which was probably the reason for the gas
build-up. Even when the temperature was reduced and a smooth extrudate obtained,
the injection-moulded test specimens were brown in colour and smelled burnt.
3.4.2 Golf tees
Looking for brittleness in the compositions, it was first attempted to use starch with a
high amylopectin fraction, called Stygel. It was expected that the higher amylopectin
content would increase Tg, thus lowering the flexibility of the material. The attempt to
use a blend of Euremelt 2138 and Stygel starch is illustrated in Figure 3.6. Different
ratios of Euremelt 2138 to Stygel were investigated, namely 25:75, 50:50 and 75:25.
The Euremelt 2138 was added at different percentages (from 5, 7 up to 10 wt%) to the
blends. Addition of more than 10 wt% was judged uneconomical for this application. The
ageing of the specimens revealed crack formation caused by the retrogradation of the
amylopectin. Unfortunately, even modest addition levels of Stygel to Euremelt 2138
(25:75) resulted in products that showed severe retrogradation. It was decided not to
pursue studies on the properties of Stygel blends any further.
Promising results were achieved with blends based on TPS Hi-Maize starch and
biodegradable polyester. Polybutylene succinate-adipate (PBSA) with the trade name
of Sky Green Polyester SG 200 (Film Grade/FG) (SGPE) was used for the golf tees

45
applications. The two compositions contained the following ingredients (Appendix A,
Table A1):
• 50 wt% SGPE(FG) + 20 wt% urea +20 wt% Hi-Maize starch + 10 wt% stearic
acid. For simplicity this composition is named U20/Hi20. (Table A1, sample 1
and 2)
• 50 wt% SGPE(FG) + 40 wt%urea + 10 wt%stearic acid. For simplicity this
composition is named U40. (Table A1 sample 3 and 4)
For the compostability tests each of the above mentioned samples were injection
moulded in dumb bell and golf tee shapes.
Figure 3.6: Cracked tensile specimens, incorporating Stygel and Euremelt 2138
in different proportions

46
4 RESULTS AND DISCUSSION
4.1 TENSILE TESTING
The results of the extrusion, injection moulding and tensile testing are given in
Appendices A, B and C.
4.1.1 Seedling tubes compositions
All compositions were aged and tested at 60% ℜH, 30°C and 0% ℜH, 25°C.
Figure 4.1: Tensile strength of seedling tubes compositions at 60% ℜℜℜℜH and 0%
ℜℜℜℜH
TPS Eu and TPS EMS showed a very slight increase in tensile strength at 60% ℜH,
30°C, while the rest of the samples (TPS 15G, TPS 30G and TPS PVB) showed nearly
constant strength for the period of 30 days (Figure 4.1). This concurs with the findings of
Van Soest and co-workers (1996a,b,c) for materials made from potato starch and aged
at 60% ℜH. They found that there was only a slight increase in B-type crystallinity,
leading to a slight increase in the tensile stress and E-modulus, while the elongation at
break decreases (Figures 4.2, 4.3 and 4.4).
0
5
10
15
20
25
30
0 5 10 15 20 25 30Time in Days
Ten
sile
Stren
gth
, M
Pa .
TPS Eu
TPS EMS
TPS PVB
TPS 30G
TPS 15G
60% RH, 30 C
0
5
10
15
20
25
30
0 5 10 15 20 25 30Time in Days
Ten
sile
Strength
, M
Pa .
TPS Eu
TPS EMS
TPS PVB
TPS 15G
TPS 30G
0% RH, 25 C

47
Figure 4.2: Young’s modulus seedling tubes compositions at 60% ℜℜℜℜH and 0%
ℜℜℜℜH
Figure 4.3: Elongation at break for seedling tube compositions at 60% and 0% ℜℜℜℜH
1
10
100
1000
0 5 10 15 20 25 30
Time in Days
Yo
un
g's
Mo
du
lus,
MP
a .
TPS EuTPS EMSTPS PVB TPS 30G TPS 15G
60% RH, 30 C
1
10
100
1000
0 5 10 15 20 25 30Time in Days
You
ng's
Mod
ulus
, MP
a .
TPS Eu
TPS EMS
TPS PVB
TPS 15G
TPS 30G
0% RH, 25 C
1
10
100
1000
0 5 10 15 20 25 30Time in Days
Elo
nga
tion a
t bre
ak, %
.
TPS Eu
TPS EMS
TPS PVB TPS 15G
TPS 30G
0% RH, 25 C
1
10
100
1000
0 5 10 15 20 25 30
Time in Days
Elo
ngatio
n a
t bre
ak,
% .
TPS Eu
TPS EMS
TPS PVB
TPS 30G
TPS 15G
60%RH, 30 C

48
Figure 4.4: Work-to-break for seedling tube compositions at 60% and 0% ℜℜℜℜH
An increase in the moisture content at the end of the 30 days was noted for the TPS
15G and TPS 30G. The rest of the compositions lost moisture over the ageing period
(Figure 4.5 and Table 4.1).
Figure 4.5: Moisture content in TPS 15G and TPS 30G at 60% ℜℜℜℜH, 30°°°°C and 0%
ℜℜℜℜH, 25°°°°C
0
2
4
6
8
10
12
14
16
0 5 10 15 20 25 30Time in Days
Wor
k to
bre
ak,
JTPS Eu
TPS EMS
TPS PVB
TPS 30G
TPS 15G
60% RH, 30 C
0
2
4
6
8
10
12
14
16
0 5 10 15 20 25 30Time in Days
Work
to B
reak
, J .
TPS Eu
TPS EMS
TPS PVB
TPS 15G
TPS 30G
0% RH, 25 C
0
1
2
3
4
5
6
7
0 10 20 30
Days
Mo
istu
re,
%.
TPS15G 60%RH
TPS15G 0%RH
TPS30G 60%RH
TPS30G 0%RH

49
Although all samples increased in tensile strength within these 30 days, when aged at
0% ℜH, the tensile strength of the TPS 15G increased by nearly three times – from 9
MPa to 23 MPa. The samples containing EMS revealed better tensile strength than the
ones made from Euremelt 2138, but both blends had lower strength than the TPS 15G.
A decrease in the moisture content was observed for all samples aged at 0% ℜH. This
could be linked to the much higher increase of the tensile strength under these
conditions in comparison with the ageing at 60% ℜH, 30ºC (Figure 4.5 and Table 4.1).
The Young’s modulus followed a similar pattern to the tensile strength behaviour. It
increased when the ageing conditions were changed from 60% ℜH, 30ºC to 0% ℜH,
25ºC.
The elongation at break is very slightly reduced within the ageing period, at 60% ℜH,
30ºC. This slight reduction was observed by Van Soest and co-workers as well (1996
a,b,c) and is explained by the very low amount of B-crystallinity forming under these
conditions.
The reduction of elongation at break is more prominent at 0% ℜH. This could be due to
the fact that water, acting as a plasticiser, is lost under the drying conditions. This is
very common behaviour for TPS and we can see it here in TPS 15G and the two
compositions made from it. At the end of the 30-day period, TPS Eu and TPS EMS
showed elongations at break almost equal to that of the TPS 15G.
The characteristic reduction in the elongation between day 5 and day 10 for TPS 15G
and TPS 30G is probably connected with the reorganisation of the molecular structures
and moisture loss, while after day 15 an equilibrium is reached.

50
Table 4.1: Moisture content during ageing of seedling tubes and golf tees
Samples/
Moisture, wt% Day 1 Day 7 Day 14 Day 30 Comment
60% ℜH, 30ºC
TPS Eu 3.77 - - 2.30 ↓
TPS EMS 3.44 - - 2.19 ↓
TPS PVB 5.32 - - 4.04 ↓
TPS 15G 2.81 2.38 2.79 3.28 ↑ (x1.2)
TPS 30G 4.01 6.34 6.30 6.53 ↑ (x1.6)
U20/Hi20 1.38 1.15 1.36 1.17 ↓
0% ℜH
TPS Eu 3.77 - - 0.61 ↓ (x6.2)
TPS EMS 3.44 - - 1.0 ↓ (x3.4)
TPS PVB 5.32 - - 1.05 ↓ (x5.1)
TPS 15G 2.81 2.25 1.30 0.90 ↓ (x3.1)
TPS 30G 4.01 3.95 2.90 1.46 ↓ (x2.7)
U20/Hi20 1.48 1.12 0.98 0.69 ↓ (x2.1)
*An arrow down ↓ shows a decrease and an arrow up ↑ an increase in moisture content
The behaviour of TPS 30G at 0% ℜH is interesting. It showed much higher moisture
losses (Figure 4.5) than TPS 15G. It has higher plasticiser content and shows lower
tensile stress but higher elongation at break compared to TPS 15G.
At 60% ℜH, 30°C, more work to break was needed for the TPS Eu, TPS EMS at the
end of the 30 days ageing than at the beginning. For the TPS PVB and TPS 30G the
work to break at the beginning and the end of the tests stayed low and was reduced
almost by half.
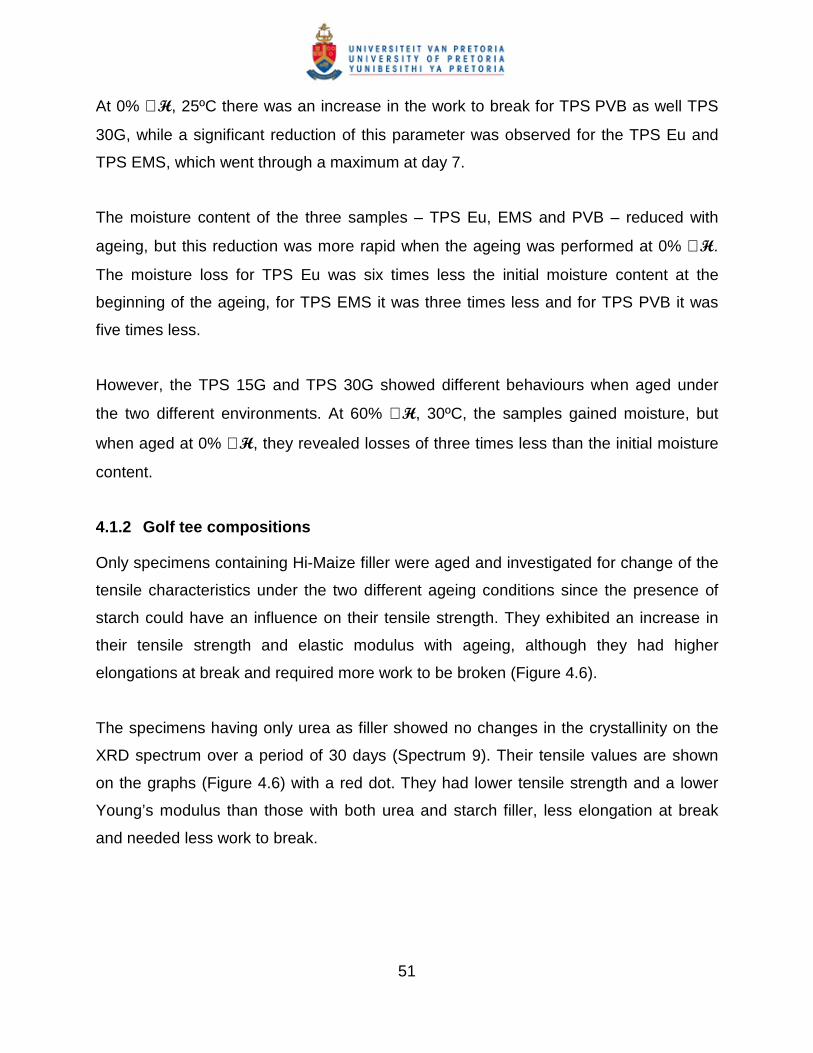
51
At 0% ℜH, 25ºC there was an increase in the work to break for TPS PVB as well TPS
30G, while a significant reduction of this parameter was observed for the TPS Eu and
TPS EMS, which went through a maximum at day 7.
The moisture content of the three samples – TPS Eu, EMS and PVB – reduced with
ageing, but this reduction was more rapid when the ageing was performed at 0% ℜH.
The moisture loss for TPS Eu was six times less the initial moisture content at the
beginning of the ageing, for TPS EMS it was three times less and for TPS PVB it was
five times less.
However, the TPS 15G and TPS 30G showed different behaviours when aged under
the two different environments. At 60% ℜH, 30ºC, the samples gained moisture, but
when aged at 0% ℜH, they revealed losses of three times less than the initial moisture
content.
4.1.2 Golf tee compositions
Only specimens containing Hi-Maize filler were aged and investigated for change of the
tensile characteristics under the two different ageing conditions since the presence of
starch could have an influence on their tensile strength. They exhibited an increase in
their tensile strength and elastic modulus with ageing, although they had higher
elongations at break and required more work to be broken (Figure 4.6).
The specimens having only urea as filler showed no changes in the crystallinity on the
XRD spectrum over a period of 30 days (Spectrum 9). Their tensile values are shown
on the graphs (Figure 4.6) with a red dot. They had lower tensile strength and a lower
Young’s modulus than those with both urea and starch filler, less elongation at break
and needed less work to break.

52
Figure 4.6: Tensile properties of golf tees compositions at 60% and 0% ℜℜℜℜH
10
11
11
12
12
13
13
14
14
0 5 10 15 20 25 30
Time in Days
Ten
sile
Str
engt
h, M
pa .
60% RH U20/Hi20
0% RH U20/Hi20
60% RH U40
0
50
100
150
200
250
300
350
0 5 10 15 20 25 30
Time in DaysY
oung
's M
odul
us, M
Pa
.
60% RH U20/Hi20
0% RH U20/Hi20
60% RH U40
0
1
1
2
2
3
3
0 5 10 15 20 25 30Time in Days
Wor
k to
bre
ak, J
60% RH U20/Hi20
0% RH U20/Hi20
60% RH U400
2
4
6
8
10
12
0 5 10 15 20 25 30
Time in Days
Elo
ngat
ion
at b
reak
, %.
RH 60% U20/Hi20
RH 0% U20/Hi20
RH 60% U40

53
For the starch blends with Hi-Maize as filler it was interesting to see the influence of
moisture content on the tensile properties (Figure 4.7). Up to day 7 both samples aged
under different conditions had reduced moisture content. For the samples studied under
0% ℜH, the moisture content continued to reduce after day 7, whereas for those aged
at 60% ℜH an increase in the moisture was initially observed, and then a steady
reduction after day 15.
0
0.2
0.4
0.6
0.8
1
1.2
1.4
1.6
0 5 10 15 20 25 30Days
Moi
stur
e, %
.
SGPE 20U/20HI RH60
SGPE 20U/20HI RH0
Figure 4.7: Moisture change in starch-filled golf tees compositions over 30 days
4.2 XRD RESULTS
4.2.1 Seedling tubes compositions
There are a total of 11 spectra, all displayed in Appendix D – XRD data.
The diffractograms were used to study the changes in the material in a more qualitative
way, according to the sharpness and the size of the crystallinity peaks. Quantitative
determination of the crystallinity was not the aim of this study.

54
Spectrum D1 is a spectrum of Virgin Hi-maize starch from 5-70 2θ. Starch is a
semi-crystalline polymer and it has three crystalline peaks, which appear around 2θ=17
- 22º.
Spectrum D2 shows the spectra for TPS Eu and each of the raw materials incorporated
into this composition. TPS Eu is much more crystalline than the amorphous
Euremelt 2138, which has a broad amorphous peak at 2θ=19.5º. Three sharp peaks
appear at 2θ=19.5º, 2θ=12.5º and 2θ=22.5º.
Spectrum D3 shows the spectra for TPS EMS and each of the raw materials
incorporated into the composition. TPS EMS has more crystallinity or sharper peaks
compared with the amorphous EMS. The three crystalline peaks observed for TPS Eu
appear here as well.
Spectrum D4 shows the spectra for TPS PVB and each of the raw materials
incorporated into the composition. As with TPS Eu and TPS EMS, the spectrum of the
third sample of TPS PVB has very much the same peaks.
In Spectra D2, D3 and D4, the raw materials show different amounts of crystallinity of
the polymers involved in the blends. The highest crystallinity is observed for TPS EMS,
with a peak at θ=21º, while TPS PVB and Euremelt display wide amorphous peaks at
θ=19.5º.
The spectra for TPS 15G and TPS 30G show some broad crystalline peaks at 2θ=12.5º
and 2θ=19.5º.
Spectrum D5 shows the spectra for TPS Eu, EMS and PVB, as well TPS 15G and TPS
30G, aged at 60% ℜH, 30ºC. The samples were aged for a period of 30 days at 60%
ℜH, 30ºC to check if there would be changes.

55
Spectrum D6 shows the spectra for TPS Eu, EMS and PVB aged at 0% ℜH.
Characteristic shifts in the spectra of TPS 30G and TPS PVB, which are made from
TPS 30G, were observed when the ageing was done at 0% ℜH. Spectrum D7 combines
Spectrum D5, when the samples were aged at 60% ℜH, and Spectrum D6, when the
samples were aged at 0% ℜH.
The three blends – TPS Eu, EMS and PVB – have similar crystallinity characteristics
(spectra), which do not change significantly with a change in the ageing conditions from
dry to humid. A shift in the spectra of TPS 30G and the blend with PVB, when aged at
0% ℜH, is observed. Virgin EMS appears to be more crystalline than virgin PVB and
Euremelt 2138. This is why the blend of Hi-Maize with Virgin EMS shows more
crystalline behaviour.
4.2.2 Golf tee compositions
Spectrum D8 shows the spectrum for U40. The 40 wt% urea used as filler forms a
complex with SGPE, having two groups of crystalline peaks at 2θ=19.5º/
20.5º/21.5º/22.5º and 2θ=25º/26.5º/27.5º.
Spectrum D9 shows the ageing of the specimens containing 20 wt% urea and 20 wt%
Hi-Maize over 30 days. No changes were observed during the ageing at days 1, 7, 14
and 30. At 2θ=19.5º/21.5º/22.5º, the peak at 2θ=20.5º is much smaller. The peaks in the
second group appear to be much smaller in size at 2θ=25º/26.5º/27.5º, which is an
indication that the crystallinity has been reduced by the addition of starch.
Spectrum D10 combines Spectrum D8 of U40 and Spectrum D9 of U20/Hi20.
Overlapping the two spectra clearly shows the difference in the crystallinity, with greater
crystallinity being achieved when only urea was used as filler.
Spectrum D11 gives an indication of the raw materials involved in the composition
U20/Hi20.
56
4.3 COMPOSTABILITY
4.3.1 Seedling tubes compositions
The results of the compostability tests and the viability control are presented in
Appendix E. The compostability was studied according to the test method ASTM G160.
An inoculum was collected from Weltevreden composting municipal grounds at
Brakpan. The mixture was aged for three months, as well as resifted on a regular basis
through a mesh screen. The viability control for the tensile strength of untreated cotton
cloth of 400 to 475 g/m2 had a loss of 55 wt% strength, which complied with the
standard requirement.
The pH of the soil was tested at the beginning and at the end of the test and showed no
significant changes over the testing period. One part by weight of soil was mixed with 20
parts by weight of water. The mixture was shaken, allowed to settle and after one hour,
the reading was taken.
The moisture content was kept between 20 and 30 wt% and measured at 105°C with a
moisture analyser. Table 11 in Appendix E shows the changes in the moisture content
of the soil. The two soil containers were made of HDPE. To be able to keep the
temperature at 30 ± 2 °C, a Labcon humidity chamber was used. It was supplied with a
saturated solution of K2SO4, acting as a humidity stabilise (RH calibration with saturated
salts (s.a.10) http://www.natmus.dk/cons/tp/satsit/satsalt.htm, [2007, January 29];
Equilibrium Relative Humidity (s.a.11)
http://www.omega.com/temperature/Z/pdf/z103.pdf, [2007, January 29]).
From three to five standard tensile test specimens were buried in the soil. The
properties of the samples were studied for 60 days at days 0, 7, 14, 30, 45 and 60. Care
was taken when removing the test specimens not to disturb the soil bed, which could
affect the growth of soil microbes and cause inconsistent results.

57
The visual observations at the beginning and the end of the exposure period are
reflected in Figure 4.8 below.

58
Figure 4.8: Visual observations of seedling tubes compositions at day 0 and
day 60 of the composting
Day 0 Day 60
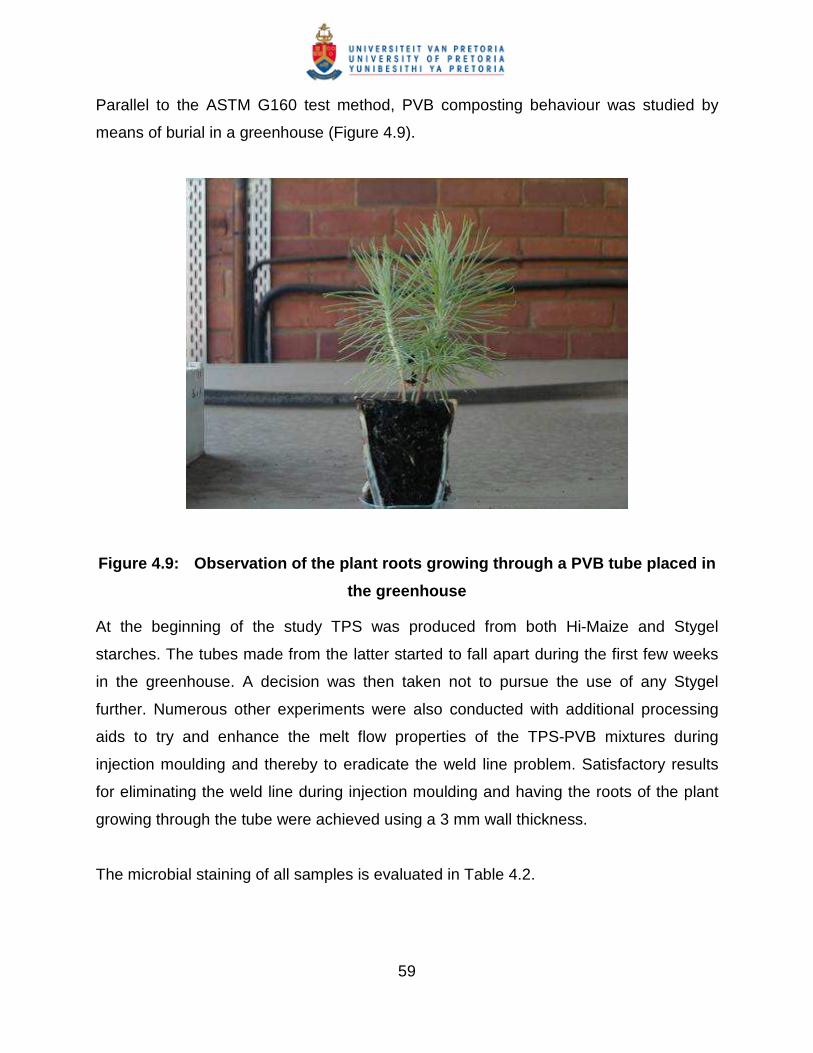
59
Parallel to the ASTM G160 test method, PVB composting behaviour was studied by
means of burial in a greenhouse (Figure 4.9).
Figure 4.9: Observation of the plant roots growing through a PVB tube placed in
the greenhouse
At the beginning of the study TPS was produced from both Hi-Maize and Stygel
starches. The tubes made from the latter started to fall apart during the first few weeks
in the greenhouse. A decision was then taken not to pursue the use of any Stygel
further. Numerous other experiments were also conducted with additional processing
aids to try and enhance the melt flow properties of the TPS-PVB mixtures during
injection moulding and thereby to eradicate the weld line problem. Satisfactory results
for eliminating the weld line during injection moulding and having the roots of the plant
growing through the tube were achieved using a 3 mm wall thickness.
The microbial staining of all samples is evaluated in Table 4.2.

60
Table 4.2: Estimation of microbial staining for all samples (ASTM G160)
Observed growth or stain Rating* Material Observation/Comment
None 0
Trace (less than10% coverage) 1 U20/Hi20 Yellow/brownish staining
Light (10 to 30% coverage) 2 U40 Yellow/brownish staining
Moderate (30 to 60%coverage) 3 Black growth
Heavy (60 % to complete coverage) 4 TPS Eu/
EMS/PVB Heavy black growth
* Rating according to ASTM G160
Property changes such as tensile strength, flexibility and weight loss are shown in
Table 4.3 and Figure 4.10. The seedling tubes and golf tees samples have close to
100% reduction in tensile strength and Young’s modulus, which is satisfactory.
Table 4.3: Changes in tensile strength
Note: The negative sign in front of the change in the properties indicates reduction in
the property at the end of the testing period. The positive sign indicates an increase
in the property at the end of the testing period.
Tensile strength
(MPa)
Day 0 Day 60 Difference Change in
property
(%)
Standard
Deviation
TPS Eu 6.5 0.0004 -6.5 -100 0
TPS EMS 10.4 0.0011 -10.4 -100 0
TPS PVB 1.3 0.0017 -1.3 -100 0
U20/Hi20 12.4 0.0040 -12.4 -100 0
U40 11.2 0.0021 -11.2 -100 0

61
0
2
4
6
8
10
12
14
0 10 20 30 40 50 60
Time in Days
Ten
sile
Str
engt
h, M
pa .
TPS Eu
TPS EMS
TPS PVB
TPS 15G
TPS 30G
0
50
100
150
200
250
300
0 10 20 30 40 50 60Time in Days
Mod
ulus
, MP
a TPS Eu
TPS EMS
TPS PVB
TPS 15G
TPS 30G
0
10
20
30
40
50
60
70
0 10 20 30 40 50 60Time in Days
Elo
ngat
ion
at b
reak
, % .
TPS Eu
TPS EMS
TPS PVB
TPS 15G
TPS 30G
0
1
2
3
4
5
6
7
8
9
0 10 20 30 40 50 60
Time in Days
Wor
k to
bre
ak, J TPS Eu
TPS EMS
TPS PVB
TPS 15G
TPS 30G
Figure 4.10: Tensile properties of seedling tubes compositions under controlled
composting conditions

62
It must be mentioned that samples of TPS 15G and TPS 30G were not able to undergo
tensile testing after day 7 since they had disintegrated into pieces and could be
regarded as biodegradable straight away.
Table 4.4: Changes in elongation at break
It is interesting to note the change in the elongation at break (Table 4.4). For the
seedling tubes there is a reduction in the initial property for TPS Eu and TPS PVB.
Such a reduction was expected for TPS EMS as well since the XRD crystallinity of the
three samples is comparable. Contrary to expectations, however, there was an increase
in the elongation at break from 28% to 39%. Unfortunately, this composition has to be
disregarded for future use and biodegradability tests for seedling tubes compositions
since such toughening in the material does not bring about fast biodegradation.
The reductions in the elongation at break for TPS Eu and TPS PVB were respectively
18% and 79%. TPS PVB, which had the highest reduction in the elongation at break,
qualifies as the ‘winning’ composition among all three compositions tested for seedling
tubes, although a residual elongation of 8% was still recorded on the final day of testing.
This was regarded as satisfactory since the customer had requested that the tubes
should have some strength, enough to keep them intact up to three months after they
had been planted in the soil.
The optical microscopic photos of TPS EMS show much more homogeneous blending
between TPS 15G and EMS than with PVB or Euremelt 2138 (Figure 4.11).
Elongation at break
(%)
Day 0 Day 60 Difference Change
in property
(%)
Standard
Deviation
TPS Eu 28.2 22.9 -5.3 -18.4 9.0
TPS EMS 28.3 39.0 10.7 37.9 18.5
TPS PVB 43.1 8.9 -34.2 -79.3 3.0
U20/Hi20 6.8 6.7 -0. 1 0.1 0.9
U40 5.8 3.8 -2.0 34.2 0.9

63
Figure 4.11: Optical microscopy results of TPS Eu (top left), TPS EMS (top right)
and TPS PVB (bottom) at a magnification of x40
The results from the optical microscopy revealed homogeneity in the blends of TPS
EMS and phase separation for TPS Eu and TPS PVB. Such homogeneity for TPS PVB
has been confirmed by DMTA by Sita et al. (2006). It is concluded that at low TPS
loadings, starch-rich domains act as physical reinforcements for the PVB matrix. The
loss in mechanical properties above the 50 wt% TPS content is ascribed to the starch
phase becoming the continuous phase (Sita et al., 2006).
4.3.2 Golf tees compositions
4.3.2.1 Visual observation, at the end of the exposure period
Figures 4.12 and 4.13 show visually the state of the golf tees at the beginning and end
of the exposure period, and Figure 4.14 shows the tensile strength properties of the golf
tees compositions under controlled composting conditions

64
Figure 4.12: Visual observation of golf tees compositions U20/Hi20 at day 0 and
day 60 of the composting
Day 0 Day 60

65
Figure 4.13: Visual observation of golf tees compositions U40 at day 0 and day 60
of the composting
Day 0 Day 60
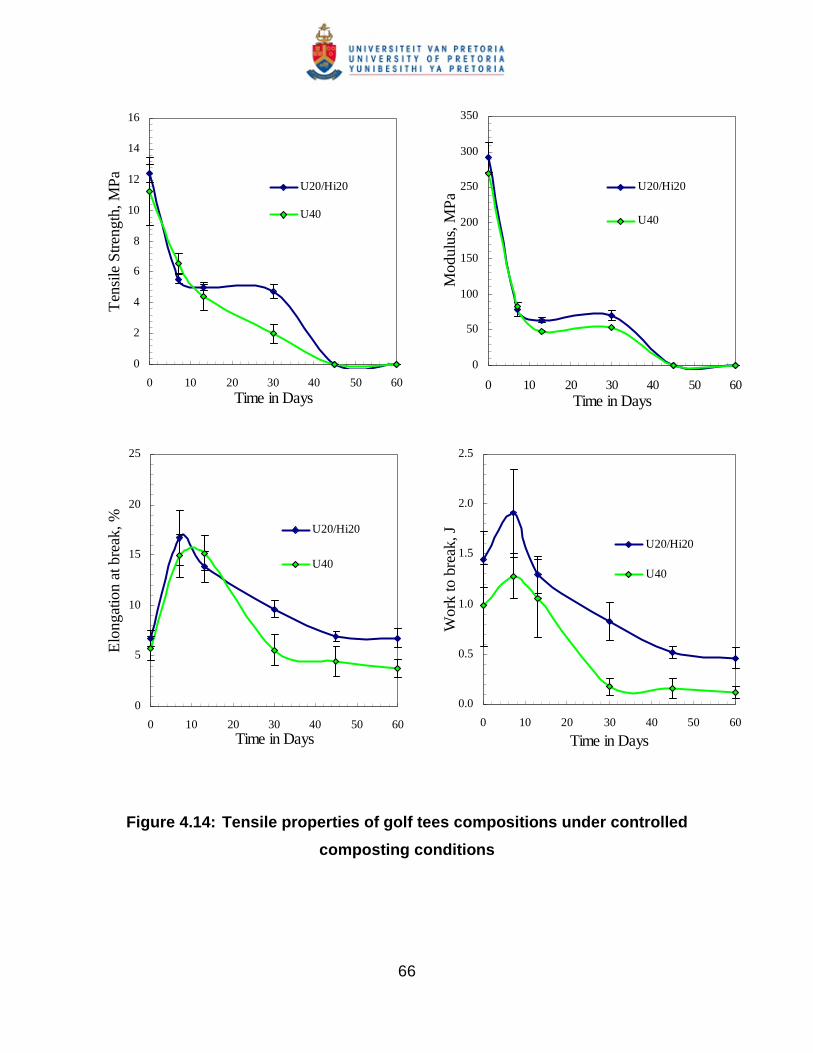
66
0
2
4
6
8
10
12
14
16
0 10 20 30 40 50 60Time in Days
Ten
sile
Str
engt
h, M
Pa
.
U20/Hi20
U40
0
50
100
150
200
250
300
350
0 10 20 30 40 50 60Time in Days
Mod
ulus
, MP
a U20/Hi20
U40
0
5
10
15
20
25
0 10 20 30 40 50 60Time in Days
Elo
ngat
ion
at b
reak
, % .
U20/Hi20
U40
0.0
0.5
1.0
1.5
2.0
2.5
0 10 20 30 40 50 60
Time in Days
Wor
k to
bre
ak, J
U20/Hi20
U40
Figure 4.14: Tensile properties of golf tees compositions under controlled
composting conditions

67
To test the golf tees’ compostability, the tensile property changes were combined with
the weight loss study. In contrast to the starch compositions, which incorporated around
80 wt% of Hi-Maize, the golf tees had only 20 wt% Hi-Maize, which made the weight
loss test easy. When weight percent of Hi-Maize was predominant in the composition,
difficulties obtaining weight loss results were experienced.
0
5
10
15
20
25
30
35
0 10 20 30 40 50 60Time in days
% W
eigt
Los
s
U20/Hi20
tees from U20/Hi20
U40
tees from U40
Figure 4.15: Weight loss of golf tees compositions under controlled composting
conditions
The graph of the weight loss of the golf tees compositions (Figure 4.15) indicates that
weight loss occurred according to the size of the specimen; the smaller the specimen,
the bigger the weight loss during the composting period. Tees of the two different
compositions lost more weight than the very same specimens made into dumb-bell
shapes for tensile strength testing, which are much larger in size.
The composition containing only urea as filler had the greater weight loss of the two.
The fact that of the two compositions, the one containing only urea has a higher
percentage of biodegradability was proved from studying the results of the SEM and
XRD analyses.

68
4.4 SEM RESULTS
The scanning electron microscopy (SEM) photos are contained in Appendix F – SEM
data.
Example of SEM abbreviations:
1_7in1(x1000)
1 indicates the date of the compostability test (days 1, 7, 13, 45, 60, etc.)
7 indicates the number of the sample, in this case E 2138
‘In’ or ‘out’ indicates whether the photo was taken in (the inner part of the sample) or out
(the outer part) of the cut for SEM specimen.
1 - the number in front of the magnification brackets is the number of pictures taken at
this magnification and aging conditions. In this case only one picture has been taken.
The number in brackets is the magnification.
All samples were studied for a period of 60 days, parallel to the biodegradation process
taking place.
The microorganisms’ activity was clearly observable in the TPS 15 and TPS 30
samples. Hife (a type of microorganism) with collapsed cell walls was noted in two
photos of TPS 15, 45_5in1 (x1000) and 45_5in4(x3700) (Appendix F, Figures F1 and
F2). Together with it some type of crystalline structure (bottom right) was observed.
These could be crystals of vitamins, produced from the microorganisms, or from the soil
or sand structures.
In TPS 30G extra-cellular slimy mucus, produced by the bacteria, is seen in the outside
layer of the cut sample in 13_6out1(x3700) (Appendix F, Figure F3).
Spores of hife in TPS Eu were observed in photo 13_7out1(x7000) (Appendix F,
Figure F4).

69
So-called pitting (Appendix F, Figure F6), or the start of the degradation process, which
is caused by enzymatic activity, is observed in the TPS EMS photo 13_8in3(x7 000) as
well as a broken starch granule in photo 7_8in2(x500) (Appendix F, Figure F5).
The slimy effect of the bacterial activity in TPS PVB can be seen in photo 7_9in2(x3700)
(Appendix F, Figure F7). Even with the naked eye the author was able to see two
distinct layers of biodegradation when the sample was cut. It is clear that two different
types of microorganism were creating (1) the outside layer (aerobic) and (2) the inside
layer (anaerobic) 45_9out1(x20) (Appendix F, Figure F8). Hife activity is noticed here
again in 45_9out2(x3700) (Appendix F, Figure F9)
In the golf tees compositions containing Hi-Maize and urea, the activity of the enzymes
and microorganisms is clearly visible, but starch granules were still found at day 60;
these can be spotted in the anaerobic inside layer in 60_1in3(x3700) (Appendix F,
Figure F10). In the aerobic layer there appears to be full decomposition in
60_1out3(x1400) (Appendix F, Figure F11)
Complete degradation is observed on the inner and outer sides of the cut samples
having urea as filler, shown in 60_3in 4(x3 700) (Appendix F, Figure F12). This
degradation is more complete than in the samples with the starch-filled compositions.

70
5 CONCLUSIONS
Attempts were made to prepare starch-based plastic compounds for biodegradable,
injection-moulded seedling tubes and golf tees. Sappi Forest Products SA needed
partially biodegradable tubes to be able to increase the productivity of their seedlings.
Biodegradability, brittleness and low cost are what the golf tee market is currently
looking for.
For the seedling tube compositions, blends of thermoplastic starch (TPS) and polymers
were prepared via extrusion, followed by injection moulding. Two types of polyamides
were used: low-molecular-weight Euremelt 2138 and copolymer EMS Grilon BM13
SBG, as well recycled polyvinylbutyral (PVB). They all formed compatible, rather than
miscible, blends with TPS.
For the golf tee compositions, synthetic polyester polybutylene succinate adipate
(PBSA) was incorporated as the main ingredient in the blends. Adding fillers such as
urea and starch reduced the cost of these blends. Same process methods of extrusion
and injection moulding apply for the golf tee compositions.
Characterisation of the blends was achieved through mechanical testing, X-ray
diffraction (XRD) analysis, scanning electron microscopy (SEM), optical microscopy and
ASTM G160 biodegradability burial testing.
A number of conclusions can be drawn from the analysis of the experimental results.
5.1 SEEDLING TUBES
The availability of a continuous supply of Hi-Maize is uncertain. Blends with Stygel were
therefore considered. However, the experiments with Stygel resulted in compounds that
suffered severe retrogradation. Acceptable mechanical properties were achieved only
when high-amylose starch, e.g. Hi-Maize, was incorporated into the blends.
71
A change in the ageing conditions from 60% ℜH to 0% ℜH had an enormous effect on
the mechanical tensile strength properties of the compositions. At 60% ℜH, 30ºC, the
blends used for the seedling tubes had lower tensile strength and a lower elastic
modulus, but higher elongation at break in comparison with the TPS 15G and TPS 30G.
No significant changes were observed due to the fact that very little B-crystallinity is
present under these drying conditions. The moisture gain in TPS 15G and TPS 30G
under these conditions brought about higher strength in the TPS than in the blends.
Under drying conditions the low B-crystallinity is predominant in determining the
mechanical characteristics of the blends. The moisture gain influences the material
slightly.
The trend in the changes in tensile strength properties was the same when the ageing
was performed at 0% ℜH. Moisture losses, however, were four to six times greater than
at the beginning of the experiment. Much higher increases in the tensile strength and
elastic modulus, and greater decreases in the elongation at break were observed for the
compositions aged at 0% ℜH than for those aged at 60% ℜH.
The glycerol has a greater plasticising effect on the compositions than water.
Compositions with 15 wt% glycerol and 15 wt% water had higher tensile strengths and
elastic moduli and less elongation at break than those with 30 wt% glycerol and 3 wt%
water.
The blends TPS Eu and TPS EMS showed a similar pattern of crystallinity, which was
not influenced by the change in the ageing conditions from humid to dry. Virgin EMS
appears to be more crystalline than PVB and Euremelt 2138, which is why the blend
with Hi-Maize showed more crystalline behaviour. TPS EMS could not be considered for
seedling tubes compositions because, although it has highest tensile strength and the
best compatibility of the ingredients, according to the optical microscopy results it has
the worst susceptibility to biodegradation. TPS PVB has a shift in the spectrum to the
right when aged under dry conditions. The same shift is observed for the TPS 30G
under 0% ℜH.

72
Complete degradation of TPS 15G and TPS 30G within seven days of composting was
noticed. No mechanical testing results on these compositions were available for that
reason. Of the polyamide-starch blends, the one with Euremelt 2138 decomposed more
easily than the one with EMS Grilon.
An interesting trend in behaviour was observed with the mechanical strength testing of
the PVB blends during composting. The elastic modulus and tensile strength increased
with ageing, reached a plateau and then dropped again, whereas the mixes with
polyamide showed deterioration in these properties with an increase in the composting
time, also showing a plateau between day 10 and day 30 of the composting period. On
the other hand, TPS PVB had the lowest tensile strength and elastic modulus and an
80% reduction in the elongation at break during the compostability tests. This is the
composition finally chosen for the seedling tubes. A shift in the XRD spectra of TPS
30G and the blend TPS PVB was observed, which could explain the different
composting behaviour of the blend in comparison with the polyamide blends.
The processing properties of these materials, such as compounding and shaping, are
poor compared with those of conventional plastics. The mechanical properties and
ageing behaviour of Hi-Maize TPS blends are sensitive to the type of polymer, the
amount of plasticiser and the processing additives used, and to the moisture content
and amount of water. More research is necessary to solve these problems before
commercialisation can be considered.
5.2 GOLF TEES
The mechanical properties of blends containing starch are not affected by changes in
the ageing conditions. The compostability tests on the polyester blends containing 20
wt% starch showed unexpected slower decomposition than the blends containing only
urea filler. This phenomenon could be explained by the strong interaction between urea
and starch, which probably led to cross-linking in the compositions. A weight loss of only
15 wt% for compositions with 20 wt% Hi-Maize and 20 wt% urea was achieved.
73
Biodegradation of 30 wt% for golf tees compositions containing 40 wt% urea filler was
obtained. These results were accompanied by higher crystallinity and lower tensile
strength characteristics in U40 compositions.
The size of the test specimen during composting is important. Tees of both different golf
tees compositions had greater weight loss than the very same compositions made into
a dumb-bell shape.
SK Chemicals Korea has discontinued the production of Skygreen polyester SG200
(FG). Other suppliers of PBSA should be found if commercialisation is required.

74
6 REFERENCES
African Products (Pty) Ltd (s.a.1) Basic starch chemistry, Presentation.
African Products (Pty) Ltd (s.a.2) Starch modification and application, Presentation.
ASTM D 5338 (1992) Standard Test Method for Determining Aerobic Biodegradation of
Plastic Materials under Controlled Composting Conditions.
ASTM G 160 (1998) Standard Practice for Evaluating Microbial Susceptibility of
Nonmetallic Materials By Laboratory Soil Burial.
ASTM G 160 (s.a.3), http://www.astm.org, [2004, March 4].
Bellis, M. Inventors, http://inventors.about.com/library/inventors/blgolfteehtm,htm [2004,
March 4].
Biodegradable Polyesters: Packaging goes green (s.a.4)
http://www.plasticstechnology.com/articles/200209fa3.html, [2004, June 07]
Buhler, F.S., Schmid, E. and Schultze, H.J. (1995), Starch mixture and process for
production thereof, US Patent 5436078, assigned to Ems-Inventa AG.
Chapter1 (s.a.5) http://scholar.lib.vt.edu/theses/available/etd6998-
172444/unrestricted/CHAPTER1.PDF [2004, February 19].
Cheremisinoff, N.P. (1993) An Introduction to Polymer ℜH eology and Processing, CRC
Press, London.

75
Chen, W., David, D.J., Mac Knight, W.J. and Karasz, F.E. (2001) Miscibility and
morphology of blends of poly(3-hydroxybutyrate) and poly(vinyl butyral). Polymer, Vol.
42, (20), 8407-8414.
Dubois, P. and Narayan, R. (2002) Biodegradable compositions by reactive processing
of aliphatic polyester/polysaccharide blends, 7th European symposium on polymer
blends, 198(1), 233-244.
Equilibrium Relative Humidity (s.a.11)
http://www.omega.com/temperature/Z/pdf/z103.pdf, [2007, January 29]
Forssell, P.M., Mikkila, M., Moates, G.K. and Parker, R. (1997). Phase and glass
transition behaviour of concentrated barley starch-glycerol-water mixtures: A model for
thermoplastic starch. Carbohydrate Polymers, 34, 275 - 282.
Godbole, S., Gote, S. and Chakrabarti, T. (2003) Preparation and characterization of
biodegradable poly-3-hydroxybutyrate – starch blend films, Bioresource Technology, 86,
33 - 37.
Golding, S. (1998) The effects of annealing on structural and mechanical properties of
starch films, unpublished.
Graaf, R.A., Karman, A.P. and Janssen L.P.B.M. (2003) Material properties and glass
transition temperatures of different thermoplastic starches after extrusion processing,
Starch, 55, 80 - 86.
Hammer, C.F., Paul, D.R. and Newman, S. (1978) Polymer Blends, Vol. 2, Academic
Press, New York, USA, pp 217 - 219.
History George F. Grant (s.a.6), http://www.ourgolf.com/history/georgegrant.htm [2004,
March 4].

76
Hizukuri, S. (1986), Carbohydrate Res., 147, 342.
Hoseney, R.C. (1994) Principles of Cereal Science and Technology, 2d Ed, American
Ass. Of Cereal chemists, Inc., St.Paul, Minnesota, USA.
Hoshino, A., Sawada, H., Yokota, M., Tsuji, M., Fukuda, K. and Kimura, M. (2001) , Soil
Science & Plant Nutrition, 47, 35.
Huang, S.J. and Edelman, P.G. (1995) An overview of biodegradable polymers and
biodegradation of polymers, in: Degradable Polymers: Principles and Applications, Scot,
G. and Gielead, D., Eds., Chapman & Hall, Chapter 2, pp 18 - 28.
ISO 846 (1978) Determination of Behaviour under the Action of Fungi and Bacteria-
Evaluation by Visual Examination or Measurement of Change in Mass or Physical
Property.
Jang, J.K. and Pyun, Y.R. (1997) Effects of moisture on crystallinity of wheat starch at
different temperatures, Starch, 49 (7-8), 272 - 277.
Janik, H., Justrebska, M. and Rutkowska, M. (1998) Biodegradation of polycaprolactone
in sea water, Reactive Functional Polymers, 38, 27.
Jasberg, B.K. and Shogren, R.L. (1994) Ageing properties of extruded high-amylose
starch, Journal of Environmental Degradation,.2, 99 - 109.
Jenkins, R., Gould, R.W. and Gedcke, D. (1981) Quantitative X-Ray Spectrometry,
Marcel Dekker, Inc., pp 1 - 4.
Jiogao, Y., Songzhe, C., Jianping, G., Huawu, Z., Jie, Z. and Tong, L., (1998) A study
on the properties of starch/glycerin blend, Starch, 50 (6), 246 - 250.

77
Kalichevsky, M.T., Jaroszkiewicz, E., Abllet, S., Blanshard, J.M.V. and Lillford, P.J.
(1992) The glass transition of amylopectin measured by DSC, DMTA and NMR.
Carbohydrate Polymers 18, 77 - 78.
Kaplan, D.S. (1976) Structure-property relationships in copolymers to composites:
Molecular interpretations of the glass transition phenomenon, Journal of Applied
Polymer Science, 20, 2615 - 2629.
Khalil, M.I., Farag, S., Aly, A.A. and Hebeish, A. (2002) Some studies on starch-urea-
acid reaction mechanism, Carbohydrate Polymers, 48, 255 - 261.
Kollinsky, F. and Markert, G. (1971) Multi-component Polymer Systems, ACS,
Washington, D.C., p 175.
Kruger, A. (2003) Starch-based Plastics for Injection Moulding, Status Report, CSIR,
Pretoria, RSA.
Lim, S.W., Jung, I.K. and Jin, B.S. (1999) Structure and properties of biodegradable
gluten/aliphatic polyester blends, Eur. Polym. J, 35, 1875 - 1881.
Liu, Z.Q., Yi, X.S. and Feng, Y. (2001) Effects of glycerol monostearate on the
performance of thermoplastic starch, J. Mat. Sci., 36, 1809 - 1815.
Meadows, C. (1998) The Effects of Ageing on Biodegradable Starch Plastic Films,
BEng Thesis, University of Queensland, Australia
Myllarinen, P., Partanen, R., Seppala, J. and Forssell, P. (2002) Effect of glycerol on
behaviour of amylose and amylopectin films, Carbohydrate Polymers, 50, 355 - 361.

78
Narayan, R., Barengerg, S.A., Brash, J.L. and Redpath, A.E. (1990) Introduction, In:
Degradable Materials: Perspectives, Issues and Opportunities, CRC Boston, pp 1 - 37.
Nolan-ITU Pty (Ltd) (2002) Biodegradable plastics – Development and environmental
impacts, http://www.deh.gov.au/industry/waste/biodegradable/index.html [2004, May
17].
Paul, D.R. and Newman, S. (1978) Polymer Blends, Vol. 2, Chapter 12, New York,
Academic Press, p 35.
Phillips, J. W. (1998) Mechanical Behaviour of Materials, TAM 224/CE 210.
Purushothaman, M., Anderson, R.K.I., Narayana, S. and Jayaraman, V.K. (2001)
Bioprocess & Biosystems Engineering, 24, 131.
Rao, M.A. and Hartel, R.W. (1998) Phase/State Transitions in Foods, Marcel Dekker
Inc, New York, USA.
Ratto, J.A., Stenhouse, P.J., Auerbach, M., Mitchell, J. and Farrell, R. (1999)
Processing, performance and biodegradability of thermoplastic aliphatic polyester/starch
system, Polymer, 40, 6777 – 6788.
RH calibration with saturated salts (s.a.10)
http://www.natmus.dk/cons/tp/satsit/satsalt.htm, [2007, January 29].
Ritchie, P.D. (1972) Plasticizers, Stabilizers and Fillers, Glasgow, UK.
Rutkowska, M., Krasowska, K., Heimowska, A., Smiechowska, M. and Janik, H. (2000)
The influence of different processing additives on biodegradation of poly (epsilon-
caprolactone), Iranian Polymer Journal, 9, 221.

79
Scottish Golf History (s.a.7) http:// www.scottishgolfhistory.net/tee_term.htm [2004,
March 4].
Shogren, R.L., Fanta, G.F. and Doane, W.M. (1993) Development of starch-based
plastics: A re-examination of selected polymer systems in historical perspective, Starch,
45, 276 - 280.
Shogren, R.L., Swarson, C.L. and Thompsons, A.R. (1992) Extrudates of corn starch
with urea and glycerols: Structure/mechanical property relations, Starch, 44 (9), 335 -
338.
Shimao, M., (2001) Biodegradation of plastics, Biotechnology, 12: 242 - 247.
Shin, P.K., Kim, M.H. and Kim, J.M. (1997), Journal of Environmental Polymer
Degradation, 5 (1), 33 - 39.
Sita, C., (2007) Tensile Properties of Thermoplastic Starch and its Blends with Polyvinyl
Butyral and Polyamides, PhD Thesis, University of Pretoria, South Africa
Sita, C., Burns, M.G., Häβler, R. Focke, W.W. (2006) Tensile properties of thermoplastic
starch PVB blends, Journal of Applied Polymer Science,101(3), 1751-1755.
Skoog, D.A. and Leary, J.J. (1992) Principles of Instrumental Analysis, 4th ed.,
Saunders College Publishing, pp 357 - 381.
Swift, G. and Glass, J.E. (1990) Degradability of commodity plastics and speciality
polymers: An overview, In: Agricultural and Synthetic Polymers Biodegradability and
Utilization, American Chemical Society Press, Washington, D.C., Chapter 1, pp. 2 - 12.
The Starch Granule (s.a.8), http://www.eco-foam.com/processing.asp [2004, February
19].

80
Technical committee standards list (s.a.9)
http://www.iso.ch/iso/en/stddevelopment/tc/tclist, [2004, March 4].
Van Soest, J.J.G. and Vliegenthart J.F.G. (1997). Crystallinity in starch plastics:
Consequences for material properties, Tibtech, 15, 123 - 125.
Van Soest, J.J.G., Hulleman, S.H.D., De Wit, D. and Vliegenthart, J.F.G. (1996a)
Changes in the mechanical properties of thermoplastic potato starch in relation with
changes in B-type crystallinity, Carbohydrate Polymers, 29, 225 - 232.
Van Soest, J.J.G., De Wit, D. and Vliegenthart, J.F.G. (1996b) Mechanical properties of
thermoplastic waxy maize starch, Journal of Applied Polymer Science, 61, 1927 - 1937.
Van Soest, J.J.G., Benes, K. and De Wit, D. (1996c) The influence of starch molecular
mass on the properties of extruded thermoplastic starch, Polymer, 37 (16), 3543 - 3552.
Williams, K.L. (1987) An Introduction to X-Ray Spectrometry, Allen and Unwin, pp 1-
110.
Webber, C.J., (2000) “Biobased packaging materials for the food industry”, Report,
Department of Dairy and Food Science, The Royal Veterinary and Agricultural
University, Rolighedsvej 30, 1958 Frederiksberg C, Denmark.
Zobel, H.F. (1988) Molecules to granules: A comprehensive starch review, Starch, 40
(2), 44 - 50.

81
APPENDICES

82
APPENDIX A: EXTRUSION

83
Table A1: Sample’s compositions
Sample Number and Name
Composition Mass % of the ingredients
Golf Tees 1/ U20/Hi20 dumb bell shape
U/Hi/SGPE/St.Ac 20/20/50/10
2/ U20/Hi20 golf tee shape
U/Hi/SGPE/St.Ac 20/20/50/10
3/ U40 dumb bell shape
U/SGPE/St.Ac 40/50/10
4/ U40 golf tee shape
U/SGPE/St.Ac 40/50/10
Seedling Trays 5/ TPS 15G Hi/G/W/Si/St.Alc. 66/15/15/3/1 6/ TPS 30G Hi/G/W/Si/St.Alc 61/30/5/3/1 7/ TPS Eu TPS15G/Eu2138/U 80/20/2(on top) 8/ TPS EMS TPS15G/EMS/U 80/20/2(on top) 9/ TPS PVB TPS30G/PVB/U/EVA 78/22/2(on top)/3(on top)
U - Urea
Hi - Hi Maize Starch
SGPE /PBSA– Sky Green Polyester
St. Alc. – Stearic Alcohol
St.Ac. –Stearic Acid
Si - Precipitated Silica
TPS 15G – TPS containing 15 wt%Glycerol
TPS 30G – TPS containing 30 wt% Glycerol
TPS Eu – blend of TPS 15G and Euremelt 2138
TPS EMS – blend of TPS 15G and EMS
TPS PVB – blend of TPS 30G and PVB

84
Table A2: Extrusion of Seedling trays compositions
• TPS 15G and TPS 30G were prepared at twin screw extruder Berstoff
• The blends of TPS and PVB, Euremelt 2138 and EMS were prepared at CTM
extruder
Sample Composition Mass
of
ingredients
(%)
Temp profile
(ºC)
Speed
(rpm)
Torque
(amps)
5/TPS 15G Hi/G/W/Si/St Alc 66/15/15/3/1 Set 100 100 20
6/TPS 30G Hi/G/W/Si/St.Alc 61/30/5/3/1 Set 100 100 20
7/TPS Eu TPS15G/E2130/U 80/20/2 103d/130/130/116 25-30 ~6
8/TPS EMS TPS15G/EMS/U 80/20/2 103d/130/130/116 25-30 ~6
9/TPS PVB TPS30G/PVB/U/EVA 78/22/2/3 103d/130/130/116 25-30 ~7
d – temperature at the die G- Glycerol
% - Percentage in mass basis ºC – temperature in degrees Celsius
PVB – Poly Vinyl Butyral St.Alc. – Stearic Alcohol
Hi - Hi Maize Starch W - Water
Eu - Euremelt 2138 rpm – speed in round per minute
EMS – Polyamide EMS amps – torque in amperes
U – Urea Si – Precipitated Silica

85
Table A3: Extrusion characteristics of Golf tees compositions, performed at Berstoff
U – Urea % - percentage in mass basis
Hi – Hi-maize Starch ºC – temperature in degrees Celsius
SGPE – Sky Green Polyester rpm – rounds per minute speed
St.Ac – Stearic acid amps – torque in amperes
m/min – meter per minutes speed kg/h – kilogram per hour feeding speed
Sample Composition Mass
of
ingredients
(%)
Temp
profile
(ºC)
Speed
(rpm)
Torque
(amps)
Hall of
Speed
(m/min)
Feeding
Rate
(kg/h)
1/U20/Hi20 U/Hi/SGPE/St.Ac 20/20/50/10 Set 120 110 ~30 33 20.1
3/U40 U/SGPE/St.Ac 40/50/10 Set 120 140 ~25 40 23.7

86
APPENDIX B: INJECTION MOULDING

87
Table B1: Injection moulding parameters of Seedling trays compositions, performed at Engel
Sample Characte
ristics
of
moulds
Temp profile
ºC
Inj.
pressure
(bar)
Inj.
speed
(mm/s)
Hold on
pressure
(bar)
Hold
on
time
(sec.)
Cooling
time
(sec.)
Stroke
(mm/g)
Plastici
zing
speed
(%)
Back
press
ure
(bar)
5/TPS 15G No cooling
of mould
N150/150/150/150 180 85 20 5 15 28 50 0
6/ TPS 30G
No cooling
of mould
N150/150/150/150 120 50 20 5 15 27 50 0
7/TPS Eu No cooling
and heating
of mould
N130/130/125/120 120 50 20 5 15 26 50 0
8/TPS EMS No cooling
and heating
of mould
N130/130/125/120 120 50 20 5 15 28 50 0
9/TPS PVB No cooling
and heating
of mould
N130/130/125/120 100 50 20 5 15 28 50 0
88
Notes to Table B1
N – temperature at the nozzle
wt% - percentage in mass basis
ºC – temperature in degrees Celsius
mm/s - millimetre per second
sec - time in seconds
bar – pressure in bars
d – mass in grams

89
Table B2: Injection moulding parameters of Golf Tees compositions, performed at
Engel
U – Urea
Hi – Hi-Maize Starch
SGPE – Sky Green Polyester
N – temperature at the nozzle
wt% - percentage in mass basis
ºC – temperature in degrees Celsius
sec- time in seconds
bar – pressure in bars
mm/s – millimetres per second Injection speed
g – mass in grams
Sample Feed Temp profile
ºC
Inj.
press
ure
(bar)
Inj.
spee
d
(mm/
s)
Hold
on
press
ure(ba
r)
Hold
on
time
(sec.)
Cooli
ng
time
(sec.)
Stro
ke
mm
(g)
Plast
icizin
g
spee
d
(%)
Bac
k
pre
ssu
re
(bar
)
1/U20/Hi20 Easy
feed
N130/120/110/
110
100 5 15 5 20 27.5 50 0
3/U40 Easy
feed
N120/110/100/
80
100 50 20 5 15 26 50 0
90
APPENDIX C: TENSILE TEST DATA

91
Table C1: Values obtained from tensile testing of Seedling trays compositions at 60% ℜℜℜℜH, 30ºC for 30 days
Composition Time in
Days
Young’s Modulus,
(MPa)
Ave STD Dev
Tensile Strength,
(MPa)
Ave STD Dev
Elongation at break,
(%)
Ave STD Dev
Work at break,
(J)
Ave STD Dev
5/TPS 15G 1 155.03 27.13 8.71 0.72 32.36 2.52 6.65 0.75
7 199.10 9.55 9.90 0.27 35.79 2.36 8.58 0.64
14 217.78 4.19 10.42 0.44 30.26 4.07 7.70 1.40
30 175.57 10.01 8.97 0.33 31.18 1.29 6.52 0.22
6/TPS 30G 1 34.92 5.52 2.67 0.01 32.77 1.25 1.91 0.04
7 27.43 0.86 2.04 0.03 24.17 0.70 1.07 0.05
14 30.23 3.23 2.01 0.21 20.23 3.43 0.87 0.23
30 33.97 3.30 1.74 0.02 14.28 0.32 0.52 0.02
7/TPS Eu 1 52.21 5.32 3.64 0.14 37.31 3.64 3.09 0.40
7 96.46 6.06 5.43 0.16 35.02 1.07 4.37 0.21
14 111.29 13.29 6.02 0.23 34.70 1.38 4.80 0.41
30 127.43 9.08 6.55 0.28 31.08 2.41 4.86 0.42
8/TPS EMS 1 78.77 5.79 6.43 0.08 46.26 1.14 6.75 0.24
7 137.66 5.37 8.64 0.18 31.35 2.53 6.13 0.71
14 147.06 4.47 9.69 0.25 35.98 1.87 8.09 0.63
30 158.46 7.78 10.03 0.47 38.60 3.01 9.08 1.16
9/TPS PVB 1 13.75 3.09 1.34 0.05 55.53 1.96 1.69 0.05
7 10.21 0.51 1.14 0.02 49.78 4.54 1.27 0.06
14 9.55 0.59 1.08 0.04 50.80 2.37 1.19 0.05
30 12.30 4.07 1.07 0.04 43.88 3.95 1.06 0.11

92
Notes to Table C2
U – Urea MPa – pressure in mega pascals
Hi – Hi-Maize Starch % - percentage in mass basis
SGPE/PBSA – Sky Green Polyester J – work in Joules

93
Table C2: Values obtained from tensile testing of Golf tees compositions at 0% ℜℜℜℜH and 60% ℜℜℜℜH, for 30 days
Hi – Hi-Maize Starch wt% - percentage in mass basis
SGPE/PBSA – Sky Green Polyester J – work in Joules
Composition Time in
Days
Young’s Modulus,
(MPa)
Ave STD Dev
Tensile Strength,
(MPa)
Ave STD Dev
Elongation at break
(%)
Ave STD Dev
Work at break,
(J)
Ave STD Dev
1/U20/Hi20 1 240.46 9.45 11.89 0.46 8.54 1.06 1.93 0.43
60% ℜH , 30C 7 281.90 10.49 12.78 0.37 7.77 0.70 1.88 0.28
14 298.98 4.67 12.69 0.36 6.82 0.34 1.52 0.16
30 293.63 6.86 12.97 0.20 7.20 0.58 1.67 0.21
1/U20/Hi20 1 242.16 9.54 12.49 0.15 9.32 0.66 2.19 0.28
0% ℜH , 25C 7 289.59 8.05 13.20 0.19 7.32 0.34 1.70 0.16
14 312.63 8.27 13.41 0.57 7.00 0.41 1.57 0.23
30 314.77 14.41 13.29 0.50 7.61 0.58 1.79 0.20
3/U40 1 270.90 14.39 11.26 2.21 5.75 1.17 0.99 0.41
60% ℜH , 30C

94
APPENDIX D: XRD SPECTRA

95
1 - Fi le: BUR NS05-2 1.raw - T ype: 2T h/Th locked - S tep: 0.040 ° - S tep time: 1.5 s - Anode: Cu - C reati on: 2005 /0 2/16 07:43:25 PM
0 8/02/2005 G - Fi le: BUR NS05-2 2.raw - T ype: 2T h/Th locked - S tep: 0.040 ° - S tep time: 1.5 s - Anode: Cu - C reation: 2005 /03/01 04:28:43 PM0 9102105 - Fi le: BURN S0 5-23.r aw - Type: 2T h/Th locked - S tep: 0.040 ° - S tep time: 1.5 s - Anode: C u - Cr eation: 2005/03/02 1 2:36:45 AM
Lin
(Co
unts
)
0
100
200
300
400
500
600
700
800
900
2 Theta (Cu K -alpha)
5 10 20 30 40 50 60 70
Spectrum D1: Raw Starch diffractogram

96
TPS9
0 0-022- 1692 ( I) - Cyclododecane - C12H24 - Monocl inic - I/Ic PDF 1.7 -
0 0-048- 1070 (Q) - Urea - C H4N2 O/(N H2) 2CO - 0 0-005- 0586 (*) - Calc ite, syn - C aCO3 - Hexagonal (Rh ) - I/Ic PDF 2 . -
5 - File: BUR NS05-1 7.raw - T ype: 2T h/Th locked - Step: 0.040 ° - S tep time: 1.5 s - Anode: Cu - C reati on: 2005 /0 2/16 10:41:06 PM
3 - File: BUR NS05-1 5.raw - T ype: 2T h/Th locked - Step: 0.040 ° - S tep time: 1.5 s - Anode: Cu - C reati on: 2005 /0 2/16 09:12:16 PMEU 2138 - F ile: BU RNS05-09.raw - T ype: 2 Th/T h locked - S tep: 0.04 0 ° - Step time: 1.5 s - Anode: Cu - Creation: 2005/01/14 07:02:42 PM
T PS 9 RH60,30 - Fi le: BUR NS05-7 .r aw - T ype: 2T h/Th locked - Step: 0.040 ° - Step time: 1.5 s - Anode: Cu - C reation: 2005/01 /12 09:50:37 PM1 - File: BUR NS05-2 1.raw - T ype: 2T h/Th locked - Step: 0.040 ° - S tep time: 1.5 s - Anode: Cu - C reati on: 2005 /0 2/16 07:43:25 PM
Lin
(Co
unts
)
0
1000
2000
3000
2 Theta (Cu K-alpha)
6 7 8 9 10 11 12 13 14 15 16 17 18 19 20 21 22 23 24 25 26 27 28 29 30 31 32 33 34 35 36 37 38 39 40 41 42 43 44
d=6.
9296
9
d=4.
532
03
d=3
.971
44
Eu2138 = amorphous
raw starch
TPS15 GRH60
Urea
TPS9
Spectrum D2: TPS 9/Eu and raw materials

97
TPS10
0 0-022-1692 (I) - Cyclododecane - C12H24 - Monoclinic - I/Ic PDF 1.7 -
0 0-048-1070 (Q) - Urea - C H4N2 O/(N H2)2CO - 0 0-005-0586 (*) - Calcite, syn - C aCO3 - Hexagonal (Rh ) - I/Ic PDF 2 . -
5 - File: BUR NS05-1 7.raw - T ype: 2Th/Th locked - Step: 0.040 ° - Step time: 1.5 s - Anode: Cu - C reati on: 2005 /0 2/16 10:41:06 PM
3 - File: BUR NS05-1 5.raw - T ype: 2Th/Th locked - Step: 0.040 ° - Step time: 1.5 s - Anode: Cu - C reati on: 2005 /0 2/16 09:12:16 PMTPS 10 RH60 ,3 0 - File: BUR NS05-5.raw - Type: 2Th/Th locked - Step: 0.040 ° - Step time: 1.5 s - Anode: Cu - C reation: 2005 /0 1/12 08:21:43 PM
GRILON EMS - File: BUR NS05-01 .raw - Type: 2Th/Th locked - Step: 0.040 ° - Step time: 1.5 s - Anode: Cu - C reation: 2005 /0 1/12 05:23:58 PM1 - File: BUR NS05-2 1.raw - T ype: 2Th/Th locked - Step: 0.040 ° - Step time: 1.5 s - Anode: Cu - C reati on: 2005 /0 2/16 07:43:25 PM
Lin
(Co
unts
)
0
1000
2000
3000
2 Theta (Cu K-alpha)
6 7 8 9 10 11 12 13 14 15 16 17 18 19 20 21 22 23 24 25 26 27 28 29 30 31 32 33 34 35 36 37 38 39 40 41 42 43 44
d=6
.929
69
d=4
.532
03
d=3.
971
44EMS = amorphous
raw starch
TPS15GRH60
Urea
TPS10
Spectrum D3: TPS 10/EMS and raw materials

98
TPS11
00-022-1692 ( I) - Cyclododecane - C12H24 - Monoclinic - I/Ic PDF 1.7 -
0 0-048-1070 (Q) - Urea - CH4N2 O/(NH2)2CO -
0 0-005-0586 (*) - Calcite, syn - CaCO3 - Hexagonal (Rh ) - I/Ic PDF 2 . - 6 - File: BURNS05-1 8.raw - Type: 2Th/Th locked - Step: 0.040 ° - Step time: 1.5 s - Anode: Cu - C reati o
4 - File: BURNS05-1 6.raw - Type: 2Th/Th locked - Step: 0.040 ° - Step time: 1.5 s - Anode: Cu - C reati o
3 - File: BURNS05-1 5.raw - Type: 2Th/Th locked - Step: 0.040 ° - Step time: 1.5 s - Anode: Cu - C reati oPVB - File: BURNS05-10.raw - Typ e: 2Th/Th locked - Step: 0.040 ° - Step time: 1.5 s - Anode: Cu - C rea
TPS 11 RH60 ,3 0 - File: BURNS05-3.raw - Type: 2Th/Th locked - Step: 0.040 ° - Step time: 1.5 s - Anod1 - File: BURNS05-2 1.raw - Type: 2Th/Th locked - Step: 0.040 ° - Step time: 1.5 s - Anode: Cu - C reati o
Lin
(Co
unts
)
0
1000
2000
3000
2 Theta (Cu K-alpha)
6 7 8 9 10 11 12 13 14 15 16 17 18 19 20 21 22 23 24 25 26 27 28 29 30 31 32 33 34 35 36 37 38 39 40 41 42
d=6.
9296
9
d=4
.532
03
d=3.
971
44
PVB = amorphous
raw starch
TPS30GRH60
Urea
TPS11
EVA = amorphous
Spectrum D4: TPS 11/PVB and raw materials
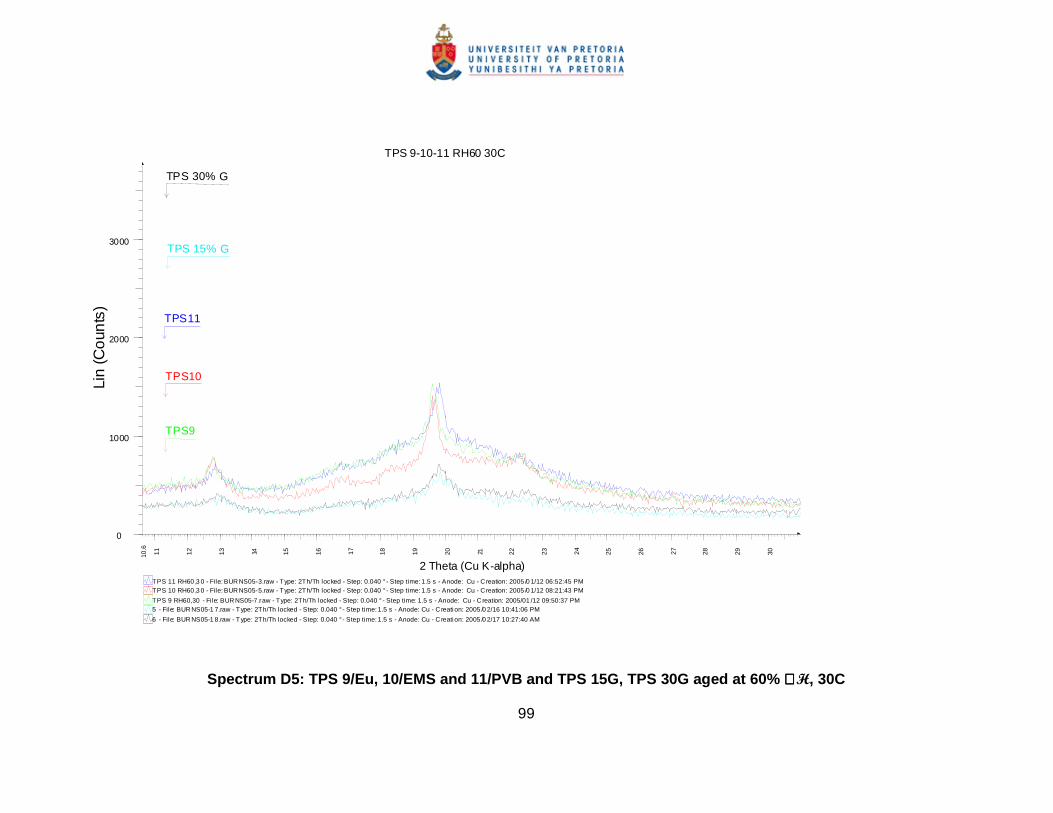
99
TPS 9-10-11 RH60 30C
6 - File: BURNS05-1 8.raw - Type: 2Th/Th locked - Step: 0.040 ° - Step time: 1.5 s - Anode: Cu - C reati on: 2005 /0 2/17 10:27:40 AM
5 - File: BURNS05-1 7.raw - Type: 2Th/Th locked - Step: 0.040 ° - Step time: 1.5 s - Anode: Cu - C reati on: 2005 /0 2/16 10:41:06 PMTPS 9 RH60,30 - File: BURNS05-7 .raw - Type: 2Th/Th locked - Step: 0.040 ° - Step time: 1.5 s - Anode: Cu - C reation: 2005/01 /12 09:50:37 PM
TPS 10 RH60 ,3 0 - File: BURNS05-5.raw - Type: 2Th/Th locked - Step: 0.040 ° - Step time: 1.5 s - Anode: Cu - C reation: 2005 /0 1/12 08:21:43 PMTPS 11 RH60 ,3 0 - File: BURNS05-3.raw - Type: 2Th/Th locked - Step: 0.040 ° - Step time: 1.5 s - Anode: Cu - C reation: 2005 /0 1/12 06:52:45 PM
Lin
(Co
unts
)
0
1000
2000
3000
2 Theta (Cu K-alpha)
10.6
11 12 13 14 15 16 17 18 19 20 21 22 23 24 25 26 27 28 29 30 31
TPS9
TPS10
TPS11
TPS 15% G
TPS 30% G
Spectrum D5: TPS 9/Eu, 10/EMS and 11/PVB and TPS 15G, TPS 30G aged at 60% ℜℜℜℜH, 30C

100
Spectrum D6: TPS 9/Eu, 10/EMS, 11/PVB aged at 0% ℜℜℜℜH, 25°°°°C
TPS 9-10-11 P2O5
11 - File: BURNS05-24.raw - Typ e: 2Th/Th locked - Step: 0.040 ° - Step time: 1 .5 s - Anode: Cu - Creat ion: 2005/04/22 09:51:57 AM
10 - File: BURNS05-25.raw - Typ e: 2Th/Th locked - Step: 0.040 ° - Step time: 1 .5 s - Anode: Cu - Creat ion: 2005/04/22 10:36:18 AMTPS 9 P2O5 - F ile: BURNS05-8.raw - Type: 2Th/Th locked - Step: 0.040 ° - Step time: 1.5 s - Anode: Cu - Creation: 2005/01/12 10:34 :58 PM
TPS 11 P2O5 - File: BURNS05-6.raw - Type: 2Th /Th locked - Step: 0.040 ° - Step time: 1.5 s - Anode: Cu - Creation: 2005/01/12 09 :06:09 PMTPS 10 P2O5 - File: BURNS05-4.raw - Type: 2Th /Th locked - Step: 0.040 ° - Step time: 1.5 s - Anode: Cu - Creation: 2005/01/12 07 :37:14 PM
Lin
(Co
unts
)
0
1000
2000
3000
4000
2 Theta (Cu K-alpha)
10 11 12 13 14 15 16 17 18 19 20 21 22 23 24 25 26 27 28 29 30
TPS9
TPS10
TPS11
TPS 15% G
TPS 30% G

101
Spectrum D7: TPS 9/Eu, 10/EMS and 11/PVB aged at 60% ℜℜℜℜH, 30°°°°C and 0% ℜℜℜℜH, 25°°°°C
TPS 9-10-11 RH60 30C + P2O5
TPS 9 P2 O5 - File: BURNS0 5-8.raw - Type: 2Th/Th locked - Step: 0.040 ° - Step time: 1.5 s - An ode: Cu - Creation: 2005/01/12 10:34 :58 PM
TPS 9 RH60,30 - File: BURNS05-7 .raw - Type: 2Th/Th locked - Step: 0.040 ° - Step time: 1.5 s - Anode: Cu - Creation: 2005/01 /12 09:50:37 PM
TPS 11 P2O5 - File: BURNS05-6.raw - Type: 2Th /Th locked - Step: 0.040 ° - Step time: 1.5 s - Anod e: Cu - Creation: 2005/01/12 09 :0 6:09 PMTPS 10 RH60 ,3 0 - File: BURNS05-5.raw - Type: 2Th/Th locked - Step: 0.040 ° - Step time: 1.5 s - Anode: Cu - Creation: 2005 /0 1/12 08:21:43 PM
TPS 10 P2O5 - File: BURNS05-4.raw - Type: 2Th /Th locked - Step: 0.040 ° - Step time: 1.5 s - Anod e: Cu - Creation: 2005/01/12 07 :3 7:14 PMTPS 11 RH60 ,3 0 - File: BURNS05-3.raw - Type: 2Th/Th locked - Step: 0.040 ° - Step time: 1.5 s - Anode: Cu - Creation: 2005 /0 1/12 06:52:45 PM
Lin
(Co
unts
)
010020030040050060070080090010001100120013001400150016001700180019002000210022002300240025002600270028002900
2 Theta (Cu K-alpha)
11.1
12 13 14 15 16 17 18 19 20 21 22 23
TPS9
TPS10
TPS11

102
UREA POLYESTER
0 0-051-1902 (*) - alpha-Glutaric acid - C5H8O4 - Monoclinic -
0 0-049-2268 (Q) - Poly(N-ethyl-b isbenzoylamine 4,4'-diimido-dip hen ylethane) - (C34H2 3N3O6)n/[N(CO)2(C6H3)(CON(C2H5)CO)(C6H3)(CO)2 N(C6H4CH2CH2 - 0 0-038-1923 (*) - Stearic acid - C18H36O2 - Mon oclin ic -
0 0-034-1766 (N) - Polyethylene urea complex - C14.76H41.52 N12O6/(CH2)8.76·6CO(NH2)2 - Hexagon al - UREA POLYESTER - File: M ARA04-5.raw - Type: 2Th/Th locked - Start: 5.00 0 ° - End: 70.000 ° - Step: 0.0 40 ° - Step time: 1.5 s - Anod e: Cu - X-Offset: 0.0 00 - Displ.: 0. mm - Creation: 2 004/11/15 02:44:24 PM
Lin
(Co
unts
)
0
1000
2000
3000
4000
5000
2 Theta (Cu K-alpha)
5 6 7 8 9 10 11 12 13 14 15 16 17 18 19 20 21 22 23 24 25 26 27 28 29 30 31 32 33
Spectrum D8: U40
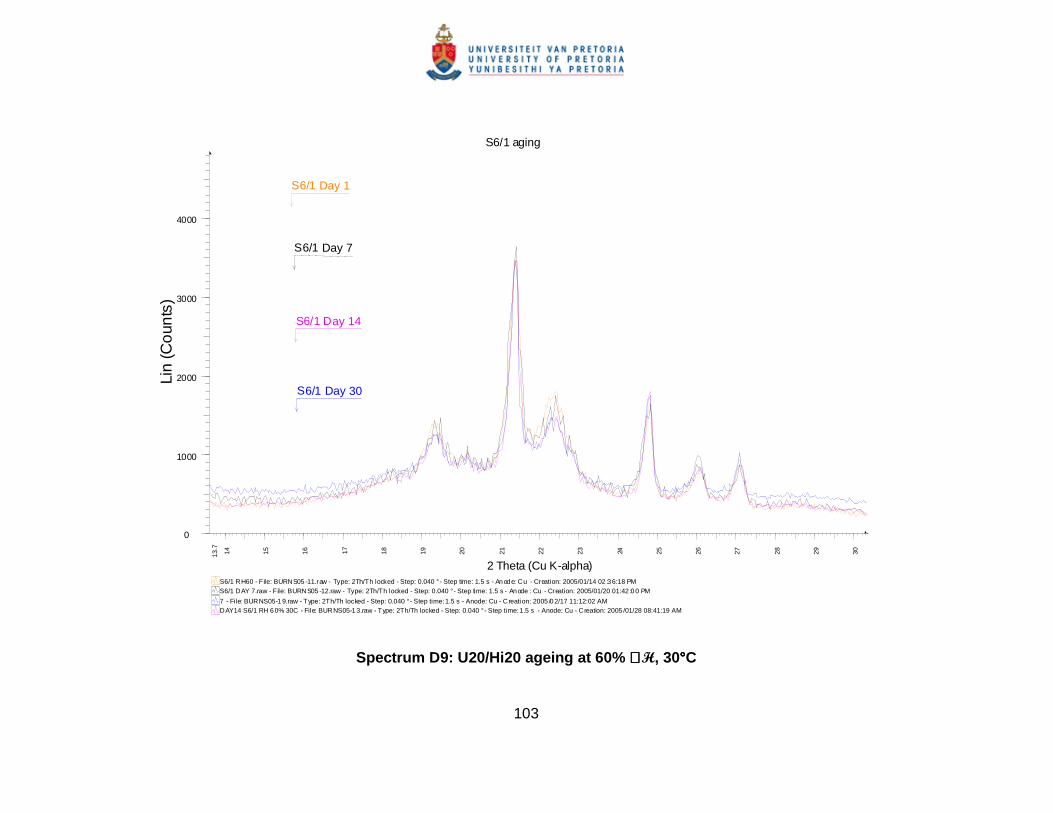
103
Spectrum D9: U20/Hi20 ageing at 60% ℜℜℜℜH, 30°°°°C
S6/1 aging
DAY14 S6/1 RH 6 0% 30C - File: BURNS05-1 3.raw - Type: 2Th/Th locked - Step: 0.040 ° - Step time: 1.5 s - Anode: Cu - Creation: 2005 /01/28 08:41:19 AM7 - File: BURNS05-1 9.raw - Type: 2Th/Th locked - Step: 0.040 ° - Step time: 1.5 s - Anode: Cu - Creation: 2005 /0 2/17 11:12:02 AM
S6/1 DAY 7.raw - File: BURNS05 -12.raw - Type: 2Th/Th locked - Step: 0.040 ° - Step time: 1.5 s - An ode : Cu - Creation: 2005/01/20 01:42 :0 0 PMS6/1 RH60 - File: BURNS05 -11.raw - Type: 2Th/Th locked - Step: 0.040 ° - Step time: 1.5 s - An od e: Cu - Creation: 2005/01/14 02 :3 6:18 PM
Lin
(Co
unts
)
0
1000
2000
3000
4000
2 Theta (Cu K-alpha)
13.7
14 15 16 17 18 19 20 21 22 23 24 25 26 27 28 29 30
S6/1 Day 30
S6/1 Day 14
S6/1 Day 7
S6/1 Day 1
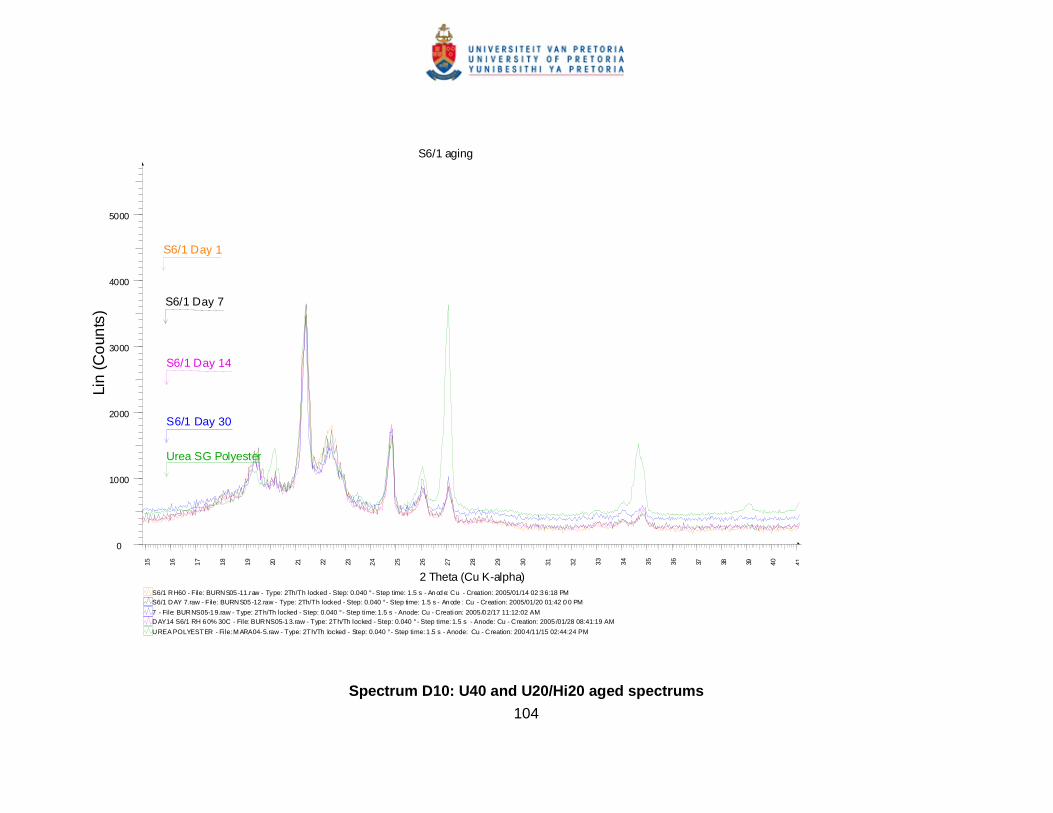
104
S6/1 aging
UREA POLYESTER - File: M ARA04-5.raw - Type: 2Th/Th locked - Step: 0.040 ° - Step time: 1 .5 s - Anode: Cu - Creation: 200 4/11/15 02:44:24 PM
DAY14 S6/1 RH 6 0% 30C - File: BURNS05-1 3.raw - Type: 2Th/Th locked - Step: 0.040 ° - Step time: 1.5 s - Anode: Cu - Creation: 2005 /01/28 08:41:19 AM7 - File: BURNS05-1 9.raw - Type: 2Th/Th locked - Step: 0.040 ° - Step time: 1.5 s - Anode: Cu - Creation: 2005 /0 2/17 11:12:02 AM
S6/1 DAY 7.raw - F ile: BURNS05 -12.raw - Type: 2Th/Th locked - Step: 0.040 ° - Step time: 1.5 s - An ode : Cu - Creation: 2005/01/20 01:42 :0 0 PMS6/1 RH60 - File: BURNS05 -11.raw - Type: 2Th/Th locked - Step: 0.040 ° - Step time: 1.5 s - An od e: Cu - Creation: 2005/01/14 02 :3 6:18 PM
Lin
(Co
unts
)
0
1000
2000
3000
4000
5000
2 Theta (Cu K-alpha)
15 16 17 18 19 20 21 22 23 24 25 26 27 28 29 30 31 32 33 34 35 36 37 38 39 40 41
S6/1 Day 30
S6/1 Day 14
S6/1 Day 7
S6/1 Day 1
Urea SG Polyester
Spectrum D10: U40 and U20/Hi20 aged spectrums
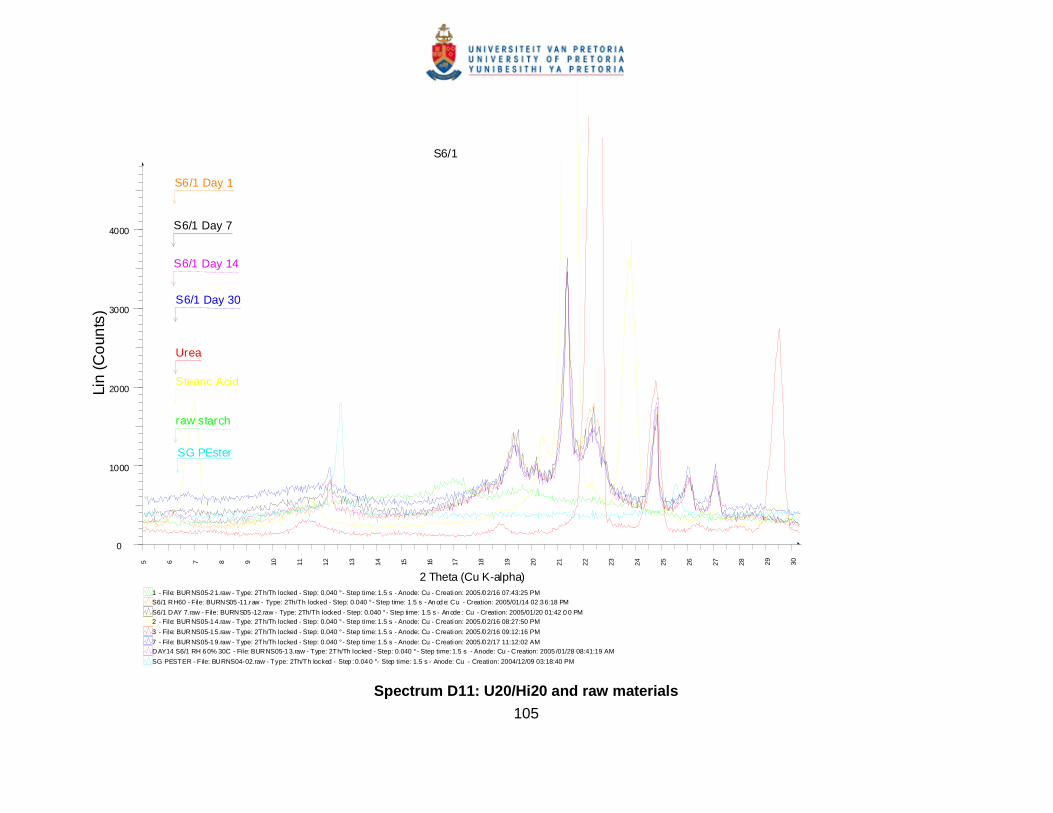
105
S6/1
SG PESTER - File: BURNS04-02.raw - Type: 2Th/Th locked - Step : 0.04 0 ° - Step time: 1.5 s - Anode: Cu - Creation: 2004/12/09 03:18:40 PM
DAY14 S6/1 RH 6 0% 30C - File: BURNS05-1 3.raw - Type: 2Th/Th locked - Step: 0.040 ° - Step time: 1.5 s - Anode: Cu - Creation: 2005 /01/28 08:41:19 AM7 - File: BURNS05-1 9.raw - Type: 2Th/Th locked - Step: 0.040 ° - Step time: 1.5 s - Anode: Cu - Creation: 2005 /0 2/17 11:12:02 AM
3 - File: BURNS05-1 5.raw - Type: 2Th/Th locked - Step: 0.040 ° - Step time: 1.5 s - Anode: Cu - Creation: 2005 /0 2/16 09:12:16 PM
2 - File: BURNS05-1 4.raw - Type: 2Th/Th locked - Step: 0.040 ° - Step time: 1.5 s - Anode: Cu - Creation: 2005 /0 2/16 08:27:50 PMS6/1 DAY 7.raw - F ile: BURNS05 -12.raw - Type: 2Th/Th locked - Step: 0.040 ° - Step time: 1.5 s - An ode : Cu - Creation: 2005/01/20 01:42 :0 0 PM
S6/1 RH60 - File: BURNS05 -11.raw - Type: 2Th/Th locked - Step: 0.040 ° - Step time: 1.5 s - An od e: Cu - Creation: 2005/01/14 02 :3 6:18 PM1 - File: BURNS05-2 1.raw - Type: 2Th/Th locked - Step: 0.040 ° - Step time: 1.5 s - Anode: Cu - Creation: 2005 /0 2/16 07:43:25 PM
Lin
(Co
unts
)
0
1000
2000
3000
4000
2 Theta (Cu K-alpha)
5 6 7 8 9 10 11 12 13 14 15 16 17 18 19 20 21 22 23 24 25 26 27 28 29 30
raw starch
S6/1 Day 1
S6/1 Day 14
S6/1 Day 30
S6/1 Day 7
SG PEster
Stearic Acid
Urea
Spectrum D11: U20/Hi20 and raw materials

106
APPENDIX E: COMPOSTABILITY TENSILE TEST DATA

107
Table E1: Observed compostability parameters according to ASTM G160
Parameter Days measured Result
pH
Container 1(Golf Tees samples) Day 1 7.3
Day 60 7.5
Container 2(Seedling Trays samples) Day 1 7.0
Day 60 7.5
Moisture of soil, mass%
Container 1(Golf Tees samples) Day 1 29.94
Day 30 34.15
Day 60 20.07
Container 2(Seedling Trays samples) Day 1 37.18
Day 30 30.49
Day 60 24.99
Material Tensile Strength, MPa
Before burial 224.31
After three days 123.00

108
Table E2: Values obtained from tensile testing of Seedling trays compositions during composting for 60 days
Composition Time in
Days
Young’s Modulus,
(MPa)
Ave STD Dev
Tensile Strength,
(MPa)
Ave STD Dev
Elongation at break
(%)
Ave STD Dev
Work at break,
(J)
Ave STD Dev
5/TPS 15G 0 252.79 19.59 11.53 0.36 25.71 2.91 7.19 1.08
6/TPS 30G 0 30.68 3.17 2.18 0.02 20.12 1.28 0.95 0.07
7/TPS Eu 0 129.02 12.88 6.54 0.49 28.17 1.09 4.29 0.58
7 59.86 21.27 2.46 0.27 15.84 4.71 0.79 0.32
13 37.79 8.08 1.93 0.19 18.46 1.06 0.71 0.09
30 28.70 1.97 1.60 0.21 14.18 2.22 0.42 0.13
45 0.03 0.00 0.00 0.00 11.72 3.06 0.29 0.13
60 0.01 0.00 0.00 0.00 22.99 9.01 0.26 0.11
8/TPS EMS 0 172.15 9.87 10.42 0.18 28.26 5.25 6.69 1.55
7 103.95 10.57 5.45 0.61 17.40 2.24 1.92 0.42
13 83.48 15.84 3.87 0.71 15.66 2.70 1.18 0.35
30 41.64 18.48 3.09 1.22 17.99 2.45 1.09 0.46
45 0.07 0.00 0.00 0.00 10.51 2.60 0.62 0.22
60 0.01 0.00 0.00 0.00 38.98 18.49 0.77 0.40
9/TPS PVB 0 16.78 2.05 1.31 0.01 43.13 1.07 1.28 0.04
7 30.68 14.53 1.34 0.05 19.53 6.21 0.54 0.17
13 47.18 13.21 1.17 0.25 10.45 0.00 0.12 0.05
30 42.66 15.11 1.36 0.39 10.12 4.54 0.15 0.04
45 0.05 0.00 0.00 0.00 4.45 1.10 0.12 0.04
60 0.07 0.01 0.00 0.00 8.93 3.52 0.12 0.02

109
Table E3: of values obtained from tensile testing of Golf tees compositions during composting for 60 days
d – temperature at the die wt% - Percentage in mass basis
U – Urea ºC – temperature in degrees Celsius
G – Glycerol rpm – speed in round per minute
St.Ac – Stearic Acid J – work in Joules
Composition Time in
Days
Young’s Modulus,
(Mpa)
AVE STD DEV
Tensile Strength,
(MPa)
Ave STD Dev
Elongation at break
(%)
Ave STD Dev
Work at break,
(J)
Ave STD Dev
1/U20/Hi20 0 292.70 20.59 12.42 0.58 6.75 0.77 1.45 0.28
7 78.93 9.82 5.52 0.29 16.67 2.75 1.91 0.44
13 63.10 3.48 5.00 0.20 13.81 1.55 1.29 0.18
30 69.99 6.48 4.73 0.48 9.60 0.83 0.83 0.19
45 0.08 0.01 0.00 0.00 6.91 0.46 0.52 0.06
60 0.08 0.01 0.00 0.00 6.74 0.95 0.46 0.11
3/U40 0 270.90 14.39 11.26 2.21 5.75 1.17 0.99 0.41
7 82.70 3.44 6.55 0.66 14.90 2.10 1.28 0.22
13 47.45 4.13 4.41 0.92 15.14 1.75 1.05 0.39
30 52.80 14.75 2.01 0.61 5.56 1.53 0.18 0.08
45 0.07 0.03 0.00 0.00 4.45 1.48 0.16 0.10
60 0.07 0.01 0.00 0.00 3.78 0.88 0.12 0.06

110
APPENDIX F: SEM

111
Figure F1: Microphotograph of TPS 15G crystal structures: crystals of vitamins, produced by microorganisms, soil or
sand structures. Picture taken at day 45 of composting inside the cut specimen at magnification X1000

112
Figure F2: Microphotograph of TPS 15G collapsed hife and crystal structure. Picture taken at day 45 of composting,
inside the cut specimen, at magnification x3 700

113
Figure F3: Microphotograph of TPS 30G microorganism activity, slime effect. Photo taken from the outside degradation
layer at day 13 of the computability test. Magnification x3 700.

114
Figure F4: Microphotograph TPS Eu spores. Picture taken at day 13 of compostability test, outside degradation layer at
magnification x7 000.

115
Figure F5: Broken Starch granule in TPS EMS bottom right. Photo taken at day 7 of the compostability test at
magnification x500, inside of the degradation layer

116
Figure F6: Start of the degradation/pitting at the starch granule in TPS EMS. Photo taken from the inside degradation
layer, day 13 of the degradation process and magnification x7 000

117
Figure F7: Slime effect in TPS PVB. Photo taken at day 7 of the composting at x3 700 magnification

118
Figure F8: Aerobic and anaerobic layers of biodegradation in TPS PVB. Photo taken at day 45 of the composting at x20
magnification.
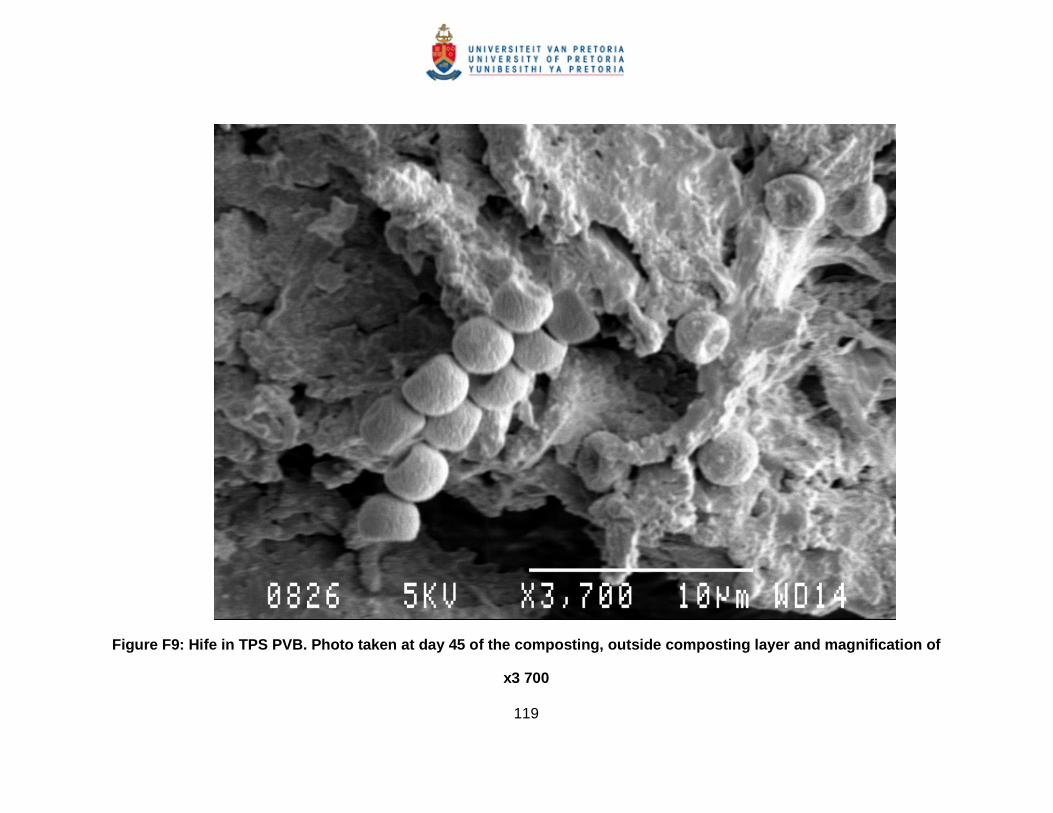
119
Figure F9: Hife in TPS PVB. Photo taken at day 45 of the composting, outside composting layer and magnification of
x3 700

120
Figure F10: U20/Hi20 at day 60 of composting. Starch granules still visible under the slime mucus. Photo taken from the
inside composting layer at magnification x3 700.

121
Figure F11: Complete degradation in the outer aerobic layer in U20/Hi20 composition. Photo taken from the outside
decomposing layer at day 60 of the test and magnification x1 400.

122
Figure F12: Complete degradation in the inner layer of U40 composition, compostability day 60 and magnification x3 700.
Figure 1