Mechanical, Physical and Thermal Properties of Sugar Palm ...
18
polymers Article Mechanical, Physical and Thermal Properties of Sugar Palm Nanocellulose Reinforced Thermoplastic Starch (TPS)/Poly (Lactic Acid) (PLA) Blend Bionanocomposites A. Nazrin 1 , S. M. Sapuan 1,2, * and M. Y. M. Zuhri 2 1 Laboratory of Biocomposite Technology, Institute of Tropical Forestry and Forest Products (INTROP), Universiti Putra Malaysia, Serdang 43400, Selangor, Malaysia; [email protected] 2 Advanced Engineering Materials and Composites Research Centre (AEMC), Department of Mechanical and Manufacturing Engineering, Universiti Putra Malaysia, Serdang 43400, Selangor, Malaysia; [email protected] * Correspondence: [email protected] Received: 13 July 2020; Accepted: 3 September 2020; Published: 27 September 2020 Abstract: In this paper, sugar palm nanocellulose fibre-reinforced thermoplastic starch (TPS)/poly (lactic acid) (PLA) blend bionanocomposites were prepared using melt blending and compression moulding with different TPS concentrations (20%, 30%, 40%, 60%, and 80%) and constant sugar palm nanocellulose fibres (0.5%). The physical, mechanical, thermal, and water barrier properties were investigated. The SEM images indicated different TPS loading effects with the morphology of the blend bionanocomposites due to their immiscibility. A high content of TPS led to agglomeration, while a lower content resulted in the presence of cracks and voids. The 20% TPS loading reduced the tensile strength from 49.08 to 19.45 MPa and flexural strength from 79.60 to 35.38 MPa. The thermal stability of the blend bionanocomposites was reduced as the TPS loading increased. The thickness swelling, which corresponded to the water absorption, demonstrated an increasing trend with the increased addition of TPS loading. Keywords: mechanical properties; poly (lactic acid) (PLA); poly (lactic acid) (PLA) blend bionanocomposites; sugar palm nanocellulose fibre; thermoplastic sugar palm starch 1. Introduction A huge accumulation of plastic waste has resulted in a negative impact on the environment due to their non-biodegradable properties [1,2]. Plastic products made from synthetics have been used in many industries like the automotive sector, food packaging, furniture, aerospace, defence, electronics, communication, and building construction [3–9]. These materials have excellent properties: high mechanical strength and stiffness, good chemical and thermal resistances, and impressive barrier properties. However, these petroleum-based polymers have caused massive waste that is detrimental to Mother Nature. Furthermore, the depletion of fossil resources has prompted researchers to develop alternative polymers that are environmentally friendly, which have been derived from biodegradable and sustainable resources [10]. Starch is one of the promising materials that have the potential to replace petroleum-based polymers. It is considered cheap, abundant, biodegradable, and renewable [11–15]. Despite this, starch-based materials are brittle with poor mechanical and water barrier properties. Thus, further modification must be done to acquire more decent material properties. The most common method is by plasticising starch to reduce intermolecular forces and increase the mobility of polymer chains [16,17]. Polymers 2020, 12, 2216; doi:10.3390/polym12102216 www.mdpi.com/journal/polymers
Transcript of Mechanical, Physical and Thermal Properties of Sugar Palm ...

polymers
Article
Mechanical, Physical and Thermal Properties ofSugar Palm Nanocellulose ReinforcedThermoplastic Starch (TPS)/Poly (Lactic Acid) (PLA)Blend Bionanocomposites
A. Nazrin 1, S. M. Sapuan 1,2,* and M. Y. M. Zuhri 2
1 Laboratory of Biocomposite Technology, Institute of Tropical Forestry and Forest Products (INTROP),Universiti Putra Malaysia, Serdang 43400, Selangor, Malaysia; [email protected]
2 Advanced Engineering Materials and Composites Research Centre (AEMC), Department of Mechanical andManufacturing Engineering, Universiti Putra Malaysia, Serdang 43400, Selangor, Malaysia;[email protected]
* Correspondence: [email protected]
Received: 13 July 2020; Accepted: 3 September 2020; Published: 27 September 2020�����������������
Abstract: In this paper, sugar palm nanocellulose fibre-reinforced thermoplastic starch (TPS)/poly(lactic acid) (PLA) blend bionanocomposites were prepared using melt blending and compressionmoulding with different TPS concentrations (20%, 30%, 40%, 60%, and 80%) and constant sugarpalm nanocellulose fibres (0.5%). The physical, mechanical, thermal, and water barrier propertieswere investigated. The SEM images indicated different TPS loading effects with the morphology ofthe blend bionanocomposites due to their immiscibility. A high content of TPS led to agglomeration,while a lower content resulted in the presence of cracks and voids. The 20% TPS loading reducedthe tensile strength from 49.08 to 19.45 MPa and flexural strength from 79.60 to 35.38 MPa. The thermalstability of the blend bionanocomposites was reduced as the TPS loading increased. The thicknessswelling, which corresponded to the water absorption, demonstrated an increasing trend withthe increased addition of TPS loading.
Keywords: mechanical properties; poly (lactic acid) (PLA); poly (lactic acid) (PLA) blendbionanocomposites; sugar palm nanocellulose fibre; thermoplastic sugar palm starch
1. Introduction
A huge accumulation of plastic waste has resulted in a negative impact on the environment dueto their non-biodegradable properties [1,2]. Plastic products made from synthetics have been used inmany industries like the automotive sector, food packaging, furniture, aerospace, defence, electronics,communication, and building construction [3–9]. These materials have excellent properties: highmechanical strength and stiffness, good chemical and thermal resistances, and impressive barrierproperties. However, these petroleum-based polymers have caused massive waste that is detrimentalto Mother Nature. Furthermore, the depletion of fossil resources has prompted researchers to developalternative polymers that are environmentally friendly, which have been derived from biodegradableand sustainable resources [10].
Starch is one of the promising materials that have the potential to replace petroleum-basedpolymers. It is considered cheap, abundant, biodegradable, and renewable [11–15]. Despite this,starch-based materials are brittle with poor mechanical and water barrier properties. Thus, furthermodification must be done to acquire more decent material properties. The most common method is byplasticising starch to reduce intermolecular forces and increase the mobility of polymer chains [16,17].
Polymers 2020, 12, 2216; doi:10.3390/polym12102216 www.mdpi.com/journal/polymers

Polymers 2020, 12, 2216 2 of 18
By doing so, plasticised starch or thermoplastic starch (TPS) has a lower glass transition temperatureand improved flexibility. Nevertheless, TPS displayed several weaknesses such as poor mechanicalstrength and water resistance that limit its potential as a packaging material [18]. Reinforcing TPSwith natural fibres has been proven to improve the drawbacks of TPS. Natural fibres can be obtainedfrom agricultural crop residues, such as sugar palm, oil palm, pineapple and banana, which amount tobillions of tons of waste products around the world [19]. Another approach is to blend natural fibreswith different polymers, such as poly (lactic acid) (PLA). PLA is yet another biodegradable polymerthat is comparable in terms of its functional properties to synthetic polymers, such as polypropylene(PP), polyethylene (PE), polyethylene terephthalate (PET), and polystyrene (PS) [20]. The downside ofPLA is its high production cost, which seems to be non-economical in packaging applications [21].Hence, starches, natural fibres and plasticisers have often been chosen to reduce the cost of materialsand improve their drawbacks.
On this basis, sugar palm starches, like most other starches, have intrigued the interest offellow researchers in developing starch-based food packaging materials. For poor countries, moststarches, such as tapioca, potatoes, wheat, rice, cassava and sago are considered a staple food.The exploitation of such carbohydrates, as matrices in polymer composites, has triggered seriouscriticism and condemnation. Thus, sugar palm starch is a potential substitution. Sugar palm starchis a high-amylose starch (37%), which can be extracted from sugar palm trees (Arenga pinnata),multipurpose tropical trees that belong to the Palmae family [22]. Starch has limited processability;therefore, plasticisers are required to improve its processability and other properties. The addition ofa plasticiser, such as water, glycerol, and sorbitol helped to improve the thermal stability, ductility,cohesion, resistance to retrogradation, and elongation at break of TPS [23]. Aside from their starch,which is extracted from the trunk, almost all parts of the sugar palm tree can be utilised to createsignificant products. Traditionally, the palm was tapped to obtain the sugar palm sap, which isconverted into brown sugar blocks, vinegar, bio-ethanol, and toddy. Sugar palm fibres are naturallywoven fibres attached to the trunk and can be used to make sea water-resistant fibres, while the leavescan be used to make brooms, roofing, baskets, matting, and cattle feed [24]. Until recently, sugar palmfibre has been utilised in advanced engineering applications, such as a substitute for glass fibre inthe soil stabilisation of road construction, to reinforce polymers, as a matrix composite in materialengineering and in underwater cables [25]. Nanocellulose fibres isolated from sugar palm fibres havegained tremendous attraction due to their unique features, such as their excellent mechanical properties,high surface area (100 m2 g−1), high aspect ratio of 100, light weight, and low density compared toother commercial fibres [26–31]. Cao et al. [32] reported that nanocrystalline cellulose has a hightheoretical Young’s modulus value of approximately 150 GPa, which is comparable to the value of steelat 200 GPa. The incorporation of nanocellulose fibres into the TPS matrix has reportedly resulted inthe high compatibility of 3D hydrogen bonding networks between starch and nanocellulose fibres, thusimproving mechanical strength and water barrier properties [33,34]. According to Ilyas et al., sugarpalm starch film reinforced with 0.5% sugar palm nanocellulose demonstrated an improvement inboth tensile strength (140%) [35] and water vapour permeability (19.94%) [36]. Even so, TPS still doesnot have the qualities of petrochemical plastics. It was also reported that sugar palm starch and PLAbilayers significantly increased the mechanical resistance and reduced water vapour permeability [37].
Blending TPS and PLA has helped to offset each material’s weakness and potentially overcomethe global plastic waste problem. Thus, it is essential to evaluate the performance of TPS/PLAblends as packaging materials that may be beneficial for humans and the ecosystem. To the bestof the authors’ knowledge, and from the above literature review, no work has been carried out inthe past on the performance of sugar palm nanocellulose fibre-reinforced thermoplastic sugar palmstarch/poly (lactic acid) (PLA) blend bionanocomposites. For this reason, the performance of differentratios of TPS/PLA blends mixed in sugar palm nanocellulose fibre composites, which include physical,mechanical, thermal, chemical, and barrier properties, is presented in this paper.

Polymers 2020, 12, 2216 3 of 18
2. Materials and methods
2.1. Materials
Sugar palm starch was obtained from sugar palm trees located in Jempol, Negeri Sembilan,Malaysia. Matured sugar palm trees were cut and the interior trunk parts were crushed to acquirewoody fibres mixed with starch. Water was added to separate the fibres and starch. Since starch isdenser than water, the starch sunk into the sedimentation, while the fibre floated to the top. The fibreswere removed and the remaining starch was filtered to remove fibrous remnants. The supernatantwas discarded, and the wet starch was kept in open air for 48 h, followed by air drying in the ovenfor 100 ◦C for 24 h. Poly (lactic acid) (PLA) resin (NatureWorks 2003D) was purchased from MechaSolve Engineering, Petaling Jaya, Malaysia. Sorbitol and glycerol were used to improve the sugar palmstarch’s processability. Table 1 shows the composition of sugar palm starch and various starches.
Table 1. The composition of sugar palm starch and various starches [38].
Starch Density Water Content (%) Amylose (%)
Tapioca 1.446–1.461 13 17Sago - 10–20 24–27
Potato 1.54–1.55 18–19 20–25Wheat 1.44 13 26–27Maize 1.5 12–13 26–28
Sugar palm 1.54 15 37.60
2.2. Sugar Palm Nanocellulose Preparation
Sugar palm fibre can be found entwined naturally from the bottom to the top of the trunk ofsugar palm trees. The fibre was cut using an axe and then ground using a Fritsch Pulverisette mill toproduce a finer size of 2 mm. The fibre went through a bleaching process to remove lignin-producingholocellulose ASTM D1104-56 [35]. Then, the holocellulose was further treated to obtain α-celluloseaccording to ASTM D1103-60 (1977) [39]. The acquired cellulose went through acid hydrolysis inwhich it was soaked in aqueous H2SO4 (60%) and mechanically stirred at 1200 rpm for 45 min at 45 ◦C.The ratio of the cellulose to H2SO4 solution was 5:100 (%). After that, the hydrolysed cellulose waswashed four times by centrifugation at 6000 rpm for 20 min at 10 ◦C. The suspension was dialysedusing distilled water to attain a constant pH value (6.5–7.0). The suspension was sonicated for 30 minbefore being freeze-dried at −110 ◦C using ethylene gas and then stored prior to sample analysis.The outcomes from the characterization of the sugar palm nanocellulose can be found in work done byIlyas et al. [35] Table 2 displays the physical properties of sugar palm nanocellulose.
Table 2. Physical properties of sugar palm nanocellulose.
Properties Value
Diameter (nm) 9
Density (g/cm−3) 1.05
Moisture content (wt %) 17.90
Degree of crystallinity (%) 85.9
Surface area (m2/g) 14.47
Pore volume (cm3/g) 0.226
Degree of polymerization 142.86
Molecular weight (g/mol) 23164.7

Polymers 2020, 12, 2216 4 of 18
2.3. Sample Preparation
TPS was prepared using the solution-casting method. Firstly, 100 g of sugar palm starch, 0.5 g ofsugar palm nanocrystalline cellulose fibre (0.5%), and 15 g of both glycerol (15%) and sorbitol (15%)were added into 1000 mL of distilled water. The mixture underwent sonication for 15 min to promotesugar palm nanocrystalline cellulose dispersion. The mixture was heated in a water bath at 90 ◦C for1 h under continuous stirring. After that, the mixture was poured into glass petri dishes and finallyleft to dry in the oven at 60 ◦C for 24 h. PLA and TPS were then melt blended using a BrabenderPlastograph (Model 815651, Brabender GmbH & Co. KG, Duisburg, Germany) at 170 ◦C for 13 minwith a rotor speed of 50 rpm. PLA and TPS were mixed into different ratios (80:20, 70:30, 60:40, 40:60,and 20:80). The blend bionanocomposites were crushed into granule size before being hot pressed at170 ◦C for 17 min into 150 mm × 150 mm × 3 mm sheets. Figure 1 shows the illustration of preparationof TPS/PLA blend bionanocomposites.
2.4. Scanning Electron Microscope (SEM)
The fractured surface of the samples was observed under SEM, model Hitachi S-3400N, operatingat an acceleration voltage of 10kV. All samples were coated with gold using an argon plasma metalliser(sputter coater KK575X) (Edwards Limited, Crawley, United Kingdom) to avoid unwanted charging.
2.5. Density
The density was determined by using balance (XS205 Mettler Toledo). The sample weightwas labelled as m before being submerged into distilled water. The volume of liquid displacedafter the submersion was recorded as V and the density ρ was calculated from Equation (1). Fivemeasurements were conducted at 26 ◦C and the average value was computed.
ρ =mV
(1)
2.6. FTIR Analysis
Fourier transform infrared (FTIR) spectroscopy was used to detect the presence of functionalgroups existing in the PLA/TPS blends. The spectra of the material were obtained using an IRspectrometer (Nicolet 6700 AEM). The FTIR spectra of the samples (10 mm × 10 mm × 3 mm) werecollected in the range of 4000–400 cm−1.
2.7. Thermogravimetric Analysis (TGA)
The thermal degradation behaviours of blend bionanocomposites were analysed bythermogravimetric analysis (TGA) with respect to weight loss due to the increase in temperature.TGA was performed with a Q series thermal analysis machine from TA Instruments (New Castle,DE, USA). The analysis was carried out in aluminium pans under a dynamic nitrogen atmosphere inthe temperature range 25–900 ◦C at a heating rate of 10 ◦C/min.
2.8. Water Absorption
Five samples (10 mm × 10 mm × 3 mm) were dried in an air-circulating oven at 100 ± 2 ◦C for24 h in order to remove existing moisture and then immersed in water at room temperature (23 ± 1 ◦C)for 0.5 h and 2 h, as proposed by previous studies. The samples were weighed before (Wi) and afterimmersion (Wf) and the water absorption of the laminates was calculated using Equation (2):
Water absorption (%) = [(Wf −Wi)/Wi] × 100 (2)

Polymers 2020, 12, 2216 5 of 18
Polymers 2020, 12, x FOR PEER REVIEW 4 of 19
2.3. Sample Preparation
TPS was prepared using the solution-casting method. Firstly, 100 g of sugar palm starch, 0.5 g of sugar palm nanocrystalline cellulose fibre (0.5%), and 15 g of both glycerol (15%) and sorbitol (15%) were added into 1000 mL of distilled water. The mixture underwent sonication for 15 min to promote sugar palm nanocrystalline cellulose dispersion. The mixture was heated in a water bath at 90 °C for 1 h under continuous stirring. After that, the mixture was poured into glass petri dishes and finally left to dry in the oven at 60 °C for 24 h. PLA and TPS were then melt blended using a Brabender Plastograph (Model 815651, Brabender GmbH & Co. KG, Duisburg, Germany) at 170 °C for 13 min with a rotor speed of 50 rpm. PLA and TPS were mixed into different ratios (80:20, 70:30, 60:40, 40:60, and 20:80). The blend bionanocomposites were crushed into granule size before being hot pressed at 170 °C for 17 min into 150 mm × 150 mm × 3 mm sheets. Figure 1 shows the illustration of preparation of TPS/PLA blend bionanocomposites.
Unproductive sugar palm tree
Sugar palm starch from trunk was harvested, washed and filtered
Sugar palm nanocellulose isolation: Delignification (ASTM D1104-56) Mercerization (ASTM D1103-60) Acid hydrolysis (60% H2SO4,
mechanical stirred with 1200 rpm for 45 min at 45°C)
Thermoplastic sugar palm starch
was crushed
Poly (lactic acid) (PLA)
pellets
(a (b
PLA/TPS blend; (a) tensile and (b) flexural
Solution casting
Melt blending using brabender
PLA/TPS pellets
Compression molding
Figure 1. Thermoplastic starch (TPS)/poly (lactic acid) (PLA) blend bionanocomposite preparation.
2.9. Thickness Swelling
Five samples (10 mm × 10 mm × 3 mm) were dried in an air-circulating oven at 100 ± 2 ◦C for24 h in order to remove existing moisture and then immersed in water at room temperature (23 ± 1 ◦C)for 0.5 h and 2 h, as proposed by previous studies. The thickness swelling of samples was measuredbefore (Ti) and after immersion (Tf) using a digital Vernier (Model: Mitutoyo) with 0.01-cm accuracy.The thickness swelling ratio of the blend was calculated using Equation (3):
Thickness swelling (%) = [(Tf − Ti)/Ti] × 100 (3)

Polymers 2020, 12, 2216 6 of 18
2.10. Tensile Testing
Tensile tests were conducted according to ASTM D-638 at a temperature of 23 ± 1 ◦C and a relativehumidity of 50 ± 5%. The tests were carried out on five repetitions using a Universal Testing Machine(INSTRON 5556) with a 5-kN load cell; the crosshead speed was maintained at 1 mm/min.
2.11. Flexural Testing
Flexural tests were conducted according to ASTM D-790 at a temperature of 23 ± 1 ◦Cand a relative humidity of 50 ± 5%. The samples were prepared with dimensions of130 mm (L) × 13 mm (W) × 3 mm (T). The tests were carried out with five repetitions using a UniversalTesting Machine (INSTRON 5556) with a 5-kN load cell; the crosshead speed was maintained at1 mm/min. The support span length was set at a ratio of 16:1 to the thickness of the samples.
3. Results and Discussion
The results and a discussion of the performance of the nanocellulose fibre-reinforced PLA/TPSblend bionanocomposites are presented in the following subsections.
3.1. FTIR Analysis
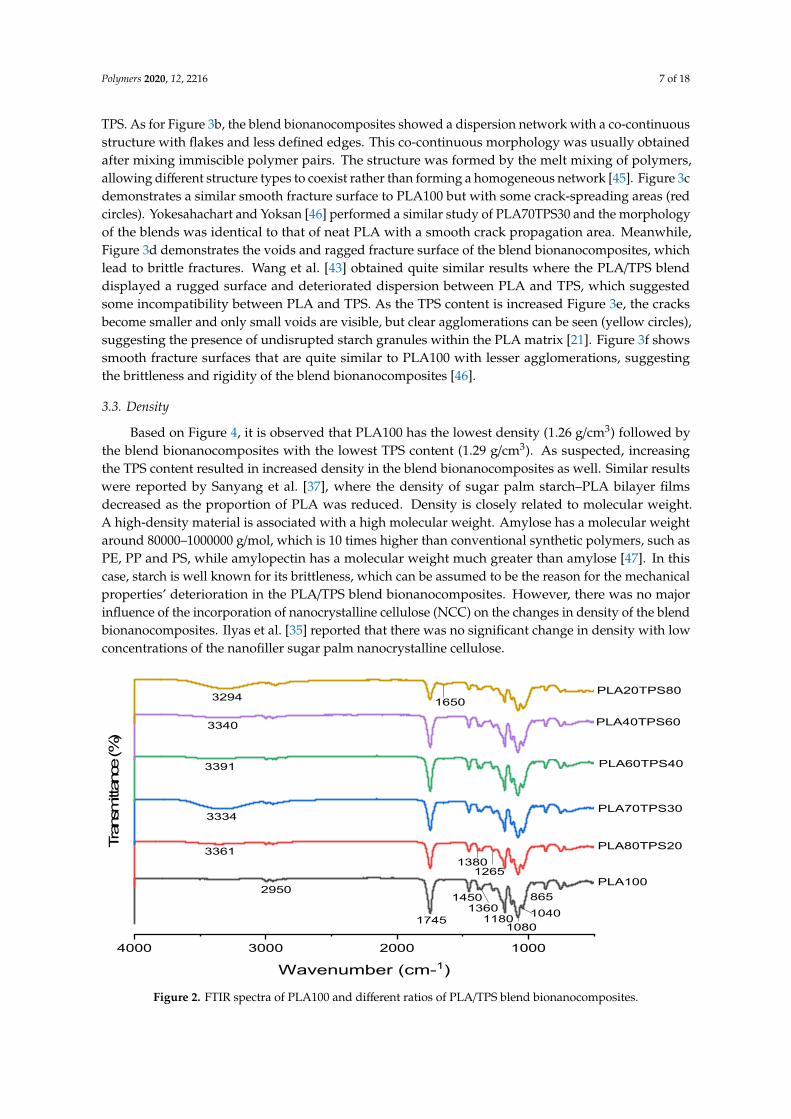
The FTIR data were analysed to demonstrate the possible physical and chemical interactionsbetween PLA, TPS, and nanocellulose fibres. Figure 2 shows the FTIR spectrum curves of the PLA100and PLA/TPS blend bionanocomposites of different ratios. It was found that the FTIR spectrum forPLA100 and PLA/TPS blend bionanocomposites showed quite similar peaks. With the exception ofPLA100, all blend bionanocomposite spectra showed broad absorption bands ranging from 3200 to3500 cm−1, which indicated the presence of O–H groups in starch, glycerol, and cellulose fibre associatedwith free, inter-, and intramolecular bound hydroxyl groups. However, PLA70TPS30 and PLA20TPS80showed a higher wavenumber shift in the O–H band compared to other bionanocomposites. The shiftedwavenumber implied weak inter and intramolecular hydrogen bonds between starch chains. Theseresults reflect that blending PLA with starch hindered the hydrogen bonds of starch molecules.The IR spectra of PLA100 and all blend bionanocomposites for C–H stretching can be observed at3000–2875 cm−1. The sharp absorption peak at approximately 1745 cm−1 might be associated withthe –C=O stretching vibration of the ester group in PLA. With the addition of TPS, the peak seemsto shift to a lower wavenumber, which can be seen in all bionanocomposite samples. The functiongroups might be affected by the weak interaction between these two immiscible polymers. Accordingto Wan et al. [40], the carbonyl groups also played a role in the interaction between PLA and TPS,increasing the dispersion of the two phases. The peaks at approximately 1450 and 1360 cm−1 wereassigned to asymmetric and symmetric –CH3 deformation vibrations, respectively [41]. The sharpabsorption peaks at 1180, 1080, and 1040 cm−1 represent the C–O stretching vibration [42]. After TPSaddition, these peaks can be seen to have shifted to a lower wavenumber. These phenomena aresimilar to the shifted wavenumber at 1745 cm−1. At the 865 cm−1 absorption peak, the presence of C–Cbonding was detected. Figure 2 shows that all blend bionanocomposites have predominant functionalgroups of hydroxyl, whereas PLA100 has the highest carbonyl groups.
3.2. Morphological Analysis
Figure 3 shows the SEM images of the tensile fractured surfaces of PLA100 and the PLA/TPSblend bionanocomposites. In general, the SEM images showed that good dispersion was achieved byusing the combination of glycerol, sorbitol, and water as plasticisers. As reported by Wang et al. [43],the substitution of a 10% weight of glycerol with water resulted in no visible starch granuleson the fracture surface of PLA/TPS blend bionanocomposites. However, Li and Huneault [44]performed a study on the comparison of glycerol and sorbitol on a PLA/TPS blend and found out thatthe substitution of glycerol with sorbitol decreased the particle size and promoted a fine dispersion of
Polymers 2020, 12, 2216 7 of 18
TPS. As for Figure 3b, the blend bionanocomposites showed a dispersion network with a co-continuousstructure with flakes and less defined edges. This co-continuous morphology was usually obtainedafter mixing immiscible polymer pairs. The structure was formed by the melt mixing of polymers,allowing different structure types to coexist rather than forming a homogeneous network [45]. Figure 3cdemonstrates a similar smooth fracture surface to PLA100 but with some crack-spreading areas (redcircles). Yokesahachart and Yoksan [46] performed a similar study of PLA70TPS30 and the morphologyof the blends was identical to that of neat PLA with a smooth crack propagation area. Meanwhile,Figure 3d demonstrates the voids and ragged fracture surface of the blend bionanocomposites, whichlead to brittle fractures. Wang et al. [43] obtained quite similar results where the PLA/TPS blenddisplayed a rugged surface and deteriorated dispersion between PLA and TPS, which suggestedsome incompatibility between PLA and TPS. As the TPS content is increased Figure 3e, the cracksbecome smaller and only small voids are visible, but clear agglomerations can be seen (yellow circles),suggesting the presence of undisrupted starch granules within the PLA matrix [21]. Figure 3f showssmooth fracture surfaces that are quite similar to PLA100 with lesser agglomerations, suggestingthe brittleness and rigidity of the blend bionanocomposites [46].
3.3. Density
Based on Figure 4, it is observed that PLA100 has the lowest density (1.26 g/cm3) followed bythe blend bionanocomposites with the lowest TPS content (1.29 g/cm3). As suspected, increasingthe TPS content resulted in increased density in the blend bionanocomposites as well. Similar resultswere reported by Sanyang et al. [37], where the density of sugar palm starch–PLA bilayer filmsdecreased as the proportion of PLA was reduced. Density is closely related to molecular weight.A high-density material is associated with a high molecular weight. Amylose has a molecular weightaround 80000–1000000 g/mol, which is 10 times higher than conventional synthetic polymers, such asPE, PP and PS, while amylopectin has a molecular weight much greater than amylose [47]. In thiscase, starch is well known for its brittleness, which can be assumed to be the reason for the mechanicalproperties’ deterioration in the PLA/TPS blend bionanocomposites. However, there was no majorinfluence of the incorporation of nanocrystalline cellulose (NCC) on the changes in density of the blendbionanocomposites. Ilyas et al. [35] reported that there was no significant change in density with lowconcentrations of the nanofiller sugar palm nanocrystalline cellulose.Polymers 2020, 12, x FOR PEER REVIEW 7 of 19
Figure 2. FTIR spectra of PLA100 and different ratios of PLA/TPS blend bionanocomposites.
3.2. Morphological Analysis
Figure 3 shows the SEM images of the tensile fractured surfaces of PLA100 and the PLA/TPS blend bionanocomposites. In general, the SEM images showed that good dispersion was achieved by using the combination of glycerol, sorbitol, and water as plasticisers. As reported by Wang et al. [43], the substitution of a 10% weight of glycerol with water resulted in no visible starch granules on the fracture surface of PLA/TPS blend bionanocomposites. However, Li and Huneault [44] performed a study on the comparison of glycerol and sorbitol on a PLA/TPS blend and found out that the substitution of glycerol with sorbitol decreased the particle size and promoted a fine dispersion of TPS. As for Figure 3b, the blend bionanocomposites showed a dispersion network with a co-continuous structure with flakes and less defined edges. This co-continuous morphology was usually obtained after mixing immiscible polymer pairs. The structure was formed by the melt mixing of polymers, allowing different structure types to coexist rather than forming a homogeneous network [45]. Figure 3c demonstrates a similar smooth fracture surface to PLA100 but with some crack-spreading areas (red circles). Yokesahachart and Yoksan [46] performed a similar study of PLA70TPS30 and the morphology of the blends was identical to that of neat PLA with a smooth crack propagation area. Meanwhile, Figure 3d demonstrates the voids and ragged fracture surface of the blend bionanocomposites, which lead to brittle fractures. Wang et al. [43] obtained quite similar results where the PLA/TPS blend displayed a rugged surface and deteriorated dispersion between PLA and TPS, which suggested some incompatibility between PLA and TPS. As the TPS content is increased Figure 3e, the cracks become smaller and only small voids are visible, but clear agglomerations can be seen (yellow circles), suggesting the presence of undisrupted starch granules within the PLA matrix [21]. Figure 3f shows smooth fracture surfaces that are quite similar to PLA100 with lesser agglomerations, suggesting the brittleness and rigidity of the blend bionanocomposites [46].
4000 3000 2000 1000
Tran
smittan
ce (%
)
Wavenumber (cm-1)
PLA20TPS80
PLA40TPS60
PLA60TPS40
PLA70TPS30
PLA80TPS20
PLA1002950
3361
3334
3391
3340
3294
1745
1450
11801080
865
1380
10401360
1265
1650
Figure 2. FTIR spectra of PLA100 and different ratios of PLA/TPS blend bionanocomposites.

Polymers 2020, 12, 2216 8 of 18Polymers 2020, 12, x FOR PEER REVIEW 8 of 19
Figure 3. SEM images of tensile fractured surfaces for (a) PLA100, (b) PLA80TPS20, (c) PLA70TPS30, (d) PLA60TPS40, (e) PLA40TPS60, (f) PLA20TPS80.
3.3. Density
Based on Figure 4, it is observed that PLA100 has the lowest density (1.26 g/cm3) followed by the blend bionanocomposites with the lowest TPS content (1.29 g/cm3). As suspected, increasing the TPS content resulted in increased density in the blend bionanocomposites as well. Similar results were reported by Sanyang et al. [37], where the density of sugar palm starch–PLA bilayer films decreased as the proportion of PLA was reduced. Density is closely related to molecular weight. A high-density material is associated with a high molecular weight. Amylose has a molecular weight around 80000–1000000 g/mol, which is 10 times higher than conventional synthetic polymers, such as PE, PP and PS, while amylopectin has a molecular weight much greater than amylose [47]. In this case, starch is
Figure 3. SEM images of tensile fractured surfaces for (a) PLA100, (b) PLA80TPS20, (c) PLA70TPS30,(d) PLA60TPS40, (e) PLA40TPS60, (f) PLA20TPS80.
3.4. Mechanical Properties
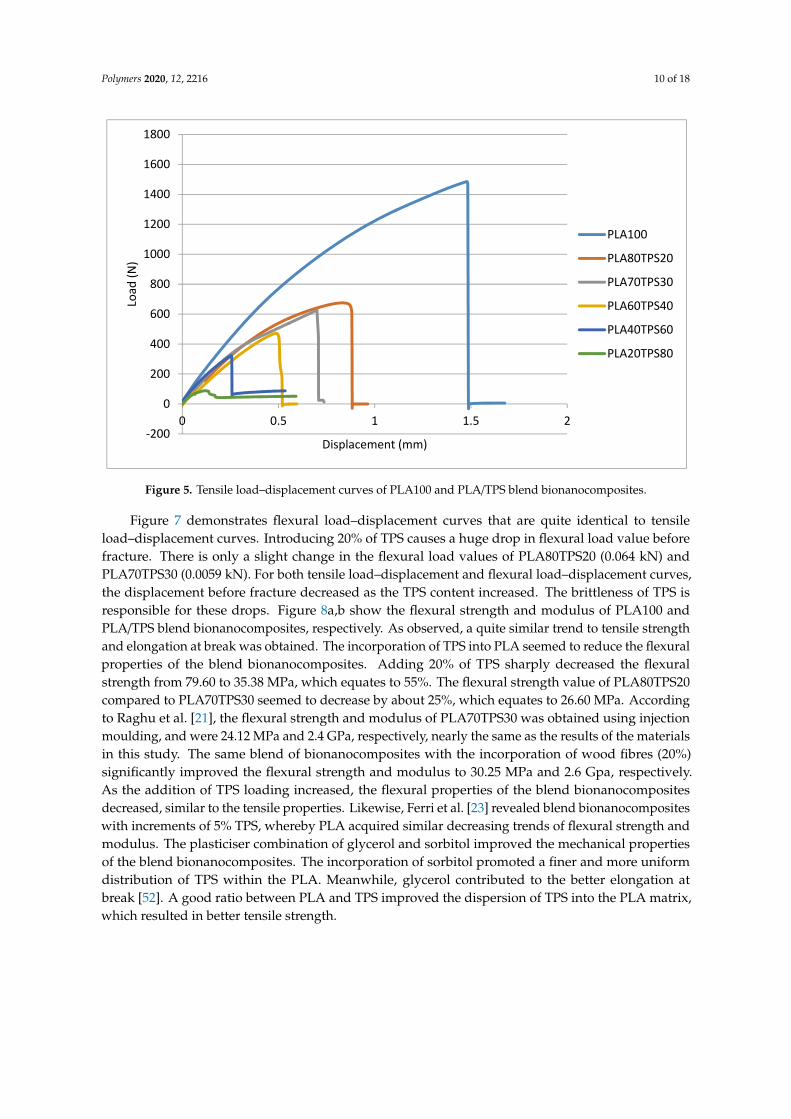
In terms of mechanical properties, PLA demonstrates excellent polymer properties comparableto synthetic polymers. However, the high price tag due to its complex production process is noteconomical for food packaging applications. As a step to reduce the cost, TPS was chosen to be blendedwith PLA, producing an acceptable standard of mechanical properties for packaging materials. Therewere five ratios of PLA/TPS blend bionanocomposites with different TPS contents: 20%, 30%, 40%,60% and 80% (w/w). Figure 5 gives the tensile load–displacement curves for PLA100 and PLA/TPSblend bionanocomposites. In the figure, the addition of 20% of TPS content decreased the tensileload (0.67 kN) before fracture, exceeding 50% compared to PLA100 (1.46 kN). However, further

Polymers 2020, 12, 2216 9 of 18
addition up to 30% only decreased the tensile load to 0.63 kN. Both tensile load and displacementvalues kept on decreasing as TPS content increased. Referring to Figure 6, as expected, PLA100 orneat PLA possessed superior mechanical properties, surpassing all the blend bionanocomposites.The addition of TPS into PLA decreased 60% of the tensile strength from 49.08 to 19.45 MPa withjust 20% of TPS addition. It is well known that PLA and TPS are chemically incompatible and TPSmight have contributed to the brittleness of the PLA blend [48]. The same goes for the elongation atbreak, where PLA100 had the highest value (5.28%) and the values kept on decreasing as TPS wasadded. Similar results were obtained by Wokadala et al. [49], where every 10% addition of waxy starchdecreased the elongation at break. There was only a slight difference in the tensile strength valuesof PLA80TPS20 and PLA70TPS30, which were 19.45 and 18.50 MPa, respectively. Akrami et al. [50]fabricated a PLA/TPS blend (70:30) using melt blending and compression moulding, which producedquite similar values of tensile strength (18 MPa) but lower values of elongation at break (1.34%). Thismay be due to the incompatibility of the PLA matrix with the dispersed phase. The tensile strengthvalue of PLA60TPS40 (12.11MPa) dropped drastically compared to PLA70TPS30 (18.5MPa), which wasabout 34.5%. This can be related to the SEM imaging of PLA60TPS40 with some voids and a raggedstructure that caused brittle fractures. As can be seen from the morphology of the polymer blendbionanocomposites with higher TPS contents (PLA40TPS60 and PLA20TPS80), partial agglomerationcan be found, suggesting poor interfacial adhesion between PLA and TPS. This resulted in a furtherdecrease in the tensile strength [51]. This verified that every increment of TPS content into PLA ledto a decline in tensile strength and further elongation at break due to the brittleness of TPS. Even so,the increasing addition of TPS appeared to improve the Young’s modulus.
Polymers 2020, 12, x FOR PEER REVIEW 9 of 19
well known for its brittleness, which can be assumed to be the reason for the mechanical properties’ deterioration in the PLA/TPS blend bionanocomposites. However, there was no major influence of the incorporation of nanocrystalline cellulose (NCC) on the changes in density of the blend bionanocomposites. Ilyas et al. [35] reported that there was no significant change in density with low concentrations of the nanofiller sugar palm nanocrystalline cellulose.
Figure 4. Density of PLA100 and PLA/TPS blend bionanocomposites.
3.4. Mechanical Properties
In terms of mechanical properties, PLA demonstrates excellent polymer properties comparable to synthetic polymers. However, the high price tag due to its complex production process is not economical for food packaging applications. As a step to reduce the cost, TPS was chosen to be blended with PLA, producing an acceptable standard of mechanical properties for packaging materials. There were five ratios of PLA/TPS blend bionanocomposites with different TPS contents: 20%, 30%, 40%, 60% and 80% (w/w). Figure 5 gives the tensile load–displacement curves for PLA100 and PLA/TPS blend bionanocomposites. In the figure, the addition of 20% of TPS content decreased the tensile load (0.67 kN) before fracture, exceeding 50% compared to PLA100 (1.46 kN). However, further addition up to 30% only decreased the tensile load to 0.63 kN. Both tensile load and displacement values kept on decreasing as TPS content increased. Referring to Figure 6, as expected, PLA100 or neat PLA possessed superior mechanical properties, surpassing all the blend bionanocomposites. The addition of TPS into PLA decreased 60% of the tensile strength from 49.08 to 19.45 MPa with just 20% of TPS addition. It is well known that PLA and TPS are chemically incompatible and TPS might have contributed to the brittleness of the PLA blend [48]. The same goes for the elongation at break, where PLA100 had the highest value (5.28%) and the values kept on decreasing as TPS was added. Similar results were obtained by Wokadala et al. [49], where every 10% addition of waxy starch decreased the elongation at break. There was only a slight difference in the tensile strength values of PLA80TPS20 and PLA70TPS30, which were 19.45 and 18.50 MPa, respectively. Akrami et al. [50] fabricated a PLA/TPS blend (70:30) using melt blending and compression moulding, which produced quite similar values of tensile strength (18 MPa) but lower values of elongation at break (1.34%). This may be due to the incompatibility of the PLA matrix with the dispersed phase. The tensile strength value of PLA60TPS40 (12.11MPa) dropped drastically compared to PLA70TPS30 (18.5MPa), which was about 34.5%. This can be related to the SEM imaging
1.41
1.37
1.331.31
1.29
1.26
1.15
1.20
1.25
1.30
1.35
1.40
1.45
PLA20TPS80 PLA40TPS60 PLA60TPS40 PLA70TPS30 PLA80TPS20 PLA100
Dens
ity (g
/cm
3)
Figure 4. Density of PLA100 and PLA/TPS blend bionanocomposites.
Polymers 2020, 12, 2216 10 of 18
Polymers 2020, 12, x FOR PEER REVIEW 10 of 19
of PLA60TPS40 with some voids and a ragged structure that caused brittle fractures. As can be seen from the morphology of the polymer blend bionanocomposites with higher TPS contents (PLA40TPS60 and PLA20TPS80), partial agglomeration can be found, suggesting poor interfacial adhesion between PLA and TPS. This resulted in a further decrease in the tensile strength [51]. This verified that every increment of TPS content into PLA led to a decline in tensile strength and further elongation at break due to the brittleness of TPS. Even so, the increasing addition of TPS appeared to improve the Young’s modulus.
Figure 5. Tensile load–displacement curves of PLA100 and PLA/TPS blend bionanocomposites.
-200
0
200
400
600
800
1000
1200
1400
1600
1800
0 0.5 1 1.5 2
Load
(N)
Displacement (mm)
PLA100
PLA80TPS20
PLA70TPS30
PLA60TPS40
PLA40TPS60
PLA20TPS80
Figure 5. Tensile load–displacement curves of PLA100 and PLA/TPS blend bionanocomposites.
Figure 7 demonstrates flexural load–displacement curves that are quite identical to tensileload–displacement curves. Introducing 20% of TPS causes a huge drop in flexural load value beforefracture. There is only a slight change in the flexural load values of PLA80TPS20 (0.064 kN) andPLA70TPS30 (0.0059 kN). For both tensile load–displacement and flexural load–displacement curves,the displacement before fracture decreased as the TPS content increased. The brittleness of TPS isresponsible for these drops. Figure 8a,b show the flexural strength and modulus of PLA100 andPLA/TPS blend bionanocomposites, respectively. As observed, a quite similar trend to tensile strengthand elongation at break was obtained. The incorporation of TPS into PLA seemed to reduce the flexuralproperties of the blend bionanocomposites. Adding 20% of TPS sharply decreased the flexuralstrength from 79.60 to 35.38 MPa, which equates to 55%. The flexural strength value of PLA80TPS20compared to PLA70TPS30 seemed to decrease by about 25%, which equates to 26.60 MPa. Accordingto Raghu et al. [21], the flexural strength and modulus of PLA70TPS30 was obtained using injectionmoulding, and were 24.12 MPa and 2.4 GPa, respectively, nearly the same as the results of the materialsin this study. The same blend of bionanocomposites with the incorporation of wood fibres (20%)significantly improved the flexural strength and modulus to 30.25 MPa and 2.6 Gpa, respectively.As the addition of TPS loading increased, the flexural properties of the blend bionanocompositesdecreased, similar to the tensile properties. Likewise, Ferri et al. [23] revealed blend bionanocompositeswith increments of 5% TPS, whereby PLA acquired similar decreasing trends of flexural strength andmodulus. The plasticiser combination of glycerol and sorbitol improved the mechanical propertiesof the blend bionanocomposites. The incorporation of sorbitol promoted a finer and more uniformdistribution of TPS within the PLA. Meanwhile, glycerol contributed to the better elongation atbreak [52]. A good ratio between PLA and TPS improved the dispersion of TPS into the PLA matrix,which resulted in better tensile strength.

Polymers 2020, 12, 2216 11 of 18
Polymers 2020, 12, x FOR PEER REVIEW 11 of 19
Figure 6. (a) Tensile strength, (b) elongation at break, (c) Young’s modulus of PLA100 and PLA/TPS blend bionanocomposites.
Figure 7 demonstrates flexural load–displacement curves that are quite identical to tensile load–displacement curves. Introducing 20% of TPS causes a huge drop in flexural load value before fracture. There is only a slight change in the flexural load values of PLA80TPS20 (0.064 kN) and PLA70TPS30 (0.0059 kN). For both tensile load–displacement and flexural load–displacement curves, the displacement before fracture decreased as the TPS content increased. The brittleness of TPS is responsible for these drops. Figure 8a,b show the flexural strength and modulus of PLA100 and PLA/TPS blend bionanocomposites, respectively. As observed, a quite similar trend to tensile strength and elongation at break was obtained. The incorporation of TPS into PLA seemed to reduce the flexural properties of the blend bionanocomposites. Adding 20% of TPS sharply decreased the flexural strength from 79.60 to 35.38 MPa, which equates to 55%. The flexural strength value of PLA80TPS20 compared to PLA70TPS30 seemed to decrease by about 25%, which equates to 26.60 MPa. According to Raghu et al. [21], the flexural strength and modulus of PLA70TPS30 was obtained using injection moulding, and were 24.12 MPa and 2.4 GPa, respectively, nearly the same as the results of the materials in this study. The same blend of bionanocomposites with the incorporation of wood fibres (20%) significantly improved the flexural strength and modulus to 30.25 MPa and 2.6
2.35
9.5812.11
18.50 19.45
49.08
0.00
10.00
20.00
30.00
40.00
50.00
60.00Te
nsile
Str
engt
h (M
Pa)
1.401.56
1.401.30
1.19
1.69
0.00
0.20
0.40
0.60
0.80
1.00
1.20
1.40
1.60
1.80
2.00
Mod
ulus
(GPa
)
1.401.73
2.442.75
3.40
5.28
0.00
1.00
2.00
3.00
4.00
5.00
6.00
7.00
Elon
gatio
n (%
)
(a) (b)
(c)
Figure 6. (a) Tensile strength, (b) elongation at break, (c) Young’s modulus of PLA100 and PLA/TPSblend bionanocomposites.
3.5. Thermal Properties
Thermogravimetric analysis (TGA) and derivative thermogravimetric (DTG) curves wereemployed to investigate the thermal stability and decomposition of polymeric systems. The prominentpeak in the DTG curves and the specific weight loss in the TGA graph are associated with each thermaldegradation stage. It is important to acquire the statistics regarding degradation and decompositionmode under heat exposure in order to optimise the processing capabilities of a polymer [53]. Figure 9a,bshow the results of the TGA and DTG curves of PLA100 and PLA/TPS blend bionanocomposites, whichdemonstrated three thermal degradation stages where the initial stage happened at a temperaturebelow 100 ◦C. According to Sanyang et al. [22], the mass loss within this stage can be related tothe evaporation or dehydration of poorly bound water and low molecular weight compounds inthe blend bionanocomposites. Table 3 shows the thermal degradation temperatures at 5% (T5%),25% (T25%), 50% (T50%) and 75% (T75%) mass losses and maximum weight loss (Tmax%). At 5%weight loss, the degradation temperature of bionanocomposite samples drop as TPS content is added.

Polymers 2020, 12, 2216 12 of 18
However, PLA80TPS20 and PLA70TPS30 (222 ◦C) demonstrate a similar degradation temperaturein the same way as PLA60TPS40 and PLA40TPS60 (158 ◦C). There is a huge drop in the degradationtemperature from PLA60TPS40 to PLA40TPS60. This change is related to the higher concentration ofglycerol in the higher proportion of TPS. The volatilisation of hydrolysed glycerol occurs at 160–195 ◦C.The maximum weight loss (Tmax%) for all blend bionanocomposites observed in the temperaturerange between 343–376 ◦C, indicating the maximum degradation of PLA and TPS. The char residuesignificantly increased as the TPS content increased since starch produces a higher yield of charredproducts compared to PLA.
Polymers 2020, 12, x FOR PEER REVIEW 12 of 19
Gpa, respectively. As the addition of TPS loading increased, the flexural properties of the blend bionanocomposites decreased, similar to the tensile properties. Likewise, Ferri et al. [23] revealed blend bionanocomposites with increments of 5% TPS, whereby PLA acquired similar decreasing trends of flexural strength and modulus. The plasticiser combination of glycerol and sorbitol improved the mechanical properties of the blend bionanocomposites. The incorporation of sorbitol promoted a finer and more uniform distribution of TPS within the PLA. Meanwhile, glycerol contributed to the better elongation at break [52]. A good ratio between PLA and TPS improved the dispersion of TPS into the PLA matrix, which resulted in better tensile strength.
Figure 7. Flexural load–displacement curves of PLA100 and PLA/TPS blend bionanocomposites.
Figure 8. (a) Flexural strength, (b) flexural modulus of PLA100 and PLA/TPS blend bionanocomposites.
-20
0
20
40
60
80
100
120
140
160
-1 0 1 2 3 4 5 6
Flex
ural
Load
(N)
Displacement (mm)
PLA100
PLA80TPS20
PLA70TPS30
PLA60TPS40
PLA40TPS60
PLA20TPS80
3.76
13.7418.37
26.60
35.38
79.69
0.00
10.00
20.00
30.00
40.00
50.00
60.00
70.00
80.00
90.00
Flex
ural
Str
engt
h (M
Pa)
1.01
1.892.07
2.202.38
2.70
0.00
0.50
1.00
1.50
2.00
2.50
3.00
Flex
ural
Mod
ulus
(GPa
)
(a) (b)
Figure 7. Flexural load–displacement curves of PLA100 and PLA/TPS blend bionanocomposites.
Table 3. Thermal degradation temperature of PLA100 and PLA/TPS blend bionanocomposites.
Sample T5% (◦C) T25% (◦C) T50% (◦C) T75% (◦C) Tmax (◦C) CharResidue (%)
PLA20/TPS80 158 290 313 335 343 10.969PLA40/TPS20 158 298 313 335 343 8.824PLA60/TPS40 222 307 324 339 361 4.372PLA70/TPS30 222 298 320 339 361 4.232PLA80/TPS20 286 319 337 354 373 2.198
PLA100 296 332 349 360 376 1.247
The second stage of the thermal degradation occurred within the varying range for all blendbionanocomposite samples. As observed in Figure 9, the increasing addition of TPS resulted ina greater mass loss. PLA80TPS20 had the highest temperature range of 130–280 ◦C. A similardegradation temperature range was observed for PLA70TPS30 and PLA60TPS, which was 130–265 ◦C.The thermal degradation temperature dropped to 130–250 ◦C for both of the lowest PLA contentsamples (PLA40TPS60 and PLA20TPS80). Glycerol has a boiling point of 290 ◦C, but, in this case,starch with a helical structure of all hydroxyl groups formed hydrogen bonds with glycerol andsubsequently lowered the volatility of glycerol in the blend bionanocomposite samples [54]. This stagewas associated with the volatilisation of plasticiser compounds by various authors [18,21,22,35,55].

Polymers 2020, 12, 2216 13 of 18
Polymers 2020, 12, x FOR PEER REVIEW 12 of 19
Gpa, respectively. As the addition of TPS loading increased, the flexural properties of the blend bionanocomposites decreased, similar to the tensile properties. Likewise, Ferri et al. [23] revealed blend bionanocomposites with increments of 5% TPS, whereby PLA acquired similar decreasing trends of flexural strength and modulus. The plasticiser combination of glycerol and sorbitol improved the mechanical properties of the blend bionanocomposites. The incorporation of sorbitol promoted a finer and more uniform distribution of TPS within the PLA. Meanwhile, glycerol contributed to the better elongation at break [52]. A good ratio between PLA and TPS improved the dispersion of TPS into the PLA matrix, which resulted in better tensile strength.
Figure 7. Flexural load–displacement curves of PLA100 and PLA/TPS blend bionanocomposites.
Figure 8. (a) Flexural strength, (b) flexural modulus of PLA100 and PLA/TPS blend bionanocomposites.
-20
0
20
40
60
80
100
120
140
160
-1 0 1 2 3 4 5 6
Flex
ural
Load
(N)
Displacement (mm)
PLA100
PLA80TPS20
PLA70TPS30
PLA60TPS40
PLA40TPS60
PLA20TPS80
3.76
13.7418.37
26.60
35.38
79.69
0.00
10.00
20.00
30.00
40.00
50.00
60.00
70.00
80.00
90.00
Flex
ural
Str
engt
h (M
Pa)
1.01
1.892.07
2.202.38
2.70
0.00
0.50
1.00
1.50
2.00
2.50
3.00
Flex
ural
Mod
ulus
(GPa
)
(a) (b)
Figure 8. (a) Flexural strength, (b) flexural modulus of PLA100 and PLA/TPS blend bionanocomposites.
Polymers 2020, 12, x FOR PEER REVIEW 13 of 19
3.5. Thermal Properties
Thermogravimetric analysis (TGA) and derivative thermogravimetric (DTG) curves were employed to investigate the thermal stability and decomposition of polymeric systems. The prominent peak in the DTG curves and the specific weight loss in the TGA graph are associated with each thermal degradation stage. It is important to acquire the statistics regarding degradation and decomposition mode under heat exposure in order to optimise the processing capabilities of a polymer [53]. Figure 9a,b show the results of the TGA and DTG curves of PLA100 and PLA/TPS blend bionanocomposites, which demonstrated three thermal degradation stages where the initial stage happened at a temperature below 100 °C. According to Sanyang et al. [22], the mass loss within this stage can be related to the evaporation or dehydration of poorly bound water and low molecular weight compounds in the blend bionanocomposites. Table 3 shows the thermal degradation temperatures at 5% (T5%), 25% (T25%), 50% (T50%) and 75% (T75%) mass losses and maximum weight loss (Tmax%). At 5% weight loss, the degradation temperature of bionanocomposite samples drop as TPS content is added. However, PLA80TPS20 and PLA70TPS30 (222 °C) demonstrate a similar degradation temperature in the same way as PLA60TPS40 and PLA40TPS60 (158 °C). There is a huge drop in the degradation temperature from PLA60TPS40 to PLA40TPS60. This change is related to the higher concentration of glycerol in the higher proportion of TPS. The volatilisation of hydrolysed glycerol occurs at 160–195 °C. The maximum weight loss (Tmax%) for all blend bionanocomposites observed in the temperature range between 343–376 °C, indicating the maximum degradation of PLA and TPS. The char residue significantly increased as the TPS content increased since starch produces a higher yield of charred products compared to PLA.
Figure 9. (a) Thermogravimetric analysis (TGA), (b) derivative thermogravimetric (DTG) curves of PLA100 and PLA/TPS blend bionanocomposites.
Table 3. Thermal degradation temperature of PLA100 and PLA/TPS blend bionanocomposites.
Sample T5% (°C) T25% (°C) T50% (°C) T75% (°C) Tmax(°C) Char Residue (%)
PLA20/TPS80 158 290 313 335 343 10.969 PLA40/TPS20 158 298 313 335 343 8.824 PLA60/TPS40 222 307 324 339 361 4.372 PLA70/TPS30 222 298 320 339 361 4.232 PLA80/TPS20 286 319 337 354 373 2.198
PLA100 296 332 349 360 376 1.247
0 100 200 300 400 500 600
-4
-3
-2
-1
0
1
2
3
Der
ivat
ive
wei
ght (
%/°C
)
Temperature (°C)
PLA100 PLA80TPS20 PLA70TPS30 PLA60TPS40 PLA40TPS60 PLA20TPS80
0 100 200 300 400 500 600
0
20
40
60
80
100
Wei
ght (
%)
Temperature (°C)
PLA100 PLA80TPS20 PLA70TPS30 PLA60TPS40 PLA40TPS60 PLA20TPS80
(a) (b)
Figure 9. (a) Thermogravimetric analysis (TGA), (b) derivative thermogravimetric (DTG) curves ofPLA100 and PLA/TPS blend bionanocomposites.
The drastic weight reduction that occurred for all samples indicated the highest thermaldegradation with the temperature beyond 250 ◦C. At this stage, all samples were attributed topolymer matrix decomposition. PLA100 had the highest thermal stability; thus, further addition of TPScontent in the blend bionanocomposites lowered the thermal stability [40]. The maximum degradationrate displayed a varying temperature with PLA100 having the highest value (376 ◦C) followed byPLA80TPS20 (373 ◦C), PLA70TPS30 and PLA60TPS40 (361 ◦C), and PLA40TPS60 and PLA20TPS80(343 ◦C). These shifting temperatures are associated with the decomposition of starch at 280–320 ◦Cand the decomposition of PLA at 330–360 ◦C [56].

Polymers 2020, 12, 2216 14 of 18
3.6. Water Absorption
It is well known that starch-based materials are sensitive to water which is why it is crucialto investigate their sensitivity when blended with hydrophobic polymers for efficient packagingapplications. The water absorption of PLA100 and PLA/TPS blend bionanocomposites after 0.5 and 2 hof immersion is displayed in Table 4. Obviously, the longer period of immersion resulted in a higherwater absorption for all blend bionanocomposite samples. Moreover, a higher concentration of TPSled to even quicker water absorption. At the 0.5 h immersion period, increasing the TPS contentby 10% showed a drastic increment in water absorption from PLA80TPS20 (0.93%) to PLA70TPS30(6.23%) and PLA60TPS40 (11.18%). This can be associated with the presence of cracks and voids asmentioned in the morphological analysis due to the lack of interfacial bonding between the starch andPLA matrix [46]. As for PLA40TPS60 (17%) and PLA20TPS80 (22.4%), the water absorption valuesincreased, respectively, with 20% of TPS variation. The water absorption of all blend bionanocompositesamples skyrocketed after the 2 h immersion period.
Table 4. Density, thickness swelling and water absorption of PLA100 and PLA/TPSblend bionanocomposites.
Sample Density(g/cm3)
Thickness Swelling (%) Water Absorption (%)
0.5 h 2 h 0.5 h 2 h
PLA20/TPS80 1.41 ± 0.01 16.08 ± 1.8 40.17 ± 1.58 22.40 ± 0.95 61.24 ± 0.85PLA40/TPS60 1.37 ± 0.01 11.41 ± 0.3 31.66 ± 1.61 17.0 ± 0.93 46.42 ± 0.84PLA60/TPS40 1.33 ± 0.01 10.72 ± 0.86 25.97 ± 2.02 11.18 ± 0.62 25.21 ± 0.37PLA70/TPS30 1.31 ± 0.01 2.35 ± 0.57 11.23 ± 0.92 6.23 ± 0.27 14.49 ± 0.51PLA80/TPS20 1.29 ± 0.01 0.90 ± 0.21 4.18 ± 0.82 0.93 ± 0.28 5.70 ± 0.37
PLA100 1.26 ± 0.01 0 0 0 0
3.7. Thickness Swelling
The swelling behaviour was studied to investigate the dimensional stability of the materialsfor packaging application purposes. Thickness swelling is often associated with the moistureabsorption capability of the material [57]. The thickness swelling results of PLA100 and PLA/TPS blendbionanocomposites for 0.5 h and 2 h of immersion can be observed in Table 4. Based on the results, allbionanocomposites samples followed a similar trend as the water absorption while PLA100 remainingundisturbed, The bionanocomposites samples showed an increasing trend as TPS loading was increased.For the 0.5-h immersion period, a major increment in swelling values can be seen from PLA80TPS20(0.9%) to PLA70TPS30 (2.35%) and PLA60TPS40 (10.72%). After that, the addition of 20% TPS contentresulted in a further increase in swelling values for PLA40TPS60 (11.41%) and PLA20TPS80 (16.08%).As for 2 h of immersion, it was observed that every blend bionanocomposite sample went througha drastic increase in swelling value. All blend bionanocomposite samples showed a beyond 100%swelling rate compared to 0.5 h of immersion. Teixeira et al. [58] found out that the water absorptionof cassava bagasse nanofibrillated cellulose reinforced thermoplastic cassava starch was reduced by32–37% with the incorporation of only glycerol and by 15–18% with both glycerol and sorbitol.
4. Conclusions
From this study, the effect of different ratios of TPS/PLA blends on sugar palm nanocellulose fibreshelped to reinforce thermoplastic sugar palm starch/poly (lactic acid) (PLA) blend bionanocomposites,as their physical, mechanical and thermal properties were evaluated. A series of PLA/TPS blendbionanocomposites were produced using melt blending and compression moulding with variedloadings of TPS (20%, 30%, 40%, 60% and 80%) and at a constant loading of sugar palm nanocellulosefibres (0.5%). Referring to Table 5, the experimental results demonstrated that the increase inthe TPS loading decreased the overall mechanical properties of the blend bionanocomposites due to

Polymers 2020, 12, 2216 15 of 18
the brittleness of TPS. In addition, there was an increase in the Young’s modulus up to 60% of TPSloading from 1.19 to 1.56 GPa. All bionanocomposite samples except PLA20TPS80 possess acceptablevalues of mechanical properties for packaging applications, considering no compatibiliser was used.As for FTIR analysis, PLA70TPS30 and PLA20TPS80 displayed a higher shifted wavenumber of O–Hbands compared to other bionanocomposites. These results can be related to the apparent increase inthe water absorption of these two samples from the previous samples. The SEM micrograph imagesof the fracture surfaces showed voids and crack- spreading areas for blend bionanocomposites withTPS loadings under 50%. Meanwhile, some agglomerations were visible for blend bionanocompositeswith TPS loadings beyond 50%. This result can be related to the incompatibility of the starch and PLAmatrix without the incorporation of a compatibiliser to enhance its miscibility. The thermal stabilitydecreased as the TPS loading increased from 373 to 343 ◦C. In Table 3, it is observed that PLA60TPS40demonstrated a higher degradation temperature at 25% (307 ◦C) and 50% (324 ◦C) weight lossescompared to PLA70TPS30. It is assumed that PLA60TPS40 has a better affinity between PLA andTPS. The density, water absorption, and thickness swelling increased as the TPS loading increased,which can be associated with the predominant functional group of hydroxyls. However, there wasno significant effect of the sugar palm nanocellulose fibres on the blend bionanocomposites due toa minimal amount being added. In a nutshell, PLA60TPS40 can be considered to achieve reasonablefunctional properties for food packaging applications. Hence, this study reveals the potential ofPLA/TPS blend bionanocomposites for biodegradable packaging applications.
Table 5. Mechanical properties of PLA100 and PLA/TPS blend bionanocomposites.
SampleTensile
Strength(MPa)
Young’sModulus
(GPa)Elongation (%)
FlexuralStrength
(MPa)
FlexuralModulus
(GPa)
PLA20/TPS80 2.35 1.40 1.40 3.76 1.00PLA40/TPS60 9.58 1.55 1.73 13.74 1.88PLA60/TPS40 12.11 1.40 2.44 18.37 2.07PLA70/TPS30 18.50 1.30 2.75 26.60 2.19PLA80/TPS20 19.45 1.19 3.40 35.38 2.38
PLA100 49.08 1.68 5.28 79.69 2.70
Author Contributions: A.N., Methodology; S.M.S., Supervision; M.Y.M.Z. Research design. All authors haveread and agreed to the published version of the manuscript.
Funding: The authors thank Universiti Putra Malaysia for the financial support through the GraduateResearch Assistantship (GRA), the Ministry of Higher Education Malaysia HICoE Grant Scheme (vote no.6369107) and the Fundamental Research Grant Scheme (FRGS), Ministry of Higher Education, Malaysia:FRGS/1/2017/TK05/UPM/01/1 (5540048).
Conflicts of Interest: The authors declare no conflict of interest.
References
1. Ilyas, R.A.; Sapuan, S.M. Biopolymers and Biocomposites: Chemistry and Technology. Curr. Anal. Chem.2020, 16, 500–503. [CrossRef]
2. Ilyas, R.A.; Sapuan, S.M. The Preparation Methods and Processing of Natural Fibre Bio-polymer Composites.Curr. Org. Synth. 2020, 16, 1068–1070. [CrossRef] [PubMed]
3. Atiqah, A.; Jawaid, M.; Sapuan, S.M.; Ishak, M.R.; Ansari, M.N.M.; Ilyas, R.A. Physical and thermalproperties of treated sugar palm/glass fibre reinforced thermoplastic polyurethane hybrid composites.J. Mater. Res. Technol. 2019, 8, 3726–3732. [CrossRef]
4. Nurazzi, N.M.; Khalina, A.; Sapuan, S.M.; Ilyas, R.A.; Rafiqah, S.A.; Hanafee, Z.M. Thermal properties oftreated sugar palm yarn/glass fiber reinforced unsaturated polyester hybrid composites. J. Mater. Res. Technol.2020, 9, 1606–1618. [CrossRef]

Polymers 2020, 12, 2216 16 of 18
5. Abral, H.; Atmajaya, A.; Mahardika, M.; Hafizulhaq, F.; Handayani, D.; Sapuan, S.M.; Ilyas, R.A. Effect ofultrasonication duration of polyvinyl alcohol (PVA) gel on characterizations of PVA film. J. Mater. Res. Technol.2020, 1–10. [CrossRef]
6. Aisyah, H.A.; Paridah, M.T.; Sapuan, S.M.; Khalina, A.; Berkalp, O.B.; Lee, S.H.; Lee, C.H.; Nurazzi, N.M.;Ramli, N.; Wahab, M.S.; et al. Thermal Properties of Woven Kenaf/Carbon Fibre-Reinforced Epoxy HybridComposite Panels. Int. J. Polym. Sci. 2019, 2019, 1–8. [CrossRef]
7. Asyraf, M.R.M.; Ishak, M.R.; Sapuan, S.M.; Yidris, N.; Ilyas, R.A. Woods and composites cantilever beam: Acomprehensive review of experimental and numerical creep methodologies. J. Mater. Res. Technol. 2020.[CrossRef]
8. Hu, S.; Gao, H.; Zhang, J. Study on the properties of poly(lactic acid)/grafted starch composites. Adv. Mater.Res. 2012, 345, 70–74. [CrossRef]
9. Nurazzi, N.M.; Khalina, A.; Sapuan, S.M.; Ilyas, R.A. Mechanical properties of sugar palm yarn/woven glassfiber reinforced unsaturated polyester composites: Effect of fiber loadings and alkaline treatment. Polimery2019, 64, 12–22. [CrossRef]
10. Muller, J.; González-Martínez, C.; Chiralt, A. Combination of Poly(lactic) Acid and Starch for BiodegradableFood Packaging. Materials 2017, 10, 952. [CrossRef]
11. Ilyas, R.A.; Sapuan, S.M.; Ibrahim, R.; Abral, H.; Ishak, M.R.; Zainudin, E.S.; Atikah, M.S.N.; MohdNurazzi, N.; Atiqah, A.; Ansari, M.N.M.; et al. Effect of sugar palm nanofibrillated cellulose concentrationson morphological, mechanical and physical properties of biodegradable films based on agro-waste sugarpalm (Arenga pinnata (Wurmb.) Merr) starch. J. Mater. Res. Technol. 2019, 8, 4819–4830. [CrossRef]
12. Ilyas, R.A.; Sapuan, S.M.; Ibrahim, R.; Abral, H.; Ishak, M.R.; Zainudin, E.S.; Atiqah, A.; Atikah, M.S.N.;Syafri, E.; Asrofi, M.; et al. Thermal, Biodegradability and Water Barrier Properties of Bio-NanocompositesBased on Plasticised Sugar Palm Starch and Nanofibrillated Celluloses from Sugar Palm Fibres. J. BiobasedMater. Bioenergy 2020, 14, 234–248. [CrossRef]
13. Jumaidin, R.; Khiruddin, M.A.A.; Asyul Sutan Saidi, Z.; Salit, M.S.; Ilyas, R.A. Effect of cogon grass fibre onthe thermal, mechanical and biodegradation properties of thermoplastic cassava starch biocomposite. Int. J.Biol. Macromol. 2020, 146, 746–755. [CrossRef] [PubMed]
14. Ilyas, R.A.; Sapuan, S.M.; Atiqah, A.; Ibrahim, R.; Abral, H.; Ishak, M.R.; Zainudin, E.S.; Nurazzi, N.M.;Atikah, M.S.N.; Ansari, M.N.M.; et al. Sugar palm (Arenga pinnata [Wurmb.] Merr) starch films containingsugar palm nanofibrillated cellulose as reinforcement: Water barrier properties. Polym. Compos. 2020, 41,459–467. [CrossRef]
15. Ayu, R.S.; Khalina, A.; Harmaen, A.S.; Zaman, K.; Isma, T.; Liu, Q.; Ilyas, R.A.; Lee, C.H. CharacterizationStudy of Empty Fruit Bunch (EFB) Fibers Reinforcement in Poly(Butylene) Succinate (PBS)/Starch/GlycerolComposite Sheet. Polymers 2020, 12, 1571. [CrossRef]
16. Edhirej, A.; Sapuan, S.M.; Jawaid, M.; Zahari, N.I. Effect of various plasticizers and concentration onthe physical, thermal, mechanical, and structural properties of cassava-starch-based films. Starch-Stärke 2017,69, 1500366. [CrossRef]
17. Atikah, M.S.N.; Ilyas, R.A.; Sapuan, S.M.; Ishak, M.R.; Zainudin, E.S.; Ibrahim, R.; Atiqah, A.; Ansari, M.N.M.;Jumaidin, R. Degradation and physical properties of sugar palm starch / sugar palm nanofibrillated cellulosebionanocomposite. Polimery 2019, 64, 27–36. [CrossRef]
18. Jumaidin, R.; Sapuan, S.M.; Jawaid, M.; Ishak, M.R.; Sahari, J. Thermal, mechanical, and physical propertiesof seaweed/sugar palm fibre reinforced thermoplastic sugar palm Starch/Agar hybrid composites. Int. J.Biol. Macromol. 2017, 97, 606–615. [CrossRef]
19. Sahari, J.; Sapuan, S.M. Natural fibre reinforced biodegradable polymer composites. Rev. Adv. Mater. Sci.2012, 30, 166–174.
20. Wang, H.; Sun, X.; Seib, P. Mechanical properties of poly(lactic acid) and wheat starch blends withmethylenediphenyl diisocyanate. J. Appl. Polym. Sci. 2002, 84, 1257–1262. [CrossRef]
21. Raghu, N.; Kale, A.; Raj, A.; Aggarwal, P.; Chauhan, S. Mechanical and thermal properties of wood fibersreinforced poly(lactic acid)/thermoplasticized starch composites. J. Appl. Polym. Sci. 2018, 135, 1–10.[CrossRef]
22. Sanyang, M.L.; Sapuan, S.M.; Jawaid, M.; Ishak, M.R.; Sahari, J. Effect of plasticizer type and concentrationon tensile, thermal and barrier properties of biodegradable films based on sugar palm (Arenga pinnata) starch.Polymers 2015, 7, 1106–1124. [CrossRef]

Polymers 2020, 12, 2216 17 of 18
23. Ferri, J.M.; Garcia-Garcia, D.; Carbonell-Verdu, A.; Fenollar, O.; Balart, R. Poly(lactic acid) formulations withimproved toughness by physical blending with thermoplastic starch. J. Appl. Polym. Sci. 2018, 135, 1–8.[CrossRef]
24. Ishak, M.R.; Sapuan, S.M.; Leman, Z.; Rahman, M.Z.A.; Anwar, U.M.K.; Siregar, J.P. Sugar palm (Arengapinnata): Its fibres, polymers and composites. Carbohydr. Polym. 2013, 91, 699–710. [CrossRef]
25. Ilyas, R.A.; Sapuan, S.M.; Ishak, M.R. Isolation and characterization of nanocrystalline cellulose from sugarpalm fibres (Arenga pinnata). Carbohydr. Polym. 2018, 181, 1038–1051. [CrossRef] [PubMed]
26. Ilyas, R.A.; Sapuan, S.M.; Sanyang, M.L.; Ishak, M.R.; Zainudin, E.S. Nanocrystalline Cellulose asReinforcement for Polymeric Matrix Nanocomposites and its Potential Applications: A Review. Curr. Anal.Chem. 2018, 14, 203–225. [CrossRef]
27. Ilyas, R.A.; Sapuan, S.M.; Ishak, M.R.; Zainudin, E.S. Sugar palm nanofibrillated cellulose (Arenga pinnata(Wurmb.) Merr): Effect of cycles on their yield, physic-chemical, morphological and thermal behavior. Int. J.Biol. Macromol. 2019, 123, 379–388. [CrossRef]
28. Ilyas, R.; Sapuan, S.; Atikah, M.; Asyraf, M.; Rafiqah, S.A.; Aisyah, H.; Nurazzi, N.M.; Norrrahim, M.Effect of hydrolysis time on the morphological, physical, chemical, and thermal behavior of sugar palmnanocrystalline cellulose (Arenga pinnata (Wurmb.) Merr). Text. Res. J. 2020, 004051752093239. [CrossRef]
29. Abral, H.; Ariksa, J.; Mahardika, M.; Handayani, D.; Aminah, I.; Sandrawati, N.; Pratama, A.B.; Fajri, N.;Sapuan, S.M.; Ilyas, R.A. Transparent and antimicrobial cellulose film from ginger nanofiber. Food Hydrocoll.2020, 98, 105266. [CrossRef]
30. Abral, H.; Ariksa, J.; Mahardika, M.; Handayani, D.; Aminah, I.; Sandrawati, N.; Sapuan, S.M.; Ilyas, R.A.Highly transparent and antimicrobial PVA based bionanocomposites reinforced by ginger nanofiber.Polym. Test. 2019, 106186. [CrossRef]
31. Syafri, E.; Yulianti, E.; Asrofi, M.; Abral, H.; Sapuan, S.M.; Ilyas, R.A.; Fudholi, A. Effect of sonication timeon the thermal stability, moisture absorption, and biodegradation of water hyacinth (Eichhornia crassipes)nanocellulose-filled bengkuang (Pachyrhizus erosus) starch biocomposites. J. Mater. Res. Technol. 2019, 8,6223–6231. [CrossRef]
32. Cao, X.; Habibi, Y.; Luiz, W.; Magalhães, E.; Orlando, J.; Lucia, L.A.; Cao, X.; Habibi, Y.; Luiz, W.; Magalhäes, E.;et al. Teaching platform fruits of a novel biomass research an platform Cellul. Nanocrystals-Based Nanoc. 2011,100, 1172–1176.
33. Sanyang, M.L.; Ilyas, R.A.; Sapuan, S.M.; Jumaidin, R. Sugar palm starch-based composites for packagingapplications. In Bionanocomposites for Packaging Applications; Springer International Publishing: Cham,Switzerland, 2018; pp. 125–147. ISBN 9783319673196.
34. Kargarzadeh, H.; Huang, J.; Lin, N.; Ahmad, I.; Mariano, M.; Dufresne, A.; Thomas, S.; Gałeski, A.Recent developments in nanocellulose-based biodegradable polymers, thermoplastic polymers, and porousnanocomposites. Prog. Polym. Sci. 2018, 87, 197–227. [CrossRef]
35. Ilyas, R.A.; Sapuan, S.M.; Ishak, M.R.; Zainudin, E.S. Development and characterization of sugar palmnanocrystalline cellulose reinforced sugar palm starch bionanocomposites. Carbohydr. Polym. 2018, 202,186–202. [CrossRef] [PubMed]
36. Ilyas, R.A.; Sapuan, S.M.; Ishak, M.R.; Zainudin, E.S.; Atikah, M.S.N.; Huzaifah, M.R.M. Water barrierproperties of biodegradable films reinforced with nanocellulose for food packaging application: A review. InProceedings of the 6th Postgraduate Seminar on Natural Fiber Reinforced Polymer Composites, Selango,Malaysia, 4 December 2018; Malaysia Institute of Tropical Forestry and Forest Products, Universiti PutraMalaysia; pp. 55–59.
37. Sanyang, M.L.; Sapuan, S.M.; Jawaid, M.; Ishak, M.R.; Sahari, J. Development and characterization of sugarpalm starch and poly(lactic acid) bilayer films. Carbohydr. Polym. 2016, 146, 36–45. [CrossRef] [PubMed]
38. Sanyang, M.L.; Sapuan, S.M.; Jawaid, M.; Ishak, M.R.; Sahari, J. Recent developments in sugar palm (Arengapinnata) based biocomposites and their potential industrial applications: A review. Renew. Sustain. Energy Rev.2016, 54, 533–549. [CrossRef]
39. Ilyas, R.A.A.; Sapuan, S.M.M.; Ishak, M.R.R.; Zainudin, E.S.S. Effect of delignification on the physical,thermal, chemical, and structural properties of sugar palm fibre. BioResources 2017, 12, 8734–8754. [CrossRef]
40. Wang, N.; Yu, J.; Chang, P.R.; Ma, X. Influence of Citric Acid on the Properties of Glycerol-plasticized dryStarch (DTPS) and DTPS/Poly(lactic acid) Blends. Starch-Stärke 2007, 59, 409–417. [CrossRef]
Polymers 2020, 12, 2216 18 of 18
41. Muller, J.; González-Martínez, C.; Chiralt, A. Poly(lactic) acid (PLA) and starch bilayer films, containingcinnamaldehyde, obtained by compression moulding. Eur. Polym. J. 2017, 95, 56–70. [CrossRef]
42. Lv, S.; Zhang, Y.; Gu, J.; Tan, H. Physicochemical evolutions of starch/poly(lactic acid) composite biodegradedin real soil. J. Environ. Manag. 2018, 228, 223–231. [CrossRef]
43. Wang, N.; Yu, J.; Chang, P.R.; Ma, X. Influence of formamide and water on the properties of thermoplasticstarch/poly(lactic acid) blends. Carbohydr. Polym. 2008, 71, 109–118. [CrossRef]
44. Li, H.; Huneault, M.A. Comparison of sorbitol and glycerol as plasticizers for thermoplastic starch in TPS/PLAblends. J. Appl. Polym. Sci. 2011, 119, 2439–2448. [CrossRef]
45. Taylor, P.; Pötschke, P.; Paul, D.R. Formation of Co-continuous Structures in Melt-Mixed Immiscible PolymerBlends Formation of Co-continuous Structures in Melt-Mixed Immiscible Polymer Blends. J. Macromol. Sci.Part C Polym. Rev. 2003, 37–41. [CrossRef]
46. Yokesahachart, C.; Yoksan, R. Effect of amphiphilic molecules on characteristics and tensile properties ofthermoplastic starch and its blends with poly(lactic acid). Carbohydr. Polym. 2011, 83, 22–31. [CrossRef]
47. Jiang, T.; Duan, Q.; Zhu, J.; Liu, H.; Yu, L. Starch-based biodegradable materials: Challenges and opportunities.Adv. Ind. Eng. Polym. Res. 2020, 3, 8–18. [CrossRef]
48. Xiong, Z.; Li, C.; Ma, S.; Feng, J.; Yang, Y.; Zhang, R.; Zhu, J. The properties of poly(lactic acid)/starch blendswith a functionalized plant oil: Tung oil anhydride. Carbohydr. Polym. 2013, 95, 77–84. [CrossRef]
49. Wokadala, O.C.; Emmambux, N.M.; Ray, S.S. Inducing PLA/starch compatibility through butyl-etherificationof waxy and high amylose starch. Carbohydr. Polym. 2014, 112, 216–224. [CrossRef]
50. Akrami, M.; Ghasemi, I.; Azizi, H.; Karrabi, M.; Seyedabadi, M. A new approach in compatibilization ofthe poly(lactic acid)/thermoplastic starch (PLA/TPS) blends. Carbohydr. Polym. 2016, 144, 254–262. [CrossRef]
51. Lv, S.; Gu, J.; Tan, H.; Zhang, Y. The morphology, rheological, and mechanical properties of woodflour/starch/poly(lactic acid) blends. J. Appl. Polym. Sci. 2017, 134, 1–9. [CrossRef]
52. Kim, S.O.H.; Kim, Y.H.A.; Park, J.W.; Im, S.S. Biodegradable polymer blends of poly(L-lactic acid) andgelatinized starch. Polym. Eng. Sci. 2000, 40, 2539–2550.
53. Mano, J.F.; Koniarova, D.; Reis, R.L. Thermal properties of thermoplastic starch/synthetic polymer blendswith potential biomedical applicability. J. Mater. Sci. Mater. Med. 2003, 14, 127–135. [CrossRef]
54. Sahari, J.; Sapuan, S.M.; Zainudin, E.S.; Maleque, M.A. Thermo-mechanical behaviors of thermoplastic starchderived from sugar palm tree (Arenga pinnata). Carbohydr. Polym. 2013, 92, 1711–1716. [CrossRef] [PubMed]
55. Montero, B.; Rico, M.; Rodríguez-Llamazares, S.; Barral, L.; Bouza, R. Effect of nanocellulose as a filleron biodegradable thermoplastic starch films from tuber, cereal and legume. Carbohydr. Polym. 2017, 157,1094–1104. [CrossRef]
56. Chotiprayon, P.; Chaisawad, B.; Yoksan, R. Thermoplastic cassava starch/poly(lactic acid) blend reinforcedwith coir fibres. Int. J. Biol. Macromol. 2020, 156, 960–968. [CrossRef] [PubMed]
57. Edhirej, A.; Sapuan, S.M.; Jawaid, M.; Zahari, N.I. Cassava/sugar palm fiber reinforced cassava starch hybridcomposites: Physical, thermal and structural properties. Int. J. Biol. Macromol. 2017, 101, 75–83. [CrossRef][PubMed]
58. De Teixeira, E.M.; Pasquini, D.; Curvelo, A.A.S.; Corradini, E.; Belgacem, M.N.; Dufresne, A. Cassava bagassecellulose nanofibrils reinforced thermoplastic cassava starch. Carbohydr. Polym. 2009, 78, 422–431. [CrossRef]
© 2020 by the authors. Licensee MDPI, Basel, Switzerland. This article is an open accessarticle distributed under the terms and conditions of the Creative Commons Attribution(CC BY) license (http://creativecommons.org/licenses/by/4.0/).