Mechanical Engineering - California State University ...
34
Fact Book Fall 2017 6000 J Street, MS 6028 Sacramento, CA 95819 Phone: (916) 278-6566 Fax: (916) 278-6828 http://www.csus.edu/oir Fall 2012-Spring 2017 Mechanical Engineering
Transcript of Mechanical Engineering - California State University ...

Fact Book
Fall 2017
6000 J Street, MS 6028 Sacramento, CA 95819 Phone: (916) 278-6566
Fax: (916) 278-6828 http://www.csus.edu/oir
Fall 2012-Spring 2017
Mechanical
Engineering
TABLE OF CONTENTS
INPUT: STUDENTS
Table 1: New Undergraduate Student Background .......................................................... 1 Table 2: All Undergraduate Student Profile ..................................................................... 2 Table 3: New Graduate Student Background .................................................................. 3 Table 4: Graduate Student Profile ................................................................................... 4 Table 5: All Student Enrollment by Program and Concentration ..................................... 5
PROCESS: CURRICULUM AND INSTRUCTION
Table 6: Student Course Load ........................................................................................ 6 Table 7: Class Size ......................................................................................................... 7 Table 8: Course Enrollment ............................................................................................ 8 Table 9: FTE and Student/Faculty Ratio ...................................................................... 11 Table 10: Faculty Profile .............................................................................................. 12
OUTCOMES: STUDENT ACADEMIC PERFORMANCE
Table 11: Grades and Course GPA by Level ................................................................. 13 Table 12: Undergraduate Degree GPA by Ethnicity ..................................................... 15 Table 13: Degrees Conferred ....................................................................................... 16 Table 14: Retention Rates for First-Time Freshmen and Transfers ................................. 17 Table 15: Graduation Rates for First-Time Freshmen and Transfers .............................. 19
APPENDIX
Appendix A: Faculty Workload Fall ......................................................................... A - 1 Appendix B: Faculty Workload Spring ..................................................................... B - 1 Appendix C: Student Flow Chart ............................................................................. C - 1

TABLE 1: New Undergraduate Student Background
5-Year
First-Time Freshmen 2012 2013 2014 2015 2016 Mean
HeadcountDepartment (Majors) 121 123 138 166 160 142
Pre-Major/Expressed Interest 1 1
College (Majors) 387 353 398 439 459 407
Pre-Major/Expressed Interest 45 121 153 213 190 144
% of College 28.2% 25.9% 25.0% 25.6% 24.7% 25.7%
Average SAT Scores
SAT Verbal 483 480 496 477 474 482
SAT Math 545 545 541 521 527 536
Combined SAT 1028 1024 1037 997 1001 1018
College Mean 997 1014 1016 1004 989 1004
University Mean 960 952 946 952 936 949
High School GPA
Department Mean 3.32 3.34 3.38 3.28 3.22 3.31
College Mean 3.30 3.29 3.32 3.32 3.27 3.30
University Mean 3.26 3.25 3.27 3.30 3.25 3.27
Need Remediation (Regular Admit)
Department 35.2% 43.1% 34.8% 39.5% 37.5% 38.0%
College 43.1% 40.9% 41.4% 39.9% 38.4% 40.7%
University 55.7% 53.2% 58.9% 55.0% 54.6% 55.5%
New Transfers
Headcount
Department (Majors) 56 99 75 95 85 82
Pre-Major/Expressed Interest 6 1 1
College (Majors) 196 294 240 225 244 240
Pre-Major/Expressed Interest 66 113 110 119 131 108
% of College 21.4% 24.3% 21.4% 29.4% 22.9% 24.0%
Transfer GPA
Department Mean 2.96 2.89 2.93 2.99 2.93 2.94
College Mean 2.96 2.92 2.97 3.01 2.98 2.97
University Mean 3.05 3.04 3.07 3.09 3.07 3.06
Transfer Units
Department Mean 89 88 95 92 92 91
College Mean 90 90 91 90 91 90
University Mean 78 79 79 79 79 79
*Transfer units are recalculated and updated each year after the evaluation process has been completed.
Entering in Fall
Notes: Only programs which have been designated as being "impacted" will have students within the "expressed interest" group.
Mechanical Engineering 1

TABLE 2: All Undergraduate Student Profile
Total Enrolled*Department (Majors)
Pre-Major/Expressed Interest
College (Majors)
Pre-Major/Expressed Interest
% of College
EthnicityAfrican American 24 3.8% 22 3.0% 23 2.9% 27 2.8% 44 4.6%
American Indian 3 0.5% 3 0.4% 4 0.5% 5 0.5% 5 0.5%
Asian 109 17.3% 127 17.1% 163 20.7% 194 20.5% 220 22.8%
Latino 158 25.1% 205 27.6% 208 26.4% 268 28.3% 241 25.0%
Pacific Islander 7 1.1% 6 0.8% 6 0.8% 8 0.8% 19 2.0%
Underrepresented Minority 192 30.5% 236 31.7% 241 30.5% 308 32.5% 309 32.1%
All Minority 301 47.8% 363 48.8% 404 51.2% 502 53.0% 529 54.9%
Multiracial 34 5.4% 36 4.8% 45 5.7% 54 5.7% 51 5.3%
White/Caucasian 229 36.3% 270 36.3% 252 31.9% 285 30.1% 319 33.1%
Foreign 11 1.7% 15 2.0% 22 2.8% 38 4.0% 37 3.8%
Other/Unreported 55 8.7% 60 8.1% 66 8.4% 69 7.3% 27 2.8%
Minority (College) 1,331 52.2% 1,522 53.2% 1,738 55.4% 2,070 56.9% 2,207 57.4%
Minority (University) 13,120 51.4% 13,963 53.7% 14,764 55.4% 15,574 56.3% 15,714 56.4%
GenderDepartment- Female 60 9.5% 66 8.9% 77 9.8% 99 10.4% 101 10.5%
Department- Male 570 90.5% 678 91.1% 712 90.2% 849 89.6% 862 89.5%
College-Female 329 12.9% 354 12.4% 420 13.4% 500 13.7% 524 13.6%
College-Male 2,223 87.1% 2,505 87.6% 2,720 86.6% 3,140 86.3% 3,322 86.4%
University-Female 14,497 56.8% 14,696 56.5% 15,007 56.3% 15,464 55.9% 15,570 55.9%
University-Male 11,044 43.2% 11,316 43.5% 11,641 43.7% 12,177 44.1% 12,306 44.1%
AgeUnder 18 7 1.1% 17 2.3% 17 2.2% 27 2.8% 27 2.8%
18-24 501 79.5% 574 77.2% 608 77.1% 733 77.3% 735 76.3%
25 and over 122 19.4% 153 20.6% 164 20.8% 188 19.8% 201 20.9%
BackgroundLow Income Family 279 44.3% 365 49.1% 369 46.8% 444 46.8% 458 47.6%
First Generation 155 24.6% 203 27.3% 222 28.1% 298 31.4% 297 30.8%
Commuter StatusLiving on Campus 49 7.8% 54 7.3% 48 6.1% 76 8.0% 73 7.6%
Commuters 581 92.2% 690 92.7% 741 93.9% 872 92.0% 890 92.4%
530 592 656 849 848
3 7 1
Fall
2012 2013 2014 2015 2016
627 744 789 941 962
2,022 2,267 2,484 2,791 2,998
* Total enrollment includes new, continuing, and returning students. All counts are based on primary majors. Graduate students enrolled in undergraduate degree programs (2nd Bachelor) are included in Table 4.
Note: Ethnic headcounts may differ from those reported before 2013. The Fact Book now uses new ERSR (Race/Ethnicity) data, collected since 2009, to complete the historical record.
24.7% 26.0% 25.1% 26.0% 25.0%
Mechanical Engineering 2

TABLE 3: New Graduate Student Background
5-Year
Graduates - First-time 2012 2013 2014 2015 2016 Mean
Degree Objective
2nd Bachelor's Degree
Master's Degree 4 28 15 14 16 15
Other Degree
Total 4 28 15 14 16 15
Institution of Origin
Sacramento State 14 6 8 10 8
Out of State 3 8 5 2 3 4
State College 3 1 1 1
University of California 1 2 3 3 2 2
Private School 1 1 0
Other Institute
Total 4 28 15 14 16 15
% Sacramento State Students 0.0% 50.0% 40.0% 57.1% 62.5% 41.9%
Graduate Transfers
Degree Objective
2nd Bachelor's Degree 2 0
Master's Degree
Other Degree
Total 2 0
Institution of Origin
Sacramento State 2 0
Out of State
State College
University of California
Private School
Other Institute
Total 2 0
% Sacramento State Students 100% 20.0%
Entering in Fall
Mechanical Engineering 3
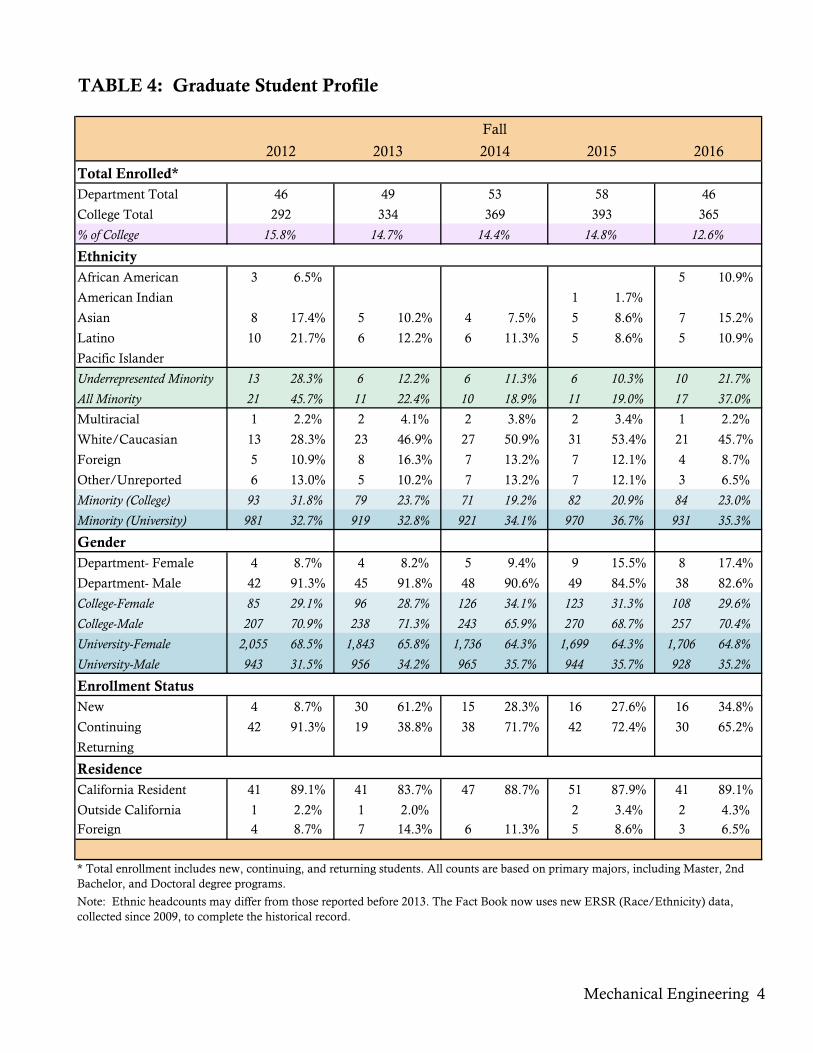
TABLE 4: Graduate Student Profile
Total Enrolled*
Department Total
College Total
% of College
Ethnicity
African American 3 6.5% 5 10.9%
American Indian 1 1.7%
Asian 8 17.4% 5 10.2% 4 7.5% 5 8.6% 7 15.2%
Latino 10 21.7% 6 12.2% 6 11.3% 5 8.6% 5 10.9%
Pacific Islander
Underrepresented Minority 13 28.3% 6 12.2% 6 11.3% 6 10.3% 10 21.7%
All Minority 21 45.7% 11 22.4% 10 18.9% 11 19.0% 17 37.0%
Multiracial 1 2.2% 2 4.1% 2 3.8% 2 3.4% 1 2.2%
White/Caucasian 13 28.3% 23 46.9% 27 50.9% 31 53.4% 21 45.7%
Foreign 5 10.9% 8 16.3% 7 13.2% 7 12.1% 4 8.7%
Other/Unreported 6 13.0% 5 10.2% 7 13.2% 7 12.1% 3 6.5%
Minority (College) 93 31.8% 79 23.7% 71 19.2% 82 20.9% 84 23.0%
Minority (University) 981 32.7% 919 32.8% 921 34.1% 970 36.7% 931 35.3%
Gender
Department- Female 4 8.7% 4 8.2% 5 9.4% 9 15.5% 8 17.4%
Department- Male 42 91.3% 45 91.8% 48 90.6% 49 84.5% 38 82.6%
College-Female 85 29.1% 96 28.7% 126 34.1% 123 31.3% 108 29.6%
College-Male 207 70.9% 238 71.3% 243 65.9% 270 68.7% 257 70.4%
University-Female 2,055 68.5% 1,843 65.8% 1,736 64.3% 1,699 64.3% 1,706 64.8%
University-Male 943 31.5% 956 34.2% 965 35.7% 944 35.7% 928 35.2%
Enrollment Status
New 4 8.7% 30 61.2% 15 28.3% 16 27.6% 16 34.8%
Continuing 42 91.3% 19 38.8% 38 71.7% 42 72.4% 30 65.2%
Returning
Residence
California Resident 41 89.1% 41 83.7% 47 88.7% 51 87.9% 41 89.1%
Outside California 1 2.2% 1 2.0% 2 3.4% 2 4.3%
Foreign 4 8.7% 7 14.3% 6 11.3% 5 8.6% 3 6.5%
Note: Ethnic headcounts may differ from those reported before 2013. The Fact Book now uses new ERSR (Race/Ethnicity) data, collected since 2009, to complete the historical record.
Fall
2012 2013 2014 2015 2016
46 49 53 58 46
292 334 369 393 365
* Total enrollment includes new, continuing, and returning students. All counts are based on primary majors, including Master, 2nd Bachelor, and Doctoral degree programs.
15.8% 14.7% 14.4% 14.8% 12.6%
Mechanical Engineering 4

TABLE 5: All Student Enrollment by Program and Concentration
2012 2013 2014 2015 2016
Undergraduate StudentsMechanical Engineering
Mechanical Engineering 627 744 780 936 955
Mechanical Engineering Blended 9 5 7
Pre-Mechanical Engineering 3 7 1
Sub-Total 630 744 789 948 963
Graduate Students - 2nd BA
Mechanical Engineering
Mechanical Engineering 2 2 1 0
Sub-Total 0 2 2 1 0
Graduate Students - Masters
Mechanical Engineering
Mechanical Engineering 46 47 51 51 39
Mechanical Engineering Blended 6 7
Sub-Total 46 47 51 57 46
Departmental Total 676 793 842 1,006 1,009
Entering in Fall
Note: Some programs/concentrations are not listed if there were no students majored in those programs in the past five years.
Mechanical Engineering 5

TABLE 6: Student Course Load
10-Term
Mean
Fall Spring Fall Spring Fall Spring Fall Spring Fall Spring
Course Load (Undergraduate)
# Full-Time 505 515 600 581 635 612 782 720 830 774 655
# Part-Time 125 82 144 116 154 155 166 146 133 138 136
Dept. Mean Units 13.0 13.4 13.1 13.3 12.7 12.8 13.0 13.1 13.4 13.4 13.1
College Mean Units 12.8 12.9 13.0 12.8 12.6 12.6 12.7 12.7 13.1 13.0 12.8
University Mean Units 12.6 12.5 12.8 12.3 12.3 12.4 12.5 12.5 12.9 12.8 12.6
Course Load (Graduate)
# Full-Time 10 15 17 17 19 11 16 6 11 14 14
# Part-Time 36 19 32 34 34 44 42 46 35 38 36
Dept. Mean Units 6.5 7.5 7.0 7.0 7.1 5.9 6.6 5.8 7.1 6.7 6.7
College Mean Units 6.8 7.0 7.2 7.3 7.5 7.6 7.5 6.9 6.9 7.1 7.2
University Mean Units 9.9 9.6 10.1 9.7 10.1 9.5 10.2 9.6 10.4 9.8 9.9
Academic Year
2012-13 2013-14 2014-15 2015-16 2016-17
11.5
12.0
12.5
13.0
13.5
Fall Spring Fall Spring Fall Spring Fall Spring Fall Spring
2012-13 2013-14 2014-15 2015-16 2016-17
Ave
rage
Uni
t
Average Unit LoadUndergraduate Students
Dept. Mean Units College Mean Units University Mean Units
Mechanical Engineering 6

TABLE 7: Class Size
10-Term Mean
Fall Spring Fall Spring Fall Spring Fall Spring Fall SpringNumber of Sections (Non-supervision)1
Lower Division 24 20 25 24 32 29 38 33 13 39 28
Upper Division 43 48 45 48 51 54 56 65 64 90 56
Graduate 5 6 6 6 7 5 8 8 10 8 7
Department Total 72 74 76 78 90 88 102 106 87 137 91
College Total 323 305 352 329 378 367 425 416 488 475 386
% of College 22.2% 24.2% 21.5% 23.7% 23.7% 24.1% 24.0% 25.5% 17.8% 28.8% 23.5%
Average Section Size (Non-supervision)Lower Division 27 24 30 28 29 26 28 25 23 20 26
Upper Division 30 32 32 33 31 33 34 32 29 26 31
Graduate 13 10 17 17 18 19 13 11 9 12 14Department Mean 28 28 30 30 29 30 30 28 26 24 28
College Mean 27 26 27 27 28 28 28 27 27 26 27
University Mean 35 33 34 34 34 33 34 33 33 32 33
Number of Sections (Supervision)2
Lower Division
Upper Division 4 6 5 7 5 7 7 7 6 6 6
Graduate 7 7 8 6 6 8 10 12 5 8 8
Department Total 11 13 13 13 11 15 17 19 11 14 14
College Total 49 57 54 52 47 56 63 70 54 65 57
% of College 22.4% 22.8% 24.1% 25.0% 23.4% 26.8% 27.0% 27.1% 20.4% 21.5% 24.1%
% Course Enrollment for MajorsLower Division 76% 85% 74% 75% 73% 67% 81% 64% 76% 78% 75%
Upper Division 85% 90% 87% 87% 88% 88% 91% 92% 89% 92% 89%
Graduate 99% 97% 97% 94% 92% 100% 96% 93% 99% 95% 96%
Department Total 84% 89% 85% 85% 84% 84% 89% 87% 86% 90% 86%
2 Includes Independent Study, Field Work, Practice Teaching, Work-study, Thesis, and Studio instruction.
Note: ENGR and CPE courses are placed with the instructor's department except cross-listed courses.
1 Includes Lecture, Laboratory, Seminar and Activity sections. Beginning with this edition of the Factbook, the percentage of course enrollment by major has been calculated based on end-of-term data.
Academic Year2016-172015-162012-13 2013-14 2014-15
20
25
30
35
40
2012-13 2013-14 2014-15 2015-16 2016-17
Ave
rage
Siz
e
Average Size of Course Sections (non-supervision)DepartmentMean
CollegeMean
UniversityMean
Mechanical Engineering 7

TABLE 8: Course Enrollment
10-Term
Total
Course* Fall Spring Fall Spring Fall Spring Fall Spring Fall SpringENGR001A 12 17 16 17 20 82
ENGR006 117 40 84 58 181 87 222 79 219 65 1,152
ENGR006W 28 3 1 1 1 34
ENGR045 94 72 138 126 126 142 152 133 148 130 1,261
ENGR045W 29 36 17 9 4 4 52 151
ENGR050 36 37 46 119
ENGR096A 69 69
ENGR110 112 88 125 131 136 156 154 167 181 146 1,396
ENGR110W 28 55 17 9 46 10 165
ENGR112 81 81
ENGR124 108 110 115 142 153 167 145 176 164 185 1,465
ENGR124W 41 61 6 3 2 113
ENGR132 40 41 81
ENGR201 14 34 31 23 11 19 18 150
ENGR202 16 23 27 14 16 12 12 120
ME 037 101 97 109 113 107 121 134 160 147 186 1,275
ME 105 49 46 49 59 62 72 80 112 95 101 725
ME 108 68 84 79 78 93 105 133 83 88 91 902
ME 116 60 48 52 74 76 62 85 71 89 83 700
ME 117 63 55 41 53 63 74 55 97 59 80 640
ME 121 25 29 29 83
ME 122 12 21 33
ME 123 18 24 42
ME 126 43 65 69 66 62 71 80 84 110 111 761
ME 128 44 48 57 53 59 72 40 71 74 125 643
ME 136 24 17 18 13 22 94
ME 137 17 16 12 20 26 91
ME 138 58 67 57 56 83 84 96 94 92 99 786
ME 141 21 17 38
ME 143 22 17 27 66
ME 153 30 8 38
ME 156 21 47 31 36 25 160
ME 159 12 13 30 55
ME 164 13 13
ME 165 24 18 20 23 85
ME 171 49 50 41 40 60 58 73 70 114 94 649
ME 172 41 48 49 43 47 54 70 70 92 126 640
ME 173 18 24 22 64
ME 176 25 22 47
Academic Year
2016-172015-162012-13 2013-14 2014-15
Mechanical Engineering 8

TABLE 8: Course Enrollment
10-Term
Total
Course* Fall Spring Fall Spring Fall Spring Fall Spring Fall Spring
Academic Year
2016-172015-162012-13 2013-14 2014-15
ME 177 23 42 27 37 32 37 35 233
ME 180 56 82 53 58 84 72 81 85 114 70 755
ME 180W 2 2
ME 182 33 25 37 95
ME 184 25 15 14 17 71
ME 186 17 23 19 19 17 95
ME 190 64 58 70 47 67 81 96 83 117 99 782
ME 191 34 64 59 72 45 67 82 95 82 121 721
ME 194 11 25 12 26 35 52 8 30 15 24 238
ME 195 1 1
ME 195A 3 2 1 6
ME 196A 2 5 7
ME 196B 16 8 24
ME 196E 8 18 26
ME 196F 35 35
ME 196G 15 15
ME 196V 16 16
ME 196W 16 16
ME 196X 17 17
ME 196Z 17 17
ME 199 11 18 13 27 11 22 31 22 21 54 230
ME 209 6 20 18 8 25 9 10 14 110
ME 233 10 19 29
ME 236 11 43 14 68
ME 237 15 19 34
ME 238 9 21 14 44
ME 240 2 2
ME 241 19 19
ME 253 11 17 10 38
ME 258 14 15 14 43
ME 259 18 16 34
ME 270 14 7 8 29
ME 272 12 12 24
ME 273 6 6
ME 274 7 7 14
ME 275 10 4 14
ME 276 15 10 8 33
ME 278 13 13
ME 296M 9 9
Mechanical Engineering 9

TABLE 8: Course Enrollment
10-Term
Total
Course* Fall Spring Fall Spring Fall Spring Fall Spring Fall Spring
Academic Year
2016-172015-162012-13 2013-14 2014-15
ME 296N 19 19
ME 296O 5 12 17
ME 296P 4 5 9
ME 296R 18 8 6 32
ME 296S 4 4
ME 296T 12 12
ME 296U 10 10
ME 296V 6 6
ME 299 6 3 7 5 7 3 12 7 2 5 57
ME 500 12 15 9 8 4 12 11 15 6 12 104
Total 1,466 1,509 1,580 1,786 1,853 1,954 2,179 2,183 2,451 2,343 19,304
* Enrollment is combined for courses with more than one section in the same semester. Course enrollment is based on end-of-term data.
Mechanical Engineering 10
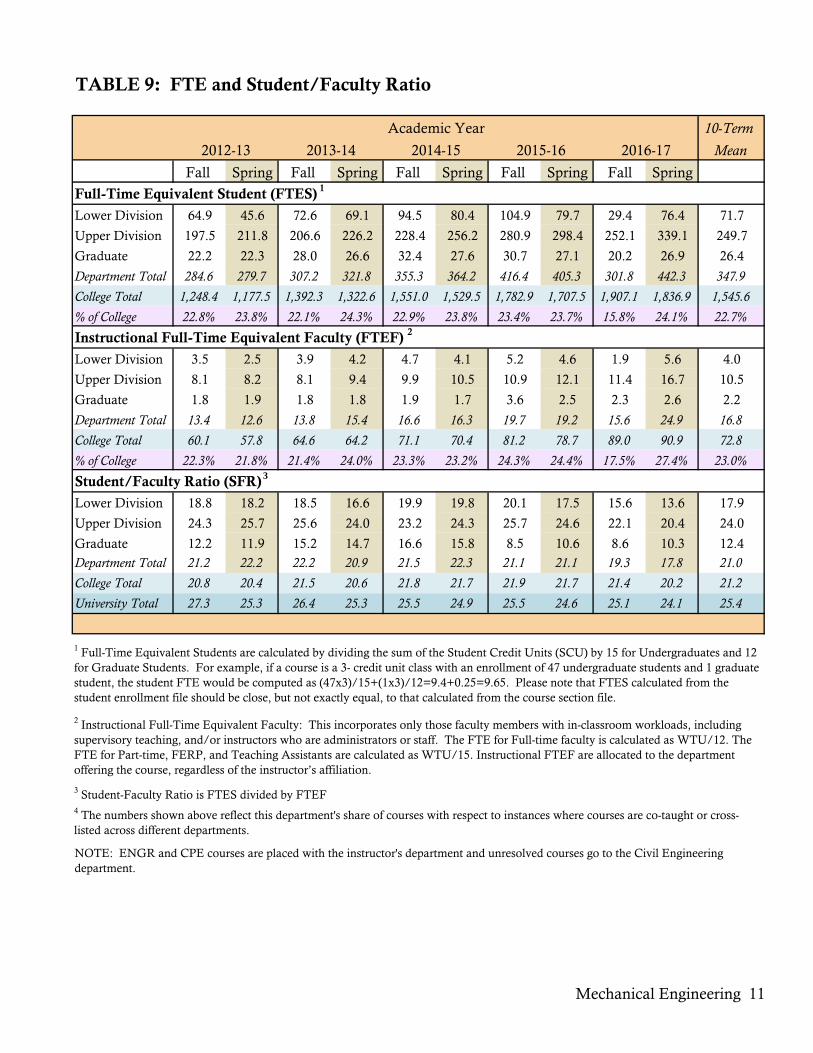
TABLE 9: FTE and Student/Faculty Ratio
10-Term
Mean
Fall Spring Fall Spring Fall Spring Fall Spring Fall Spring
Full-Time Equivalent Student (FTES) 1
Lower Division 64.9 45.6 72.6 69.1 94.5 80.4 104.9 79.7 29.4 76.4 71.7
Upper Division 197.5 211.8 206.6 226.2 228.4 256.2 280.9 298.4 252.1 339.1 249.7
Graduate 22.2 22.3 28.0 26.6 32.4 27.6 30.7 27.1 20.2 26.9 26.4
Department Total 284.6 279.7 307.2 321.8 355.3 364.2 416.4 405.3 301.8 442.3 347.9
College Total 1,248.4 1,177.5 1,392.3 1,322.6 1,551.0 1,529.5 1,782.9 1,707.5 1,907.1 1,836.9 1,545.6
% of College 22.8% 23.8% 22.1% 24.3% 22.9% 23.8% 23.4% 23.7% 15.8% 24.1% 22.7%
Instructional Full-Time Equivalent Faculty (FTEF) 2
Lower Division 3.5 2.5 3.9 4.2 4.7 4.1 5.2 4.6 1.9 5.6 4.0
Upper Division 8.1 8.2 8.1 9.4 9.9 10.5 10.9 12.1 11.4 16.7 10.5
Graduate 1.8 1.9 1.8 1.8 1.9 1.7 3.6 2.5 2.3 2.6 2.2
Department Total 13.4 12.6 13.8 15.4 16.6 16.3 19.7 19.2 15.6 24.9 16.8
College Total 60.1 57.8 64.6 64.2 71.1 70.4 81.2 78.7 89.0 90.9 72.8
% of College 22.3% 21.8% 21.4% 24.0% 23.3% 23.2% 24.3% 24.4% 17.5% 27.4% 23.0%
Student/Faculty Ratio (SFR)3
Lower Division 18.8 18.2 18.5 16.6 19.9 19.8 20.1 17.5 15.6 13.6 17.9
Upper Division 24.3 25.7 25.6 24.0 23.2 24.3 25.7 24.6 22.1 20.4 24.0
Graduate 12.2 11.9 15.2 14.7 16.6 15.8 8.5 10.6 8.6 10.3 12.4
Department Total 21.2 22.2 22.2 20.9 21.5 22.3 21.1 21.1 19.3 17.8 21.0
College Total 20.8 20.4 21.5 20.6 21.8 21.7 21.9 21.7 21.4 20.2 21.2
University Total 27.3 25.3 26.4 25.3 25.5 24.9 25.5 24.6 25.1 24.1 25.4
3 Student-Faculty Ratio is FTES divided by FTEF
NOTE: ENGR and CPE courses are placed with the instructor's department and unresolved courses go to the Civil Engineering department.
1 Full-Time Equivalent Students are calculated by dividing the sum of the Student Credit Units (SCU) by 15 for Undergraduates and 12 for Graduate Students. For example, if a course is a 3- credit unit class with an enrollment of 47 undergraduate students and 1 graduate student, the student FTE would be computed as (47x3)/15+(1x3)/12=9.4+0.25=9.65. Please note that FTES calculated from the student enrollment file should be close, but not exactly equal, to that calculated from the course section file.
2 Instructional Full-Time Equivalent Faculty: This incorporates only those faculty members with in-classroom workloads, including supervisory teaching, and/or instructors who are administrators or staff. The FTE for Full-time faculty is calculated as WTU/12. The FTE for Part-time, FERP, and Teaching Assistants are calculated as WTU/15. Instructional FTEF are allocated to the department offering the course, regardless of the instructor’s affiliation.
4 The numbers shown above reflect this department's share of courses with respect to instances where courses are co-taught or cross-listed across different departments.
Academic Year
2016-172015-162012-13 2013-14 2014-15
Mechanical Engineering 11

TABLE 10: Faculty Profile
Total Faculty
Department
College
University
Ethnicity
African American 1 5.6% 1 5.3% 1 4.0% 1 3.3% 1 2.9%
American Indian
Asian 7 38.9% 5 26.3% 7 28.0% 7 23.3% 8 23.5%
Latino 1 5.6% 2 10.5% 2 8.0% 3 10.0% 6 17.6%
Underrepresented Minority 2 11.1% 3 15.8% 3 12.0% 4 13.3% 7 20.6%
All Minority 9 50.0% 8 42.1% 10 40.0% 11 36.7% 15 44.1%
Multiracial 2 8.0% 2 6.7% 1 2.9%
White/Caucasian 9 50.0% 11 57.9% 13 52.0% 17 56.7% 16 47.1%
Other/Unreported 2 5.9%
Minority (College) 29 29.0% 33 31.7% 36 28.8% 39 27.5% 43 28.5%
Minority (University) 323 23.4% 351 23.7% 370 23.5% 387 23.8% 426 24.7%
Gender
Department- Female 4 22.2% 4 21.1% 6 24.0% 5 16.7% 7 20.6%
Department- Male 14 77.8% 15 78.9% 19 76.0% 25 83.3% 27 79.4%
College-Female 17 17.0% 18 17.3% 23 18.4% 24 16.9% 29 19.2%
College-Male 83 83.0% 86 82.7% 102 81.6% 118 83.1% 122 80.8%
University-Female 707 51.2% 744 50.3% 771 49.0% 784 48.2% 842 48.7%
University-Male 675 48.8% 735 49.7% 803 51.0% 841 51.8% 886 51.3%
Rank
Full Professor 6 33.3% 6 31.6% 6 24.0% 7 23.3% 8 23.5%
Associate Professor 5 27.8% 5 26.3% 5 20.0% 4 13.3% 2 5.9%
Assistant Professor 1 5.3% 2 8.0% 2 6.7% 3 8.8%
Lecturer 7 38.9% 7 36.8% 12 48.0% 17 56.7% 21 61.8%
Tenure Status
Tenure 11 61.1% 11 57.9% 11 44.0% 11 36.7% 9 26.5%
On Tenure Track 1 5.3% 2 8.0% 2 6.7% 3 8.8%
Non-Tenure Track 7 38.9% 7 36.8% 12 48.0% 17 56.7% 22 64.7%
Note: Faculty members with more than one assignment are only counted once and are attributed to the department with the greatest portion of FTE based on HR Census data (October 1). Total faculty count of the university includes instructors, librarians and coaches.
2016
34
151
1,7281,382
2012
18
2013
19
104
1,479 1,574 1,625
Fall
100
2014
25
125
2015
30
142
Mechanical Engineering 12

TABLE 11: Grades and Course GPA by Level
10-Term
MeanFall Spring Fall Spring Fall Spring Fall Spring Fall Spring
Lower DivisionA 71 69 79 106 153 140 133 109 149 149 116
B 132 98 144 135 161 137 215 149 202 126 150
C 85 34 101 76 102 86 123 88 121 79 90
D 11 5 3 6 10 8 19 5 13 9 9
F 7 1 3 6 21 22 15 10 21 6 11
CR 11 57 17 38 33 10 20 70 72 1 33
NC 1 0 1 4 1
I 1 0 0 3 0 3 1
WU 4 1 0 2 3 2 2 8 1 8 3
W 1 1 1 3 1 1 1 0 7 1 2
Other
Total 324 266 348 372 484 406 529 446 586 382 414
Upper DivisionA 403 469 471 421 497 486 698 672 823 805 575
B 305 325 315 374 363 452 458 543 475 562 417
C 249 220 241 282 251 325 254 267 290 323 270
D 31 25 17 38 25 34 32 38 25 36 30
F 40 19 33 29 40 35 49 47 49 42 38
CR 2 83 6 129 22 66 9 43 64 39 46
NC 2 6 2 5 2 12 3
I 21 9 15 16 21 7 7 2 4 17 12
WU 4 4 10 6 6 5 4 15 6 24 8
W 4 5 4 2 8 14 9 2 8 4 6
Other
Total 1,061 1,165 1,114 1,302 1,235 1,436 1,520 1,629 1,744 1,852 1,406
Graduate LevelA 52 40 60 55 70 62 86 52 78 54 61
B 14 19 31 33 31 30 19 30 25 30 26
C 2 4 4 7 16 5 9 8 7 9 7
D 0 1 2 0 1 1 1 0 1
F 1 4 1 1 1 0 1
CR 2 14 7 2 1 1 1 8 1 3 4
NC 1 0 0
I 1 0 4 3 7 1 1 0 1 2 2
WU 3 1 1 1 2 0 1
W 5 0 1 1 1 2 1
Other 10 1 3 6 4 11 11 8 5 9 7
Total 81 78 118 112 134 112 130 108 121 109 110
2016-17
Note: All grades shown reflect those of students regularly enrolled as of the Census Date. Students enrolled through the College of Continuing Education (CCE) have been excluded.
Academic Year
2015-162012-13 2013-14 2014-15
Mechanical Engineering 13

TABLE 11: Grades and Course GPA by Level
10-Term
MeanFall Spring Fall Spring Fall Spring Fall Spring Fall Spring
2016-17
Academic Year
2015-162012-13 2013-14 2014-15
Average Course GPA (Lower Division)Department 2.75 3.06 2.87 2.97 2.89 2.88 2.83 2.82 2.85 2.99 2.88
College 2.63 2.51 2.73 2.68 2.71 2.48 2.66 2.58 2.73 2.72 2.65
University 2.74 2.68 2.75 2.68 2.72 2.66 2.75 2.68 2.74 2.69 2.71
Average Course GPA (Upper Division)Department 2.90 3.08 3.01 2.88 3.00 2.92 3.10 3.02 3.14 3.04 3.02
College 2.84 2.84 2.84 2.83 2.83 2.87 2.90 2.89 2.90 2.90 2.87
University 2.96 2.97 2.97 2.98 2.98 3.01 3.01 3.02 3.02 3.01 2.99
Average Course GPA (Graduate)Department 3.71 3.55 3.45 3.31 3.34 3.55 3.54 3.39 3.47 3.44 3.47
College 3.52 3.49 3.52 3.43 3.40 3.50 3.44 3.48 3.50 3.45 3.47
University 3.76 3.77 3.77 3.75 3.74 3.76 3.76 3.78 3.79 3.78 3.77
A-F - Letter Grade NC - No Credit WU - Unauthorized WithdrawalCR - Credit I - Incomplete W - WithdrawalOther:RD - Report Delayed AU - AuditRP - Report in Progress Blank - No Grade
Grade:
40%
60%
80%
100%
Fall Spring Fall Spring Fall Spring Fall Spring Fall Spring
2012-13 2013-14 2014-15 2015-16 2016-17
% A
and
B
A and B Grade by Level
Lower Division Upper Division Graduate
Mechanical Engineering 14

TABLE 12: Undergraduate Degree GPA by Ethnicity
5-Year
2012-13 2013-14 2014-15 2015-16 2016-17 Mean
Ethnicity GPAAfrican Mean 2.84 2.86 2.59 2.99 2.52 2.74
American Count 3 4 2 1 3 3
American Mean 3.11 2.85 2.94
Indian Count 1 2 2
Mean 3.15 2.88 3.04 2.87 3.01 2.96
Count 7 20 15 23 31 19
Mean 2.84 2.94 2.79 2.88 2.93 2.89
Count 12 23 19 47 50 30
Mean 2.35 2.88 3.22 2.89
Count 1 2 2 2
Mean 2.82 3.12 3.08 3.05 3.08 3.02
Count 7 4 8 8 8 7
Mean 3.05 2.99 3.14 3.19 3.11 3.09
Count 39 62 46 47 65 52
Mean 2.71 3.47 3.26 2.81 3.12 3.14
Count 2 3 3 1 4 3
Other/ Mean 3.01 3.04 3.30 3.03 3.13 3.10
Unreported Count 16 12 15 13 18 15
Mean 2.98 2.98 3.07 3.01 3.03 3.02
Count 87 128 111 140 183 130
Mean Degree GPADepartment 2.98 2.98 3.07 3.01 3.03 3.02
College 2.99 3.00 3.03 3.01 3.07 3.02
University 3.08 3.08 3.09 3.11 3.12 3.10
White
Foreign
Total
Graduating Class
Asian
Latino
Pacific Islander
Multiracial
2.98 2.98 3.07 3.01 3.03
2.99 3.00 3.03 3.01 3.07
3.08 3.08 3.09 3.11 3.120.00
0.50
1.00
1.50
2.00
2.50
3.00
3.50
4.00
2012-13 2013-14 2014-15 2015-16 2016-17
GP
A
Mean Degree GPA of Graduating ClassesDepartment College University
Mechanical Engineering 15

TABLE 13: Degrees Conferred
5-Year
2012-13 2013-14 2014-15 2015-16 2016-17 Mean
Degree Program
Bachelor's 87 128 111 140 183 130
Second Bachelor's 1 1
Master's 13 11 10 16 12 12
Doctorate
Total 100 139 121 157 195 142
Median Years to Bachelor's Degree (First-time Freshmen)
Department 5.8 5.0 5.3 5.3 4.8 5.3
College 5.5 5.3 5.3 5.3 5.0 5.3
University 4.8 4.8 4.8 4.8 4.8 4.8
Median Years to Bachelor's Degree (Transfers)
Department 2.8 2.3 2.8 2.3 2.7 2.8
College 3.3 2.9 2.8 2.8 2.8 2.8
University 2.3 2.3 2.3 2.3 2.3 2.3
Median Years to Master's Degree
Department 2.3 2.8 2.9 2.5 2.3 2.8
College 2.8 2.3 2.3 2.3 2.3 2.3
University 2.3 2.3 2.3 1.9 2.3 2.3
Median Units for Bachelor's Degree
Department 158.0 149.3 151.0 149.0 148.0 151.0
College 159.0 155.0 153.0 153.0 151.0 154.0
University 135.5 134.0 133.0 131.0 131.0 133.0
Degree Conferred by Program/Concentration 5-Year Total
Undergraduate DegreeMechanical Engineering 87 128 111 141 183 650
Sub-Total 87 128 111 141 183 650
Graduate Degree
Mechanical Engineering 13 11 10 16 12 62
Sub-Total 13 11 10 16 12 62
Graduating Year
Note: Median years or units to degree are used to calculate the average rather than the mean in order to reduce the impact that extreme values would otherwise have on the averages of smaller programs.
Mechanical Engineering 16
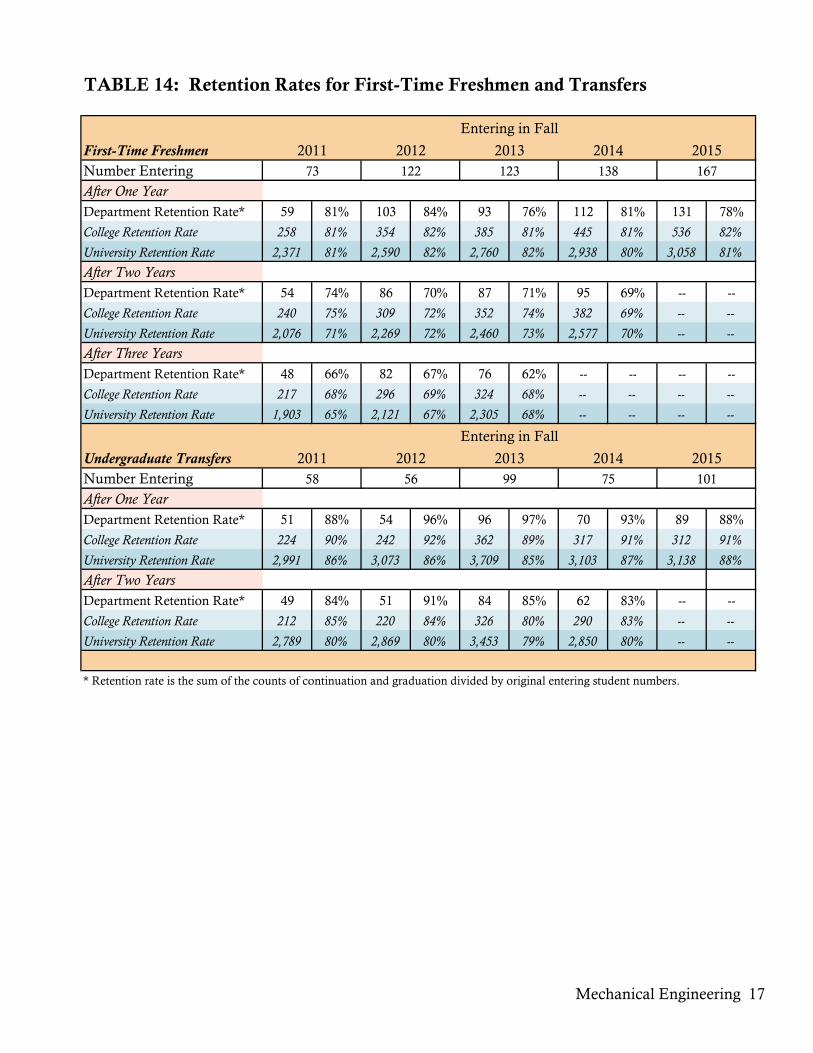
TABLE 14: Retention Rates for First-Time Freshmen and Transfers
First-Time FreshmenNumber EnteringAfter One YearDepartment Retention Rate* 59 81% 103 84% 93 76% 112 81% 131 78%
College Retention Rate 258 81% 354 82% 385 81% 445 81% 536 82%
University Retention Rate 2,371 81% 2,590 82% 2,760 82% 2,938 80% 3,058 81%
After Two YearsDepartment Retention Rate* 54 74% 86 70% 87 71% 95 69% -- --
College Retention Rate 240 75% 309 72% 352 74% 382 69% -- --
University Retention Rate 2,076 71% 2,269 72% 2,460 73% 2,577 70% -- --
After Three YearsDepartment Retention Rate* 48 66% 82 67% 76 62% -- -- -- --
College Retention Rate 217 68% 296 69% 324 68% -- -- -- --
University Retention Rate 1,903 65% 2,121 67% 2,305 68% -- -- -- --
Undergraduate TransfersNumber EnteringAfter One YearDepartment Retention Rate* 51 88% 54 96% 96 97% 70 93% 89 88%
College Retention Rate 224 90% 242 92% 362 89% 317 91% 312 91%
University Retention Rate 2,991 86% 3,073 86% 3,709 85% 3,103 87% 3,138 88%
After Two YearsDepartment Retention Rate* 49 84% 51 91% 84 85% 62 83% -- --
College Retention Rate 212 85% 220 84% 326 80% 290 83% -- --
University Retention Rate 2,789 80% 2,869 80% 3,453 79% 2,850 80% -- --
58 56 99 75 101
* Retention rate is the sum of the counts of continuation and graduation divided by original entering student numbers.
Entering in Fall
2011 2012 2013 2014 2015
Entering in Fall
2011 2012 2013 2014 201573 122 123 138 167
Mechanical Engineering 17

TABLE 14: Retention Rates for First-Time Freshmen and Transfers
81% 84%76%
81% 78%
81% 82% 81% 81% 82%
81% 82% 82% 80% 81%0%
20%
40%
60%
80%
100%
2011 2012 2013 2014 2015
One-Year Retention RateFirst-Time Freshmen
DepartmentRetentionRate*
CollegeRetentionRate
UniversityRetentionRate
88%96% 97% 93%
88%
90% 92% 89% 91% 91%
86% 86% 85% 87% 88%0%
20%
40%
60%
80%
100%
2011 2012 2013 2014 2015
One-Year Retention RateUndergraduate Transfers
DepartmentRetentionRate*
CollegeRetentionRate
UniversityRetentionRate
81%84%
76%
81%78%
88%
96% 97%
93%88%
60%
70%
80%
90%
100%
2011 2012 2013 2014 2015
Department One-Year Retention RateFirst-Time Freshmen and Transfers
First-TimeFreshmen
UndergraduateTransfers
Mechanical Engineering 18

TABLE 15: Graduation Rates for First-Time Freshmen and Transfers
First-Time FreshmenNumber Entering4-Year Graduation RateDepartment Rate 1 1% 0 0% 3 4% 3 4% 7 6%
College Rate 8 2% 4 1% 11 3% 16 5% 17 4%
University Rate 191 7% 203 7% 243 9% 242 8% 276 9%
5-Year Graduation RateDepartment Rate 9 13% 24 20% 16 23% 20 27% -- --
College Rate 60 18% 67 18% 63 19% 72 23% -- --
University Rate 748 29% 894 29% 883 32% 942 32% -- --
6-Year Graduation RateDepartment Rate 27 38% 48 39% 30 43% -- -- -- --
College Rate 125 37% 127 34% 120 37% -- -- -- --
University Rate 1,121 43% 1,400 46% 1,320 48% -- -- -- --
Undergraduate TransfersNumber Entering2-Year Graduation RateDepartment Rate 8 20% 5 9% 15 27% 13 13% 12 16%
College Rate 13 5% 8 3% 21 8% 36 9% 24 7%
University Rate 844 24% 818 24% 857 24% 1,119 26% 969 27%
3-Year Graduation RateDepartment Rate 24 59% 38 66% 35 63% 44 44% -- --
College Rate 104 39% 114 46% 110 42% 158 39% -- --
University Rate 2,044 58% 2,069 59% 2,123 59% 2,549 59% -- --
4-Year Graduation RateDepartment Rate 32 78% 43 74% 46 82% -- -- -- --
College Rate 160 61% 155 62% 170 65% -- -- -- --
University Rate 2,517 71% 2,478 71% 2,509 70% -- -- -- --
99 75
2010 2011 2012 2013 2014
Note: Programs within the College of Engineering and Computer Sciences require an average of 133 units for a Bachelor's degree, which is higher than the unit requirement of most other programs (on average, most require 120 units). Subsequently, the graduation rate of this college is not comparable with that of other colleges.
Entering in Fall
2008 2009 2010 2011 201271 123 70 73 122
Entering in Fall
41 58 56
Mechanical Engineering 19

TABLE 15: Graduation Rates for First-Time Freshmen and Transfers
78% 74%82%
61% 62% 65%
71% 71% 70%0%
20%
40%
60%
80%
100%
2010 2011 2012
Entering in Fall...
Four-Year Graduation RateUndergraduate Transfers
DepartmentRate
College Rate
UniversityRate
38% 39% 43%
37% 34% 37%43% 46% 48%
0%
20%
40%
60%
80%
100%
2008 2009 2010
Entering in Fall...
Six-Year Graduation RateFirst-Time Freshmen
DepartmentRate
College Rate
UniversityRate
38% 39%43%
78% 74%82%
0%
20%
40%
60%
80%
100%
Cohort 1 Cohort 2 Cohort 3
Department Graduation RateFirst-Time Freshmen and Transfers
First-TimeFreshmen
UndergraduateTransfers
Mechanical Engineering 20

Name Course SectionStudent Course Credits
EnrollmentTeam
TeachingStudent
FTEWTU
Artz, MH ME 037 2 1 13 100 0.9 2.0
Artz, MH ME 037 13 1 14 100 0.9 2.0
Artz, MH ME 037 14 1 15 100 1.0 2.0
Artz, MH Total 42 2.8 6.0
Awni, K ME 275 2 3 4 100 0.8 3.0
Awni, K ME 296S 1 3 4 100 0.9 3.0
Awni, K Total 8 1.7 6.0
Bell, MM ME 191 5 1 17 100 1.1 2.0
Bell, MM ME 191 6 1 11 100 0.7 2.0
Bell, MM Total 28 1.9 4.0
Brummer, EL ME 037 12 1 16 100 1.1 2.0
Brummer, EL ME 037 16 1 13 100 0.9 2.0
Brummer, EL Total 29 1.9 4.0
Chakroborty, SP ENGR 124 7 3 31 100 6.2 3.0
Chakroborty, SP Total 31 6.2 3.0
Chen, W ME 105 4 3 69 100 13.8 3.0
Chen, W ME 105 5 1 27 100 1.8 2.0
Chen, W ME 105 6 1 21 100 1.4 2.0
Chen, W ME 105 7 1 21 100 1.4 2.0
Chen, W Total 138 18.4 9.0
Daneshvar, N ENGR 124 9 3 21 100 4.2 3.0
Daneshvar, N Total 21 4.2 3.0
Eke, EM ENGR 110 2 3 34 100 6.8 3.0
Eke, EM ME 105 1 3 26 100 5.2 3.0
Eke, EM ME 105 2 1 26 100 1.7 2.0
Eke, EM ME 172 1 3 28 100 5.6 3.0
Eke, EM Total 114 19.3 11.0
Fernandez, S ENGR 006 5 2 36 100 4.8 2.0
Fernandez, S ENGR 006 6 1 36 100 2.4 2.0
Fernandez, S Total 72 7.2 4.0
Garcia, E ENGR 006 9 2 38 100 5.1 2.0
Garcia, E ENGR 006 10 1 38 100 2.5 2.0
Garcia, E ENGR 006 11 2 37 100 4.9 2.0
Garcia, E ENGR 006 12 1 37 100 2.5 2.0
Garcia, E ENGR 124 2 3 41 100 8.2 3.0
Garcia, E ME 190 2 1 39 100 2.6 2.0
Garcia, E ME 190 7 1 8 100 0.5 2.0
Garcia, E Total 238 26.3 15.0
Granda, JJ ME 171 1 3 35 100 7.0 3.0
Granda, JJ ME 172 2 3 30 100 6.0 3.0
Granda, JJ ME 173 1 3 22 100 4.4 3.0
Appendix A: Faculty Work Load (Fall 2016)
A - 1

Name Course SectionStudent Course Credits
EnrollmentTeam
TeachingStudent
FTEWTU
Appendix A: Faculty Work Load (Fall 2016)
Granda, JJ ME 240 1 3 2 100 0.5 3.0
Granda, JJ ME 500 5 4 2 100 0.7 1.0
Granda, JJ Total 91 18.5 13.0
Hahn, WD ENGR 045 6 1 16 100 1.1 2.0
Hahn, WD ENGR 045 12 1 11 100 0.7 2.0
Hahn, WD ENGR 045 13 1 17 100 1.1 2.0
Hahn, WD ENGR 045 14 1 12 100 0.8 2.0
Hahn, WD ENGR 045 16 1 16 100 1.1 2.0
Hahn, WD ME 180 4 1 11 100 0.7 2.0
Hahn, WD ME 180 12 1 9 100 0.6 2.0
Hahn, WD ME 180 15 1 9 100 0.6 2.0
Hahn, WD Total 101 6.7 16.0
Holl, SL ME 195A 1 9.5 2 100 1.4 0.7
Holl, SL ME 199 1 2 12 100 1.6 4.0
Holl, SL ME 199 5 1 1 100 0.1 0.3
Holl, SL Total 15 3.1 5.0
Homen, PD ENGR 001A 90 2 20 100 2.7 2.0
Homen, PD ENGR 001A 91 1 20 100 1.3 2.0
Homen, PD ENGR 045 10 2 49 100 6.5 2.0
Homen, PD ENGR 045 17 2 1 100 0.1 2.0
Homen, PD ENGR 045 18 2 14 100 1.9 2.0
Homen, PD ME 180 5 2 57 100 7.6 2.0
Homen, PD ME 180 7 2 41 100 5.5 2.0
Homen, PD ME 180 14 2 16 100 2.1 2.0
Homen, PD ME 199 2 3 1 100 0.2 0.3
Homen, PD Total 219 27.9 16.3
Jackson, JJ ME 037 3 1 16 100 1.1 2.0
Jackson, JJ ME 037 4 1 15 100 1.0 2.0
Jackson, JJ ME 037 5 1 16 100 1.1 2.0
Jackson, JJ ME 191 2 1 20 100 1.3 2.0
Jackson, JJ ME 191 3 1 21 100 1.4 2.0
Jackson, JJ ME 191 7 1 13 100 0.9 2.0
Jackson, JJ Total 101 6.7 12.0
Koontz, RA ENGR 006 7 2 35 100 4.7 2.0
Koontz, RA ENGR 006 8 1 35 100 2.3 2.0
Koontz, RA ME 190 8 1 9 100 0.6 2.0
Koontz, RA Total 79 7.6 6.0
Kumagai, A ME 037 1 2 55 100 7.3 2.0
Kumagai, A ME 037 9 2 47 100 6.3 2.0
Kumagai, A ME 037 15 2 45 100 6.0 2.0
Kumagai, A ME 136 1 3 22 100 4.4 3.0
Kumagai, A ME 299 1 1 2 100 0.2 1.0
A - 2

Name Course SectionStudent Course Credits
EnrollmentTeam
TeachingStudent
FTEWTU
Appendix A: Faculty Work Load (Fall 2016)
Kumagai, A ME 500 2 4 2 100 0.7 1.0
Kumagai, A Total 173 24.8 11.0
Liu, T ME 137 1 3 26 100 5.2 3.0
Liu, T ME 138 1 3 45 100 9.0 3.0
Liu, T ME 138 2 3 47 100 9.4 3.0
Liu, T ME 238 1 3 14 100 3.4 3.0
Liu, T Total 132 27.0 12.0
MacDonald, JR ME 194 1 1 11 100 0.7 1.0
MacDonald, JR ME 194 2 1 4 100 0.3 1.0
MacDonald, JR Total 15 1.0 2.0
Marbach, TL ENGR 124 1 3 47 100 9.4 3.0
Marbach, TL ENGR 124 6 3 24 100 4.8 3.0
Marbach, TL ME 128 1 1 24 100 1.6 2.0
Marbach, TL ME 128 2 1 17 100 1.1 2.0
Marbach, TL ME 128 7 2 41 100 5.5 2.0
Marbach, TL ME 199 3 1 1 100 0.1 0.3
Marbach, TL ME 500 1 5 1 100 0.4 0.5
Marbach, TL Total 155 22.9 12.8
McClain, K ME 177 1 2 37 100 4.9 2.0
McClain, K ME 177 2 1 37 100 2.5 2.0
McClain, K Total 74 7.4 4.0
Palma, LG ENGR 110 1 3 38 100 7.6 3.0
Palma, LG ENGR 110 3 3 45 100 9.0 3.0
Palma, LG ENGR 110W 1 1 21 100 1.4 1.3
Palma, LG ENGR 110W 2 1 25 100 1.7 1.3
Palma, LG ME 190 3 1 39 100 2.6 2.0
Palma, LG ME 190 6 1 22 100 1.5 2.0
Palma, LG Total 190 23.7 12.6
Potts, CW ENGR 045 3 1 12 100 0.8 2.0
Potts, CW ENGR 045 9 1 15 100 1.0 2.0
Potts, CW Total 27 1.8 4.0
Richards, NO ME 258 1 3 14 100 3.4 3.0
Richards, NO Total 14 3.4 3.0
Romani, MJ ME 126 8 3 44 100 8.8 3.0
Romani, MJ ME 128 4 1 19 100 1.3 2.0
Romani, MJ ME 128 6 2 33 100 4.4 2.0
Romani, MJ ME 128 8 1 14 100 0.9 2.0
Romani, MJ ME 159 1 3 30 100 6.1 3.0
Romani, MJ Total 140 21.5 12.0
Rowell, MD ENGR 045 5 1 16 100 1.1 2.0
Rowell, MD ENGR 045 7 1 16 100 1.1 2.0
Rowell, MD Total 32 2.1 4.0
A - 3

Name Course SectionStudent Course Credits
EnrollmentTeam
TeachingStudent
FTEWTU
Appendix A: Faculty Work Load (Fall 2016)
Sahragard-Monfared, S ME 108 1 2 46 100 6.1 2.0
Sahragard-Monfared, S ME 108 2 2 42 100 5.6 2.0
Sahragard-Monfared, S ME 180 2 1 16 100 1.1 2.0
Sahragard-Monfared, S ME 180 3 1 19 100 1.3 2.0
Sahragard-Monfared, S ME 180 8 1 18 100 1.2 2.0
Sahragard-Monfared, S ME 180 9 1 21 100 1.4 2.0
Sahragard-Monfared, S ME 180 13 1 11 100 0.7 2.0
Sahragard-Monfared, S Total 173 17.4 14.0
Sprott, KS ME 116 1 2 47 100 6.3 2.0
Sprott, KS ME 116 2 2 29 100 3.9 2.0
Sprott, KS ME 117 1 2 36 100 4.8 2.0
Sprott, KS ME 117 3 2 23 100 3.1 2.0
Sprott, KS ME 141 1 2 17 100 2.3 2.0
Sprott, KS Total 152 20.3 10.0
Suh, YS ENGR 006 1 2 36 100 4.8 2.0
Suh, YS ENGR 006 2 1 36 100 2.4 2.0
Suh, YS ENGR 006 3 2 37 100 4.9 2.0
Suh, YS ENGR 006 4 1 37 100 2.5 2.0
Suh, YS ME 296U 1 1 10 100 0.8 1.0
Suh, YS ME 296U 2 2 10 100 1.5 4.0
Suh, YS Total 166 16.9 13.0
Tang, H ME 037 7 1 15 100 1.0 2.0
Tang, H ME 037 8 1 14 100 0.9 2.0
Tang, H ME 171 4 3 44 100 8.8 3.0
Tang, H ME 171 5 3 35 100 7.0 3.0
Tang, H ME 172 4 3 34 100 6.8 3.0
Tang, H Total 142 24.5 13.0
Topping, TD ENGR 045 1 2 45 100 6.0 2.0
Topping, TD ENGR 045 2 1 17 100 1.1 2.0
Topping, TD ENGR 045 15 2 39 100 5.2 2.0
Topping, TD ENGR 045W 1 1 31 100 2.1 1.3
Topping, TD ENGR 045W 2 1 21 100 1.4 1.3
Topping, TD ME 296T 1 3 12 100 2.6 3.0
Topping, TD Total 165 18.4 11.6
Tuzcu, I ENGR 110 4 3 35 100 7.0 3.0
Tuzcu, I ENGR 110 5 3 29 100 5.8 3.0
Tuzcu, I ENGR 201 1 3 19 100 3.9 3.0
Tuzcu, I ENGR 202 1 3 12 100 2.5 3.0
Tuzcu, I ME 500 3 4 1 100 0.3 0.5
Tuzcu, I Total 96 19.5 12.5
Vogt, R ME 116 4 2 13 100 1.7 2.0
Vogt, R ME 190 1 2 46 100 6.1 2.0
A - 4

Name Course SectionStudent Course Credits
EnrollmentTeam
TeachingStudent
FTEWTU
Appendix A: Faculty Work Load (Fall 2016)
Vogt, R ME 190 5 2 71 100 9.5 2.0
Vogt, R ME 191 4 1 82 100 5.5 1.0
Vogt, R ME 196F 1 3 35 100 7.0 3.0
Vogt, R ME 199 4 2.2 5 100 0.7 1.7
Vogt, R ME 209 2 2 10 100 1.4 2.0
Vogt, R Total 262 31.9 13.7
Zhou, D ME 126 1 3 38 100 7.6 3.0
Zhou, D ME 126 9 3 28 100 5.6 3.0
Zhou, D ME 296O 1 3 12 100 2.9 3.0
Zhou, D Total 78 16.1 9.0
Grand Total 3513 461.0 307.5
Source: APDB report, Fall 2016, excluding the instructors without college/department affiliation.
Please Note: (*) Indicates that the instructor teaches courses in more than one department.
A - 5

Name Course SectionStudent Course Credits
EnrollmentTeam
TeachingStudent
FTEWTU
Artz, MH ME 037 2 1 16 100 1.1 2.0
Artz, MH ME 037 4 1 16 100 1.1 2.0
Artz, MH ME 037 11 1 16 100 1.1 2.0
Artz, MH ME 037 12 1 15 100 1.0 2.0
Artz, MH Total 63 4.2 8.0
Awni, K ME 165 1 2 23 100 3.1 2.0
Awni, K ME 165 2 1 23 100 1.5 2.0
Awni, K ME 296V 1 3 6 100 1.4 3.0
Awni, K ME 299 2 3 1 100 0.3 0.5
Awni, K Total 53 6.3 7.5
Bandy, R ME 180 1 2 15 100 2.0 2.0
Bandy, R ME 180 2 2 22 100 2.9 2.0
Bandy, R ME 180 6 2 33 100 4.4 2.0
Bandy, R ME 180W 1 1 2 100 0.1 1.3
Bandy, R ME 186 1 3 17 100 3.4 3.0
Bandy, R Total 89 12.9 10.3
Bell, MM ME 191 3 1 21 100 1.4 2.0
Bell, MM ME 191 8 1 7 100 0.5 2.0
Bell, MM Total 28 1.9 4.0
Bessette, MJ ME 191 10 1 13 100 0.9 2.0
Bessette, MJ Total 13 0.9 2.0
Brummer, EL ME 037 13 1 16 100 1.1 2.0
Brummer, EL ME 037 14 1 15 100 1.0 2.0
Brummer, EL ME 037 15 1 15 100 1.0 2.0
Brummer, EL ME 037 16 1 14 100 0.9 2.0
Brummer, EL Total 60 4.0 8.0
Carter, KA ME 037 3 1 16 100 1.1 2.0
Carter, KA ME 037 6 1 16 100 1.1 2.0
Carter, KA ME 037 7 1 16 100 1.1 2.0
Carter, KA ME 191 6 1 14 100 0.9 2.0
Carter, KA ME 191 7 1 3 100 0.2 2.0
Carter, KA Total 65 4.3 10.0
Chakroborty, SP ENGR 124 3 3 28 100 5.6 3.0
Chakroborty, SP ENGR 124 6 3 12 100 2.4 3.0
Chakroborty, SP Total 40 8.0 6.0
Chen, W ME 105 5 3 37 100 7.4 3.0
Chen, W ME 105 6 1 37 100 2.5 2.0
Chen, W ME 105 7 3 27 100 5.4 3.0
Chen, W ME 105 8 1 27 100 1.8 2.0
Chen, W Total 128 17.1 10.0
Eke, EM ME 105 1 3 26 100 5.2 3.0
Eke, EM ME 105 2 1 26 100 1.7 2.0
Appendix B: Faculty Work Load (Spring 2017)
B - 1

Name Course SectionStudent Course Credits
EnrollmentTeam
TeachingStudent
FTEWTU
Appendix B: Faculty Work Load (Spring 2017)
Eke, EM ME 105 3 3 11 100 2.2 3.0
Eke, EM ME 105 4 1 11 100 0.7 2.0
Eke, EM ME 172 1 3 5 100 1.0 3.0
Eke, EM Total 79 10.9 13.0
Fernandez, S ENGR 006 11 2 9 100 1.2 2.0
Fernandez, S ENGR 006 12 1 9 100 0.6 2.0
Fernandez, S Total 18 1.9 4.0
Garcia, E ENGR 006 1 2 20 100 2.7 2.0
Garcia, E ENGR 006 2 1 18 100 1.2 2.0
Garcia, E ENGR 006 5 2 12 100 1.6 2.0
Garcia, E ENGR 006 6 1 13 100 0.9 2.0
Garcia, E ENGR 110 7 3 24 100 4.8 3.0
Garcia, E ME 190 2 1 19 100 1.3 2.0
Garcia, E ME 190 9 1 17 100 1.1 2.0
Garcia, E Total 123 13.5 15.0
Gastelum, WQ ENGR 110W 2 1 10 100 0.7 1.3
Gastelum, WQ Total 10 0.7 1.3
Granda, JJ ME 171 2 3 18 100 3.6 3.0
Granda, JJ ME 172 2 3 29 100 5.8 3.0
Granda, JJ ME 196E 1 3 18 100 3.6 3.0
Granda, JJ ME 272 1 3 12 100 3.0 3.0
Granda, JJ Total 77 16.0 12.0
Hahn, WD ENGR 045 8 1 15 100 1.0 2.0
Hahn, WD ENGR 045 9 1 15 100 1.0 2.0
Hahn, WD ENGR 045 10 1 13 100 0.9 2.0
Hahn, WD ENGR 045 14 1 14 100 0.9 2.0
Hahn, WD ME 180 7 1 12 100 0.8 2.0
Hahn, WD ME 180 9 1 7 100 0.5 2.0
Hahn, WD Total 76 5.1 12.0
Holl, SL ME 195A 1 9 1 100 0.8 0.3
Holl, SL ME 199 1 2 16 100 1.7 5.3
Holl, SL ME 199 5 1 23 100 1.5 7.7
Holl, SL Total 40 4.0 13.3
Homen, PD ENGR 045 1 2 41 100 5.5 2.0
Homen, PD ENGR 045 11 2 24 100 3.2 2.0
Homen, PD ME 180 3 1 10 100 0.7 2.0
Homen, PD ME 180 4 1 15 100 1.0 2.0
Homen, PD ME 182 1 3 37 100 7.4 3.0
Homen, PD ME 199 3 3 7 100 1.4 2.3
Homen, PD Total 134 19.1 13.3
Jackson, JJ ME 037 5 1 15 100 1.0 2.0
Jackson, JJ ME 190 4 1 21 100 1.4 2.0
B - 2

Name Course SectionStudent Course Credits
EnrollmentTeam
TeachingStudent
FTEWTU
Appendix B: Faculty Work Load (Spring 2017)
Jackson, JJ ME 190 10 1 16 100 1.1 2.0
Jackson, JJ ME 191 2 1 22 100 1.5 2.0
Jackson, JJ ME 191 4 1 22 100 1.5 2.0
Jackson, JJ ME 191 9 1 19 100 1.3 2.0
Jackson, JJ Total 115 7.7 12.0
Kazemifar, F ME 253 1 3 10 100 2.5 3.0
Kazemifar, F* Total 10 2.5 3.0
Kumagai, A ME 138 1 3 50 100 10.0 3.0
Kumagai, A ME 138 2 3 49 100 9.8 3.0
Kumagai, A ME 236 1 3 14 100 3.5 3.0
Kumagai, A ME 500 3 4 3 100 1.1 1.5
Kumagai, A Total 116 24.3 10.5
MacDonald, JR ME 194 1 1 17 100 1.1 1.0
MacDonald, JR ME 194 2 1 7 100 0.5 1.0
MacDonald, JR Total 24 1.6 2.0
Marbach, TL ENGR 124 1 3 37 100 7.4 3.0
Marbach, TL ENGR 124 4 3 46 100 9.2 3.0
Marbach, TL ME 128 1 2 83 100 11.1 2.0
Marbach, TL ME 128 2 1 22 100 1.5 2.0
Marbach, TL ME 128 3 1 23 100 1.5 2.0
Marbach, TL ME 500 5 5 2 100 0.8 1.0
Marbach, TL Total 213 31.4 13.0
McClain, K ME 177 1 2 35 100 4.7 2.0
McClain, K ME 177 2 1 35 100 2.3 2.0
McClain, K Total 70 7.0 4.0
McKown, AJ ENGR 045 5 1 12 100 0.8 2.0
McKown, AJ ENGR 045 6 1 13 100 0.9 2.0
McKown, AJ Total 25 1.7 4.0
Sahragard-Monfared, S ENGR 110 2 3 30 100 6.0 3.0
Sahragard-Monfared, S ME 108 1 2 50 100 6.7 2.0
Sahragard-Monfared, S ME 108 2 2 41 100 5.5 2.0
Sahragard-Monfared, S ME 180 5 1 13 100 0.9 2.0
Sahragard-Monfared, S ME 180 8 1 13 100 0.9 2.0
Sahragard-Monfared, S ME 190 3 1 15 100 1.0 2.0
Sahragard-Monfared, S ME 190 8 1 11 100 0.7 2.0
Sahragard-Monfared, S Total 173 21.6 15.0
Popovich, C ENGR 124W 2 1 2 100 0.1 1.3
Popovich, C ME 128 7 1 21 100 1.4 2.0
Popovich, C ME 128 8 1 17 100 1.1 2.0
Popovich, C Total 40 2.7 5.3
Potts, CW ENGR 045 3 1 13 100 0.9 2.0
Potts, CW ENGR 045 4 1 11 100 0.7 2.0
B - 3

Name Course SectionStudent Course Credits
EnrollmentTeam
TeachingStudent
FTEWTU
Appendix B: Faculty Work Load (Spring 2017)
Potts, CW Total 24 1.6 4.0
Romani, MJ ME 121 1 2 29 100 3.9 2.0
Romani, MJ ME 126 5 3 43 100 8.7 3.0
Romani, MJ ME 128 4 2 42 100 5.6 2.0
Romani, MJ ME 128 5 1 20 100 1.3 2.0Romani, MJ ME 128 6 1 22 100 1.5 2.0
Romani, MJ Total 156 21.0 11.0
Rowell, MD ENGR 045 7 1 12 100 0.8 2.0
Rowell, MD ENGR 045 13 1 12 100 0.8 2.0
Rowell, MD Total 24 1.6 4.0
Sprott, KS ME 116 1 2 57 100 7.6 2.0
Sprott, KS ME 116 2 2 26 100 3.5 2.0
Sprott, KS ME 117 2 2 43 100 5.7 2.0
Sprott, KS ME 117 3 2 37 100 4.9 2.0
Sprott, KS ME 164 1 2 13 100 1.8 2.0
Sprott, KS ME 164 2 1 13 100 0.9 2.0
Sprott, KS Total 189 24.4 12.0
Suh, YS ENGR 006 7 2 19 100 2.5 2.0
Suh, YS ENGR 006 8 1 19 100 1.3 2.0
Suh, YS ENGR 006 9 2 5 100 0.7 2.0
Suh, YS ENGR 006 10 1 6 100 0.4 2.0
Suh, YS ENGR 006W 2 1 1 100 0.1 1.3
Suh, YS Total 50 4.9 9.3
Tang, H ME 171 4 3 23 100 4.7 3.0
Tang, H ME 171 5 3 27 100 5.4 3.0
Tang, H ME 171 6 3 26 100 5.2 3.0
Tang, H ME 172 3 3 50 100 10.0 3.0
Tang, H ME 172 4 3 42 100 8.4 3.0
Tang, H Total 168 33.7 15.0
Topping, TD ENGR 045 2 2 38 100 5.1 2.0
Topping, TD ENGR 045 12 2 27 100 3.6 2.0
Topping, TD ME 184 2 3 17 100 3.6 3.0
Topping, TD ME 199 4 1 2 100 0.2 0.7
Topping, TD ME 209 1 2 14 100 2.3 2.0
Topping, TD ME 296R 1 3 6 100 1.5 3.0
Topping, TD ME 299 1 3 1 100 0.3 0.5
Topping, TD ME 500 1 5 2 100 0.8 1.0
Topping, TD Total 107 17.3 14.2
Tuzcu, I ENGR 110 4 3 51 100 10.3 3.0
Tuzcu, I ENGR 110 8 3 41 100 8.2 3.0
Tuzcu, I ENGR 201 1 3 18 100 4.4 3.0
Tuzcu, I ENGR 202 1 3 12 100 2.9 3.0
B - 4

Name Course SectionStudent Course Credits
EnrollmentTeam
TeachingStudent
FTEWTU
Appendix B: Faculty Work Load (Spring 2017)
Tuzcu, I Total 122 25.7 12.0
Vogt, R ME 037 1 2 110 100 14.7 2.0
Vogt, R ME 037 8 2 76 100 10.2 2.0
Vogt, R ME 190 6 2 54 100 7.2 2.0
Vogt, R ME 190 7 2 44 100 5.9 2.0
Vogt, R ME 191 1 1 61 100 4.1 1.0
Vogt, R ME 191 5 1 60 100 4.0 1.0
Vogt, R ME 199 2 2 3 100 0.4 1.0
Vogt, R ME 299 3 3 3 100 0.7 1.5
Vogt, R ME 500 2 4 2 100 0.7 1.0
Vogt, R Total 413 47.7 13.5
Zabihian, F ENGR 124 2 3 34 100 6.8 3.0
Zabihian, F ENGR 124 5 3 28 100 5.6 3.0
Zabihian, F ME 196G 1 3 15 100 3.2 3.0
Zabihian, F Total 77 15.6 9.0
Zhou, D ME 123 1 2 24 100 3.2 2.0
Zhou, D ME 126 1 3 32 100 6.4 3.0
Zhou, D ME 126 4 3 36 100 7.2 3.0
Zhou, D ME 500 4 5 3 100 1.2 1.5
Zhou, D Total 95 18.0 9.5
Grand Total 3307 442.3 332.0
Source: APDB report, Spring 2017, excluding the instructors without college/department affiliation.
Please Note: (*) Indicates that the instructor teaches courses in more than one department.
B - 5

College of Engineering & Computer Science: Student Flow from Initial Major to Final Degree2010 Freshman Cohort Initial Major
(Entering in Fall 2010) Civil EngineeringConstruction Management Computer Science
Electrical & Electronic Engineering
Mechanical Engineering College
Cohort Headcount 91 18 57 91 70 327Civil Engineering 14 1 4 19Construction Management 4 1 5Computer Science 6 1 7Electrical & Electronic Engineering 3 19 1 23Mechanical Engineering 1 19 20Withdrew 34 11 28 37 27 137Enrolled in Fall 2016 26 1 10 20 13 70Graduated (Initial major) 14 4 6 19 19 62
Flowed in from undeclared group 1 1 1 0 1 4Flowed in from other ECS majors 0 2 3 1 6 12Flowed in from other colleges of Sac State 1 0 6 1 3 11Total Inflow 2 3 10 2 10 27Adjusted Cohort 76 19 54 78 69 296
Flowed out to other ECS majors 5 1 1 4 1 12Flowed out to other colleges of Sac State 12 1 12 11 10 46Total Outflow 17 2 13 15 11 58
From initial Major1 15.4% 22.2% 10.5% 20.9% 27.1% 19.0%Add inflow students2 21.1% 36.8% 29.6% 26.9% 42.0% 30.1%Add outflow students3 (Official rate) 34.1% 33.3% 33.3% 37.4% 42.9% 36.7%
Withdraw Rate 37.4% 61.1% 49.1% 40.7% 38.6% 41.9%Outflow Rate 18.7% 11.1% 22.8% 16.5% 15.7% 17.7%
2. This rate is calculated by dividing the number of students who graduated from their initial major plus inflow students by the number of students in the adjusted cohort (original cohort plus inflow students minus outflow students). This is the actual graduation rate for each major and college.
3. This rate is calculated by dividing the number of students who graduated from their initial major plus outflow students by the number of students in the original cohort. This is the official graduate rate for each major and college.
Final Degree (Graduated by Summer 2016)
Student Inflow
Student Outflow
6‐Year Graduation Rate
6‐Year Attrition Rate
1. This rate is calculated by dividing the number of students who graduated from their initial major by the number of students in the original cohort.
C - 1

College of Engineering & Computer Science: Student Flow from Initial Major to Final Degree2012 Transfer Cohort Initial Major
(Entering in Fall 2012) Civil EngineeringConstruction Management Computer Science
Electrical & Electronic Engineering
Mechanical Engineering College
Cohort Headcount 77 19 61 49 56 262Civil Engineering 50 1Construction Management 12Computer Science 27Electrical & Electronic Engineering 1 27Mechanical Engineering 1 41 42Withdrew 14 4 16 14 5 53Enrolled in Fall 2016 10 3 15 6 5 39Graduated (Initial major) 50 12 27 27 41 157
Flowed in from undeclared group 0 0 0 0 0 0Flowed in from other ECS majors 1 1 1 0 0 3Flowed in from other colleges of Sac State 1 0 0 0 1 2Total Inflow 2 1 1 0 1 5Adjusted Cohort 76 20 59 47 52 254
Flowed out to other ECS majors 1 0 0 1 1 3Flowed out to other colleges of Sac State 2 0 3 1 4 10Total Outflow 3 0 3 2 5 13
From initial Major1 64.9% 63.2% 44.3% 55.1% 73.2% 59.9%Add inflow students2 68.4% 65.0% 47.5% 57.4% 80.8% 63.8%Add outflow students3 (Official rate) 68.8% 63.2% 49.2% 59.2% 82.1% 64.9%
Withdraw Rate 18.2% 21.1% 26.2% 28.6% 8.9% 20.2%Outflow Rate 3.9% 0.0% 4.9% 4.1% 8.9% 5.0%
2. This rate is calculated by dividing the number of students who graduated from their initial major plus inflow students by the number of students in the adjusted cohort (original cohort plus inflow students minus outflow students). This is the actual graduation rate for each major and college.
3. This rate is calculated by dividing the number of students who graduated from their initial major plus outflow students by the number of students in the original cohort. This is the official graduate rate for each major and college.
Final Degree (Graduated by Summer 2016)
Student Inflow
Student Outflow
4‐Year Graduation Rate
4‐Year Attrition Rate
1. This rate is calculated by dividing the number of students who graduated from their initial major by the number of students in the original cohort.
C - 2