Mechanical effect of fluid migration on the complexity of ...1997)JGR.pdf · YAMASHITA: MECHANICAL...
10
JOURNAL OF GEOPHYSICAL RESEARCH, VOL. 102, NO. B8, PAGES 17,797-17,806, AUGUST 10, 1997 Mechanical effect of fluid migration on the complexity of seismicity Teruo Yamashita Earthquake Research Institute, University of Tokyo, Tokyo, Japan Abstract. Spatio-temporal variation of earthquakeactivity is modeledassuming fluid mi- gration in a narrow porous fault zone whoseboundariesare impermeable. The duration of earthquake sequence is assumed to be much shorter than the recurrenceperiod of char- acteristic events on the fault. Principle of the effective stresscoupled to the Coulomb failure criterion introducesmechanical couplingbetweenfault slip and pore fluid pres- sure. A linear relation is assumed in our simulationsbetweenthe accumulatedslip and fault zone width on the basisof laboratory and field observations. High complexity is ob- servedin the rupture activity so long as an inhomogeneity is introduced in the spatial distribution of initial strength, which is defined as the fracture threshold stressbefore the intrusion of the fluid. Frequency-magnitude statisticsof intermediate-size eventsobeys the Gutenberg-Richter relation for all the models in which spatial heterogeneity is intro- duced for the initial strength. The behavior of larger-sizeeventsseems to be rather model dependent. It is also observedthat the rupture occurrence tends to be inactivated imme- diately before the occurrence of the largest event in a sequence. This never happens if a brittle rupture is assumedin an elastic medium with no mechanical effect of fluid. This inactivation will occur becauseit takes much time to build up fluid pressureto break a fault segmenthaving high initial strength, whoserupture triggers the largest event in a sequence.Our calculationsalso showthat a singlepredominant principal event cannot be observedin a sequence when both the variance and averagevalue of the distributed initial strengths are large. This may explain a feature observed for earthquake swarm. Introduction It is widely believed that fluids play an important role in many aspects of earthquake faulting. As a typical mechan- ical effect, we can mention the lowering of fracture strength by fluid pressureon the basis of the principle of the effec- tive stress coupled to the Coulomb failure criterion[Raleigh et al., 1976], which is thought to be applicable at least to the top few kilometers of the crust [Raleighet al., 1976; Zoback and Hickman, 1982; Zoback and Healy, 1984; Hick- man et al., 1995]. The role of pore fluid in reducing the effective value of the confining stressin bulk samplesand the normal stress across frictional surfaces has been demon- strated in laboratory experiments [e.g., Brace and Martin, 1968; Byeflee and Brace,1972]. Field evidence comes from earthquakes induced either through direct injection of flu- ids down boreholes or from the filling of large reservoirs with subsequent infiltration of water into the underlying rock mass [e.g., Healy et al., 1968; Raleigh et al., 1976]. Additional evidence of mechanical involvement of fluids in earthquake faulting comesfrom the substantial changein groundwater level, and surface dischargebefore and after some earthquakes in the shallow crust. For example, the variation in groundwater flow is observed at many loca- tions before and after the 1995 Hyogoken-Nanbu (Kobe) earthquake; Tsunogai and Wakita [1995]report a steady increase in C1- and SO•- concentrations with time from Copyright 1997 by the American Geophysical Union. Paper number 97JB00763. 0148-0227/97/97J B- 00763 $ 09.00 August 1994 to just before the earthquake at a site in the aftershock zone; these precursory changes are interpreted to be due to the intrusion of groundwater from deep frac- ture zone. It is also reported that large quantities of min- eral water flowed out through numerousspringsduring the Matsushiro, Japan, earthquake swarm [Iijima, 1969]. This flow occurred mostly within the zoneof fissuring associated with the fault [Tsuneishi and Nakamura, 1970]. Mechanical effectsof fluids have been proposed in a num- ber of theoretical studies as playing a role in a variety of earthquakerupture phenomena such as aftershocks [Nut and Booker, 1972], fault creep [Rice and Simons,1976], earthquake precursory process [Rudnickiand Chen, 1988; Segalland Rice, 1995], and so on. Nut and Booker [1972] and Booker [1974] studied the effect of fluid migration on af- tershock occurrence. However, they did not consider a frac- ture condition.For example, Nut andBooker [1972] instead assumedthat the rate of aftershock occurrence is propor- tional to time derivative of the local pore pressure; Booker [1974] also madea similarassumption. However, the mag- nitude and distribution of fracture strength generally play a central role in the results of rupture simulation, so that fracture condition has to be explicitly taken into account in a more reasonable modeling. Sleep and Blanpied[1992] presented models of the earthquake cycle with transiently high pore fluid pressure. Segalland Rice [1995]extended their modeling and analyzed the conditions for unstable slip on a fluid-infiltrated fault usinga rate and state depen- dent friction law including the effects of dilatancy and pore compaction. However, they could not considerthe spatial migration of fluid or spario-temporal changein earthquake 17,797
Transcript of Mechanical effect of fluid migration on the complexity of ...1997)JGR.pdf · YAMASHITA: MECHANICAL...

JOURNAL OF GEOPHYSICAL RESEARCH, VOL. 102, NO. B8, PAGES 17,797-17,806, AUGUST 10, 1997
Mechanical effect of fluid migration on the complexity of seismicity
Teruo Yamashita
Earthquake Research Institute, University of Tokyo, Tokyo, Japan
Abstract. Spatio-temporal variation of earthquake activity is modeled assuming fluid mi- gration in a narrow porous fault zone whose boundaries are impermeable. The duration of earthquake sequence is assumed to be much shorter than the recurrence period of char- acteristic events on the fault. Principle of the effective stress coupled to the Coulomb failure criterion introduces mechanical coupling between fault slip and pore fluid pres- sure. A linear relation is assumed in our simulations between the accumulated slip and fault zone width on the basis of laboratory and field observations. High complexity is ob- served in the rupture activity so long as an inhomogeneity is introduced in the spatial distribution of initial strength, which is defined as the fracture threshold stress before the intrusion of the fluid. Frequency-magnitude statistics of intermediate-size events obeys the Gutenberg-Richter relation for all the models in which spatial heterogeneity is intro- duced for the initial strength. The behavior of larger-size events seems to be rather model dependent. It is also observed that the rupture occurrence tends to be inactivated imme- diately before the occurrence of the largest event in a sequence. This never happens if a brittle rupture is assumed in an elastic medium with no mechanical effect of fluid. This inactivation will occur because it takes much time to build up fluid pressure to break a fault segment having high initial strength, whose rupture triggers the largest event in a sequence. Our calculations also show that a single predominant principal event cannot be observed in a sequence when both the variance and average value of the distributed initial strengths are large. This may explain a feature observed for earthquake swarm.
Introduction
It is widely believed that fluids play an important role in many aspects of earthquake faulting. As a typical mechan- ical effect, we can mention the lowering of fracture strength by fluid pressure on the basis of the principle of the effec- tive stress coupled to the Coulomb failure criterion [Raleigh et al., 1976], which is thought to be applicable at least to the top few kilometers of the crust [Raleigh et al., 1976; Zoback and Hickman, 1982; Zoback and Healy, 1984; Hick- man et al., 1995]. The role of pore fluid in reducing the effective value of the confining stress in bulk samples and the normal stress across frictional surfaces has been demon-
strated in laboratory experiments [e.g., Brace and Martin, 1968; Byeflee and Brace, 1972]. Field evidence comes from earthquakes induced either through direct injection of flu- ids down boreholes or from the filling of large reservoirs with subsequent infiltration of water into the underlying rock mass [e.g., Healy et al., 1968; Raleigh et al., 1976]. Additional evidence of mechanical involvement of fluids in
earthquake faulting comes from the substantial change in groundwater level, and surface discharge before and after some earthquakes in the shallow crust. For example, the variation in groundwater flow is observed at many loca- tions before and after the 1995 Hyogoken-Nanbu (Kobe) earthquake; Tsunogai and Wakita [1995] report a steady increase in C1- and SO•- concentrations with time from
Copyright 1997 by the American Geophysical Union.
Paper number 97JB00763. 0148-0227/97/97J B- 00763 $ 09.00
August 1994 to just before the earthquake at a site in the aftershock zone; these precursory changes are interpreted to be due to the intrusion of groundwater from deep frac- ture zone. It is also reported that large quantities of min- eral water flowed out through numerous springs during the Matsushiro, Japan, earthquake swarm [Iijima, 1969]. This flow occurred mostly within the zone of fissuring associated with the fault [Tsuneishi and Nakamura, 1970].
Mechanical effects of fluids have been proposed in a num- ber of theoretical studies as playing a role in a variety of earthquake rupture phenomena such as aftershocks [Nut and Booker, 1972], fault creep [Rice and Simons, 1976], earthquake precursory process [Rudnicki and Chen, 1988; Segall and Rice, 1995], and so on. Nut and Booker [1972] and Booker [1974] studied the effect of fluid migration on af- tershock occurrence. However, they did not consider a frac- ture condition. For example, Nut and Booker [1972] instead assumed that the rate of aftershock occurrence is propor- tional to time derivative of the local pore pressure; Booker [1974] also made a similar assumption. However, the mag- nitude and distribution of fracture strength generally play a central role in the results of rupture simulation, so that fracture condition has to be explicitly taken into account in a more reasonable modeling. Sleep and Blanpied [1992] presented models of the earthquake cycle with transiently high pore fluid pressure. Segall and Rice [1995] extended their modeling and analyzed the conditions for unstable slip on a fluid-infiltrated fault using a rate and state depen- dent friction law including the effects of dilatancy and pore compaction. However, they could not consider the spatial migration of fluid or spario-temporal change in earthquake
17,797
17,798 YAMASHITA. MECHANICAL EFFECT OF FLUID MIGRATION
activity because of the assumption of a simple spring slider model.
In recent years much attention has been paid to the simu- lation of complexity of seismic activity [e.g., Bak and Tan9, 1989; Carlson and Lan9er , 1989; Rice, 1993; Yaraashita, 1993, 1995]. However, as far as the author knows, the effect of fluid migration on seismic activity has not been studied yet except in a recent study by Miller et al. [1996]. As stated above, the pore fluid pressure tends to reduce the effective stress, so that it facilitates earthquake ruptures, and the spario-temporal variation of seismicity should gen- erally be affected by the fluid migration. Our aim in this paper is to investigate the effect of fluid migration on the complexity of earthquake activity on a fault. While Miller et al. [1996] assumed the strain accumulation on a fault due to the monotonically increasing tectonic load, we only con- sider the sequence of activity whose duration time is much smaller than in their study, so that the remotely applied load is kept constant in our treatment.
Formulation
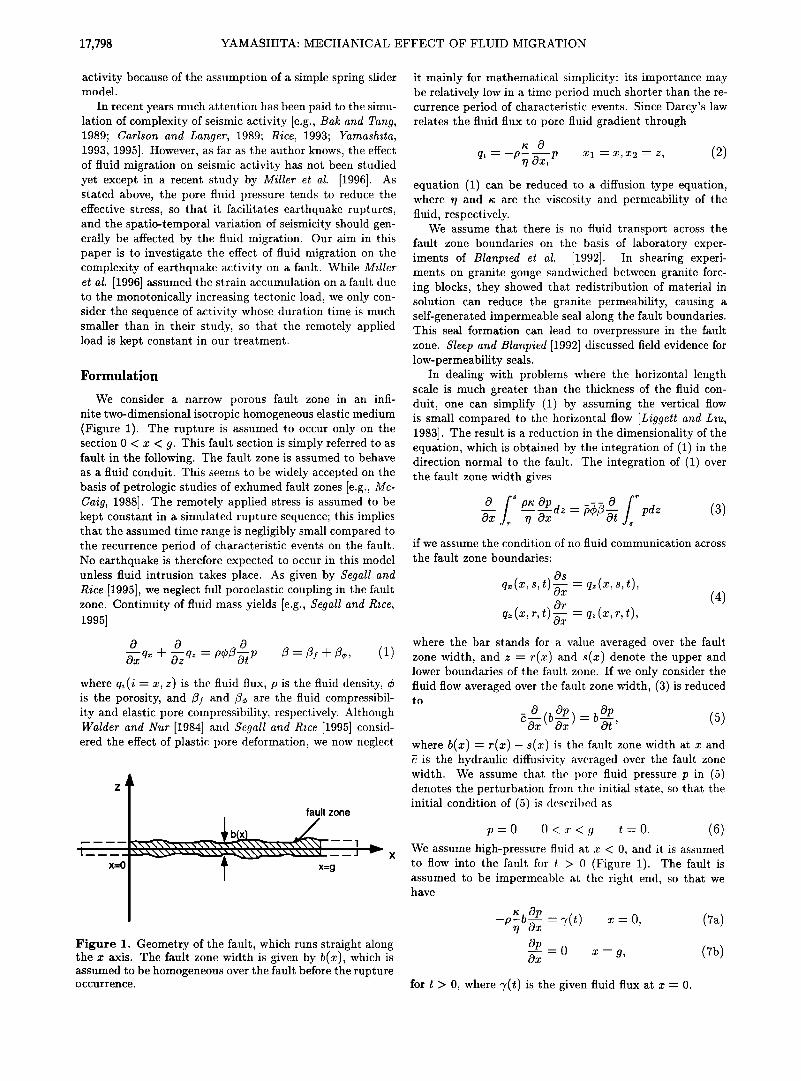
We consider a narrow porous fault zone in an infi- nite two-dimensional isotropic homogeneous elastic medium (Figure 1). The rupture is assumed to occur only on the section 0 < x < g. This fault section is simply referred to as fault in the following. The fault zone is assumed to behave as a fluid conduit. This seems to be widely accepted on the basis of petrologic studies of exhumed fault zones [e.g., Mc- Caig, 1988]. The remotely applied stress is assumed to be kept constant in a simulated rupture sequence; this implies that the assumed time range is negligibly small compared to the recurrence period of characteristic events on the fault. No earthquake is therefore expected to occur in this model unless fluid intrusion takes place. As given by Segall and Rice [1995], we neglect fifil poroelastic coupling in the fault zone. Continuity of fluid mass yields [e.g., Segall and Rice, 1995]
where qi(i -- x, z) is the fluid flux, p is the fluid density, • is the porosity, and /•f and /7• are the fluid compressibil- ity and elastic pore compressibility, respectively. Although Walder and Nut [1984] and $e.qall and Rice [1995] consid- ered the effect of plastic pore deformation, we now neglect
z
fault zone
I -- -- -- 0•:-- -- J •'• X X= g
Figure 1. Geometry of the fault, which runs straight along the x axis. The fault zone width is given by b(x), which is assumed to be homogeneous over the fault before the rupture occurrence.
it mainly for mathematical simplicity: its importance may be relatively low in a time period much shorter than the re- currence period of characteristic events. Since Darcy's law relates the fluid flux to pore fluid gradient through
qi -- --p• •xiP Xl -- x, x2 -- z, (2) equation (1) can be reduced to a diffusion type equation, where r/ and n are the viscosity and permeability of the fluid, respectively.
We assume that there is no fluid transport across the fault zone boundaries on the basis of laboratory exper- iments of Blanpied et al. [1992]. In shearing experi- ments on granite gouge sandwiched between granite forc- ing blocks, they showed that redistribution of material in solution can reduce the granite permeability, causing a self-generated impermeable seal along the fault boundaries. This seal formation can lead to overpressure in the fault zone. Sleep and Blanpied [1992] discussed field evidence for low-permeability seals.
In dealing with problems where the horizontal length scale is much greater than the thickness of the fluid con- duit, one can simplify (1) by assuming the vertical flow is small compared to the horizontal flow [Liggett and Liu, 1983]. The result is a reduction in the dimensionality of the equation, which is obtained by the integration of (1) in the direction normal to the fault. The integration of (1) over the fault zone width gives
Ox -•- dz -- •½/• pdz (3) if we assume the condition of no fluid communication across
the fault zone boundaries:
q•(x s t)Os (x s t) , , •--q .... (4)
q•(x,r,t) Or • --q•(x,r,t), where the bar stands for a value averaged over the fault zone width, and z -- r(x) and s(x) denote the •pp• •d lower boundaries of the fault zone. If we only consider the fluid flow averaged over the fault zone width, (3) is reduced to
where b(x) -- r(x)- s(x)is the fault zone width at x and • is the hydraulic diffusivity averaged over the fault zone width. We assume that the pore fluid pressure p in (5) denotes the perturbation from the initial state, so that the initial condition of (5) is described as
p-0 0 < :r<.q t-0. (6) We assume high-pressure fluid at x < 0, and it is assumed to flow into the fault for t > 0 (Figure 1). The fault is assumed to be impermeable at the right end, so that we have
= o - a, (7b) Ow
for t > 0, where 7(t) is the given fluid flux at x - 0.

YAMASHITA: MECHANICAL EFFECT OF FLUID MIGRATION 17,799
As a plausible mechanism for locally elevated fluid pres- sure, we can mention the shear-induced pore compaction in a sealed fault. Byeflee [1993] proposed that the forma- tion of sealed fluid compartments of various sizes in a fault zone and their compaction can lead to locally elevated fluid pressure. The formation of the seal is considered to be due to the redistribution of materials in solution as dis-
cussed by Sleep and Blanpied [1992, 1994]. The rupture of one of the strongest impermeable seals separating highly compacted fluid compartments can lead to an earthquake in this model. The fault valve model proposed by Sibson [1992] also seems to be partly based on the idea of pore compaction. He considered that transition from hydrostatic to suprahydrostatic regime occurs at some depth across a discrete permeability barrier. Below the barrier, the fluid pressure may become suprahydrostatic due to porosity re- duction; the porosity reduction occurs only at depth where pore space is disconnected. The rupture of the barrier leads to an earthquake in this model. In our model we assume a strong impermeable seal at x -- 0 separating high-pressure and low-pressure fluid compartments whose rupture at t -- 0 triggers a sequence of earthquakes; the high pressure may be caused by the pore compaction and the existence of the strong seal. This seal may correspond to the impermeable barrier according to the fault valve model of Sibson [1992], or one of the strongest impermeable seals in a fault zone if we assume the model of Byeflee [1993].
The deformation is assumed to be plane strain in the country rock. We also assume that the coupling between the shear stress pzx on the fault zone boundary in the coun- try rock and the fluid migration is caused only through the fracture occurrence. In other words, the shear stress is not caused only by the quasi-static fluid flow. This will be al- lowed if the width of the fluid conduit is narrow enough as assumed in the present paper. The fracture condition is given by
rs: a0 q- ms(an -- p)
according to the principle of the effective stress, where a0 is a constant, rs is the static shear traction at fracture, ms is the coefficient of static friction, an is the total normal traction on the fault and p is the fluid pressure. The con- tribution from the fault slip to the normal traction at y ---- 0 is negligible because of the assumptions of the narrow straight fault zone and the occurrence of shear slip only. Hence the normal stress can be assumed to be constant, and (8) is rewritten as
•-s - c•s - rasp as > 0, (9)
where c•s is constant. Since Cts denotes the strength before the fluid intrusion, it is referred to as initial strength in this paper. We consider only the perturbation from the initial equilibrium state in this paper, so that the traction can be assumed in the form
•'• - -c• - m•p c• > 0 (10)
on the slipping fault surface, where c•f is constant and mf is the coefficient of sliding friction. Laboratory experiments have shown that the two coefficients are in the range 0.5 < rn,, my < 1.0 [Byeflee, 1978; Wong, 1986] at seismogenic depths and there is little difference between the two [Wong, 1986], so that we simply assume ms: mf -- 0.7.
Since the coupling between the shear stress pzy on the fault zone boundary in the country rock and the fluid mi- gration is assumed to take place only through the rupture occurrence as stated above, the shear stress is written as [e.g., Yamashita, 1993]
• •_• 1 d pzx(x) -- -2•(1 - •) P Au(s)ds (11) . • x-sds
in terms of the relative slip /ku(s) on the fault, where • and It are Poisson's ratio and the rigidity of the country rock and P denotes the Cauchy principal value. In this pa- per, catastrophic rupture is assumed to be instantaneous, so that quasi-static analysis as shown in (5) and (11)is allowed. Equation (11) is an integral equation, and the rel- ative slip is to be derived, using the condition (10). Hence the problem is reduced to solving (5) and (11) under the boundary conditions (7) and (10) and the initial condition (6). Equations (5) and (11) are coupled through the frac- ture condition (9) and boundary condition (10).
We assume a linear relation between the fault zone width
and the accumulated slip on the basis of laboratory and field observations [e.g., Engelder, 1974; Teufel, 1981; Chester et al., 1993]. For example, Chester et al. [1993] observed that thickness of internal damaged zone of the San An- dreas fault scales with fault slip. Teufel [1981] showed that width of fault gouge increases with increasing fault slip in his drained, triaxial compression, pore pressure ex- periments on precut rocks. Although Engelder [1974] and Teufel [1981] suggested a possibility of the existence of up- per critical gouge zone width, we assume a linear relation b(x) -- • •-],•/ku'•(x) with no upper critical width for mathematical simplicity, where Au"•(x) denotes the slip caused at location x by the ruth catastrophic event. This assumption may imply that our analysis can be applied only to underdeveloped faults.
In our formulation, only the fault zone width is assumed to depend on the slip among the model parameters to affect the fluid migration. This is of course a rough idealization even for a narrow fault zone model. For example, changes in the porosity and permeability are also expected to result from the slip occurrence. In fact, Teufel [1981] observed that microfracture density increases with increasing slip in his laboratory experiment, which may suggest a possibility that the porosity is proportional to the slip. In addition, the permeability should be proportional to the porosity in some way [e.g., Probstein, 1994, p.100]. However, we do not have simple quantitative relations between porosity, permeabil- ity, and slip that are applicable to earthquake fault zone, so that we confine ourselves to our present idealized modeling.
Numerical Procedure
Qualitatively, the sequence of the events occurs as fol- lows: the fluid begins to flow into the fault at time t -- 0. The fluid migration is described by (5). The fracture strength (equation (9)) decreases with the accumulation of the fluid pressure, and the fault slip occurs if the frac- ture condition (9) is satisfied after attaining sufficient fluid pressure. With the slip occurrence the shear stress sud- denly drops to the residual stress level (equation (10)) on the slipping region. The amount of relative slip can be calculated by solving integral equation (ll) with condition

17,800 YAMASHITA: MECHANICAL EFFECT OF FLUID MIGRATION
(10); the seismic moment M0 released by the catastrophic event is given from the calculated relative slip in the form ]F[o = I• f P,u(s)ds. In general, quasi-static slip occurs on surface where catastrophic slips have already occurred be- cause of temporal variation of the sliding frictional stress; however, our calculations show that the quasi-static slip is negligible compared to the catastrophic one. We do not consider healing on ruptured surface because of the assump- tion of relatively short time period. The fault zone width expands at a location where the slip occurs; the fault zone expansion implies the formation of new fault zone bound- ary outside the original one. We assume that new seals are formed at the new fault zone boundary soon after a catastrophic event due to the redistribution of material in solution accelerated by the catastrophic rupture.
All the equations are discretized, and the fault is as- sumed to comprise a computational grid where space and time evolution of stress, slip, and fluid pressure fields are calculated. We fix the number of fault segments at N -- 100, and unbreakable barriers are assumed at both ends of the fault. All the calculations are carried out in terms
of nondimensional quantities. Refer to the Appendix for the discretization of the equations and normalization of the physical quantities. According to Rice [1993], our fault model is classified as an inherently discrete model, which contrasts a continuum model. While fault segments can rupture individually in the former model, they cannot in the latter. Motivation of the inherently discrete model was discussed by Ben-Zion and Rice [1995]. We carry out the calculation until all the segments are ruptured. This im- plies that the total amount of strain energy release is almost the same in each sequence since the remotely applied load is kept constant in the calculations and negligible amount of energy is released by quasi-static slips on ruptured sur- face. The fluid flux 7 given at x : 0 is assumed to be time independent for simplicity. The model magnitude M is given by the logarithm of the released moment in the form /V/-- log10 •-•k D•, where D• is the catastrophic nondimen- sional slip on the kth segment. The relation between the nondimensional fault zone width Z and accumulated slip
is rewritten as Z -- • •m D m in the nondimensional form, _
where • -- •[/•/271-(1 -- L•)O/s and .Dm is the nondimensional slip caused by the mth event. We arbitrarily assume 0.01
_
< • < 0.5 in the calculations. We assume that the fault zone width is negligibly narrow at t -- 0 compared to the width after the rupture of the entire fault; in all the calculations we arbitrarily assume Z•.0 -- 0.1 (i--1,...,N), where Z•,j is the nondimensional fault zone width at the ith segment and at the jth time step. This value is shown to be negligibly small compared to the final fault zone width in each sim- ulation. Since even an inactive fault seems to have high permeability compared to the country rock [e.g., Chester and Logan, 1986], it will be reasonable to assume a narrow fluid conduit in the fault zone before rupture excitation.
Reference Simulation for Homogeneous Models
In this section we carry out reference simulations for models in which distributions of the model parameters are spatially homogeneous on the fault. Such models are re- ferred to as homogeneous models in the following. The ef- fect of inhomogeneously distributed model parameters can be understood by reference to the homogeneous model. We specifically investigate the effect of the initial strength A(---- c•s/c•f), given flow flux F(---- Uc¾7/pn), and constant •(• Z/•m Din)' These will be important model parame- ters to determine the rate of fluid migration and the rupture occurrence.
Examples of the spario-temporal variations of pore fluid pressure and relative slip are illustrated in Figure 2. It is observed that the system entirely ruptures before the fluid migrates to the other end of the fault section. This occurs because the stress at the crack tip exceeds the threshold for the rupture of the entire system. Note that the crack growth excited by the fluid pressure buildup is arrested after breaking only one segment in an earlier stage of the rupture sequence: the stress at the crack tip is still smaller than the above threshold value. However, the crack tip stress mono- tonically increases with the crack growth, and it can exceed the threshold sooner or later, leading to the rupture of the
i (a)
0.5x10 -1
t ...... i•!• •.,:• i 5 00 ....:.::.
.... ....
...... 3.75 .:.....:.... .....
...... ..•. :. ::..::;.5..'.:':-.::'.:" '
........... 2.50 :.:.::.... ...
......
......... ß .:..:5 ß .....
'<:'•'• .......... • 25 •..-...
250 •'%:..
20 •"•O-•::::• ..... •:- : •:• 0.00 •" 0
150 T
lOO
5o
75
50
fault segment
25
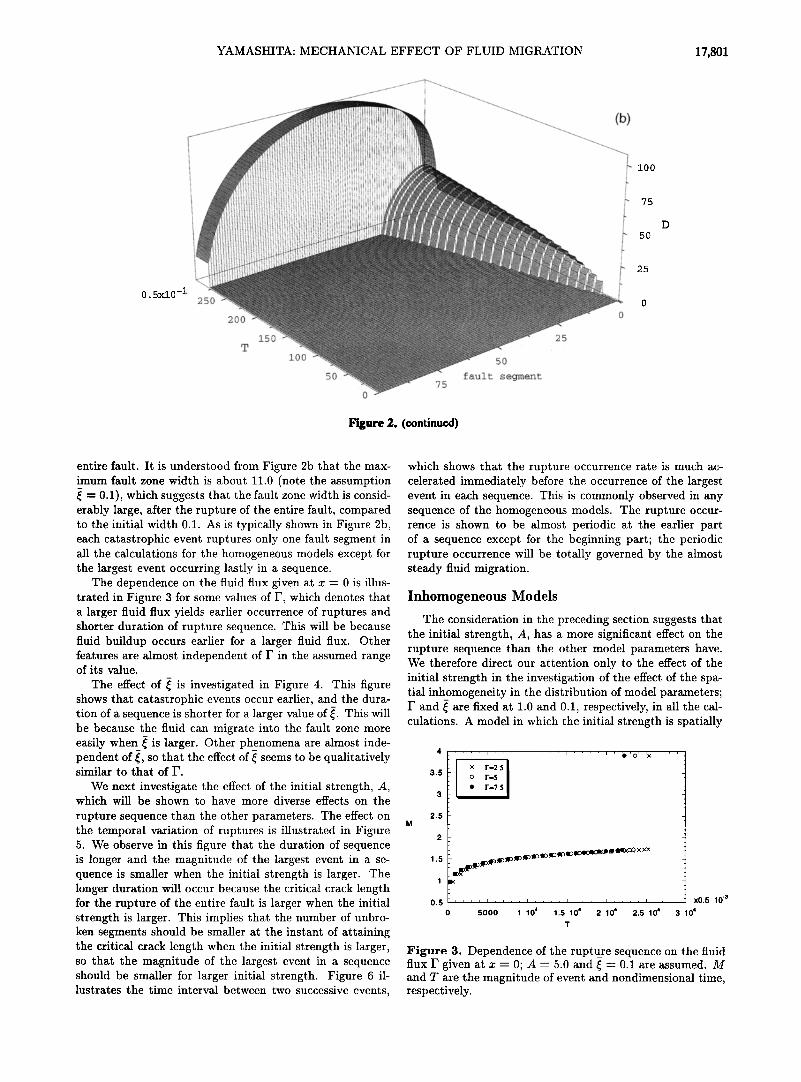
Figure 2. An example of the calculation for the homogeneous model; I' -- 1.0, A -- 5.0, and • -- 0.1 are assumed. (a) Spario-temporal evolution of pore-fluid pressure P in the fault zone. (b) Spario-temporal evolution of relative slip D on the fault.
YAMASHITA: MECHANICAL EFFECT OF FLUID MIGRATION 17,801
0.5x10 -1
Figure 2. (continue. d)
lOO
75
50
25
entire fault. It is understood from Figure 2b that the max- imum fault zone width is about 11.0 (note the assumption _
{ -- 0.1), which suggests that the fault zone width is consid- erably large, after the rupture of the entire fault, compared to the initial width 0.1. As is typically shown in Figure 2b, each catastrophic event ruptures only one fault segment in all the calculations for the homogeneous models except for the largest event occurring lastly in a sequence.
The dependence on the fluid flux given at x -- 0 is illus- trated in Figure 3 for some values of F, which denotes that a larger fluid flux yields earlier occurrence of ruptures and shorter duration of rupture sequence. This will be because fluid buildup occurs earlier for a larger fluid flux. Other features are almost independent of F in the assumed range of its value.
The effect of • is investigated in Figure 4. This figure shows that catastrophic events occur earlier, and the dura-
_
tion of a sequence is shorter for a larger value of •. This will be because the fluid can migrate into the fault zone more
_
easily when • is larger. Other phenomena are almost inde- pendent of •, so that the effect of • seems to be qualitatively similar to that of F.
We next investigate the effect of the initial strength, A, which will be shown to have more diverse effects on the
rupture sequence than the other parameters. The effect on the temporal variation of ruptures is illustrated in Figure 5. We observe in this figure that the duration of sequence is longer and the magnitude of the largest event in a se- quence is smaller when the initial strength is larger. The longer duration will occur because the critical crack length for the rupture of the entire fault is larger when the initial strength is larger. This implies that the number of unbro- ken segments should be smaller at the instant of attaining the critical crack length when the initial strength is larger, so that the magnitude of the largest event in a sequence should be smaller for larger initial strength. Figure 6 il- lustrates the time interval between two successive events,
which shows that the rupture occurrence rate is much ac- celerated immediately before the occurrence of the largest event in each sequence. This is commonly observed in any sequence of the homogeneous models. The rupture occur- rence is shown to be almost periodic at the earlier part of a sequence except for the beginning part; the periodic rupture occurrence will be totally governed by the almost steady fluid migration.
Inhomogeneous Models
The consideration in the preceding section suggests that the initial strength, A, has a more significant effect on the rupture sequence than the other model parameters have. We therefore direct our attention only to the effect of the initial strength in the investigation of the effect of the spa- tial inhomogeneity in the distribution of model parameters;
_
F and • are fixed at 1.0 and 0.1, respectively, in all the cal- culations. A model in which the initial strength is spatially
3.5
2.5
1.5
o r=• ß F=7.5 I
0.5 .... I .... I .... I .... I .... , .... xO.5 10 '3 0 5000 1 10 '• 1.5 10 '• 2 10 '• 2.5 10 '• 3 10 '•
T
Figure 3. Dependence of the ruptu_re sequence on the fluid flux F given at x - 0; A -- 5.0 and • -- 0.1 are assumed. M and T are the magnitude of event and nondimensional time, respectively.

17,802 YAMASHITA: MECHANICAL EFFECT OF FLUID MIGRATION
3.5
2.5
1.5
0.5
ß ß ß ß ß ß ß ß ß ß •=0.0•
1104 2104 3104 4104 5104
x0.5 10
Figure 4. Effect of • on the rupture sequence; A -- 5.0 and F- 1.0 are assumed.
inhomogeneous on a fault is referred to as an inhomoge- neous model.
At present, we have no experimental or seismologically derived information that permits us to specify the distri- bution of A. Therefore we assume one of the simplest sta- tistical distributions, a homogeneous distribution; in other words, the probability density is assumed to be homoge- neous in a specified range, Amin < A < Amax. We assume three models for the distribution of A; model I (5 < A < 10), model II (2.5 < A < 7.5), and model III (6.5 < A < 8.5). The effect of the extent of the distribution can be studied in comparison between models I and III. We can investigate the effect of the mean value by comparing model I with II. In each of the three models we carry out 10 nu- merical experiments with a different set of values of A. The computation is carried out up to the time when a fault is entirely ruptured.
Temporal Variation of Rupture Activity for Inhomogeneous Models
A typical example of the rupture sequence of model III is illustrated in Figure 7 together with an example of the homogeneous model having A = 7.5, which is equal to the mean value of A assumed in model III. Although the devi- ation from the homogeneous model is smallest in model III among the three inhomogeneous models, we find significant differences between the two sequences. We first notice that the duration of the sequence is considerably longer in the example of model III. In fact, as shown in Figure 8, all the sequences in the inhomogeneo,•s models haw• much longer duration than in the homogcneo,•s models. Another notable finding in Figure 7 is that the time interval between two suc- cessive events does not necessarily decrease with time near the occurrence time of the largest event in the sequence of model III. The sequence of model III illustrated in Figure 7 rather has a long quiescence period immediately before the occurrence of the largest event; this feature is generally observed in all the sequences of the inhomogeneous model. We study in the following what the above differences can be attributed to.
We first investigate causes leading to longer duration of sequences in the inhomogeneous models. Figure 9 illus- trates the rupture occurrence times of 50 segments nearest to the fluid source at x = 0 for the sequences shown in Figure 7. One of the most characteristic features is that
several neighboring segments tend to rupture simultane- ously in the inhomogeneous model, while in the homoge- neous model each segment ruptures individually. This fea- ture is also observed in the other inhomogeneous models. It is characteristic in Figure 9 that relatively long quiescent period exists before and after the simultaneous rupture of several neighboring segments in the sequence of the inho- mogeneous model. It therefore seems that long duration of the sequence is associated with the simultaneous rupture of neighboring segments and/or the existence of quiescent period before and after such rupture.
We now study why simultaneous ruptures tend to oc- cur and why there occur relatively long quiescent periods in the inhomogeneous models. Figure 10 shows the spatial distribution of the initial strength, A, on the 15th to 40th segments for the example of model III illustrated in Figures 7 and 9; our calculation shows that neighboring segments surrounded by a single broken ellipse ruptures simultane- ously. Figure 10 suggests that a rupture of segment having local maximum strength tends to induce rupture of nearest segments ahead with lower strengths. The above observa- tion implies that two factors contribute to the lengthening of sequence duration. It generally takes much time to build up the fluid pressure to rupture a locally strong segment. Hence the rupture of such segment is relatively delayed, which can be a factor to lengthen a sequence in the inho- mogeneous models. The other factor is related to the si- multaneous rupture of several segments ahead triggered by the rupture of the locally strong segment. Our calculations show that some amount of fluid penetrates ahead of the rupture tip during the build up of the fluid pressure at the locally strong segment. This will contribute to the simul- taneous rupture of several segments. If such simultaneous ruptures occur and the rupture tip is suddenly advanced, then it takes considerable time for the high-pressure fluid to migrate to the rupture tip again and to contribute to the catastrophic growth of the rupture tip. These two fac- tors will form the activity quiescence before and after the simultaneous rupture of neighboring segments and will con- tribute to the lengthening of the sequence duration.
Figure 8 denotes that model I generally has the longest duration of sequence among the three inhomogeneous mod- els. This observation can also be m•derstood in terms of the
two factors stated in the preceding paragraph. Since model I has the largest A,,•x value among the three inhomoge- neous models, it generally takes more time to rupture a
4
3.5
3
2.5
2
1.5
1
0.5
0
-o ß A=I I • o A=5 I
x A=10 I .... i .... • .... I .... I .... • .... t .... ' x0.5 10 '3
0 I 104 2 104 3 104 4 104 5 104 6 104 7 104 T
Figure 5. Dependence_of the rupture sequence on the initial strength; F- 1.0 and • -- 0.1 are assumed.

YAMASHITA- MECHANICAL EFFECT OF FLUID MIGRATION 17,803
1200
1000
800
6OO
400
200
I ø A=7.5 I I x A=101
¸
¸ x
¸
x0.5 10 '3
1 10 4 2 10 4 3 10 4 4 10 4 5 10 4 6 10 4 7 10 4
Figure 6. Time interval between two successive events for three values of the initial strength; I' -- 1.0 and • -- 0.1 are assumed in all the examples.
locally strong segment. On the other hand, model I is also characterized by having the largest value of Amax- Amin in the three models, so that it will be easy for the rupture of such strong segment to induce rupture of neighboring seg- ments ahead. This will retard the remigration of the fluid to the rupture tip in model I.
As typically shown in Figure 7, our calculations for the inhomogeneous models generally show that the time inter- val between two successive events does not necessarily de- crease with time near the occurrence time of the largest event in a sequence. The relative inactivation of rupture occurrence before the occurrence of the largest event in a sequence will occur because the largest event is triggered by the rupture of segment with a locally maximum initial strength; as discussed before, the existence of a locally high- strength segment retards the fluid migration and temporar- ily inactivates the rupture ocurrence.
Frequency Distribution of Event Sizes for Inhomogeneous Models
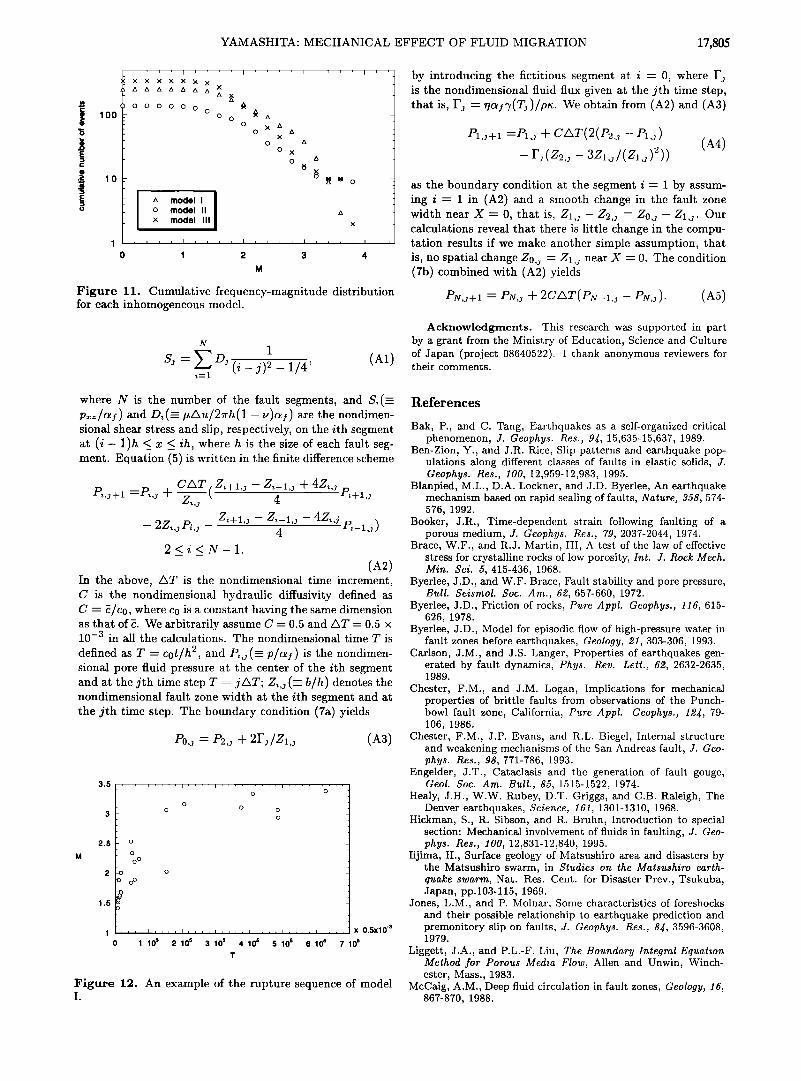
We now study how the frequency distribution of event sizes is influenced by the spatial distribution of the ini- tial strength, A, on a fault. Figure 11 shows cumulative frequency-magnitude statistics for each of models I, II, and III; the results of 10 sequences are superimposed in each model. The frequency-magnitude statistics of Figure 11
3.5
2.5
1.5
o
o o
o inhomogeneous[ x homogeneous
5 10 • 1 10 s 1.5 10 s 2 10 s T
xO.5 10 '3
2.5 10 5
Figure 7. A typical example of the rupture sequence of model III. An example of the homogeneous model_having A- 7.5 is also shown for comparison. F- 1.0 and •- 0.1 are assumed in both examples.
show three event groups for each model' small events with almost constant level for M < 1.6, intermediate-size events approximately obeying the Gutenberg-Richter (GR) rela- tion, and large events deviating from the GR relation for M > 3.6.
A bump is observed near M •0 3.6 for models II and III. Each of the events near this bump stands for the largest event in a sequence rupturing all the unbroken segments near x -- g. Hence the even. ts near M • 3.6 will be strongly influenced by the finiteness of the system size in models II and III. Such large-scale ruptures are forced to be arrested at the barrier assumed at the ends of the fault, so that there will be an upper threshold for the magnitude of the event; this will form a bump near M • 3.6. By contrast, no such bump is observed for model I. This will be because the largest event in a sequence is not much influenced by the finitehess of the system size in model I. In fact, the magnitude of the largest event in a sequence is relatively small in model I; for example, compare Figures 7 and 12. In addition, the largest event does not rupture all the un- broken segments on a fault in some sequences of model I. This will occur because the rupture growth is easily arrested due to large variance and large average value of the initial strengths.
Our calculations show that each of small events for M <
1.6 ruptures only a single fault segment, so that the effect of interactions among fault segments is relatively weak for these events. Hence we can conclude like many authors [e.g., Yamashita, 1993] that the Gutenberg-Richter law ob- served for intermediate events in Figure 11 is due to strong local interactions among fault segments; larger events for M ) 3.6 are influenced by the finiteness of the system size.
Discussion and Conclusions
We do not intend to explain real seismological behav- ior quantitatively in this paper. Our study is rather for qualitative understanding of the effect of the model parame- ters, so that some idealized assumptions are made to isolate the effect of each model parameter. For example, a fault
x0.5 10 -3
8 10 s
7 10 s
6 10 s
5 10 s --
4 10 s
3 10 s
2 10 s
I 10 s
0
x model I o model II ß model III
x
o o o
ß
ß ß
o ß ß o ß
ß
2 4 6 8 10
experiment
Figure 8. Duration of rupture sequence for all the calcu- lated examples of the inhomogeneous models. The broken and solid lines stand for the calculated results for the ho-
mogeneous models with A- 5.0 and 10.0, respectively (see Figure 5). Note that A _< 10 in all the inhomogeneous mod- els. I' and • are fixed at 1.0 and 0.1 in all the calculations in this figure.

17,804 YAMASHITA: MECHANICAL EFFECT OF FLUID MIGRATION
xO.5 10 '3
1.5 10 s
1 10 s
5 104
ß model III o homogeneous model
•,• ilt•[l• o o•,•: • • o o•O o o o o oøøøøøøøøøøøøøøø( 2ø7, , , - 0 10 20 30 40 50
segment
Figure 9. Rupture occurrence times at the 1st to 50th fault segments. Calculated example of model III is co_mpared with that of the homogeneous model. I • -- 1.0 and • -- 0.1 are assumed in both examples. We assume A -- 7.5 in the calculation of the homogeneous model; note that the average value of A is 7.5 in model III. Temporal variation of event sizes is shown in Figure 7 for these two examples.
with one-dimensional extent is a highly idealized assump- tion, which can, however, be useful to abstract the effect of complexity in fluid path on a two-dimensional fault. The assumption of constant fluid flux at x = 0 can abstract the details of the fluid source. The assumption of unbreakable barrier at x = 0 is also for removing the details of the fluid source. However, if the coexistence of the unbreakable bar- rier and fluid source near x = 0 is interpreted literally, it implies the existence of high-pressure fluid localized near an end of a fault. The results obtained in this study can be a basis for more realistic three-dimensional treatment. We
assumed an impermeable seal along the fault zone bound- ary for the idealized treatment. However, seals for actual faults will not be perfect and fluid needs not be trapped for geological times in a fault zone. A slightly leaky seal will allow the average pressure during an earthquake cycle to be roughly hydrostatic as noted by Sleep and Blanpied [1992].
It was shown in this paper that rupture occurrence is not necessarily activated near the occurrence time of the largest event in a sequence of the inhomogeneous model. This never happens so long as a brittle rupture is assumed in an elastic medium with no mechanical effect of fluid; in fact, the rate of rupture occurrence is shown to increase as the time of the largest event approaches [Yamashita and Knopoff, 1989; ¾amashita, 1993]. Since the inactivation of the rupture occurrence cannot be observed in the homoge- neous models, the inactivation must be related to both fluid migration and spatial inhomogeneity in the distribution of the initial strength. Seismological observations have shown that foreshocks do not always precede large shallow earth- quakes. In a systematic study, Jones and Molnar [1979] examined teleseismically located events before major earth- quakes globally from 1914 to 1973 and found that roughly 400/o of the main shocks with M > 7 were preceded by one or more foreshocks. Mogi [1963] found that only about 4070 of major events were preceded by foreshocks by investigat- ing earthquakes in and near Japan from 1926 to 1956. It is therefore suggested on the basis of our analysis that nu- cleations of the majority of large shallow earthquakes are possibly affected by fluid migration.
While only monotonic changes are observed in spatio- temporal variation of rupture activity in the homogeneous models, the activity is observed to be significantly complex in an individual sequence of the inhomogeneous models. However, some statistical regularities are observed even in the inhomogeneous models. For example, we observe that the duration of rupture sequence is longer when the average value and/or variance of the initial strength distribution are larger for fixed fluid flux given at the end of the fault. It is also shown that the frequency-magnitude statistics obey well the Gutenberg-Richter relation for intermediate-size events for all the inhomogeneous models, while the b value appears to be slightly model dependent. The occurrence of larger events deviating from the GR relation is also shown to be model dependent. In fact, it is observed for models II and III that a greater frequency of occurrence of the larger- size events than would be expected from lesser-size events. On the other hand, model I shows a lesser frequency of occurrence of the larger events.
It is sometimes suggested that occurrence of earthquake swarm is associated with fluid migration [e.g., Tsuneishi and Nakamura, 1970]; earthquake swarm is generally char- acterized as a sequence of earthquakes in which there is no single predominant principal event. Our calculations show that this feature is observed in model I. In fact, no predom- inantly large event is observed in a sequence of model I, which is implied by the frequency-magnitude curve shown in Figure 11. It is more clearly shown by a typical example of sequence of model I illustrated in Figure 12. Hence it can be inferred that earthquake swarm takes place when the average initial strength, A, is comparatively large and the variance of its distribution is also large on a fault. Mogi [1963] showed that earthquake swarm tends to occur at re- markably fractured regions by investigating earthquake ac- tivity in and near Japan. Our analysis together with Mogi's finding suggests that highly fractured regions in the Earth's crust are characterized by high average value and large vari- ance of the distribution of the initial strength.
Appendix: Diseretization of Equations and Numerical Calculations
The relative slip Au, fluid pressure p, and shear stress pxz are calculated at the center of each segment when solv- ing (5) and (11). Equation (11) is therefore discretized as
/ \
8'511
',',i.', '::, ',', :..i = t ,:, ,
7 • I -,j 'e • • I • I • I.
6.5
15 20 25 30 •' 35 \ I 40
segment • /
Figure 10. The initial strengths, A, on the 15th to 40tt: fault segments for the example of model III shown in Figures 7 and 9. See the text about the broken ellipses.
YAMASHITA: MECHANICAL EFFECT OF FLUID MIGRATION 17,805
lOO
lO
i
X X X X X X X A A A A A A A
O O O O O O O
model I model II model III
1 , , , , I i
o 1
x
o x A O ß X
O O
A
A
X
O A
• a o
2 3 4
M
Figure 11. Cumulative frequency-magnitude distribution for each inhomogeneous model.
N
Z 1 (A1) $j -- Oj (i- j)2 _ 1/4' i--1
where N is the number of the fault segments, and $i(-- pxz/af) and Di(-- t•Au/2vrh(1 - •)af) are the nondimen- sional shear stress and slip, respectively, on the ith segment at (i- 1)h _< x <_ ih, where h is the size of each fault seg- ment. Equation (5) is written in the finite difference scheme
CAT ( Zi+ 1,3 - Zi- 1,j -1- 4Zi,• p•+l,• Pi'• + • =P•'J + Z•,• 4 - 2Z• j P• • - g•+ •,• - g•_ •,• - 4gi,• P•- •,• ) ' ' 4
2<i<N-1.
(A2) In the above, AT is the nondimensional time increment, C is the nondimensiona,1 hydraulic diffusivity defined as C -- Z/co, where co is a constant having the same dimension as that of •. We arbitrarily assume C -- 0.5 and AT -- 0.5 x 10 -3 in all the calculations. The nondimensional time T is
defined as T -- cot/h •, and P•,•(-- p/c•f) is the nondimen- sional pore fluid pressure at the center of the ith segment and at the jth time step T -- jAT; Z•,j(---- b/h) denotes the nondimensional fault zone width at the ith segment and at the jth time step. The boundary condition (7a) yields
70,• - 72,• + 2I'•/z•,• (A3)
3.5
2.5
1.5
.... i .... i .... i .... i .... i .... I ....
o o
o o o o
o
o
o
o o
ß .o o
o o o
o
I 10 s 2 10 s 3 10 s 4 10 s 5 10 s 6 10 s 7 T
x 0.5xl 0 '3
O s
Figure 12. An example of the rupture sequence of model I.
by introducing the fictitious segment at i -- 0, where Fj is the nondimensional fluid flux given at the jth time step, that is, Fj -- rlozf3/(T j)/pn. We obtain from (A2) and (A3)
•,•+• =•,• + CAr(2(•2,• - •,•) (A4)
- F• (Z2,• - 3Zz,j/(Zz,j)2))
as the boundary condition at the segment i = 1 by assum- ing i = 1 in (A2) and a smooth change in the fault zone width near X = 0, that is, Z•,j - Z2,j = Z0j - Z•,j. Our calculations reveal that there is little change in the compu- tation results if we make another simple assumption, that is, no spatial change Z0,j = Z•,j near X = 0. The condition (7b) combined with (A2) yields
PN,; + • - PN,j + 2C AT (P•_ • ,j - P•,• ). (A5)
Acknowledgments. This research was supported in part by a grant from the Ministry of Education, Science and Culture of Japan (project 08640522). I thank anonymous reviewers for their comments.
References
Bak, P., and C. Tang, Earthquakes as a self-organized critical phenomenon, J. Geophys. Res., 9J, 15,635-15,637, 1989.
Ben-Zion, Y., and J.R. Rice, Slip patterns and earthquake pop- ulations along different classes of faults in elastic solids, J. Geophys. Res., 100, 12,959-12,983, 1995.
Blanpied, M.L., D.A. Lockner, and J.D. Byerlee, An earthquake mechanism based on rapid sealing of faults, Nature, 358, 574- 576, 1992.
Booker, J.R., Time-dependent strain following faulting of a porous medium, J. Geophys. Res., 79, 2037-2044, 1974.
Brace, W.F., and R.J. Martin, III, A test of the law of effective stress for crystalline rocks of low porosity, Int. J. Rock Mech. Min. Sci. 5, 415-436, 1968.
Byerlee, J.D., and W.F. Brace, Fault stability and pore pressure, Bull. Seismol. Soc. Am., 62, 657-660, 1972.
Byerlee, J.D., Friction of rocks, Pure Appl. Geophys., 116, 615- 626, 1978.
Byerlee, J.D., Model for episodic flow of high-pressure water in fault zones before earthquakes, Geology, 21, 303-306, 1993.
Carlson, J.M., and J.S. Langer, Properties of earthquakes gen- erated by fault dynamics, Phys. Rev. Left., 62, 2632-2635, 1989.
Chester, F.M., and J.M. Logan, Implications for mechanical properties of brittle faults from observations of the Punch- bowl fault zone, California, Pure Appl. Geophys., 12•, 79- 106, 1986.
Chester, F.M., J.P. Evans, and R.L. Biegel, Internal structure and weakening mechanisms of the San Andreas fault, J. Geo- phys. Res., 98, 771-786, 1993.
Engelder, J.T., Cataclasis and the generation of fault gouge, Geol. Soc. Am. Bull., 85, 1515-1522, 1974.
Healy, J.H., W.W. Rubey, D.T. Griggs, and C.B. Raleigh, The Denver earthquakes, Science, 161, 1301-1310, 1968.
Hickman, S., R. Sibson, and R. Bruhn, Introduction to special section: Mechanical involvement of fluids in faulting, J. Geo- phys. Res., 100, 12,831-12,840, 1995.
Iijima, H., Surface geology of Matsushiro area and disasters by the Matsushiro swarm, in Studies on the Matsushiro earth- quake swarm, Nat. Res. Cent. for Disaster Prey., Tsukuba, Japan, pp.103-115, 1969.
Jones, L.M., and P. Molnar, Some characteristics of foreshocks and their possible relationship to earthquake prediction and premonitory slip on faults, J. Geophys. Res., 8•, 3596-3608, 1979.
Liggett, J.A., and P.L.-F. Liu, The Boundary Integral Equation Method for Porous Media Flow, Allen and Unwin, Winch- ester, Mass., 1983.
McCaig, A.M., Deep fluid circulation in fault zones, Geology, 16, 867-870, 1988.

17,806 YAMASHITA: MECHANICAL EFFECT OF FLUID MIGRATION
Miller, S.A, A. Nur, and D.L. Olgaard, Earthquakes as a coupled shear stress - high pore pressure dynamical system, Geophys. Res. Left., œ$, 197-200, 1996.
Mogi, K., Some discussions on aftershocks, foreshocks and earth- quake swarms - The fracture of a semi-infinite body caused by an inner stress origin and its relation to the earthquake phe- nomena (Third paper), Bull. Earthquake Res. Inst. Univ. Tokyo, J1,615-658, 1963.
Nur, A., and J.R. Booker, Aftershocks caused by pore fluid flow?, $ciencet 175, 885-887, 1972.
Probstein,R.F., Physicochemical Hydrodynamics, An Introduc- tion, 2nd ed., John Wiley, New York, 1994.
Raleigh, C.B., J.H. Healy, and J.D. Bredehoeft, An experiment in earthquake control at Rangely, Colorado, Science, 191, 1230-1237, 1976.
Rice, J.R., Spatio-temporal complexity of slip on a fault, J. Geo- phys. Res., 98, 9885-9907, 1993.
Rice, J.R., and D.A. Simons, The stabilization of spreading shear faults by coupled deformation-diffusion effect in fluid- infiltrated porous materials, J. Geophys. Res., 81, 5322-5334, 1976.
Rudnicki, J.W., and C.H. Chen, Stabilization of rapid frictional slip on a weakening fault by dilatant hardening, J. Geophys. Res., 93, 4745-4757, 1988.
Segall, P., and J.R. Rice, Dilatancy, compaction, and slip in- stability of a fluid-infiltrated fault, J. Geophys. Res., 100, 22,155-22,171, 1995.
Sibson, R.H., Implications of fault-valve behaviour for rup- ture nucleation and recurrence, Tectonophysicst 211,283-293, 1992.
Sleep, N.H., and M. Blanpied, Creep, compaction, and the weak rheology of major faults, Nature, 359, 687-692, 1992.
Sleep, N.H., and M. Blanpied, Ductile creep and compaction: A mechanism for transiently increasing fluid pressure in mostly sealed fault zones, Pure Appl. Geophys., 1J$, 9-40, 1994.
Teufel, L.W., Pore volume changes during frictional sliding of simulated faults, in Mechanical Behavior of Crustal Rocks:
The Handin Volume, Geophys. Monogr., $er., vol.24, edited by N.L. Carter et al., pp.135-145, AGU, Washington, D.C., 1981.
Tsuneishi, Y., and K. Nakamura, Faulting associated with the Matsushiro swarm earthquakes, Bull. Earthquake Res. Inst. Univ. Tokyo, J8, 29-51, 1970.
Tsunogai, U., and H. Wakita, Precursory chemical changes in ground water: Kobe earthquake, Japan, Science, 269, 61-63, 1995.
Walder, J., and A. Nur, Porosity reduction and crustal pore pres- sure development, J. Geophys. Res., 89, 11,539-11,548, 1984.
Wong, T.F., On the normal stress dependence of the shear fracture energy, in Earthquake Source Mechanics, Geophys. Monogr. $er., vol.37, edited by S. Das et al., pp.l-11, AGU, Washington, D.C., 1986.
Yamashita, T., Application of fracture mechanics to the simula- tion of seismicity and recurrence of characteristic earthquakes on a fault, J. Geophys. Res., 98, 12,019-12,032, 1993.
Yamashita, T., Simulation of seismicity due to ruptures on non- coplanar interactive faults, J. Geophys. Res., 100, 8339-8350, 1995.
Yamashita, T., and L. Knopoff, A model of foreshock occurrence, Geophys. J. Int., 96, 389-399, 1989.
Zoback, M.D., and S.H. Hickman, In situ study of the physi- cal mechanisms controlling induced seismicity at Monticello Reservoir, South Carolina, J. Geophys. Res., 87, 6959-6974, 1982.
Zoback, M.D., and J.H. Healy, Friction, faulting, and "in situ" stresses, Ann. Geophys., 2, 689-698, 1984.
T. Yamashita, Earthquake Research Institute, University of Tokyo, 1-1-1 Yayoi, Bunkyo-ku, Tokyo ll3, Japan. (e-mail: [email protected]. ac.j p )
(Received May 16, 1996; revised November 18, 1996; accepted March 7, 1997.)