Mechanical Contractors Profile 0
20
UNDERSTANDING CAPACITY ALBERTA Mechanical Contractors Profile CONTRACTOR
-
Upload
yoseph-birru -
Category
Documents
-
view
12 -
download
1
description
me
Transcript of Mechanical Contractors Profile 0
U N D E R S T A N D I N G
C A P A C I T Y
AlbertAMechanical Contractors Profile
CONTRACTOR

About the CSC
The Construction Sector Council (CSC) is a national industry-led organization committed to the development of a highly skilled workforce that will support the future needs of Canada’s construction industry.
This document is available in both official languages and can be obtained electronically at www.csc-ca.org.
For more information, contact
The Construction Sector CouncilPhone: 613-569-5552Fax: 613-569-1220E-mail: [email protected]
(October 2011)
1
Un
de
rs
tan
din
g c
on
tr
ac
to
r c
ap
ac
ity
– a
lbe
rta
me
ch
an
ica
l c
on
tr
ac
to
rs
pr
of
ile
CONTeNTs1. IntroduCtIon ..............................................................................2
2. ProfIle hIghlIghts ....................................................................3
2.1 general profile ................................................................................................. 3
2.2 capacity profile ................................................................................................ 3
2.2.1 concentration of sales and employment ................................................... 3
2.2.2 specialization, scope and mobility ........................................................... 3
2.2.3 factors impacting bidding and building .................................................... 4
2.2.4 structural change .................................................................................. 4
2.2.5 growth plans ........................................................................................ 4
2.2.6 analyzing capacity ................................................................................. 4
3. AnAlysIs of ContrACtor CAPACIty ............................................5
3.1 general profile ................................................................................................. 5
3.1.1 scope of work ....................................................................................... 6
3.1.2 credit ratings ........................................................................................ 6
3.2 capacity profile ................................................................................................ 8
3.2.1 concentration of sales and employment ................................................... 8
3.2.2 specialization, scope and mobility ........................................................... 8
3.2.3 factors impacting bidding and building .................................................... 9
3.2.4 structural change ................................................................................ 13
3.2.5 growth plans ...................................................................................... 14
4. ConClusIons And IMPlICAtIons for buIldIng MeChAnICAl ContrACtor CAPACIty ..........................................15
4.1 capacity additions and the available workforce .................................................. 15
4.2 other factors impacting capacity ...................................................................... 15

2
co
ns
tr
Uc
tio
n s
ec
to
r c
oU
nc
il
The Construction Sector Council recently conducted research to develop an approach for describing and assessing the capacity of contractors to respond to changes in the industry (see the document Understanding Contractor Capacity, available on the Construction Sector Council’s (CSC) website, www.csc-ca.org). With this project, a new tool has been developed to help owners, contractors, labour, government, and education and training institutions plan for the addition of new capacity. Five contractor sectors and regions were chosen for the initial round of capacity profiles:
•Alberta mechanical contractors
•Manitoba home builders
•National painting contractors
•Ontario electrical contractors
•Ontario general contractors
The other profiles are available on the CSC’s website, www.csc-ca.org.
Each profile is divided into three parts:
General profile – describes the population of businesses in the sector. InfoUSA and related statistics are the main data sources for the general profile.
CSC contractor capacity profile – reports on the survey/interview results for a group of businesses in the sector. While the businesses in each profile do not represent a statistically significant sample, the profiles report a strong consistency around many detailed business practices and features impacting expansion.
Analyzing capacity – provides a preliminary assessment of the sector’s capacity for adapting to future conditions. This section – tied to the forecast scenario developed in the CSC’s 2011 Construction Looking Forward reports – covers detailed projections of construction activity in each sector and tracks labour markets for key occupations. The 2011 forecast scenarios set up overall rates of growth needed to meet expected industry expansion as well as describing shifts in activity across markets and regions. Cyclical and structural features of the scenarios can be related back to the contractor profiles and focus atten-tion on groups of contractors or business features that will be important as the industry adapts in the future. This third section in each profile is a preliminary view only. Results are intended to suggest to the reader how the profiles can be used to assess contractor capacity in the context of the scenarios.
1 . INTRODUCTION

3
Un
de
rs
tan
din
g c
on
tr
ac
to
r c
ap
ac
ity
– a
lbe
rta
me
ch
an
ica
l c
on
tr
ac
to
rs
pr
of
ile
2.1 generAl ProfIle
•There are 2,200 establishments working as mechanical contractors in Alberta.
|| More than 1,890 are smaller owner/ operators or branches of larger businesses.
•Total Alberta revenues for mechanical contractors are $4 billion.
•More than half of sales ($2.2 billion) are concentrated in 300 large establishments, while the 1,890 smaller firms have total sales of $1.8 billion.
•Mechanical contracting establishments in Alberta employ more than 17,000 people, or about eight workers per establishment.
•More than 80% of the establishments report “mechanical contractor” as their primary and only line of business.
|| The remaining 370 establishments report secondary businesses in appliances such as furnaces, plumbing and drain cleaning, oil field services and work on sewers.
Larger mechanical contracting firms will be key players for future capacity building thanks to their workforce’s mobility, and their strategic and financial strength. Firms with revenues greater than $2.5 million averaged just under $30 million in annual sales and employ approximately 120 employees. These larger establishments represent less than 15% of total establishments, but about 55% of both revenues and employment. Larger firms are also typically better positioned when it comes to accessing credit and financing.
2.2 CAPACIty ProfIle
2.2.1 Concentration of sales and employment
• Seventy-six mechanical contractors in Alberta were surveyed and interviewed.
|| Ninety percent (90%) of the sample is non-unionized.
•The CSC sample shows a large majority of firms (70%) have revenues less than $2.5 million.
2.2.2 Specialization, scope and mobility
•Results confirm that the scope of work for most firms is limited to mechanical contracting.
|| More than 70% work as mechanical contractors only.
|| Thirteen percent (13%) work as general con-tractors and mechanical trade contractors.
|| Where more than one primary business was mentioned, the secondary focus was trades that fall into mechanical trades or were closely related (e.g., sheet metal work, gasfitting and refrigeration).
•Most mechanical contractors work in several markets.
|| The most common focus is on institutional and commercial as well as residential markets.
•Mechanical contractors are mobile across markets, but most tend to serve a local area.
|| Two-thirds of the establishments serve only their home city and commuting area.
|| Sixteen percent (16%) have locations in other provinces.
|| Firms with operations in multiple provinces tend to be concentrated in Western Canada.
2 . PROFILE hIGhLIGhTS

4
co
ns
tr
Uc
tio
n s
ec
to
r c
oU
nc
il
2.2.3 Factors impacting bidding and building
•Mechanical contractors report that labour availability is the most important factor impact-ing bids, followed by availability of materials and supplies.
•Responses around the impact of pre-qualification requirements were ambiguous.
|| An equal number of firms cited pre-quali-fication requirements as having “regular” or “likely impact” or “no impact” or “not likely to impact.”
•Availability of senior management time was cited in the top three factors impacting bidding.
• Firms reported that key factors impacting building include:
|| availability of skilled trades (this was the top cited factor impacting both building and bidding),
|| price variations and availability of materials,
|| project specifications, and
|| government regulations (i.e., building permits), which were mentioned equally as impacting and not impacting building.
2.2.4 Structural change
•Most mechanical contractors who responded to questions on structural change felt that the traditional boundaries across owners, designers, and general and trade contractors, etc. were being altered.
•There was no consensus on what is causing the structural change in traditional work boundaries. Technology, owner/client preferences and competition were all mentioned.
• Faced with structural changes in the industry, firms mentioned the following actions that best prepare them to meet challenges:
|| access to banks, equity, venture capital, or other risk-accepting finance; and
|| access to and experience with partnering and collaborating.
2.2.5 Growth plans
•When asked, “Does your company want or plan to grow?”
|| twenty-five percent (25%) answered “no.” This proportion rises to 35% for the smaller firms (sales less than $2.5 million) and only 9% for the larger firms.
•When asked about their plans to grow, respon-dents mentioned the following strategies:
|| hiring/finding more qualified employees,
|| apprenticeship, and
|| developing new partnerships.
2.2.6 Analyzing capacity
The CSC’s 2011 forecast scenario projects that markets for mechanical contractors in Alberta will rise 23% from 2011 to 2019. Growth will be centered in industrial and utility projects with slower growth in residential. Implications for contractors are that:
• tight labour markets for key pipe trades in the next few years will inhibit growth,
• expansion may be concentrated in a small group of large firms with the needed financial strength and management depth, and
•mobility of the contactor workforce across markets and regions will be a crucial part of their ability to adjust.

5
Un
de
rs
tan
din
g c
on
tr
ac
to
r c
ap
ac
ity
– a
lbe
rta
me
ch
an
ica
l c
on
tr
ac
to
rs
pr
of
ile
Contractors included in this profile are “special trade contractors primarily engaged in plumbing, heating, air-conditioning, and similar work.”1
The general profile provides the high-level description of all Alberta establishments identified as mechanical contractors. The Alberta mechanical contractors capacity profile draws on surveys and interviews conducted by the CSC for this report. Finally, the findings are assessed in the context of the CSC forecast scenarios for the markets and employment.
3.1 generAl ProfIle
A little less than 2,200 establishments across Alberta identify themselves as mechanical contrac-tors.2 The primary source of data for the general profile, InfoUSA, reports that 85% (1,890) of the establishments have sales of less than $2.5 million. The remaining 15% (297) of the establishments have sales between $2.5 and $50 million. Sales for all establishments total $4 billion. These two groups roughly split the total industry revenue with the combined sales for the smaller firms totalling $1.8 billion, while the larger firms have total sales of almost $2.2 billion (Figure 1).
The smaller firms in the sample have average sales of just under $1 million and work in a local community. The larger firms have average sales just over $7 million and employ as many as 430 people, but average about 100 each.
The CSC estimates that these contractors employ more than 17,000 workers or about eight workers
in each establishment (Table 1, page 6). These estimates can be compared to other sources. For example, the CSC forecast scenario analysis for Alberta tracks just more than 10,000 workers in the pipe trades. Most of these trades would likely work in the mechanical contracting firms.
Source: InfoUSA list of Canadian construction firms, 2009
FIGURE 1
DISTRIBUTION OF TOTAL SALES BY ESTABLISHMENT SIZE
# of establishments
Bill
ions
Less than$2.5 million
Greater than$2.5 million
$0.0
$0.5
$1.0
$1.5
$2.0
$2.5
� 1,890 � 297
1 The complete description is: “Special trade contractors primarily engaged in plumbing, heating, air-conditioning, and similar work. Sheet metal work performed by plumbing, heating, and air-conditioning contractors in conjunction with the installation of plumbing, heating, and air-conditioning equipment is included here, but roofing and sheet metal work contractors are classified in Industry 1761. Establishments included are in the SIC group 1711.” This description is taken from the Standard Industrial Classification at the U.S. Department of Labor. Retrieved from http://www.osha.gov/pls/ imis/sic_manual.display?id=414&tab=description.
2 Results in this section of the report cover all the mechanical contractors in Alberta reported in the InfoUSA database.
3 . ANALYSIS OF CONTRACTOR CAPACITY
6
co
ns
tr
Uc
tio
n s
ec
to
r c
oU
nc
il
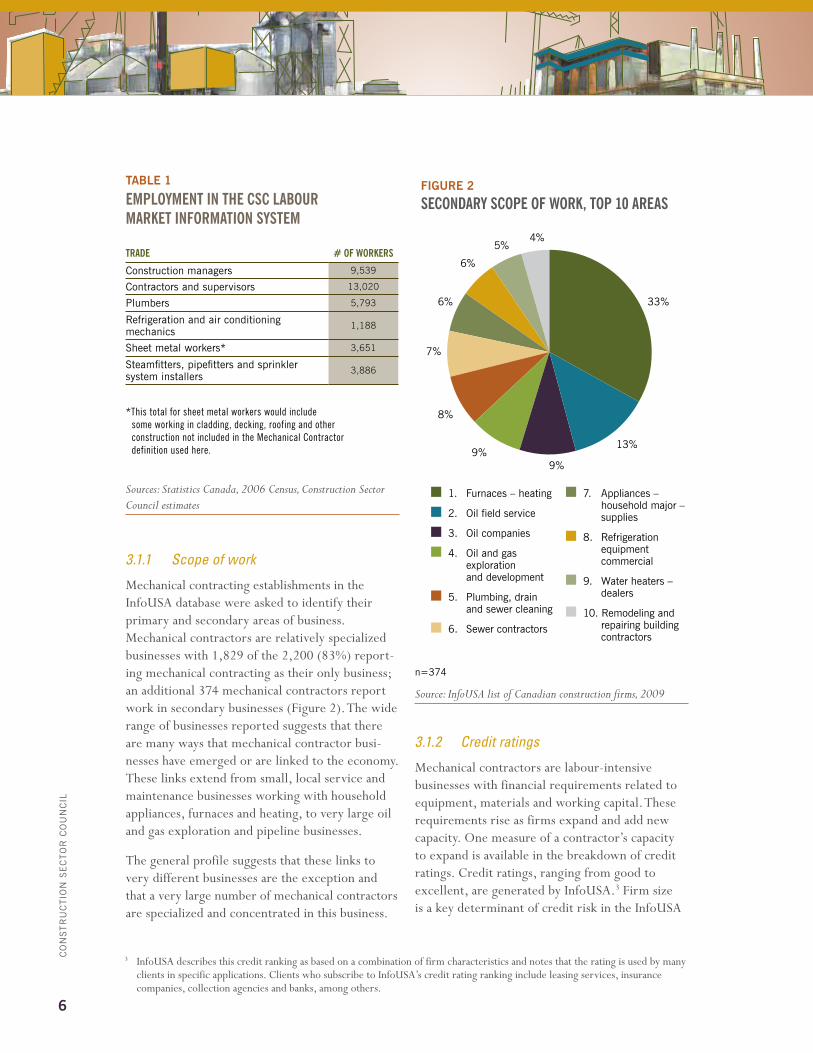
3.1.1 Scope of work
Mechanical contracting establishments in the InfoUSA database were asked to identify their primary and secondary areas of business. Mechanical contractors are relatively specialized businesses with 1,829 of the 2,200 (83%) report-ing mechanical contracting as their only business; an additional 374 mechanical contractors report work in secondary businesses (Figure 2). The wide range of businesses reported suggests that there are many ways that mechanical contractor busi-nesses have emerged or are linked to the economy. These links extend from small, local service and maintenance businesses working with household appliances, furnaces and heating, to very large oil and gas exploration and pipeline businesses.
The general profile suggests that these links to very different businesses are the exception and that a very large number of mechanical contractors are specialized and concentrated in this business.
3.1.2 Credit ratings
Mechanical contractors are labour-intensive businesses with financial requirements related to equipment, materials and working capital. These requirements rise as firms expand and add new capacity. One measure of a contractor’s capacity to expand is available in the breakdown of credit ratings. Credit ratings, ranging from good to excellent, are generated by InfoUSA.3 Firm size is a key determinant of credit risk in the InfoUSA
n=374
Source: InfoUSA list of Canadian construction firms, 2009
FIGURE 2
SECONDARY SCOPE OF WORK, TOP 10 AREAS
33%
8%
9%
7%
6%
6%
5% 4%
9%
13%
� 1. Furnaces – heating
� 2. Oil field service
� 3. Oil companies
� 4. Oil and gas exploration and development
� 5. Plumbing, drain and sewer cleaning
� 6. Sewer contractors
� 7. Appliances – household major – supplies
� 8. Refrigeration equipment commercial
� 9. Water heaters – dealers
� 10. Remodeling and repairing building contractors
3 InfoUSA describes this credit ranking as based on a combination of firm characteristics and notes that the rating is used by many clients in specific applications. Clients who subscribe to InfoUSA’s credit rating ranking include leasing services, insurance companies, collection agencies and banks, among others.
tAble 1
EmploymEnt in thE CSC labour markEt information SyStEm
traDE # of WorkErS
construction managers 9,539
contractors and supervisors 13,020
plumbers 5,793
refrigeration and air conditioning mechanics
1,188
sheet metal workers* 3,651
steamfitters, pipefitters and sprinkler system installers
3,886
*This total for sheet metal workers would include some working in cladding, decking, roofing and other construction not included in the Mechanical Contractor definition used here.
Sources: Statistics Canada, 2006 Census, Construction Sector Council estimates

7
Un
de
rs
tan
din
g c
on
tr
ac
to
r c
ap
ac
ity
– a
lbe
rta
me
ch
an
ica
l c
on
tr
ac
to
rs
pr
of
ile
*n=1,890 **n=297
Source: InfoUSA list of Canadian construction firms, 2009
FIGURE 3
DISTRIBUTION OF ESTABLISHMENTS BY CREDIT RATINGS
49%
16%
18% 2%
64% 43%
8% 0%
� Excellent
� Very good
� Good
� Unknown
Firms with revenue less than $2.5 million*
Firms with revenue greater than $2.5 million**
n=67
Source: Construction Sector Council Survey of Canadian Contractors, 2010
FIGURE 4
DISTRIBUTION OF FIRMS BY REVENUE
5%3%
40%
16%
6%
6%
24%
� Under $1 million
� $1 – $2.5 million
� $2.6 – $4.9 million
� $5 – $9.9 million
� $10 – $19.9 million
� $20 – $49.9 million
� Over $50 million
n=60
Source: Construction Sector Council Survey of Canadian Contractors, 2010
FIGURE 5
DISTRIBUTION OF FIRMS BY TOTAL EMPLOYEES
3%
61% 15%
2% 2%
17%
� 1–9
� 10–19
� 20–49
� 50–99
� 250–499
� 500+

8
co
ns
tr
Uc
tio
n s
ec
to
r c
oU
nc
il
measure, as only 66% of the smaller firms have an “excellent” or “very good” rating while 92% of the largest firms have an “excellent” or “very good” rating (Figure 3, page 7).
3.2 CAPACIty ProfIle
3.2.1 Concentration of sales and employment
To add detail to the general profile, the CSC interviewed and surveyed 76 Alberta mechanical contractors.4 Figure 4 (page 7) reports the distri-bution of the responding firms by size, finding a similar pattern of concentration to the general profile with the great majority of contractor businesses with sales less than $2.5 million.
Figure 5 (page 7) shows the division of the sample by employment size, duplicating the findings in the general profile. The smaller firms, with revenues less than $2.5 million, tend to employ nine people or fewer.
3.2.2 Specialization, scope and mobility
The geographic range of each establishment is another measure of capacity. Figure 6 tracks the scope of businesses in the sample. The smaller firms in the sample are limited in their geographic scope of work to the local community while the larger firms work in more than one province, though for the most part, are still concentrated in Western Canada. Figure 6 shows the distribution across the entire sample. In the case of firms with revenues less than $2.5 million, only 5% work in multiple provinces, while for firms with revenues greater than $2.5 million, this share increases to one-third.
Figure 7 shows the range of work for the Alberta mechanical contractors across markets. Respondents were asked to identify their markets and to indicate whether each was a primary or secondary focus. Most contractors in the sample work in several markets. The most common focus of business was commercial and institutional followed by residential markets, including low- and high-rise housing as well as renovation and maintenance. Findings here point to a roughly equal division between residential and non- residential and a broad diversification across many markets.
FIGURE 6
DISTRIBUTION OF FIRMS BY GEOGRAPHIC OPERATIONS
68%
16%
16%
� Home city and commuting area
� Home city and other parts of the province
� Multiple provinces
n=76
Source: Construction Sector Council Survey of Canadian Contractors, 2010
4 Seventy-six firms responded to interviews and the survey indicating that “plumbing” or “hVAC” best describes their scope of business and that their main office is in Alberta.

9
Un
de
rs
tan
din
g c
on
tr
ac
to
r c
ap
ac
ity
– a
lbe
rta
me
ch
an
ica
l c
on
tr
ac
to
rs
pr
of
ile
Virtually all the firms in the CSC sample work in multiple markets.
The capacity of the firms to work in different markets depends on the mobility of their resources. The CSC survey/interview process asked about the mobility of the workforce across different sectors such as residential and non-residential construction. Alberta mechanical contractors serving many markets reported that the great majority of their workforce is either “somewhat mobile” or “mobile” across all their industries. Trades and occupations working on the sites were slightly less mobile (Figure 8, page 10).
It would appear that strong labour mobility exists across markets.
3.2.3 Factors impacting bidding and building
Responding contractors were asked to identify factors impacting their ability to bid and build. Both the survey and the interview results were highlighted by a positive and confident attitude with contractors reporting their strengths and their capacity to carry out work. This positive attitude included identifying relatively few factors that would limit their capacity to bid and build and an emphasis on many factors that do not impact businesses because the firm has managed these areas well. Respondents sometimes noted that their competitors may face a disadvantage in these areas.
FIGURE 7
TOP MARKETS SERVED
Institutional and commercial
Pipelines (large diameter)
Industrial maintenance
Institutional maintenance
Residential, renovation and maintenance
Low-rise (single-family) residential
Commercial building services
Industrial
Other engineering construction
All civil engineering
High-rise (multi-family) residential
0 5 10 15 20 25 30 35 40 45 50
Number
n=52
Source: Construction Sector Council Survey of Canadian Contractors, 2010

10
co
ns
tr
Uc
tio
n s
ec
to
r c
oU
nc
il
Just over three-quarters of the responding firms submit competitive bids to win work, while the remaining quarter report that they do not bid for work.
Firms were asked to identify the factors that were most likely to impact their decision to bid on work. Each potential factor was ranked across four choices:
• regular and important impact
• likely to impact
• not likely to impact
• no impact
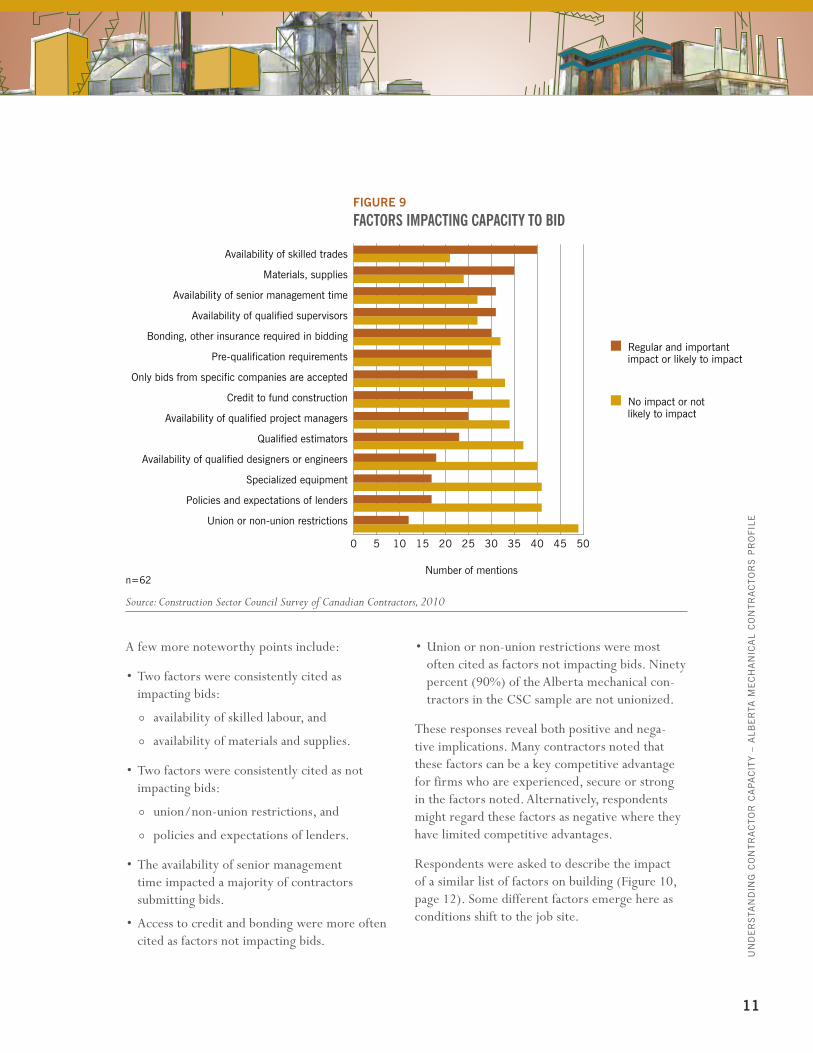
Figure 9 lists the factors impacting bidding mentioned by respondents. Factors are ranked in terms of the frequency with which they were mentioned. Responses were grouped into two broad categories combining “not likely” and “no impact” and contrasting this to “regular and important” and “likely impact.” The most often mentioned factor having an impact was the avail-ability of skilled trades and this was mentioned more than 40 times by the 62 respondents.
n=66
Source: Construction Sector Council Survey of Canadian Contractors, 2010
FIGURE 8
LABOUR MOBILITY REPORTED BY TYPE OF WORK
Senior management
Site supervision
Engineering, project management, estimating, design
Site trades and occupations
� Mobile � Somewhat mobile
0% 10% 20% 30% 40% 50% 60% 70% 80% 90%
11
Un
de
rs
tan
din
g c
on
tr
ac
to
r c
ap
ac
ity
– a
lbe
rta
me
ch
an
ica
l c
on
tr
ac
to
rs
pr
of
ile
FIGURE 9
FACTORS IMPACTING CAPACITY TO BID
Availability of skilled trades
Materials, supplies
Availability of senior management time
Availability of qualified supervisors
Bonding, other insurance required in bidding
Pre-qualification requirements
Only bids from specific companies are accepted
Credit to fund construction
Availability of qualified project managers
Qualified estimators
Availability of qualified designers or engineers
Specialized equipment
Policies and expectations of lenders
Union or non-union restrictions
0 5 10 15 20 25 30 35 40 45 50
� Regular and important impact or likely to impact
� No impact or not likely to impact
Number of mentionsn=62
Source: Construction Sector Council Survey of Canadian Contractors, 2010
A few more noteworthy points include:
•Two factors were consistently cited as impacting bids:
|| availability of skilled labour, and
|| availability of materials and supplies.
•Two factors were consistently cited as not impacting bids:
|| union/non-union restrictions, and
|| policies and expectations of lenders.
•The availability of senior management time impacted a majority of contractors submitting bids.
•Access to credit and bonding were more often cited as factors not impacting bids.
•Union or non-union restrictions were most often cited as factors not impacting bids. Ninety percent (90%) of the Alberta mechanical con-tractors in the CSC sample are not unionized.
These responses reveal both positive and nega-tive implications. Many contractors noted that these factors can be a key competitive advantage for firms who are experienced, secure or strong in the factors noted. Alternatively, respondents might regard these factors as negative where they have limited competitive advantages.
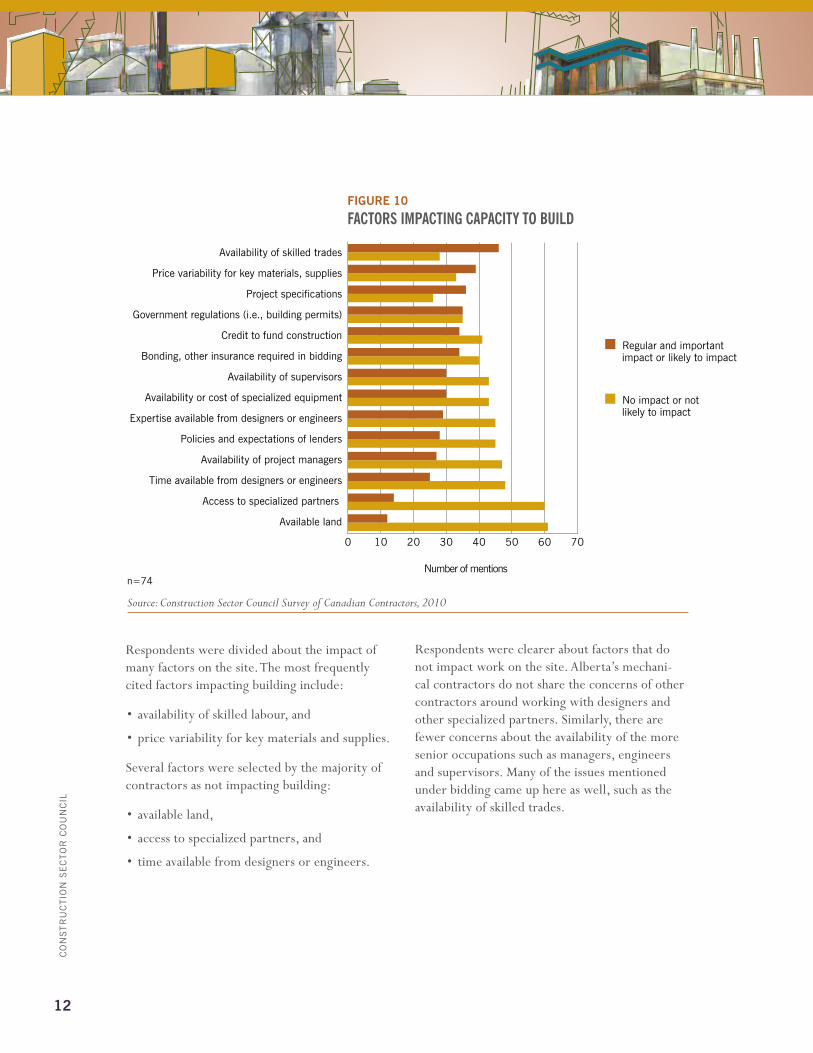
Respondents were asked to describe the impact of a similar list of factors on building (Figure 10, page 12). Some different factors emerge here as conditions shift to the job site.
12
co
ns
tr
Uc
tio
n s
ec
to
r c
oU
nc
il
Respondents were divided about the impact of many factors on the site. The most frequently cited factors impacting building include:
• availability of skilled labour, and
• price variability for key materials and supplies.
Several factors were selected by the majority of contractors as not impacting building:
• available land,
• access to specialized partners, and
• time available from designers or engineers.
Respondents were clearer about factors that do not impact work on the site. Alberta’s mechani-cal contractors do not share the concerns of other contractors around working with designers and other specialized partners. Similarly, there are fewer concerns about the availability of the more senior occupations such as managers, engineers and supervisors. Many of the issues mentioned under bidding came up here as well, such as the availability of skilled trades.
FIGURE 10
FACTORS IMPACTING CAPACITY TO BUILD
Availability of skilled trades
Price variability for key materials, supplies
Project specifications
Government regulations (i.e., building permits)
Credit to fund construction
Bonding, other insurance required in bidding
Availability of supervisors
Availability or cost of specialized equipment
Expertise available from designers or engineers
Policies and expectations of lenders
Availability of project managers
Time available from designers or engineers
Access to specialized partners
Available land
0 10 20 30 40 50 60 70
� Regular and important impact or likely to impact
� No impact or not likely to impact
Number of mentionsn=74
Source: Construction Sector Council Survey of Canadian Contractors, 2010

13
Un
de
rs
tan
din
g c
on
tr
ac
to
r c
ap
ac
ity
– a
lbe
rta
me
ch
an
ica
l c
on
tr
ac
to
rs
pr
of
ile
3.2.4 Structural change
Respondents were asked if structural change in the industry was altering the division of work among owners, designers, and general and trade contractors. Only a few contactors responded to this question, but the majority of these felt that such a structural change is occurring.
The idea was also expressed that, to some extent, the nature of mechanical work does not allow traditional boundaries to change too much. For example, where modular systems are being purchased and shipped for installation, this is not as feasible in mechanical work where contractors must check that a pre-built system is properly sealed and built to code.
There was no consensus on what is causing the structural change in traditional work boundar-ies. Nonetheless, some causes of this change mentioned were:
• technology,
• owner/client preferences, and
• competition.
Where respondents felt there is a structural change occurring they also indicated that this change typically leads to greater opportunity for collaboration and partnering. Detailed comments from Alberta mechanical contractors indicated a theme around the importance of choosing the right firm(s) to partner with. Companies prefer to partner with firms with whom they have had a good working experience in the past. Mechanical contractors indicated a need to have their voice heard at the design stage, as some engineers and designers do not have sufficient construction
experience, which presents great challenges at the building stage. To mitigate issues that may occur between designers and builders, one mechani-cal contracting company stated: “we take a more aggressive role in the design of a building and have more say in what is specified or who is specified by the engineers.”
The importance of strong relationships between design and building, as well as the importance of access to credit, were both confirmed in the final question around structural change in the industry. When asked what characteristics best prepare a firm for success in this environment of structural change, respondents commented:
• “ good relations with banks and bonding companies,” and
• “ access to and experience with partnering and collaborating with other firms in the design/build chain.”
• In one contractor’s words, “a contractor needs to know as much as possible about the financial risks of a job as it is very difficult to obtain redress.”
Mechanical contractors in Alberta were also able to articulate the impact of the current economic conditions on these structural changes in the industry. For example, one firm noted that big corporate mergers or acquisitions drive service providers toward a national scale to the detriment of local contractors. The response on the side of the firm is to focus more on the service side of their work; to diversify away from construction, which has “a very lumpy cash flow and delayed payment mechanism.”
14
co
ns
tr
Uc
tio
n s
ec
to
r c
oU
nc
il
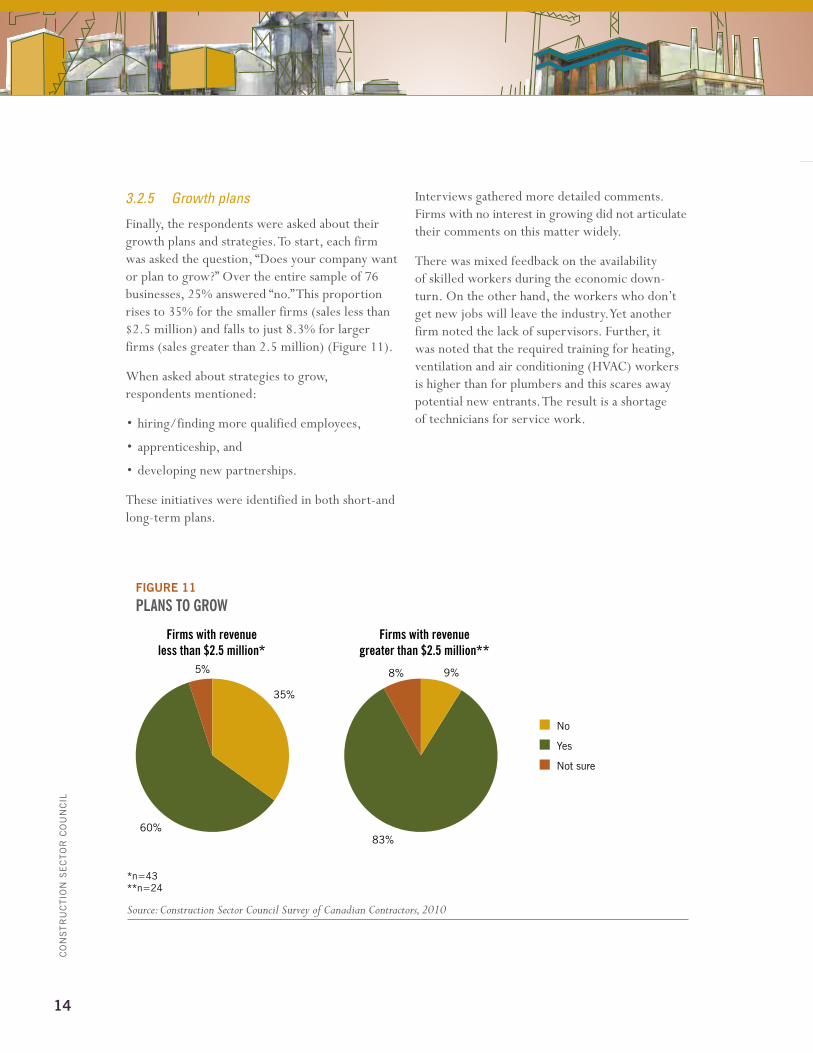
3.2.5 Growth plans
Finally, the respondents were asked about their growth plans and strategies. To start, each firm was asked the question, “Does your company want or plan to grow?” Over the entire sample of 76 businesses, 25% answered “no.” This proportion rises to 35% for the smaller firms (sales less than $2.5 million) and falls to just 8.3% for larger firms (sales greater than 2.5 million) (Figure 11).
When asked about strategies to grow, respondents mentioned:
• hiring/finding more qualified employees,
• apprenticeship, and
• developing new partnerships.
These initiatives were identified in both short-and long-term plans.
Interviews gathered more detailed comments. Firms with no interest in growing did not articulate their comments on this matter widely.
There was mixed feedback on the availability of skilled workers during the economic down-turn. On the other hand, the workers who don’t get new jobs will leave the industry. Yet another firm noted the lack of supervisors. Further, it was noted that the required training for heating, ventilation and air conditioning (hVAC) workers is higher than for plumbers and this scares away potential new entrants. The result is a shortage of technicians for service work.
FIGURE 11
PLANS TO GROW
60%
5%
35%
83%
8% 9%
Firms with revenueless than $2.5 million*
Firms with revenuegreater than $2.5 million**
� No
� Yes
� Not sure
*n=43 **n=24
Source: Construction Sector Council Survey of Canadian Contractors, 2010

15
Un
de
rs
tan
din
g c
on
tr
ac
to
r c
ap
ac
ity
– a
lbe
rta
me
ch
an
ica
l c
on
tr
ac
to
rs
pr
of
ile
The themes noted in the Alberta mechanical contractors capacity profile can be considered through the lens of the CSC’s 2011 forecast scenarios. The detailed construction and mainte-nance market projections in the scenarios set out the extent of the needed expansion to mechanical and related services. Further, the primary contractor focus on the availability of skilled trades is addressed in labour market assessments for plumbers, steamfitters, pipefit-ters, sheet metal workers, and refrigeration and air conditioning mechanics. Contractors and supervisors, as well as construction managers, are also tracked in the system and are mentioned in the scenarios as they relate to some of the stated impacts on bidding and building (i.e., availability of senior management time and availability of supervisors). The scenarios also cover other factors impacting business prospects.
The 2011 forecast scenario for Alberta antici-pates that the market for mechanical contractors will grow by nearly 23% from 2011 to 2019. Opportunities will be more concentrated from 2011 to 2013 in the non-residential sector. Cyclical downturns in new housing construction may impact markets around 2014 and toward 2019. These conditions favour firms that are more specialized in industrial and utility-based projects.
4.1 CAPACIty AddItIons And the AvAIlAble workforCe
Additions to capacity at the anticipated pace are not unprecedented. But the availability of both human resources and capital will be limited by
new circumstances that will hinder contractors. This is particularly the case around 2013, based on analysis from the 2011 CSC forecast scenario.
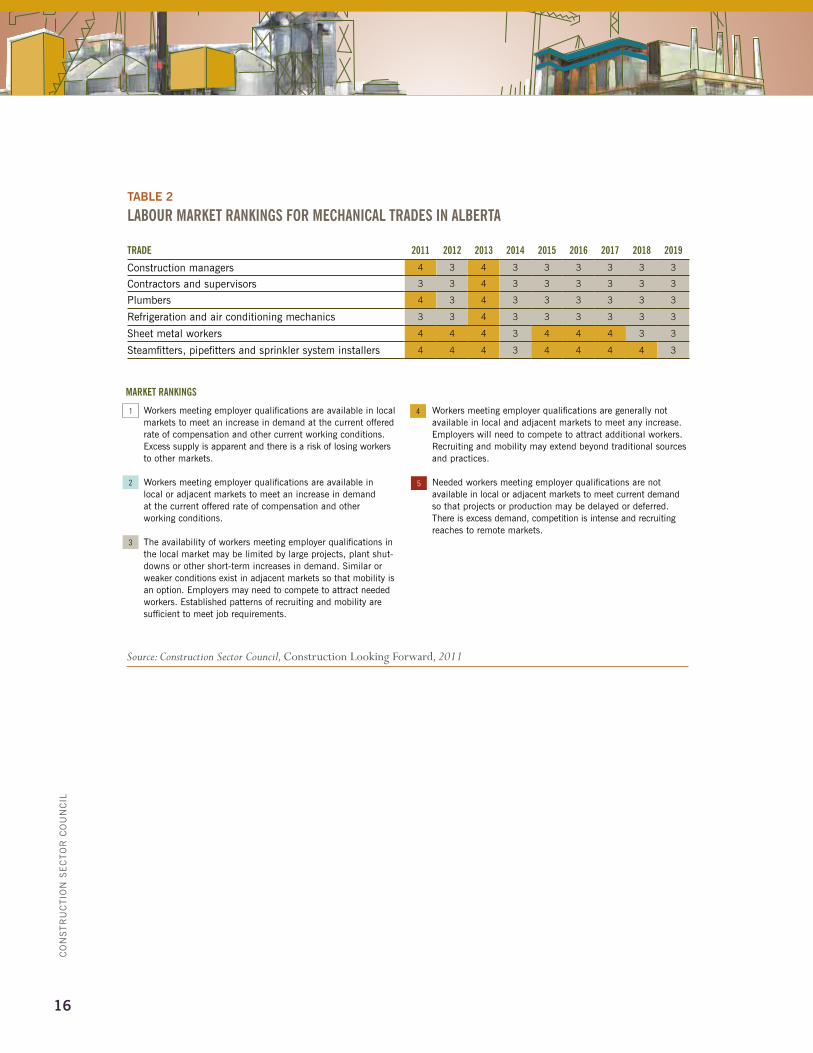
The CSC forecast scenario tracks markets for pipe trades and hVAC. Table 2 (page 16) summa-rizes findings and labour market assessments for key occupations.
Concerns about human resources revealed in the CSC contractor survey are well placed given the analysis cited here.
4.2 other fACtors IMPACtIng CAPACIty
Findings suggest that more than half of the required growth in mechanical contractor capacity will likely be concentrated in the key group of perhaps just over 250 large contactors with plans to grow. These firms have the financial strength, partnerships and access to technology to meet these demands. For this group to accommodate expected requirements for their share of the increase in capacity they will have to grow, on average, more than the 23% anticipated for the Alberta markets from 2011 to 2019.
The CSC forecast scenario also suggests that the pattern of growth will shift work from residential to industrial and related engineering-type proj-ects. This will test the ability of firms to adapt their capacity and move resources across markets and regions.
4 . CONCLUSIONS AND IMPLICATIONS FOR BUILDING MEChANICAL CONTRACTOR CAPACITY
16
co
ns
tr
Uc
tio
n s
ec
to
r c
oU
nc
il
tAble 2
labour markEt rankingS for mEChaniCal traDES in albErta
traDE 2011 2012 2013 2014 2015 2016 2017 2018 2019
construction managers 4 3 4 3 3 3 3 3 3
contractors and supervisors 3 3 4 3 3 3 3 3 3
plumbers 4 3 4 3 3 3 3 3 3
refrigeration and air conditioning mechanics 3 3 4 3 3 3 3 3 3
sheet metal workers 4 4 4 3 4 4 4 3 3
steamfitters, pipefitters and sprinkler system installers 4 4 4 3 4 4 4 4 3
Source: Construction Sector Council, Construction Looking Forward, 2011
markEt rankingS
Workers meeting employer qualifications are available in local markets to meet an increase in demand at the current offered rate of compensation and other current working conditions. excess supply is apparent and there is a risk of losing workers to other markets.
Workers meeting employer qualifications are available in local or adjacent markets to meet an increase in demand at the current offered rate of compensation and other working conditions.
the availability of workers meeting employer qualifications in the local market may be limited by large projects, plant shut-downs or other short-term increases in demand. similar or weaker conditions exist in adjacent markets so that mobility is an option. employers may need to compete to attract needed workers. established patterns of recruiting and mobility are sufficient to meet job requirements.
Workers meeting employer qualifications are generally not available in local and adjacent markets to meet any increase. employers will need to compete to attract additional workers. recruiting and mobility may extend beyond traditional sources and practices.
needed workers meeting employer qualifications are not available in local or adjacent markets to meet current demand so that projects or production may be delayed or deferred. there is excess demand, competition is intense and recruiting reaches to remote markets.
1
2
3
4
5


Funded by the Government of Canada’s Sector Council Program
The opinions and interpretations in this publication are those of the author and do not necessarily reflect those of the Government of Canada.