MECHANICAL BEHAVIOUR OF EXPANSIVE CLAYS IN NORTH …docs.neu.edu.tr/library/6715437660.pdf ·...
100
MECHANICAL BEHAVIOUR OF EXPANSIVE CLAYS IN NORTH CYPRUS A THESIS SUBMITTED TO THE GRADUATE SCHOOL OF APPLIED SCIENCES OF NEAR EAST UNIVERSITY By AMR ABDEH In Partial Fulfilment of the Requirements for the Degree of Master of Science in Civil Engineering NICOSIA, 2018 MOSTAFA K.A HAMED MECHANICAL BEHAVIOUR OF EXPANSIVE CLAYS IN NORTH CYPRUS AMR ABDEH NEU 2018
Transcript of MECHANICAL BEHAVIOUR OF EXPANSIVE CLAYS IN NORTH …docs.neu.edu.tr/library/6715437660.pdf ·...
MECHANICAL BEHAVIOUR OF EXPANSIVE
CLAYS IN NORTH CYPRUS
A THESIS SUBMITTED TO THE GRADUATE
SCHOOL OF APPLIED SCIENCES
OF
NEAR EAST UNIVERSITY
By
AMR ABDEH
In Partial Fulfilment of the Requirements for
the Degree of Master of Science
in
Civil Engineering
NICOSIA, 2018
MO
STAFA
K.A
HA
MED
M
EC
HA
NIC
AL
BE
HA
VIO
UR
OF
EX
PA
NS
IVE
CL
AY
S IN
NO
RT
H
CY
PR
US
AM
R
AB
DE
H
NE
U
2018

MECHANICAL BEHAVIOUR OF EXPANSIVE
CLAYS IN NORTH CYPRUS
A THESIS SUBMITTED TO THE GRADUATE
SCHOOL OF APPLIED SCIENCES
OF
NEAR EAST UNIVERSITY
By
AMR ABDEH
In Partial Fulfilment of the Requirements for
the Degree of Master of Science
in
Civil Engineering
NICOSIA, 2018
Amr ABDEH: MECHANICAL BEHAVIOUR OF EXPANSIVE CLAYS IN NORTH
CYPRUS
Approval of Director of Graduate School of
Applied Sciences
Prof. Dr. Nadire ÇAVUŞ
We certify this thesis is satisfactory for the award of the degree of Master of
Science in Civil Engineering
Examining Committee in Charge:
Department of Civil Engineering, Lefke
European University
Department of Civil Engineering, Near
East University
Department of Civil Engineering, Near
East University
Supervisor, Department of Civil
Engineering, Near East University
Co-Supervisor, Department of Civil
Engineering, Near East University
Asst. Prof. Dr. Abdullah Ekinci
Dr. Shaban Ismael Al Brka
Dr. Mehmet Necdet
Dr. Anoosheh Iravanian
Prof. Dr. Hüseyin Gökçekuş

I hereby declare that all information in this document has been obtained and presented in
accordance with academic rules and ethical conduct. I also declare that, as required by these
rules and conduct, I have fully cited and referenced all material and results that are not
original to this work.
Name, Last name: Amr Abdeh
Signature:
Date:
i
ACKNOWLEDGEMENTS
Firstly, I would like to thank my family for providing me with all the necessary support and
funding which helped me in accomplishing my master thesis.
My special gratitude goes to my supervisor and vice chairman Dr. Anoosheh Iravanian for
her full support and guidance during my research work. I am also grateful to her valuable
efforts and contributions which assisted me in my thesis preparation.
My sincere thanks and full respect go to my co-supervisor and chairman of Civil and
Environmental Engineering Faculty Prof. Dr. Hüseyin Gökçekuş for granting me full support
and feedback which helped in increasing my research knowledge.
Special thanks to Dr. Mehmet Necdet who helped and guided me in my samples picking trip
by showing me the areas where expansive soil can be found. Dr. Mehmet Necdet is a
professional geologist who possesses great experience with the formation of soils in North
Cyprus.
I would also like to thank Asst. Prof. Dr. Abdullah Ekinci who is an academic staff in the
faculty of engineering, Lefke European University for granting me permission to use
Unconfined Compression Strength apparatus and helped in operating it.
In addition to that, I appreciate the help and support of our laboratory assistant Mustafa Turk
and my friend Salah Al- Dubai.

ii
To my family…
iii
ABSTRACT
Expansive clays in semi-arid regions are known as problematic soils especially for low
weight civil structures. Volume change is a critical issue, therefore determining expansive
clays and quantifying their expandability, retractility and strength is a major step to be
considered in geotechnical engineering.
This research provides a study on the behaviour of expansive clays done under different
geotechnical laboratory experiments on four different types of expansive clayey soils
brought from various areas in Northern Cyprus.
Fundamental assessments were performed for determining soil index properties. Swell and
consolidation behaviours were determined using one-dimensional oedometer apparatus.
Strength test was done for both shear and compressive strength. In addition to that, swell and
shrinkage cycles were applied to one of the four samples to understand its lateral/axial
behaviour and progression of cracks.
The results showed that the rate of the expansiveness of sample T4 (bentonitic clay) was the
highest for the predicted ultimate swell with expandability index categorized as very high.
Also, the largest compressibility was for sample T4. Cyclic swell and shrinkage results of
sample T2 (Kythrea formation) showed that during equilibrium the average axial/lateral
deformation behaviour was anisotropic. In addition to that, surface cracks initiation started
after 3 hours and stopped at 96 hours. Mohr’s failure envelopes were drawn for the peak and
residual shear stress obtained from the shear strength test, thus parameters related to the test
were determined. Furthermore, unconfined compressive strength test was carried out on the
samples and parameters obtained were used to relate between consistency and strength.
Keywords: Expansive clays; compressibility; cyclic swell and shrinkage; crack patterns;
shear strength
iv
ÖZET
Yarı kurak iklim bölgelerinde bulunan şişen killer,yapılar için sorun oluşturan zemin türleri
olarak bilinmektedir. Hacimsel değişim zeminlerde rastlanan ciddi bir sorun olup şişen killer
üzerinde yapılan inşaatlarda ciddi hasarlara yolaçabilmektedir. Bu tür killerdeki olası şişme
ve büzülme oranlarının belirlenmesi jeoteknik mühendisleri tarafından ele alınması gereken
başlıca konular arasındadır.
Mevcut araştırmada, Kuzey Kıbrıs’ın değişik bölgelerinden temin edilen dört farklı çeşit
şişen kil örnekleri üzerinde yapılan deneysel çalışmalarla davranışları incelenmiştir.
Zeminlerin indeks özellikleri zemin indeksleri tayin teknikleri ile tanımlanmıştır. Şişme ve
konsolidasyon davranışları tek yönlü oedometre aparatı kullanılarak belirlenmiştir. Kesme
ve basınç dayanımlarının tayini için mukavemet testleri gerçekleştirilmiştir. Buna ek olarak,
killerin izotropik davranışı ve çatlakların oluşumunu anlamak için dört örnekten birinde
şişme ve büzülme döngüleri uygulanmıştır.
T4 (Bentonitik kil) nolu örnek şişme indisi ve sıkıştırılabilirlik limitleri içinde en yüksek
değerlere sahiptir. Değirmenlik Formasyonun’dan alınan T2 nolu örnek döngüsel şişme ve
büzülme sonuçları bakımından gerek düşey gerekse yanal yönde farklı davranış göstermiştir.
Buna ilaveten yüzeyde oluşan çatlaklar deneyin 3üncü saatinde oluşmaya başlamış ve 96ıncı
saatinde durmuştur. Mohr'un kırılma zarfları çizilerek elde edilen maksimum ve kalan kesme
dayanımı değerleri ölçülmüş ve böylece drenajsız kesme dayanımı parametreleri
belirlenmiştir. Ayrıca, maksimum kuru yoğunluklarında sıkıştırılmış zemin numuneleri
üzerinde serbest basınç deneyi uygulandıktan sonra elde edilen parametreler, kıvam ve
dayanıklılık arasında bağlantı kurmada kullanılmıştır.
Anahtar kelimeler: Şişen killer; sıkıştırılabilme; döngüsel şişme ve büzülme; çatlak
modelleri; kesme dayanımı
v
TABLE OF CONTENTS
ACKNOWLEDGEMENTS ............................................................................................... i
ABSTRACT ...................................................................................................................... iii
ÖZET ................................................................................................................................. iv
TABLE OF CONTENTS .................................................................................................. v
LIST OF FIGURES ........................................................................................................ viii
LIST OF TABLES ............................................................................................................. x
LIST OF SYMBOLS AND ABBREVIATIONS ............................................................ xi
CHAPTER 1: INTRODUCTION
1.1 General Background .................................................................................................. 1
1.2 An Overview of Swelling Clays in Cyprus................................................................ 2
1.2.1 Scale of the problems of swelling clays in Cyprus ............................................. 4
1.3 Aim of the Study ........................................................................................................ 5
1.4 Thesis Outline ............................................................................................................ 5
CHAPTER 2: LITREATURE REVIEW
2.1 Introduction ................................................................................................................ 6
2.2 Mineralogy and Particles of Clay .............................................................................. 8
2.2.1 Kaolinite ............................................................................................................ 11
2.2.2 Illite ................................................................................................................... 13
2.2.3 Smectite ............................................................................................................. 14
2.3 Clay Structure .......................................................................................................... 16
2.4 Diffuse Double Layer .............................................................................................. 17
2.5 Cation Exchange Capacity ....................................................................................... 18
2.6 Swelling Mechanism ................................................................................................ 19
2.7 The Geochemistry of Clay Minerals ........................................................................ 20
vi
2.7.1 Ion exchange and equilibrium adsorption ......................................................... 20
2.7.2 Surface charge properties .................................................................................. 21
2.8 Previous Experimental Studies ................................................................................ 23
2.8.1 A general overview of previously studied soils. ............................................... 23
2.8.2 Turkey soils ....................................................................................................... 27
2.8.3 North Cyprus soils ............................................................................................. 28
CHAPTER 3: EXPERIMENTAL STUDIES
3.1 Introduction .............................................................................................................. 30
3.2 Material Selection .................................................................................................... 30
3.2.1 Sample T1 pickup location ................................................................................ 30
3.2.2 Sample T2 pickup location ................................................................................ 30
3.2.3 Sample T3 pickup location ................................................................................ 30
3.2.4 Sample T4 pickup location ................................................................................ 31
3.3 Properties Test ......................................................................................................... 31
3.3.1 Sieve analysis and hydrometer test ................................................................... 32
3.3.2 Atterberg limit tests ........................................................................................... 33
3.3.3 Standard Proctor compaction tests .................................................................... 35
3.3.4 Specific gravity ................................................................................................. 37
3.4 Volume Change Behaviour ...................................................................................... 38
3.4.1 One-dimensional oedometer free swell ............................................................. 39
3.4.2 One-dimensional consolidation test .................................................................. 40
3.4.3 Swell-shrinkage cycle ....................................................................................... 41
3.5 Soil Strength Test ..................................................................................................... 41
3.5.1 Direct shear test ................................................................................................. 42
3.5.2 Unconfined compressive test (UCT) ................................................................. 43
vii
CHAPTER 4: RESULTS AND DISCUSSIONS
4.1 Introduction .............................................................................................................. 45
4.2 Index Properties ....................................................................................................... 45
4.2.1 Distribution of grain size ................................................................................... 45
4.2.2 Atterberg limits ................................................................................................. 46
4.2.3 Compaction behavior ........................................................................................ 48
4.2.4 Specific gravity of soil ...................................................................................... 50
4.3 Volume Change of Clay........................................................................................... 50
4.3.1 One-dimensional oedometer free swell ............................................................. 51
4.3.2 One-dimensional consolidation test .................................................................. 56
4.3.3 Swell-shrinkage cycle test ................................................................................. 58
4.4 Soil Strength Test ..................................................................................................... 62
4.4.1 Shear box test .................................................................................................... 63
4.4.2 Unconfined compression test ............................................................................ 69
CHAPTER 5: CONCLUSION AND RECOMMENDATIONS
5.1 Conclusions .............................................................................................................. 74
5.2 Recommendations .................................................................................................... 76
REFERENCES ................................................................................................................ 77
viii
LIST OF FIGURES
Figure 1.1: Swelling clay settlements in Cyprus ................................................................ 4
Figure 1.2: Cracks on walls and road surface..................................................................... 4
Figure 2.1: Particles size distribution in accordance with USCS and AASHTO ............... 9
Figure 2.2: Structural units in silica sheet ........................................................................ 10
Figure 2.3: Structural units in octahedral sheet ................................................................ 10
Figure 2.4: Kaolinite layered structure ............................................................................. 12
Figure 2.5: Scanning electron microscopy of Kaolinite ................................................... 12
Figure 2.6: Illite layered structure .................................................................................... 13
Figure 2.7: Scanning electron microscopy of Illite .......................................................... 14
Figure 2.8: Montmorillonite layered structure ................................................................. 15
Figure 2.9: Scanning electron microscopy of montmorillonite ........................................ 15
Figure 2.10: Dispersed and flocculated structures ........................................................... 16
Figure 2.11: Distribution of anions and cations adjacent to a clay surface in accordance to
diffusion theory of double layers ................................................................. 17
Figure 2.12: Different exchange sites on clay particles ................................................... 19
Figure 2.13: Swell mechanism ......................................................................................... 20
Figure 2.14: Attraction of ions to a 2:1 smectite structure ............................................... 21
Figure 2.15: Different pH level versus surface charge ..................................................... 22
Figure 3.1: Obtained Soil samples.................................................................................... 31
Figure 3.2: Standard sieves used for the obtained soil samples ....................................... 32
Figure 3.3: Hydrometer test done for the obtained soil samples ...................................... 33
Figure 3.4: States of soils ................................................................................................. 34
Figure 3.5: Determination of plastic limit by crumbling .................................................. 34
Figure 3.6: Casagrande liquid limit test ........................................................................... 35
Figure 3.7: Standard Proctor compactor with a mold....................................................... 36
Figure 3.8: Standard Proctor Test MDD and OMC ......................................................... 37
Figure 3.9: Vacuum pump ................................................................................................ 38
Figure 3.10: Simple oedometer setup ............................................................................... 39
Figure 3.11: One-Dimensional Oedometer....................................................................... 41
ix
Figure 3.12: Shear box testing machine ........................................................................... 43
Figure 3.13: UCT testing machine ................................................................................... 44
Figure 4.1: Particle size distribution of sample T1, T2, T3 and T4 ................................. 46
Figure 4.2: The Atterberg limits of sample T1, T2, T3 and T4 ........................................ 47
Figure 4.3: Unified Soil Classification System (USCS) with plasticity chart .................. 48
Figure 4.4: Standard Proctor compaction curve for sample T1, T2, T3 and T4 .............. 49
Figure 4.5: Percent swell of sample T1, T2, T3 and T4 versus logarithmic time ............ 52
Figure 4.6: Percent swell of sample T1, T2, T3 and T4 versus time................................ 54
Figure 4.7: The relationship of time/swell vs time of samples T1, T2, T3 and T4 .......... 55
Figure 4.8: Tested samples consolidation results ............................................................. 57
Figure 4.9: Plasticity Index and Compression Index........................................................ 58
Figure 4.10: Swell and shrinkage axial deformation of sample T2 .................................. 60
Figure 4.11: Cracking and diameter change of sample T2 during wetting/drying cycle . 60
Figure 4.12: Change of crack patterns with respect to time ............................................. 61
Figure 4.13: Lateral and axial deformation of sample T2 during wetting/drying cycle ... 62
Figure 4.14: Direct shear test results of sample T1 .......................................................... 64
Figure 4.15: Direct shear test failure envelope of sample T1........................................... 64
Figure 4.16: Direct shear test results of sample T2 .......................................................... 65
Figure 4.17: Direct shear test failure envelope of sample T2........................................... 65
Figure 4.18: Direct shear test results of sample T3 .......................................................... 66
Figure 4.19: Direct shear test failure envelope of sample T3........................................... 66
Figure 4.20: Direct shear test results of sample T4 .......................................................... 67
Figure 4.21: Direct shear test failure envelope of sample T4........................................... 67
Figure 4.22: Plot of stress vs strain for UCT result of sample T1, T2, T3 and T4 ........... 70
Figure 4.23: Unconfined compressive test Mohr’s circle for sample T1 ......................... 71
Figure 4.24: Unconfined compressive test Mohr’s circle for sample T2 ......................... 71
Figure 4.25: Unconfined compressive test Mohr’s circle for sample T3 ......................... 72
Figure 4.26: Unconfined compressive test Mohr’s circle for sample T4 ......................... 72
x
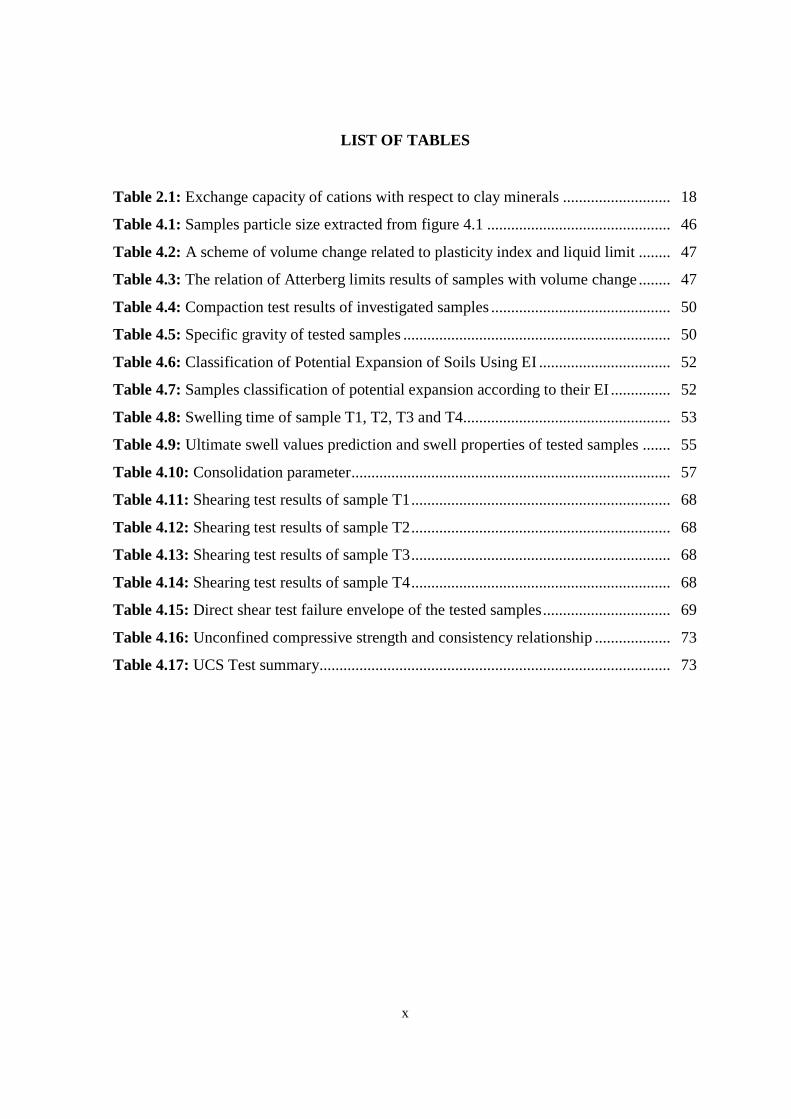
LIST OF TABLES
Table 2.1: Exchange capacity of cations with respect to clay minerals ........................... 18
Table 4.1: Samples particle size extracted from figure 4.1 .............................................. 46
Table 4.2: A scheme of volume change related to plasticity index and liquid limit ........ 47
Table 4.3: The relation of Atterberg limits results of samples with volume change ........ 47
Table 4.4: Compaction test results of investigated samples ............................................. 50
Table 4.5: Specific gravity of tested samples ................................................................... 50
Table 4.6: Classification of Potential Expansion of Soils Using EI ................................. 52
Table 4.7: Samples classification of potential expansion according to their EI ............... 52
Table 4.8: Swelling time of sample T1, T2, T3 and T4.................................................... 53
Table 4.9: Ultimate swell values prediction and swell properties of tested samples ....... 55
Table 4.10: Consolidation parameter ................................................................................ 57
Table 4.11: Shearing test results of sample T1 ................................................................. 68
Table 4.12: Shearing test results of sample T2 ................................................................. 68
Table 4.13: Shearing test results of sample T3 ................................................................. 68
Table 4.14: Shearing test results of sample T4 ................................................................. 68
Table 4.15: Direct shear test failure envelope of the tested samples ................................ 69
Table 4.16: Unconfined compressive strength and consistency relationship ................... 73
Table 4.17: UCS Test summary........................................................................................ 73
xi
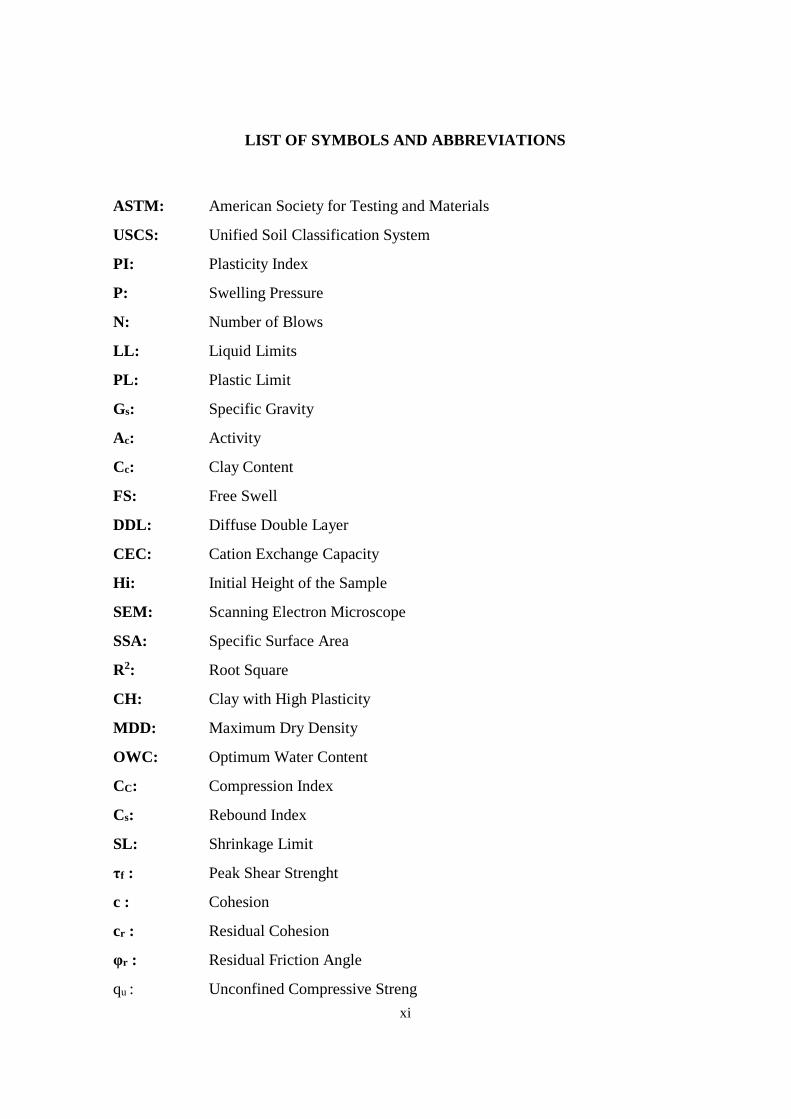
LIST OF SYMBOLS AND ABBREVIATIONS
ASTM: American Society for Testing and Materials
USCS: Unified Soil Classification System
PI: Plasticity Index
P: Swelling Pressure
N: Number of Blows
LL: Liquid Limits
PL: Plastic Limit
Gs: Specific Gravity
Ac: Activity
Cc: Clay Content
FS: Free Swell
DDL: Diffuse Double Layer
CEC: Cation Exchange Capacity
Hi: Initial Height of the Sample
SEM: Scanning Electron Microscope
SSA: Specific Surface Area
R2: Root Square
CH: Clay with High Plasticity
MDD: Maximum Dry Density
OWC: Optimum Water Content
CC: Compression Index
Cs: Rebound Index
SL: Shrinkage Limit
τf : Peak Shear Strenght
c : Cohesion
cr : Residual Cohesion
φr : Residual Friction Angle
qu : Unconfined Compressive Streng
1
CHAPTER 1
INTRODUCTION
1.1 General Background
Expansive clays are high swelling soils, they are very reactive due to their high plasticity.
Clays with high plasticity are composed of fine-grained particles which are prone to a huge
volume change whenever water content differs. Holtz & Kovacs (1981) mentioned that clays
with a plasticity index larger than 35 percent are highly plastic. Clay moisture content
decreases and increases depending on the environmental conditions surrounding it resulting
in shrinkage and swell, this change in moisture is regarded as the main reason for the change
in volume. Also, the mineralogy, soil structure, specific surface and stress history all
contribute to the volume change (Pusch & Yong, 2006).
Clays with swell potentials are found in semi-arid regions of tropical and climate temperature
zones worldwide (Chen, 1988). It is a challenging issue for engineers to design substructures
on expansive clays, in order to bypass that, the volume change (swell and shrinkage)
characteristics of expansive clays must be considered before engineering structures are built.
In the United Kingdom, the annual damage caused by expansive clays had reached one
hundred and fifty million pounds, almost one billion dollars in the United States of America
and billions worldwide (Das, 2009). Also, considerable infrastructure damages had been
reported caused by high plastic clays due to their shrink and swell behaviour (Jones & Holtz,
1973).
It was strongly understood that improper solutions used by engineers are the cause of
structural damages until it was then realized that lack of surveys and quantification of the
expansive potentiality of expansive clays during geotechnical site investigation is the main
reason for the damages (Das, 2009). The necessity of determining swelling clays and
evaluating their swell potentiality before construction will definitely help in reducing future
damages. Swelling clays can be determined by either laboratory method or on the field,
where the clay behaviour such as swelling potential, swelling pressure, shrinkage, strength
and permeability can be classified. Geotechnical engineers utilize different interpretations
2
and methods when determining and classifying expansive clays. Through the chemical
composition, physical properties and mineralogical contents, expansive clay classifications
in accordance with the swell degree from non-expansive to highly-expansive can be known.
Different approaches are used for investigating the swelling potentials of clays, but the most
commonly used ones are the Micro-scale and Macro scale. Mineralogy of clay samples are
determined by micro-scale test, an example of such a test is done by Methylene blue test
induced by different methods. Indirect and direct measurements of the swelling potentials of
clays are done by macro-scale using different techniques. The three most commonly used
techniques for taking measurements are Free Swelling test, Load-Back test and Constant
Volume test.
An oedometer device is generally used in measuring the swelling properties of clays. In most
of the experimental swell pressure test, one-dimensional consolidation oedometer is applied
for acquiring swell results of clays with high plasticity (Attom & Barakat, 2000). Another
method like Free Swell is also used for the determination of swelling pressure (W. G. Holtz
& Gibbs, 1956).
1.2 An Overview of Swelling Clays in Cyprus
The geology and climate of Cyprus made expansive clay formations in some parts of the
Island (Sridharan and Gurtug, 2004). The majority of swelling clays in North Cyprus occur
in a geological unit of Neogene. The greatest amount of damages caused by swelling clays
are contained in stratigraphic sequence ranging in age from Miocene to Quaternary.
Therefore, the island’s geological and geotechnical evolution contributed to the swelling
clay formations. The geological location of Cyprus is at the triple junction of Africa, Eurasia
and Arabian plates. Through the complex tectonical and sedimentary process, the triple
junction intersection zone occurred. Complex geotectonic activities were found in Cyprus
during Late Cenozoic (Constantinou et al., 2002).
Cyprus is covered with marly and clayey formations bearing montmorillonite clays to
bentonitic group of clays. Kythrea formation, Mamonia complex, Nicosia formation,
Alluvial soils and Bentonitic clays are the most common soils of Cyprus.
3
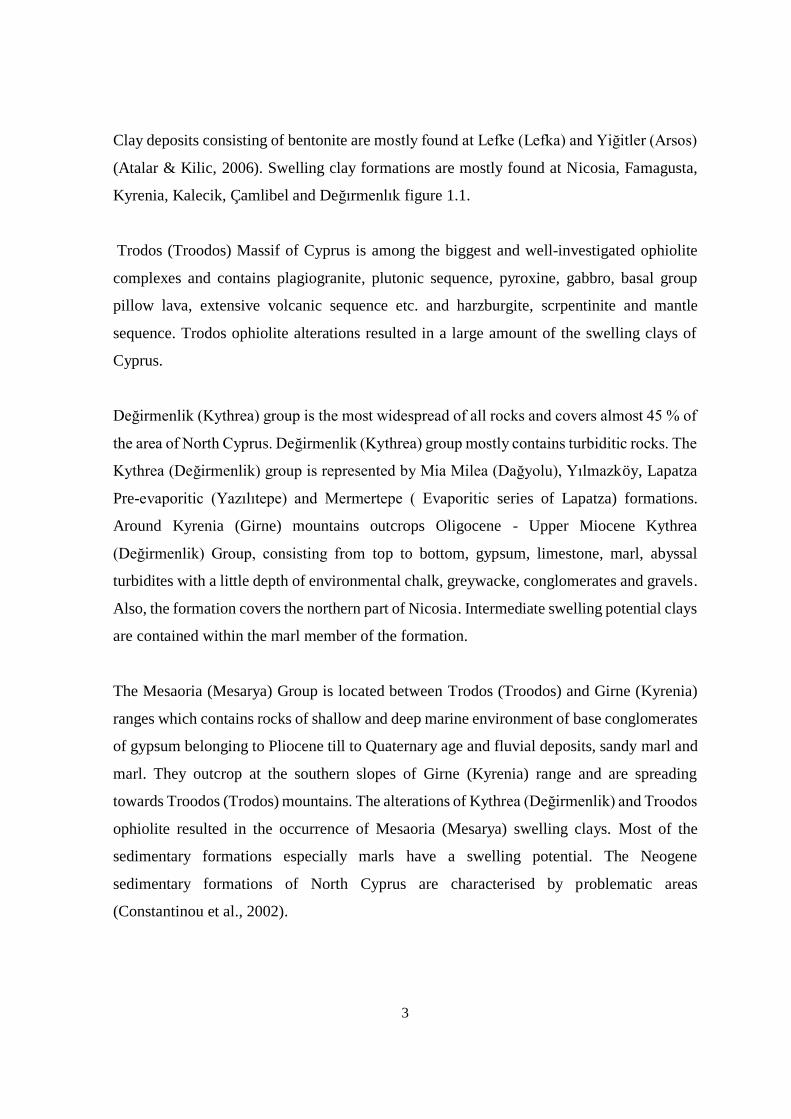
Clay deposits consisting of bentonite are mostly found at Lefke (Lefka) and Yiğitler (Arsos)
(Atalar & Kilic, 2006). Swelling clay formations are mostly found at Nicosia, Famagusta,
Kyrenia, Kalecik, Çamlibel and Değırmenlık figure 1.1.
Trodos (Troodos) Massif of Cyprus is among the biggest and well-investigated ophiolite
complexes and contains plagiogranite, plutonic sequence, pyroxine, gabbro, basal group
pillow lava, extensive volcanic sequence etc. and harzburgite, scrpentinite and mantle
sequence. Trodos ophiolite alterations resulted in a large amount of the swelling clays of
Cyprus.
Değirmenlik (Kythrea) group is the most widespread of all rocks and covers almost 45 % of
the area of North Cyprus. Değirmenlik (Kythrea) group mostly contains turbiditic rocks. The
Kythrea (Değirmenlik) group is represented by Mia Milea (Dağyolu), Yılmazköy, Lapatza
Pre-evaporitic (Yazılıtepe) and Mermertepe ( Evaporitic series of Lapatza) formations.
Around Kyrenia (Girne) mountains outcrops Oligocene - Upper Miocene Kythrea
(Değirmenlik) Group, consisting from top to bottom, gypsum, limestone, marl, abyssal
turbidites with a little depth of environmental chalk, greywacke, conglomerates and gravels.
Also, the formation covers the northern part of Nicosia. Intermediate swelling potential clays
are contained within the marl member of the formation.
The Mesaoria (Mesarya) Group is located between Trodos (Troodos) and Girne (Kyrenia)
ranges which contains rocks of shallow and deep marine environment of base conglomerates
of gypsum belonging to Pliocene till to Quaternary age and fluvial deposits, sandy marl and
marl. They outcrop at the southern slopes of Girne (Kyrenia) range and are spreading
towards Troodos (Trodos) mountains. The alterations of Kythrea (Değirmenlik) and Troodos
ophiolite resulted in the occurrence of Mesaoria (Mesarya) swelling clays. Most of the
sedimentary formations especially marls have a swelling potential. The Neogene
sedimentary formations of North Cyprus are characterised by problematic areas
(Constantinou et al., 2002).
4
Figure 1.1: Swelling clay settlements in Cyprus (Constantinou et al., 2002)
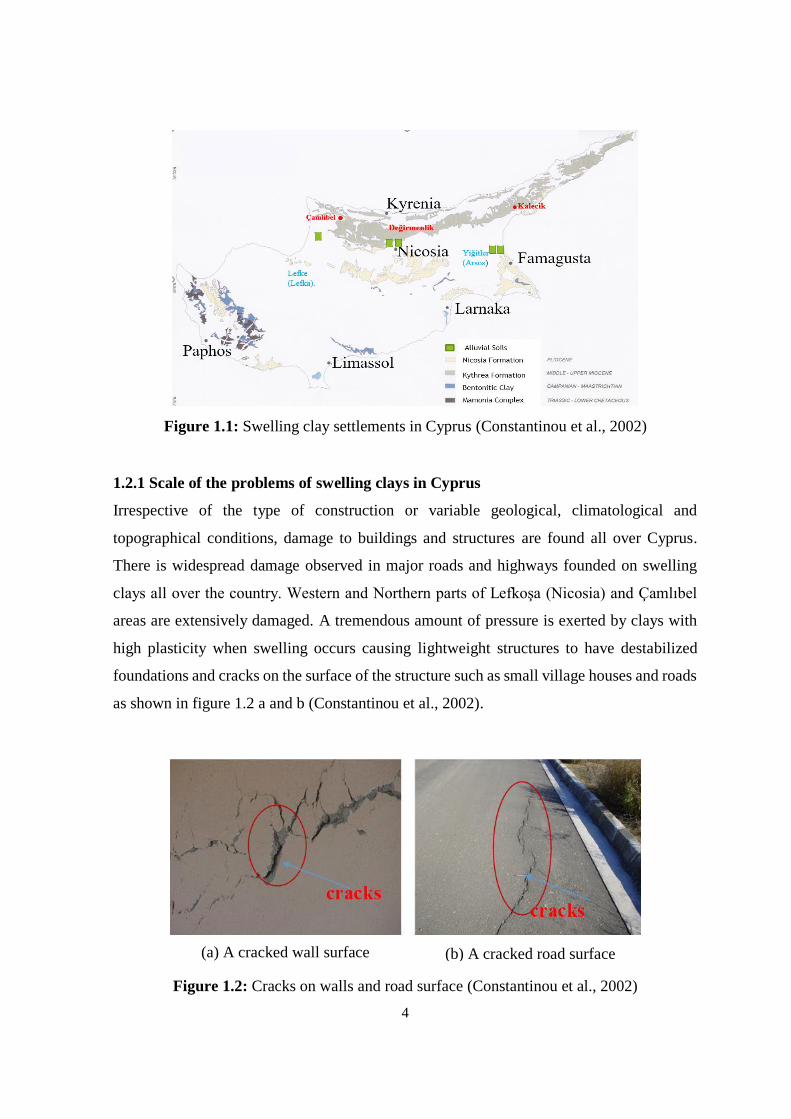
1.2.1 Scale of the problems of swelling clays in Cyprus
Irrespective of the type of construction or variable geological, climatological and
topographical conditions, damage to buildings and structures are found all over Cyprus.
There is widespread damage observed in major roads and highways founded on swelling
clays all over the country. Western and Northern parts of Lefkoşa (Nicosia) and Çamlıbel
areas are extensively damaged. A tremendous amount of pressure is exerted by clays with
high plasticity when swelling occurs causing lightweight structures to have destabilized
foundations and cracks on the surface of the structure such as small village houses and roads
as shown in figure 1.2 a and b (Constantinou et al., 2002).
Figure 1.2: Cracks on walls and road surface (Constantinou et al., 2002)
(a) A cracked wall surface (b) A cracked road surface
5
1.3 Aim of the Study
The main aim of this thesis is to provide properties and characteristics of the obtained
samples by applying different laboratory experiments in order to be able to understand the
nature and mechanical behaviour of the soils before design and construction of light civil
structures avoiding damages that might occur due to the different possible movements of
expansive clays.
1.4 Thesis Outline
Chapter 1: Background information and thesis outline are introduced in this chapter.
Chapter 2: The knowledge of expansive clays obtained from experiments done by previous
literature reviews are the main objective of this chapter. All the work done in this thesis
relies on the fundamental concepts provided by previous literature review, existing
experimental works done by others are linked to this research in order to correlate between
them for knowing the correct procedures of the experimental lab work and expected results.
Chapter 3: The materials used and experimental methods implemented are discussed in this
chapter. Materials preparation, experimental procedures and equipment used in this thesis
are also included.
Chapter 4: Experimental results obtained are all included in this chapter. The investigated
clay properties will be correlated with its swelling behaviour. In addition, discussions will
be made between the correlated data.
Chapter 5: Conclusion and recommendation for future comments.
6
CHAPTER 2
LITERATURE REVIEW
2.1 Introduction
Clays are not easy for understanding due to their different behaviours. As engineers what is
most important is their characteristics, the state or fact of being likely or liable to be
influenced by wetting or drying without any subjected loads resulting in a volumetric change
of the soil is a major concern. Water content differs seasonally, due to this, periodical change
of swelling and shrinkage occurs. Structures are affected by the active clay response to the
periods of evaporation and precipitation resulting in volume change due to water variation.
Structural damage is caused by rising and movement of the ground when a change in volume
occurs. As a consequence of that, they are a major concern when designing and constructing
foundations.
The factors that mainly affects the soil volumetric change potentials are clay mineral type,
the ratio of voids and moisture content of a certain soil (Bell, 2000; Ferber et al, 2009; Jones
& Jones, 1987; Mitchell & van Genuchten, 1992). Expansive clays moisture content changes
when wetted or dried which leads to void ratio and volume change of the soil. Wetting dry
expansive clay sample will increase the volume of voids, it happens because there is a direct
relation between the voids and water content.
Expansion undergoes three stages, primary, secondary and no expansion stage (Day, 1999).
During the primary stage, cracks developed during drying are closed which normally
happens at a very fast rate. The secondary stage involves reduction of entrapped air and
micro-cracks starts to close. Finally, the third stage, the void ratio or volume will have no
further change. Likewise, the dried soil has three stages due to gradual drying and is
commonly known as structural shrinkage, normal shrinkage, and residual shrinkage (Haines,
1923). The soil structure and resistance caused by inter-particles bonds are mainly what
determines the range of each process (Bell, 2000; Popescu, 1979). A change in volume is
observed for soil undergoing the structural and residual shrinkage stage, where the total
volume change is smaller compared to water volume change but stays the same in normal
7
shrinkage stage. Haines (1923) mentioned that at the beginning of the residual stage
(shrinkage limit), the volume of soils decreases, the decrease is less than the volume of the
escaping water as particles approach a contact point. Also, no further change for shrinkage
occurs as the water still evaporates.
Compaction of soils is understood as variables obtained in percentages and unit weight,
namely the moisture content of a compacted sample with respect to its optimum, attained
density and method used. The influence of fabric on unsaturated soil shall be considered as
an important factor, mostly for compacted soil (Alonso et al, 1986). The word “fabric” can
be described as the geometric arrangement of soil particles. Some aspects of compaction
procedures were defined by Gens (1996), such as compactive effort and the content of water
used during compaction, which significantly influences the following mechanical (physical)
manner (behaviour) of fine-grained soil after compaction. Different compaction procedures
affect the subsequent mechanical behaviour which will result in various forms of the
produced soil fabric (Barden & Sides, 1970; Seed & Chan, 1959). Some fine-grained soil
data which had been compacted was reported by Delage & Lefebvre, (1984); and Lapierre
et al., (1990) mentioning that the dry part of optimum moisture content, bimodal distribution
(not homogenous) of pore size was realized after the fine-grained soil was compacted. On
the other hand, the wet part of the optimum moisture content, soil tend to have a fabric with
unimodal (partially homogenous) distribution of pore size. Physical and mechanical
behaviours of soil are determined by bimodal/unimodal distribution as mentioned in the
previous sentence. Expansive soils behaviour was also studied by other researchers like
Jotisankasa et al, (2009); Sharma, (1998); Sivakumaret al, (2006); Wheeler et al, (2003),
they conducted a modified triaxial cell test on unsaturated samples with varying specific
volume with suction. They mentioned that values obtained for specific volume during
wetting (decreased suction) and drying (increased suction) for a given suction are different
for drying and wetting due to the hysteresis, the phenomenon in which the value of a physical
property lags behind changes in the effect causing it. Expansive soil moisture content and
the ratio of voids changes during drying and wetting, therefore void ratio is a function of
suction since the water content is contingent on the suction rate. A major problem is that
researches and investigations related to the variations of void ratio and suction which is
8
dependent to water content for expansive soil during drying and wetting are limited, while
the deformation behaviour is not (Estabragh et al., 2015).
A brief summary of the techniques, methodologies and investigations made by previous
studies are summarized in this chapter. These studies present the knowledge of
understanding the clay structure, mineralogy, geochemistry and swelling behaviour,
therefore can be a guide to our clay investigation as the laboratory experiment work
commence.
2.2 Mineralogy and Particles of Clay
Clay mineral refers to minerals which interfere with clay’s plasticity and hardens upon
drying. Scott, (1963) mentioned the engineering behaviour and properties of a soil depends
on the type of mineral within it. When the amount of clay minerals increases the general
particle size of a soil decreases resulting in an excessive interparticle force projecting its
effects on the behaviour of soil. Soil properties and behaviour might likely change when
influenced by the type of minerals, small soil particles and interparticle forces. Engineers
main concern is to understand the soil mechanical behaviour caused by water seepage.
Mineralogy in soil is a dominant of shape, size and particles properties. The mineralogical
structure of the soil helps in determining the physical and chemical properties of the soil.
Also, the degree of soil expansion can be determined by the soil mineral. The definition of
clay can be understood by their particle size distribution, a commonly used way for
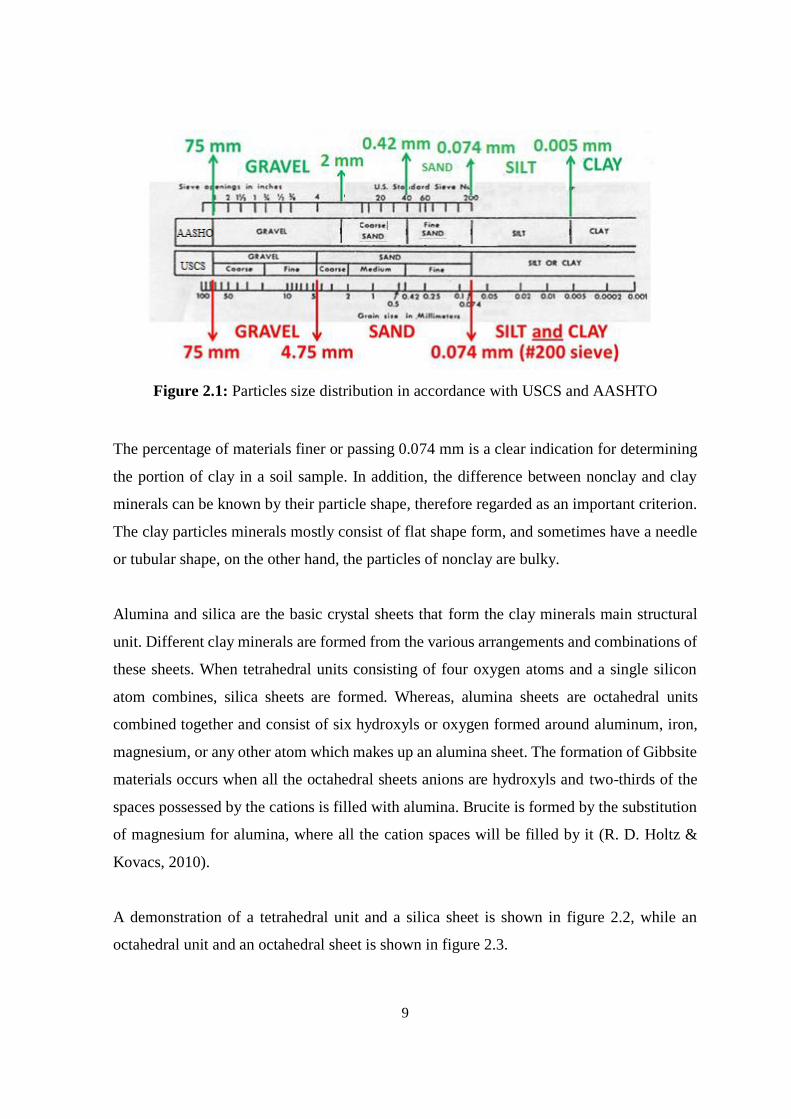
understanding the particle size range is shown in figure 2.1. The soil particles constituents
less than 0.075 mm are regarded as silts and clay particles. Mitchell & Soga, (2005) stated
that through the special minerals found in clays, recognizing them will be much easier, also
mentioning some points on how to know them:
• The size of fine particles
• Plasticity
• High weathering resistance
• Net negative electrical charge
9
Figure 2.1: Particles size distribution in accordance with USCS and AASHTO
The percentage of materials finer or passing 0.074 mm is a clear indication for determining
the portion of clay in a soil sample. In addition, the difference between nonclay and clay
minerals can be known by their particle shape, therefore regarded as an important criterion.
The clay particles minerals mostly consist of flat shape form, and sometimes have a needle
or tubular shape, on the other hand, the particles of nonclay are bulky.
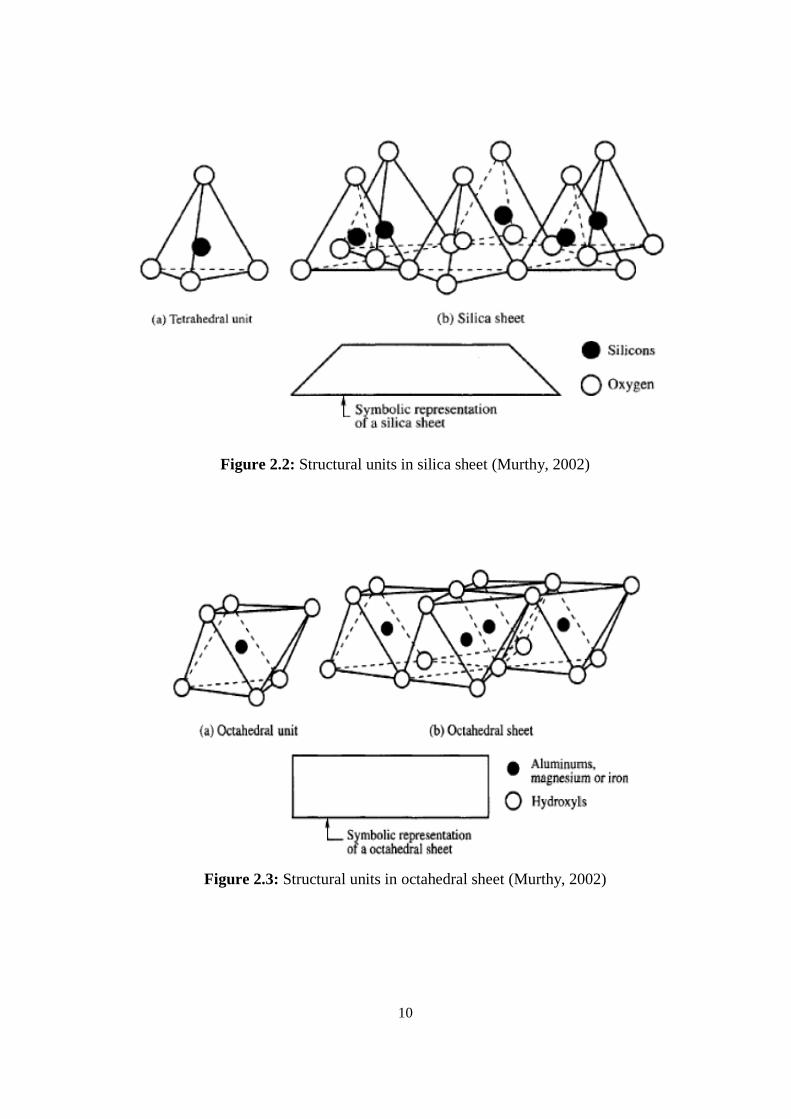
Alumina and silica are the basic crystal sheets that form the clay minerals main structural
unit. Different clay minerals are formed from the various arrangements and combinations of
these sheets. When tetrahedral units consisting of four oxygen atoms and a single silicon
atom combines, silica sheets are formed. Whereas, alumina sheets are octahedral units
combined together and consist of six hydroxyls or oxygen formed around aluminum, iron,
magnesium, or any other atom which makes up an alumina sheet. The formation of Gibbsite
materials occurs when all the octahedral sheets anions are hydroxyls and two-thirds of the
spaces possessed by the cations is filled with alumina. Brucite is formed by the substitution
of magnesium for alumina, where all the cation spaces will be filled by it (R. D. Holtz &
Kovacs, 2010).
A demonstration of a tetrahedral unit and a silica sheet is shown in figure 2.2, while an
octahedral unit and an octahedral sheet is shown in figure 2.3.
10
Figure 2.2: Structural units in silica sheet (Murthy, 2002)
Figure 2.3: Structural units in octahedral sheet (Murthy, 2002)
11
Clay minerals are classified into three, which are:
• Kaolinite.
• Illite.
• Smectite.
They all consist of a crystal layer formation, mineralogy of clay mineral differs by the type
of bonds within structural units and the arrangement of different physical layers. The
connection between layers is due to bonding, where basic bonds namely, potassium bonds,
van der Waals bonds and hydrogen bonds are responsible for the linkage.
“Specific Surface Area” (SSA) is defined as the overall surface area of a grain induced as
square centimetres per cubic meter or per gram. It’s a parameter that changes increasingly
from kaolinite to smectites mineral. Increase and decrease in reaction with water is directly
dependent on SSA. Reactivity of soil with water and clay minerals classification is induced
by Atterberg limits (liquid limit, plastic limit and shrinkage limit) in geotechnical
engineering. White (1949) had previous studies which mentioned that high liquid and plastic
limits belongs to the smectite group and has the lowest shrinkage limit of all clay minerals.
Activity is another parameter used for clay minerals classification. The clay minerals activity
values can be determined by the percentage of clay particles and plasticity index, where the
swelling potential of a clay increases by increasing activity (White, 1949).
2.2.1 Kaolinite
Kaolinite is a whitish mineral with a soft formation having a 2SiO2Al2O32H2O chemical
composition produced by the chemical weathering of alumina silicate minerals. Kaolin,
sometimes referred to as China clay, have a considerable amount of kaolinite which makes
them of great interest to some industries (Pohl, 2011). Repeated layers of dual-layered sheets
are mostly found in kaolin clay minerals. Kaolin is known through the layers of silicate
minerals it poses, where oxygen atoms connect one tetrahedral sheet to a single alumina
octahedral sheet (Deer,1992). Secondary valence forces and hydrogen bonding hold repeated
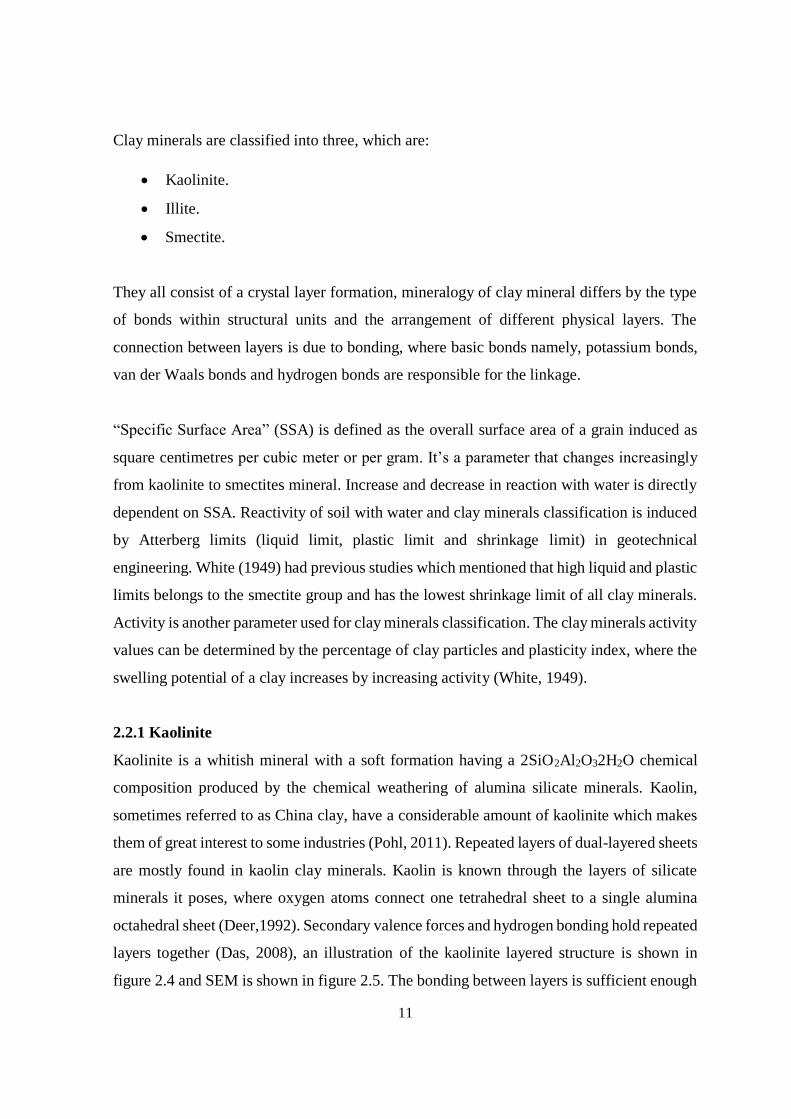
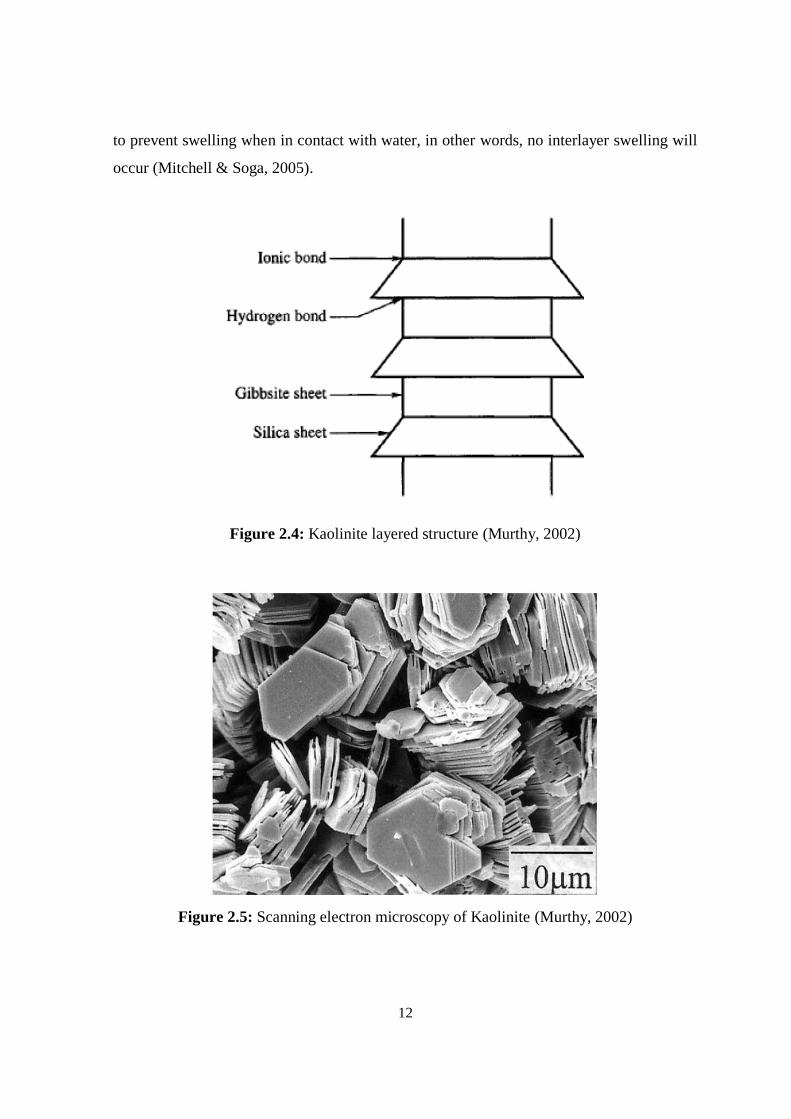
layers together (Das, 2008), an illustration of the kaolinite layered structure is shown in
figure 2.4 and SEM is shown in figure 2.5. The bonding between layers is sufficient enough
12
to prevent swelling when in contact with water, in other words, no interlayer swelling will
occur (Mitchell & Soga, 2005).
Figure 2.4: Kaolinite layered structure (Murthy, 2002)
Figure 2.5: Scanning electron microscopy of Kaolinite (Murthy, 2002)
13
The stacking of kaolinite sheets on each other will give access to the hydroxyls of the
octahedral sheet to be drawn towards the oxygen of the silica’s tetrahedron sheets via oxygen
bonds. When covalent and ionic bonds are weak as compared with primary bonds, cleavage
occurs. Crystals of almost seventy to one-hundred layers thick are produced due to the
structural sheets developing in two directions (Oweis, 1998).
2.2.2 Illite
Illite is produced by the weathering of felsic silicates and feldspar, it has a close resemblance
to muscovite in its mineral composition. The chemical formula for illite is (K, H3O) (Al, Mg,
Fe)2 (Si, Al)4O10 [(OH)2, (H2O)], where layers of alumina-silicate or sometimes referred to
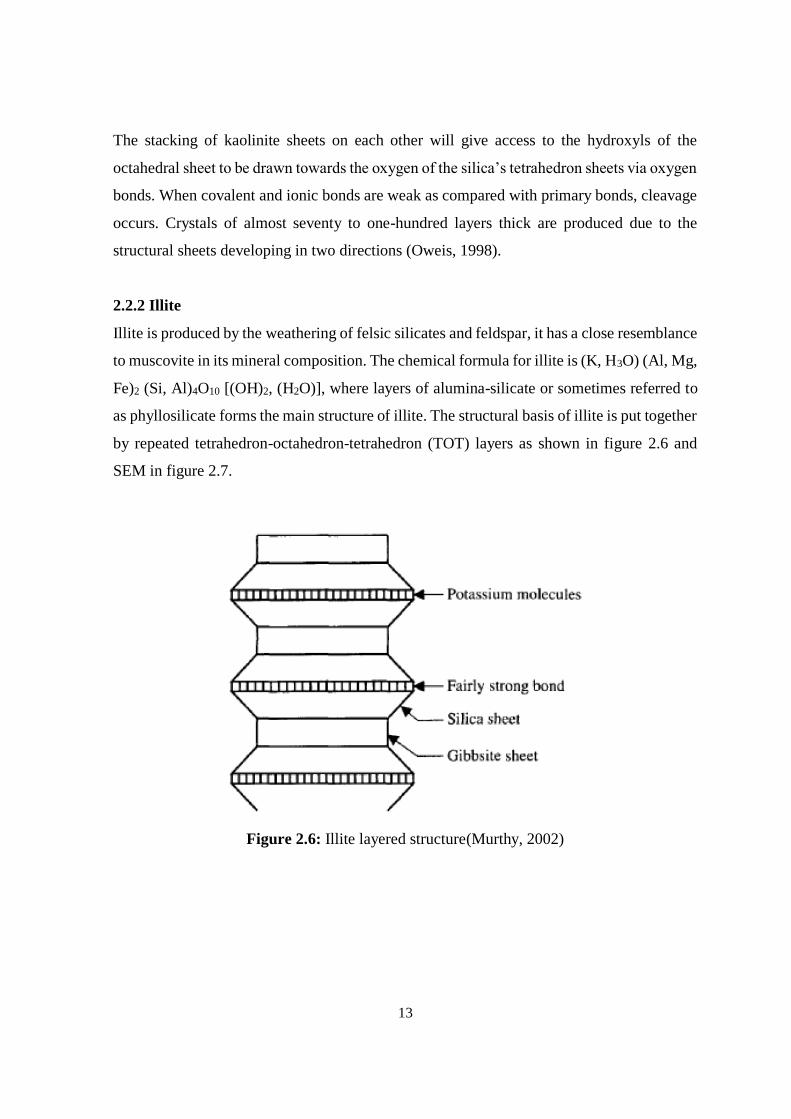
as phyllosilicate forms the main structure of illite. The structural basis of illite is put together
by repeated tetrahedron-octahedron-tetrahedron (TOT) layers as shown in figure 2.6 and
SEM in figure 2.7.
Figure 2.6: Illite layered structure(Murthy, 2002)
14
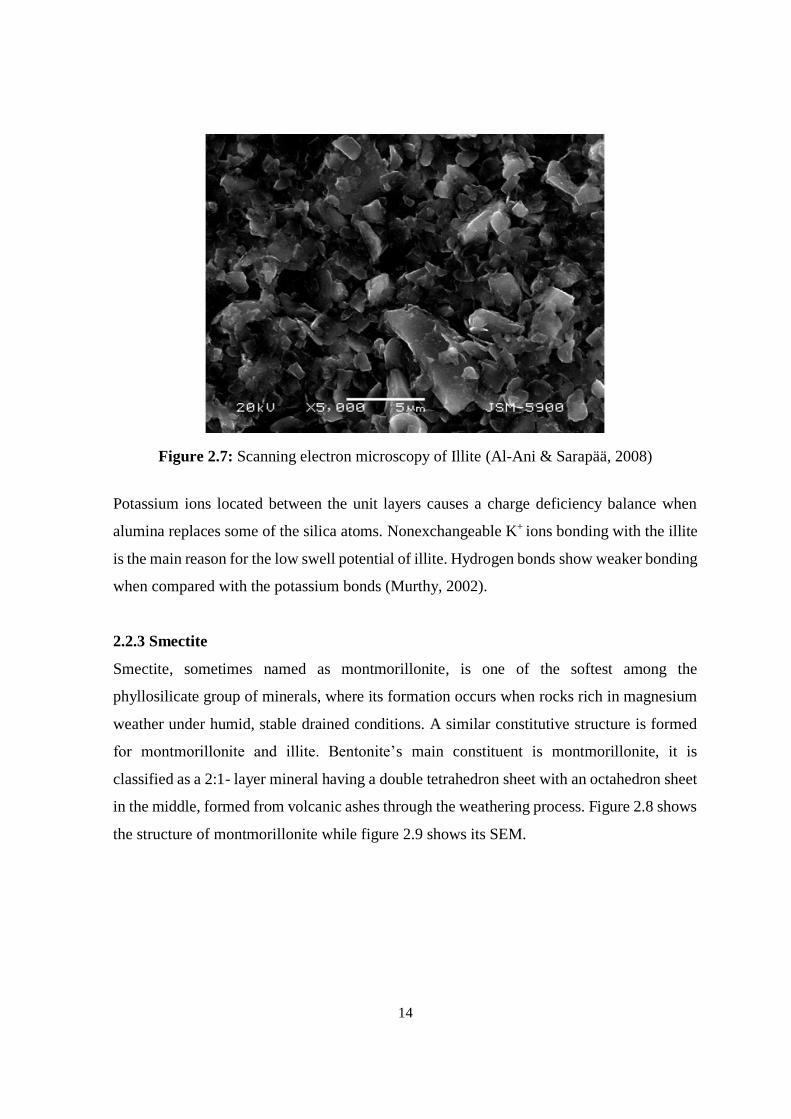
Figure 2.7: Scanning electron microscopy of Illite (Al-Ani & Sarapää, 2008)
Potassium ions located between the unit layers causes a charge deficiency balance when
alumina replaces some of the silica atoms. Nonexchangeable K+ ions bonding with the illite
is the main reason for the low swell potential of illite. Hydrogen bonds show weaker bonding
when compared with the potassium bonds (Murthy, 2002).
2.2.3 Smectite
Smectite, sometimes named as montmorillonite, is one of the softest among the
phyllosilicate group of minerals, where its formation occurs when rocks rich in magnesium
weather under humid, stable drained conditions. A similar constitutive structure is formed
for montmorillonite and illite. Bentonite’s main constituent is montmorillonite, it is
classified as a 2:1- layer mineral having a double tetrahedron sheet with an octahedron sheet
in the middle, formed from volcanic ashes through the weathering process. Figure 2.8 shows
the structure of montmorillonite while figure 2.9 shows its SEM.
15
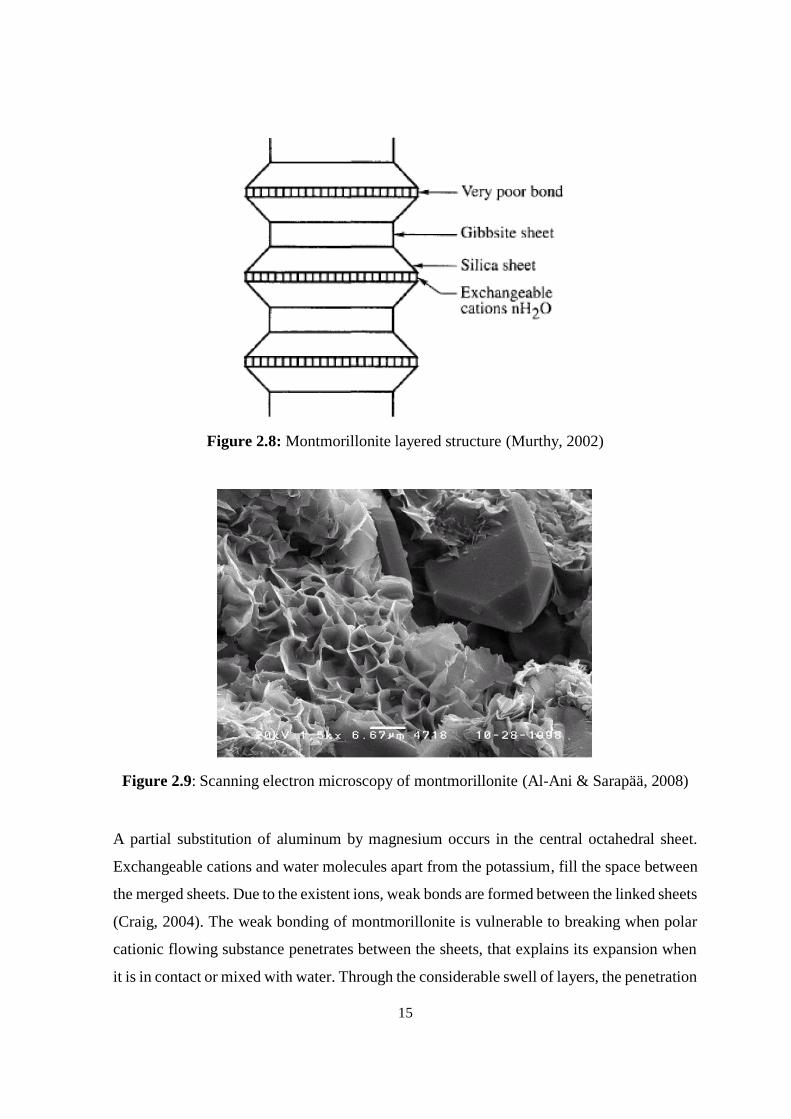
Figure 2.8: Montmorillonite layered structure (Murthy, 2002)
Figure 2.9: Scanning electron microscopy of montmorillonite (Al-Ani & Sarapää, 2008)
A partial substitution of aluminum by magnesium occurs in the central octahedral sheet.
Exchangeable cations and water molecules apart from the potassium, fill the space between
the merged sheets. Due to the existent ions, weak bonds are formed between the linked sheets
(Craig, 2004). The weak bonding of montmorillonite is vulnerable to breaking when polar
cationic flowing substance penetrates between the sheets, that explains its expansion when
it is in contact or mixed with water. Through the considerable swell of layers, the penetration

16
of water can be easily found where particles with smaller size having a bigger SSA are
endured (Oweis and Khera, 1998). High swelling potentials are always found in soils which
consists of a large amount of montmorillonite which causes shrinkage when dried out and
regarded as a distinctive mineral among other groups due to its high swelling potential, liquid
limit and activity in clay. There are two main varieties of montmorillonite, sodium
montmorillonite having a high swell capacity and calcium montmorillonite having a lower
swell capacity. Another type of montmorillonite is bentonite which contains both calcium
bentonite and sodium bentonite.
2.3 Clay Structure
The orientation of soil particles and the gaps between them directly influences the interaction
of soil particles. The basic elementary structures of clay are divided into two, flocculated
and dispersed as illustrated in figure 2.10 a and b.
Figure 2.10: Dispersed and flocculated structures (Lambe and Withman, 1969)
Flocculated structures are made when the net particle force is attractive. On the other hand,
dispersed structures are formed when the net particle force is repulsive. Dispersed clays have
a lower swelling tendency than flocculated clays because of the smaller gaps between their
particles.
(b) Flocculated
(a) Dispersed

17
2.4 Diffuse Double Layer
Negatively charged surfaces of clay particles attract or magnetize the existing cations in the
water pore by means of electrostatic force. Altogether, cations frequently start to diffuse
back to less concentrated areas of the fluid’s pore (Van Olphen, 1977), figure 2.11 below
shows diffusion of double layer theory.
Figure 2.11: Distribution of anions and cations adjacent to a clay surface in accordance to
diffusion theory of double layers (Keijzer, 2000)
Water is the main cause of volume increase and not the cations where the high concentration
of cations holds the water. Diffuse Double Layer (DDL) is the spatial distribution of ions in
the fluid which surrounds the charged surfaces caused by two opposite directions. The
thickness of double layer diffusion is normally affected by two factors:
1. Valence
2. Concentration of cations
Cations with high ionic valence might cause the double layer to have a smaller thickness. In
contrast, cations with lower valence can cause bigger thickness of diffuse double layer.
Mitchell & Soga, (2005) mentioned that a lower concentration of cations can cause an
increase in swelling and DDL. A repulsive force is formed between DDL systems when the
18
surface of clay particles contains a high concentration of cations. Another parameter which
affects the thickness of DDL is temperature, where the rise in temperature causes an increase
in thickness.
2.5 Cation Exchange Capacity
“Particles of organic matter in soils and cations held on the clay are exchangeable”. An
example of that is when calcium cations replace hydrogen cations or potassium cations, and
vice versa. Cation Exchange Capacity (CEC) of soils occurs when charge deficiency on clay
particles surface is balanced by a certain number of exchangeable cations. Higher surface
activity and water absorption potentials will lead to a higher CEC. Furthermore, Oweis
(1998) explained soil’s CEC as “the number of cations in milliequivalents that neutralize
one hundred grams of dry clay (meq/100 g)”. when a milligram of hydrogen is displaced or
combined with one milligram of any ion, it is then defined as one milliequivalent (Oweis,
1998). An illustration of CEC different values with respect to some clay minerals are shown
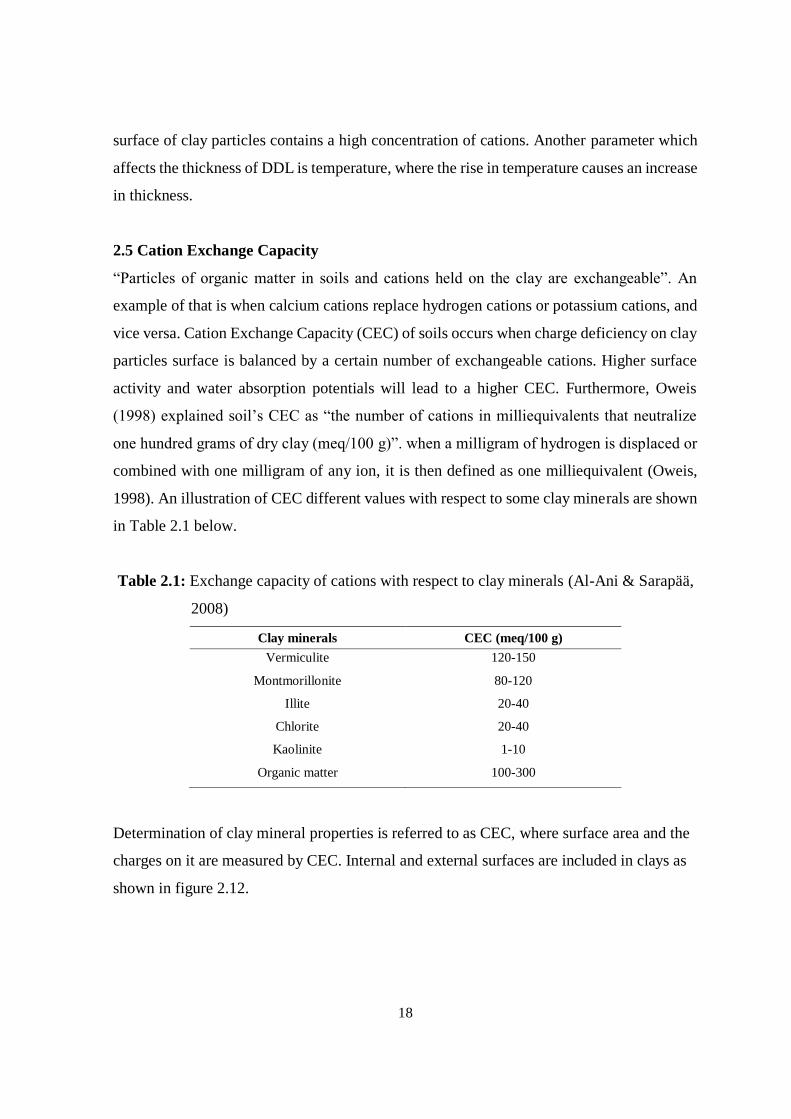
in Table 2.1 below.
Table 2.1: Exchange capacity of cations with respect to clay minerals (Al-Ani & Sarapää,
2008)
Clay minerals CEC (meq/100 g)
Vermiculite 120-150
Montmorillonite 80-120
Illite 20-40
Chlorite 20-40
Kaolinite 1-10
Organic matter 100-300
Determination of clay mineral properties is referred to as CEC, where surface area and the
charges on it are measured by CEC. Internal and external surfaces are included in clays as
shown in figure 2.12.
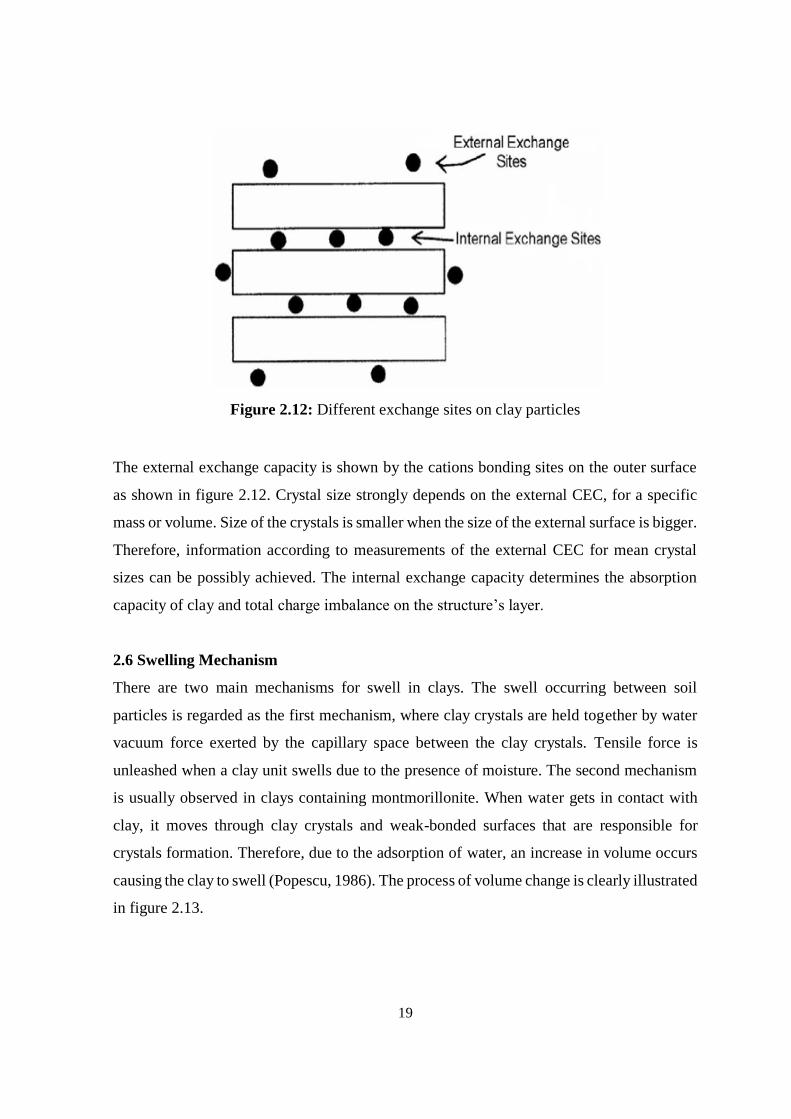
19
Figure 2.12: Different exchange sites on clay particles
The external exchange capacity is shown by the cations bonding sites on the outer surface
as shown in figure 2.12. Crystal size strongly depends on the external CEC, for a specific
mass or volume. Size of the crystals is smaller when the size of the external surface is bigger.
Therefore, information according to measurements of the external CEC for mean crystal
sizes can be possibly achieved. The internal exchange capacity determines the absorption
capacity of clay and total charge imbalance on the structure’s layer.
2.6 Swelling Mechanism
There are two main mechanisms for swell in clays. The swell occurring between soil
particles is regarded as the first mechanism, where clay crystals are held together by water
vacuum force exerted by the capillary space between the clay crystals. Tensile force is
unleashed when a clay unit swells due to the presence of moisture. The second mechanism
is usually observed in clays containing montmorillonite. When water gets in contact with
clay, it moves through clay crystals and weak-bonded surfaces that are responsible for
crystals formation. Therefore, due to the adsorption of water, an increase in volume occurs
causing the clay to swell (Popescu, 1986). The process of volume change is clearly illustrated
in figure 2.13.
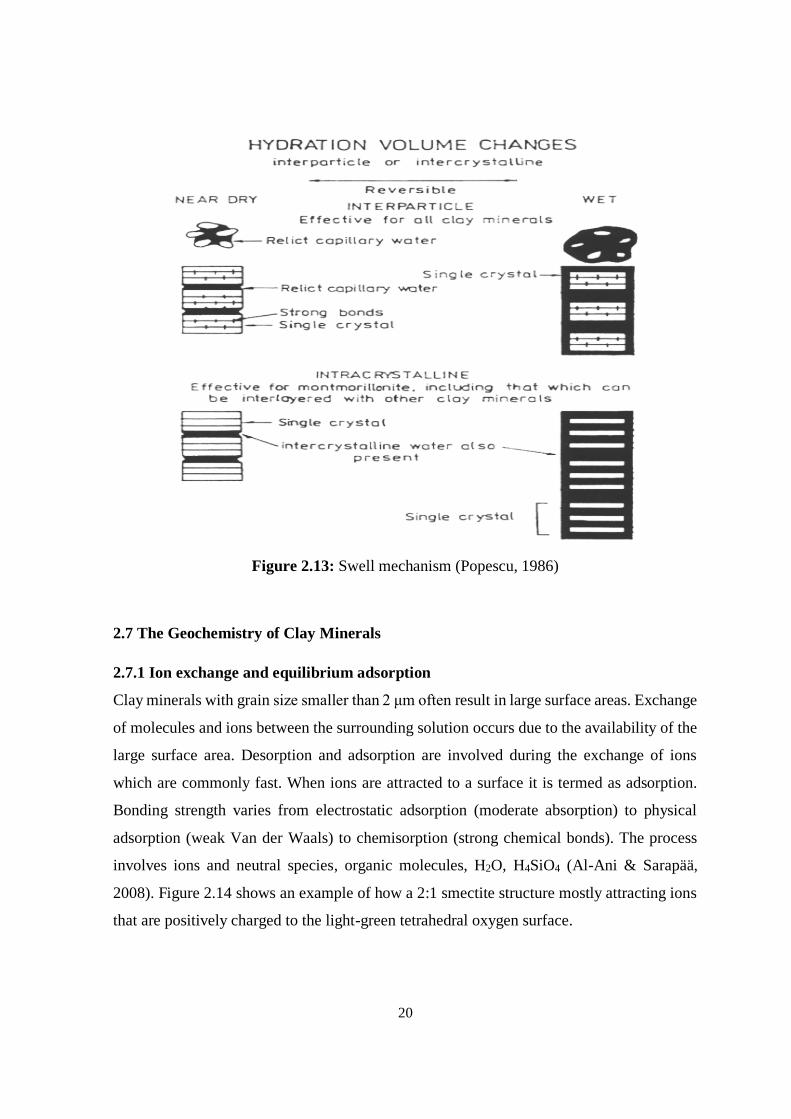
20
Figure 2.13: Swell mechanism (Popescu, 1986)
2.7 The Geochemistry of Clay Minerals
2.7.1 Ion exchange and equilibrium adsorption
Clay minerals with grain size smaller than 2 μm often result in large surface areas. Exchange
of molecules and ions between the surrounding solution occurs due to the availability of the
large surface area. Desorption and adsorption are involved during the exchange of ions
which are commonly fast. When ions are attracted to a surface it is termed as adsorption.
Bonding strength varies from electrostatic adsorption (moderate absorption) to physical
adsorption (weak Van der Waals) to chemisorption (strong chemical bonds). The process
involves ions and neutral species, organic molecules, H2O, H4SiO4 (Al-Ani & Sarapää,
2008). Figure 2.14 shows an example of how a 2:1 smectite structure mostly attracting ions
that are positively charged to the light-green tetrahedral oxygen surface.
21
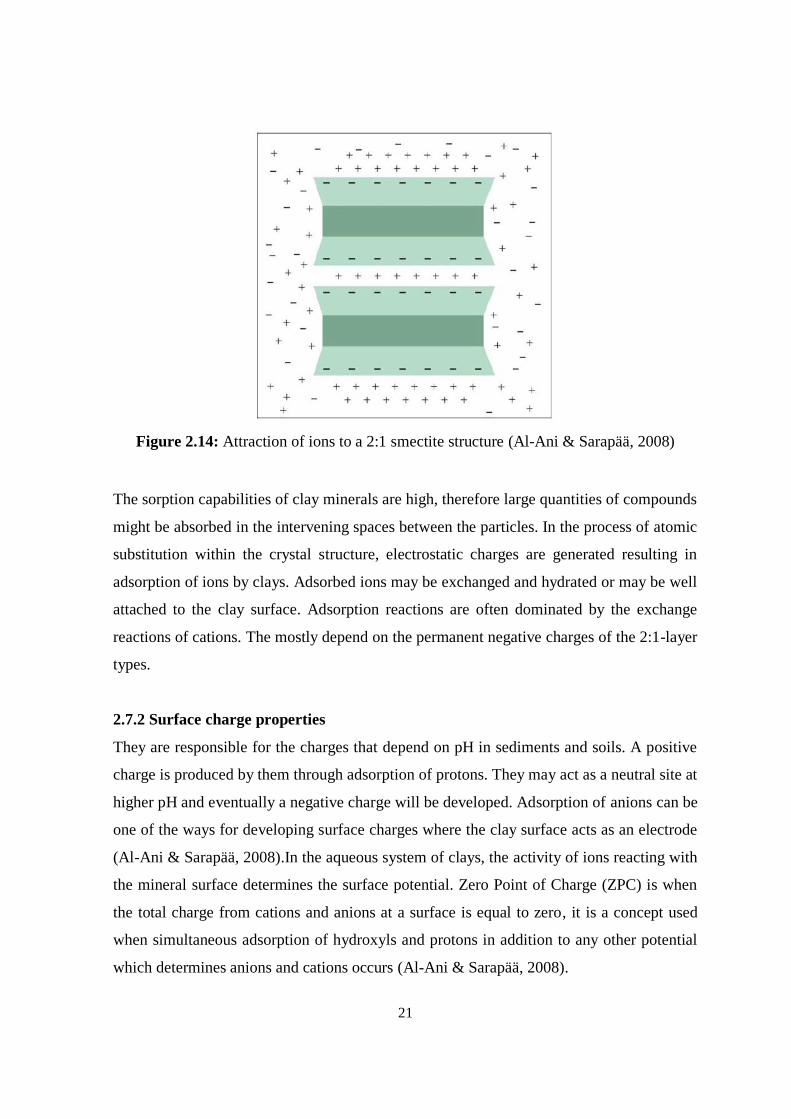
Figure 2.14: Attraction of ions to a 2:1 smectite structure (Al-Ani & Sarapää, 2008)
The sorption capabilities of clay minerals are high, therefore large quantities of compounds
might be absorbed in the intervening spaces between the particles. In the process of atomic
substitution within the crystal structure, electrostatic charges are generated resulting in
adsorption of ions by clays. Adsorbed ions may be exchanged and hydrated or may be well
attached to the clay surface. Adsorption reactions are often dominated by the exchange
reactions of cations. The mostly depend on the permanent negative charges of the 2:1-layer
types.
2.7.2 Surface charge properties
They are responsible for the charges that depend on pH in sediments and soils. A positive
charge is produced by them through adsorption of protons. They may act as a neutral site at
higher pH and eventually a negative charge will be developed. Adsorption of anions can be
one of the ways for developing surface charges where the clay surface acts as an electrode
(Al-Ani & Sarapää, 2008).In the aqueous system of clays, the activity of ions reacting with
the mineral surface determines the surface potential. Zero Point of Charge (ZPC) is when
the total charge from cations and anions at a surface is equal to zero, it is a concept used
when simultaneous adsorption of hydroxyls and protons in addition to any other potential
which determines anions and cations occurs (Al-Ani & Sarapää, 2008).
22
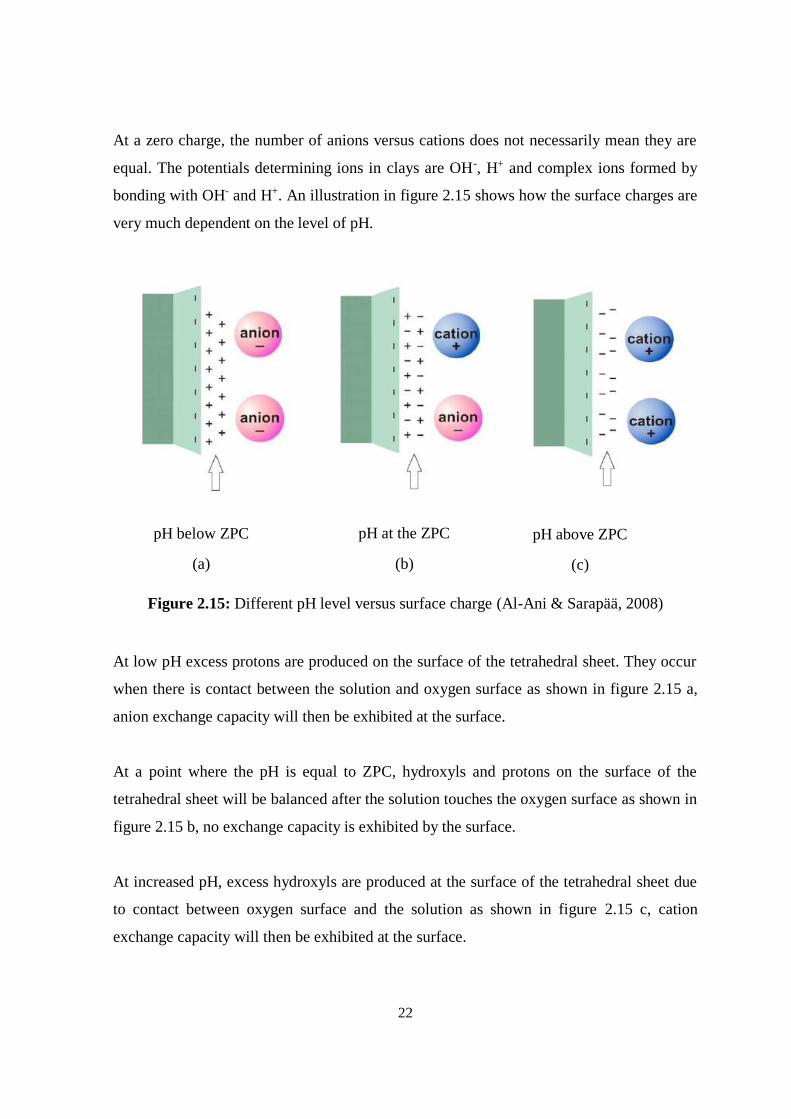
At a zero charge, the number of anions versus cations does not necessarily mean they are
equal. The potentials determining ions in clays are OH-, H+ and complex ions formed by
bonding with OH- and H+. An illustration in figure 2.15 shows how the surface charges are
very much dependent on the level of pH.
Figure 2.15: Different pH level versus surface charge (Al-Ani & Sarapää, 2008)
At low pH excess protons are produced on the surface of the tetrahedral sheet. They occur
when there is contact between the solution and oxygen surface as shown in figure 2.15 a,
anion exchange capacity will then be exhibited at the surface.
At a point where the pH is equal to ZPC, hydroxyls and protons on the surface of the
tetrahedral sheet will be balanced after the solution touches the oxygen surface as shown in
figure 2.15 b, no exchange capacity is exhibited by the surface.
At increased pH, excess hydroxyls are produced at the surface of the tetrahedral sheet due
to contact between oxygen surface and the solution as shown in figure 2.15 c, cation
exchange capacity will then be exhibited at the surface.
pH below ZPC
(a)
pH at the ZPC
(b)
pH above ZPC
(c)
23
2.8 Previous Experimental Studies
2.8.1 A general overview of previously studied soils
Mishra et al., (2008) had studied three soils, red soil, black cotton soil and an artificially
mixed soil. The artificial soil was mixed at a proportion of 20 percent bentonite and 80
percent sand, the soil was then referred to as sand-bentonite soil. Selection of the soils was
made from low to high swelling capacity. The bentonite and black cotton used for the study
consists of montmorillonite mineral whereas the red soil consists of kaolinite minerals. The
purpose of the study is to understand the swell and shrinkage behaviour of the soils when
different compaction conditions are used. Various conditions of Standard Proctor
compaction curve were plotted and four conditions were chosen. The results obtained from
the experiment showed that the compaction conditions were dominated by the clay’s
mineralogy, thus affecting the shrinkage and swelling behaviour of the investigated soils.
During shrinkage, the relationship between water content and void ratio occurred in three
different stages. As water content decreased, void ratio slightly decreased during the first
stage of shrinkage and was described as initial shrinkage. As the water content decreased
during the second stage, a rapid decrease in void ratio was noted and that was termed as
primary shrinkage. The third stage showed a marginal change in the void ratio as the water
content decreased and was termed as residual shrinkage. The shrinkage change for the tested
specimens occurred at a water content ranging between 10% and 15%.
Estabragh et al., (2015) investigated different soils for their expansive behaviour through
wetting and drying cycles. Samples were made at a water content of 17% dry side and 23.5%
wet sides of the optimum water content with a dry unit weight of 16.1 kN/m3, disperse fabrics
and flocculate were also added. Specific gravity, sieve analysis, Atterberg limit, swell and
standard Proctor compaction test of the soil had all been determined for their necessity to
know the wetting and drying cycles using a conventional oedometer modified test at different
surcharge pressure. The results for the first cycle under a surcharge pressure of 1 kPa on the
dry and wet samples gave 34% and 29% swell, respectively. When the wetting and drying
cycle increased, the subsequent results were decreasing until they reached equilibrium
condition of 19.65% and 19.75%, respectively. Similarly, the swelling potentials under a
24
surcharge pressure of 6.25 kPa at equilibrium condition were found to be 12.2% and 12.4%,
respectively while 6.7% and 7% were obtained for a surcharge pressure of 10 kPa.
Tripathy et al., (2009) made a cyclic swelling and shrinkage test on a highly compacted
expansive soil in order to understand the shrinkage patterns change as the specimen
behaviour changes during swell and shrink cycles. The specimens were put to swell and then
allowed to either partially or fully shrink to different predetermined heights, soil suction test
was also involved. A surcharge pressure of 50 kPa was used to carry out the test. The test
results showed that as the number of swell and shrinkage cycles increased, the content of
water remained almost unchanged at the end of the shrinkage cycles for a given shrinkage
pattern. It was also observed that the reversible vertical and volumetric deformation was
affected by the soil suction during shrinkage cycles. The vertical deformation of the
specimens subjected to intense shrinkage looked much smaller than the volumetric
deformation.
Puppala et al., (2013) studied five different soils from different sites, namely El Paso,
Huston, Fort Worth, Paris and San Antonio. The purpose of the study is to observe the
volume change caused by the swell and shrinkage of the obtained expansive clays. The basic,
mineralogical and chemical composition of the soils were determined. Various compaction
conditions were used on all the obtained soils to perform three dimensional and shrinkage
tests on them. The results obtained showed that San Antonio, Fort Worth and Paris clay
contained medium to high amounts of montmorillonite, also the swell-shrinkage strain
during characterization study showed large volume change for soils with high plasticity. The
volumetric strain during shrinkage had the largest magnitudes at the wet side of optimum
moisture content conditions whereas the volumetric strain during swell had the largest
magnitudes at dry side of optimum moisture content conditions.
Tripathy et al., (2002) made an investigation on two compacted soil. The purpose of the
study is to observe the behaviour of the soils under surcharge pressure of 6.25 kPa, 50 kPa
and 100 kPa based on swell-shrink cycles. The water content and void ratio of the samples
at various intermediate stages as swell commences until it finished and shrinkage until it
ended, were observed in order to trace the void ratio versus water content paths as the number
25
of cycles increases. The results obtained from the experiment showed a reversible path for
swelling and shrinkage when the equilibrium stage was reached where the axial deformation
for swell and shrinkage were almost the same. It normally occurs after the fourth swelling
and shrinkage cycles. A linear portion and two curvilinear portions forming an S-shaped
curve were observed for each soil as they were subjected to full swell and shrinkage cycles.
The biggest part of the volume change and almost 50% of the axial deformation occurred in
the middle linear portion of the curve when the samples were subjected to full swell and
partial shrinkage. The water content and dry density had no effect on the swell and shrinkage
path after equilibrium was reached. Similar paths were noted for different surcharge
pressure.
Lu et al., (2013) studied a clay which was obtained from a construction site. Shrinkage and
swell deformation test were to be made using two conditions. The first condition had same
dry density (1.65g/cm3) and different molding water contents 17%, 19%, 21%, 23% and
25%) while the second condition had same molding water content (21%) and different dry
density (1.50g/cm3, 1.55g/cm3, 1.60g/cm3, 1.65g/cm3, 1.70g/cm3). During the first condition,
the results showed that the clay had slow expansion after it had been compacted at a molding
water content almost at the optimum moisture and gave a minimum swell rate of 18.5%. At
a molding water content of 17% and 19%, the maximum swelling rate was 31.85% and
31.6% respectively, minimum average axial shrinkage had been obtained at a molding water
content of 21% while a larger average axial shrinkage was seen at 23% and 25%. The volume
shrinkage increased by almost 2.26 times when the water content increased from 17% to
25%. During the second condition, the results gave a final swell of 30.1% which was the
minimum at 1.50g/cm3 dry density and final swell of 31.2% at 1.65g/cm3 dry density. An
increase of final axial shrinkage had been observed as compaction degree increased. When
the compaction degree increased from 1.5 g/cm3 to 1.7 g/cm3, the volume shrinkage
decreased from 4.8 to 3.8.
Sudjianto et al., (2011) studied expansive clay sample obtained from Soko Ngawi region,
Indonesia. The investigation was carried out in order to understand how the volumetric
behaviour of highly expansive swelling clays is affected by suction variation and changing
water contents. The swelling research was carried out using an oedometer apparatus after

26
the samples were remolded. The dry density was 1.26 g/cm3 with an initial water content of
10 %. The height and diameter were 1.50 cm and 6.35 cm respectively. Gypsum blocks were
used to measure the change in water content and filter papers were used for the suction. The
result showed that vertical, horizontal and volumetric swell behaviour were increasing
linearly as the water content increased. The swell behaviour was greatly influenced by the
degree of saturation (Sr) as well. They also showed a linear increase as the degree of
saturation (Sr) was increasing and then the samples stopped swelling when (Sr) was equal to
100%. It was also found that the greater the suction the lower the swelling behaviour is on
the expansive soil.
Ameta et al., (2007) investigated five swelling soil samples brought from different parts of
Rajasthan, India, which are namely Jaisalmer, Balotra, Merta, Pali and Kolayat. The
investigation dealt with expansive soils properties and concentrated on the swelling pressure
behaviour affected by gypsum and dune sand. The water content and dry density effects were
also observed. The results showed that when dry density increases, the swell pressure also
increases and it decreases when water content increases. The addition of gypsum and dune
sand also decreased the swelling pressure.
Lew, (2010) studied disturbed and undisturbed samples collected at a different depth from
three boreholes in Cuiaba, Brazil. The study aimed for knowing the swelling potential
properties of the obtained samples using constant volume and load-swell method. In addition
to that, diffraction analysis, energy dispersive techniques and scanning electron microscopy
were used. The test results obtained for depth of 0.5m gave 1.05 activity, 2.1% swell and
45.0 kPa swell pressure, for a depth of 1 m it gave 1.12 activity, 12.7% swell and 38.3 kPa
swell pressure, for a depth of 1.5m it gave 1.17 activity, 10.1% swell and 35.2 kPa swell
pressure, for a depth of 2 m it gave 1.17 activity, 7.4% swell and 28.5 kPa swell pressure,
for a depth of 2.5m it gave 1.16 activity, 6.2% swell and 24.4 kPa swell pressure. The
swelling potentials of the clays were categorized as average to high caused by expansive
clay minerals.
Rosenbalm & Zapata, (2017) made a study on two natural expansive soils. The purpose of
the experiment was to assess the effect of multiple wetting and drying cycles on the change
27
of volume behaviour of the obtained soils. All soils were compacted at different compaction
conditions for the purpose of remolding and different stresses were loaded on them. The
soils are then fully saturated and later on allowed to fully dry. The results showed that after
the fourth cycle, the swell pressure and swelling strains reached to equilibrium. The results
also showed that the swelling strains of the two soils increased, from the previous wetting
cycle, when applied loading stress exceeded 25% of the swelling pressure. On the other hand,
the swell potential increased for both soils, from the previous cycle, when applied stress was
below 25% of the swelling pressure.
2.8.2 Turkey soils
Uzundurukan et al., (2014) studied three different natural clayey samples namely A, B and
C brought from different locations in the west and middle parts of Turkey. The aim of the
study is to investigate the relationship between swelling characteristics and suction of the
obtained clayey soils. Oedometer apparatus was used in accordance with the procedures of
ASTM D 4546. The result showed that there was a linear relationship between suction and
the percent swell. Also, the testing results indicated that suction and swelling pressure
relationship depended on the nature of the clayey soils tested.
Çimen et al., (2012) studied four different samples brought from different areas in Turkey.
The study aimed to predict swelling potentials and swelling pressure in compacted clays
which were compacted using standard compaction method, an equation had been proposed
for making a simple relationship. The obtained clays were prepared in two different ways.
The first way was using an initial dry unit weight which was constant for all samples with
varying water contents while the second way was done by using constant water content for
all samples with different dry unit weights. The free swelling method was implemented using
an oedometer apparatus. The obtained values were to be analyzed using multiple regression
analysis to predicting both swelling potential and swelling pressure for different values of
plasticity index, dry unit weight and initial water content of three samples. After the test
results were obtained, the proposed equation was used. The experimental values obtained
for the swelling potential and swelling pressure were close to the estimated values. The
increase in initial water content at any constant dry density showed a decrease in the swelling
potential and pressure. In contrast, an increase in dry density at any constant initial water
28
content showed an increase in the swelling potential and pressure. Furthermore, as the
plasticity index increased the swell potential and pressure also increased. The proposed
relationship was valid for samples having a 11.5-17 kN/m3 dry unit weight, 38-35% PI and
15-42% water content.
2.8.3 North Cyprus soils
Tawfiq & Nalbantoglu, (2009) investigated a soil sample brought from the Northern part of
Eastern Mediterranean University, North Cyprus. The physical properties of the soil had
64% Liquid limit, 36% Plastic limit, 28% plasticity index, 50% silt, 50% clay, 24% optimum
water content, 1.560 g/cm3 Max. dry density, classified as MH according to the Unified Soil
Classification System and 19.2% linear shrinkage, ASTM was used. The cyclic swell-shrink
test was to be found at full swell-full shrinkage. The results obtained for full swell-full
shrinkage cycle was observed, during the first and second cycle, swell potential decreased
later on after the second cycle the swell potential increased and started to level off at the fifth
cycle. The values of volume change increased with increasing number of cycles but then it
started to decrease at the fifth cycle caused by fatigue of soil indicating it is at equilibrium
state. The values of water content during the drying process of the first cycle was
considerably small, whereas a larger amount of water was observed at the third and fourth
cycle where it had the largest amount of change compared with the other cycles.
Sridharan & Gurtug, (2004) investigated three soils from North Cyprus (Akdeniz,
Degirmenlik and Tuzla) and two other clays (Montmorillonitic and a Kalonite clay) for the
sake of comparison. The study was based on understanding and comparing the swelling
behaviour of the three soils possessing different physical properties with different
compaction force gained from modified Proctor and standard Proctor. The Compaction
energy had a great influence on the swelling pressure and percent swell. The results showed
that there was a special relationship between swelling pressure and percent swell regardless
of the compaction energy and soil type, where a linear relationship was obtained. Also,
depending on the soil type, swelling pressure and percent swell increased in a linear form as
compaction energy increased. A rectangular hyperbolas graph was obtained for percent swell
versus time, and from that, the ‘time/percent swell versus time’ resulted in a good fit linear
line which was used to obtain the ultimate percent swell. The results also showed three stages
29
of percent swell versus logarithm of time, known as initial, primary and secondary. During
the secondary stage, the swell continued linearly with logarithmic time while the slope of
the line increased as the plasticity increased.
30
CHAPTER 3
EXPERIMENTAL STUDIES
3.1 Introduction
The obtained samples were brought in order to perform a laboratory test which will
determine the volume change characteristics and their related properties. The program
includes fundamental soil properties test done by most of the geotechnical investigations and
some engineering tests as well. The laboratory equipment used and procedures followed will
be briefly discussed in this chapter.
3.2 Material Selection
The laboratory work was planned to understand the properties related to expansive clay
volume behaviour. Four natural expansive soil samples were taken from different sites,
which are located in the south of Taskent village, North of Haspolat village and South of
Yigitler village within and around Nicosia, North Cyprus.
3.2.1 Sample T1 pickup location
The sample was picked almost 1 km away from the road cut south of Taskent village close
to Martyrs remembrance and about 2.5 m from the road surface. Flysch formations are found
in those areas. The soil sample had a dark brown color and was taken in a disturbed form
and placed in a plastic bag.
3.2.2 Sample T2 pickup location
After digging a depth of 0.3 m in the Northern part of a clay pit located at North of Haspolat
village, sample T2 was collected. Kythrea soil formations are found in those areas. The soil
sample had a light grey color with a mudstone shaped texture.
3.2.3 Sample T3 pickup location
The sample was picked from the Northern flank of a clay pit located at North of Haspolat
village which is 50 m away from sample T2. Kythrea soil formations are also found there.

31
The soil sample had a dark grey color with a muddy block shaped texture which was packed
in a disturbed form and placed in a plastic bag.
3.2.4 Sample T4 pickup location
The sample was picked up from south of Yigitler village after digging a depth of 0.3 m. The
area is popular with bentonitic soil. The soil sample had a light brown color and was packed
in a disturbed form then placed in plastic bags.
The soil samples were named as T1, T2, T3 and T4 as shown below in figure 3.1 a, b, c and
d. The samples were pulverized and dried in an oven at a temperature of 60 oC for 24 hours
in order to obtain their initial water content and then dried between 100 oC and 105 oC for
24 hours during the calculations of plastic and liquid limit.
3.3 Properties Test
Basic soil properties test was conducted which are done for most of the geotechnical
investigations. Sieve analysis, Atterberg limits, hydrometer test, specific gravity and
standard Proctor test are carried out in the test. Procedures and descriptions of the test will
be discussed below.
T1
South of Taskent
village road
section
(a)
T2
North of Haspolat
village Northern
part of the mud pit
(b)
T3
North of Haspolat
village West flank
of the mud pit
(c)
T4
South of Yigitler
village from
bentonite quarry
(d)
Figure 3.1: Obtained Soil samples
32
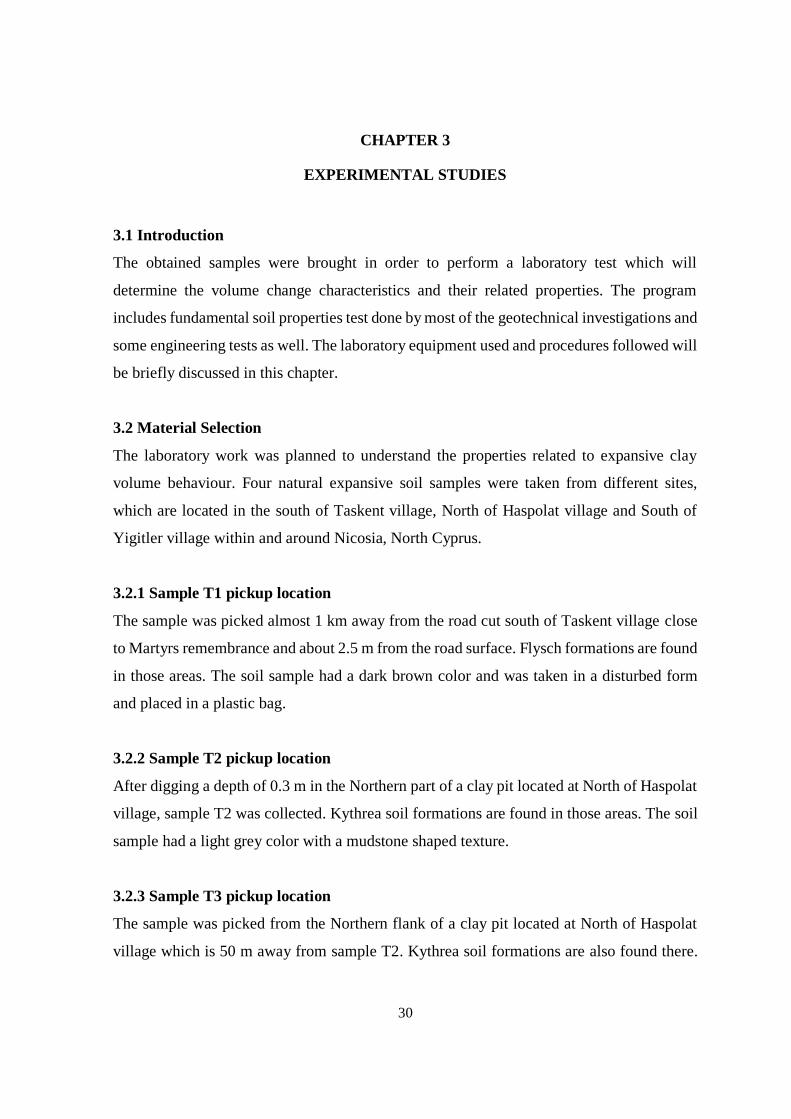
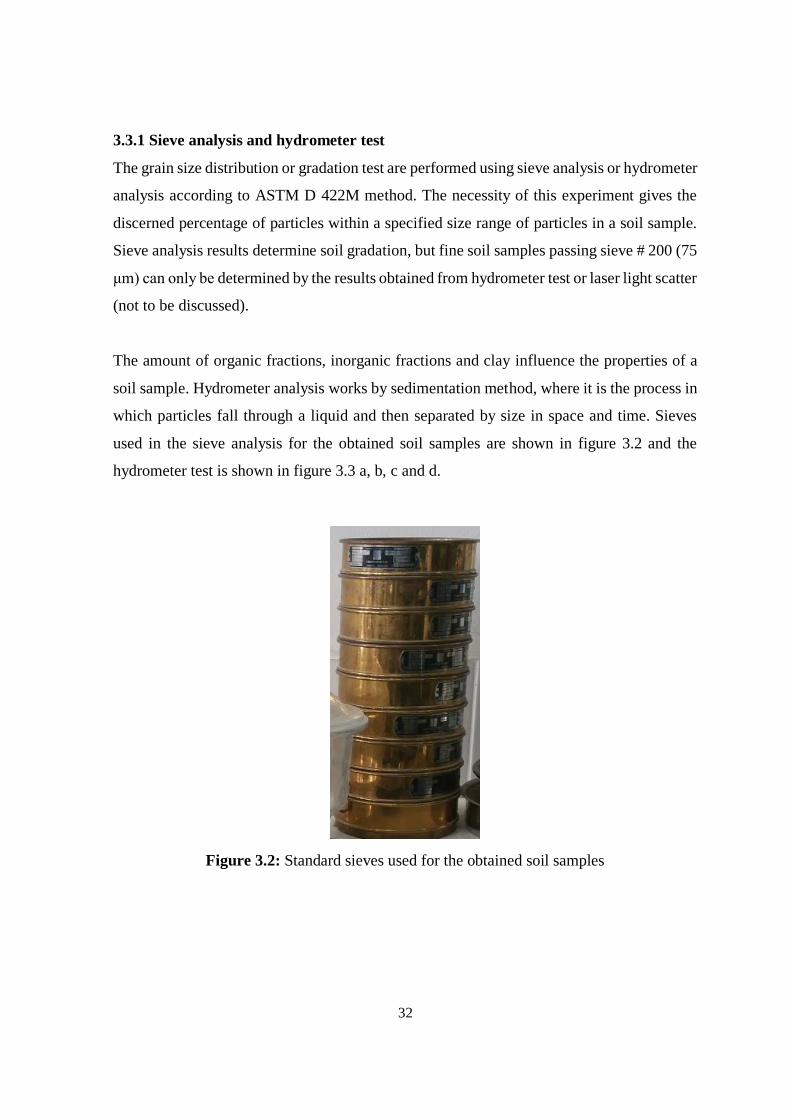
3.3.1 Sieve analysis and hydrometer test
The grain size distribution or gradation test are performed using sieve analysis or hydrometer
analysis according to ASTM D 422M method. The necessity of this experiment gives the
discerned percentage of particles within a specified size range of particles in a soil sample.
Sieve analysis results determine soil gradation, but fine soil samples passing sieve # 200 (75
μm) can only be determined by the results obtained from hydrometer test or laser light scatter
(not to be discussed).
The amount of organic fractions, inorganic fractions and clay influence the properties of a
soil sample. Hydrometer analysis works by sedimentation method, where it is the process in
which particles fall through a liquid and then separated by size in space and time. Sieves
used in the sieve analysis for the obtained soil samples are shown in figure 3.2 and the
hydrometer test is shown in figure 3.3 a, b, c and d.
Figure 3.2: Standard sieves used for the obtained soil samples
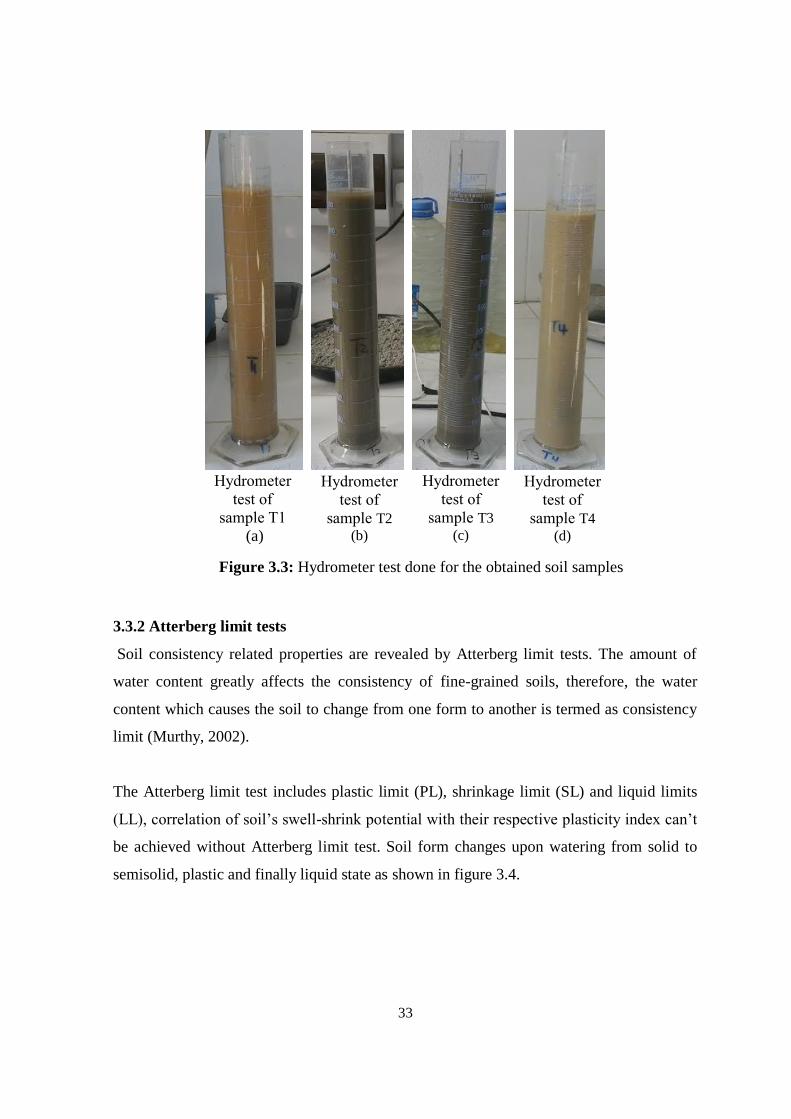
33
Figure 3.3: Hydrometer test done for the obtained soil samples
3.3.2 Atterberg limit tests
Soil consistency related properties are revealed by Atterberg limit tests. The amount of
water content greatly affects the consistency of fine-grained soils, therefore, the water
content which causes the soil to change from one form to another is termed as consistency
limit (Murthy, 2002).
The Atterberg limit test includes plastic limit (PL), shrinkage limit (SL) and liquid limits
(LL), correlation of soil’s swell-shrink potential with their respective plasticity index can’t
be achieved without Atterberg limit test. Soil form changes upon watering from solid to
semisolid, plastic and finally liquid state as shown in figure 3.4.
Hydrometer
test of
sample T1
(a)
Hydrometer
test of
sample T2
(b)
Hydrometer
test of
sample T3
(c)
Hydrometer
test of
sample T4
(d)
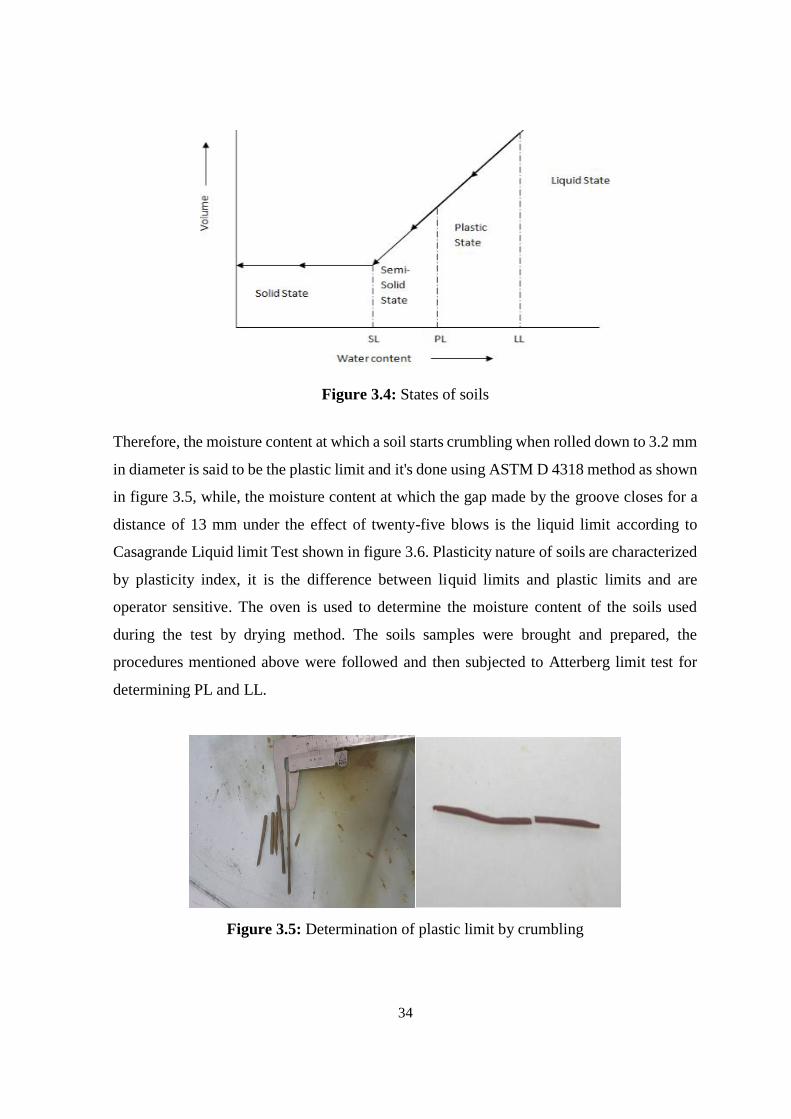
34
Figure 3.4: States of soils
Therefore, the moisture content at which a soil starts crumbling when rolled down to 3.2 mm
in diameter is said to be the plastic limit and it's done using ASTM D 4318 method as shown
in figure 3.5, while, the moisture content at which the gap made by the groove closes for a
distance of 13 mm under the effect of twenty-five blows is the liquid limit according to
Casagrande Liquid limit Test shown in figure 3.6. Plasticity nature of soils are characterized
by plasticity index, it is the difference between liquid limits and plastic limits and are
operator sensitive. The oven is used to determine the moisture content of the soils used
during the test by drying method. The soils samples were brought and prepared, the
procedures mentioned above were followed and then subjected to Atterberg limit test for
determining PL and LL.
Figure 3.5: Determination of plastic limit by crumbling
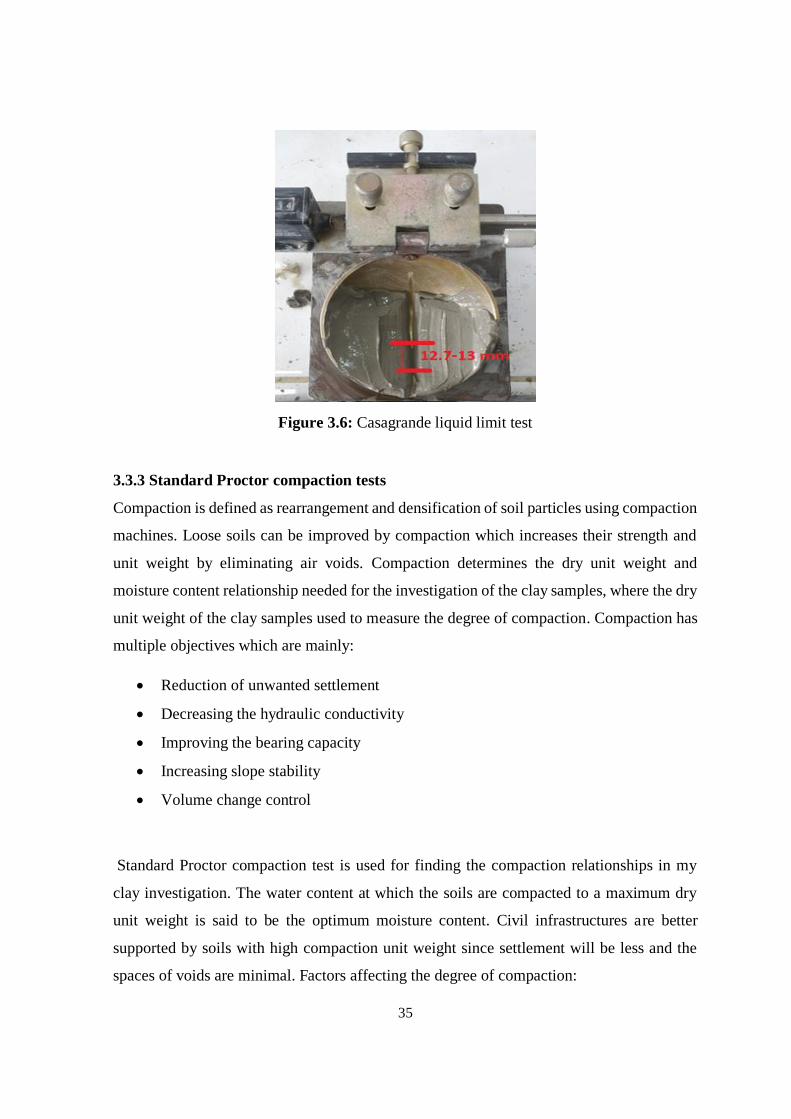
35
Figure 3.6: Casagrande liquid limit test
3.3.3 Standard Proctor compaction tests
Compaction is defined as rearrangement and densification of soil particles using compaction
machines. Loose soils can be improved by compaction which increases their strength and
unit weight by eliminating air voids. Compaction determines the dry unit weight and
moisture content relationship needed for the investigation of the clay samples, where the dry
unit weight of the clay samples used to measure the degree of compaction. Compaction has
multiple objectives which are mainly:
• Reduction of unwanted settlement
• Decreasing the hydraulic conductivity
• Improving the bearing capacity
• Increasing slope stability
• Volume change control
Standard Proctor compaction test is used for finding the compaction relationships in my
clay investigation. The water content at which the soils are compacted to a maximum dry
unit weight is said to be the optimum moisture content. Civil infrastructures are better
supported by soils with high compaction unit weight since settlement will be less and the
spaces of voids are minimal. Factors affecting the degree of compaction:
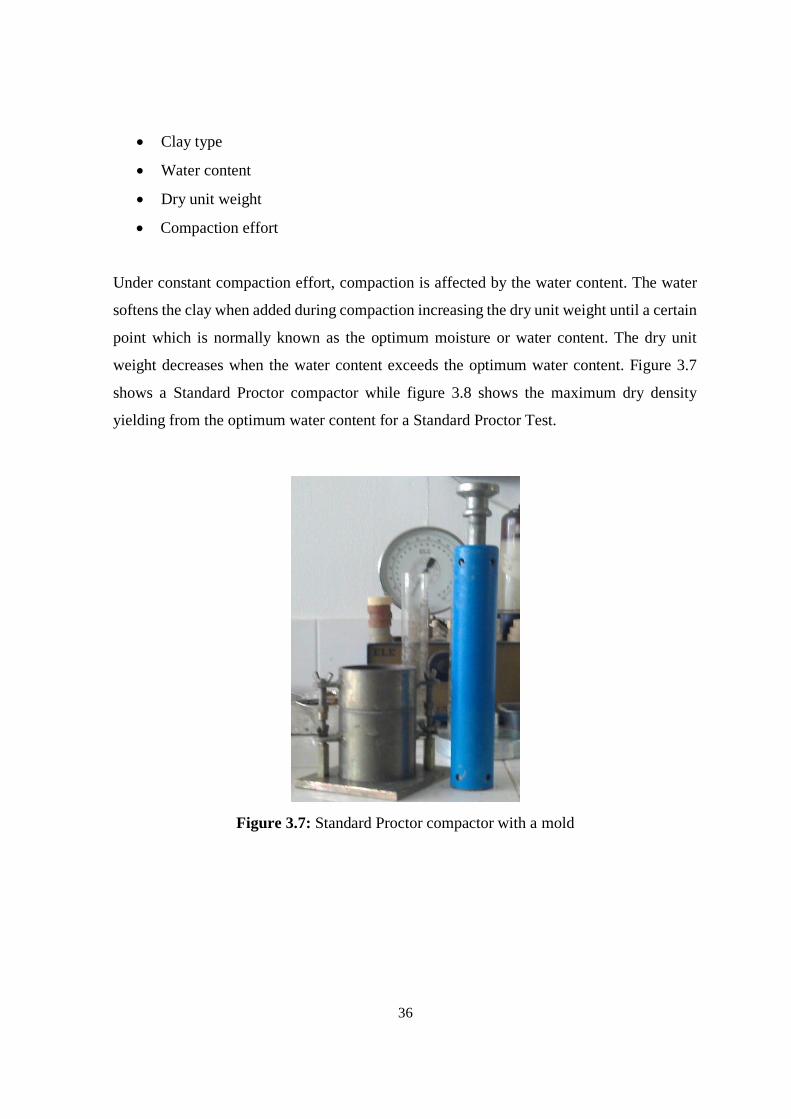
36
• Clay type
• Water content
• Dry unit weight
• Compaction effort
Under constant compaction effort, compaction is affected by the water content. The water
softens the clay when added during compaction increasing the dry unit weight until a certain
point which is normally known as the optimum moisture or water content. The dry unit
weight decreases when the water content exceeds the optimum water content. Figure 3.7
shows a Standard Proctor compactor while figure 3.8 shows the maximum dry density
yielding from the optimum water content for a Standard Proctor Test.
Figure 3.7: Standard Proctor compactor with a mold
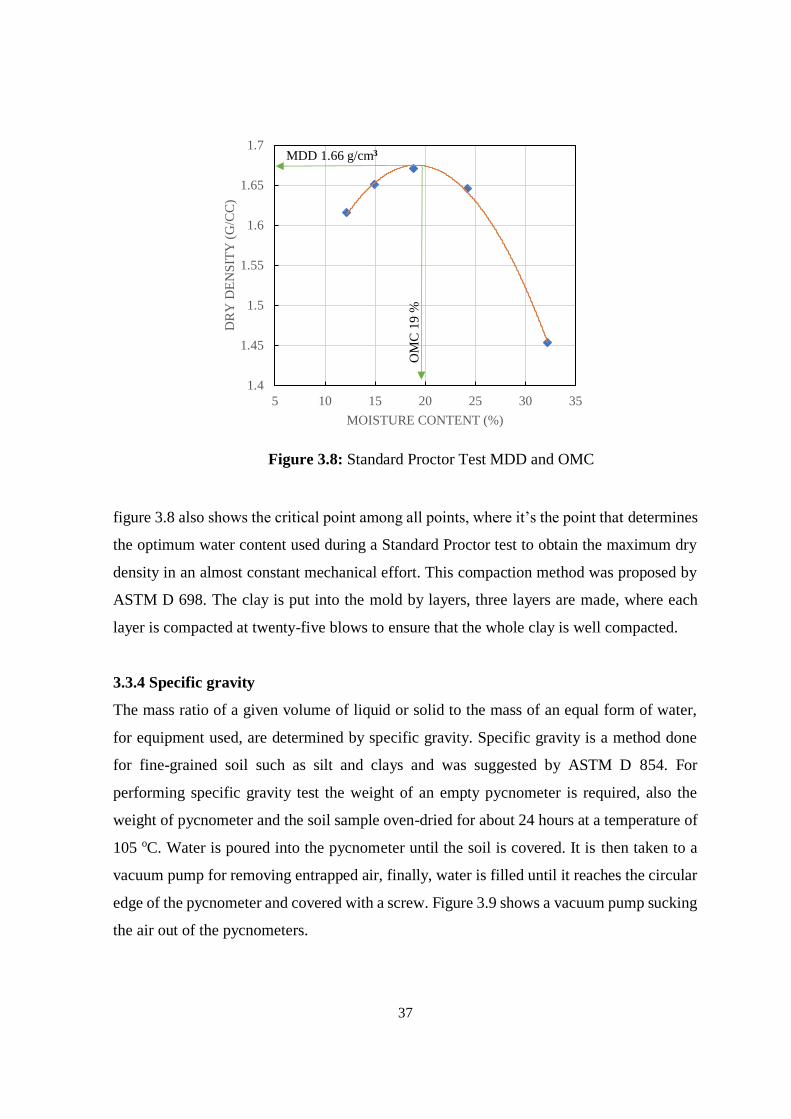
37
Figure 3.8: Standard Proctor Test MDD and OMC
figure 3.8 also shows the critical point among all points, where it’s the point that determines
the optimum water content used during a Standard Proctor test to obtain the maximum dry
density in an almost constant mechanical effort. This compaction method was proposed by
ASTM D 698. The clay is put into the mold by layers, three layers are made, where each
layer is compacted at twenty-five blows to ensure that the whole clay is well compacted.
3.3.4 Specific gravity
The mass ratio of a given volume of liquid or solid to the mass of an equal form of water,
for equipment used, are determined by specific gravity. Specific gravity is a method done
for fine-grained soil such as silt and clays and was suggested by ASTM D 854. For
performing specific gravity test the weight of an empty pycnometer is required, also the
weight of pycnometer and the soil sample oven-dried for about 24 hours at a temperature of
105 oC. Water is poured into the pycnometer until the soil is covered. It is then taken to a
vacuum pump for removing entrapped air, finally, water is filled until it reaches the circular
edge of the pycnometer and covered with a screw. Figure 3.9 shows a vacuum pump sucking
the air out of the pycnometers.
1.4
1.45
1.5
1.55
1.6
1.65
1.7
5 10 15 20 25 30 35
DR
Y D
EN
SIT
Y (
G/C
C)
MOISTURE CONTENT (%)
MDD 1.66 g/cm3
OM
C19 %
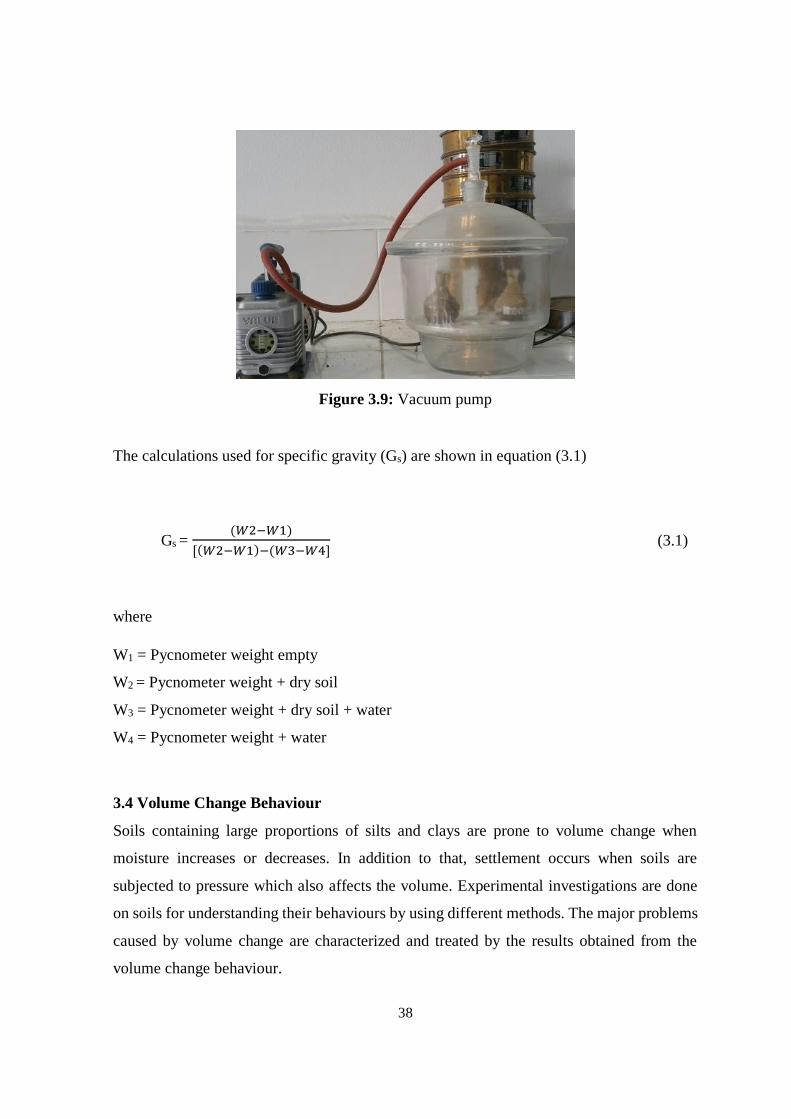
38
Figure 3.9: Vacuum pump
The calculations used for specific gravity (Gs) are shown in equation (3.1)
Gs = (𝑊2−𝑊1)
[(𝑊2−𝑊1)−(𝑊3−𝑊4] (3.1)
where
W1 = Pycnometer weight empty
W2 = Pycnometer weight + dry soil
W3 = Pycnometer weight + dry soil + water
W4 = Pycnometer weight + water
3.4 Volume Change Behaviour
Soils containing large proportions of silts and clays are prone to volume change when
moisture increases or decreases. In addition to that, settlement occurs when soils are
subjected to pressure which also affects the volume. Experimental investigations are done
on soils for understanding their behaviours by using different methods. The major problems
caused by volume change are characterized and treated by the results obtained from the
volume change behaviour.
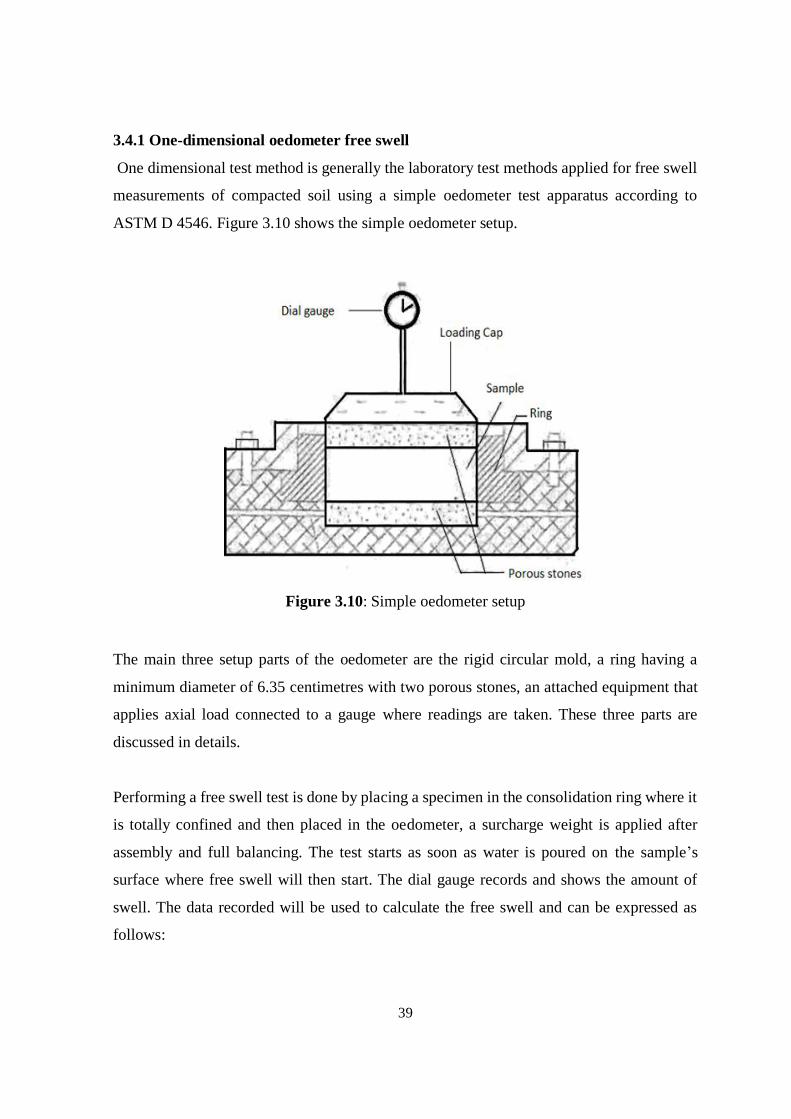
39
3.4.1 One-dimensional oedometer free swell
One dimensional test method is generally the laboratory test methods applied for free swell
measurements of compacted soil using a simple oedometer test apparatus according to
ASTM D 4546. Figure 3.10 shows the simple oedometer setup.
Figure 3.10: Simple oedometer setup
The main three setup parts of the oedometer are the rigid circular mold, a ring having a
minimum diameter of 6.35 centimetres with two porous stones, an attached equipment that
applies axial load connected to a gauge where readings are taken. These three parts are
discussed in details.
Performing a free swell test is done by placing a specimen in the consolidation ring where it
is totally confined and then placed in the oedometer, a surcharge weight is applied after
assembly and full balancing. The test starts as soon as water is poured on the sample’s
surface where free swell will then start. The dial gauge records and shows the amount of
swell. The data recorded will be used to calculate the free swell and can be expressed as
follows:
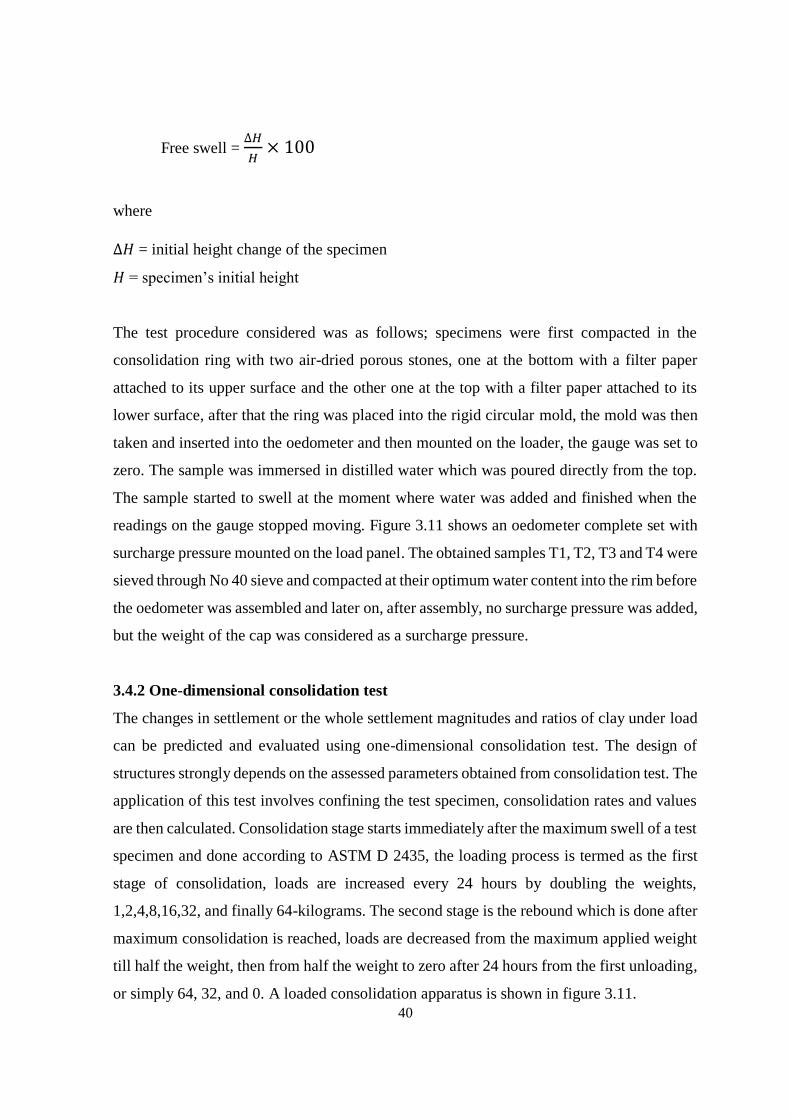
40
Free swell = ∆𝐻
𝐻× 100
where
∆𝐻 = initial height change of the specimen
𝐻 = specimen’s initial height
The test procedure considered was as follows; specimens were first compacted in the
consolidation ring with two air-dried porous stones, one at the bottom with a filter paper
attached to its upper surface and the other one at the top with a filter paper attached to its
lower surface, after that the ring was placed into the rigid circular mold, the mold was then
taken and inserted into the oedometer and then mounted on the loader, the gauge was set to
zero. The sample was immersed in distilled water which was poured directly from the top.
The sample started to swell at the moment where water was added and finished when the
readings on the gauge stopped moving. Figure 3.11 shows an oedometer complete set with
surcharge pressure mounted on the load panel. The obtained samples T1, T2, T3 and T4 were
sieved through No 40 sieve and compacted at their optimum water content into the rim before
the oedometer was assembled and later on, after assembly, no surcharge pressure was added,
but the weight of the cap was considered as a surcharge pressure.
3.4.2 One-dimensional consolidation test
The changes in settlement or the whole settlement magnitudes and ratios of clay under load
can be predicted and evaluated using one-dimensional consolidation test. The design of
structures strongly depends on the assessed parameters obtained from consolidation test. The
application of this test involves confining the test specimen, consolidation rates and values
are then calculated. Consolidation stage starts immediately after the maximum swell of a test
specimen and done according to ASTM D 2435, the loading process is termed as the first
stage of consolidation, loads are increased every 24 hours by doubling the weights,
1,2,4,8,16,32, and finally 64-kilograms. The second stage is the rebound which is done after
maximum consolidation is reached, loads are decreased from the maximum applied weight
till half the weight, then from half the weight to zero after 24 hours from the first unloading,
or simply 64, 32, and 0. A loaded consolidation apparatus is shown in figure 3.11.
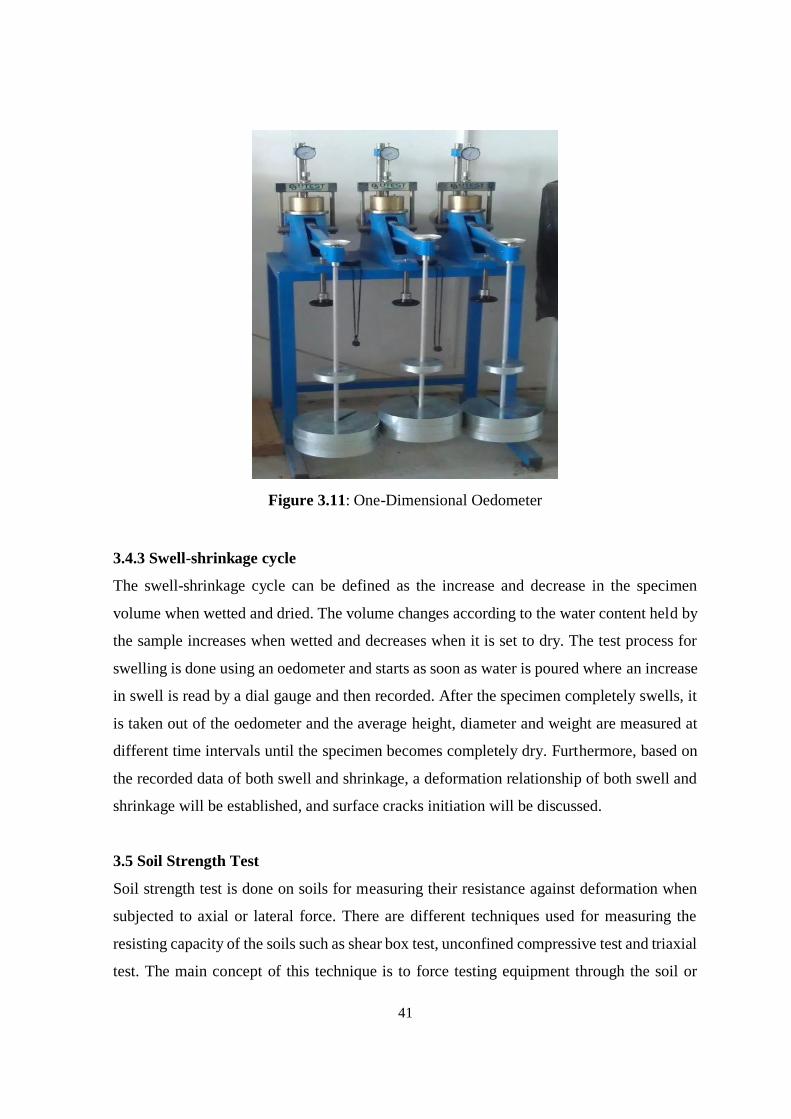
41
Figure 3.11: One-Dimensional Oedometer
3.4.3 Swell-shrinkage cycle
The swell-shrinkage cycle can be defined as the increase and decrease in the specimen
volume when wetted and dried. The volume changes according to the water content held by
the sample increases when wetted and decreases when it is set to dry. The test process for
swelling is done using an oedometer and starts as soon as water is poured where an increase
in swell is read by a dial gauge and then recorded. After the specimen completely swells, it
is taken out of the oedometer and the average height, diameter and weight are measured at
different time intervals until the specimen becomes completely dry. Furthermore, based on
the recorded data of both swell and shrinkage, a deformation relationship of both swell and
shrinkage will be established, and surface cracks initiation will be discussed.
3.5 Soil Strength Test
Soil strength test is done on soils for measuring their resistance against deformation when
subjected to axial or lateral force. There are different techniques used for measuring the
resisting capacity of the soils such as shear box test, unconfined compressive test and triaxial
test. The main concept of this technique is to force testing equipment through the soil or
42
breaking the aggregates apart for obtaining values and parameters for understanding the
strength nature of the soil.
3.5.1 Direct shear test
The shearing strength of soils is determined by a direct shear apparatus found mostly in
laboratories. Engineers strongly depend on the parameters obtained from the shear box test
when designing structures such as retaining walls, foundations, sheet pilling and pipes. A
UTEST UTS-2060 automatic direct and residual test apparatus is to be used which works
according to ASTM D 3080.
The direct shear test machine consists of four transducers, a transducer responsible for the
horizontal displacement, a transducer responsible for the vertical displacement, a transducer
responsible for the loading cell and one responsible for the pressure. All the four transducers
are connected by a real-time data recorder and then transferred to a computer via data
collection software specially programmed for the apparatus used.
A metal square box with a plan size of 60mm x 60 mm is used to confine soil samples which
separate from the middle in a horizontal motion when the test is started. There are two porous
stones used at the bottom and top of the specimen to allow free drainage for fully or partially
saturated samples, a metal plate for dry samples. A vertical normal load is applied to the
shearing plane through the lid above the box and shear stress is applied horizontally.
The build-up of excess pore pressures should be avoided if possible, by applying the
appropriates shearing rate which best fits with the specimens to be used. The shear load,
shear displacement and change in thickness of the samples are all measured once the test
starts. A sample is tested under different loads (kg), and shear stress(kPa) values obtained
during failure of the sample are plotted against the displacement (mm/min). A direct shear
box apparatus is shown in figure 3.12.
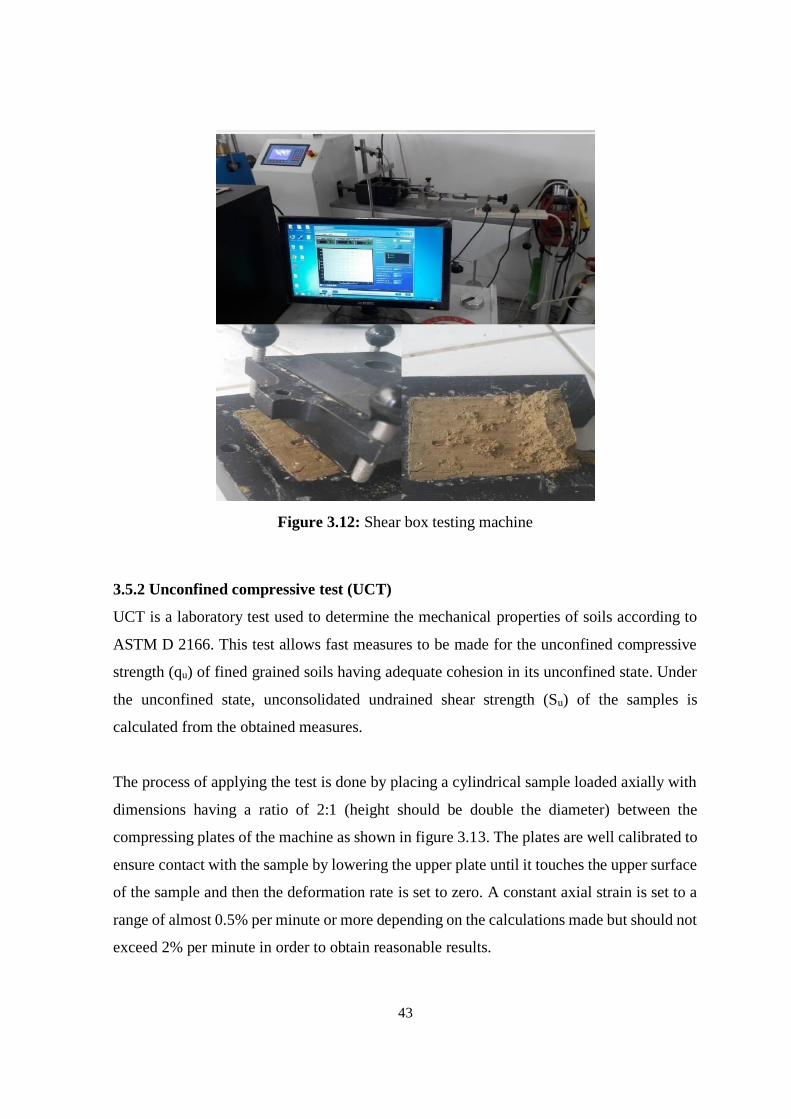
43
Figure 3.12: Shear box testing machine
3.5.2 Unconfined compressive test (UCT)
UCT is a laboratory test used to determine the mechanical properties of soils according to
ASTM D 2166. This test allows fast measures to be made for the unconfined compressive
strength (qu) of fined grained soils having adequate cohesion in its unconfined state. Under
the unconfined state, unconsolidated undrained shear strength (Su) of the samples is
calculated from the obtained measures.
The process of applying the test is done by placing a cylindrical sample loaded axially with
dimensions having a ratio of 2:1 (height should be double the diameter) between the
compressing plates of the machine as shown in figure 3.13. The plates are well calibrated to
ensure contact with the sample by lowering the upper plate until it touches the upper surface
of the sample and then the deformation rate is set to zero. A constant axial strain is set to a
range of almost 0.5% per minute or more depending on the calculations made but should not
exceed 2% per minute in order to obtain reasonable results.
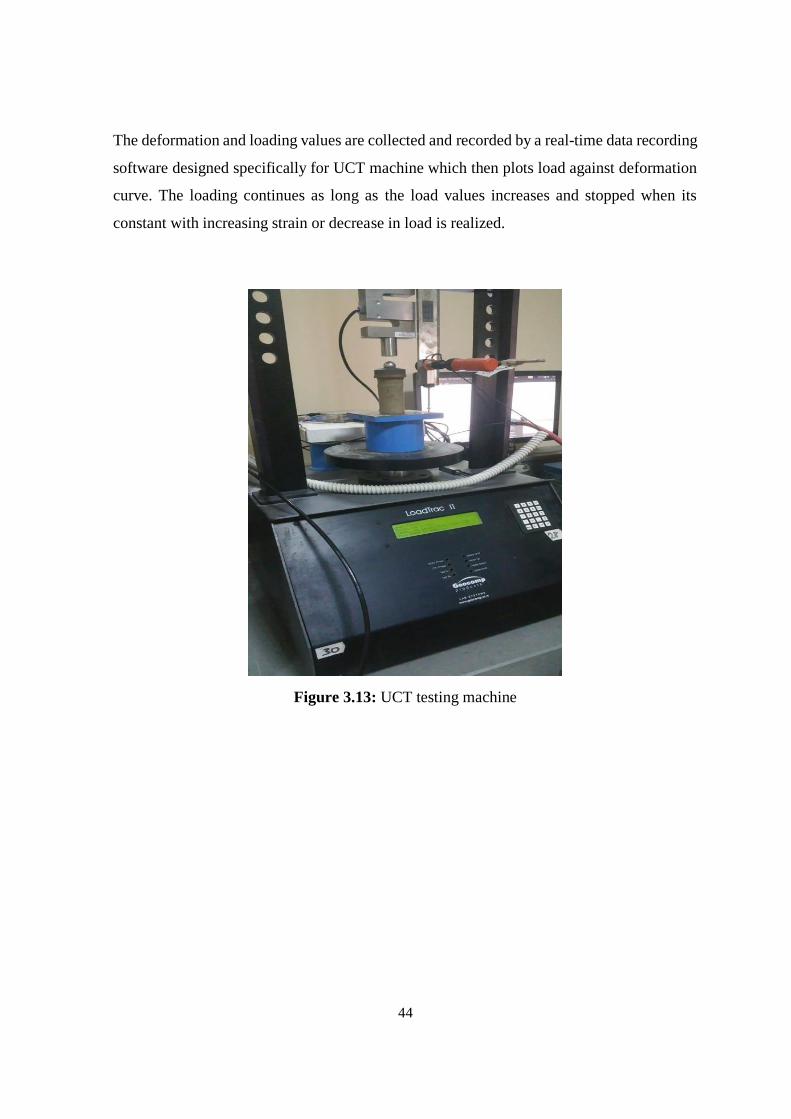
44
The deformation and loading values are collected and recorded by a real-time data recording
software designed specifically for UCT machine which then plots load against deformation
curve. The loading continues as long as the load values increases and stopped when its
constant with increasing strain or decrease in load is realized.
Figure 3.13: UCT testing machine
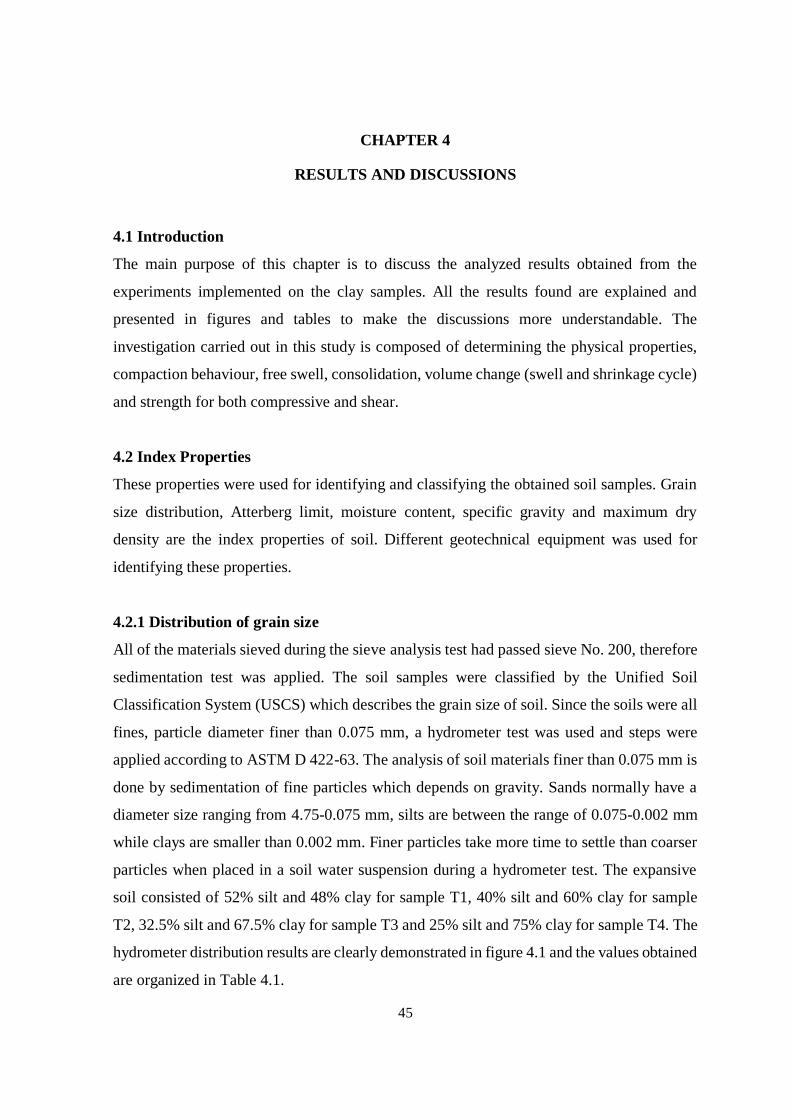
45
CHAPTER 4
RESULTS AND DISCUSSIONS
4.1 Introduction
The main purpose of this chapter is to discuss the analyzed results obtained from the
experiments implemented on the clay samples. All the results found are explained and
presented in figures and tables to make the discussions more understandable. The
investigation carried out in this study is composed of determining the physical properties,
compaction behaviour, free swell, consolidation, volume change (swell and shrinkage cycle)
and strength for both compressive and shear.
4.2 Index Properties
These properties were used for identifying and classifying the obtained soil samples. Grain
size distribution, Atterberg limit, moisture content, specific gravity and maximum dry
density are the index properties of soil. Different geotechnical equipment was used for
identifying these properties.
4.2.1 Distribution of grain size
All of the materials sieved during the sieve analysis test had passed sieve No. 200, therefore
sedimentation test was applied. The soil samples were classified by the Unified Soil
Classification System (USCS) which describes the grain size of soil. Since the soils were all
fines, particle diameter finer than 0.075 mm, a hydrometer test was used and steps were
applied according to ASTM D 422-63. The analysis of soil materials finer than 0.075 mm is
done by sedimentation of fine particles which depends on gravity. Sands normally have a
diameter size ranging from 4.75-0.075 mm, silts are between the range of 0.075-0.002 mm
while clays are smaller than 0.002 mm. Finer particles take more time to settle than coarser
particles when placed in a soil water suspension during a hydrometer test. The expansive
soil consisted of 52% silt and 48% clay for sample T1, 40% silt and 60% clay for sample
T2, 32.5% silt and 67.5% clay for sample T3 and 25% silt and 75% clay for sample T4. The
hydrometer distribution results are clearly demonstrated in figure 4.1 and the values obtained
are organized in Table 4.1.
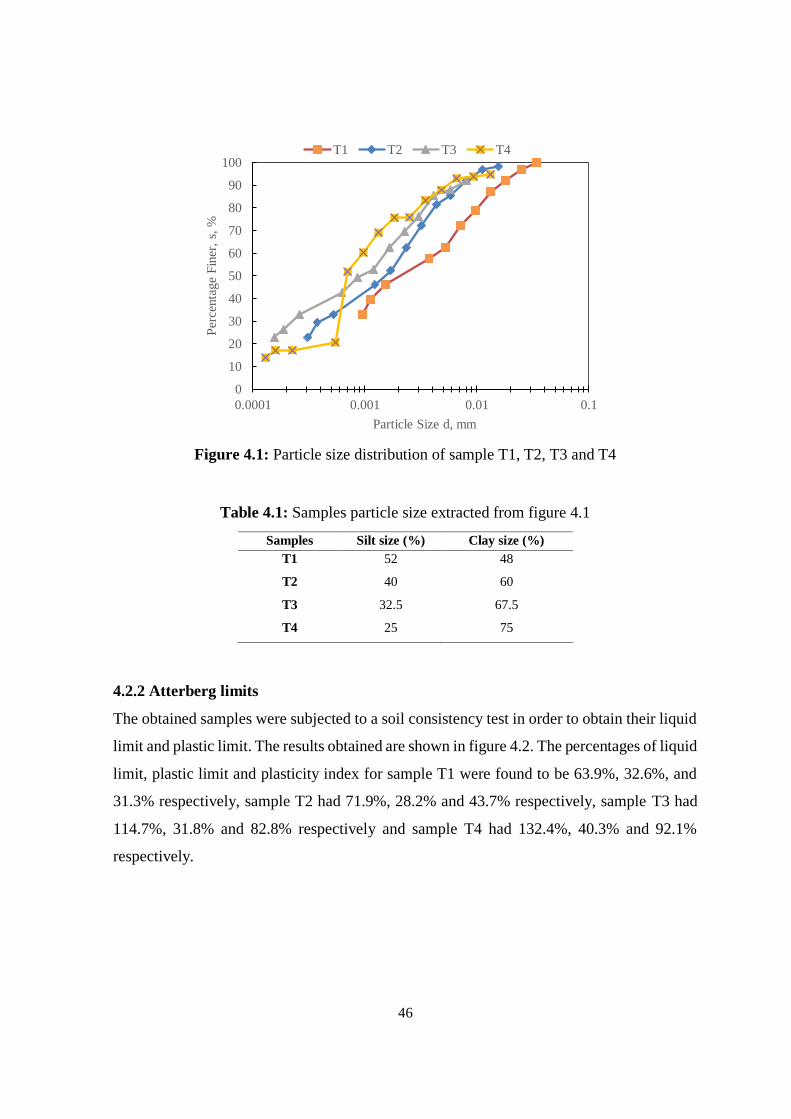
46
Figure 4.1: Particle size distribution of sample T1, T2, T3 and T4
Table 4.1: Samples particle size extracted from figure 4.1
Samples Silt size (%) Clay size (%)
T1 52 48
T2 40 60
T3 32.5 67.5
T4 25 75
4.2.2 Atterberg limits
The obtained samples were subjected to a soil consistency test in order to obtain their liquid
limit and plastic limit. The results obtained are shown in figure 4.2. The percentages of liquid
limit, plastic limit and plasticity index for sample T1 were found to be 63.9%, 32.6%, and
31.3% respectively, sample T2 had 71.9%, 28.2% and 43.7% respectively, sample T3 had
114.7%, 31.8% and 82.8% respectively and sample T4 had 132.4%, 40.3% and 92.1%
respectively.
0
10
20
30
40
50
60
70
80
90
100
0.0001 0.001 0.01 0.1
Per
centa
ge
Fin
er,
s, %
Particle Size d, mm
T1 T2 T3 T4
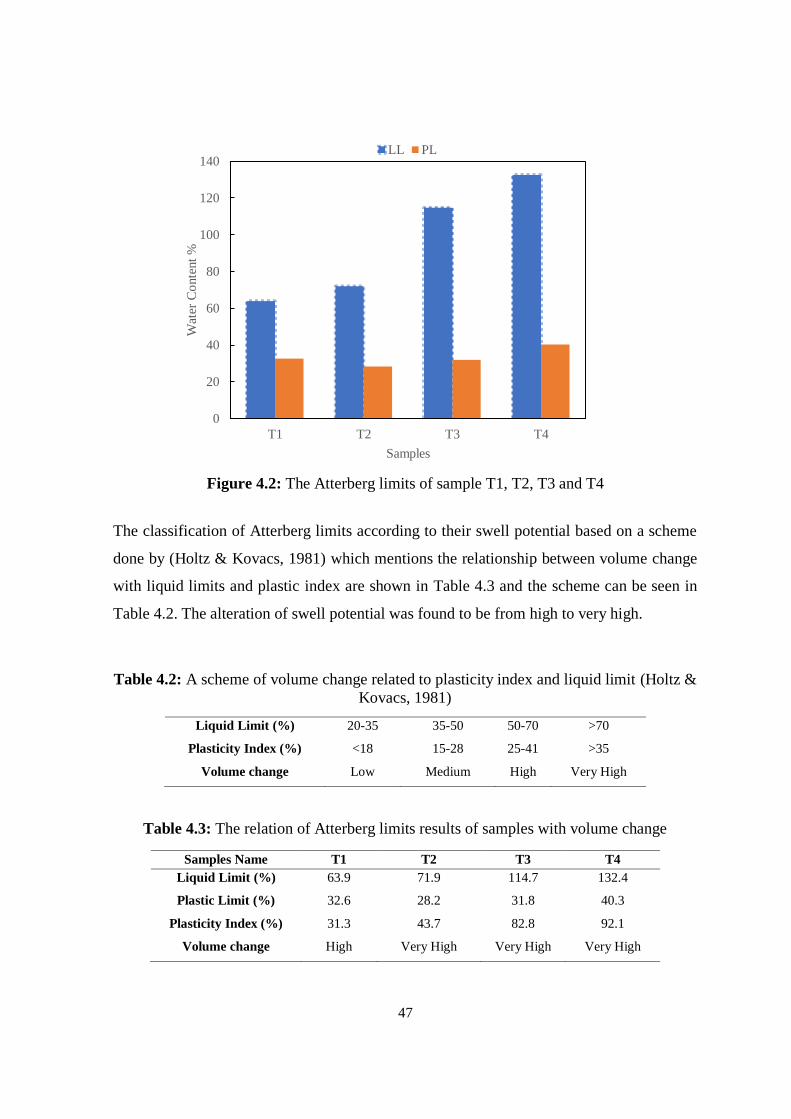
47
Figure 4.2: The Atterberg limits of sample T1, T2, T3 and T4
The classification of Atterberg limits according to their swell potential based on a scheme
done by (Holtz & Kovacs, 1981) which mentions the relationship between volume change
with liquid limits and plastic index are shown in Table 4.3 and the scheme can be seen in
Table 4.2. The alteration of swell potential was found to be from high to very high.
Table 4.2: A scheme of volume change related to plasticity index and liquid limit (Holtz &
Kovacs, 1981)
Liquid Limit (%) 20-35 35-50 50-70 >70
Plasticity Index (%) <18 15-28 25-41 >35
Volume change Low Medium High Very High
Table 4.3: The relation of Atterberg limits results of samples with volume change
Samples Name T1 T2 T3 T4
Liquid Limit (%) 63.9 71.9 114.7 132.4
Plastic Limit (%) 32.6 28.2 31.8 40.3
Plasticity Index (%) 31.3 43.7 82.8 92.1
Volume change High Very High Very High Very High
0
20
40
60
80
100
120
140
T1 T2 T3 T4
Wat
er C
onte
nt
%
Samples
LL PL
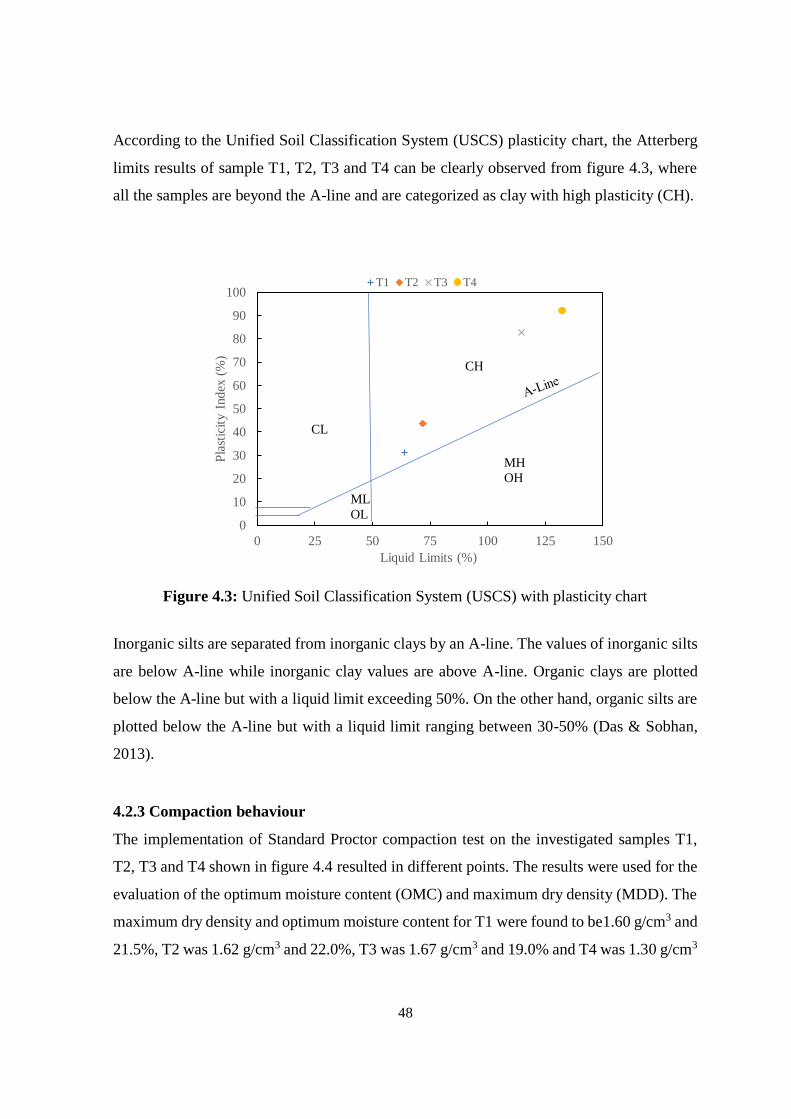
48
According to the Unified Soil Classification System (USCS) plasticity chart, the Atterberg
limits results of sample T1, T2, T3 and T4 can be clearly observed from figure 4.3, where
all the samples are beyond the A-line and are categorized as clay with high plasticity (CH).
Figure 4.3: Unified Soil Classification System (USCS) with plasticity chart
Inorganic silts are separated from inorganic clays by an A-line. The values of inorganic silts
are below A-line while inorganic clay values are above A-line. Organic clays are plotted
below the A-line but with a liquid limit exceeding 50%. On the other hand, organic silts are
plotted below the A-line but with a liquid limit ranging between 30-50% (Das & Sobhan,
2013).
4.2.3 Compaction behaviour
The implementation of Standard Proctor compaction test on the investigated samples T1,
T2, T3 and T4 shown in figure 4.4 resulted in different points. The results were used for the
evaluation of the optimum moisture content (OMC) and maximum dry density (MDD). The
maximum dry density and optimum moisture content for T1 were found to be1.60 g/cm3 and
21.5%, T2 was 1.62 g/cm3 and 22.0%, T3 was 1.67 g/cm3 and 19.0% and T4 was 1.30 g/cm3
0
10
20
30
40
50
60
70
80
90
100
0 25 50 75 100 125 150
Pla
stic
ity I
ndex
(%
)
Liquid Limits (%)
T1 T2 T3 T4
MH
OH
CL
ML
OL
CH
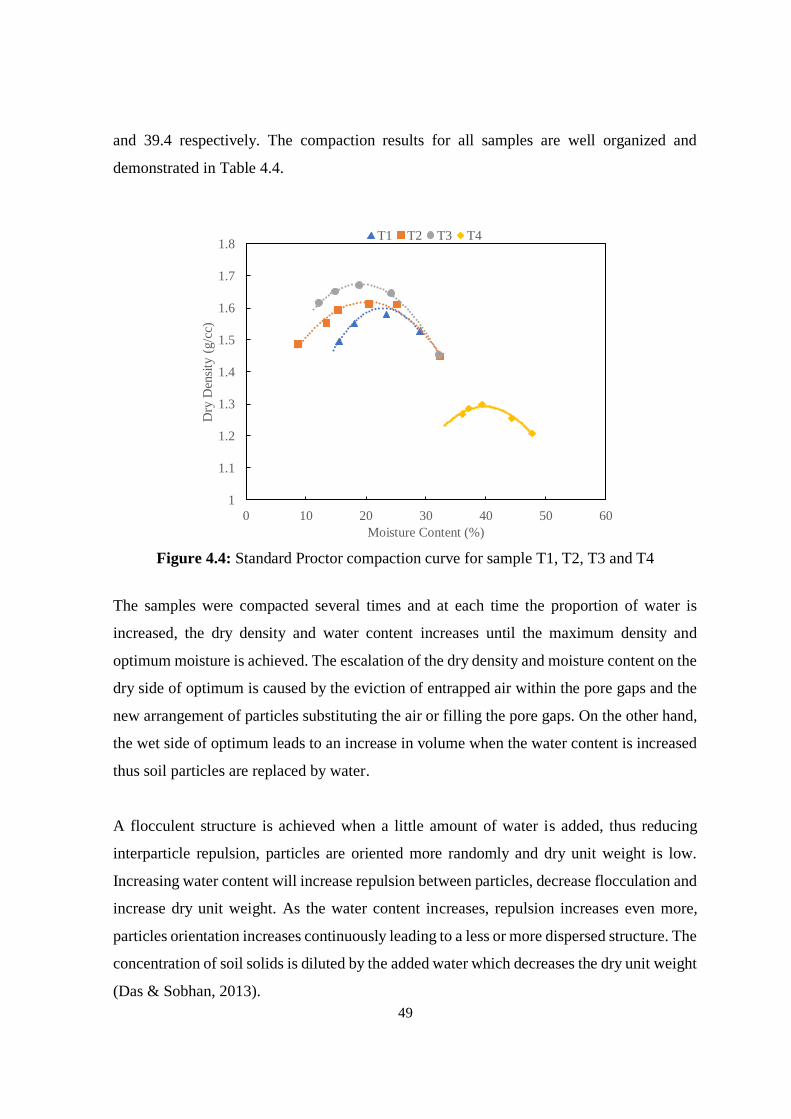
49
and 39.4 respectively. The compaction results for all samples are well organized and
demonstrated in Table 4.4.
Figure 4.4: Standard Proctor compaction curve for sample T1, T2, T3 and T4
The samples were compacted several times and at each time the proportion of water is
increased, the dry density and water content increases until the maximum density and
optimum moisture is achieved. The escalation of the dry density and moisture content on the
dry side of optimum is caused by the eviction of entrapped air within the pore gaps and the
new arrangement of particles substituting the air or filling the pore gaps. On the other hand,
the wet side of optimum leads to an increase in volume when the water content is increased
thus soil particles are replaced by water.
A flocculent structure is achieved when a little amount of water is added, thus reducing
interparticle repulsion, particles are oriented more randomly and dry unit weight is low.
Increasing water content will increase repulsion between particles, decrease flocculation and
increase dry unit weight. As the water content increases, repulsion increases even more,
particles orientation increases continuously leading to a less or more dispersed structure. The
concentration of soil solids is diluted by the added water which decreases the dry unit weight
(Das & Sobhan, 2013).
1
1.1
1.2
1.3
1.4
1.5
1.6
1.7
1.8
0 10 20 30 40 50 60
Dry
Den
sity
(g/c
c)
Moisture Content (%)
T1 T2 T3 T4
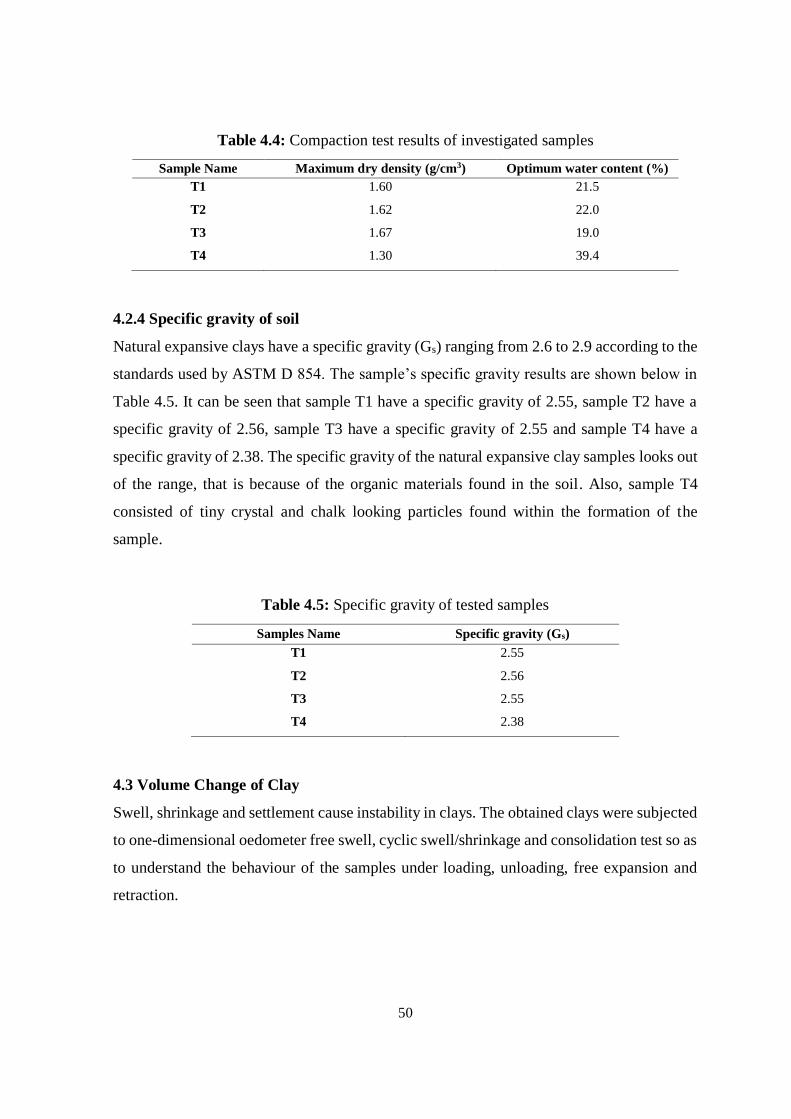
50
Table 4.4: Compaction test results of investigated samples
Sample Name Maximum dry density (g/cm3) Optimum water content (%)
T1 1.60 21.5
T2 1.62 22.0
T3 1.67 19.0
T4 1.30 39.4
4.2.4 Specific gravity of soil
Natural expansive clays have a specific gravity (Gs) ranging from 2.6 to 2.9 according to the
standards used by ASTM D 854. The sample’s specific gravity results are shown below in
Table 4.5. It can be seen that sample T1 have a specific gravity of 2.55, sample T2 have a
specific gravity of 2.56, sample T3 have a specific gravity of 2.55 and sample T4 have a
specific gravity of 2.38. The specific gravity of the natural expansive clay samples looks out
of the range, that is because of the organic materials found in the soil. Also, sample T4
consisted of tiny crystal and chalk looking particles found within the formation of the
sample.
Table 4.5: Specific gravity of tested samples
Samples Name Specific gravity (Gs)
T1 2.55
T2 2.56
T3 2.55
T4 2.38
4.3 Volume Change of Clay
Swell, shrinkage and settlement cause instability in clays. The obtained clays were subjected
to one-dimensional oedometer free swell, cyclic swell/shrinkage and consolidation test so as
to understand the behaviour of the samples under loading, unloading, free expansion and
retraction.
51
4.3.1 One-dimensional oedometer free swell
When clays are compacted and then put to swell, it should be well noted that there are some
factors which influence the swell potential of the clay samples. During compaction, water
content and dry density vary, meaning that the first factor strongly depends on the
environment and physical conditions. The nature of particles found within the clay and the
mineralogy is also a factor to be considered. The obtained samples are to be investigated for
their swelling behaviour. Oedometer test was used to carry out the one-dimensional free
swell test according to ASTM D 4546. The samples T1, T2 T3 and T4 were all compacted
at their optimum water content and maximum dry density, then cut and trimmed to fit into a
consolidation ring of 20 mm height and an inner diameter of 50 mm. The height of each
compacted soil was fixed at 14 mm in order to allow free swell in the remaining 6 mm of
the consolidation ring. A surcharge pressure of 0.125 kPa (cap weight) was applied, after
water was added, measurements began.
Full swell is to be achieved, therefore the samples were left to swell until no further change
in samples height was seen. The response of free swell in percent swell (△H/H0*100) versus
time in minutes for the obtained samples is shown below in figure 4.5, where the percent
swell is represented as axial strain (%) and time in logarithmic (min). The overall swell of
each sample consists of three stages which are the initial swell stage, primary swell stage
and secondary swell stage. The initial stage starts and ends in the first few minutes, while
the main part of the whole swell is the primary stage and finally the secondary stage which
is the part that builds up progressively from the primary stage taking the most time before
completion (Sridharan & Gurtug, 2004).
Also, Figure 4.5 represents the results of all four samples as it shows their overall swelling
behaviour from the start to maximum swell measured. It is clear that T1 has the lowest
swelling potentials with a primary swell of 3.45%, whilst T2 and T3 exhibited a higher swell
with a primary swell of 9.53% and 7.49% respectively. The highest swell was for T4 with a
primary swell of 17.4% which makes it the most expansive among all samples. The potential
expansion of the soils is classified by their Expansion Index (EI) as shown in Table 4.6 and
are calculated using equation 4.1 (ASTM D 4829-11). The results obtained were categorized
according to Table 4.6 and are shown in Table 4.7.
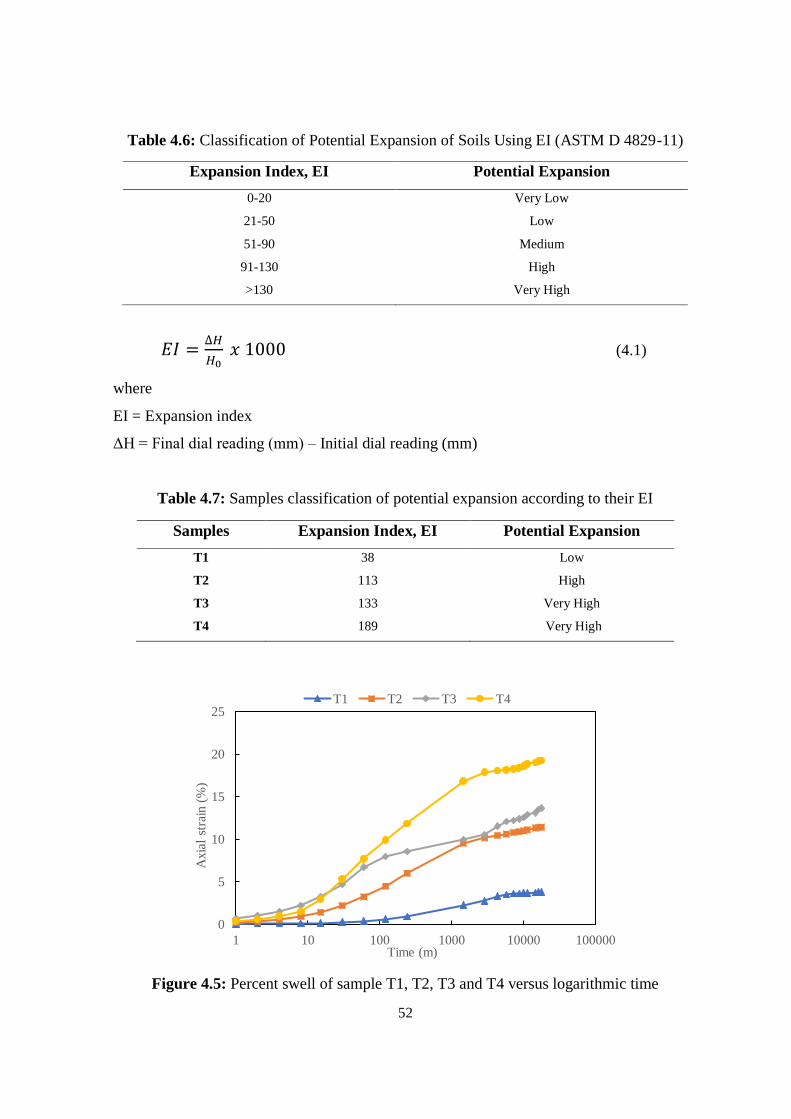
52
Table 4.6: Classification of Potential Expansion of Soils Using EI (ASTM D 4829-11)
Expansion Index, EI Potential Expansion
0-20 Very Low
21-50 Low
51-90 Medium
91-130 High
>130 Very High
𝐸𝐼 =∆𝐻
𝐻0 𝑥 1000 (4.1)
where
EI = Expansion index
ΔH = Final dial reading (mm) – Initial dial reading (mm)
Table 4.7: Samples classification of potential expansion according to their EI
Samples Expansion Index, EI Potential Expansion
T1 38 Low
T2 113 High
T3 133 Very High
T4 189 Very High
Figure 4.5: Percent swell of sample T1, T2, T3 and T4 versus logarithmic time
0
5
10
15
20
25
1 10 100 1000 10000 100000
Axia
l st
rain
(%
)
Time (m)
T1 T2 T3 T4
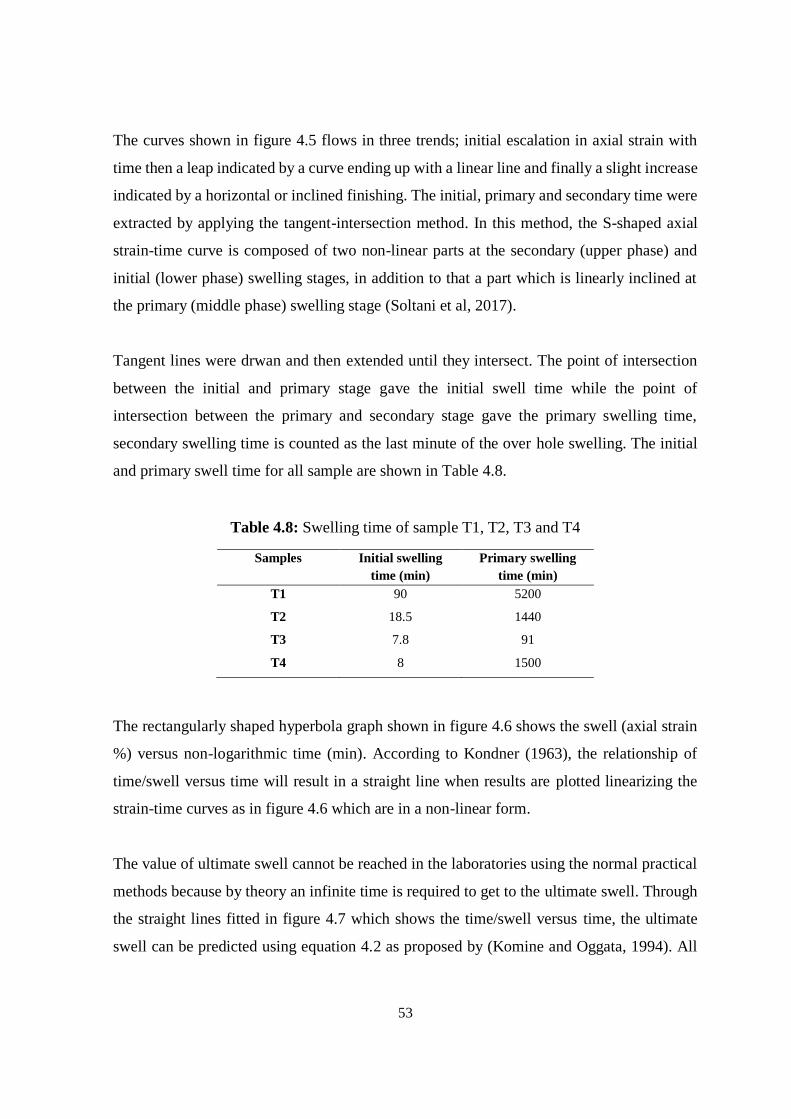
53
The curves shown in figure 4.5 flows in three trends; initial escalation in axial strain with
time then a leap indicated by a curve ending up with a linear line and finally a slight increase
indicated by a horizontal or inclined finishing. The initial, primary and secondary time were
extracted by applying the tangent-intersection method. In this method, the S-shaped axial
strain-time curve is composed of two non-linear parts at the secondary (upper phase) and
initial (lower phase) swelling stages, in addition to that a part which is linearly inclined at
the primary (middle phase) swelling stage (Soltani et al, 2017).
Tangent lines were drwan and then extended until they intersect. The point of intersection
between the initial and primary stage gave the initial swell time while the point of
intersection between the primary and secondary stage gave the primary swelling time,
secondary swelling time is counted as the last minute of the over hole swelling. The initial
and primary swell time for all sample are shown in Table 4.8.
Table 4.8: Swelling time of sample T1, T2, T3 and T4
Samples Initial swelling
time (min)
Primary swelling
time (min)
T1 90 5200
T2 18.5 1440
T3 7.8 91
T4 8 1500
The rectangularly shaped hyperbola graph shown in figure 4.6 shows the swell (axial strain
%) versus non-logarithmic time (min). According to Kondner (1963), the relationship of
time/swell versus time will result in a straight line when results are plotted linearizing the
strain-time curves as in figure 4.6 which are in a non-linear form.
The value of ultimate swell cannot be reached in the laboratories using the normal practical
methods because by theory an infinite time is required to get to the ultimate swell. Through
the straight lines fitted in figure 4.7 which shows the time/swell versus time, the ultimate
swell can be predicted using equation 4.2 as proposed by (Komine and Oggata, 1994). All
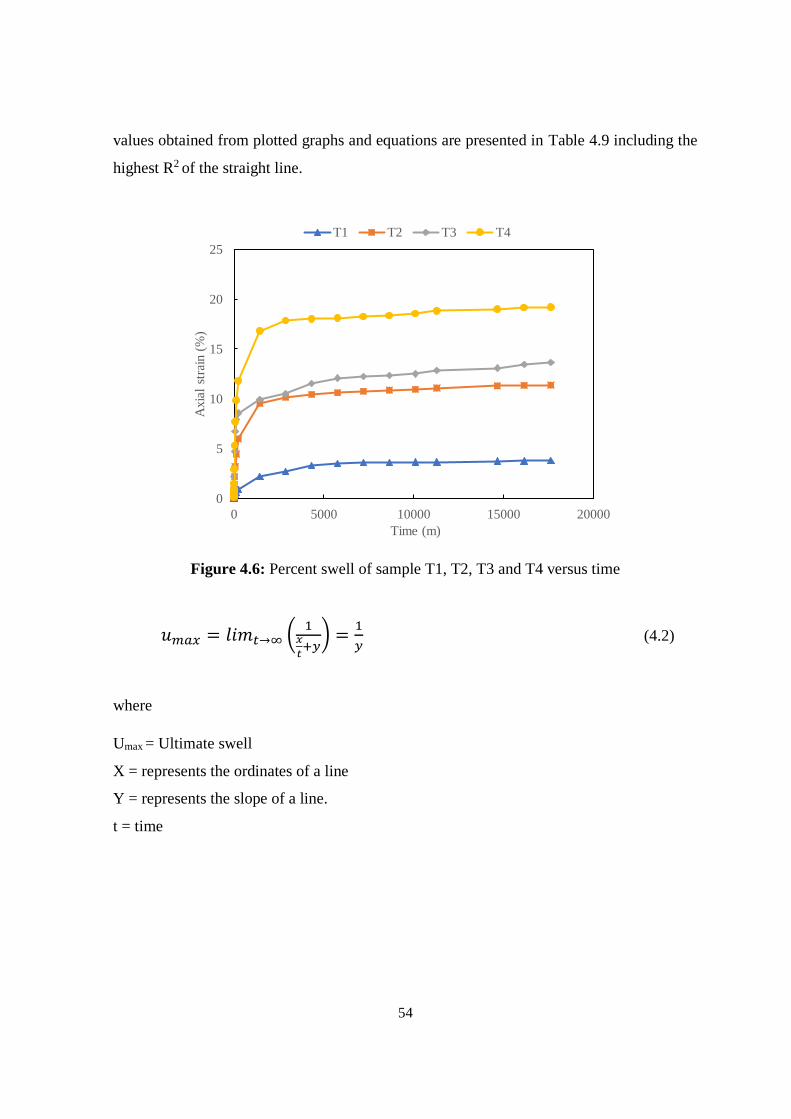
54
values obtained from plotted graphs and equations are presented in Table 4.9 including the
highest R2 of the straight line.
Figure 4.6: Percent swell of sample T1, T2, T3 and T4 versus time
𝑢𝑚𝑎𝑥 = 𝑙𝑖𝑚𝑡→∞ (1
𝑥
𝑡+𝑦
) =1
𝑦 (4.2)
where
Umax = Ultimate swell
X = represents the ordinates of a line
Y = represents the slope of a line.
t = time
0
5
10
15
20
25
0 5000 10000 15000 20000
Axia
l st
rain
(%
)
Time (m)
T1 T2 T3 T4
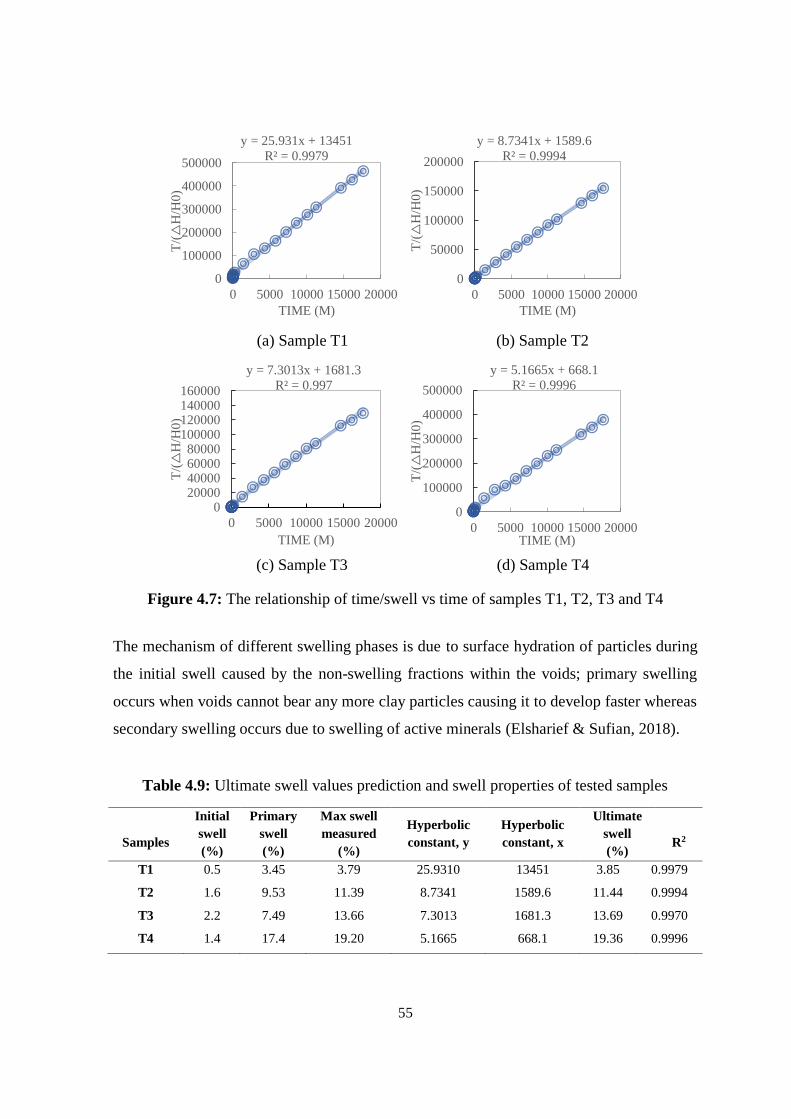
55
(a) Sample T1 (b) Sample T2
Figure 4.7: The relationship of time/swell vs time of samples T1, T2, T3 and T4
The mechanism of different swelling phases is due to surface hydration of particles during
the initial swell caused by the non-swelling fractions within the voids; primary swelling
occurs when voids cannot bear any more clay particles causing it to develop faster whereas
secondary swelling occurs due to swelling of active minerals (Elsharief & Sufian, 2018).
Table 4.9: Ultimate swell values prediction and swell properties of tested samples
Samples
Initial
swell
(%)
Primary
swell
(%)
Max swell
measured
(%)
Hyperbolic
constant, y
Hyperbolic
constant, x
Ultimate
swell
(%)
R2
T1 0.5 3.45 3.79 25.9310 13451 3.85 0.9979
T2 1.6 9.53 11.39 8.7341 1589.6 11.44 0.9994
T3 2.2 7.49 13.66 7.3013 1681.3 13.69 0.9970
T4 1.4 17.4 19.20 5.1665 668.1 19.36 0.9996
y = 25.931x + 13451
R² = 0.9979
0
100000
200000
300000
400000
500000
0 5000 10000 15000 20000
T/(△
H/H
0)
TIME (M)
y = 8.7341x + 1589.6
R² = 0.9994
0
50000
100000
150000
200000
0 5000 10000 15000 20000
T/(△
H/H
0)
TIME (M)
y = 7.3013x + 1681.3
R² = 0.997
020000400006000080000
100000120000140000160000
0 5000 10000 15000 20000
T/(△
H/H
0)
TIME (M)
y = 5.1665x + 668.1
R² = 0.9996
0
100000
200000
300000
400000
500000
0 5000 10000 15000 20000
T/(△
H/H
0)
TIME (M)
(d) Sample T4 (c) Sample T3
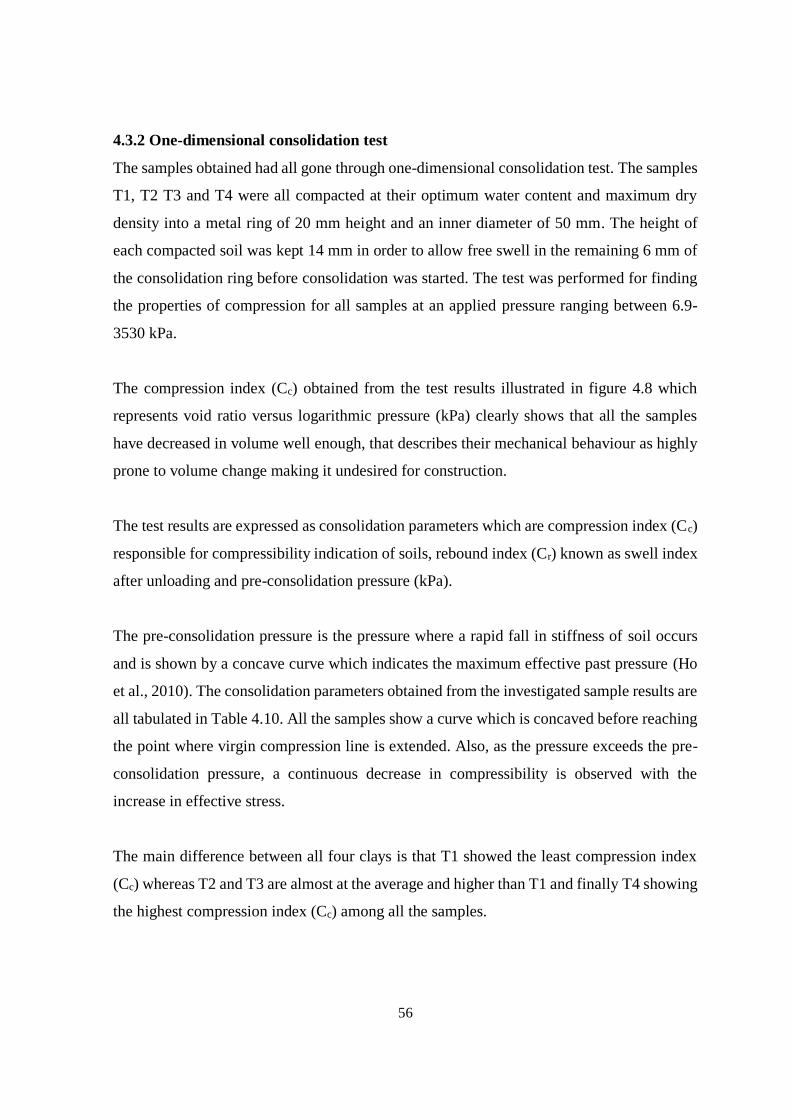
56
4.3.2 One-dimensional consolidation test
The samples obtained had all gone through one-dimensional consolidation test. The samples
T1, T2 T3 and T4 were all compacted at their optimum water content and maximum dry
density into a metal ring of 20 mm height and an inner diameter of 50 mm. The height of
each compacted soil was kept 14 mm in order to allow free swell in the remaining 6 mm of
the consolidation ring before consolidation was started. The test was performed for finding
the properties of compression for all samples at an applied pressure ranging between 6.9-
3530 kPa.
The compression index (Cc) obtained from the test results illustrated in figure 4.8 which
represents void ratio versus logarithmic pressure (kPa) clearly shows that all the samples
have decreased in volume well enough, that describes their mechanical behaviour as highly
prone to volume change making it undesired for construction.
The test results are expressed as consolidation parameters which are compression index (Cc)
responsible for compressibility indication of soils, rebound index (Cr) known as swell index
after unloading and pre-consolidation pressure (kPa).
The pre-consolidation pressure is the pressure where a rapid fall in stiffness of soil occurs
and is shown by a concave curve which indicates the maximum effective past pressure (Ho
et al., 2010). The consolidation parameters obtained from the investigated sample results are
all tabulated in Table 4.10. All the samples show a curve which is concaved before reaching
the point where virgin compression line is extended. Also, as the pressure exceeds the pre-
consolidation pressure, a continuous decrease in compressibility is observed with the
increase in effective stress.
The main difference between all four clays is that T1 showed the least compression index
(Cc) whereas T2 and T3 are almost at the average and higher than T1 and finally T4 showing
the highest compression index (Cc) among all the samples.
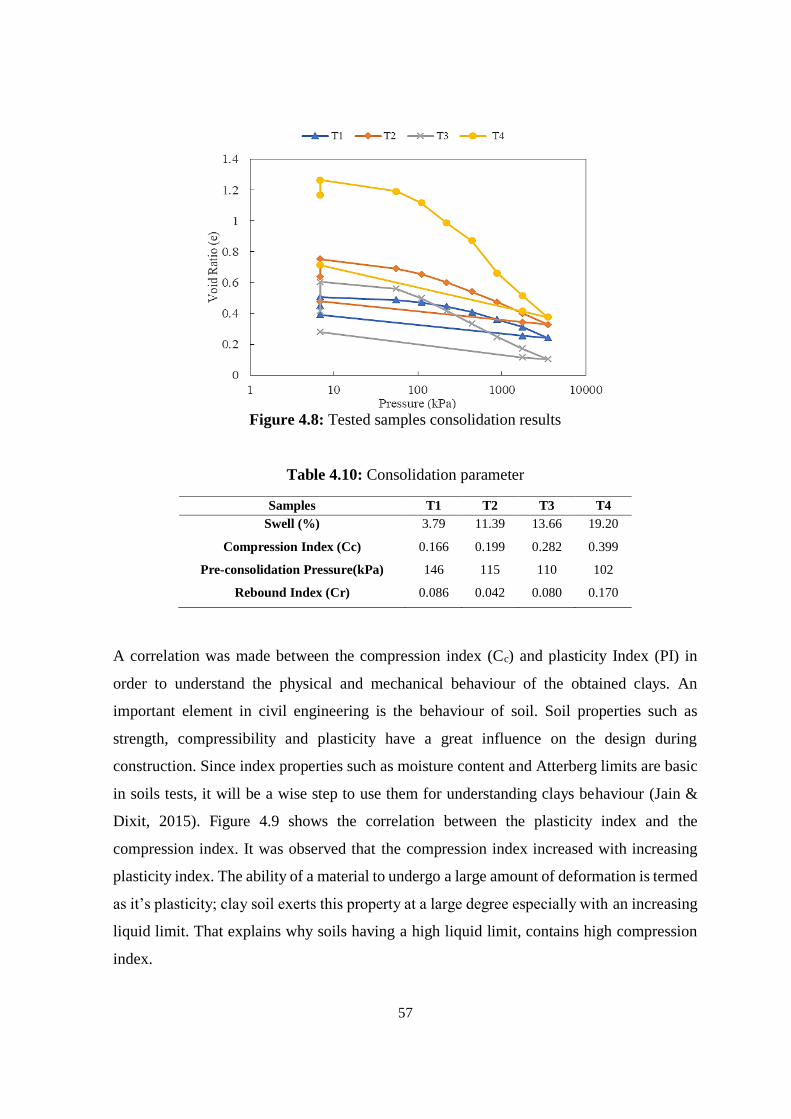
57
Figure 4.8: Tested samples consolidation results
Table 4.10: Consolidation parameter
Samples T1 T2 T3 T4
Swell (%) 3.79 11.39 13.66 19.20
Compression Index (Cc) 0.166 0.199 0.282 0.399
Pre-consolidation Pressure(kPa) 146 115 110 102
Rebound Index (Cr) 0.086 0.042 0.080 0.170
A correlation was made between the compression index (Cc) and plasticity Index (PI) in
order to understand the physical and mechanical behaviour of the obtained clays. An
important element in civil engineering is the behaviour of soil. Soil properties such as
strength, compressibility and plasticity have a great influence on the design during
construction. Since index properties such as moisture content and Atterberg limits are basic
in soils tests, it will be a wise step to use them for understanding clays behaviour (Jain &
Dixit, 2015). Figure 4.9 shows the correlation between the plasticity index and the
compression index. It was observed that the compression index increased with increasing
plasticity index. The ability of a material to undergo a large amount of deformation is termed
as it’s plasticity; clay soil exerts this property at a large degree especially with an increasing
liquid limit. That explains why soils having a high liquid limit, contains high compression
index.
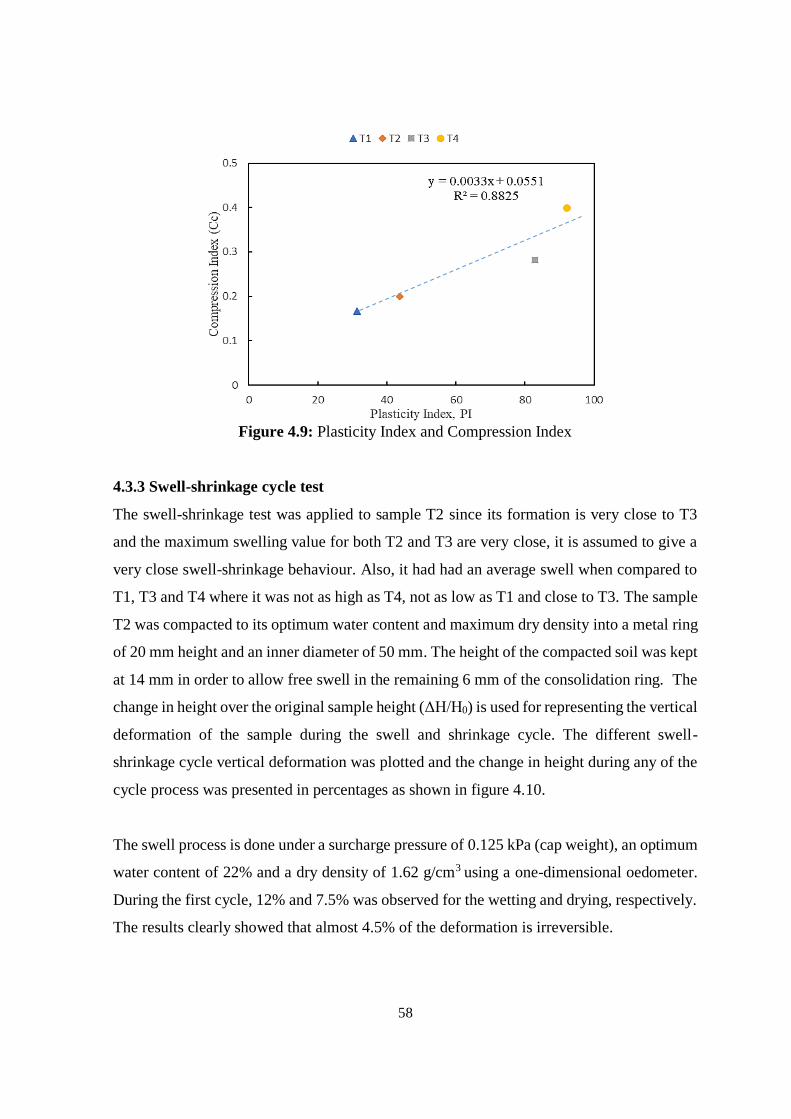
58
Figure 4.9: Plasticity Index and Compression Index
4.3.3 Swell-shrinkage cycle test
The swell-shrinkage test was applied to sample T2 since its formation is very close to T3
and the maximum swelling value for both T2 and T3 are very close, it is assumed to give a
very close swell-shrinkage behaviour. Also, it had had an average swell when compared to
T1, T3 and T4 where it was not as high as T4, not as low as T1 and close to T3. The sample
T2 was compacted to its optimum water content and maximum dry density into a metal ring
of 20 mm height and an inner diameter of 50 mm. The height of the compacted soil was kept
at 14 mm in order to allow free swell in the remaining 6 mm of the consolidation ring. The
change in height over the original sample height (ΔH/H0) is used for representing the vertical
deformation of the sample during the swell and shrinkage cycle. The different swell-
shrinkage cycle vertical deformation was plotted and the change in height during any of the
cycle process was presented in percentages as shown in figure 4.10.
The swell process is done under a surcharge pressure of 0.125 kPa (cap weight), an optimum
water content of 22% and a dry density of 1.62 g/cm3 using a one-dimensional oedometer.
During the first cycle, 12% and 7.5% was observed for the wetting and drying, respectively.
The results clearly showed that almost 4.5% of the deformation is irreversible.
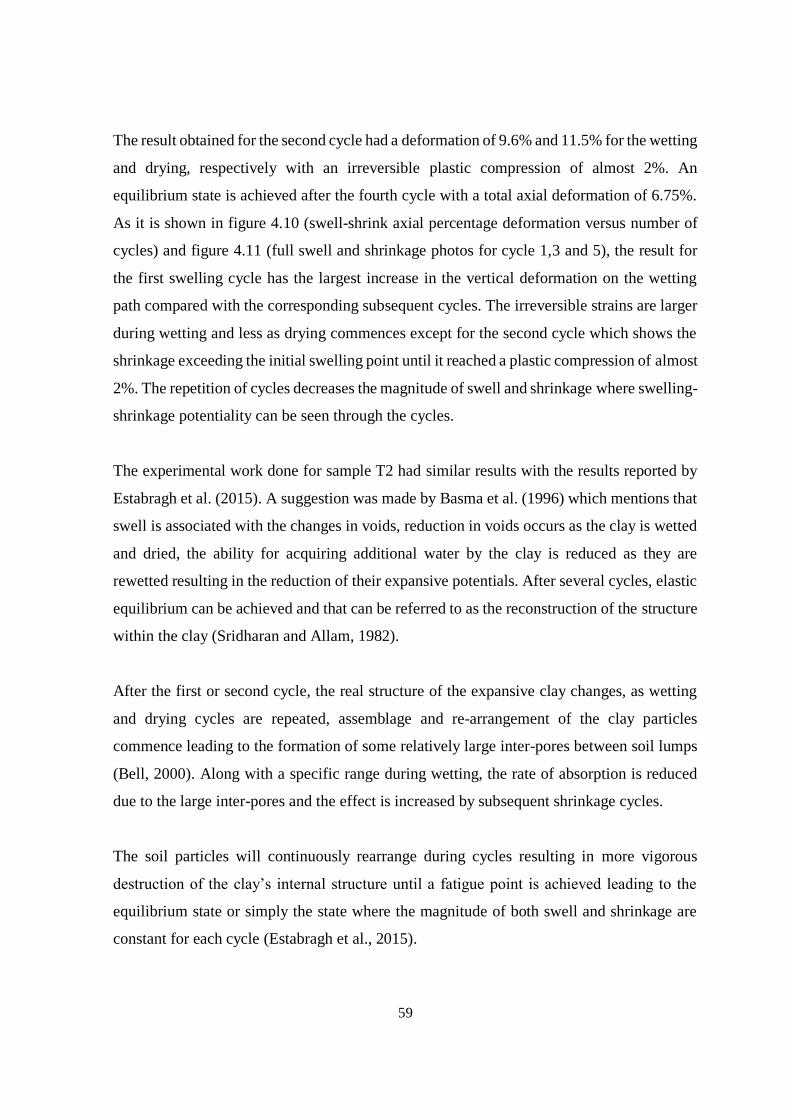
59
The result obtained for the second cycle had a deformation of 9.6% and 11.5% for the wetting
and drying, respectively with an irreversible plastic compression of almost 2%. An
equilibrium state is achieved after the fourth cycle with a total axial deformation of 6.75%.
As it is shown in figure 4.10 (swell-shrink axial percentage deformation versus number of
cycles) and figure 4.11 (full swell and shrinkage photos for cycle 1,3 and 5), the result for
the first swelling cycle has the largest increase in the vertical deformation on the wetting
path compared with the corresponding subsequent cycles. The irreversible strains are larger
during wetting and less as drying commences except for the second cycle which shows the
shrinkage exceeding the initial swelling point until it reached a plastic compression of almost
2%. The repetition of cycles decreases the magnitude of swell and shrinkage where swelling-
shrinkage potentiality can be seen through the cycles.
The experimental work done for sample T2 had similar results with the results reported by
Estabragh et al. (2015). A suggestion was made by Basma et al. (1996) which mentions that
swell is associated with the changes in voids, reduction in voids occurs as the clay is wetted
and dried, the ability for acquiring additional water by the clay is reduced as they are
rewetted resulting in the reduction of their expansive potentials. After several cycles, elastic
equilibrium can be achieved and that can be referred to as the reconstruction of the structure
within the clay (Sridharan and Allam, 1982).
After the first or second cycle, the real structure of the expansive clay changes, as wetting
and drying cycles are repeated, assemblage and re-arrangement of the clay particles
commence leading to the formation of some relatively large inter-pores between soil lumps
(Bell, 2000). Along with a specific range during wetting, the rate of absorption is reduced
due to the large inter-pores and the effect is increased by subsequent shrinkage cycles.
The soil particles will continuously rearrange during cycles resulting in more vigorous
destruction of the clay’s internal structure until a fatigue point is achieved leading to the
equilibrium state or simply the state where the magnitude of both swell and shrinkage are
constant for each cycle (Estabragh et al., 2015).
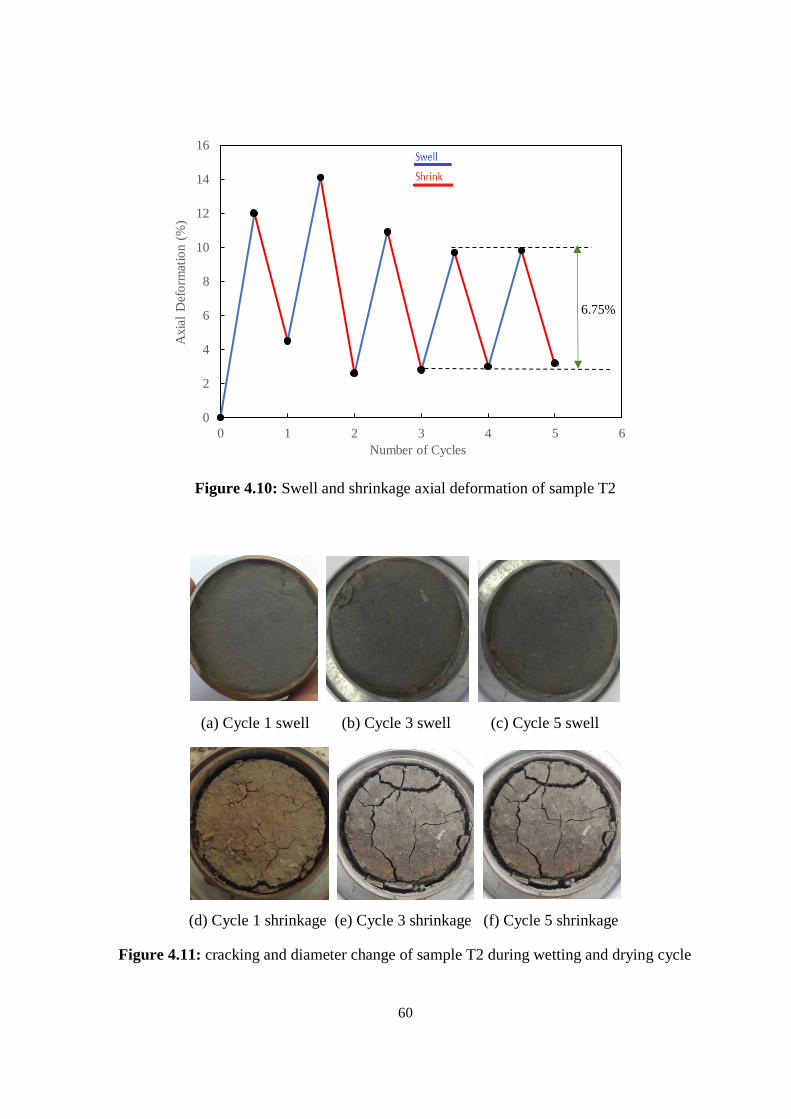
60
Figure 4.10: Swell and shrinkage axial deformation of sample T2
(a) Cycle 1 swell (b) Cycle 3 swell (c) Cycle 5 swell
(d) Cycle 1 shrinkage (e) Cycle 3 shrinkage (f) Cycle 5 shrinkage
Figure 4.11: cracking and diameter change of sample T2 during wetting and drying cycle
0
2
4
6
8
10
12
14
16
0 1 2 3 4 5 6
Axia
l D
efo
rmat
ion (
%)
Number of Cycles
6.75%
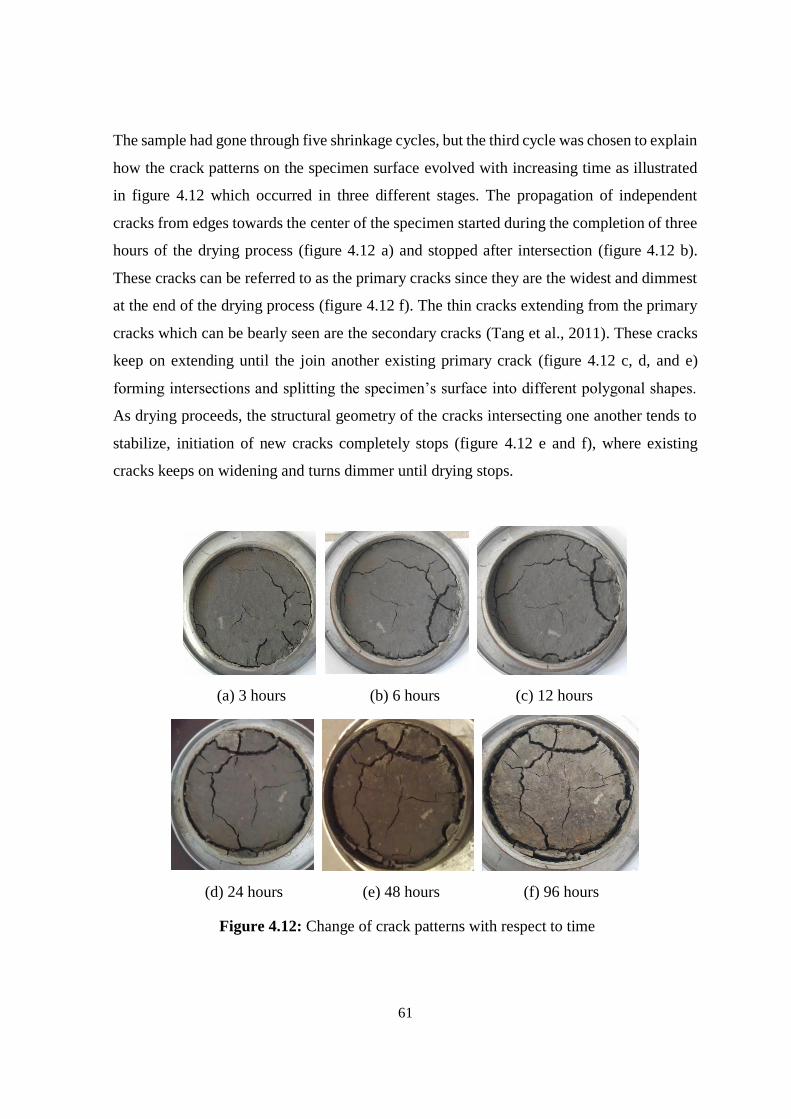
61
The sample had gone through five shrinkage cycles, but the third cycle was chosen to explain
how the crack patterns on the specimen surface evolved with increasing time as illustrated
in figure 4.12 which occurred in three different stages. The propagation of independent
cracks from edges towards the center of the specimen started during the completion of three
hours of the drying process (figure 4.12 a) and stopped after intersection (figure 4.12 b).
These cracks can be referred to as the primary cracks since they are the widest and dimmest
at the end of the drying process (figure 4.12 f). The thin cracks extending from the primary
cracks which can be bearly seen are the secondary cracks (Tang et al., 2011). These cracks
keep on extending until the join another existing primary crack (figure 4.12 c, d, and e)
forming intersections and splitting the specimen’s surface into different polygonal shapes.
As drying proceeds, the structural geometry of the cracks intersecting one another tends to
stabilize, initiation of new cracks completely stops (figure 4.12 e and f), where existing
cracks keeps on widening and turns dimmer until drying stops.
(a) 3 hours (b) 6 hours (c) 12 hours
(d) 24 hours (e) 48 hours (f) 96 hours
Figure 4.12: Change of crack patterns with respect to time
62
The diameter and vertical deformation of the specimen were measured using a calliper
during shrinkage and a dial gauge for only swell during wetting. The diameter during swell
is taken as maximum which means 50 mm. The variation of the results for both the height
and diameter are shown in figure 4.13. The obtained results showed that the lateral
deformation (change in diameter) is less than the axial deformation ( vertical change) during
the wetting and drying cycles even when equilibrium was achieved. During the equilibrium
stage, the average axial deformation obtained was 6.75% while the average lateral
deformation was 5.53%. According to (Tang et al, 2008), if the radial and axial strains are
equal, isotropic behaviour is shown by the sample. The results obtained from the wetting
and drying cycle applied to sample T2 does not match with (Tang et al, 2008) meaning that
the sample will behave anisotropically.
Figure 4.13: Lateral and axial deformation of sample T2 during wetting and drying cycle
4.4 Soil Strength Test
Soil strength test was applied to the obtained soil samples in order to identify the internal
resistance of the samples to deformation caused by external compressive and shear forces.
When the compressive and shear forces exceeded the maximum force the samples could
resist, failure occurred. Shear box test and unconfined compressive test were used for
identifying the peak shear stress and compressive failure point of the obtained samples.
-10
-5
0
5
10
15
20
0 1 2 3 4 5 6
Def
orm
atio
n (
%)
Number of cycles
Axial deformation / \
6.75%
5.53%
Lateral deformation↗↘
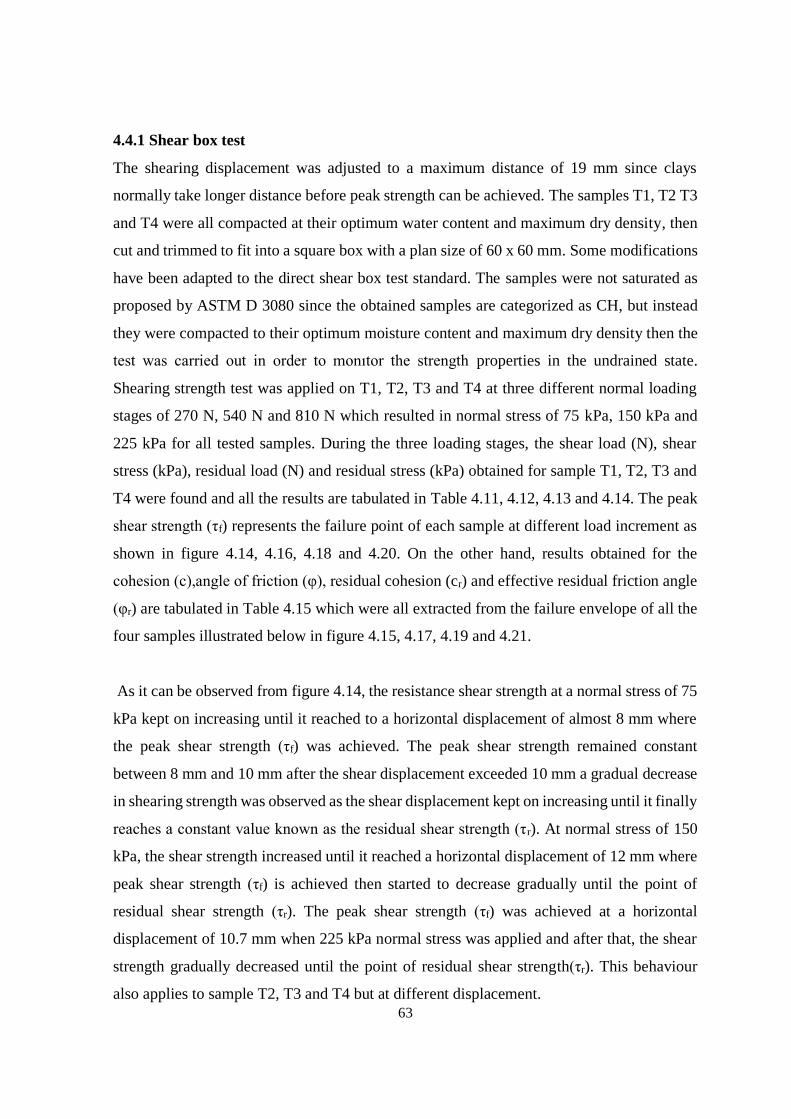
63
4.4.1 Shear box test
The shearing displacement was adjusted to a maximum distance of 19 mm since clays
normally take longer distance before peak strength can be achieved. The samples T1, T2 T3
and T4 were all compacted at their optimum water content and maximum dry density, then
cut and trimmed to fit into a square box with a plan size of 60 x 60 mm. Some modifications
have been adapted to the direct shear box test standard. The samples were not saturated as
proposed by ASTM D 3080 since the obtained samples are categorized as CH, but instead
they were compacted to their optimum moisture content and maximum dry density then the
test was carried out in order to monıtor the strength properties in the undrained state.
Shearing strength test was applied on T1, T2, T3 and T4 at three different normal loading
stages of 270 N, 540 N and 810 N which resulted in normal stress of 75 kPa, 150 kPa and
225 kPa for all tested samples. During the three loading stages, the shear load (N), shear
stress (kPa), residual load (N) and residual stress (kPa) obtained for sample T1, T2, T3 and
T4 were found and all the results are tabulated in Table 4.11, 4.12, 4.13 and 4.14. The peak
shear strength (τf) represents the failure point of each sample at different load increment as
shown in figure 4.14, 4.16, 4.18 and 4.20. On the other hand, results obtained for the
cohesion (c),angle of friction (φ), residual cohesion (cr) and effective residual friction angle
(φr) are tabulated in Table 4.15 which were all extracted from the failure envelope of all the
four samples illustrated below in figure 4.15, 4.17, 4.19 and 4.21.
As it can be observed from figure 4.14, the resistance shear strength at a normal stress of 75
kPa kept on increasing until it reached to a horizontal displacement of almost 8 mm where
the peak shear strength (τf) was achieved. The peak shear strength remained constant
between 8 mm and 10 mm after the shear displacement exceeded 10 mm a gradual decrease
in shearing strength was observed as the shear displacement kept on increasing until it finally
reaches a constant value known as the residual shear strength (τr). At normal stress of 150
kPa, the shear strength increased until it reached a horizontal displacement of 12 mm where
peak shear strength (τf) is achieved then started to decrease gradually until the point of
residual shear strength (τr). The peak shear strength (τf) was achieved at a horizontal
displacement of 10.7 mm when 225 kPa normal stress was applied and after that, the shear
strength gradually decreased until the point of residual shear strength(τr). This behaviour
also applies to sample T2, T3 and T4 but at different displacement.
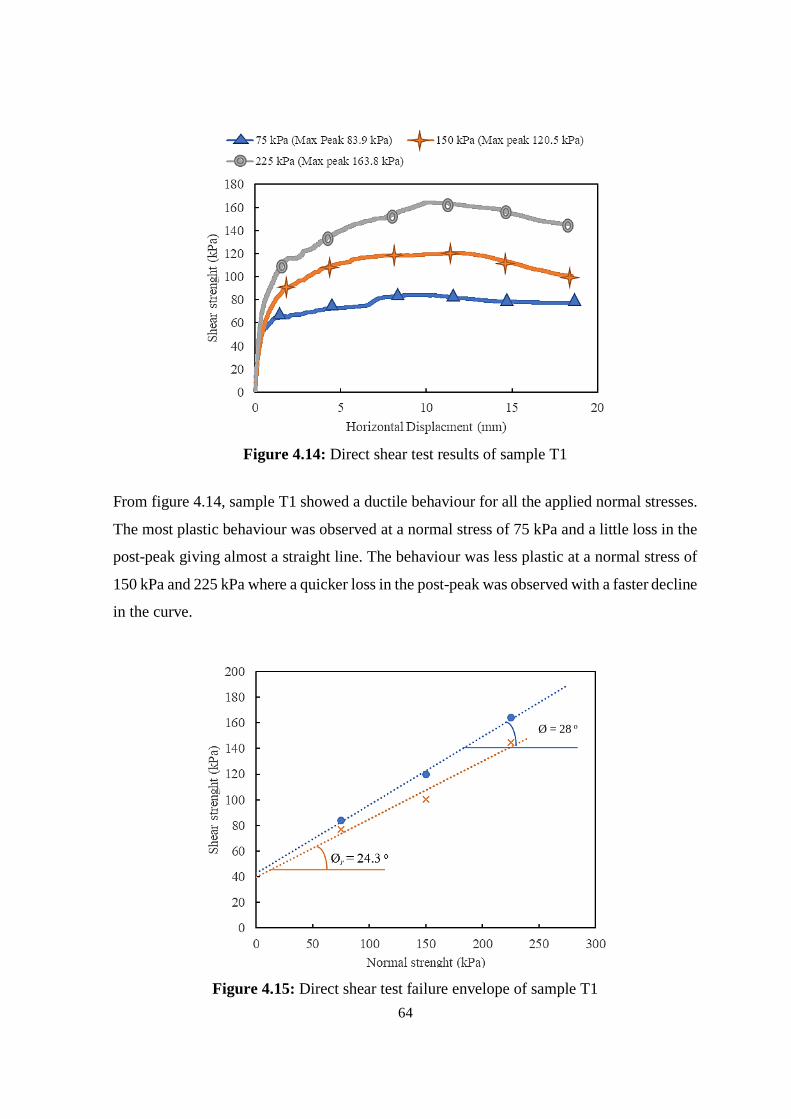
64
Figure 4.14: Direct shear test results of sample T1
From figure 4.14, sample T1 showed a ductile behaviour for all the applied normal stresses.
The most plastic behaviour was observed at a normal stress of 75 kPa and a little loss in the
post-peak giving almost a straight line. The behaviour was less plastic at a normal stress of
150 kPa and 225 kPa where a quicker loss in the post-peak was observed with a faster decline
in the curve.
Figure 4.15: Direct shear test failure envelope of sample T1
Ø = 28 o
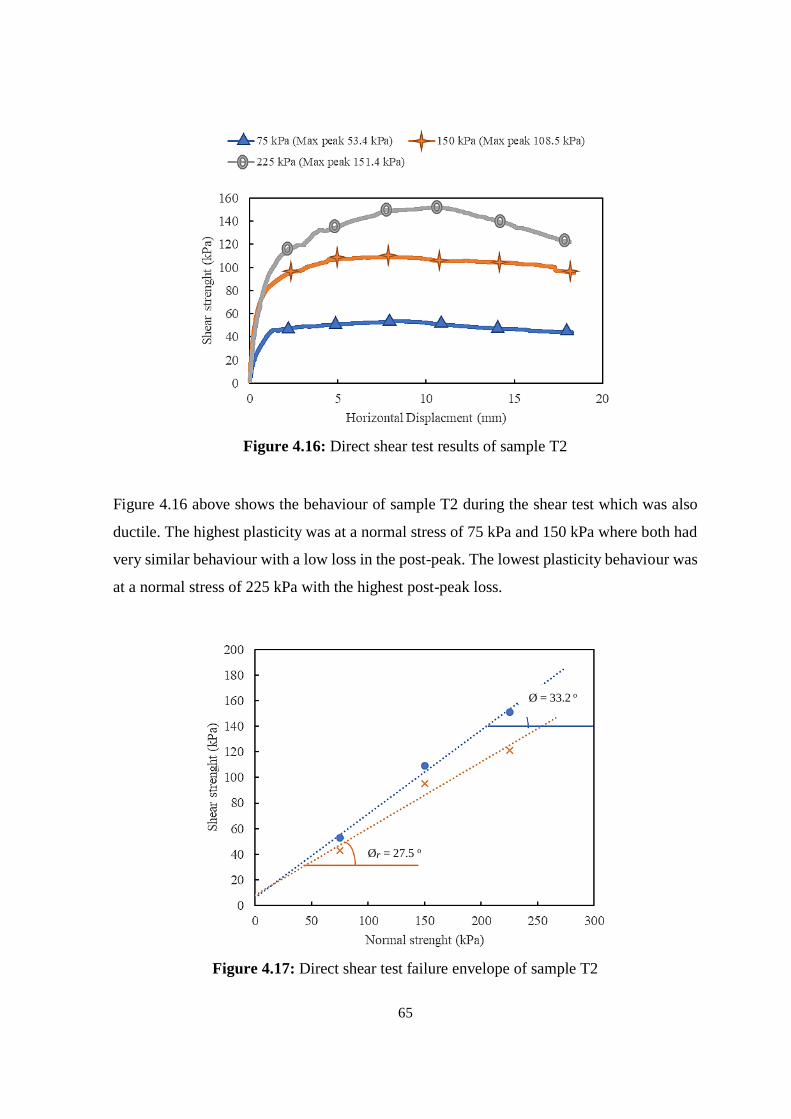
65
Figure 4.16: Direct shear test results of sample T2
Figure 4.16 above shows the behaviour of sample T2 during the shear test which was also
ductile. The highest plasticity was at a normal stress of 75 kPa and 150 kPa where both had
very similar behaviour with a low loss in the post-peak. The lowest plasticity behaviour was
at a normal stress of 225 kPa with the highest post-peak loss.
Figure 4.17: Direct shear test failure envelope of sample T2
Ø = 33.2 o
Ør = 27.5 o
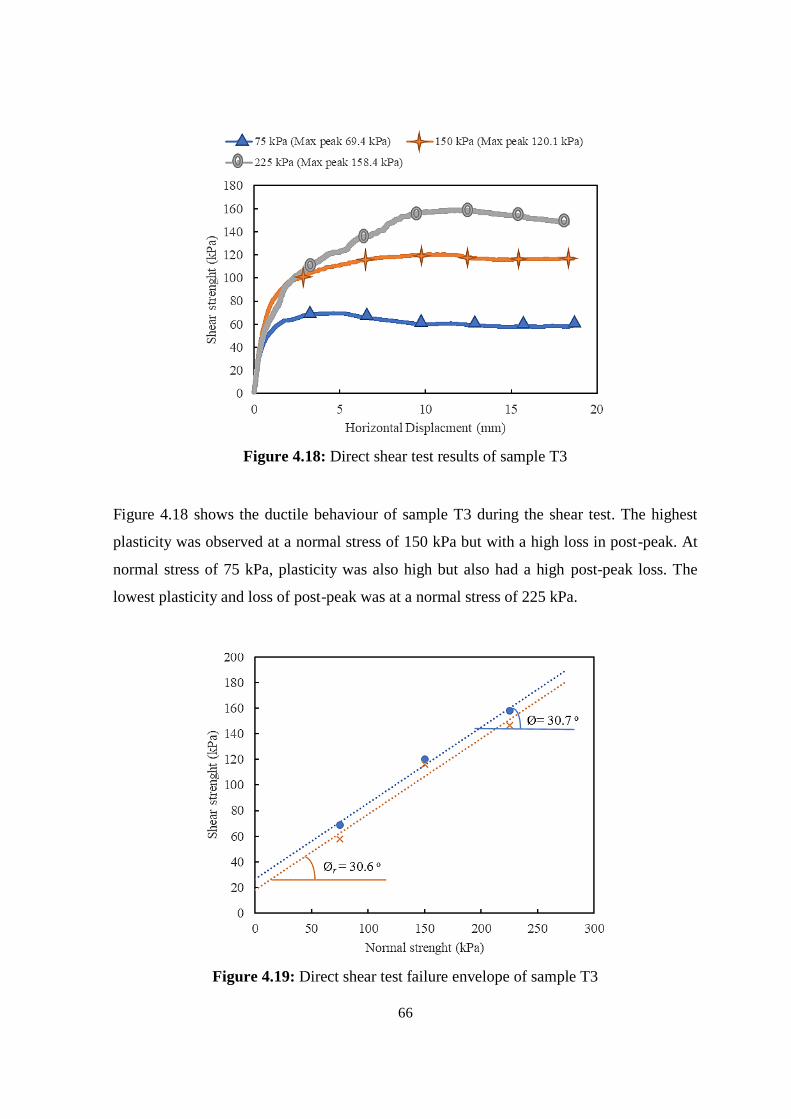
66
Figure 4.18: Direct shear test results of sample T3
Figure 4.18 shows the ductile behaviour of sample T3 during the shear test. The highest
plasticity was observed at a normal stress of 150 kPa but with a high loss in post-peak. At
normal stress of 75 kPa, plasticity was also high but also had a high post-peak loss. The
lowest plasticity and loss of post-peak was at a normal stress of 225 kPa.
Figure 4.19: Direct shear test failure envelope of sample T3
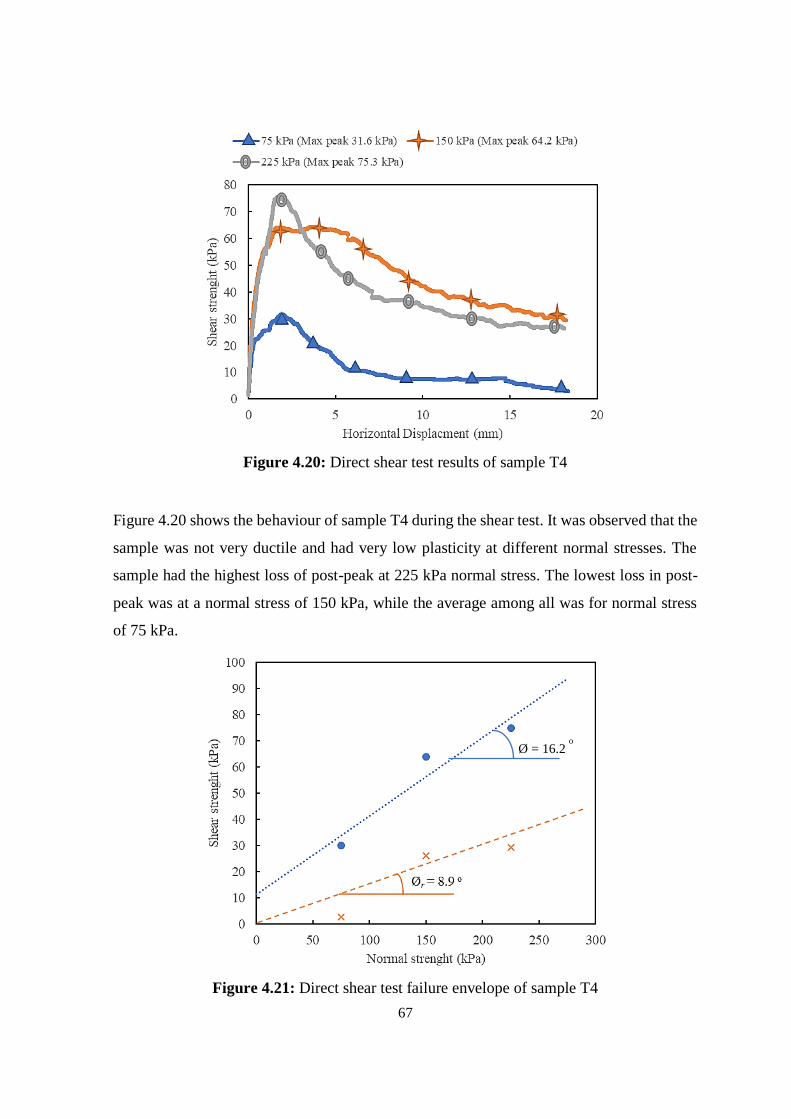
67
Figure 4.20: Direct shear test results of sample T4
Figure 4.20 shows the behaviour of sample T4 during the shear test. It was observed that the
sample was not very ductile and had very low plasticity at different normal stresses. The
sample had the highest loss of post-peak at 225 kPa normal stress. The lowest loss in post-
peak was at a normal stress of 150 kPa, while the average among all was for normal stress
of 75 kPa.
Figure 4.21: Direct shear test failure envelope of sample T4
Ø = 16.2 o
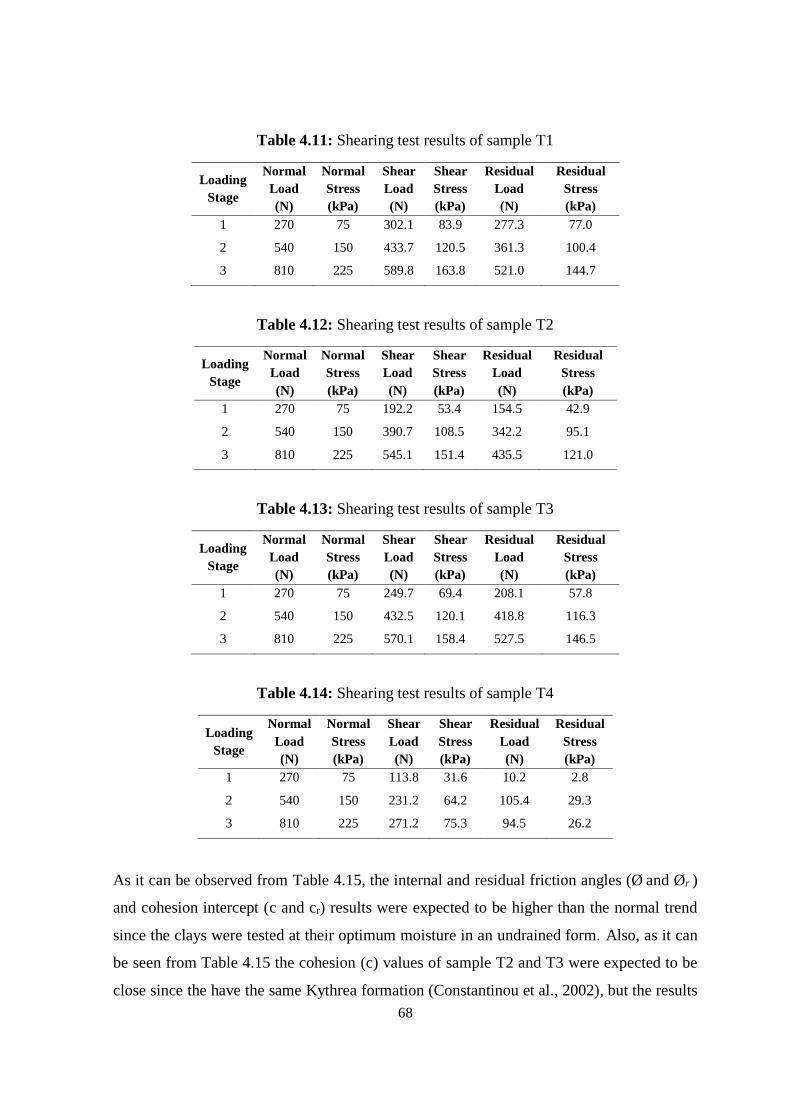
68
Table 4.11: Shearing test results of sample T1
Loading
Stage
Normal
Load
(N)
Normal
Stress
(kPa)
Shear
Load
(N)
Shear
Stress
(kPa)
Residual
Load
(N)
Residual
Stress
(kPa)
1 270 75 302.1 83.9 277.3 77.0
2 540 150 433.7 120.5 361.3 100.4
3 810 225 589.8 163.8 521.0 144.7
Table 4.12: Shearing test results of sample T2
Loading
Stage
Normal
Load
(N)
Normal
Stress
(kPa)
Shear
Load
(N)
Shear
Stress
(kPa)
Residual
Load
(N)
Residual
Stress
(kPa)
1 270 75 192.2 53.4 154.5 42.9
2 540 150 390.7 108.5 342.2 95.1
3 810 225 545.1 151.4 435.5 121.0
Table 4.13: Shearing test results of sample T3
Loading
Stage
Normal
Load
(N)
Normal
Stress
(kPa)
Shear
Load
(N)
Shear
Stress
(kPa)
Residual
Load
(N)
Residual
Stress
(kPa)
1 270 75 249.7 69.4 208.1 57.8
2 540 150 432.5 120.1 418.8 116.3
3 810 225 570.1 158.4 527.5 146.5
Table 4.14: Shearing test results of sample T4
Loading
Stage
Normal
Load
(N)
Normal
Stress
(kPa)
Shear
Load
(N)
Shear
Stress
(kPa)
Residual
Load
(N)
Residual
Stress
(kPa)
1 270 75 113.8 31.6 10.2 2.8
2 540 150 231.2 64.2 105.4 29.3
3 810 225 271.2 75.3 94.5 26.2
As it can be observed from Table 4.15, the internal and residual friction angles (Ø and Ør )
and cohesion intercept (c and cr) results were expected to be higher than the normal trend
since the clays were tested at their optimum moisture in an undrained form. Also, as it can
be seen from Table 4.15 the cohesion (c) values of sample T2 and T3 were expected to be
close since the have the same Kythrea formation (Constantinou et al., 2002), but the results
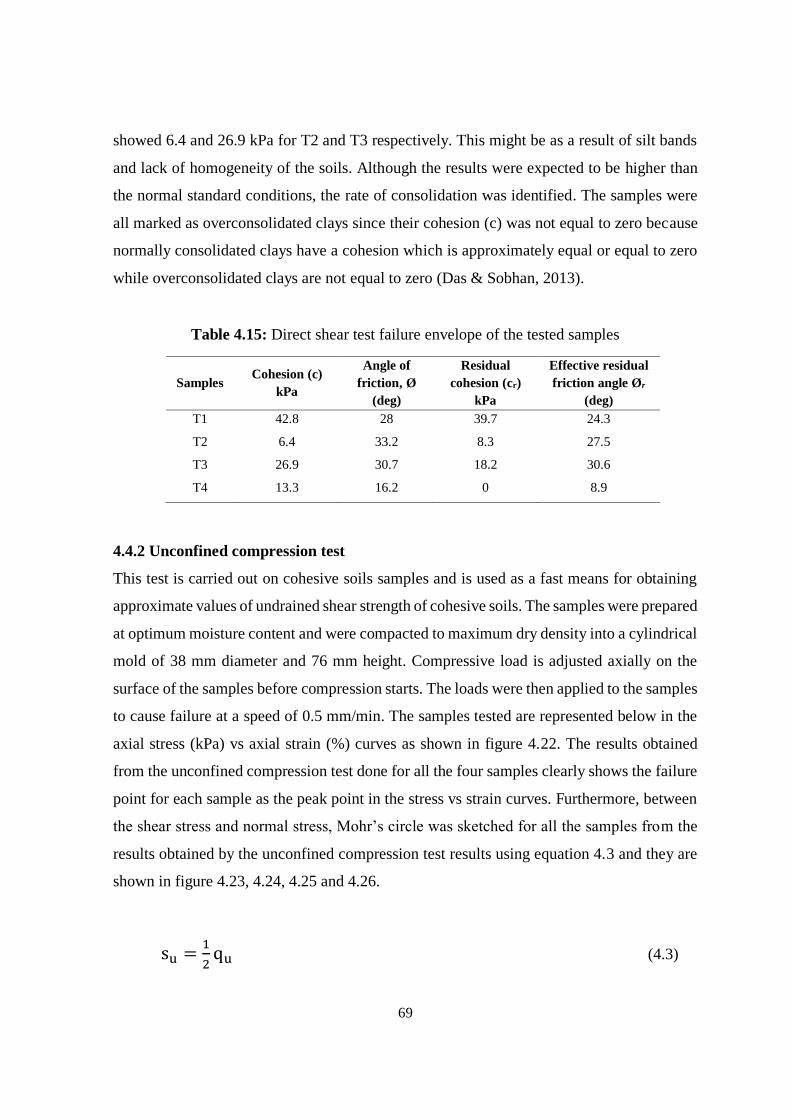
69
showed 6.4 and 26.9 kPa for T2 and T3 respectively. This might be as a result of silt bands
and lack of homogeneity of the soils. Although the results were expected to be higher than
the normal standard conditions, the rate of consolidation was identified. The samples were
all marked as overconsolidated clays since their cohesion (c) was not equal to zero because
normally consolidated clays have a cohesion which is approximately equal or equal to zero
while overconsolidated clays are not equal to zero (Das & Sobhan, 2013).
Table 4.15: Direct shear test failure envelope of the tested samples
Samples Cohesion (c)
kPa
Angle of
friction, Ø
(deg)
Residual
cohesion (cr)
kPa
Effective residual
friction angle Ør
(deg)
T1 42.8 28 39.7 24.3
T2 6.4 33.2 8.3 27.5
T3 26.9 30.7 18.2 30.6
T4 13.3 16.2 0 8.9
4.4.2 Unconfined compression test
This test is carried out on cohesive soils samples and is used as a fast means for obtaining
approximate values of undrained shear strength of cohesive soils. The samples were prepared
at optimum moisture content and were compacted to maximum dry density into a cylindrical
mold of 38 mm diameter and 76 mm height. Compressive load is adjusted axially on the
surface of the samples before compression starts. The loads were then applied to the samples
to cause failure at a speed of 0.5 mm/min. The samples tested are represented below in the
axial stress (kPa) vs axial strain (%) curves as shown in figure 4.22. The results obtained
from the unconfined compression test done for all the four samples clearly shows the failure
point for each sample as the peak point in the stress vs strain curves. Furthermore, between
the shear stress and normal stress, Mohr’s circle was sketched for all the samples from the
results obtained by the unconfined compression test results using equation 4.3 and they are
shown in figure 4.23, 4.24, 4.25 and 4.26.
su =1
2qu (4.3)
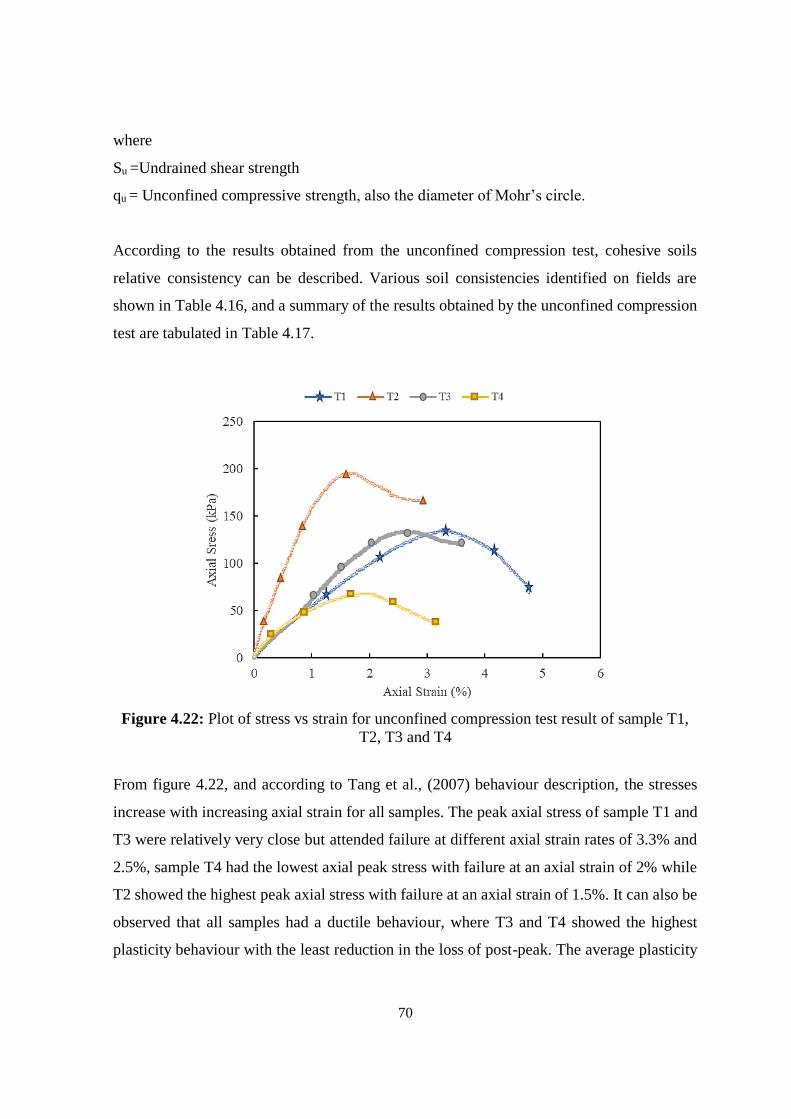
70
where
Su =Undrained shear strength
qu = Unconfined compressive strength, also the diameter of Mohr’s circle.
According to the results obtained from the unconfined compression test, cohesive soils
relative consistency can be described. Various soil consistencies identified on fields are
shown in Table 4.16, and a summary of the results obtained by the unconfined compression
test are tabulated in Table 4.17.
Figure 4.22: Plot of stress vs strain for unconfined compression test result of sample T1,
T2, T3 and T4
From figure 4.22, and according to Tang et al., (2007) behaviour description, the stresses
increase with increasing axial strain for all samples. The peak axial stress of sample T1 and
T3 were relatively very close but attended failure at different axial strain rates of 3.3% and
2.5%, sample T4 had the lowest axial peak stress with failure at an axial strain of 2% while
T2 showed the highest peak axial stress with failure at an axial strain of 1.5%. It can also be
observed that all samples had a ductile behaviour, where T3 and T4 showed the highest
plasticity behaviour with the least reduction in the loss of post-peak. The average plasticity
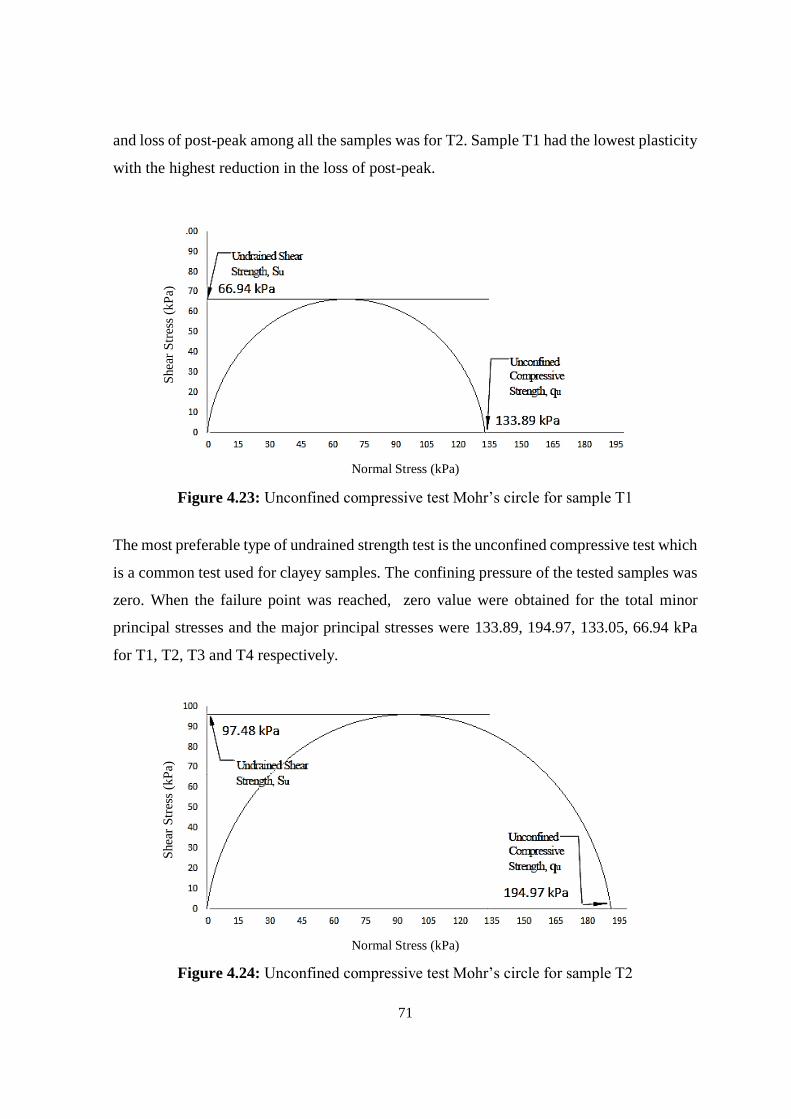
71
and loss of post-peak among all the samples was for T2. Sample T1 had the lowest plasticity
with the highest reduction in the loss of post-peak.
Normal Stress (kPa)
Figure 4.23: Unconfined compressive test Mohr’s circle for sample T1
The most preferable type of undrained strength test is the unconfined compressive test which
is a common test used for clayey samples. The confining pressure of the tested samples was
zero. When the failure point was reached, zero value were obtained for the total minor
principal stresses and the major principal stresses were 133.89, 194.97, 133.05, 66.94 kPa
for T1, T2, T3 and T4 respectively.
Normal Stress (kPa)
Figure 4.24: Unconfined compressive test Mohr’s circle for sample T2
Shea
r S
tres
s (k
Pa)
S
hea
r S
tres
s (k
Pa)
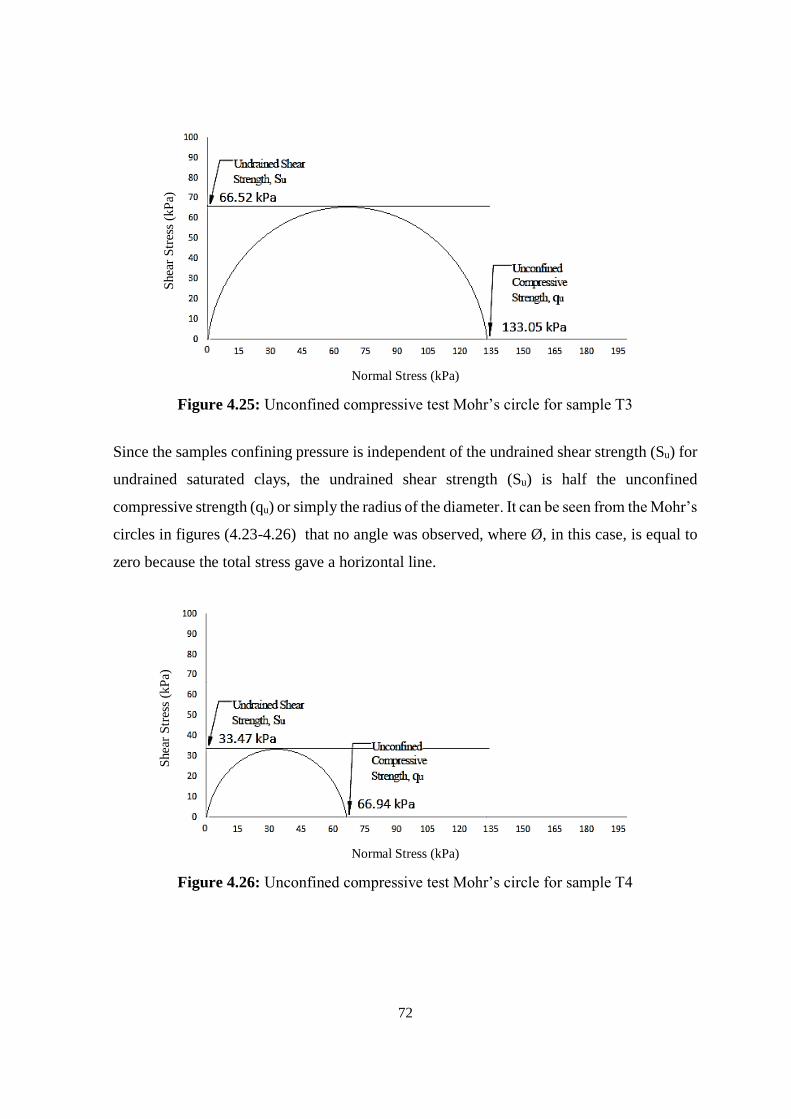
72
Normal Stress (kPa)
Figure 4.25: Unconfined compressive test Mohr’s circle for sample T3
Since the samples confining pressure is independent of the undrained shear strength (Su) for
undrained saturated clays, the undrained shear strength (Su) is half the unconfined
compressive strength (qu) or simply the radius of the diameter. It can be seen from the Mohr’s
circles in figures (4.23-4.26) that no angle was observed, where Ø, in this case, is equal to
zero because the total stress gave a horizontal line.
Normal Stress (kPa)
Figure 4.26: Unconfined compressive test Mohr’s circle for sample T4
Shea
r S
tres
s (k
Pa)
S
hea
r S
tres
s (k
Pa)
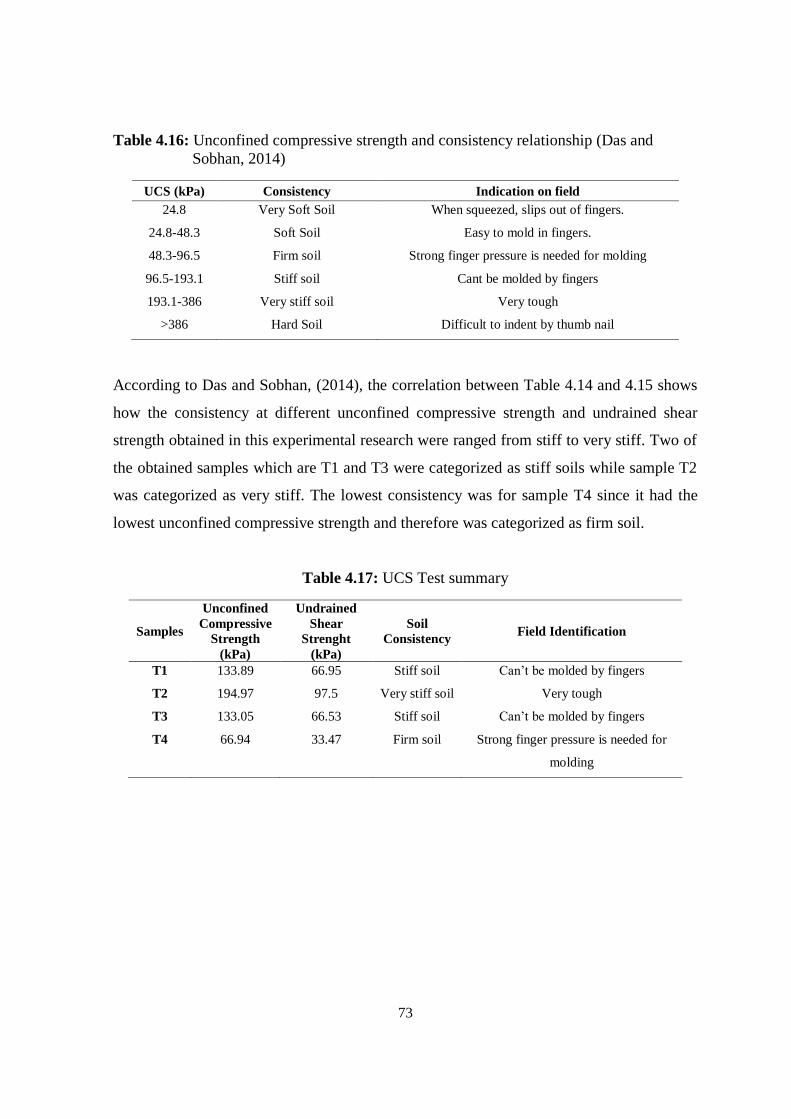
73
Table 4.16: Unconfined compressive strength and consistency relationship (Das and
Sobhan, 2014)
UCS (kPa) Consistency Indication on field
24.8 Very Soft Soil When squeezed, slips out of fingers.
24.8-48.3 Soft Soil Easy to mold in fingers.
48.3-96.5 Firm soil Strong finger pressure is needed for molding
96.5-193.1 Stiff soil Cant be molded by fingers
193.1-386 Very stiff soil Very tough
>386 Hard Soil Difficult to indent by thumb nail
According to Das and Sobhan, (2014), the correlation between Table 4.14 and 4.15 shows
how the consistency at different unconfined compressive strength and undrained shear
strength obtained in this experimental research were ranged from stiff to very stiff. Two of
the obtained samples which are T1 and T3 were categorized as stiff soils while sample T2
was categorized as very stiff. The lowest consistency was for sample T4 since it had the
lowest unconfined compressive strength and therefore was categorized as firm soil.
Table 4.17: UCS Test summary
Samples
Unconfined
Compressive
Strength
(kPa)
Undrained
Shear
Strenght
(kPa)
Soil
Consistency Field Identification
T1 133.89 66.95 Stiff soil Can’t be molded by fingers
T2 194.97 97.5 Very stiff soil Very tough
T3 133.05 66.53 Stiff soil Can’t be molded by fingers
T4 66.94 33.47 Firm soil Strong finger pressure is needed for
molding
74
CHAPTER 5
CONCLUSION AND RECOMMENDATIONS
Volume change in clays is a major problem found in semi-arid regions caused by expansive
clays in different parts of the world (Chen, 1988). Considerable infrastructure damages had
been reported caused by high plastic clays due to their shrink and swell behaviour (Jones &
Holtz, 1973). The annual damage caused by expansive clays had caused billions of dollars
worldwide (Das, 2009). Damage mitigation is possible by applying the necessary laboratory
test for understanding volume change characteristics and behaviour. The main goal of the
research was to make quantitative investigations on the volume change behaviour of the
obtained expansive clays and their strength resistance to external normal stresses. In
particular, the cyclic swell-shrinkage test was conducted on one of the obtained expansive
clays. The current research was divided into three parts, the first part was to characterize the
samples according to their physical properties. The second part was to understand the swell,
shrinkage and consolidation behaviour using a one-dimensional odometer apparatus. The
third part was to monitor the behaviour of samples under strength test and obtaining their
failure envelopes. Moreover, some correlations were made between the obtained
experimental results of the investigated expansive clays and previously studied clays.
5.1 Conclusions
The results obtained from the hydrometer test showed that more than 93% of all the obtained
samples were composed of silts and clays which makes them highly prone to expansion
when wet.
• The liquid limit and plasticity index obtained during the Atterberg test showed that
all the samples were above 50% LL and 25% PI. Therefore, their volume change
was categorized as high to very high. Also, the clays were all beyond the A-line
and were categorized as clay with high plasticity (CH) according to Unified Soil
Classification System.
• The maximum dry density obtained for sample T1, T2, T3 and T4 were 1.60, 1.62,
1.67, 1.30 g/cm3 respectively with optimum moisture contents of 21.5, 22, 19,
39.4% respectively.
75
• The highest specific gravity obtained was for T2 (2.56), sample T1 and T2 had the
same specific (2.55) gravity while sample T4 had the lowest (2.38).
• The one-dimensional oedometer swell test showed that T4 had the maximum
ultimate swell 19.63%, T2 and T3 had a close maximum swell value of 11.44 and
13.69% respectively, while T1 had the lowest with a maximum swell of 3.85% and
therefore all of the samples are considered as highly expansive.
• The consolidation test showed that T1 had the highest pre-consolidation pressure,
T2 and T3 had a close pre-consolidation pressure while T4 showed the lowest pre-
consolidation pressure. The correlation between the compression index and
plasticity index showed that the compression index increases with increasing
plasticity index.
• The swell and shrinkage cycle applied on sample T2 showed that the wetting and
drying cycles were irreversible during the first cycle. There was an irreversible
plastic compression during the second cycle. After the third cycle, reversible
deformation was achieved and equilibrium was attained at the consequent cycles.
The correlation between axial and lateral deformation showed an anisotropic
behaviour.
• During the desiccation process of sample T2, more surface cracks are observed as
the drying period increases with increased widening and dimming of cracks until
drying stops.
• The shear box test showed that all samples were ductile and had high to very high
plasticity except for sample T4 which had the lowest ductility and plasticity. The
maximum shear peak strength was observed for sample T1 at a normal stress of
225 kPa.
• During the unconfined compressive test, it was observed that T2 had the largest
unconfined compressive strength and therefore was categorized as very stiff soil,
while T1 and T3 had the same unconfined compressive strength and were
categorized as stiff soil. The lowest unconfined compressive strength was for T4
and was categorized as firm soil. All the samples had ductile behaviour during the
test.
76
• The engineering suggestions for the test results obtained during the study, it is
possible to build on expansive clays if the water content can be reduced by applying
different stabilization methods.
5.2 Recommendations
In order to have a deeper understanding of Cyprus clays, more experimental researches are
recommended on soil samples from different parts of the island. Other analysis like XRD,
XRF and scanning electron microscopy could be particularly helpful to recognize the exact
chemical compound, mineralogy and microstructure of the clay samples, which ultimately
results in a better understanding of the process of volume change in the soil. Also,
considering the semi-arid climate of Cyprus, studying the unsaturated behaviour of the soil
through suction measurement would be a requirement for a better prediction of soil
behaviour in varying degrees of saturation.
77
REFERENCES
Al-Ani, T., & Sarapää, O. (2008). CLAY AND CLAY MINERALOGY (No.
M19/3232/2008/41) (pp. 1–91). FINLAND: Geological Survey of Finland.
Alonso, E. E., Gens, A., & Hight, D. W. (1986). Special problem soils. General report. In:
Proceedings of the 9th European Conference on Soil Mechanics and Foundation
Engineering. Tunnelling and Underground Space Technology, 1(3–4), 402.
https://doi.org/10.1016/0886-7798(86)90039-8
American Society for Testing and Materials. (2007). Test Method for Particle-Size Analysis
of Soils (D422 − 63). ASTM International. https://doi.org/10.1520/D0422-
63R07E02
American Society for Testing and Materials. (2010). Test Methods for Liquid Limit, Plastic
Limit, and Plasticity Index of Soils (D4318). ASTM International.
https://doi.org/10.1520/D4318-10E01
American Society for Testing and Materials. (2011a). Test Method for Direct Shear Test of
Soils Under Consolidated Drained Conditions (D3080/D3080M). ASTM
International. https://doi.org/10.1520/D3080_D3080M-11
American Society for Testing and Materials. (2011b). Test Methods for One-Dimensional
Consolidation Properties of Soils Using Incremental Loading (D2435/D2435M).
ASTM International. https://doi.org/10.1520/D2435
American Society for Testing and Materials. (2012). Test Methods for Laboratory
Compaction Characteristics of Soil Using Standard Effort (12 400 ft-lbf/ft3 (600 kN-
m/m3)) (D698). ASTM International. https://doi.org/10.1520/D0698-12E01
78
American Society for Testing and Materials. (2013). Test Method for Unconfined
Compressive Strength of Cohesive Soil (D2166/D2166M). ASTM International.
https://doi.org/10.1520/D2166_D2166M-13
American Society for Testing and Materials. (2014a). Test Methods for One-Dimensional
Swell or Collapse of Soils (D4546). ASTM International.
American Society for Testing and Materials. (2014b). Test Methods for Specific Gravity of
Soil Solids by Water Pycnometer (D854). ASTM International.
Ameta, N. K., Purohit, D. G. M., & Wayal, A. S. (2007). Characteristics, Problems and
Remedies of Expansive Soils of Rajasthan, India. Electronic Journal of Geotechnical
Engineering, 7.
Atalar, C., & Kilic, R. (2006). Geotchnical properties of Cyprus clays. International
Association for Engineering Geology and the Environment, Formerly International
Association for Engineering Geology, (419), 9.
Attom, M. F., & Barakat, S. (2000). Investigation of three methods for evaluating swelling
pressure of soils. Environmental and Engineering Geoscience, 6(3), 293–299.
https://doi.org/10.2113/gseegeosci.6.3.293
Barden, L., & Sides, G. R. (1970). Engineering Behavior and Structure of Compacted Clay.
Journal of the Soil Mechanics and Foundations Division, 96(4), 1171–1200.
Retrieved from http://cedb.asce.org/CEDBsearch/record.jsp?dockey=0017170
Basma, A. A., Al-Homoud, A. S., Husein Malkawi, A. I., & Al-Bashabsheh, M. A. (1996).
Swelling-shrinkage behavior of natural expansive clays. Applied Clay Science, 11(2),
211–227. https://doi.org/10.1016/S0169-1317(96)00009-9
Bell, F. G. (2000). Engineering Properties of Soils and Rocks (3rd ed.). Oxford: Butterwerth-
Heinemann Ltd.
79
Chen, F. H. (1988). Foundations on Expansive Soils (2nd edition). Amsterdam ; New York :
New York, NY, U.S.A: Elsevier Science.
Çimen, Ö., Keskin, S. N., & Yıldırım, H. (2012). Prediction of Swelling Potential and
Pressure in Compacted Clay. Arabian Journal for Science and Engineering, 37(6),
1535–1546.
Constantinou, G., Petrides, G., Kyrou, K., & Chrysostomou, C. (2002). Swelling Clays:
Continuous Threat to the Built Environment of Cyprus (ETEK). Nicosia, Cyprus:
ETEK-Cyprus Scientific and Technical Chamber.
Craig, R. F. (2004). Craig’s Soil Mechanics, Seventh Edition (7 edition). London ; New
York: CRC Press.
Das, B. M. (2008). Advanced soil mechanics (3rd ed). London ; New York: Taylor &
Francis.
Das, B. M. (2009). Principles of Geotechnical Engineering (7th ed.). Stamford, CT 06902
USA: Cengage Learning.
Das, B. M., & Sobhan, K. (2013). Principles of Geotechnical Engineering (8th Edition
edition). CL.
Day, R. W. (1999). Geotechnical and Foundation Engineering: Design and Construction
(1st edition). New York: McGraw-Hill Professional.
Deer, W. A., Howie, R. A., & Zussman, J. (1992). An introduction to the rock-forming
minerals. Harlow: Longman.
Delage, P., & Lefebvre, G. (1984). Study of the structure of a sensitive Champlain clay and
of its evolution during consolidation. Canadian Geotechnical Journal, 21(1), 21–35.
https://doi.org/10.1139/t84-003
80
Elsharief, A. M., & Sufian, M. (2018). Time rate of swelling of compacted highly plastic
clay soil from Sudan. MATEC Web of Conferences, 149, 02032.
https://doi.org/10.1051/matecconf/201814902032
Estabragh, A. R., Parsaei, B., & Javadi, A. A. (2015). Laboratory investigation of the effect
of cyclic wetting and drying on the behaviour of an expansive soil. Soils and
Foundations, 55(2), 304–314. https://doi.org/10.1016/j.sandf.2015.02.007
Ferber, V., Auriol, J.-C., Cui, Y.-J., & Magnan, J.-P. (2009). On the swelling potential of
compacted high plasticity clays. Engineering Geology, 104(3–4), 200–210.
https://doi.org/10.1016/j.enggeo.2008.10.008
Gens, A. (1996). CONSTITUTIVE MODELLING: APPLICATION TO COMPACTED
SOILS (Vol. 3). Presented at the PROCEEDINGS OF THE FIRST
INTERNATIONAL CONFERENCE ON UNSATURATED SOILS, PARIS.
Haines, W. B. (1923). The volume-changes associated with variations of water content in
soil. The Journal of Agricultural Science, 13(03), 296–310.
https://doi.org/10.1017/S0021859600003580
Ho, M.-H., Chan, C.-M., & Bakar, I. (2010). One Dimensional Compressibility
Characteristics of Clay Stabilised with Cement-Rubber Chips, 1(2), 14.
Holtz, R. D., & Kovacs, W. D. (1981). An Introduction to Geotechnical Engineering (1st
edition). Englewood Cliffs, N.J: Prentice Hall.
Holtz, R. D., & Kovacs, W. D. (2010). An Introduction to Geotechnical Engineering (2
edition). Upper Saddle River, NJ: Pearson.
Holtz, W. G., & Gıbbs, H. J. (1956). Engineering properties of expansive clays. American
Society Of Civil Engineers, 121, 641–663.
81
Jain, V. K., & Dixit, M. (2015). Correlation of Plasticity Index and Compression Index of
Soil. International Journal of Innovations in Engineering and Technology, 5(3), 8.
Jones, D. E., & Holtz, W. G. (1973). EXPANSIVE SOILS- THE HIDDEN DISASTER.
American Society of Civil Engineers, 43(8), 49–51. Retrieved from
https://trid.trb.org/view/133235
Jones, D. Earl, & Jones, K. A. (1987). Treating Expansive Soils. Civil Engineering—ASCE,
57(8), 62–65.
Jotisankasa, A., Coop, M., & Ridley, A. (2009). The mechanical behaviour of an unsaturated
compacted silty clay. Géotechnique, 59(5), 415–428.
Keijzer, T. J. S. (2000). Chemical osmosis in natural clayey materials. Faculteit
Aardwetenschappen, Universiteit Utrecht.
Kondner, R. L. (1963). Hyperbolic Stress-Strain Response: Cohesive Soils. Journal of the
Soil Mechanics and Foundations Division, 89(1), 115–144. Retrieved from
https://cedb.asce.org/CEDBsearch/record.jsp?dockey=0013011
Lambe, T. W., & Whitman, R. V. (1969). Soil Mechanics. John Wiley & Sons.
Lapierre, C., Leroueil, S., & Locat, J. (1990). Mercury intrusion and permeability of
Louiseville clay. Canadian Geotechnical Journal, 27(6), 761–773.
Lew, B. (2010). Structure Damage Due to Expansive Soils: a Case Study. Electronic Journal
of Geotechnical Engineering, 15, 1317–1324.
Lu, H., He, W., Liao, Z., & Chen, W. (2013). The Swelling, Shrinkage and Cracking
Properties of Compacted Clay. Electronic Journal of Geotechnical Engineering, 18,
1037–1044.
82
Mishra, A. K., Dhawan, S., & Rao, S. M. (2008). Analysis of Swelling and Shrinkage
Behavior of Compacted Clays. Geotechnical and Geological Engineering, 26(3),
289–298. https://doi.org/10.1007/s10706-007-9165-0
Mitchell, A. R., & van Genuchten, M. T. (1992). Shrinkage of Bare and Cultivated Soil. Soil
Science Society of America Journal, 56(4), 1036–1042.
Mitchell, J. K., & Soga, K. (2005). Fundamentals of Soil Behavior (3 edition). Hoboken,
N.J: Wiley.
Murthy, V. N. S. (2002). Geotechnical Engineering: Principles and Practices of Soil
Mechanics and Foundation Engineering. CRC Press.
Olphen, H. V. (1977). An Introduction to Clay Colloid Chemistry. Wiley.
Oweis, I., & Khera, R. (1998). Geotechnology of Waste Management (2 edition). Boston:
CL Engineering.
Pohl, W. (2011). Economic geology: principles and practice: metals, minerals, coal and
hydrocarbons - introduction to formation and sustainable exploitation of mineral
deposits. Chichester, West Sussex ; Hoboken, NJ: Wiley-Blackwell.
Popescu, M. E. (1979). Engineering problems associated with expansive clays from
Romania. Engineering Geology, 14(1), 43–53. https://doi.org/10.1016/0013-
7952(79)90062-0
Popescu, M. E. (1986). A comparison between the behaviour of swelling and of collapsing
soils. Engineering Geology, 23(2), 145–163.
Puppala, A. J., Manosuthikij, T., & Chittoori, B. C. S. (2013). Swell and shrinkage
characterizations of unsaturated expansive clays from Texas. Engineering Geology,
164, 187–194. https://doi.org/10.1016/j.enggeo.2013.07.001
83
Pusch, R., & Yong, R. N. (2006). Microstructure of Smectite Clays and Engineering
Performance. CRC Press. https://doi.org/10.1201/9781482265675
Rosenbalm, D., & Zapata, C. E. (2017). Effect of Wetting and Drying Cycles on the Behavior
of Compacted Expansive Soils. Journal of Materials in Civil Engineering, 29(1), 1–
9. https://doi.org/10.1061/(ASCE)MT.1943-5533.0001689
Scott, R. F. (1963). Principles of soil mechanics (1St Edition edition). Addison-Wesley
Publishing Company.
Seed, H. B., & Chan, C. K. (1959). Structure and Strength Characteristics of Compacted
Clays. Journal of the Soil Mechanics and Foundations Division, 85(5), 87–128.
Retrieved from http://cedb.asce.org/CEDBsearch/record.jsp?dockey=0011806
Sharma, R. S. (1998). Mechanical behaviour of unsaturated highly expansive clays.
University of Oxford, Oxford-England.
Sivakumar, V., Tan, W. C., Murray, E. J., & McKinley, J. D. (2006). Wetting, drying and
compression characteristics of compacted clay. Géotechnique, 56(1), 57–62.
https://doi.org/10.1680/geot.2006.56.1.57
Soltani, A., Taheri, A., Khatibi, M., & Estabragh, A. R. (2017). Swelling Potential of a
Stabilized Expansive Soil: A Comparative Experimental Study. Geotechnical and
Geological Engineering, 35(4), 1717–1744. https://doi.org/10.1007/s10706-017-
0204-1
Sridharan, A., & Allam, M. M. (1982). Volume Change Behavior of Desiccated Soils.
Journal of the Geotechnical Engineering Division, 108(8), 1057–1071. Retrieved
from https://cedb.asce.org/CEDBsearch/record.jsp?dockey=0034496
Sridharan, A., & Gurtug, Y. (2004). Swelling behaviour of compacted fine-grained soils.
Engineering Geology, 72(1–2), 9–18.
84
Sudjianto, A. T., Suryolelono, K. B., Rifa’i, A., & Mochtar, I. B. (2011). The Effect of Water
Content Change and Variation Suction in Behavior Swelling of Expansive Soil.
International Journal of Civil & Environmental Engineering, 11(03), 11–17.
Tang, C., Shi, B., Gao, W., Chen, F., & Cai, Y. (2007). Strength and mechanical behavior
of short polypropylene fiber reinforced and cement stabilized clayey soil. Geotextiles
and Geomembranes, 25(3), 194–202.
Tang, C., Shi, B., Liu, C., Zhao, L., & Wang, B. (2008). Influencing factors of geometrical
structure of surface shrinkage cracks in clayey soils. Engineering Geology, 101(3),
204–217. https://doi.org/10.1016/j.enggeo.2008.05.005
Tang, C.-S., Shi, B., Liu, C., Suo, W.-B., & Gao, L. (2011). Experimental characterization
of shrinkage and desiccation cracking in thin clay layer. Applied Clay Science, 52(1–
2), 69–77. https://doi.org/10.1016/j.clay.2011.01.032
Tawfiq, S., & Nalbantoglu, Z. (2009). Swell-shrink behavior of expansive clays (pp. 336–
341). Presented at the 2nd International Conference on New Developments in Soil
Mechanics and Geotechnical Engineering, Near East University, Nicosia, North
Cyprus.
Tripathy, S, Rao, K. S., & Fredlund, D. G. (2002). Water content - void ratio swell-shrink
paths of compacted expansive soils. Canadian Geotechnical Journal, 39(4), 938–
959. https://doi.org/10.1139/t02-022
Tripathy, Snehasis, & Subba Rao, K. S. (2009). Cyclic Swell–Shrink Behaviour of a
Compacted Expansive Soil. Geotechnical and Geological Engineering, 27(1), 89–
103. https://doi.org/10.1007/s10706-008-9214-3
85
Uzundurukan, S., Keskin, S. N., Yıldırım, H., Göksan, T. S., & Çimen, Ö. (2014). Suction
and Swell Characteristics of Compacted Clayey Soils. Arabian Journal for Science
and Engineering, 39(2), 747–752. https://doi.org/10.1007/s13369-013-0852-2
Wheeler, S. J., Sharma, R. S., & Buisson, M. S. R. (2003). Coupling of hydraulic hysteresis
and stress–strain behaviour in unsaturated soils. Géotechnique, 53(1), 41–54.
https://doi.org/10.1680/geot.2003.53.1.41
White, W. A. (1949). Atterberg plastic limits of clay minerals: Am. Mineral, 34, 508–512.