Measuring track vertical stiffness through dynamic monitoring
9
Measuring track vertical stiffness through dynamic monitoring & 1 María José Cano PhD Associate Professor, Department of Transport Engineering and Infrastructure, Polytechnic University of Madrid, Madrid, Spain & 2 Pablo Martínez Fernández MSc Researcher, Department of Transport Engineering and Infrastructure, Polytechnic University of Valencia, Valencia, Spain & 3 Ricardo Insa Franco PhD Professor, Department of Transport Engineering and Infrastructure, Polytechnic University of Valencia, Valencia, Spain 1 2 3 This paper proposes a methodology for the evaluation of the track condition by means of the measurement of the track stiffness. This magnitude is calculated from vertical acceleration data measured at the axle box of trains during their normal operation. From the corresponding vertical acceleration spectra, the dominant vibration frequencies for each track stretch are identified and the combined stiffness is then determined. The stiffness without the contribution of the rail is then calculated. The results obtained for a high-speed ballasted track in several track stretches are within the range 120–130 kN/mm, a result consistent with direct stiffness measurements taken during previous studies. Therefore, the proposed methodology may be used to obtain a first insight to the track condition by means of a continuous measurement of the track combined stiffness. This offers an alternative to traditional stationary stiffness measuring devices and might be a useful complement to dedicated continuous monitoring vehicles. Notation A integration constant for mass vertical displacement a parameter used to calculate sleeper reaction force B integration constant for mass vertical displacement b parameter used to calculate sleeper reaction force c wheel–rail contact damping EI rail stiffness k wheel–rail contact stiffness k b ballast stiffness k f pad and fastening systems stiffness k g combined track stiffness without rail contribution k p platform stiffness L distance between sleepers m train unsprung mass p parameter dependent on yielding constant Q dynamic load q parameter dependent on yielding constant R Ao sleeper reaction force y mass vertical displacement (quarter car model) z track vertical deformation δ inverse of the track stiffness (without rail contribution) λ constant of yielding 1. Introduction In order to justify their economic cost and ensure their profit- ability, railwayservices must be fast, comfortable and safe. One of the key aspects to achieve these requirements is the degree of maintenance of the track and vehicles. Poor or insufficient maintenance will reduce the performance of the service and may even compromise its safety, whereas an excessive control of the track may increase costs beyond a reasonable level and reduce the track capacity. This is particularly important in those track stretches more prone to degradation, such as tran- sition zones between ballasted tracks and slab tracks (Insa et al., 2014), and other sections with sudden changes of stiff- ness which increase dynamic loads (López, 2001). This context points out the need for a thorough and cost-effective monitor- ing of the track condition so as to plan maintenance oper- ations. With this in mind, several different methods and devices have been developed and tested for track monitoring, ranging from simple visual inspection to sophisticated inspec- tion cars equipped with sensors. Stationary methods usually rely on devices which are placed at certain points of the track where measurements are taken to 1 Transport Measuring track vertical stiffness through dynamic monitoring Cano, Fernández and Franco Proceedings of the Institution of Civil Engineers http://dx.doi.org/10.1680/jtran.14.00081 Paper 1400081 Received 20/11/2014 Accepted 09/07/2015 Keywords: maintenance & inspection/mathematical modelling/ railway systems ICE Publishing: All rights reserved
Transcript of Measuring track vertical stiffness through dynamic monitoring
Measuring track verticalstiffness through dynamicmonitoring&1 María José Cano PhD
Associate Professor, Department of Transport Engineering andInfrastructure, Polytechnic University of Madrid, Madrid, Spain
&2 Pablo Martínez Fernández MScResearcher, Department of Transport Engineering and Infrastructure,Polytechnic University of Valencia, Valencia, Spain
&3 Ricardo Insa Franco PhDProfessor, Department of Transport Engineering and Infrastructure,Polytechnic University of Valencia, Valencia, Spain
1 2 3
This paper proposes a methodology for the evaluation of the track condition by means of the measurement of the
track stiffness. This magnitude is calculated from vertical acceleration data measured at the axle box of trains during
their normal operation. From the corresponding vertical acceleration spectra, the dominant vibration frequencies for
each track stretch are identified and the combined stiffness is then determined. The stiffness without the contribution
of the rail is then calculated. The results obtained for a high-speed ballasted track in several track stretches are within
the range 120–130 kN/mm, a result consistent with direct stiffness measurements taken during previous studies.
Therefore, the proposed methodology may be used to obtain a first insight to the track condition by means of a
continuous measurement of the track combined stiffness. This offers an alternative to traditional stationary stiffness
measuring devices and might be a useful complement to dedicated continuous monitoring vehicles.
NotationA integration constant for mass vertical displacementa parameter used to calculate sleeper reaction forceB integration constant for mass vertical displacementb parameter used to calculate sleeper reaction forcec wheel–rail contact dampingEI rail stiffnessk wheel–rail contact stiffnesskb ballast stiffnesskf pad and fastening systems stiffnesskg combined track stiffness without rail contributionkp platform stiffnessL distance between sleepersm train unsprung massp parameter dependent on yielding constantQ dynamic loadq parameter dependent on yielding constantRAo sleeper reaction forcey mass vertical displacement (quarter car model)z track vertical deformationδ inverse of the track stiffness (without rail contribution)λ constant of yielding
1. IntroductionIn order to justify their economic cost and ensure their profit-ability, railway services must be fast, comfortable and safe. Oneof the key aspects to achieve these requirements is the degreeof maintenance of the track and vehicles. Poor or insufficientmaintenance will reduce the performance of the service andmay even compromise its safety, whereas an excessive controlof the track may increase costs beyond a reasonable level andreduce the track capacity. This is particularly important inthose track stretches more prone to degradation, such as tran-sition zones between ballasted tracks and slab tracks (Insaet al., 2014), and other sections with sudden changes of stiff-ness which increase dynamic loads (López, 2001). This contextpoints out the need for a thorough and cost-effective monitor-ing of the track condition so as to plan maintenance oper-ations. With this in mind, several different methods anddevices have been developed and tested for track monitoring,ranging from simple visual inspection to sophisticated inspec-tion cars equipped with sensors.
Stationary methods usually rely on devices which are placed atcertain points of the track where measurements are taken to
1
Transport
Measuring track vertical stiffness throughdynamic monitoringCano, Fernández and Franco
Proceedings of the Institution of Civil Engineers
http://dx.doi.org/10.1680/jtran.14.00081Paper 1400081Received 20/11/2014 Accepted 09/07/2015Keywords: maintenance & inspection/mathematical modelling/railway systems
ICE Publishing: All rights reserved

assess the condition of such points. Examples of this are thefalling weight deflectometer (FWD) extensively used in theUK (Burrow et al., 2007) and impact hammers combined withaccelerometers (Kaewunruen and Remennikov, 2007). Themain issue with these methods is that they are stationary andusually require the track to be occupied, hence affecting theregular railway service.
As for inspection cars, it is worth mentioning the Mauzincars used by the French national railway company (Sociéténationale des chemins de fer français, SNCF) since the 1960s,which allow measuring several track geometric parameters atup to 200 km/h (Alias, 1984). The data thus gathered are pro-cessed with a specific computer application in order to assessthe evolution of the track and design the required maintenanceoperations (Meier-Hirmer, 2007). A similar device calledSéneca is used by the Spanish railway operator (Renfe-Adif) toinspect the condition of the track, overhead line and signallingsystems of high-speed lines at up to 350 km/h (Vía Libre, 2008).
The Swedish rail administration (Banverket) uses a devicecalled a rolling stiffness measuring vehicle (RSMV) which, asits names suggests, measures the track stiffness as a way ofidentifying those sections where maintenance is required(Berggren, 2009; With and Bodare, 2009). Other morecomplex methods have been implemented to evaluate the con-dition of different track components separately, as well as theground below, whether continuously along the track or atlocated points (Breul et al., 2008). Among them are theground-penetrating radar (GPR), which is fast and non-destructive (Fateh, 2005), and the light dynamic penetrometer,which allows soil resistance to be measured (Zhou, 1997).
These vehicles allow continuous monitoring of the track,without interrupting the normal service. They are, however,rather expensive and complex devices which are not alwaysaffordable or might be insufficient to inspect a large network.For this reason, a complementary approach is to equip regulartrains with sensors that provide a first insight of the track con-dition while operating, hence using dedicated inspection carsonly when a problem has been already hinted at by suchmeasurements.
The most promising parameter to control is the combined trackstiffness, as it is strongly related to the track behaviour in relationto dynamic loads and notably affects the process of wear anddegradation. This relation has been extensively studied, bothexperimentally (Cámara et al., 2012; Cuellar et al., 2012) andthrough computer models and theoretical studies (Alves et al.,2010; Chebli et al., 2008; Rhayma et al., 2011).
Within this context, the present paper aims to calculate thecombined track stiffness (both with and without the contri-bution of the rail stiffness) by means of acceleration data gath-ered from accelerometers placed on a train axle box. In this
way, a first insight to the track condition may be achieved,hence providing a reliable tool for preliminary identification oftrack defects.
2. Materials and methodsIn this section the method for data gathering and processing isexplained, and the mathematical tools used to calculate thecombined track stiffness are thoroughly described.
2.1 Monitoring methodologyAs already explained, the aim in this paper is to obtain thecombined track stiffness by means of measuring and proces-sing acceleration data measured in the train axle box.Therefore, monitoring such accelerations is one of the keyaspects of this study. In order to do so, uniaxial piezoelectricaccelerometers were placed in the axle box of a train (Figure 1)operating along one of the Spanish high-speed lines.
(a)
(b)
Figure 1. Sensors placed in the train axle box
2
Transport Measuring track vertical stiffness throughdynamic monitoringCano, Fernández and Franco
Offprint provided courtesy of www.icevirtuallibrary.comAuthor copy for personal use, not for distribution

Four sensors were used to measure both vertical and lateralaccelerations in both sides of the axle box. The main charac-teristics of these sensors are shown in Table 1.
Measurements were taken during two different days with asampling frequency of 12 000 Hz, to assess the influence ofsuch parameters and avoid losing any relevant information.All data gathered were stored in a laptop in real time and con-veniently processed afterwards. Vertical acceleration spectrawere obtained by means of the fast Fourier transform (FFT)for each track stretch of either 50 or 100m. Particular atten-tion was paid to singular track features such as tunnels,bridges, crossings, transitions and so on, which are most proneto degradation.
2.2 Axle natural frequencyIn order to evaluate the data gathered, the track–vehicle inter-action was modelled by means of a simple one mass (quartercar) model (Melis, 2008) as shown in Figure 2. In thismodel, the mass m represents the unsprung mass of the train;that is, the axle and wheel. This mass moves along the track,and the parameters k and c represent the stiffness and dampingof the track–vehicle interaction, respectively. This simplifiedmodel was chosen because the sprung mass (i.e. the train car-riage), although being much bigger than the unsprung mass, pre-sents a much smaller vibration frequency owing to the lowstiffness and high damping of the train dampers. Therefore, theeffect of the sprung mass on the dynamic load the train applies
to the track is negligible, and the natural frequency of the systemcan be assimilated to that of a single oscillating mass.
The mass vertical oscillation owing to its interaction with thetrack is given by the following differential equation
1: md2ydt2
þ cdydt
þ ky ¼ 0
where y is the mass vertical displacement and t is time. Ifdamping is neglected, which is a common assumption (c=0),the analytical solution for Equation 1 is
2: y ¼ A sin
ffiffiffiffikm
rt
!þ Bcos
ffiffiffiffikm
rt
!
where A and B are constants which depend on the systeminitial condition. Assuming such a condition to be at rest withinitial position y0, Equation 2 becomes
3: y ¼ y0cos
ffiffiffiffikm
rt
!
This corresponds to a sinusoidal harmonic movement whosenatural frequency is
4: f ¼ 12π
ffiffiffiffikm
r
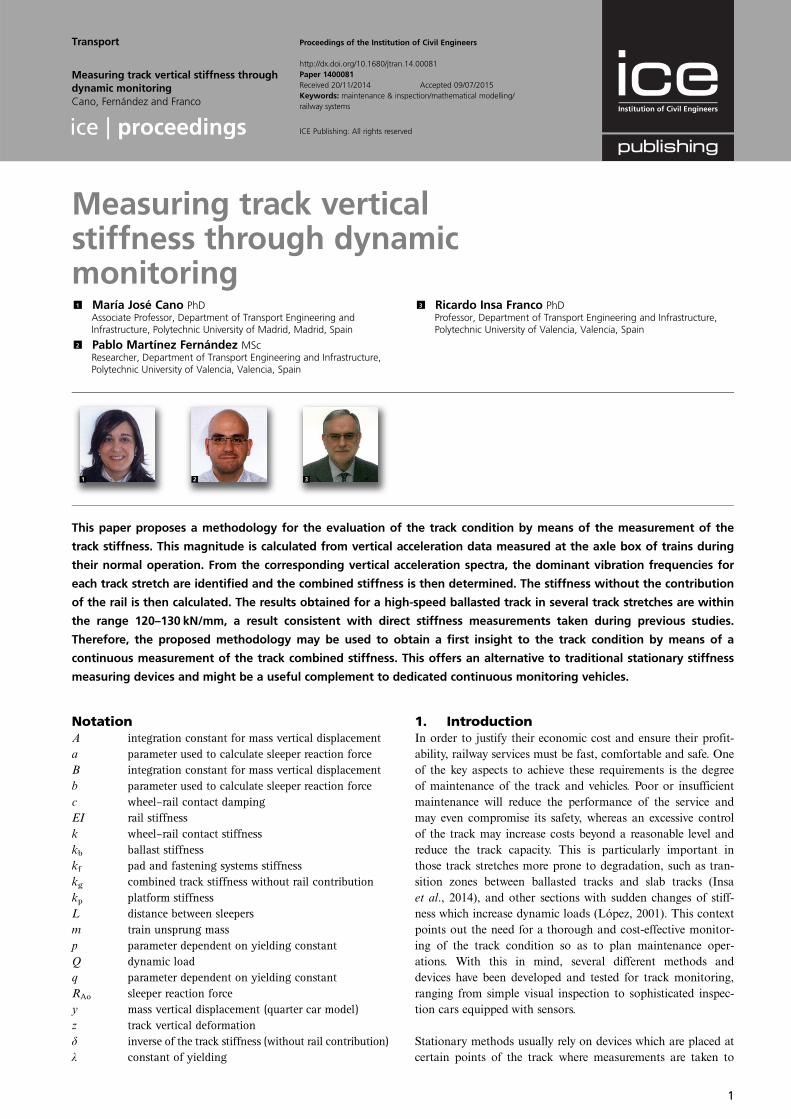
The characteristics of the train monitored (including themass and stiffness of the unsprung mass) were provided bythe train manufacturer. Therefore, assuming a free vibrationstate, it is possible to obtain from the model ruled byEquation 3 the results shown in Figure 3. From the vibrationspectrum (Figure 3(b)) the natural frequency of the train axlewas found to be about 58·5 Hz. Therefore, when analysing theacceleration spectrum of the data recorded, the natural fre-quency of the train–track system would appear to be in abandwidth around 58·5 Hz. For the purpose of this study,the range selected for the Fourier analysis was between 55 and65Hz.
Bearing this in mind, for each track stretch the correspondingvertical acceleration spectrum was studied to identify the mostdominant frequency within the aforementioned bandwidth.Once found, this frequency value was used to calculate thetrack combined stiffness k by means of Equation 4.
It is worth noting that, despite being a rather simple model,the quarter car model yields a vertical movement for thevibrating mass in good agreement with that provided by morecomplex models such as the two, three or four masses, as well
Sensor Sensitivity: mV/g
Vertical left acceleration 50Lateral left acceleration 102·2Lateral right acceleration 103·2Vertical right acceleration 50
Table 1. Sensors used and their sensitivity
m
k c
Figure 2. Quarter car model
3
Transport Measuring track vertical stiffness throughdynamic monitoringCano, Fernández and Franco
Offprint provided courtesy of www.icevirtuallibrary.comAuthor copy for personal use, not for distribution
as far more sophisticated methods of analysis such asSimpack, Adams or UM software (Melis, 2008).
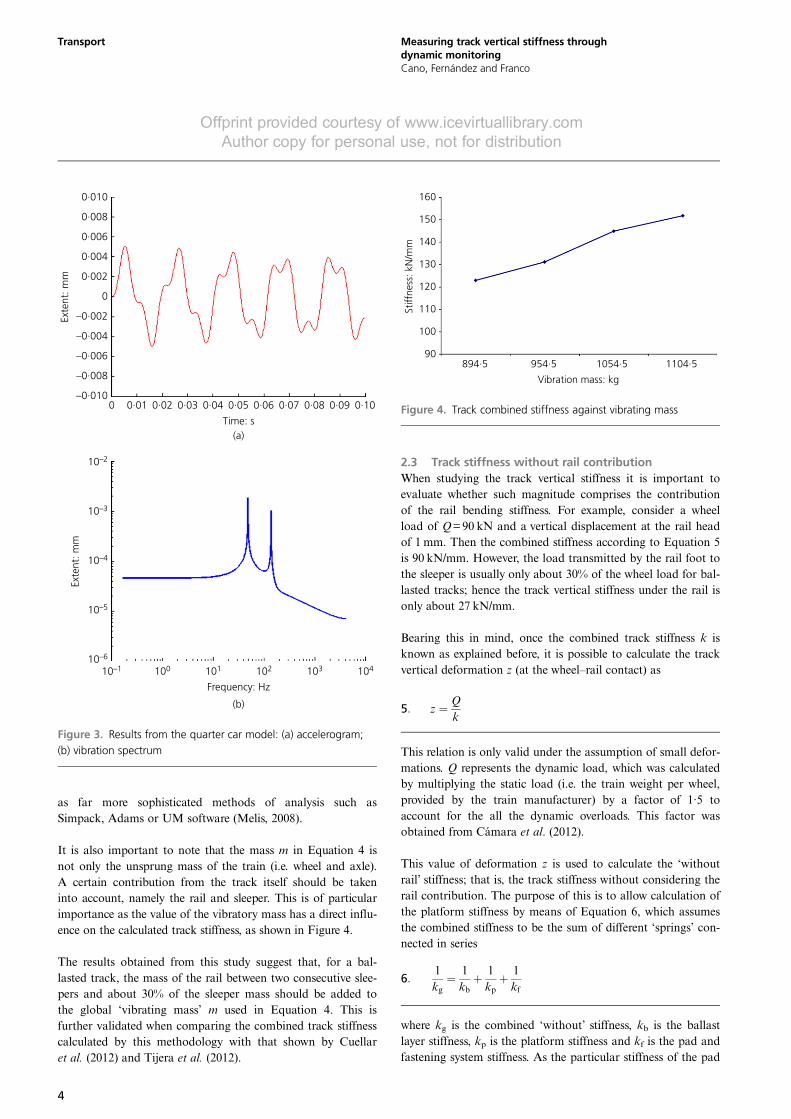
It is also important to note that the mass m in Equation 4 isnot only the unsprung mass of the train (i.e. wheel and axle).A certain contribution from the track itself should be takeninto account, namely the rail and sleeper. This is of particularimportance as the value of the vibratory mass has a direct influ-ence on the calculated track stiffness, as shown in Figure 4.
The results obtained from this study suggest that, for a bal-lasted track, the mass of the rail between two consecutive slee-pers and about 30% of the sleeper mass should be added tothe global ‘vibrating mass’ m used in Equation 4. This isfurther validated when comparing the combined track stiffnesscalculated by this methodology with that shown by Cuellaret al. (2012) and Tijera et al. (2012).
2.3 Track stiffness without rail contributionWhen studying the track vertical stiffness it is important toevaluate whether such magnitude comprises the contributionof the rail bending stiffness. For example, consider a wheelload of Q=90 kN and a vertical displacement at the rail headof 1 mm. Then the combined stiffness according to Equation 5is 90 kN/mm. However, the load transmitted by the rail foot tothe sleeper is usually only about 30% of the wheel load for bal-lasted tracks; hence the track vertical stiffness under the rail isonly about 27 kN/mm.
Bearing this in mind, once the combined track stiffness k isknown as explained before, it is possible to calculate the trackvertical deformation z (at the wheel–rail contact) as
5: z ¼ Qk
This relation is only valid under the assumption of small defor-mations. Q represents the dynamic load, which was calculatedby multiplying the static load (i.e. the train weight per wheel,provided by the train manufacturer) by a factor of 1·5 toaccount for the all the dynamic overloads. This factor wasobtained from Cámara et al. (2012).
This value of deformation z is used to calculate the ‘withoutrail’ stiffness; that is, the track stiffness without considering therail contribution. The purpose of this is to allow calculation ofthe platform stiffness by means of Equation 6, which assumesthe combined stiffness to be the sum of different ‘springs’ con-nected in series
6:1kg
¼ 1kb
þ 1kp
þ 1kf
where kg is the combined ‘without’ stiffness, kb is the ballastlayer stiffness, kp is the platform stiffness and kf is the pad andfastening system stiffness. As the particular stiffness of the pad
0·010
0·008
0·006
0·004
0·002
0
–0·002
–0·004
–0·006
–0·008
–0·010
10–2
10–3
10–4
10–5
10–6
10–1 100 101 102 103 104
0 0·01 0·02 0·03 0·04 0·05 0·06 0·07 0·08 0·09 0·10
Time: s
Frequency: Hz
Exte
nt: m
mEx
tent
: mm
(a)
(b)
Figure 3. Results from the quarter car model: (a) accelerogram;
(b) vibration spectrum
160
150
140
130
120
110
100
90894·5 954·5 1054·5 1104·5
Stiff
ness
: kN
/mm
Vibration mass: kg
Figure 4. Track combined stiffness against vibrating mass
4
Transport Measuring track vertical stiffness throughdynamic monitoringCano, Fernández and Franco
Offprint provided courtesy of www.icevirtuallibrary.comAuthor copy for personal use, not for distribution

and fastening systems is usually provided by the manufacturer,and the ballast stiffness is relatively well known, it is possibleto obtain the platform stiffness. It is worth noting that plat-form stiffness refers to the combined stiffness of the layersunder the ballast: that is, the subgrade and embankment.
The vertical analysis of the track is usually carried out bymeans of the Zimmermann–Timoshenko theory (1926).However, this method has several disadvantages, one of thembeing that the track is not a beam of constant stiffness sup-ported by a Winkler material. Another drawback is that it israther complicated to measure in situ the Ballast coefficientneeded to calculate bending moments and deformations.
The track is a relatively simple structure which consists of twoparallel rails held by elastic supports. As the distance betweensleepers (supports) may be different along the track, and thevertical stiffness of each support may also be different, the stiff-ness of each track stretch may present noticeable variations(Melis, 2013). However, if a constant distance between sleepersis assumed, both the vertical stiffness under the rail and thestiffness of each rail length are constant. Therefore, the generalmethod can be greatly simplified.
In this particular case, the methodology developed by Unold(1925) and completed by Dischinger (1942) and Lorente
de Nó (1980) is used, as explained by Melis (2008). Thismethod assumes the rail to be a continuous beam supportedby discrete and equidistant elastic foundations (i.e. thesleepers) (Figure 5) whose elasticity is ruled by a parameter δ,which is the inverse of the stiffness without considering the railcontribution (i.e. the ‘without rail’ stiffness).
From this parameter, the following relation is defined
7: δ ¼ λL3
EI
where L is the distance between consecutive sleepers, EI is therail stiffness (E being Young’s modulus and I the inertia) and λis a non-dimensional parameter called ‘constant of yielding’.
Q
A1 A0 B0 B1 B2
L L L L
Figure 5. Train load (one wheel) over a sleeper
10
9
8
7
6
5
4
3
2
1
00 10 20 30 40 50 60 70 80 90 100
Signal frequency: Hz
Sign
al a
mpl
itude
: mm
Number of sampling points 6001·0
Figure 7. Vertical acceleration spectrum. Ballasted track,
embankment 22
5.5
5·0
4·5
4·0
3·5
3·0
2·5
2·0
1·5
1·0
0·5
00 10 20 30 40 50 60 70 80 90 100
Signal frequency: Hz
Sign
al a
mpl
itude
: mm
Number of sampling points 7201·0
Figure 6. Vertical acceleration spectrum. Ballasted track,
embankment 17
7
6
5
4
3
2
1
00 10 20 30 40 50 60 70 80 90 100
Signal frequency: Hz
Sign
al a
mpl
itude
: mm
Number of sampling points 14401·0
Figure 8. Vertical acceleration spectrum. Ballasted track,
embankment 32
5
Transport Measuring track vertical stiffness throughdynamic monitoringCano, Fernández and Franco
Offprint provided courtesy of www.icevirtuallibrary.comAuthor copy for personal use, not for distribution

It is assumed that λ is known. Then the following constants pand q are calculated
8: p ¼ffiffiffiffiffiffiffiffiffiffiffiffiffiffiffiffi1þ 48λ
3
r
9: q ¼ffiffiffiffiffiffiffiffiffiffiffiffiffiffi43þ 2p
r
And from these constants, the following parameters arecalculated
10: a ¼ 2ð p� 1Þ1þ pþ q
11: b ¼ 1þ p� q1þ pþ q
These parameters allow calculation of all the reaction forces inthe sleepers and the bending moments at any point of the raildepending on whether the wheel (load) is over a sleeper orbetween sleepers. In the first case, the reaction under thesleeper is
12: RAo ¼ 1þ 3p3pq
Q
10
8
6
4
2
00 10 20 30 40 50 60 70 80 90 100
Signal frequency: Hz
Sign
al a
mpl
itude
: mm
Number of sampling points 14401·0
Figure 9. Vertical acceleration spectrum. Ballasted track,
embankment 44
10
12
8
6
4
2
00 10 20 30 40 50 60 70 80 90 100
Signal frequency: Hz
Sign
al a
mpl
itude
: mm
Number of sampling points 10801·0
Figure 11. Vertical acceleration spectrum. Ballasted track,
embankment 66
7
6
5
4
3
2
1
00 10 20 30 40 50 60 70 80 90 100
Signal frequency: Hz
Sign
al a
mpl
itude
: mm
Number of sampling points 14401·0
Figure 10. Vertical acceleration spectrum. Ballasted track,
embankment 59
7
8
6
5
4
3
2
1
00 10 20 30 40 50 60 70 80 90 100
Signal frequency: Hz
Sign
al a
mpl
itude
: mm
Number of sampling points 10801·0
Figure 12. Vertical acceleration spectrum. Ballasted track,
embankment 80
6
Transport Measuring track vertical stiffness throughdynamic monitoringCano, Fernández and Franco
Offprint provided courtesy of www.icevirtuallibrary.comAuthor copy for personal use, not for distribution

and the corresponding vertical deformation is
13: z ¼ δRAo
However, z is already known from Equation 5. Therefore, it ispossible to calculate λ so that the result of Equation 13 isequal to that obtained from Equation 5. Once λ is known, δ iseasily calculated from Equation 7 and therefore the ‘withoutrail’ stiffness is obtained.
3. Results and discussionAs mentioned earlier, the main purpose of this paper is topresent a methodology to calculate the combined track
stiffness (with and without the rail contribution) by means ofvertical acceleration data measured in a train axle box.Afterwards, acceleration spectra were calculated for differenttrack stretches of either 50 or 100m. Figures 6–13 show someexamples of the acceleration spectra obtained.
From these figures it is clear that, despite the logical stiffnessvariations along the track owing to different factors, a domi-nant frequency may be identified within the 55–65Hz rangepreviously defined. This is, as explained before, assumed tocorrespond to the natural frequency of the train unsprungmasses, which for the cases shown in Figures 6–13 is alwaysaround 60Hz with little variation and very close to the valueof 58·5 Hz previously calculated.
Once this frequency is known, the combined stiffness for eachtrack stretch may be calculated from its respective dominantfrequency following the aforementioned methodology. Theresults for the track stretches represented in Figures 6–13 areshown in Table 2.
In order to assess the performance of this methodology, theresults obtained are then compared with stiffness values fromtwo different sources. The first corresponds to the stiffnessmeasurements carried out by Tijera et al. (2012) in differenthigh-speed lines in Spain whose structure and characteristicsare equal to the line studied in this article. The stiffnesswas obtained by measuring the wheel load and rail deflection.The other data set was obtained by Cuellar et al. (2012) from a1:1 scale track model of the same typology (ballasted track)common in the Spanish high-speed network. Loads equivalentto that of actual trains passing at a speed between 300 and360 km/h were applied to the model, and the resultingmeasured stiffness was also validated with data measured
Track stretch Natural frequency: Hz Track stiffness: kN/mm Deformation: mm Without rail stiffness: kN/mm
Embankment 17 58 118·79 0·7 46·48Embankment 22 60 127·1 0·65 51·29Embankment 32 60 127·1 0·65 51·29Embankment 44 60 127·1 0·65 51·29Embankment 59 60 127·1 0·65 51·29Embankment 66 60 127·1 0·65 51·29Embankment 80 60 127·1 0·65 51·29Embankment 96 60 127·1 0·65 51·29Embankment 125 59 122·93 0·68 48·77Embankment 149 60 127·1 0·65 51·29Embankment 155 60 127·1 0·65 51·29Embankment 173 60 127·1 0·65 51·29Embankment 192 58 118·79 0·70 46·48Embankment 255 60 127·1 0·65 51·29
Table 2. Calculated track stiffness (with and without rail)
7
9
8
6
5
4
3
2
1
00 10 20 30 40 50 60 70 80 90 100
Signal frequency: Hz
Sign
al a
mpl
itude
: mm
Number of sampling points 10801·0
Figure 13. Vertical acceleration spectrum. Ballasted track,
embankment 96
7
Transport Measuring track vertical stiffness throughdynamic monitoringCano, Fernández and Franco
Offprint provided courtesy of www.icevirtuallibrary.comAuthor copy for personal use, not for distribution

from another high-speed line. The comparison between themethodology output and these two sources of data is shown inTable 3.
From Table 3 it is clear that the proposed methodology yieldsvalues of stiffness well within the range measured by otherauthors in similar conditions, particularly those presented byTijera et al. (2012) which were measured in a high-speed linesimilar to that monitored during this study. Therefore, themethodology provides a rather good estimation of the com-bined track stiffness.
4. Conclusions and practical relevanceThe methodology proposed allows measuring the track stiff-ness as a main condition parameter by means of accelerationdata measured in the trains’ axle box. This kind of data isusually available from dedicated monitoring vehicles, althoughit could be also recorded from normal trains during their dailyoperation. In this way, a first insight to the track conditionmay be taken continuously, without requiring stationary stiff-ness measuring devices. More complex monitoring equipmentwould only be deployed when a defect was spotted, henceallowing for a more efficient use of this kind of machinery.
The methodology is rather straightforward and provides a goodapproximation to the track combined stiffness when comparedto data measured by previous studies. The results obtained for ahigh-speed ballasted track are between 120 and 130 kN/mm,which is consistent with previous direct measurements.
Therefore, the method proposed might become an easy andcost-effective way of carrying out a preliminary monitoring ofthe track condition which complements the use of other moreaccurate and complex devices. To achieve this, the next step ofresearch would be to study the correlation between the vari-ations of measured combined stiffness and the specific main-tenance needs of the line.
AcknowledgementsThe authors wish to thank Renfe Operadora for granting per-mission to monitor their trains and for their kind supportduring the monitoring campaign
REFERENCES
Alias J (1984) La Voie Ferrée. Techniques de Construction etd’entretien. Eyrolles, Paris, France (in French).
Alves P, Calçada R, Silva A and Bodare A (2010) Influence of soilnon-linearity on the dynamic response of high-speedrailway tracks. Soil Dynamics and Earthquake Engineering30(4): 221–235.
Berggren E (2009) Railway Track Stiffness: DynamicMeasurements and Evaluation for Efficient Maintenance.PhD thesis, Royal Institute of Technology, StockholmUniversity, Stockholm, Sweden.
Breul P, Gourvès R, Bacconnet C and Robinet C (2008)Assessment of the Railway Structures Using an IntegratingTesting and Diagnosis Methodology. Taylor & FrancisGroup, London, UK.
Burrow MPN, Chan AHC and Shein A (2007) Deflectometer-based analysis of ballasted railway tracks. Proceedings ofthe Institution of Civil Engineers – GeotechnicalEngineering 160(3): 169–177.
Cámara JL, Cuellar V, González P et al. (2012)Análisis estadístico de cargas dinámicas para el estudiode la fatiga de una línea de alta velocidad con tráficomixto. Boletín de la Sociedad Española de Mecánicadel Suelo e Ingeniería Geotécnica 170: 115–122(in Spanish).
Chebli H, Clouteau D and Schmitt L (2008) Dynamic response ofhigh-speed ballasted railway tracks: 3D periodic model andin situ measurements. Soil Dynamics and EarthquakeEngineering 28(2): 118–131.
Cuellar V, Navarro F, Andreu MA et al. (2012) Ensayosde laboratorio a escala 1:1 en el CEDEX paradeterminar el comportamiento a corto y largo plazode líneas de alta velocidad. Boletín de la SociedadEspañola de Mecánica de Suelo e IngenieríaGeotécnica 170: 91–102 (in Spanish).
Dischinger F (1942) Der Durchlaufende traeger und rahmenauf elastich senkbaren stützen. Der Bauingenieur 23(9–10):15–27 (in German).
Fateh M (2005) Non-destructive Evaluation of Railway TrackUsing Ground Penetrating Radar. Federal RailroadAdministration, Washington, DC, USA, RR05-06.See https://www.fra.dot.gov/Elib/Document/2141(accessed 03/09/2015).
Insa R, Salvador P, Inarejos J and Madina L (2014) Analysis ofthe performance of under-sleeper pads in highspeed linetransition zones. Proceedings of the Institution of CivilEngineers – Transport 167(2): 63–77, http://dx.doi.org/10.1680/tran.11.00033.
Kaewunruen S and Remennikov AM (2007) Field trials fordynamic characteristics of railway trac and its componentsusing impact excitation technique. NDT&E International40(7): 510–519.
López A (2001) La rigidez vertical de la vía y el deterioro de laslíneas de alta velocidad. Revista de Obras Públicas 3415:7–26 (in Spanish).
Source Naturalfrequency: Hz
Track stiffness:kN/mm
Tijera et al. (2012) (high-speed track)
— 110–140
Cuellar et al. (2012)(laboratory test)
— 110
Proposed methodology 58–60 118–127
Table 3. Comparison between measured stiffness (different
sources) and calculated stiffness
8
Transport Measuring track vertical stiffness throughdynamic monitoringCano, Fernández and Franco
Offprint provided courtesy of www.icevirtuallibrary.comAuthor copy for personal use, not for distribution

Lorente de Nó C (1980) Viga continua sobre apoyos elásticos.In Geotecnia y Cimientos (Jiménez Salas J (ed.)).Rueda, Madrid, Spain, vol. 3, pp. 27–50 (in Spanish).
Meier-Hirmer C (2007) Modèles et Techniques Probabilistespour l’optimisation des Strategies de Maintenance.Application au Domaine Ferroviaire. PhD thesis, Marne laVallée University, Marne-la-Vallée, France (in French).
Melis M (2008) Introducción a la Dinámica Vertical de la Vía ySeñales Digitales en Ferrocarriles. Ed. UPM, Madrid, Spain(in Spanish).
Melis M (2013) General Method of Track Analysis underVertical and Lateral Loads, Railways Course Notes. Ed.UPM, Madrid, Spain.
Rhayma N, Bressolette P, Breul P, Fogli M and Saussine G (2011)A probabilistic approach for estimating the behavior ofrailway tracks. Engineering Structures 33(7): 2120–2133.
Tijera A, Ruiz R, Cuéllar V and Rodríguez M (2012) Variacionesde rigidez de vía en zonas de transición. Boletín de la
Sociedad Española de Mecánica de Suelo e IngenieríaGeotécnica 170: 103–112 (in Spanish).
Timoshenko S (1926) Method of Analysis of Statical andDynamic Stresses in Rail. Proceedings of the 2ndInternational Congress for Applied Mechanics, Zurich,Switzerland, pp. 407–418.
Unold G (1925) Statikfür den Eisen- und Maschinenbau.Springer-Verlag, Berlin, Germany (in German).
Vía Libre (2008) Los vehículos auscultadores en España.Revista Vía Libre 524: 26–35 (in Spanish).
With C and Bodare A (2009) Evaluation of track stiffness with avibrator for prediction of train induced displacement onrailway embankments. Soil Dynamics and EarthquakeEngineering 29: 1187–1197.
Zhou S (1997) Caractérisation des Sols de Surface à l’aidedu Pénétromètre Dynamique Léger de Type Panda.PhD thesis, Blaise Pascal University, Clermont-Ferrand,France (in French).
WHAT DO YOU THINK?
To discuss this paper, please email up to 500 words to theeditor at [email protected]. Your contribution will beforwarded to the author(s) for a reply and, if consideredappropriate by the editorial panel, will be published asdiscussion in a future issue of the journal.
Proceedings journals rely entirely on contributions sent inby civil engineering professionals, academics and stu-dents. Papers should be 2000–5000 words long (briefingpapers should be 1000–2000 words long), with adequateillustrations and references. You can submit your paperonline via www.icevirtuallibrary.com/content/journals,where you will also find detailed author guidelines.
9
Transport Measuring track vertical stiffness throughdynamic monitoringCano, Fernández and Franco
Offprint provided courtesy of www.icevirtuallibrary.comAuthor copy for personal use, not for distribution