Measuring the Performance of User Traffic in Home...
13
Measuring the Performance of User Traffic in Home Wireless Networks Srikanth Sundaresan 1(B ) , Nick Feamster 2 , and Renata Teixeira 3 1 ICSI, Berkeley, USA [email protected] 2 Princeton University, Princeton, USA [email protected] 3 Inria, Paris, France [email protected] Abstract. This paper studies how home wireless performance charac- teristics affect the performance of user traffic in real homes. Previous studies have focused either on wireless metrics exclusively, without con- nection to the performance of user traffic; or on the performance of the home network at higher layers. In contrast, we deploy a passive measurement tool on commodity access points to correlate wireless per- formance metrics with TCP performance of user traffic. We implement our measurement tool, deploy it on commodity routers in 66 homes for one month, and study the relationship between wireless metrics and TCP performance of user traffic. We find that, most of the time, TCP flows from devices in the home achieve only a small fraction of available access link throughput; as the throughput of user traffic approaches the access link throughput, the characteristics of the home wireless network more directly affect performance. We also find that the 5 GHz band offers users better performance better than the 2.4 GHz band, and although the per- formance of devices varies within the same home, many homes do not have multiple devices sending high traffic volumes, implying that certain types of wireless contention may be uncommon in practice. 1 Introduction Many home networks use 802.11 wireless as a predominant mode of communi- cation; in fact, many consumer devices in home networks connect exclusively over a wireless connection. Despite increasingly widespread deployment of home wireless networks, there is little information about their performance in real homes, particularly as it relates to that of real user traffic and end-to-end perfor- mance. Understanding how wireless performance affects end-to-end user perfor- mance will become increasingly important as the throughput of residential access links continues to increase and the home wireless network becomes more likely a bottleneck. There is an extensive set of previous work studying wireless network per- formance in many settings, including conferences, enterprise networks, and even apartment complexes [1, 3, 6, 9, 10, 12]. These studies have measured either layer-2 c Springer International Publishing Switzerland 2015 J. Mirkovic and Y. Liu (Eds.): PAM 2015, LNCS 8995, pp. 305–317, 2015. DOI: 10.1007/978-3-319-15509-8 23
Transcript of Measuring the Performance of User Traffic in Home...
Measuring the Performance of User Trafficin Home Wireless Networks
Srikanth Sundaresan1(B), Nick Feamster2, and Renata Teixeira3
1 ICSI, Berkeley, [email protected]
2 Princeton University, Princeton, [email protected]
3 Inria, Paris, [email protected]
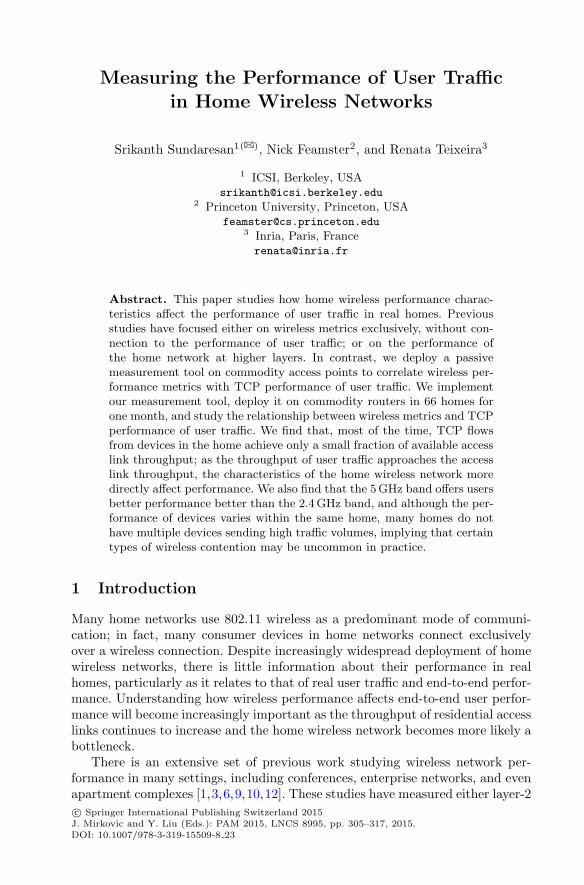
Abstract. This paper studies how home wireless performance charac-teristics affect the performance of user traffic in real homes. Previousstudies have focused either on wireless metrics exclusively, without con-nection to the performance of user traffic; or on the performance ofthe home network at higher layers. In contrast, we deploy a passivemeasurement tool on commodity access points to correlate wireless per-formance metrics with TCP performance of user traffic. We implementour measurement tool, deploy it on commodity routers in 66 homes forone month, and study the relationship between wireless metrics and TCPperformance of user traffic. We find that, most of the time, TCP flowsfrom devices in the home achieve only a small fraction of available accesslink throughput; as the throughput of user traffic approaches the accesslink throughput, the characteristics of the home wireless network moredirectly affect performance. We also find that the 5 GHz band offers usersbetter performance better than the 2.4 GHz band, and although the per-formance of devices varies within the same home, many homes do nothave multiple devices sending high traffic volumes, implying that certaintypes of wireless contention may be uncommon in practice.
1 Introduction
Many home networks use 802.11 wireless as a predominant mode of communi-cation; in fact, many consumer devices in home networks connect exclusivelyover a wireless connection. Despite increasingly widespread deployment of homewireless networks, there is little information about their performance in realhomes, particularly as it relates to that of real user traffic and end-to-end perfor-mance. Understanding how wireless performance affects end-to-end user perfor-mance will become increasingly important as the throughput of residential accesslinks continues to increase and the home wireless network becomes more likely abottleneck.
There is an extensive set of previous work studying wireless network per-formance in many settings, including conferences, enterprise networks, and evenapartment complexes [1,3,6,9,10,12]. These studies have measured either layer-2c© Springer International Publishing Switzerland 2015J. Mirkovic and Y. Liu (Eds.): PAM 2015, LNCS 8995, pp. 305–317, 2015.DOI: 10.1007/978-3-319-15509-8 23
306 S. Sundaresan et al.
performance metrics (such as wireless bitrates and retransmissions) or layer-3performance such as TCP throughput over the wireless link. Yet, wireless net-work performance is extremely variable, even on short timescales, and mappinglayer-2 performance to higher-level performance metrics such as throughput orlatency is challenging. Additionally, active measurements can only capture thewireless network performance at one point in time; these measurements maynot correspond to the performance that users see in practice for their actualapplication traffic.
In this paper, we explore the relationship between wireless performance met-rics and TCP performance of user traffic. To do so, we passively measure wirelessperformance metrics on user traffic as it passes through the home wireless accesspoint and correlate these metrics with the TCP performance of user traffic. Weimplement a measurement tool that runs on a commodity home wireless accesspoint, which permits a widespread deployment and the ability to differentiatewireless versus wide-area performance. The routers that we use for our studyhave both 2.4 and 5 GHz radios, which allows us to compare the performance ofthese two bands. The deployment on commodity hardware poses strict designconstraints: (1) the devices are resource-constrained, which limits the amount ofcollection and processing we can do; (2) each home has only a single measurementvantage point; and (3) we aim to use unmodified drivers to avoid interfering withthe very environment that we are trying to measure. We measured the perfor-mance of wireless networks in 66 home networks around the world; we passivelymeasure user traffic to extract both the performance of active TCP connectionsand wireless statistics such as frame bitrate and retransmissions. Our study bothconfirms results from previous studies and reveals new phenomena. Specifically,we find:
• As access link capacity increases, wireless performance plays a greater role inthe TCP throughput that users observe.
• Latency inside the home is a significant contributor to end-to-end latency.• The 5 GHz channel performs better than the 2.4 GHz (in particular, latency
over the wireless is larger for 2.4 GHz); we also find that bitrates are generallylow and retransmission rates high on 2.4 GHz.
• Within the same home, different devices experience different wireless perfor-mance.
• It is rare for devices in a home to send significant traffic volumes simultane-ously.
As content providers continue to place content closer to users and governmentsand companies continue to invest in increasing access link throughput, under-standing how users’ home wireless networks relate to the performance that theirtraffic experiences will become critical for improving user experience. Our find-ings are a first step towards understanding the relationship between wirelessperformance metrics and TCP performance of user traffic. The results fromthis paper may ultimately be useful for designing a system to detect and isolateperformance problems in home wireless networks.
Measuring the Performance of User Traffic in Home Wireless Networks 307
2 Method
We describe the passive measurement tool that we developed for home accesspoints, and the TCP and wireless performance metrics we used.
2.1 Measurements
We perform passive measurements of user traffic from commodity home wirelessaccess points and correlate those measurements with the wireless metrics for thecorresponding traffic. In contrast to active measurements, passive measurementsmore accurately reflect the actual performance that users experience. Further,passive measurements do not introduce contention or other artifacts that couldaffect the conditions that we seek to characterize. A measurement tool thatoperates on commodity access points facilitates both a widespread deployment,which can take advantage of an installed base of access points, and the abilityto differentiate wireless versus wide-area performance. Ultimately, such a toolcould operate in practice for a large user population. On the other hand, both theresource limitations of commodity access points and the bandwidth constraintsin real home networks introduce design constraints that preclude using existingnetwork diagnostic tools.
We collect packet traces of connections from the WAN interface and bothwireless interfaces on the access point using pcap. Packet traces from the WANinterface provide information about wide-area TCP connections and IP packetsthat traverse the access point. We configure the wireless interfaces in monitormode to capture radiotap headers [11]. For each frame, the radiotap headersprovide the source and destination MAC addresses, the received signal strength(RSSI), and the frame control bits (the bitrate used, and whether the frame wasretransmitted).
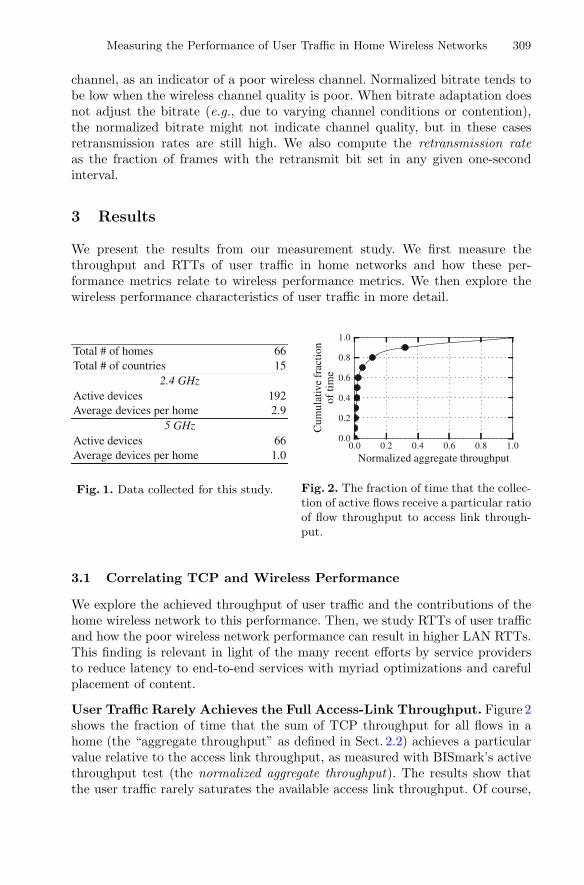
Deployment: We deploy our measurements on BISmark [2,17], which uses Net-gear’s WNDR 3700/3800 access point. This device has an Atheros chipset witha 450 MHz processor, one 802.11gn radio and one 802.11an radio. The 3800 has128 MB of RAM, and the 3700 has 64 MB of RAM. The devices run OpenWrtwith the ath9k wireless driver that uses the Minstrel rate adaptation algorithmwith the default setting to a maximum bitrate of 130 Mbps. To respect user pri-vacy, we do not collect payloads, and we anonymize all IP addresses and MACaddresses using SHA-256 and a per-access point secret salt as the data is col-lected on the router. Figure 1 summarizes our IRB-approved deployment and thecharacteristics of the home networks in this deployment; we collected data from66 homes in 15 countries for one month in 2013.
Limitations: Our collection methods limit the types of wireless performanceproblems that we can study. First, continuous data collection from multiple inter-faces on a commodity access point imposes significant CPU and data require-ments. Thus, the router collect data only every five minutes on average for15 seconds per iteration. The router exports only flow summaries, to reduceupload bandwidth requirements. This level of sampling precludes analyzing
308 S. Sundaresan et al.
fine-grained characteristics (e.g., transient faults, other conditions that fre-quently vary) or characteristics that derive from complete TCP flows. Second,because we anonymize device MACs and IP addresses, finer-grained analysisof the impact of certain types of application flows on certain devices (video inmobile devices, for example) is not possible. It is also not possible to account fordevice-specific issues, such as buffering in mobile devices. Third, we only have asingle vantage point from which to collect our measurements, because typicallyhomes only have a single access point. In contrast, other studies collect and cor-relate data from multiple radios [10] or multiple vantage points [3,6,12]. Finally,due to a driver limitation in the deployed devices, we could not scan for nearbyaccess points. Scanning caused persistent disconnections for a small number ofusers; since this had a direct impact on users (BISmark devices are intended tobe used as the primary access point), we did not scan the medium.
2.2 Metrics
We use the passive traffic traces to extract both TCP-level performance metricsand wireless performance metrics.
TCP Performance Metrics. The access point runs tcptrace, which processesthe pcap traces to provide TCP statistics. We study the average download TCPthroughput achieved during the captured lifetime of the flow. We use this met-ric to compute the aggregate throughput at every one-second interval by sum-ming the average throughput of all active flows downloading traffic through agiven access point during that interval. For reference, we compare the aggregatethroughput with the access link capacity, which we measure using BISmark’sactive measurements. BISmark performs a multi-threaded TCP throughput testapproximately every two hours [16,17]. We define the access link capacity as the95th percentile of the multi-threaded throughput test measurements. We alsostudy the round-trip time (RTT) of TCP connections, which tcptrace com-putes as the difference between the time of the data and SYN packets and itscorresponding acknowledgments (tcptrace’s analysis algorithm already handlesmany corner cases, such as delayed acknowledgments). Running tcptrace at theaccess point allows us to measure both the RTT between the access point andthe home devices (the LAN RTT ) and the RTT between the access point anddestinations in the wide-area (the WAN RTT ).
Wireless Performance Metrics. We use the bitrate, retransmission rate, andreceived signal strength indication (RSSI) as our indicators of wireless perfor-mance problems because we can obtain these metrics easily from packet head-ers. IEEE 802.11 bitrate adaptation techniques adjust the transmission bitrateas wireless channel conditions change. Although these techniques usually adaptrates even under benign conditions to determine the channel quality, rate adapta-tion is typically more frequent when the channel quality is poor, because wirelesssenders typically reduce the bitrate in response to bit errors [8]. Thus, we alsouse the normalized bitrate, which is the average wireless bitrate computed overone second intervals, normalized by the maximum bitrate supported by that
Measuring the Performance of User Traffic in Home Wireless Networks 309
channel, as an indicator of a poor wireless channel. Normalized bitrate tends tobe low when the wireless channel quality is poor. When bitrate adaptation doesnot adjust the bitrate (e.g., due to varying channel conditions or contention),the normalized bitrate might not indicate channel quality, but in these casesretransmission rates are still high. We also compute the retransmission rateas the fraction of frames with the retransmit bit set in any given one-secondinterval.
3 Results
We present the results from our measurement study. We first measure thethroughput and RTTs of user traffic in home networks and how these per-formance metrics relate to wireless performance metrics. We then explore thewireless performance characteristics of user traffic in more detail.
Fig. 1. Data collected for this study. Fig. 2. The fraction of time that the collec-tion of active flows receive a particular ratioof flow throughput to access link through-put.
3.1 Correlating TCP and Wireless Performance
We explore the achieved throughput of user traffic and the contributions of thehome wireless network to this performance. Then, we study RTTs of user trafficand how the poor wireless network performance can result in higher LAN RTTs.This finding is relevant in light of the many recent efforts by service providersto reduce latency to end-to-end services with myriad optimizations and carefulplacement of content.
User Traffic Rarely Achieves the Full Access-Link Throughput. Figure 2shows the fraction of time that the sum of TCP throughput for all flows in ahome (the “aggregate throughput” as defined in Sect. 2.2) achieves a particularvalue relative to the access link throughput, as measured with BISmark’s activethroughput test (the normalized aggregate throughput). The results show thatthe user traffic rarely saturates the available access link throughput. Of course,
310 S. Sundaresan et al.
the TCP traffic might not saturate the access link throughput for many reasons:for example, user traffic demand may be insufficient (in fact, previous studieshave shown this phenomena is often the case [15]), or flows may be short enoughthat they fail to saturate the access link, which could happen if many shortWeb transfers are the dominant traffic type. Unfortunately, we have only theflow statistics exported by tcptrace, so we cannot run a tool like T-RAT [18]to identify with certainty when the application, as opposed to the network, waslimiting TCP throughput. Nevertheless, it is remarkable that the access link isso underutilized so often. We suspect that one reason for lower utilization of theaccess link (when there is sufficient demand to saturate it) may be the presenceof wireless bottlenecks in the home network. The rest of this section exploresthis possibility.
Achieved Throughput Often Correlates with Wireless PerformanceMetrics. To explore the relationship between the TCP throughput of user traf-fic in homes and access-link throughput, we measure how the aggregate through-put correlates with the bitrate and the retransmission rate. We normalize theaggregate throughput by the access link capacity (normalized throughput) andcorrelate this value with each of the wireless performance metrics. When weconsider all traffic flows, TCP throughput does not correlate with any of thewireless performance metrics: the correlation coefficient between retransmissionrate and normalized throughput is −0.01; for bitrate, the correlation coefficientis −0.02; and for RSSI, the correlation is 0.06.
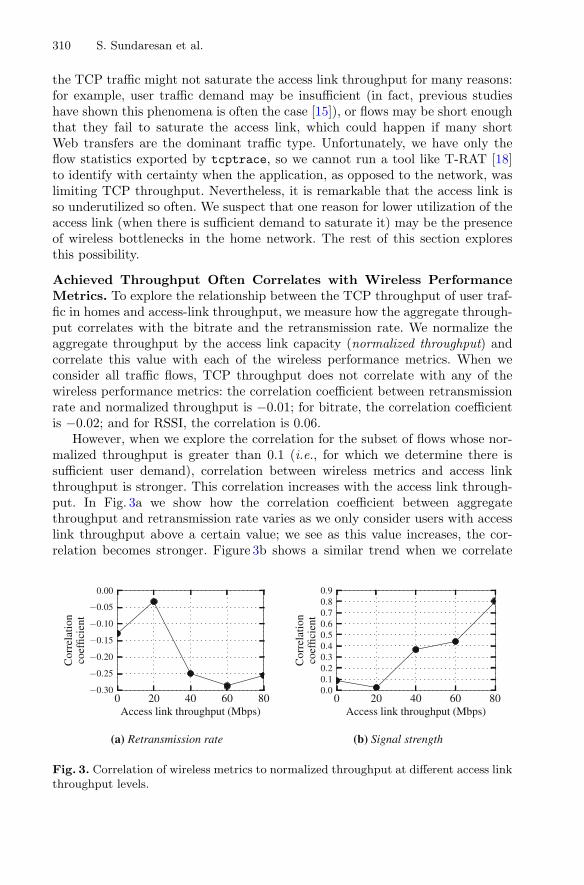
However, when we explore the correlation for the subset of flows whose nor-malized throughput is greater than 0.1 (i.e., for which we determine there issufficient user demand), correlation between wireless metrics and access linkthroughput is stronger. This correlation increases with the access link through-put. In Fig. 3a we show how the correlation coefficient between aggregatethroughput and retransmission rate varies as we only consider users with accesslink throughput above a certain value; we see as this value increases, the cor-relation becomes stronger. Figure 3b shows a similar trend when we correlate
Fig. 3. Correlation of wireless metrics to normalized throughput at different access linkthroughput levels.
Measuring the Performance of User Traffic in Home Wireless Networks 311
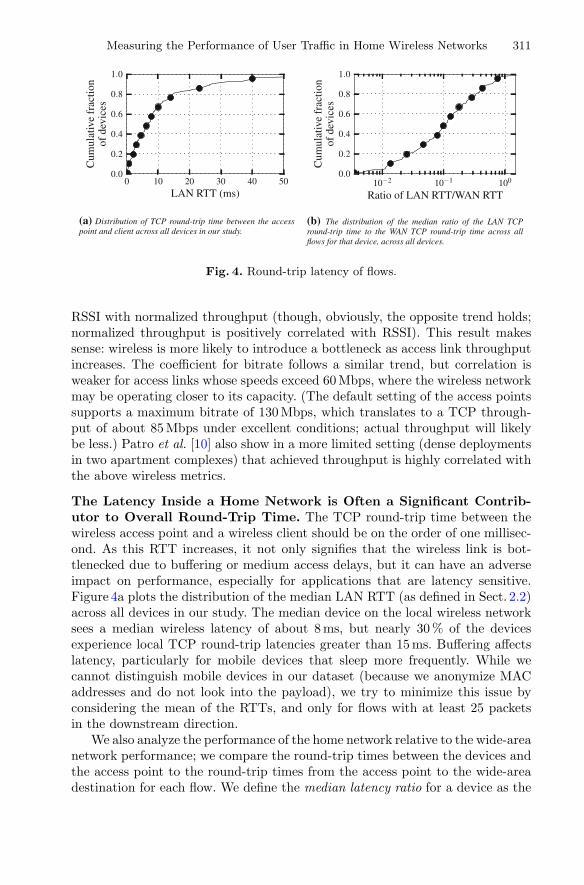
Fig. 4. Round-trip latency of flows.
RSSI with normalized throughput (though, obviously, the opposite trend holds;normalized throughput is positively correlated with RSSI). This result makessense: wireless is more likely to introduce a bottleneck as access link throughputincreases. The coefficient for bitrate follows a similar trend, but correlation isweaker for access links whose speeds exceed 60 Mbps, where the wireless networkmay be operating closer to its capacity. (The default setting of the access pointssupports a maximum bitrate of 130 Mbps, which translates to a TCP through-put of about 85 Mbps under excellent conditions; actual throughput will likelybe less.) Patro et al. [10] also show in a more limited setting (dense deploymentsin two apartment complexes) that achieved throughput is highly correlated withthe above wireless metrics.
The Latency Inside a Home Network is Often a Significant Contrib-utor to Overall Round-Trip Time. The TCP round-trip time between thewireless access point and a wireless client should be on the order of one millisec-ond. As this RTT increases, it not only signifies that the wireless link is bot-tlenecked due to buffering or medium access delays, but it can have an adverseimpact on performance, especially for applications that are latency sensitive.Figure 4a plots the distribution of the median LAN RTT (as defined in Sect. 2.2)across all devices in our study. The median device on the local wireless networksees a median wireless latency of about 8 ms, but nearly 30 % of the devicesexperience local TCP round-trip latencies greater than 15 ms. Buffering affectslatency, particularly for mobile devices that sleep more frequently. While wecannot distinguish mobile devices in our dataset (because we anonymize MACaddresses and do not look into the payload), we try to minimize this issue byconsidering the mean of the RTTs, and only for flows with at least 25 packetsin the downstream direction.
We also analyze the performance of the home network relative to the wide-areanetwork performance; we compare the round-trip times between the devices andthe access point to the round-trip times from the access point to the wide-areadestination for each flow. We define the median latency ratio for a device as the
312 S. Sundaresan et al.
median ratio of the LAN RTT to the WAN RTT (Sect. 2.2) across all flows forthat device. Figure 4b shows the distribution of the median latency ratio across alldevices. The result shows that 30 % of devices have a median latency ratio greaterthan 0.2, meaning that for those devices, at least half of the flows have end-to-end latencies where the home wireless network contributes more than 20 % of theoverall end-to-end latency.
3.2 Wireless Performance of User Traffic
We now characterize wireless performance in our deployment. Our preliminaryfindings include: (1) the 5 GHz wireless band consistently achieves better perfor-mance than the 2.4 GHz band; (2) the performance of a home wireless networkvaries across individual wireless devices within the same home; and (3) multipledevices in the same home network rarely send high traffic volumes at the sametime.
The 5GHz Band Performs Better than the 2.4 GHz Band. We analyzethe performance that devices in home wireless networks achieve and how per-formance varies depending on whether devices are on the 2.4 GHz band or the5 GHz band. Our hypothesis was that devices on the 5 GHz band would performbetter because there are generally fewer devices (and surrounding access points)in the 5 GHz band, and that the 5 GHz band also has less non-WiFi interfer-ence (e.g., microwaves, baby monitors). As shown in previous studies, deviceson 2.4 GHz experience both WiFi and non-WiFi interference [10].
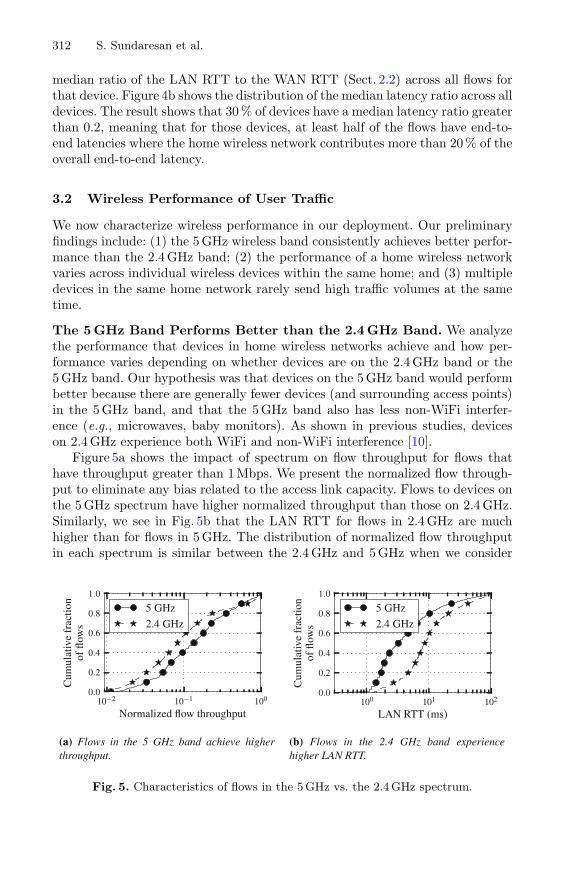
Figure 5a shows the impact of spectrum on flow throughput for flows thathave throughput greater than 1 Mbps. We present the normalized flow through-put to eliminate any bias related to the access link capacity. Flows to devices onthe 5 GHz spectrum have higher normalized throughput than those on 2.4 GHz.Similarly, we see in Fig. 5b that the LAN RTT for flows in 2.4 GHz are muchhigher than for flows in 5 GHz. The distribution of normalized flow throughputin each spectrum is similar between the 2.4 GHz and 5 GHz when we consider
Fig. 5. Characteristics of flows in the 5 GHz vs. the 2.4 GHz spectrum.
Measuring the Performance of User Traffic in Home Wireless Networks 313
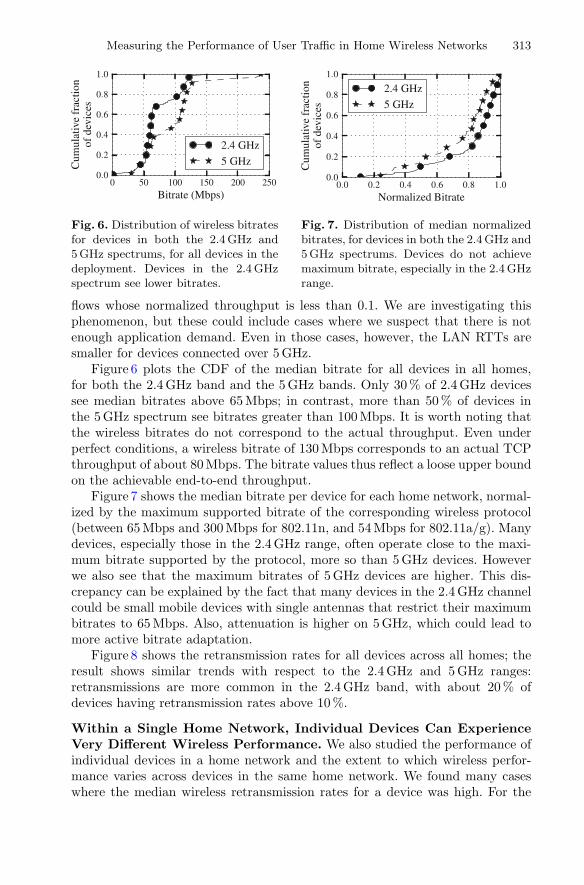
Fig. 6. Distribution of wireless bitratesfor devices in both the 2.4 GHz and5 GHz spectrums, for all devices in thedeployment. Devices in the 2.4 GHzspectrum see lower bitrates.
Fig. 7. Distribution of median normalizedbitrates, for devices in both the 2.4 GHz and5 GHz spectrums. Devices do not achievemaximum bitrate, especially in the 2.4 GHzrange.
flows whose normalized throughput is less than 0.1. We are investigating thisphenomenon, but these could include cases where we suspect that there is notenough application demand. Even in those cases, however, the LAN RTTs aresmaller for devices connected over 5 GHz.
Figure 6 plots the CDF of the median bitrate for all devices in all homes,for both the 2.4 GHz band and the 5 GHz bands. Only 30 % of 2.4 GHz devicessee median bitrates above 65 Mbps; in contrast, more than 50 % of devices inthe 5 GHz spectrum see bitrates greater than 100 Mbps. It is worth noting thatthe wireless bitrates do not correspond to the actual throughput. Even underperfect conditions, a wireless bitrate of 130 Mbps corresponds to an actual TCPthroughput of about 80 Mbps. The bitrate values thus reflect a loose upper boundon the achievable end-to-end throughput.
Figure 7 shows the median bitrate per device for each home network, normal-ized by the maximum supported bitrate of the corresponding wireless protocol(between 65 Mbps and 300 Mbps for 802.11n, and 54 Mbps for 802.11a/g). Manydevices, especially those in the 2.4 GHz range, often operate close to the maxi-mum bitrate supported by the protocol, more so than 5 GHz devices. Howeverwe also see that the maximum bitrates of 5 GHz devices are higher. This dis-crepancy can be explained by the fact that many devices in the 2.4 GHz channelcould be small mobile devices with single antennas that restrict their maximumbitrates to 65 Mbps. Also, attenuation is higher on 5 GHz, which could lead tomore active bitrate adaptation.
Figure 8 shows the retransmission rates for all devices across all homes; theresult shows similar trends with respect to the 2.4 GHz and 5 GHz ranges:retransmissions are more common in the 2.4 GHz band, with about 20 % ofdevices having retransmission rates above 10 %.
Within a Single Home Network, Individual Devices Can ExperienceVery Different Wireless Performance. We also studied the performance ofindividual devices in a home network and the extent to which wireless perfor-mance varies across devices in the same home network. We found many caseswhere the median wireless retransmission rates for a device was high. For the
314 S. Sundaresan et al.
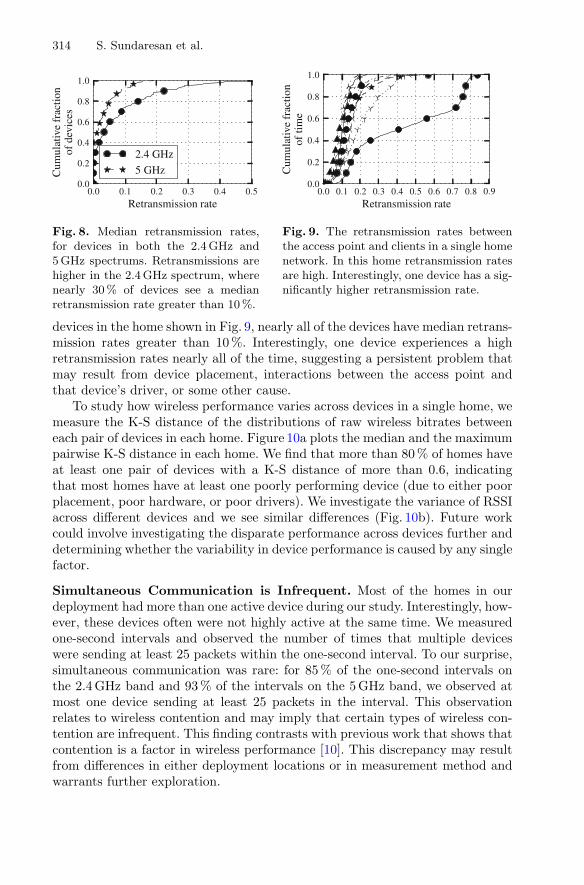
Fig. 8. Median retransmission rates,for devices in both the 2.4 GHz and5 GHz spectrums. Retransmissions arehigher in the 2.4 GHz spectrum, wherenearly 30 % of devices see a medianretransmission rate greater than 10 %.
Fig. 9. The retransmission rates betweenthe access point and clients in a single homenetwork. In this home retransmission ratesare high. Interestingly, one device has a sig-nificantly higher retransmission rate.
devices in the home shown in Fig. 9, nearly all of the devices have median retrans-mission rates greater than 10 %. Interestingly, one device experiences a highretransmission rates nearly all of the time, suggesting a persistent problem thatmay result from device placement, interactions between the access point andthat device’s driver, or some other cause.
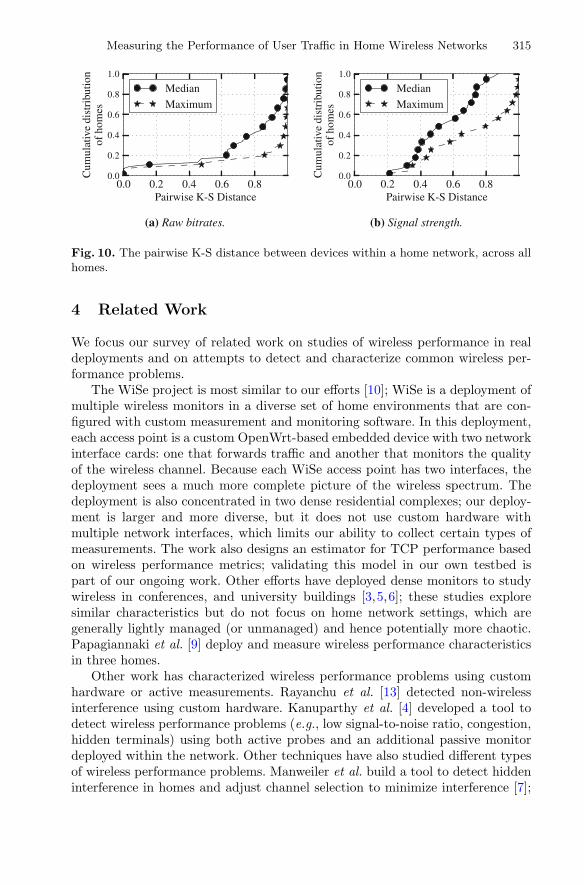
To study how wireless performance varies across devices in a single home, wemeasure the K-S distance of the distributions of raw wireless bitrates betweeneach pair of devices in each home. Figure 10a plots the median and the maximumpairwise K-S distance in each home. We find that more than 80 % of homes haveat least one pair of devices with a K-S distance of more than 0.6, indicatingthat most homes have at least one poorly performing device (due to either poorplacement, poor hardware, or poor drivers). We investigate the variance of RSSIacross different devices and we see similar differences (Fig. 10b). Future workcould involve investigating the disparate performance across devices further anddetermining whether the variability in device performance is caused by any singlefactor.
Simultaneous Communication is Infrequent. Most of the homes in ourdeployment had more than one active device during our study. Interestingly, how-ever, these devices often were not highly active at the same time. We measuredone-second intervals and observed the number of times that multiple deviceswere sending at least 25 packets within the one-second interval. To our surprise,simultaneous communication was rare: for 85 % of the one-second intervals onthe 2.4 GHz band and 93 % of the intervals on the 5 GHz band, we observed atmost one device sending at least 25 packets in the interval. This observationrelates to wireless contention and may imply that certain types of wireless con-tention are infrequent. This finding contrasts with previous work that shows thatcontention is a factor in wireless performance [10]. This discrepancy may resultfrom differences in either deployment locations or in measurement method andwarrants further exploration.
Measuring the Performance of User Traffic in Home Wireless Networks 315
Fig. 10. The pairwise K-S distance between devices within a home network, across allhomes.
4 Related Work
We focus our survey of related work on studies of wireless performance in realdeployments and on attempts to detect and characterize common wireless per-formance problems.
The WiSe project is most similar to our efforts [10]; WiSe is a deployment ofmultiple wireless monitors in a diverse set of home environments that are con-figured with custom measurement and monitoring software. In this deployment,each access point is a custom OpenWrt-based embedded device with two networkinterface cards: one that forwards traffic and another that monitors the qualityof the wireless channel. Because each WiSe access point has two interfaces, thedeployment sees a much more complete picture of the wireless spectrum. Thedeployment is also concentrated in two dense residential complexes; our deploy-ment is larger and more diverse, but it does not use custom hardware withmultiple network interfaces, which limits our ability to collect certain types ofmeasurements. The work also designs an estimator for TCP performance basedon wireless performance metrics; validating this model in our own testbed ispart of our ongoing work. Other efforts have deployed dense monitors to studywireless in conferences, and university buildings [3,5,6]; these studies exploresimilar characteristics but do not focus on home network settings, which aregenerally lightly managed (or unmanaged) and hence potentially more chaotic.Papagiannaki et al. [9] deploy and measure wireless performance characteristicsin three homes.
Other work has characterized wireless performance problems using customhardware or active measurements. Rayanchu et al. [13] detected non-wirelessinterference using custom hardware. Kanuparthy et al. [4] developed a tool todetect wireless performance problems (e.g., low signal-to-noise ratio, congestion,hidden terminals) using both active probes and an additional passive monitordeployed within the network. Other techniques have also studied different typesof wireless performance problems. Manweiler et al. build a tool to detect hiddeninterference in homes and adjust channel selection to minimize interference [7];
316 S. Sundaresan et al.
the tool requires a custom kernel and does not run on a commodity access point.Shrivastava et al. develop a tool for estimating interference in enterprise wirelessLANs [14]; the tool requires collection and analysis of packet traces at multipleaccess points within an enterprise to perform diagnosis.
5 Conclusion
In this paper, we characterized the performance of user traffic in home wirelessnetworks from 66 homes in 15 countries using passive network measurements.We analyzed passively collected traces in both the 2.4 GHz and the 5 GHz spec-trum. One of the more significant challenges in executing this study involveddesigning a measurement tool that could operate within the tight constraintsof a commodity home router and draw reasonable inferences from a single van-tage point without a second monitor radio. Our study of this real user trafficin home networks revealed that most TCP flows in home networks achieve onlya small fraction of the available access link throughput, that wireless charac-teristics have a greater effect on the performance of user traffic as access linkthroughput increases, that the 5 GHz channel exhibits better performance thanthe 2.4 GHz band, and that distinct devices within the same home can see verydifferent wireless performance. We plan to build on these insights to create adiagnostic tool that can identify both the location of the network bottlenecklink and the underlying causes of the bottleneck, should it lie in the wirelessnetwork. Finally, although wireless performance often suffers as a result of tran-sient factors, such as microwaves, passing humans, or even minute changes inorientation of devices, many wireless performance problems are persistent. Ourability to monitor wireless performance over longer time periods in many homesmay shed light on the persistent performance problems, which could offer a moreholistic picture of wireless network performance problems.
References
1. Adya, A., Bahl, P., Chandra, R., Qiu, L.: Architecture and techniques for diagnos-ing faults in IEEE 802.11 infrastructure networks. In: MobiCom 2004, pp. 30–44.ACM, New York (2004). http://doi.acm.org/10.1145/1023720.1023724
2. BISMark: Broadband Internet Service Benchmark. http://projectbismark.net/3. Cheng, Y.C., Afanasyev, M., Verkaik, P., Benko, P., Chiang, J., Snoeren, A.C.,
Savage, S., Voelker, G.M.: Automating cross-layer diagnosis of enterprise wirelessnetworks. SIGCOMM Comput. Commun. Rev. 37(4), 25–36 (2007)
4. Kanuparthy, P., Dovrolis, C., Papagiannaki, K., Seshan, S., Steenkiste, P.: Canuser-level probing detect and diagnose common home-WLAN pathologies. SIG-COMM Comput. Commun. Rev. 42(1), 7–15 (2012)
5. Kotz, D., Essien, K.: Analysis of a campus-wide wireless network. Wirel. Netw.11(1–2), 115–133 (2005)
6. Mahajan, R., Rodrig, M., Wetherall, D., Zahorjan, J.: Analyzing the MAC-levelbehavior of wireless networks in the wild. In: SIGCOMM 2006, pp. 75–86 (2006)
Measuring the Performance of User Traffic in Home Wireless Networks 317
7. Manweiler, J., Franklin, P., Choudhury, R.: RxIP: monitoring the health of homewireless networks. In: INFOCOM, 2012 Proceedings IEEE, pp. 558–566, Mar 2012
8. Minstrel rate adaptation algorithm. http://goo.gl/5xPSC9. Papagiannaki, K., Yarvis, M., Conner, W.S.: Experimental characterization of
home wireless networks and design implications. In: Proceedings of the IEEEINFOCOM, Barcelona, Spain, Mar 2006
10. Patro, A., Govindan, S., Banerjee, S.: Observing home wireless experience throughWiFi APS. In: MobiCom 2013, pp. 339–350. ACM, New York (2013)
11. Radiotap. http://radiotap.org12. Rayanchu, S., Mishra, A., Agrawal, D., Saha, S., Banerjee, S.: Diagnosing wireless
packet losses in 802.11: separating collision from weak signal. In: INFOCOM 2008,pp. 735–743, Apr 2008
13. Rayanchu, S., Patro, A., Banerjee, S.: Airshark: detecting non-WiFi RF devicesusing commodity WiFi hardware. In: IMC 2011, pp. 137–154. ACM, New York(2011)
14. Shrivastava, V., Rayanchu, S., Banerjee, S., Papagiannaki, K.: PIE in the sky:online passive interference estimation for enterprise WLANs. In: NSDI 2011, p. 25.USENIX Association, Berkeley (2011)
15. Siekkinen, M., Collange, D., Urvoy-Keller, G., Biersack, E.W.: Performance limi-tations of ADSL users: a case study. In: Uhlig, S., Papagiannaki, K., Bonaventure,O. (eds.) PAM 2007. LNCS, vol. 4427, pp. 145–154. Springer, Heidelberg (2007)
16. Sundaresan, S., de Donato, W., Feamster, N., Teixeira, R., Crawford, S., Pescape,A.: Broadband internet performance: a view from the gateway. In: Proceedings ofthe ACM SIGCOMM, Toronto, ON, Canada, Aug 2011
17. Sundaresan, S., Burnett, S., de Donato, W., Feamster, N.: BISmark: a testbedfor deploying measurements and applications in broadband access networks. In:Proceedings of the USENIX Annual Technical Conference, Philadelphia, CA, June2014
18. Zhang, Y., Breslau, L., Paxson, V., Shenker, S.: On the characteristics and originsof internet flow rates. In: Proceedings of the ACM SIGCOMM, Pittsburgh, PA,Aug 2002


![Nick Feamster - cs.princeton.edufeamster/cv/cv-jan2016.pdfPublications Theses [1] Nick Feamster. Proactive Techniques for Correct and Predictable Internet Routing. PhD thesis, Massachusetts](https://static.fdocuments.net/doc/165x107/5abef7417f8b9a7e418d9338/nick-feamster-cs-feamstercvcv-jan2016pdfpublications-theses-1-nick-feamster.jpg)