Measuring the Multiplier Effects of Tourism industry to ... 7_2_7.pdf · tourism sector that...
35
Advances in Management & Applied Economics, vol. 7, no. 2, 2017, 123-157 ISSN: 1792-7544 (print version), 1792-7552(online) Scienpress Ltd, 2017 Measuring the Multiplier Effects of Tourism industry to the Economy Sébastien Mathouraparsad 1 and Alain Maurin 1 Abstract The discussion and the empirical investigations presented in this article are part of the goal to implement the specific actions necessary for the economic evaluation of the impacts of tourism based on the conceptual and methodological standards of Tourist Satellite Accounts (TSAs) as formalised by the World Tourism Organisation (WTO), the United Nations Statistics Division and the OECD. First, we summarise the essential concepts and definitions relating to the macroeconomic impact of tourism; then, we offer a brief summary of the corpus of literature dedicated to assessing the importance of the tourism industry in the economies of the French Overseas Departments, in particular in the case of Guadeloupe. Secondly, we demonstrate that the theoretical framework of SAM modelling provides a particularly appropriate approach to conducting a detailed analysis of the repercussions of tourism in terms of its direct, indirect and induced effects across the various branches of the economy. Since Guadeloupe does not at present have an official system of Tourism Satellite Accounts, we propose to adopt the Social Accounting Matrix (SAM) as an alternative approach in order to establish results capable of filling this information deficit. Alongside the macroeconomic analyses of TSA-type tourism activities that have been conducted for Réunion and Martinique, and also alongside the TSA development programmes currently in progress for various CARICOM countries, the studies presented in this contribution are intended to offer elucidation of a similar nature on the measurement of the impact of tourism on the Guadeloupe economy. JEL classification numbers: L83 Keywords: Impact of tourism, input-output table, social accounting matrix, tourism satellite account 1 Centre de recherche en économie et droit du développement insulaire, Université des Antilles. Article Info: Received: September 2, 2016. Revised: October 3, 2016. Published online: March 1, 2017
Transcript of Measuring the Multiplier Effects of Tourism industry to ... 7_2_7.pdf · tourism sector that...
Advances in Management & Applied Economics, vol. 7, no. 2, 2017, 123-157
ISSN: 1792-7544 (print version), 1792-7552(online)
Scienpress Ltd, 2017
Measuring the Multiplier Effects of Tourism
industry to the Economy
Sébastien Mathouraparsad1 and Alain Maurin1
Abstract
The discussion and the empirical investigations presented in this article are part of
the goal to implement the specific actions necessary for the economic evaluation
of the impacts of tourism based on the conceptual and methodological standards of
Tourist Satellite Accounts (TSAs) as formalised by the World Tourism
Organisation (WTO), the United Nations Statistics Division and the OECD. First,
we summarise the essential concepts and definitions relating to the
macroeconomic impact of tourism; then, we offer a brief summary of the corpus
of literature dedicated to assessing the importance of the tourism industry in the
economies of the French Overseas Departments, in particular in the case of
Guadeloupe. Secondly, we demonstrate that the theoretical framework of SAM
modelling provides a particularly appropriate approach to conducting a detailed
analysis of the repercussions of tourism in terms of its direct, indirect and induced
effects across the various branches of the economy. Since Guadeloupe does not at
present have an official system of Tourism Satellite Accounts, we propose to
adopt the Social Accounting Matrix (SAM) as an alternative approach in order to
establish results capable of filling this information deficit. Alongside the
macroeconomic analyses of TSA-type tourism activities that have been conducted
for Réunion and Martinique, and also alongside the TSA development
programmes currently in progress for various CARICOM countries, the studies
presented in this contribution are intended to offer elucidation of a similar nature
on the measurement of the impact of tourism on the Guadeloupe economy.
JEL classification numbers: L83
Keywords: Impact of tourism, input-output table, social accounting matrix,
tourism satellite account
1 Centre de recherche en économie et droit du développement insulaire, Université des Antilles.
Article Info: Received: September 2, 2016. Revised: October 3, 2016.
Published online: March 1, 2017

124 Sébastien Mathouraparsad and Alain Maurin
1 Introduction
Since the advent of the democratisation of the phenomenon of international air
transport, it has become increasingly rare to find a country or a sub-national region
that is not taking steps to implement a tourism development strategy.
In wealthy countries, tourism undeniably constitutes an arena for international
competition. Today, the European Union holds the number one position with a
tourism sector that generates over 10% of its GDP and employs 9.7 million people
distributed across 1.8 million undertakings. In the United States, it contributes
significantly to GDP and represents a key sector in total exports of goods and
services. Every year, the media delights in giving rundowns of the world's top
most visited cities and have also started to offer rankings according to other
criteria.
In very many developing countries, for some years now we have also seen a
greater recognition of the role that ought to be played by tourism as a driver of
development, being as it is a source of foreign currencies and a support for
activities that generate revenues and jobs. On the African continent alone, for
example, World Tourism Organisation (WTO) data reports 63.6 million
international tourists for 2012 compared with 17.4 million in 1990. Even though
the distribution of gains between the countries is very unequal, the fact
nevertheless remains that their macroeconomic impacts are considerable. For the
leading beneficiary countries, receipts from international tourists reach amounts
that represent double the national GDP of some States: in 2012, these receipts
stood at $9.94 billion for Egypt and $6.711 billion, $2.183 billion and $1.564
billion respectively for Morocco, Tunisia and Tanzania; for the same year, the
GDP of Barbados reached US$5 billion, that of Haiti US$7.2 billion, and that of
the Bahamas US$8 billion. Likewise, taking such eclectic examples as Senegal,
Niger, Malta, Afghanistan and Laos, they report respective GDP figures of US$14
billion, US$6.8 billion, US$8.8 billion, US$20.4 billion and US$9.1 billion. These
few example show quite clearly that tourism occupies a position as one of the
most important sectors of national economies, showing itself to be a driver of
wealth creation.
But the economic literature is not solely restricted to publications highlighting the
positive roles of international tourism. A number of authors have focused on
examples of developing countries to deplore the low share of tourism expenditure
that they receive, even where these countries see the number of international
visitors growing more rapidly than their tourism receipts. In their paper on the
measurement of the economic effects of international tourism in destination
countries, Caire and Le Masne (2006) recalled the relatively concerning finding of
the United Nations Conference on Trade and Development (UNCTAD): " tourism
leakage is thought to be in the order of 85% in the LDCs of Africa, 80% in the
Measuring the Multiplier Effects of Tourism industry to the Economy 125
Caribbean, 70% in Thailand, 40% in India and between 10% and 20% for the most
advanced and diversified developing countries (such as Mexico)."
Of course, these figures have not been without controversy, due to the fact that
they have been reproduced in numerous articles of the literature on the subject and
they are contested because their methods of calculation are not known. However,
since they reflect certain realities widely discussed in developing countries, they
underscore the scale of the challenges to be overcome by policymakers if they are
to ensure that tourism is a sector that provides significant benefits for their
domestic economies and their populations. It was with this in mind that the
UNCTAD launched the E-Tourism Initiative in 2004, designed to help developing
countries to deploy strategies and public policy actions to minimise the leakage of
tourism receipts that they were experiencing.
In the light of all the figures cited above and the challenges arising from their
implications, there is an indisputable lesson to be drawn: the undoubted necessity
for government leaders to have at their disposal reliable measurements of the
tourist activity in an economy.
More than ever before, this requirement is essential for Guadeloupe. A plethora of
findings and arguments can easily be cited to highlight the fact that regular
observation of tourism activity and its economic impacts are core needs for a
multitude of actors. Firstly, the needs of policymakers with responsibility for
steering tourism policy at both national and local level. Without question, through
their discourse and acts the public authorities demonstrate that they are acutely
aware of the strategic role to be played by the tourism sector in the Guadeloupe
economy, and its potential in particular. Secondly, international bodies and
partners of Guadeloupe in the processes of regional cooperation. To give just one -
yet utterly typical - example, this is illustrated by the publications of the Caribbean
Tourism Organization (CTO) which give no information on Guadeloupe whereas
they offer an assessment of the tourism economy in the various territories of the
Caribbean Basin, allowing comparison between them as well as change
monitoring over long periods.
The primary objective of our analysis is to provide a methodological tool for the
quantification of the economic significance of the branch of activity constituted by
tourism in a small island economy such as that of the Guadeloupe Archipelago.
On the basis of the conceptual framework of Social Accounting Matrices (SAMs),
we propose an examination of the interdependence of the tourism sector with the
economic circuit as a whole, highlighting the main transaction flows between
agents. In so doing, we intend to extend the approach offered by input-output
tables (IOTs) commonly used in the French Overseas Departments and which
consist in plotting the interactions between the productive branches of the
economy by means of their intermediate consumptions. Our SAM-based tourism

126 Sébastien Mathouraparsad and Alain Maurin
modelling exercise also offers a means of describing the impact analysis in terms
of multipliers and the calculation of benefit aggregation as well as the effects of
exogenous expenditure on the economic circuit.
We will initially give an overview of the definitions and concepts developed in the
literature for the measurement and evaluation of the economic impact of tourism,
focusing in on the methodological framework of Tourism Satellite Accounts
(TSAs). We then explain how the SAM can be deployed in order to derive tourism
indicators and to establish estimates of the economic impact of tourism by
distinguishing between the direct, indirect and induced effects. Thirdly, we present
the results of our empirical applications, endeavouring to reconcile our "output
indicators" with the list of indicators making up a TSA.
2 Satellite accounting methodology for the analysis of the
economic impact of tourism
2.1 Definitions and concepts
On a subject as broad as tourism and a theme as complex as the economic analysis
of tourism, the precaution of defining the semantic scope would appear to be a
prerequisite for correctly focusing on the concepts addressed and the quantities
measured. It is entirely natural, then, to turn to the similar exercises previously
carried out in the literature. Professor Boris Vukonic, of the Utilus Business
School for Tourism and Hotel Management in Zagreb clearly sets out this
approach in his fine introduction to The Routledge Handbook of Tourism
Research edited by Hsu and Gartner (2012):
“One of the significant interests of theorists was to define the tourism
phenomenon itself, as theorists realised that the imprecise definition causes
difficulties in thinking about tourism, in keeping statistical records, and in having
a general understanding of tourism as a social phenomenon”.
Conducting a relatively concise yet meticulous review of the history of the theory
of tourism, he offers a reminder that the definition of Hunziker and Krapf (1942)
was among the first to be widely accepted at the time by experts and members of
the International Association of Scientific Experts in Tourism (AIEST):
“We understand by tourism the sum of the relationships and phenomena arising
from the travel and stay non-residents, insofar as they do not lead to permanent
residence and are not connected with earning activity “
Now a societal reality within every nation and in international exchanges, tourism
has constantly developed and has constituted a field of investigation in a multitude
of disciplines. A phenomenon presenting critical economic issues in international
competitiveness, it has mobilised the efforts of economists and governmental
bodies in order to establish a common framework for its definition and the

Measuring the Multiplier Effects of Tourism industry to the Economy 127
concepts it covers. A relatively detailed presentation of the conceptual and
methodological basis for the economic analysis of tourism is given on the website
of the World Tourism Organisation - WTO. Among other things, it contains a
glossary and "United Nations approved International Recommendations which
establish the concepts, definition, classifications and the basic set of data and
indicators that should be part of any national System of Tourism Statistics" (see the
WTO website: http://statistics.unwto.org/).
The definition of tourism used at international level today, and approved by the
United Nations, is worded as follows:
"Tourism is a social, cultural and economic phenomenon which entails the
movement of people to countries or places outside their usual environment for
personal or business/professional purposes. These people are called visitors
(who may be either tourists or excursionists; residents or non-residents) and
tourism has to do with their activities, some of which imply tourism
expenditure."
In the Mediterranean Basin, the Indian Ocean or the Caribbean, tourist activities
constitute a driver of the local economy for many countries and, specifically, their
impacts vary widely according to the assets and weaknesses of the territories in
question. As a consequence, the primary objective of the economic analysis of
tourism is to identify and quantify the extent of the role of the economic effects of
tourism on growth, GDP, employment etc. To achieve this end, the international
community of experts has also provided clarifications concerning the terminology
to be used to describe the components of the economic impact of tourism. As
highlighted by Maurence (2010), economic impact studies are frequently
structured around a breakdown into direct, indirect and induced impacts, but
unfortunately the literature has long contained sometimes egregious nuances in the
definition of these impacts and also in their methods of calculation (see Figure 1 by
way of illustration). However, a comparative reading of various reports on this
problem, and the concern to adhere to approaches implemented commonly at
international level, permit of broadly assigning the following definitions and
realities (Maurence (2010), Vellas (2011)) to direct, indirect and induced impacts:

128 Sébastien Mathouraparsad and Alain Maurin
Certain studies in
France
M.E.E.T.S.
Canada
A.I.S.T.S.
Switzerland
DIRECT
impact
Organiser
Expenditure
Organiser
expenditure
+
Visitor
expenditure
Organiser
expenditure
+
Visitor
expenditure etc.
INDIRECT
impact
Visitor
expenditure
Repercussions
linked to inter-
undertaking
exchanges
Repercussions
linked to inter-
undertaking
exchanges
INDUCED
impact
Repercussions
linked to inter-
undertaking
exchanges
Repercussions
linked to household
consumption
+
Repercussions
linked to
investments
Repercussions
linked to household
consumption
Figure 1: Examples of the use of the terms "direct", "indirect" and "induced" in approaches to the
evaluation of short-term economic impact
Source: Eric Maurence (2010)
Direct impact: primary economic impact generated by the phenomenon under
consideration in a territory as the result of the expenditure it occasions, in
particular from purchasing and consumption effected locally by the visitors. In the
case of tourism, the indirect impact is thus associated with the direct creation of
wealth (essentially value added and taxes) through the activities of establishments
connected with the tourism sector, activities and expenditure classified from the
list of tourism characteristic products drawn up by the WTO and the OECD.
Indirect impact: impact resulting from the direct impact and representing the
surplus of value injected into the local economy from the expenditure of
undertakings and their employees.
The indirect effects of tourism relate to intermediate consumptions for the
production of goods and services for the tourism sector. These are the goods and

Measuring the Multiplier Effects of Tourism industry to the Economy 129
services purchased by tourism undertakings from their suppliers, which constitutes
the tourism supply chain. It is therefore important to encourage the tourism sector
to procure locally-produced goods and services in order to maximise the economic
impact of tourism receipts in a country or region.
Induced impact: impact consequential to the direct and indirect impacts and
which results from the consumption of households on the basis of revenues
distributed by undertakings having benefited from the activity in question. The
induced effects of tourism thus correspond to the trickle-down effect from the
successive expenditure of agents having benefited directly or indirectly from the
initial expenditure of the tourism sector ("snowball" effect).
Figure 2 : Methodological framework of the indirect impacts of tourism
Sources: Marques (2012)
2.2 Tourism Satellite Accounts (TSAs)
Since the 1970s, the gradual rise of the tourism industry almost everywhere in the
world, and the critical issues connected with awareness of its economic impacts,
have mobilised a wide-ranging community of international institutions (UNESCO,
World Bank, European Union, World Tourism Organisation etc.) and academic or
private sector researchers, with the aim of constructing a system of Tourism
Satellite Accounts (TSAs).
Given the fact that tourism, just like transport, environment or health, is a
particular horizontal sector which is not fully represented in the system of national
accounts (SNA), unlike sectors such as agriculture or trade, the need soon became
apparent for the development of "satellite sub-systems" in order to be able to offer

130 Sébastien Mathouraparsad and Alain Maurin
a presentation framework for presenting the data on their economic activities, in
relation to the overall economic analysis of the central framework of national
accounts.
Thus, the Tourism Satellite Accounts serve as information additional to the central
framework of national accounts for tourism activities, which are partially
represented in the latter. Their aim is to cover in detail all aspects of the demand
for goods and services associated with the activity of visitors, to trace the
confrontation between this demand and domestic supply and to describe the
interactions between this supply and the other components of the economy.
It was at the International Conference on Travel and Tourism Statistics, held in
Ottawa in June 1991, that the first TSA prototype was presented by Stewart Wells
on behalf of Statistics Canada. This document demonstrated the feasibility of the
"technology transfer" consisting in implementing the principles of satellite
accounts for the tourism industry. In the wake of the Ottawa conference,
significant efforts and a whole series of initiatives at international level were also
rolled out in the 1990s and 2000s in order to develop methodological approaches,
tools and techniques designed to overcome the challenges involved in quantifying
the contributions made by tourism to the economy, policies and programmes (see
Kemp and Nijhowne (2004)).
The practical culmination of this movement of convergence of conceptual and
methodological studies came with the approval of the document "Tourist Satellite
Account (TSA): recommendations concerning the conceptual framework" by the
Statistical Commission of the United Nations at its 31st session in March 2000.
This publication now constitutes the main international reference for the
development of a TSA and it provides a common language not only for the
measurement of tourism but also its comparison with other sectors of the economy
and its international comparability.
With regard to the content and the set of information provided by TSAs, a clear
description is given in the introductory chapter of the report published by the
United Nations in 2009 (page 18):
"The complete Tourism Satellite Account provides:
• Macroeconomic aggregates that describe the size and the direct economic
contribution of tourism, such as tourism direct gross value added (TDGVA)
and tourism direct gross domestic product (TDGDP), consistent with similar
aggregates for the total economy and for other productive economic activities
and functional areas of interest;
• Detailed data on tourism consumption, a more extended concept associated
with the activity of visitors as consumers, and a description of how this

Measuring the Multiplier Effects of Tourism industry to the Economy 131
demand is met by domestic supply and imports; this data is integrated within
tables derived from supply and use tables which can be compiled both at
current and constant prices;
• Detailed production accounts of the tourism industries, including data on
employment, linkages with other productive economic activities and gross
fixed capital formation;
• A link between economic data and non-monetary information on tourism,
such as number of trips (or visits), duration of stay, purpose of trip, modes of
transport, etc., which is required to specify the characteristics of the economic
variables,"
After these few reminders of the issues involved in TSAs and the history of their
emergence, it is apposite to underscore the fact that since the late 1990s we have
witnessed true international enthusiasm reflecting the desire on the part of a
majority of countries across the world to have a TSA mechanism at their disposal.
The list of TSA tables varies from one country to another depending on the
availability of data on economic accounts and the constraints associated with the
collection of additional statistical information. In fact, the development of a TSA
calls, on the one hand, for the input-output tables of economic accounts and, on
the other, for data derived from a variety of administrative sources and surveys.
Taken together, this data must provide information on domestic tourism
consumption by product and by type of tourism, on the production accounts of the
tourism industries or on employment in the tourism industries. Figure 3 below
illustrates the process implemented within Statistics Canada.

132 Sébastien Mathouraparsad and Alain Maurin
Figure 3: Data on the national economic accounts system used within the Tourism Satellite
Account of Canada
Source: Statistics Canada (2007), page 24.
Overall, this set includes, first, tables showing the balance between supply and
demand (domestic tourism consumption by product and by type of tourism,
domestic tourism supply, production accounts of the tourism industries, tourism
value added and GDP etc.) and tables showing employment in the tourism
industries. To be even more pragmatic, a complete TSA is structured around the
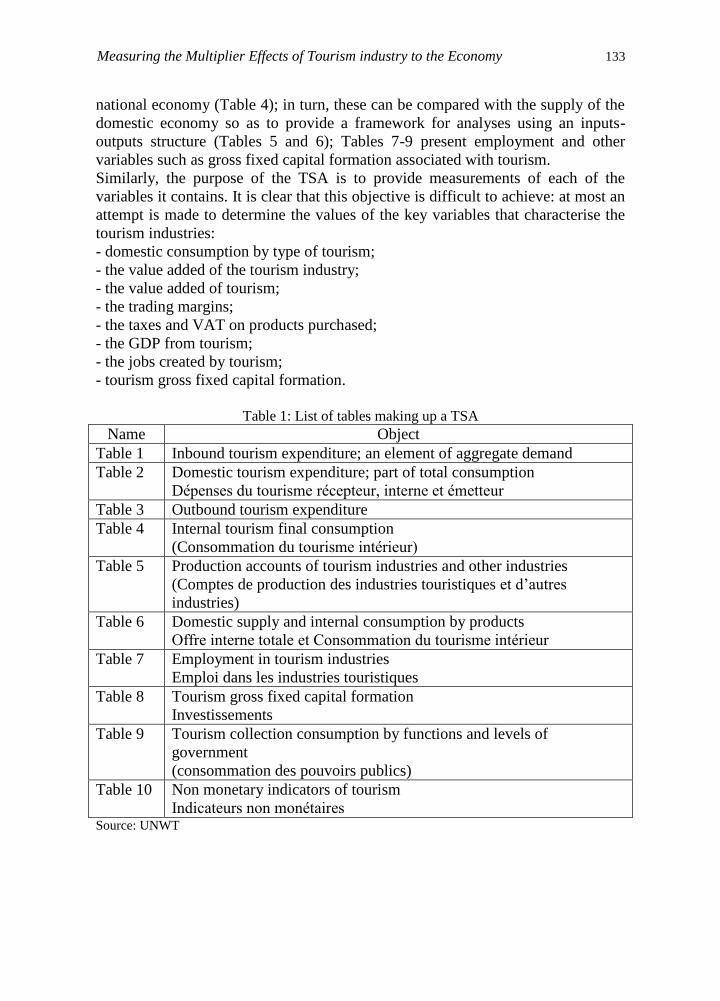
set of 10 summary tables (Table 1),
"each one containing data and representing a distinct aspect of the tourism
economic data: expenditure of inbound tourism, domestic tourism, outbound
tourism and interior tourism, production accounts of the tourism industries,
gross value added and gross domestic product (GDP) deriving from the tourism
demand, employment, investments, consumption of public administrations and
non-monetary indicators." (see the website of the WTO:
http://statistics.unwto.org/).
In more detail, the set of 10 tables of the TSA is structured showing, in this order:
the expenditure of tourism consumption associated with the various forms of
tourism (Tables 1 to 3); the aggregates of domestic tourism consumption are
calculated by totalling the non-monetary transactions that take place in the
Measuring the Multiplier Effects of Tourism industry to the Economy 133
national economy (Table 4); in turn, these can be compared with the supply of the
domestic economy so as to provide a framework for analyses using an inputs-
outputs structure (Tables 5 and 6); Tables 7-9 present employment and other
variables such as gross fixed capital formation associated with tourism.
Similarly, the purpose of the TSA is to provide measurements of each of the
variables it contains. It is clear that this objective is difficult to achieve: at most an
attempt is made to determine the values of the key variables that characterise the
tourism industries:
- domestic consumption by type of tourism;
- the value added of the tourism industry;
- the value added of tourism;
- the trading margins;
- the taxes and VAT on products purchased;
- the GDP from tourism;
- the jobs created by tourism;
- tourism gross fixed capital formation.
Table 1: List of tables making up a TSA
Name Object
Table 1 Inbound tourism expenditure; an element of aggregate demand
Table 2 Domestic tourism expenditure; part of total consumption
Dépenses du tourisme récepteur, interne et émetteur
Table 3 Outbound tourism expenditure
Table 4 Internal tourism final consumption
(Consommation du tourisme intérieur)
Table 5 Production accounts of tourism industries and other industries
(Comptes de production des industries touristiques et d’autres
industries)
Table 6 Domestic supply and internal consumption by products
Offre interne totale et Consommation du tourisme intérieur
Table 7 Employment in tourism industries
Emploi dans les industries touristiques
Table 8 Tourism gross fixed capital formation
Investissements
Table 9 Tourism collection consumption by functions and levels of
government
(consommation des pouvoirs publics)
Table 10 Non monetary indicators of tourism
Indicateurs non monétaires Source: UNWT
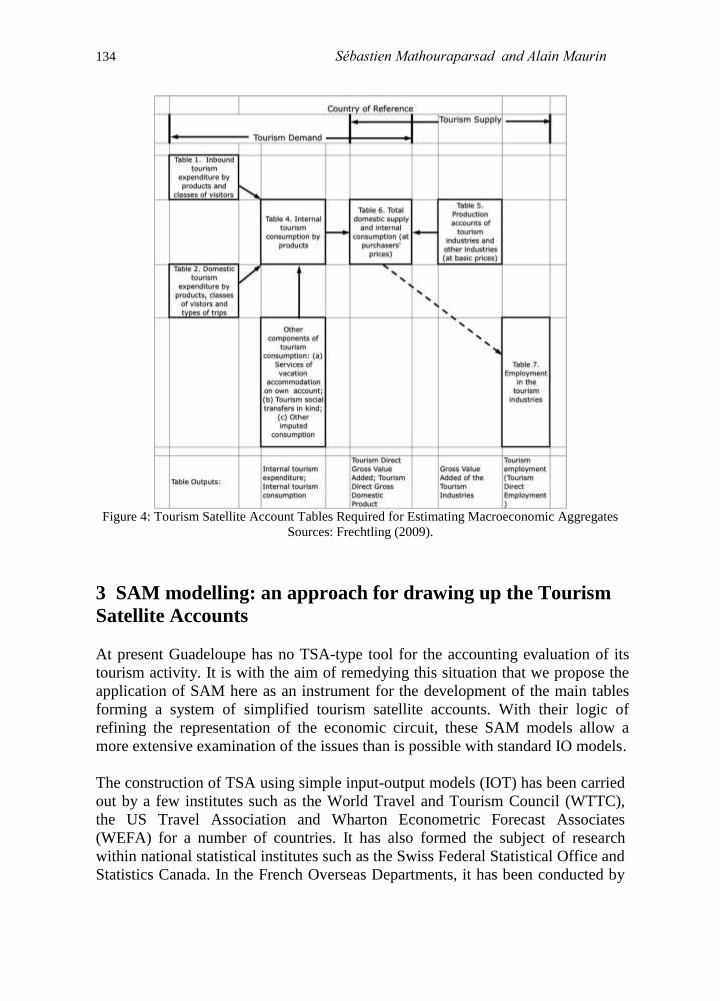
134 Sébastien Mathouraparsad and Alain Maurin
Figure 4: Tourism Satellite Account Tables Required for Estimating Macroeconomic Aggregates
Sources: Frechtling (2009).
3 SAM modelling: an approach for drawing up the Tourism
Satellite Accounts
At present Guadeloupe has no TSA-type tool for the accounting evaluation of its
tourism activity. It is with the aim of remedying this situation that we propose the
application of SAM here as an instrument for the development of the main tables
forming a system of simplified tourism satellite accounts. With their logic of
refining the representation of the economic circuit, these SAM models allow a
more extensive examination of the issues than is possible with standard IO models.
The construction of TSA using simple input-output models (IOT) has been carried
out by a few institutes such as the World Travel and Tourism Council (WTTC),
the US Travel Association and Wharton Econometric Forecast Associates
(WEFA) for a number of countries. It has also formed the subject of research
within national statistical institutes such as the Swiss Federal Statistical Office and
Statistics Canada. In the French Overseas Departments, it has been conducted by

Measuring the Multiplier Effects of Tourism industry to the Economy 135
the INSEE statistical office of Réunion and by the ARDTM-CEREGMIA-INSEE
for the TSAs of Martinique.
With regard to the deployment of the SAM, the extent of its use in developing
TSAs is much more blurred. Indeed, the literature is filled with a plethora of
studies devoted to evaluating the impact of tourism through the use in input-output
techniques, yet few of them go beyond the TSA framework to apply SAM as a
multiplier calculation tool. This exercise was carried out by Polo and Valle (2009)
who quantified the various types of tourism impact in the case of the Balearic
Islands. This contribution targets the same objective for Guadeloupe; however, our
approach to the use of SAM is more innovative in that it involves constructing
accounting data in addition to an impact study.
The SAM used here constitutes an extension of that constructed on the basis of
2005 data and which takes into consideration sixteen products, sixteen sectors,
two production factors and four agents, namely households, undertakings,
administrations and the rest of the world (see Mathouraparsad, Maurin and
Montauban (2004 and 2006) and Mathouraparsad (2011)). More specifically, it
centres on double-entry accounts for 24 products, 24 branches of activity, 4
production factors (land, physical capital, skilled labour and unskilled labour), 7
agents (households, the State, local authorities, tourists, the rest of the world,
individual undertakings and other undertakings) and several transfer accounts
(taxes, subsidies, transactions costs and other transfers between agents) and one
accumulation account (which distinguishes between private investment, public
investment and stock variations).
3.1 The contribution of the SAM to the construction of Tourism Satellite
Accounts
In their report on the recommendations for the conceptual framework for Tourism
Satellite Accounts, the European Commission-United Nations-OECD-WTO (2000)
specify a few methodological points in this regard:
"From tourism shares established for output, it is possible, through different
calculations involving assumptions concerning the technologies applied to the
production processes of the establishments, to estimate for each activity a tourism
share to be applied to the components of intermediate consumption
From the difference between the values of output attributable to visitor
consumption and to intermediate consumption, the value added generated by
visitor consumption can be computed. These calculations usually suppose the use
of input-output techniques and of the processes of reduction from a rectangular
input-output table to a square commodity-by-commodity/product-by-product
input-output table.

136 Sébastien Mathouraparsad and Alain Maurin
Since a value added can be associated to the value of part of the output of a
productive unit, tourism value added can be defined as the value added generated
by tourism industries and other industries of the economy in response to internal
tourism consumption. To obtain the GDP generated by internal tourism
consumption, to tourism value added should be added the taxes net of subsidies on
products and imports related to the tourism sector, a figure that corresponds
exactly to the difference between this variable valued at purchasers’ prices and at
basic prices, since distribution margins have already been taken into consideration.
With regard to the economic weight of the tourism sector, this must be valued as
the ratio between the tourism value added and GDP rather than according to the
current French practice (ratio between internal tourism consumption and GDP)."
To our knowledge, the first attempt to draw up a TSA for an overseas department
or territory should be attributed to Carpin, Logossah, Marquès and Para (2004) for
Martinique. They were constructed from an approach based on the IIT
(intermediate inputs table) drawn up by the INSEE and on trickle-down effect
indicators developed by the authors. More specifically, they estimated tourism
consumption and tourism production, the tourism branch account, the trickle-down
effects of the sector, the tourism public account, tourism employment and external
accounts. They used the supply and use tables of the Regional Accounts, the
branch-product production structure of the IIT.
In developing TSAs for Martinique, the CEROM (Early Economic Accounts for
Overseas France) (2009) followed the recommendations of the WTO. Given the
lack of data on domestic tourism consumption, they favoured a supply-based
approach and moved from tourism supply to tourism demand through the use of
touristicity rates for each activity.
Alongside local actors, the WTTC was also involved in the conduct of studies to
quantity the economic benefits of tourism in the French West Indies An influential
actor in the international community of tourism professionals - one of its raisons
d'être being to document the economic importance of the travel and tourism sector
in various destinations across the world - the WTTC is also known for its annual
tourism diagnostics for a group of 184 countries and territories, including the thirty
or so Caribbean islands.
Faced with the obstacle of the lengthy and onerous task of constructing complete
satellite accounts, this council devised its own methodology while at the same time
reconciling the recommendations of the WTO with timely publications for political
decision-makers and investors.
In practice, this is a demand-based approach that relies on two key phases. Firstly,
estimation of the economic impacts of visitor consumption (travel and tourism
industry) and total demand (travel and tourism economy). Secondly, the use of

Measuring the Multiplier Effects of Tourism industry to the Economy 137
input-output tables to reconcile expenditure aggregates (demand) with resource
aggregates (supply) and also to break down GDP and total employment into direct
and indirect components.
For its Travel & Tourism Competitiveness Index 2015 Ranking, the WTTC
experts have established a diagnostic of each destination on the basis of an array
of 14 indicators, placing emphasis on the various aspects of tourism performance
and the employment environment for the sector’s undertakings. The report on
Guadeloupe (WTTC 2015) reveals that the travel and tourism sector shows
moderate performances and that the archipelago is frequently ranked well below
its Caribbean neighbours.
Since the audit and forecasting tasks of the WTTC are widely recognised
internationally, it is of course necessary to consider them from the comparative
viewpoint of their methodological robustness. As stressed by a number of authors
(including McHale (2007), Frechtling (2009, a)) it is important to note that the
WTTC approach differs fundamentally from the methodology recommended by
the WTO. The WTO methodology culminates in a TSA that is based on the
existing system of national accounts whereas the former forecasts the economic
contribution of the tourism sector on the basis of estimated relationships between
diverse supply and demand variables within the economy. Similarly, although the
WTTC approach provides a means of constructing forecasts for the panel of 184
territories covered at present, for each individual country it is not necessarily
based on tested relationships between the economic variables and reliable data.
Behind these divergences, there are strong controversies over the significant
challenges presented by measurement of the weight of tourism. The single
example of calculating the competitiveness of destinations - necessary for
investors in their analyses of the competitive positioning of countries - amply
suffices to illustrate the extent to which data collection and tourism activity
measurement mechanisms need to be developed and applied in a rigorous and
consistent manner. It is this problem to which Frechtling (2009, a) refers in his
argument in support of TSAs:
"The TSA brand is unfortunately threatened with distortion and misuse. The TSA
is distorted when researchers describe the structure and results of the TSA in
distorting terms which raise false expectations in potential users and weaken the
TSA brand. The TSA brand is misused when reports are published based on
methodologies that claim to ‘simulate' TSAs for countries and sub-national
territories. Such reports, which tend to exaggerate the direct contribution of
tourism to economies, can cause conflicts between national tourism
administrations and national statistics institutes."
138 Sébastien Mathouraparsad and Alain Maurin
After this overview of the literature applied in the French Overseas Departments,
we can settle upon the essential contribution of this article.
The methodology we propose also follows the OECD recommendations.
However, it departs from those used in the case of Martinique and Réunion on two
points.
Firstly, in addition to the economic elements of the TSAs we propose social data
from the TEE, in this instance transfers between agents which constitute the
agents' revenues. The accounts of institutional sectors provide a means of tracing
the revenues and expenditure of each institutional agent. Without doubt, this
additional input has the advantage of incorporating impacts in terms of revenues
received by all workers (not only those in the tourism branch), undertakings and
administrations. In fact, a revenue surplus (unemployment benefit, return on
capital or salaries etc.) changes the behaviour of households (consumption) and in
turn impacts other branches of activity. Furthermore, a change in the revenues of
households or undertakings also affects the account of the administration which
collect taxes on incomes and profits.
Secondly, although the CEROM favoured a supply-based approach, we felt it
important to understand the interactions relating to the indirect and induced effects
of tourism by favouring a demand-based approach, in other words, starting from
the expenditure vector identified in the economic accounts. In particular, it enables
us to simulate what is generated by visitor expenditure in the SAM within the
various accounts (supply and use, branch accounts, IIT etc.).
In turn, our investigations focused on:
An evaluation of supply and use: the estimation of tourism production on
the basis of tourism consumption, performed via the supply and use table
of the Regional Account; it is then possible to evaluate the imports,
exports, intermediate consumptions, taxes etc. relating to tourist
expenditure.
An evaluation of the tourism production branch account on the basis of the
structure of the productions of the branches-products for the IIT and
branch accounts.
A breakdown of the trickle-down effect of the tourism branch: calculation
of the direct, indirect and induced effect in terms of value added, salaries,
external accounts etc.
3.2 The method: a simulation-based approach
The SAM is particularly appropriate for estimating the effects of exogenous
changes or injections such as an increase in public expenditure or exports. Any
demand shock can be followed by an increase in production which occurs due to
the system of interdependence between the economic aggregates. The direct,
indirect and induced effects of an injection to the endogenous accounts are
evaluated using multipliers. For example, a public works programme for the

Measuring the Multiplier Effects of Tourism industry to the Economy 139
construction of a road would require a certain number of workers provided by
household categories in rural and urban areas. In turn, the revenues received by
these two categories of workers will be used on the consumption of goods. The
increased production of goods to satisfy the demand surplus will lead to the
creation of more jobs and revenues in these same groups of households. This
mechanism will continue until such time as the multiplicative process is no longer
in play.
The SAM consists of endogenous and exogenous accounts. Endogenous accounts
are those that vary with revenue. They include production activities (the
intermediate inputs sub-matrix), production factors and the institutions (comprising
households and undertakings). Exogenous accounts are those for which
expenditure is independent of any variation in revenue. They include the
government, the capital account, tourists and the rest of the world. Table 6 gives a
schematic representation of the configuration of the SAM, in which endogenous
and exogenous accounts are highlighted.
Total receipts of endogenous accounts read along the row are given by yn which is
equal to the sum of the expenditure of the endogenous accounts (Tnn), equivalent to
n, plus the sum of the expenditure of the exogenous accounts (Tnx), equivalent to x
and which represents the injections. Finally, one obtains yn = n+x and likewise, for
the exogenous accounts, one obtains yx = l+t. In addition, as the rows and columns
have to be balanced, one obtains yn = yn’ and yx = yx
’ where yn
’ and yx
’ are the
transposes of columns yn and yx. All of Txn represents leakages and all of Txx the
residual balances.
A focus on the interrelationships block (matrix Tnn) between the endogenous
accounts serves to highlight the various sub-tables to be noted, respectively, T13,
T21, T22, T32 and T33. T33 represents the needs for intermediate inputs, T32 indicates
the amount of expenditure outlaid by the institutions for the various goods they
consume, T13 breaks down the value added generated by the various sectors
between the production factors while T21 describes the distribution of revenues
between the institutions. T22 represents the transfers between the institutions.
140 Sébastien Mathouraparsad and Alain Maurin
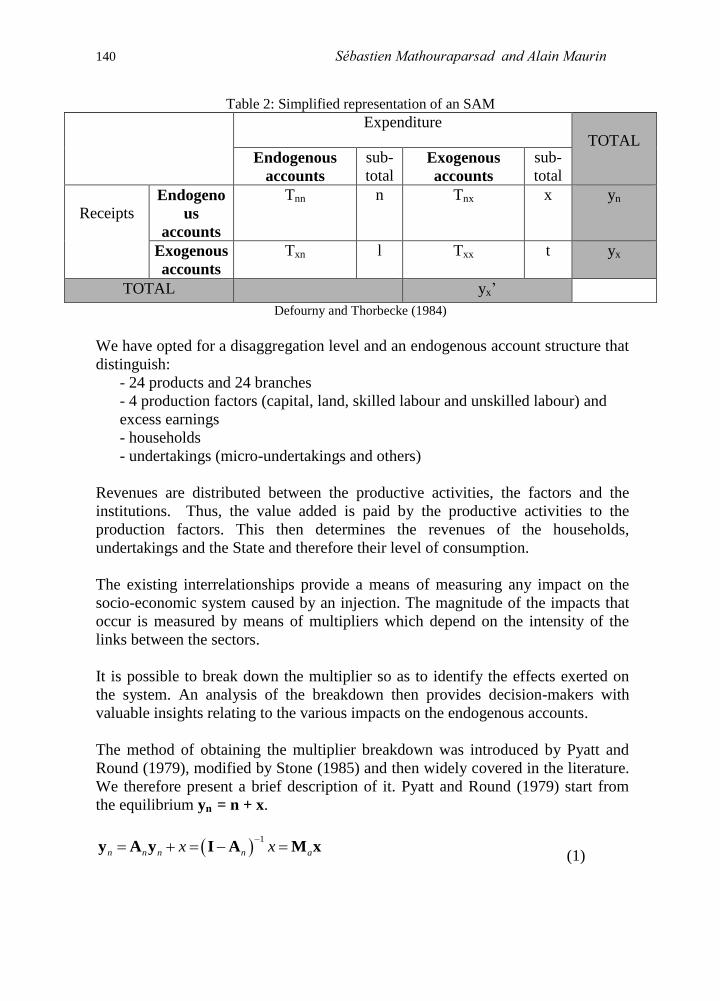
Table 2: Simplified representation of an SAM
Expenditure
TOTAL Endogenous
accounts
sub-
total Exogenous
accounts
sub-
total
Receipts Endogeno
us
accounts
Tnn n Tnx x yn
Exogenous
accounts
Txn l Txx t yx
TOTAL yx’
Defourny and Thorbecke (1984)
We have opted for a disaggregation level and an endogenous account structure that
distinguish:
- 24 products and 24 branches
- 4 production factors (capital, land, skilled labour and unskilled labour) and
excess earnings
- households
- undertakings (micro-undertakings and others)
Revenues are distributed between the productive activities, the factors and the
institutions. Thus, the value added is paid by the productive activities to the
production factors. This then determines the revenues of the households,
undertakings and the State and therefore their level of consumption.
The existing interrelationships provide a means of measuring any impact on the
socio-economic system caused by an injection. The magnitude of the impacts that
occur is measured by means of multipliers which depend on the intensity of the
links between the sectors.
It is possible to break down the multiplier so as to identify the effects exerted on
the system. An analysis of the breakdown then provides decision-makers with
valuable insights relating to the various impacts on the endogenous accounts.
The method of obtaining the multiplier breakdown was introduced by Pyatt and
Round (1979), modified by Stone (1985) and then widely covered in the literature.
We therefore present a brief description of it. Pyatt and Round (1979) start from
the equilibrium yn = n + x.
1
n n n n ax x
y A y I A M x (1)
Measuring the Multiplier Effects of Tourism industry to the Economy 141
where An is the matrix of standard endogenous coefficients, also called the matrix
of average expenditure propensities, and Ma the matrix of multipliers. The
revenues of the endogenous accounts can be determined by premultiplying the
injections xn by the multiplier Ma. This matrix therefore offers a means of
calculating the totals obtained in the columns in the SAM, but not how they are
generated.
Several examples serve to illustrate the information contained in this matrix An.
For example, one can decipher that the production of a unit of agricultural products
generates 70% in capital revenues and 30% of labour revenues. Similarly, by
reading the elements in the households column, it is possible to determine their
consumption goods basket, the amount of taxes they pay to the State and the
amount they save. Many specific cases also serve to illustrate how the multiplier
Ma can be interpreted. If one looks, for example, at the impact of a 100-unit
reduction in exports of agricultural products on the socio-economic system as a
whole, one would see that it would lead to a reduction of 56 units of capital
revenues and 44 units of salaries.
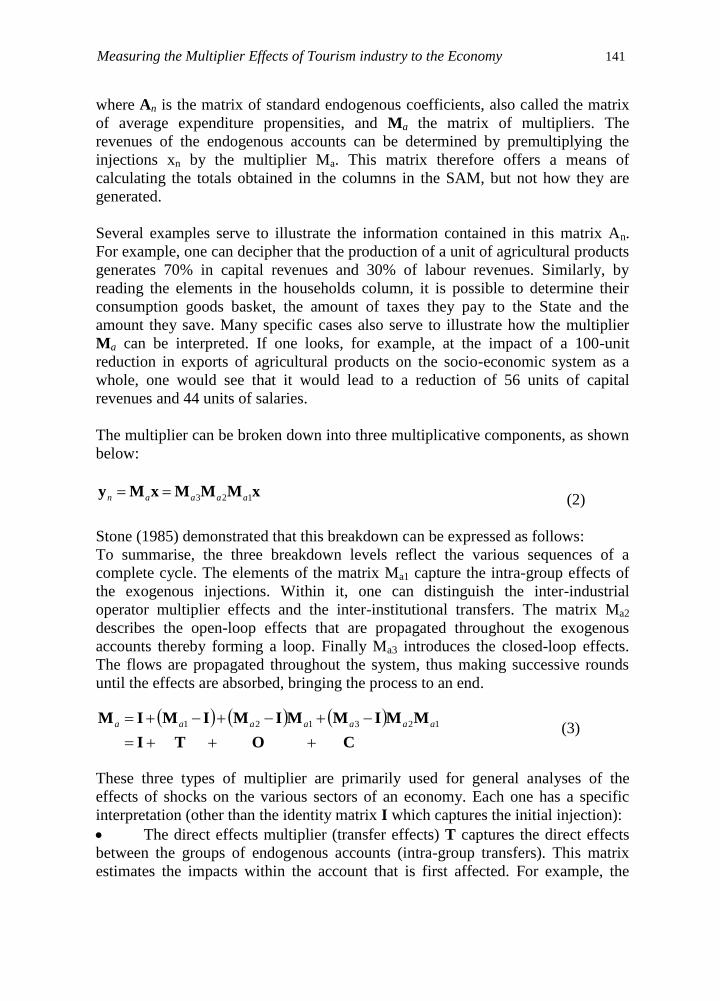
The multiplier can be broken down into three multiplicative components, as shown
below:
3 2 1n a a a a y M x M M M x (2)
Stone (1985) demonstrated that this breakdown can be expressed as follows:
To summarise, the three breakdown levels reflect the various sequences of a
complete cycle. The elements of the matrix Ma1 capture the intra-group effects of
the exogenous injections. Within it, one can distinguish the inter-industrial
operator multiplier effects and the inter-institutional transfers. The matrix Ma2
describes the open-loop effects that are propagated throughout the exogenous
accounts thereby forming a loop. Finally Ma3 introduces the closed-loop effects.
The flows are propagated throughout the system, thus making successive rounds
until the effects are absorbed, bringing the process to an end.
COTI
MMIMMIMIMIM
123121
aaaaaaa
(3)
These three types of multiplier are primarily used for general analyses of the
effects of shocks on the various sectors of an economy. Each one has a specific
interpretation (other than the identity matrix I which captures the initial injection):
The direct effects multiplier (transfer effects) T captures the direct effects
between the groups of endogenous accounts (intra-group transfers). This matrix
estimates the impacts within the account that is first affected. For example, the

142 Sébastien Mathouraparsad and Alain Maurin
direct effect of a tourist purchasing a hotel room will concern the hotels-restaurants
branch and will correspond to the price paid for the room.
The open-loop multiplier O captures the interactions between endogenous
accounts (extra-group or indirect effects). This matrix estimates the impacts of an
injection on the other accounts, without feedback effects to the original account.
For example, the extra-group effect of a tourist purchasing a hotel room will be the
change in household revenues (production factors account) and their consumption
(institutional account). These multipliers show how the impacts are transmitted to
the other categories of account.
The closed-loop multipliers C show the complete circular effect of the
shock (induced effects). They have inter-group effects and explain how the shock
on one sector affects other sectors before coming back to its starting point. For
example, the purchase of a room by a tourist, in the form of a production of
services, would have impacts on household revenues leading simultaneously to an
increase in purchases of goods and services by those households, which also
include the hotels branch, hence a consumption of this service.
Following a shock, it is possible to break down the effects by applying this
method. A simulation consists in making a change to one of the exogenous
accounts appearing in Table 2. We then obtain a new SAM.
4 Applications to the evaluation of the weight of tourism in
Guadeloupe: towards satellite accounts
4.1 Tourist expenditure and tourism production
Tourists spent €289 million in the year 2005. Their main expenditure items were
hotel accommodation and meals, to which they dedicated 61% of total expenditure.
Next comes expenditure on vehicle hire, purchases of consumption goods etc.
Tourism represents 3.7% of regional GDP. Tourists consume 8.6% of the
production of local alcoholic beverages and 4.9% of services to individuals. They
account for 26% of the turnover realised by the hotels and restaurants branch.
The tourist expenditure that can be interpreted as an export represents 56% of all
exports and covers 10% of imports.
The production generated by tourism expenditure stands at €580 million and €98
million in imports.
The SAM offers a ready means of determining the key aggregates revealing the
amounts generated by tourism.
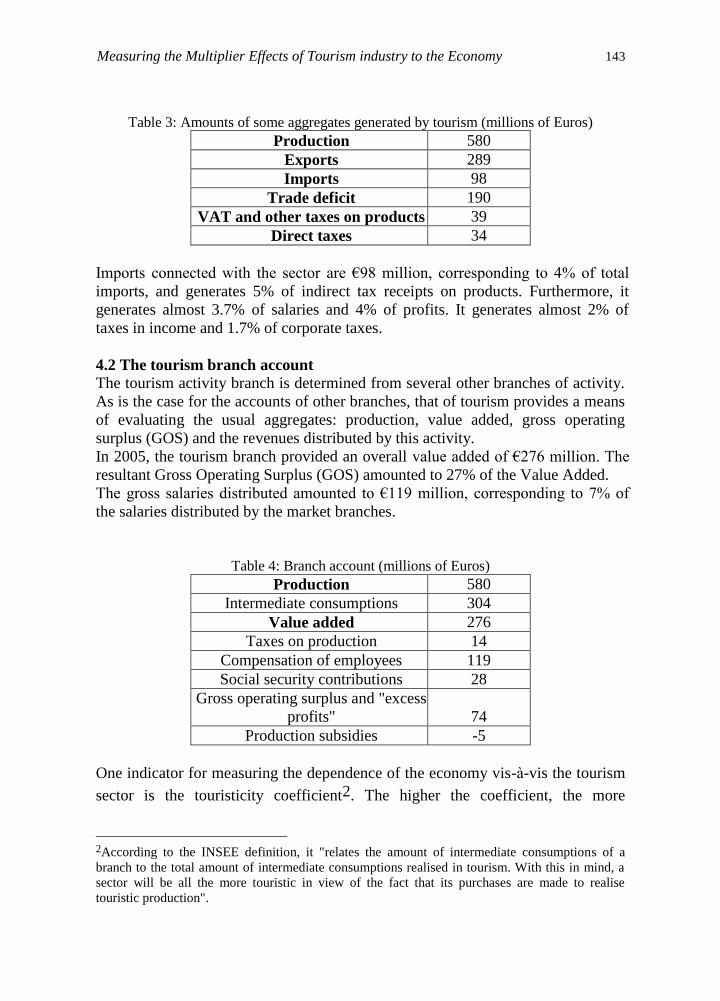
Measuring the Multiplier Effects of Tourism industry to the Economy 143
Table 3: Amounts of some aggregates generated by tourism (millions of Euros)
Production 580
Exports 289
Imports 98
Trade deficit 190
VAT and other taxes on products 39
Direct taxes 34
Imports connected with the sector are €98 million, corresponding to 4% of total
imports, and generates 5% of indirect tax receipts on products. Furthermore, it
generates almost 3.7% of salaries and 4% of profits. It generates almost 2% of
taxes in income and 1.7% of corporate taxes.
4.2 The tourism branch account
The tourism activity branch is determined from several other branches of activity.
As is the case for the accounts of other branches, that of tourism provides a means
of evaluating the usual aggregates: production, value added, gross operating
surplus (GOS) and the revenues distributed by this activity.
In 2005, the tourism branch provided an overall value added of €276 million. The
resultant Gross Operating Surplus (GOS) amounted to 27% of the Value Added.
The gross salaries distributed amounted to €119 million, corresponding to 7% of
the salaries distributed by the market branches.
Table 4: Branch account (millions of Euros)
Production 580
Intermediate consumptions 304
Value added 276
Taxes on production 14
Compensation of employees 119
Social security contributions 28
Gross operating surplus and "excess
profits" 74
Production subsidies -5
One indicator for measuring the dependence of the economy vis-à-vis the tourism
sector is the touristicity coefficient2. The higher the coefficient, the more
2According to the INSEE definition, it "relates the amount of intermediate consumptions of a
branch to the total amount of intermediate consumptions realised in tourism. With this in mind, a
sector will be all the more touristic in view of the fact that its purchases are made to realise
touristic production".

144 Sébastien Mathouraparsad and Alain Maurin
dependent the branch will be deemed and therefore the more it will be deemed to
be characteristic of tourism.
Overall, the touristicity coefficient of the Guadeloupe economy stands at 6%. The
highest coefficient is seen in the hotels-restaurants branch (29%), followed by the
services to undertakings branch (20%), the trade branch (12%) and the energy and
transport branches (7%). These are branches with a relatively high potential for
development through tourism.
Table 5: Touristicity of branches in terms of production
Production
(millions of
Euros) Percentage of
production
Banana cultivation 1 0%
Sugar cane 7 1%
Other agriculture 5 1%
Fishing 4 1%
Rum 11 2%
Meats and milk 2 0%
Other agriculture and food processing
industries 13 2%
Consumer goods industry 4 1%
Capital goods industry 10 2%
Mineral products industry 3 0%
Other intermediate goods industries 7 1%
Fuel 0 0%
Electricity 41 7%
Construction 3 1%
Trade 68 12%
Transport 38 7%
Financial activities 14 2%
Real estate activities 23 4%
Telecommunications 11 2%
Other services to undertakings 116 20%
Hotels and restaurants 167 29%
Other services to individuals 23 4%
Education, health 5 1%
Administrations 3 1%
In 2005, the value added of the tourism branch represented 5% of the value added
of the market branches. The direct weight of tourism is thus 10% of the market
gross value added. Of the 23 market branches with highest value added in the total

Measuring the Multiplier Effects of Tourism industry to the Economy 145
gross value added, the branch is ranked 7th. In terms of importance, the total
payroll stands in 5th place.
Table 6: Classification by size of value added
Market
branches
percentage Classification
Trade 18 1
Real estate
activities 16 2
Services to
undertakings 13 3
Construction 12 4
Electricity 7 5
Financial
activities 7 6
Tourism 5 7
Hotels-
restaurants 5 8
Transport 5 9
Table 7: Classification by size of wage bill
Market
branches
percentage Classification
Trade 26 1
Services to
undertakings 15 2
Construction 12 3
Hotels-restaurants 8 4
Tourism 7 5
Financial activities 6 6
Transport 6 9
The product item most intensively consumed by the tourism branch is "other
services to undertakings". By contrast, the products least intensively consumed are
non-market services and agricultural goods.
In terms of total weight, the "tourism sector" represents 6% of market production,
corresponding to €580 million. It is thus ranked 9th
of the 24 branches classified
according to the size of their production.

146 Sébastien Mathouraparsad and Alain Maurin
Table 8: Intermediate products consumed (millions of Euros)
Value of inputs
consumed
Banana cultivation 0
Sugar cane 4
Other agriculture 4
Fishing 3
Rum 5
Meats and milk 10
Other agriculture and food processing
industries 35
Consumer goods industry 16
Capital goods industry 26
Mineral products industry 5
Other intermediate goods industries 25
Fuel 23
Electricity 20
Construction 2
Trade 9
Transport 24
Financial activities 6
Real estate activities 10
Telecommunications 10
Other services to undertakings 60
Hotels and restaurants 3
Other services to individuals 3
Education, health 2
Administrations -
Total 304
4.3 The trickle-down effects of tourism
The methodology used enables us to distinguish a number of types of effect. To
evaluate the direct effect, the traditional inputs-outputs model is used. It is based
solely on the transactions of the inter-industrial operator matrix or the activities
sub-account of the matrix. According to our results, tourism directly generated a
production of €446 million, corresponding to 4% of overall market production.
Next, the indirect effects consist only of the additional economic impacts
engendered by the wages and salaries received by households by way of
compensation for the labour factor (Miller and Blair, 1985). The sector thus
generates €143 million in household revenues, corresponding to 2% of total
household revenues.

Measuring the Multiplier Effects of Tourism industry to the Economy 147
Finally, the expenditure of the activity account will also have an impact on the
other accounts. The induced effects evaluate the influence of the salaries that are
generated by tourism consumption and distributed to the rest of the economy. The
Stone (1985) and Bulmer-Thomas (1982) method calculates the induced effects
and defines a multiplier that closes the inter-industrial operator transactions of the
SAM in response to the expenditure produced by the returns on labour and capital
received by households. In terms of induced effects, tourism thus appears to be a
source of wealth creation to the tune of €134 million, corresponding to 1.4% of
overall market production.
Consequently, analysis of the impact of tourism on the other branches enables us to
identify a variety of benefits.
Table 9: Breakdown of the effects on a selection of aggregates (thousands of Euros)
Value
added
Tax
receipts
Direct 148 989
Indirect 42 759
Induced 86 822
Total 276 2,570
An undoubted advantage of this SAM-based approach is that it offers a very clear
estimate of the trickle-down capacity of the tourism branch. By analysing the
implications of international tourism for other branches of the economy, it is in fact
possible to determine the productions arising from direct, indirect and induced
effects for the 25 branches of the economy. These have been set forth in the table
below:
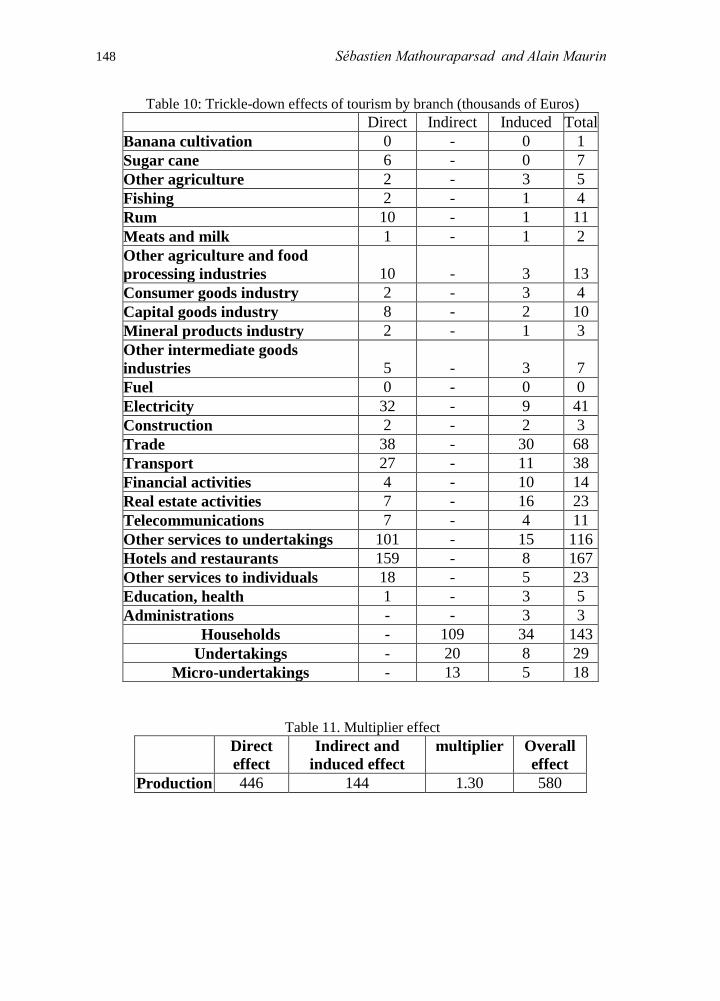
The direct effect is by far the most significant, accounting for 77% of the overall
trickle-down effect.
The branches benefiting most from the induced trickle-down effects of tourism are
trade (€30 million and 22% of the overall trickle-down effect), real estate activities
(€16 million and 12% of the overall trickle-down effect) and other services to
undertakings (€15 million and 11% of the overall trickle-down effect).
Analysis of the tourism multiplier effect, which relates cumulative effects to direct
effects, shows that a direct production estimated at 100 generated by expenditure
outlaid by tourists leads to an overall production amount of 130 as the result of
indirect and induced effects.
148 Sébastien Mathouraparsad and Alain Maurin
Table 10: Trickle-down effects of tourism by branch (thousands of Euros)
Direct Indirect Induced Total
Banana cultivation 0 - 0 1
Sugar cane 6 - 0 7
Other agriculture 2 - 3 5
Fishing 2 - 1 4
Rum 10 - 1 11
Meats and milk 1 - 1 2
Other agriculture and food
processing industries 10 - 3 13
Consumer goods industry 2 - 3 4
Capital goods industry 8 - 2 10
Mineral products industry 2 - 1 3
Other intermediate goods
industries 5 - 3 7
Fuel 0 - 0 0
Electricity 32 - 9 41
Construction 2 - 2 3
Trade 38 - 30 68
Transport 27 - 11 38
Financial activities 4 - 10 14
Real estate activities 7 - 16 23
Telecommunications 7 - 4 11
Other services to undertakings 101 - 15 116
Hotels and restaurants 159 - 8 167
Other services to individuals 18 - 5 23
Education, health 1 - 3 5
Administrations - - 3 3
Households - 109 34 143
Undertakings - 20 8 29
Micro-undertakings - 13 5 18
Table 11. Multiplier effect
Direct
effect
Indirect and
induced effect
multiplier Overall
effect
Production 446 144 1.30 580

Measuring the Multiplier Effects of Tourism industry to the Economy 149
5 Simulation of a rise: return to the record level of 2000
Adopting the same methodology as that used to construct the TSAs for
Guadeloupe, we perform a simulation of a rise of approximately 14% in tourist
expenditure, equalling their record level of €328 million in the year 2000. All
other things being equal, such an increase in tourist expenditure would lead to a
+0.46% change in GDP, with an increase in production of 0.55%.
As shown in the table below, practically all market activities would be affected by
this rise, with the exception of non-market services which change very little. The
most affected is the hotels-restaurants branch, with a 3.6% change, and the sugar
and rum branch with an increase in activity in the order of 1.8%.
Table 12. Effects of a 14% rise in tourist expenditure
on the value added of the branches
Banana cultivation 0.2%
Sugar cane 1.8%
Other agriculture 0.3%
Fishing 0.7%
Rum 1.8%
Meats and milk 0.7%
Other agriculture and food
processing industries 1.0%
Consumer goods industry 0.3%
Capital goods industry 0.6%
Mineral products industry 0.2%
Other intermediate goods
industries 0.3%
Fuel 0.5%
Electricity 0.8%
Construction 0.0%
Trade 0.4%
Transport 0.7%
Financial activities 0.3%
Real estate activities 0.3%
Telecommunications 0.5%
Other services to undertakings 1.2%
Hotels and restaurants 3.6%
Other services to individuals 0.9%
Education, health 0.0%
Administrations 0.0%

150 Sébastien Mathouraparsad and Alain Maurin
The revenues of agents would be positively affected by this rise. The
compensations for households and undertakings would increase by 0.2% and 0.3%
respectively. This rise would logically be followed by an increase in household
consumption estimated at 0.25% but also by a small 0.07% reduction in imports as
a response to the boom in economic activity.
As the result of the rise in household revenues, tax receipts would increase. The
rises in income and corporate tax receipts would be approximately 0.25% and
0.21%. The amount of receipts from indirect taxes on products would also rise, by
0.46%.
The total effect of the multiplier identifies the branches most closely correlated to
the tourism sector. Thus, the sugar-rum branch sees its activity increase by almost
1.8%. This is primarily due to the souvenirs taken home by tourists when they
leave the island.
By breaking down total revenues, one can see that for the sugar-rum branch the
direct multiplier generates €1.4 million of production, out of the total of €1.5
million.
The hotels-restaurants branch is likely to produce an additional €21.4 million
through the direct effects, and €1 million through the induced effects.
Out of a total additional €17.6 million, households would receive €13.5 million
indirectly and €4.1 million incidentally.

Measuring the Multiplier Effects of Tourism industry to the Economy 151
Table 13: Breakdown of the multiplier effects following a 14% injection
of tourist expenditure (in millions of Euros)
DIRECTS INDIRECTS INDUCED TOTAL
Variation
following
a shock
Production
factors
Capital factor 0.0 6.6 2.6 9.2 0.5%
Land factor 0.0 0.4 0.1 0.5 0.8%
Excess profits 0.0 0.1 0.1 0.2 0.5%
Skilled labour factor 0.0 4.0 1.6 5.6 0.3%
Unskilled labour factor 0.0 6.9 1.6 8.5 0.7%
Products
Banana cultivation 0.0 0.0 0.0 0.1 0.2%
Sugar cane 0.5 0.0 0.0 0.5 1.8%
Other agriculture 0.4 0.0 0.6 0.9 0.3%
Fishing 0.4 0.0 0.2 0.6 0.7%
Rum 1.8 0.0 0.1 1.9 1.8%
Meats and milk 1.3 0.0 0.6 1.9 0.7%
Other agriculture and food
processing industries 5.2 0.0 1.3 6.5 1.0%
Consumer goods industry 1.5 0.0 2.2 3.7 0.3%
Capital goods industry -22.5 0.0 1.5 -21.0 -1.6%
Mineral products industry 0.3 0.0 0.2 0.5 0.2%
Other intermediate goods
industries 0.8 0.0 1.3 2.1 0.3%
Fuel 2.2 0.0 1.5 3.7 0.5%
Electricity 2.3 0.0 0.6 2.9 0.8%
Construction 0.2 0.0 0.2 0.4 0.0%
Trade 0.7 0.0 0.6 1.3 0.4%
Transport 4.2 0.0 1.6 5.8 0.6%
Financial activities 0.6 0.0 1.2 1.8 0.3%
Real estate activities 1.0 0.0 1.9 2.9 0.3%
Telecommunications 1.0 0.0 0.5 1.5 0.5%
Other services to undertakings 13.8 0.0 1.9 15.8 1.2%
Hotels and restaurants 22.2 0.0 1.0 23.2 3.5%
Other services to individuals 2.5 0.0 0.7 3.3 0.9%
Education, health 0.2 0.0 0.4 0.6 0.0%
Administrations 0.0 0.0 0.4 0.4 0.0%
Branches of
activity
Banana cultivation 0.1 0.0 0.0 0.1 0.2%
Sugar cane 0.9 0.0 0.0 0.9 1.8%
Other agriculture 0.2 0.0 0.4 0.6 0.3%
Fishing 0.3 0.0 0.2 0.5 0.7%
Rum 1.4 0.0 0.1 1.5 1.8%

152 Sébastien Mathouraparsad and Alain Maurin
Meats and milk 0.2 0.0 0.1 0.3 0.7%
Other agriculture and food
processing industries 1.4 0.0 0.3 1.7 1.0%
Consumer goods industry 0.2 0.0 0.3 0.5 0.3%
Capital goods industry -4.2 0.0 0.3 -3.9 -1.6%
Mineral products industry 0.2 0.0 0.1 0.3 0.2%
Other intermediate goods
industries 0.2 0.0 0.3 0.6 0.3%
Fuel 0.0 0.0 0.0 0.0 0.5%
Electricity 4.2 0.0 1.2 5.3 0.8%
Construction 0.2 0.0 0.2 0.4 0.0%
Trade 4.6 0.0 3.7 8.3 0.4%
Transport 3.6 0.0 1.4 5.0 0.6%
Financial activities 0.5 0.0 1.2 1.7 0.3%
Real estate activities 1.0 0.0 1.9 2.9 0.3%
Telecommunications 1.0 0.0 0.5 1.4 0.5%
Other services to undertakings 13.3 0.0 1.9 15.1 1.2%
Hotels and restaurants 21.4 0.0 1.0 22.4 3.5%
Other services to individuals 2.4 0.0 0.6 3.0 0.9%
Education, health 0.2 0.0 0.4 0.6 0.0%
Administrations 0.0 0.0 0.4 0.4 0.0%
Agents
Households 0.0 13.5 4.1 17.6 0.2%
Undertakings 0.0 2.6 1.0 3.6 0.2%
Micro-undertakings 0.0 1.6 0.6 2.3 0.5%
The branch that responds most rapidly is the financial activities branch. The direct
production of the agriculture and food processing industries generated by an
estimated increase in tourist expenditure of 100 Euros leads to an overall rise in
production of 315 Euros as a result of the indirect and induced effects.
Table 14: Effects of a 14% rise in tourist expenditure
Multipliers
Banana cultivation 1.4
Sugar cane 1.1
Other agriculture 2.5
Fishing 1.5
Rum 1.1
Meats and milk 1.5
Other agriculture and food
processing industries 1.3
Consumer goods industry 2.5
Capital goods industry 0.9

Measuring the Multiplier Effects of Tourism industry to the Economy 153
Mineral products industry 1.6
Other intermediate goods
industries 2.6
Fuel 1.7
Electricity 1.3
Construction 2.1
Trade 1.8
Transport 1.4
Financial activities 3.2
Real estate activities 3.0
Telecommunications 1.5
Other services to undertakings 1.1
Hotels and restaurants 1.0
Other services to individuals 1.3
Education, health 3.1
Administrations 0.0
6 Conclusion
In direct connection with its professional sectors of hotels, restaurants, travel
agents, car hire, historical monument sites, theme parks, etc. and in indirect
connection with the branches of activity of other sectors, the tourism industry
stands out for its considerable economic and social value in the majority of
industrialised countries, and is also a powerful source of revenue and employment
in many countries across the world.
Now much more than ever before, tourism in Guadeloupe cannot be immune to
this reality. Its trajectory over the last four decades clearly demonstrates that the
archipelago has moved from the position as a winning destination up to the turn of
the millennium to its present situation as a destination in crisis, posting a notable
decline in visitor numbers and adversely affected by deterioration in its hotel offer.
More acutely than the majority of its Caribbean neighbours, today the Guadeloupe
economy stands at a crossroads and, in terms of sectors in particular, its tourism
industry is in need of a fresh impetus.
Inescapably, the challenge of restoring its glorious past performances, and
especially achieving wider growth in the coming years, calls for the optimisation
of the economic impact of tourism on the Guadeloupe economy. A great deal of
work needs to be done if this is to be achieved. The tasks of statistical observation
and macroeconomic modelling are paramount and, more specifically, paraphrasing
Vellas (2011), the decision-making actors of Guadeloupe must create the
"possibility of promoting a significant exploitation of tourism as a job-creating

154 Sébastien Mathouraparsad and Alain Maurin
economic development factor by implementing specific actions designed to draw
up economic evaluations of the direct and indirect effects of tourism based on
new statistical tools consisting of a set of headings which, when grouped together,
can better inform public policies with regard to the economic, social, direct and
indirect effects of the tourism activity."
The discussions and empirical investigations presented in this article are intended
to achieve these objectives. First, we have summarised the essential concepts and
definitions relating to the macroeconomic impact of tourism; then we have offered
a brief summary of the corpus of literature dedicated to evaluating the weight of
the tourism industry in the economies of the French Overseas Departments, in
particular in the case of Guadeloupe. Secondly, we have demonstrated that the
theoretical framework of SAM modelling provides a particularly appropriate
approach to conducting a detailed analysis of the repercussions of tourism in terms
of its direct, indirect and induced effects across the various branches of the
economy. Since Guadeloupe does not at present have an official system of Tourism
Satellite Accounts, we propose to adopt the SAM as an alternative approach in
order to establish results capable of filling this information deficit. Alongside the
TSA-type macroeconomic analyses of tourism activities performed for Réunion
and Martinique, the studies described in this contribution now offer clarification of
a similar nature on the measurement of the impact of tourism on the Guadeloupe
economy.
References
[1] G. Caire and P. Le Masne (2006), La mesure des effets économiques du
tourisme international sur les pays de destination (Measurement of the
economic effects of international tourism on destination countries), Working
document, DT/44/2006, Laboratory for research on industry and innovation,
University of Poitiers.
[2] G. Carpin, K. Logossah, B. Marquès and G. Para (2004), Evaluations de
l’impact économique du tourisme international à la Martinique: vers
l’élaboration d’u compte satellite du tourisme (Evaluation of the economic
impact of international tourism in Martinique: towards the development of a
Tourism Satellite Account), INSEE.
[3] CEROM, 2009, "Le compte satellite du tourisme à La Réunion-2005" (The
Tourism Satellite Account in Réunion).
[4] T. De Gubernatis (2007), Le Tourisme en Guadeloupe: une application de la
théorie du cycle du produit (Tourism in Guadeloupe: an application of the
product cycle theory), Note of the CEROM, N°10, September 2007.

Measuring the Multiplier Effects of Tourism industry to the Economy 155
[5] D.C. Frechtling (2009, a), The tourism satellite account, A Primer, Annals of
Tourism Research, Vol. 37, No. 1, pp. 136–153, 2010.
[6] D.C. Frechtling, (2009, b), Clarifier et étendre la marque CST (Clarifying and
extending the TSA brand), paper presented at the Fifth International
Conference of the WTO on tourism statistics, "Tourism, a driver of job
creation", Bali, Indonesia, 30 March - 2 April 2009.
[7] C. Hsu and W.C. Gartner (2012), The Routledge Handbook of Tourism
Research, Routledge, 472 pages.
[8] IEDOM (French overseas departments note-issuing bank) (2015), Le
tourisme outre-mer: une mutation nécessaire (Overseas tourism: a necessary
change), Notes of the issuing bank, March 2015.
[9] INSEE (1997), Les comptes économiques des Départements Français
d’Amérique (The economic accounts of the French Departments in the
Americas), Years 1993-1994-1995, Base 95, Les cahiers de l’INSEE.
[10] K. Kemp and S. Nijhowne (2004), Study of the Canadian Tourism Satellite
Account (CTSA), Comparison between the TSA-RMF and the CTSA, Phase
I Final Report, Canadian Tourism Commission.
[11] B.Marques (2012), Flux touristique international et croissance économique
de long terme, Publibook.
[12] E. Maurence (2010), "La mesure de l’impact économique d’un évènement
touristique" (Measurement of the economic impact of a tourism event), Study
report, EMC/Ministry of Economy, Finance and Industry, General
Directorate for Competitiveness, Industry and Services. December 2010.
[13] S. Mathouraparsad (2011), Sur la modélisation et la préparation de la
politique économique des régions ultrapériphériques d’Europe:le cas des
DOM (On the modelling and preparation of the economic policy of the
ultraperipheral regions of Europe: the example of the French Oversease
Departments), Doctoral thesis. University of the French West Indies and
Guiana.
[14] S. Mathouraparsad, A. Maurin and J.M. Montauban (2004), La modélisation
input-output:une approche pour mesurer l’impact des mesures économiques
dans les DOM (Input-output modelling: an approach for measuring the
impact of economic measures in the French Overseas Departments), paper
presented at the international sessions of the LEAD on the subject of
"macroeconomics applied to economic policy", 21 May 2004.
[15] S. Mathouraparsad, A. Maurin and J.M. Montauban (2007), “Modeling The
Economic Impact of Changes in Tourism for the French Overseas
Department : The Guadeloupean Case”, Colloque de la Central Bank of
Barbados, Barbade.
[16] A. McHale (2007), Tourism satellite accounting in the Caribbean, paper
presented at the International Conference On Statistics, Eastern Caribbean
Central Bank, St.Kitts, September 5th –7th, 2007
[17] C. Polo and E. Valle (2009), Estimating tourism impacts using input-output
and SAM models on Balearic Islands economy, in Matias A. Nijkamp P. and

156 Sébastien Mathouraparsad and Alain Maurin
Sarmento M. (editors), Advances in Tourism Economics, Physica-Verlag,
2009.
[18] Statistics Canada (2007), Guide to the Tourism Satellite Account of Canada
No.13-604-MIF in catalogue — No.052, ISSN:1707-1844.
[19] UN (2008), Tourism Satellite Account: recommendations concerning the
conceptual framework 2008, Methodological studies Series F N°80/Rev.1,
Department of Economic and Social Affairs, Statistics Division, United
Nations Publications.
[20] UNCTAD (2004), Initiative of the UNCTAD on E-Tourism, Eleventh
Session, São Paulo, 13–18 June 2004.
http://unctad.org/fr/docs/tdxibpd6_fr.pdf .
[21] F. Vellas (2011), The indirect impact of tourism: an economic analysis, 3rd
meeting of the T20 Tourism Ministers, FRANCE, Paris, 25 October 2011
[22] World Tourism Organisation (2001), Tourism Satellite Accounts:
recommendation concerning the conceptual framework, 165p., EC, OECD,
WTO, UN (ISBN 92-1-161438-4), April 2001
[23] World Travel and Tourism Council (2015), Travel and Tourism Economic
impact 2015, Guadeloupe, www.wttc.org.

Measuring the Multiplier Effects of Tourism industry to the Economy 157
APENDIX
Table 1: Characteristic products and activities of tourism
List of characteristic products of
tourism
List of characteristic activities of
tourism
Description of the products Description of the activities
1. Accommodation services
1.1 Hotels and other accommodation
services
1.2 Tourist accommodation services on
own account or free of charge
2. Restaurant services
3. Passenger transport services
3.1 Inter-urban rail passenger transport
services
3.2 Road passenger transport services
3.3 Waterway passenger transport
services
3.4 Air passenger transport services
3.5 Ancillary passenger transport
services
3.6 Hire of passenger transport
equipment
3.7 Passenger aircraft and vessel
maintenance and repair services
4. Services of travel agencies, tour
operators and tourist guides
4.1 Travel agency services
4.2 Tour operator services
4.3 Tourist information and tourist
guide services
5. Cultural services 5.1 Dramatic arts
5.2 Museum and other cultural services
6. Leisure and entertainment services
6.1 Sport and recreational sport services
6.2 Other leisure and entertainment
services
7. Miscellaneous tourism services
7.1 Financial and insurance services
7.2 Other goods hire services
7.3 Other tourism services
1. Hotels and related establishments
2. Ownership of second homes
(imputed)
3. Restaurants and related
establishment
4. Rail passenger transport
5. Road passenger transport
6. Waterway passenger transport
7. Air passenger transport
8. Ancillary passenger transport
services
9. Hire of passenger transport
equipment
10. Travel agencies and related
activities
11. Cultural services
12. Sport and other recreational
services
Source: OMT (2001)