Measuring the Level of Complexity of Scientific Inquiries ... · PDF filethe past four decades...
20
International Journal of Environmental & Science Education, 2015, 10(1), 1-20 Copyright © 2015 by iSER, International Society of Educational Research ISSN: 1306-3065 Measuring the Level of Complexity of Scientific Inquiries: The LCSI Index Efrat Eilam Victoria University, School of Education, Australia Received 17 September 2013; accepted 13 October 2014, doi: 10.12973/ijese.2015.227a The study developed and applied an index for measuring the level of complexity of full authentic scientific inquiry. Complexity is a fundamental attribute of real life scientific research. The level of complexity is an overall reflection of complex cognitive and metacognitive processes which are required for navigating the authentic inquiry through high levels of uncertainty, from the unknown to the known. To develop the index, an educational framework was set up, in which five teams of high school students were conducting a full authentic scientific inquiry, using online facilitation. Protocols obtained from the teams’ on-line communications were used for developing the Level of Complexity of Scientific Inquiry (LCSI) index. The index measures complexity by measuring the number of deviations from a linear straightforward inquiry process and the magnitude of these deviations. In structured teacher guided inquiries, the index measurement would be zero. The more students activate self-regulatory processes and grapple with the unknown, the higher is the obtained measurement. Keywords: Scientific inquiry; authentic inquiry; inquiry assessment; science education assessment. INTRODUCTION The educational approach whereby students perform full authentic scientific inquiries has been considered for the past four decades as a major pillar in science education (American Association for the Advancement of Science, 1993; National Research Council, 1996, 2012; Organization for Economic Co-operation and Development, 2003). The present study focuses attention to assessing aspects of complexity in the inquiry processes, as opposed to the more commonly assessed, procedural outcomes of the scientific inquiry. The aim of the study is to find a way to assess the inherent complex cognitive processes of the authentic inquiry, rather than merely procedural outcomes. By this it is hoped to assist in closing a long standing gap in the field of science education, between the requirement for complexity in students’ inquiry and the lack of appropriate assessment tools. Theoretical Background Throughout the past five decades, science education research has emphasized the fundamental role of inquiry- based learning in supporting development of meaningful learning, metacognitive skill development, and scientific epistemology related to science reasoning as well as the conceptual and procedural understanding of the nature of science (Chinn & Malhotra, 2002; Kipnis & Hofstein, 2008; National Research Council, 1996, 2005, 2000). The National Research Council (2000) published a set of key cognitive abilities which are required for performing scientific inquiries. These abilities go beyond procedural skills and content knowledge. Complexity analysis forms a major thread connecting the various abilities characterizing the scientific inquiry. Since the 1960’s extensive efforts have been made to develop typologies for characterizing various types of classroom scientific inquiries (Herron, 1971; Schwab, 1962). A common and widely used typology differentiates between the following four levels: Structured Inquiry; Coupled Inquiry; Guided Inquiry; and, open or full inquiry (Martin-Hensen, 2002). Over the years, these four types of inquiries received various interpretations by different researchers (Buck, Bretz, & Towns, 2008). However, common to all perceptions, is the understanding that the level
-
Upload
phungthuan -
Category
Documents
-
view
220 -
download
4
Transcript of Measuring the Level of Complexity of Scientific Inquiries ... · PDF filethe past four decades...

International Journal of Environmental & Science Education, 2015, 10(1), 1-20
Copyright © 2015 by iSER, International Society of Educational Research ISSN: 1306-3065
Measuring the Level of Complexity of Scientific Inquiries: The LCSI Index Efrat Eilam Victoria University, School of Education, Australia Received 17 September 2013; accepted 13 October 2014, doi: 10.12973/ijese.2015.227a
The study developed and applied an index for measuring the level of complexity of full authentic scientific inquiry. Complexity is a fundamental attribute of real life scientific research. The level of complexity is an overall reflection of complex cognitive and metacognitive processes which are required for navigating the authentic inquiry through high levels of uncertainty, from the unknown to the known. To develop the index, an educational framework was set up, in which five teams of high school students were conducting a full authentic scientific inquiry, using online facilitation. Protocols obtained from the teams’ on-line communications were used for developing the Level of Complexity of Scientific Inquiry (LCSI) index. The index measures complexity by measuring the number of deviations from a linear straightforward inquiry process and the magnitude of these deviations. In structured teacher guided inquiries, the index measurement would be zero. The more students activate self-regulatory processes and grapple with the unknown, the higher is the obtained measurement. Keywords: Scientific inquiry; authentic inquiry; inquiry assessment; science education assessment.
INTRODUCTION
The educational approach whereby students perform full authentic scientific inquiries has been considered for the past four decades as a major pillar in science education (American Association for the Advancement of Science, 1993; National Research Council, 1996, 2012; Organization for Economic Co-operation and Development, 2003). The present study focuses attention to assessing aspects of complexity in the inquiry processes, as opposed to the more commonly assessed, procedural outcomes of the scientific inquiry. The aim of the study is to find a way to assess the inherent complex cognitive processes of the authentic inquiry, rather than merely procedural outcomes. By this it is hoped to assist in closing a long standing gap in the field of science education, between the requirement for complexity in students’ inquiry and the lack of appropriate assessment tools.
Theoretical Background Throughout the past five decades, science education research has emphasized the fundamental role of inquiry-
based learning in supporting development of meaningful learning, metacognitive skill development, and scientific epistemology related to science reasoning as well as the conceptual and procedural understanding of the nature of science (Chinn & Malhotra, 2002; Kipnis & Hofstein, 2008; National Research Council, 1996, 2005, 2000). The National Research Council (2000) published a set of key cognitive abilities which are required for performing scientific inquiries. These abilities go beyond procedural skills and content knowledge. Complexity analysis forms a major thread connecting the various abilities characterizing the scientific inquiry.
Since the 1960’s extensive efforts have been made to develop typologies for characterizing various types of classroom scientific inquiries (Herron, 1971; Schwab, 1962). A common and widely used typology differentiates between the following four levels: Structured Inquiry; Coupled Inquiry; Guided Inquiry; and, open or full inquiry (Martin-Hensen, 2002). Over the years, these four types of inquiries received various interpretations by different researchers (Buck, Bretz, & Towns, 2008). However, common to all perceptions, is the understanding that the level

E. Eilam
2 © 2015 iSER, International J. Sci. Env. Ed., 10(1), 1-20
of the students’ active involvement increases as one moves from the simple teacher guided ‘structured inquiry’ to the complex and more student driven, ‘open or full inquiry’. Some scales have been developed for capturing progression over various features of the inquiry process. Herron (1971) developed a scale of four levels of inquiries based on teachers’ guidance or lack of guidance on the three dimensions of ‘problem’, ‘ways and means’ and, ‘answers’. Buck, Bretz and Towns (2008) developed a five level rubric for characterizing the inquiry over the six dimensions of ‘problem/question’, ‘theory/background’, procedures/design’, ‘results and communication’ and, ‘conclusions’. The NRC (2000) moved further away from a typological perception in which inquiry types are allocated to discrete categories. According to the NRC (2000) the classroom inquiries can be placed along a continuum in which five essential inquiry features vary in accordance to the amount of learner self-direction and to the amount of direction from teachers or materials. The complexity of the inquiry increases with increased learner self-direction and, it decreases with increased direction from teachers and materials. Common to the various models that were developed for characterizing the classroom inquiry is a strong emphasis on providing students with opportunities to perform the high levels of scientific inquiries, as it enables students to think and work as scientist do in the real world (Schwartz, Lederman and Crawford, 2004).
Various terms have been given to these high levels of inquiry by the researchers who explored this type if inquiry. The most common terms are “real scientific inquiry”, “real world inquiry”, “open inquiry”, “full inquiry”, and “authentic inquiry” (e.g., Chinn & Malhotra, 2001; Crawford, 2000; Dewey, 1938/1997; Lee & Songer, 2003; National Research Council, 2012; Reiser et al., 2001; Solomon, 1989). Each one of these terms highlights various characteristics that are recognized as core features of the full scientific inquiry, an inquiry path that is primarily student-centered, driven by students’ self-regulation of their inquiries.
Chinn and Malhotra (2001) compared the two extremes of the scale, simple inquiry tasks to authentic inquiry. They characterized simple inquiry tasks as straightforward processes, whereas authentic inquiry was characterized as a complex process, whose complexity is reflected in the fact that “authentic experiments have many intervening events between the initial and final events in each condition” (p. 194). Chinn and Malhotra (2001) also referred to these intervening events as “branch out” points. Full authentic scientific inquiries can be further characterized by the final outcome being unknown. Therefore, inevitably, the road leading to solving the research problem is not linear. Rather, it is a bumpy road with curves, wrong turns and dead ends, which often leads the inquirer to retreat back to the starting point or to a previous junction, to readjust the course of action. These unique features of the full authentic scientific inquiry pose substantial challenges for assessment.
The NRC (1996; 2000) in its “Science teaching standard C”, emphasize the importance of integrating assessment as an ongoing part of the learning process, with a particular emphasis on developing assessment methods that are appropriate for capturing the unique features of the scientific inquiry (NRC, 2000). So far, the literature has been lagging in responding to the call. The extensive research related to aspects of complexity of the authentic scientific inquiry were not met with an equivalent body of research regarding their assessments. To date, most scientific inquiry assessments have been limited to assessing mainly content knowledge, a set of skills (Alonzo and Aschbacher, 2004; Lorch et al., 2010) or procedural understanding, mainly in the form of final outcomes (Gotwals & Songer, 2006; Myers & Burgess, 2003). The most common type of assessment has been found to be paper and pencil (Scalise et al., 2009). Quellmalz et al. (2009) claimed that such assessments are insufficient for capturing the full complexity of the scientific learning experience as intended. Such assessments leave out diverse skills and complex cognitive processes which are inherent to performing full scientific inquiries (Gobert, 2012).
Technology offers some solutions for closing the gap between the authentic scientific inquiry and its assessment. Some computer programs have been instrumental in capturing some of the more complex cognitive processes that are involved in performing a scientific inquiry. For example the program ‘Science Assistments’ (Gobert, Heffernan, Ruiz & Ryung, 2007) was developed specifically for providing scalable, reliable performance-based assessment of authentic inquiry skills (Gobert et al., 2012). Another example for a simulation based assessment is the SAIA program which assesses inquiry abilities of high school students (Wu, Wu, & Hsu, 2014). Though computer simulated programs are instrumental in assessing students’ performing scientific inquiries, they are still limited in the fact that they are mainly forms of summative assessments detached from the actual learning tasks. These forms of assessments are highly time consuming and create an artificial separation between the ongoing learning and the assessment tasks. So far, to our knowledge, no assessment tool has been developed for measuring the complexity of the actual inquiry process. In the rare cases in which complexity is addressed in the assessment, it is disconnected from the ongoing learning, thus creating an artificial add-on detached from students’ actual learning. It thus becomes unclear what is it that is being assessed.
The prevailing gap between our current understanding of the processes involved in scientific inquiry and the incompleteness of appropriate assessments methods, form the background for the present study.

Measuring the Level of Complexity
© 2015 iSER, International J. Sci. Env. Ed., 10(1), 1-20 3
In what follows we present an educational framework that was developed specifically for allowing ongoing documentation of students’ inquiry processes. The documented processes were then used for developing an index for measuring the level of complexity of the inquiry processes. The study demonstrates how the measurement may be derived directly from the ongoing learning process. METHODS
The Study Framework The educational setup in which the research was conducted was a Biology class in a high school situated twenty
minutes away from the Mediterranean coast, in northern Israel. Israeli high school students who major in Biology are typically required to conduct scientific inquiries. The inquiries are carried out by pairs of students throughout one school year with the aid of biology teachers. In the present study, 27 tenth-grade Israeli high school students (15 females and 12 males) who majored in Biology were asked to focus their inquiries on a common topic: biological invasions in the Mediterranean Sea ecosystem, in particular, Lessepsian migration. The term “Lessepsian migration” refers to large-scale bioinvasion of marine species from the Red Sea into the eastern part of the Mediterranean Sea, through the Suez Canal (Ruiz, Carlton, Grosholtz, & Hines, 1997; Spanier & Galil, 1991). The process is named after the French engineer Ferdinand Marie de Lesseps, who opened the Suez Canal in 1869, and thus initiated what may be called a large-scale experiment of species dispersal. To date, more than 20% of the species in the eastern Mediterranean Sea are alien (Spanier & Galil, 1991). As an ongoing dynamic phenomenon, Lessepsian migration provides a perfect framework in which school groups can interact scientifically in an authentic inquiry. Students were expected to produce new knowledge through their inquiry processes, and thus contribute to developing this body of research.
The 27 participating students were divided into 14 teams—13 pairs and 1 single student—each carrying out a different inquiry project related to the topic. The class was run by a team consisting of one biology teacher and three assistants, each holding at least a BSc degree in Biology. The study framework was composed of the following components (see Figure 1 for the study framework): An internet site was developed for the purposes of the project (site’s address: http://www.linet-pro.net/il/meal). The site was used for communication between all the participating parties in the study, including the student teams, their teachers, and an academic facilitator—a specialist in Lessepsian migration whose role was to oversee the 14 inquiry projects by providing continuous guidance to both teachers and students. Each of the 14 student teams was allocated a forum within the internet site for a three-way communication between the student team, the academic facilitator, and the students’ teachers. One forum was developed for communication between the academic facilitator and the teachers. Face-to-face communication took place at schools between the students and their teachers. The students collected data at the sea site and worked in the school’s laboratory.
Neither the teachers in class nor the students had any prior knowledge on Lessepsian migration. Therefore, the role of the facilitator was inherently crucial for the students’ advancement in their inquiry projects. The assumption was that due to the novelty of the topic, the participants will be highly dependent on the expert facilitator, which provided support only through the internet site. Building on the dependency assumption, it was estimated that most of the communication will be trafficked through the internet site, the sole meeting place of the participants with the facilitator. The facilitator entered each of the forums daily, providing guidance, prompting and feedback. Periodically, students would upload their data and advancement reports for assessment by the facilitator. A fundamental aspect of the facilitator’s guidance was continuous prompting of higher order thinking among the students. The facilitator frequently asked questions such as: “Why did you choose this organism?”; “What is the biological basis of your hypothesis?”; “Do the evidences support your conclusion?”; “Perhaps you should re-evaluate your methodology”, etc. The discussions in the forms were both synchronous and asynchronous, depending on the availability of users on both sides of the line at any given time.
The forums were open, so theoretically students could enter one another’s forums and discuss common issues concerning their research projects; however, most students relegated themselves to their own forums.

E. Eilam
4 © 2015 iSER, International J. Sci. Env. Ed., 10(1), 1-20
The study commenced at the beginning of the school year and ended with the end of the school year, spanning approximately nine months. Throughout the study, students were expected to form research questions, plan hands-on experiments, conduct the experiments, collect and analyze the data and submit full research reports. The reports formed part of their biology matriculation assessment.
Data Sources We used two sources of data for analysis, as follows: (a) the protocols of the internet discussion forums; and (b)
retrospective interviews with five teams of students. The protocols of the internet discussion forums. The main source of data for analysis of students’ inquiry
processes and metacognitive processes was derived “in vitro”, directly from the protocols of the internet discussion forums. We chose this as the main source because of the internet protocols’ unique qualities in delivering authentic unbiased documentation of the ongoing discussions related to the inquiry processes. Unlike other sources, such as interviews or reports (whether ongoing or retrospective), internet protocols provide a pure reflection of the actual processes, raw data that are completely unprocessed by their producers. When students wrote down their questions or discussed issues with the facilitator, they did so ad hoc, attending to the problems they faced at the given moment. The forum protocols are remarkably different from the processed materials that students produced later on, as final reports, or through a posteriori recollections of processes, produced in interviews (please see Box 1 for an example of an online protocol).
Not all the information that accumulated in the internet forums could be used for in-depth qualitative analysis. Contrary to our prediction that most of the information will be trafficked through the Internet forms, some student teams made little use of the internet discussion forums. These teams’ inquiry processes could not be fully traced by analyzing their internet discussions. We therefore decided to analyze only the internet forums that contained at least 30 entries. Five inquiry projects met this criterion. The five chosen pairs of students yielded enough data in the internet forums, to allow full analyses of the processes.
Figure 1. Educational framework. Bold arrows: IT communication; Single line arrows: F2F communication; Square boxes: Communication type; Rounded boxes: Communicating participants
Measuring the Level of Complexity
© 2015 iSER, International J. Sci. Env. Ed., 10(1), 1-20 5
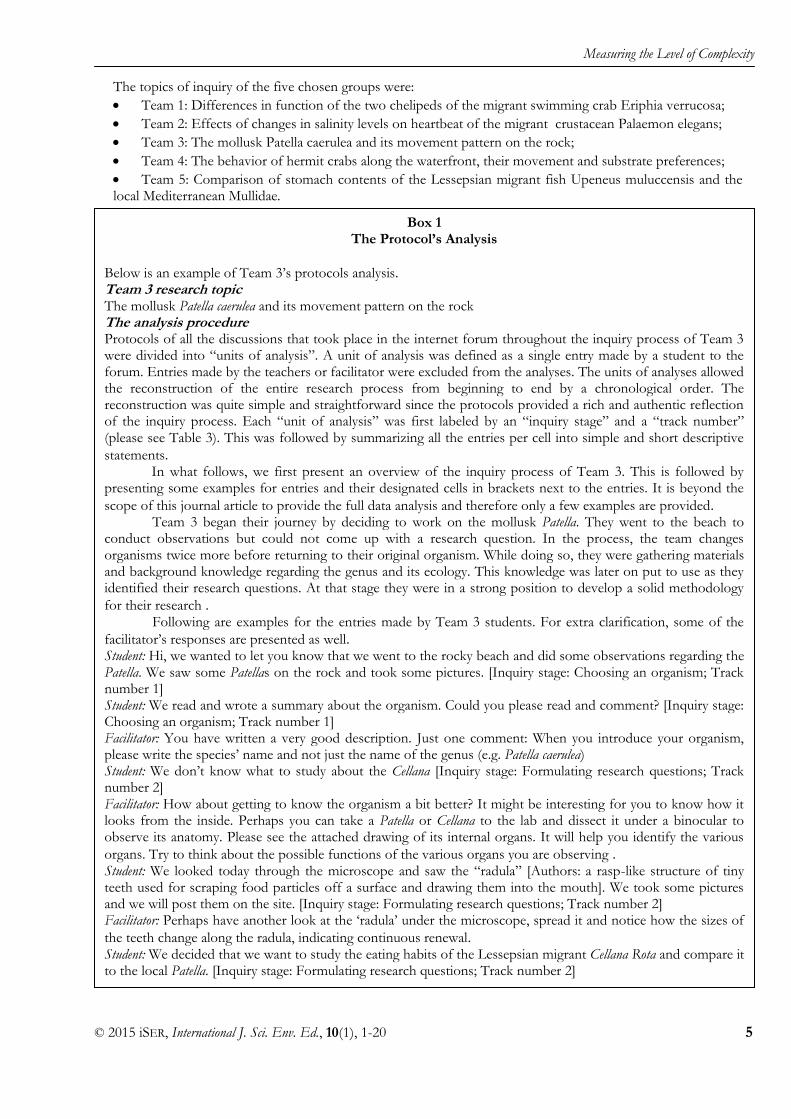
The topics of inquiry of the five chosen groups were:
Team 1: Differences in function of the two chelipeds of the migrant swimming crab Eriphia verrucosa;
Team 2: Effects of changes in salinity levels on heartbeat of the migrant crustacean Palaemon elegans;
Team 3: The mollusk Patella caerulea and its movement pattern on the rock;
Team 4: The behavior of hermit crabs along the waterfront, their movement and substrate preferences;
Team 5: Comparison of stomach contents of the Lessepsian migrant fish Upeneus muluccensis and the local Mediterranean Mullidae.
Box 1 The Protocol’s Analysis
Below is an example of Team 3’s protocols analysis. Team 3 research topic The mollusk Patella caerulea and its movement pattern on the rock The analysis procedure Protocols of all the discussions that took place in the internet forum throughout the inquiry process of Team 3 were divided into “units of analysis”. A unit of analysis was defined as a single entry made by a student to the forum. Entries made by the teachers or facilitator were excluded from the analyses. The units of analyses allowed the reconstruction of the entire research process from beginning to end by a chronological order. The reconstruction was quite simple and straightforward since the protocols provided a rich and authentic reflection of the inquiry process. Each “unit of analysis” was first labeled by an “inquiry stage” and a “track number” (please see Table 3). This was followed by summarizing all the entries per cell into simple and short descriptive
statements. In what follows, we first present an overview of the inquiry process of Team 3. This is followed by
presenting some examples for entries and their designated cells in brackets next to the entries. It is beyond the
scope of this journal article to provide the full data analysis and therefore only a few examples are provided. Team 3 began their journey by deciding to work on the mollusk Patella. They went to the beach to
conduct observations but could not come up with a research question. In the process, the team changes organisms twice more before returning to their original organism. While doing so, they were gathering materials and background knowledge regarding the genus and its ecology. This knowledge was later on put to use as they identified their research questions. At that stage they were in a strong position to develop a solid methodology
for their research . Following are examples for the entries made by Team 3 students. For extra clarification, some of the
facilitator’s responses are presented as well. Student: Hi, we wanted to let you know that we went to the rocky beach and did some observations regarding the Patella. We saw some Patellas on the rock and took some pictures. [Inquiry stage: Choosing an organism; Track number 1] Student: We read and wrote a summary about the organism. Could you please read and comment? [Inquiry stage: Choosing an organism; Track number 1] Facilitator: You have written a very good description. Just one comment: When you introduce your organism, please write the species’ name and not just the name of the genus (e.g. Patella caerulea) Student: We don’t know what to study about the Cellana [Inquiry stage: Formulating research questions; Track number 2] Facilitator: How about getting to know the organism a bit better? It might be interesting for you to know how it looks from the inside. Perhaps you can take a Patella or Cellana to the lab and dissect it under a binocular to observe its anatomy. Please see the attached drawing of its internal organs. It will help you identify the various
organs. Try to think about the possible functions of the various organs you are observing . Student: We looked today through the microscope and saw the “radula” [Authors: a rasp-like structure of tiny teeth used for scraping food particles off a surface and drawing them into the mouth]. We took some pictures and we will post them on the site. [Inquiry stage: Formulating research questions; Track number 2] Facilitator: Perhaps have another look at the ‘radula’ under the microscope, spread it and notice how the sizes of
the teeth change along the radula, indicating continuous renewal. Student: We decided that we want to study the eating habits of the Lessepsian migrant Cellana Rota and compare it to the local Patella. [Inquiry stage: Formulating research questions; Track number 2]
E. Eilam
6 © 2015 iSER, International J. Sci. Env. Ed., 10(1), 1-20
The retrospective interviews. The interviews were implemented as a means for verifying the reliability of the applied method. At the end of the school year, one of the researchers met with each of the five teams separately. Each team, assisted by appropriate prompts by the interviewer, was requested to reconstruct its inquiry path. The interviewer asked the participants one question only, as follows: “please describe your research path, starting from choosing an organism and ending by describing the final stage of producing your reports. The interviewer assisted the student groups’ recollections by providing prompts. The students’ recollections were then compared to the online analyses.
Analysis of the Protocols and Development of the Index A qualitative approach was implementing for analyzing the protocols. Protocols of all the discussions that took
place in the internet forums throughout the inquiry processes of the five teams were divided into “units of analysis” following Fahy et.al. (2001) who claim that a single sentence may comprise a unit of analysis. In the present context, a unit of analysis was defined as a single entry made by a student to the forum. Entries made by the teachers or facilitator were excluded from the analyses, as a measure for increasing validity. The reliability of the coding scheme was based on coder stability (intra-rater reliability in which one coder agreeing with herself over time) (Rourke et al., 2001). The units of analysis were used for reconstructing the authentic inquiry path of each of the five teams. By sequencing them in a chronological order it became possible to reconstruct the various stages of the inquiry. Box 1 provides an example of the protocols that were produced by the online discussions of Team 3. An explanation is provided for the applied analysis procedure. Once a chronological flow of each team’s inquiry process was constructed, the teams’ inquiry processes were depicted in separate tables, for each team. The table format enabled us to extract the LCSI index in an easy and straightforward way. The LCSI index was developed as a number
Box 1 - continued
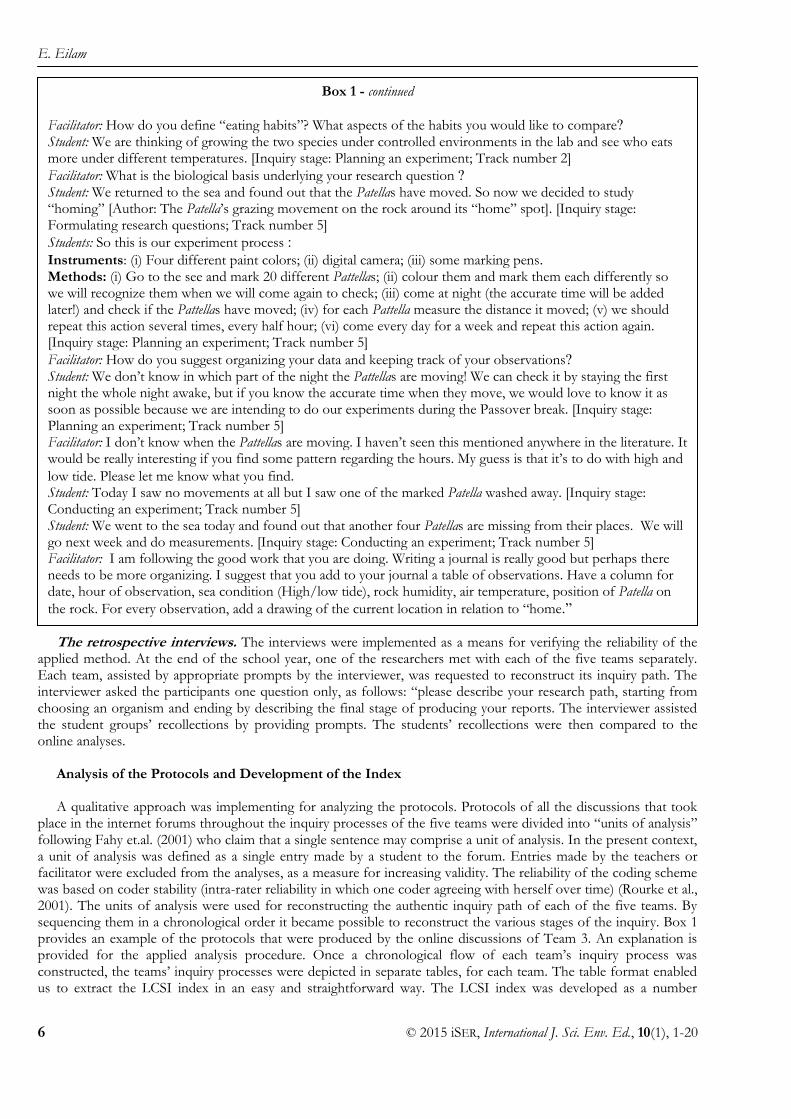
Facilitator: How do you define “eating habits”? What aspects of the habits you would like to compare? Student: We are thinking of growing the two species under controlled environments in the lab and see who eats more under different temperatures. [Inquiry stage: Planning an experiment; Track number 2]
Facilitator: What is the biological basis underlying your research question ? Student: We returned to the sea and found out that the Patellas have moved. So now we decided to study “homing” [Author: The Patella’s grazing movement on the rock around its “home” spot]. [Inquiry stage: Formulating research questions; Track number 5]
Students: So this is our experiment process :
Instruments: (i) Four different paint colors; (ii) digital camera; (iii) some marking pens. Methods: (i) Go to the see and mark 20 different Pattellas; (ii) colour them and mark them each differently so we will recognize them when we will come again to check; (iii) come at night (the accurate time will be added later!) and check if the Pattellas have moved; (iv) for each Pattella measure the distance it moved; (v) we should repeat this action several times, every half hour; (vi) come every day for a week and repeat this action again. [Inquiry stage: Planning an experiment; Track number 5]
Facilitator: How do you suggest organizing your data and keeping track of your observations? Student: We don’t know in which part of the night the Pattellas are moving! We can check it by staying the first night the whole night awake, but if you know the accurate time when they move, we would love to know it as soon as possible because we are intending to do our experiments during the Passover break. [Inquiry stage: Planning an experiment; Track number 5] Facilitator: I don’t know when the Pattellas are moving. I haven’t seen this mentioned anywhere in the literature. It would be really interesting if you find some pattern regarding the hours. My guess is that it’s to do with high and
low tide. Please let me know what you find. Student: Today I saw no movements at all but I saw one of the marked Patella washed away. [Inquiry stage: Conducting an experiment; Track number 5] Student: We went to the sea today and found out that another four Patellas are missing from their places. We will go next week and do measurements. [Inquiry stage: Conducting an experiment; Track number 5] Facilitator: I am following the good work that you are doing. Writing a journal is really good but perhaps there needs to be more organizing. I suggest that you add to your journal a table of observations. Have a column for date, hour of observation, sea condition (High/low tide), rock humidity, air temperature, position of Patella on
the rock. For every observation, add a drawing of the current location in relation to “home.”

Measuring the Level of Complexity
© 2015 iSER, International J. Sci. Env. Ed., 10(1), 1-20 7
measurement that is capable of quantifying some critical aspects of complexity of the inquiry process. In what follows, the two outcomes of the analysis process are presented, the inquiry process tables followed by the LCSI Index. RESULTS
Five tables were constructed representing the inquiry processes of the five teams (see Tables 1–5 below). The
tables are designed to represent the stages of the inquiry and the number of deviations from a linear straightforward inquiry path. The left column, titled “Inquiry stage”, presents the inquiry stages that are relevant to the present study’s full authentic inquiries. In the present context, students were expected to proceed through seven stages, beginning with the first stage of choosing an organism, up to the final stage of presenting their conclusions. The subsequent columns are termed “Tracks”. Each track represents an inquiry path that the students took in the process of completing their assignment. Each deviation from the straightforward path of the inquiry entails a shift in track, such that one new track is added for each deviation. The following example may assist in clarifying the concept of the “tracks”. Let us assume that students are conducting a simple guided inquiry in which the teacher provides the students with the research question and with guidelines for performing an experiment that leads to the correct conclusion. In this case, the students will be moving in a linear path, along the same track throughout the entire process. No deviations are expected, and therefore their inquiry path will be presented in the table on a single track, Number 1. The cells in the column of Track Number 1 will include the descriptions of activities at each of the stages that the students performed. The absence of deviations makes the inquiry process linear. Unlike this example, full authentic inquiries are neither linear nor straightforward. At any point during the inquiry, changes may occur. Such deviations are captured by the tracks. Students proceed along a given track until their advancement is blocked for various reasons (e.g., not enough data, experimental design does not fit research questions, etc.). Each blockage is a branching point. When reaching such branching points, students can respond in various ways: They can partially or fully retreat from the track they are on and begin to proceed along a new path of inquiry; they can make partial retrieval by adding a new research question; or they can repeat steps that have already been performed. In each of these cases students cease to advance along one track and perform some kind of retrieval, denoted by a new track.
Once the overall inquiry process was organized within the table, the next step was to derive the index. The index is derived by focusing on the following two aspects of the inquiry process: (a) How far back did the students retreat at each branching point, in terms of the number of stages? (b) How many tracks did students take in the process of completing the inquiry? For calculating the index, we first calculate the number of retreated stages that occur at each deviation from one track to the next. For calculating the overall deviations we sum up the number of retreats. The obtained number is the LCSI index measurement. The measurement sums up both the number of deviations/branching points and the magnitude of changes, as expressed by the number of retreated stages at each track.
The following example illustrates the overall procedure of deriving the index. Table 1 presents the inquiry process of team 1, which consisted of five tracks. The students advanced one step in track number 1, by choosing the organism Portunus pelagicus. Then they retreated and chose to work with another organism, Eriphia verrucosa. By doing so, they moved to a new track, Number 2. They retreated one stage backwards, since they performed the same step twice: They chose one organism and then chose a different organism. The number of retreats carried out while moving from Track 1 to Track 2 is shown at the bottom of the Track 2 column. In this particular case, the number is 1. Similarly, the number at the bottom of the Track 3 column denotes the number of retreats made when deviating from Track 2, and so on. Theoretically, the number at the bottom of a given column may be negative as well as positive. Though in our study, each track change involved a retreat, one can imagine a situation in which students jump stages forward when moving from one track to another. Though this might occur for specific track deviations, the overall index number is expected to be positive, and a higher number of deviations is expected to be associated with a higher index measurement. The reason for this is that deviations are, on the whole, costly in terms of repeated stages.
When performing full authentic inquiries students would sometimes skip stages. For example, they would go forward with an experiment without planning it. When calculating the number of retreated stages, we calculated the skipped stages as well. For example, when looking at Table 1 Track 3, it can be seen that students skipped from formulating research questions to conducting an experiment. They skipped the stages of hypothesizing and planning. When calculating the number of retreated stages that occurred in the transition from Track 3 to Track 4, we included the missing stages as well, thus yielding a retreat of 6 stages (see Table 1, column 5, last row). The summation of all these retreats across all tracks yields the index as calculated below.

E. Eilam
8 © 2015 iSER, International J. Sci. Env. Ed., 10(1), 1-20
LCSI index formulation. The LCSI index is calculated according to the following formula. The formula may be useful for deriving the measurement without needing to develop a table for each particular inquiry that is being assessed.
n LCSI = Σ Δk = Δ1 + Δ2 +…Δn
k=1
LCSI = Level of complexity of a scientific inquiry process. k = track number n = total number of tracks Δk= Number of stages backwards on the path from track number k to track number k+1 (k+1-k). When there is no change in the linear process of an inquiry (as is the case in structured inquiries), LCSI = 0. In
structured inquiries the starting point and end point are usually known in advance to the teacher who leads the
Table 1. The Inquiry Process of Team 1, by Inquiry Stage, Number of Tracks and LCSI Measurements
Inquiry stage Track number
1 2 3 4 5
Choosing an organism Portunus pelagicus
Eriphia verrucosa
Formulating research questions
What is the average size of the crabs?
How does their body size affect the type of prey they choose?
What is the difference between the two chelipeds?
How are the differences in shape reflected in differences in function?
Is there a sex difference in the location of the large cheliped?
Do the crabs appear more at low tide and in the mornings?
Presenting hypotheses
In females the large cheliped is on the right. In males the large cheliped is on the left.
Planning an experiment Choose seven crabs
and measure body size and pincers' size
Conducting an experiment
Measurement of chelipeds of four crabs
Observations at various hours
Presenting results
Report size of chelipeds
There is no evidence to confirm this hypothesis.
Presenting conclusions
1. Unequal size of chelipeds. The lengths are not constant. 2. The longer cheliped can be on the right side or the left. 3. Extended use of the larger cheliped.
Number of backward stages
1 3 6 2
Note. Index for level of complexity of scientific inquiry (LCSI) = 12

Measuring the Level of Complexity
© 2015 iSER, International J. Sci. Env. Ed., 10(1), 1-20 9
inquiry. In such cases, there are no deviations. Each step leads to the next in a linear process at a relatively steady rate; thus, students stay on track number 1 throughout the entire process. Therefore:
1
LCSI= Δk=0
k=1
The LCSI index quantifies both the number of deviations that occurred from the linear, straightforward process, and the magnitude of the deviations. The number of deviations is expressed by the summation. The magnitude of each deviation is expressed by Δk which represents the number of steps back on each track. The index takes into account how far students advanced before they made a change in course, and not just how many changes occurred over the course of the project. Thus, the LCSI index is able to provide useful qualitative information (regarding magnitudes) within a single quantitative measurement.
Tables 1-5 present the inquiry processes and LCSI measurements for each of the five teams. Each of the tables is followed by a flow chart presenting a summary of the forward and backward stages that student teams performed throughout their inquiry processes. For each team, the number of retreated stages is presented and summed up. Figures 2-6 present the flow charts for teams 1-5.
Figure 2. Flow Chart of the Inquiry Process of Team 1

E. Eilam
10 © 2015 iSER, International J. Sci. Env. Ed., 10(1), 1-20
Table 2. The Inquiry Process of Team 2, by Inquiry Stage, Number of Tracks and LCSI Measurements
Inquiry stage Track number
1 2
Choosing an organism Echinoidea
Palaemon elegans
Formulating research questions How do changes in salinity rate affect the heartbeat of Palaemon
elegans? Presenting hypotheses Planning an experiment Heart beat will be tested at salinities ranging from 0% to 16%. Conducting an experiment Reported procedures
Presenting results
Maximum heartbeat at 4% salinity, which is equal to salinity at sea.
Presenting conclusions Number of backward stages 1
Note. Index for level of complexity of scientific inquiry (LCSI) = 1
A. Choosing an organism
B. Formulating research questions
C. Presenting hypotheses
D. Planning an experiment
E. Conducting an experiment
F. Presenting results
G. Presenting conclusions
Track 1
Track 2
A
D
C
B
A1
Inquiry stage
Number of backward
stages1
E
F
Figure 3. Flow Chart of the Inquiry Process of Team 2

Measuring the Level of Complexity
© 2015 iSER, International J. Sci. Env. Ed., 10(1), 1-20 11
Table 3. The Inquiry Process of Team 3, by Inquiry Stage, Number of Tracks and LCSI Measurements
Inquiry stage
Track number
1 2 3 4 5
Choosing an organism
Patella caerulea
Cellana rota & P. Caerulea
Monodanta & Cellana
Patella caerulea
Formulating research questions
What is the difference between C. rota and P. caerulea in the amount of food they consume and the water temperature in which they feed?
How do the two organisms differ in their adaptation to their biotopes' conditions?
How does P. caerulea feed? Do they feed at night in circles or stay in one place?
To what distance can P. caerulea be moved and still return home?
Presenting hypotheses
Planning an experiment
The two species will be put in the lab in an aquarium with food. The rate in which the water becomes clear from algae will be measured with a spectrophotometer.
Document changes in location with a camera
Mark 10 P. caerulea mollusks. Follow their movements during a week by observations and camera. Measure radius of movement.
Conducting an experiment
Visits to sea. Visits to sea. Measures were taken.
Presenting results
No movements.
Patellas moved. Photographs were sent.
Presenting conclusions
Report of conclusions
Number of backward stages
1 4 4 5
Note. Index for level of complexity of scientific inquiry (LCSI) = 14
E. Eilam
12 © 2015 iSER, International J. Sci. Env. Ed., 10(1), 1-20
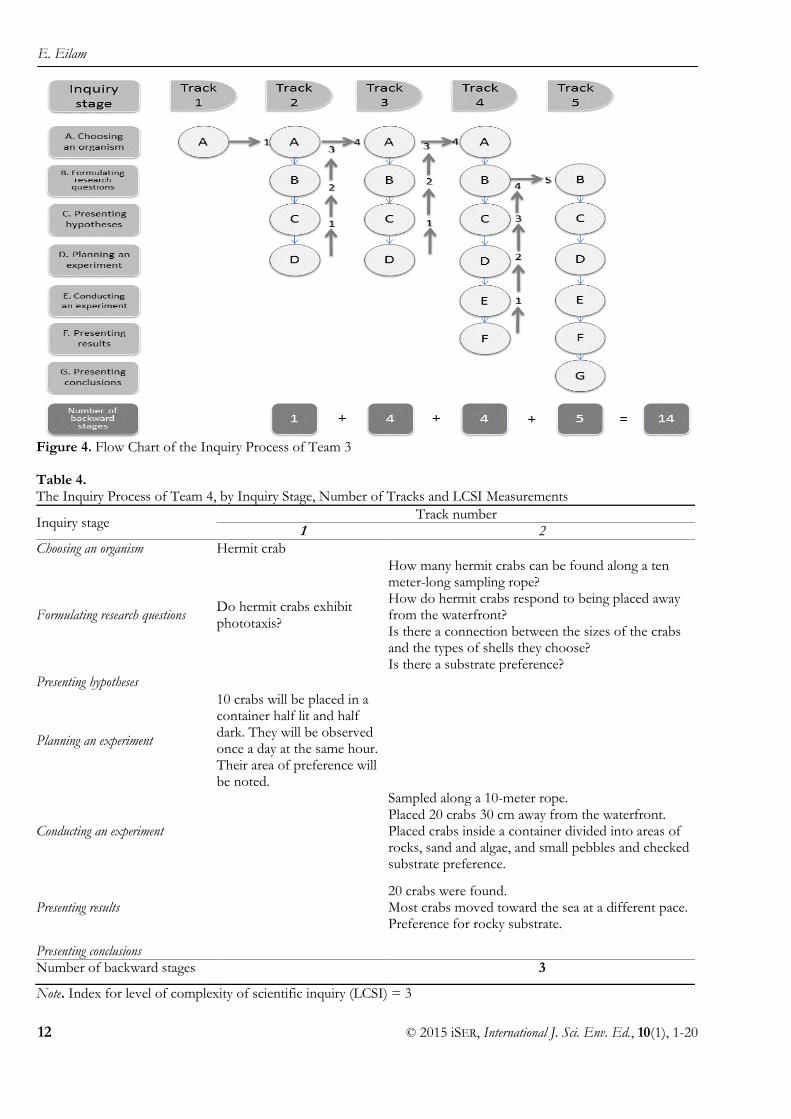
Figure 4. Flow Chart of the Inquiry Process of Team 3 Table 4. The Inquiry Process of Team 4, by Inquiry Stage, Number of Tracks and LCSI Measurements
Inquiry stage Track number
1 2
Choosing an organism Hermit crab
Formulating research questions Do hermit crabs exhibit phototaxis?
How many hermit crabs can be found along a ten meter-long sampling rope? How do hermit crabs respond to being placed away from the waterfront? Is there a connection between the sizes of the crabs and the types of shells they choose? Is there a substrate preference?
Presenting hypotheses
Planning an experiment
10 crabs will be placed in a container half lit and half dark. They will be observed once a day at the same hour. Their area of preference will be noted.
Conducting an experiment
Sampled along a 10-meter rope. Placed 20 crabs 30 cm away from the waterfront. Placed crabs inside a container divided into areas of rocks, sand and algae, and small pebbles and checked substrate preference.
Presenting results 20 crabs were found. Most crabs moved toward the sea at a different pace. Preference for rocky substrate.
Presenting conclusions Number of backward stages 3
Note. Index for level of complexity of scientific inquiry (LCSI) = 3

Measuring the Level of Complexity
© 2015 iSER, International J. Sci. Env. Ed., 10(1), 1-20 13
A. Choosing an organism
B. Formulating research questions
C. Presenting hypotheses
D. Planning an experiment
E. Conducting an experiment
F. Presenting results
G. Presenting conclusions
Track 1
Track 2
A
D
C
B3
Inquiry stage
Number of backward
stages3
B
C
D
E
F
1
2
Figure 5. Flow Chart of the Inquiry Process of Team 4
Table 5. The Inquiry Process of Team 5, by Inquiry Stage, Number of Tracks and LCSI Measurements
Inquiry stage Track number
1 2 3 4 5
Choosing an organism
Argyrosomus regius Scomberomorus commersonii
Upeneus muluccensis
Adding an organism: Upeneus muluccensis and a local Mediterranean Mullidae.
Formulating research questions
What is the stomach content of S. commerson?
What is the size of the stomach?
How does stomach size change in different fishing grounds?
What is the stomach content and in what quantity does it appear in the stomachs of U. moluccensis?
Comparison of density of stomach content of the invader Mullidae and the local Mullidae
Comparison of quantity of stomach content of the two species.

E. Eilam
14 © 2015 iSER, International J. Sci. Env. Ed., 10(1), 1-20
Presenting hypotheses
1. The food content is different, and that explains the establishment of the invader, who found a different ecological niche. 2. The food content is the same, and that explains the establishment of the invader who can eat the available food in the Mediterranean Sea.
Reformulate the hypothesis: The food content of the invader is different and more diverse. The difference in food content can help in understanding the invader's establishment.
Planning an experiment
Buy fishes in fish market. Dissect in lab.
Three repetitions in Cyprus, Greece and Israel. 10 fishes in each sampling. Measurements of circumference of stomach, volume and quantity.
Conducting an experiment
Experiment was conducted in Israel only.
Found pieces of crabs and algae in the stomachs.
Found only local species in the markets. Dissected local species.
Additional parameter checked: weight of stomach
Presenting results
Results: Reported state of gonads Stomach content Weight Length Length of barbules.
Results: Reported state of gonads Stomach content Weight Length Length of barbules.
No difference found in food content The ratio of stomach weight to body weight is higher for the local species
Presenting conclusions
The invader does not seem to be well established and does not have advantage on the local species in food intake.
Number of backward stages
4 5 5 4
Note. Index for level of complexity of scientific inquiry (LCSI) = 18

Measuring the Level of Complexity
© 2015 iSER, International J. Sci. Env. Ed., 10(1), 1-20 15
There is a large disparity between the LCSI measurements of teams 1, 3, and 5 and the measurements obtained
for teams 2 and 4. The large differences in the measurements indicate that the complexity levels of the inquiries differed substantially between the two sets of teams. We assume that these differences reflect fundamental differences in cognitive and metacognitive processes.
INTERVIEW RESULTS
When comparing the online analysis of the process to the students’ recollections of the processes, the online
analysis was found to be highly reliable, to a much greater extent than the interviews. Each of the five teams initially produced a very limited description of the full process. Upon prompting, without exception, the teams confirmed the validity of the information that had been documented in the protocols but omitted from their initial interview responses.
DISCUSSION
The study put forward the aim to develop an educational framework which allows documentation of students’
ongoing process of full scientific inquiry. The documented protocols were used for developing the LCSI index for measuring the level of complexity of the scientific inquiry processes. The index was applied to the inquiry processes of five teams and five measures were obtained. In what follows, we discuss the results and their implications through a series of related questions.
Figure 6. Flow Chart of the Inquiry Process of Team 5

E. Eilam
16 © 2015 iSER, International J. Sci. Env. Ed., 10(1), 1-20
The Groups’ Performance of Full Inquiries The five groups varied greatly in their LCSI measurements. Teams 2 and 4 had exceptionally low measurements.
These low measurements reflect the teams’ low self-regulation and low levels of higher order thinking. Both teams chose topics which were a replica of prior experiences and did not require the teams to challenge themselves to the unknown. Team 1 performed an experiment which is quite standard in Israeli biology classes – measuring the effects of gradients of solvents. The only modification that was required was to choose a Lessepsian Migrant crustacean. The relative simplicity of the inquiry of Team 4 is expressed by restricting their inquiry to ecological observations only, which once again, a process that Israeli biology students are well trained to do. Both teams had minimal cognitive and affective investment in their projects. They were driven mainly by their wish to get the reports done and submitted so that they could obtain their matriculation accreditation. Contrary to these two teams, Teams 1, 3 and 5 presented high levels of complexity. These high measurements may be related to the large amount of metacognitive activity that was presented in the internet protocols. The teams tested and re-tested their assumptions; they expressed courage in their thinking and did trials for assessing their ideas. The teams’ protocols clearly presented strong emotional and cognitive investments in the inquiries. The high LCSI measurements of the teams’ inquiries reflect these complex interconnected cognitive, metacognitive and affective processes. These skills and attributes are also reflected in the students’ protocols and may be used for further analysis of the factors contributing to complexity.
Why Measure the Complexity of the Inquiry Process? For the past four decades, developing students’ skills in performing full scientific inquiries has been considered
as the ultimate goal of science education, although this goal is rarely achieved in science classrooms (International Council for Science, 2011; Tytler, 2007). Despite the importance of this goal, most of the assessment tools that have been developed to evaluate students’ achievements regarding scientific inquiries relate mainly to procedural aspects of the inquiry, such as: “How well is the research question phrased?” “Is the methodology appropriate?” Examples for inquiry assessment tools include Tamir, Nussinovitz, and Friedler’s (1982) assessment inventory for laboratory inquiry projects in biology, or Lunsford and Melear’s (2004) scoring rubrics, which are used for comparing students’ performance to expected performance.
Inquiries can vary greatly not only in procedural outcomes but also in the implemented skills. At one extreme of the inquiry spectrum, all that the students are required to do is to follow instructions, while at the other end, the students become fully immersed in minds-on and hands-on experience, working towards the unknown with high level of uncertainty. These differences entail high variance in implemented cognitive and emotional skills, which procedural assessments overlook in their measurements. In procedural assessments, scores are awarded to students on the basis of the procedures they apply, regardless of the substantial differences in skills that are required for conducting each type of inquiry. The LCSI index is innovative because the differences in students’ experienced paths are inherent to the measurement. The LCSI index provides a clear differentiation within the wide range of inquiries, capturing the subtleties of the cognitive and the affective experiences along the path, rather than merely the procedural outcomes. This index provides educators and researchers with a practical and simple tool for assessing the inquiry process not only qualitatively but also quantitatively. The obtained measurements become an authentic reflection of the array of emotional and cognitive skills, and attributes that are involved in scientific inquiries.
How Do We Know That We Are Measuring Complexity Rather Than Mere Efficiency? Complexity is complex in its nature. As discussed above, it captures multitude of qualities and skills, such as self-
regulation, system thinking, creativity, courage and more. From this respect, the LCSI Index may be viewed as an indicator reflecting a range of interacting skills and attributes, some of which are unknown, that together form the complexity of the scientific research.
Efficiency, on the other hand, is a measure of educational performance. Readers of this article might query whether students who deviate more, might be less efficient or “not as good at it”, rather than applying more complexity. Efficiency may be attributed to a variety of reasons, including prior knowledge regarding the topic, prior skills in dealing with the topic, or possibly high perception of self-efficacy (Bandura and Schunk, 1981; Pajares and Miller, 1994; Zimmerman, 2000).
The present study puts forward the claim that deviations from a straightforward linear path are not random meaningless occurrences representing lack of efficiency, but rather they are reflections of complexity. This claim

Measuring the Level of Complexity
© 2015 iSER, International J. Sci. Env. Ed., 10(1), 1-20 17
could only be true under the condition that all the assessed groups have completed their inquiries. This condition ensures that any deviation is purposeful and leads towards an end goal which is producing a final report. In the present study, all the participating students chose to do Biology for their Matriculation. The Inquiry was an essential part of their Matriculation. Abandoning the assignment would have carried a great toll and therefore, all the students in the study (100%) completed the final report.
In the present study all the students who chose to study biology for their matriculation, had similar high self-efficacy in regards to the chosen discipline. There are also reasons to assume that their prior knowledge and skills were similar as well, since these particular students all grew up in the same community in northern Israel and the majority of them studied together at the same school, since Year 1.
The study showed that students who relied heavily on prior knowledge and skills, employed less self-regulatory processes, there were less observed metacognitive activities in their protocols and less expressions of grappling with complex issues. These students were relying heavily on what was already known to them and were less inclined to take risks and grapple with the messiness of the scientific inquiry. Though their work might have been efficient in the sense that it was straightforward, it presented less complexity and the final report was less innovative.
How Reliable Are the Measurements? In the present study, online discourse protocols were used as a means of obtaining authentic documentation of
the inquiry processes. The design of the research framework was meant to ensure that students were dependent on the online facilitation for advancing. When students make regular and consistent use of the Internet forums, the obtained internet discussion protocols provide authentic reflections of the students’ progress from one stage to another. To ensure that we evaluated processes that were fully documented online and that the information was not partial, we determined a threshold for participation, set to a minimum of 30 entries. This threshold caused 9 out of 14 teams to be excluded from the analysis. The reason for this high number of teams not reaching the threshold is derived from a loose end in the study framework. It turned out that many teams selected research topics that were similar to one another. A few teams researched the same questions with different species, or researched different questions using similar methods. As a consequence, the teachers who were supporting the students’ inquiries in class quickly transferred the guidance that was given online from one group to others through face to face communication. The end result was that only five teams were fully dependent on the online guidance, paving the way for the other teams. For these five teams, the interview results showed very high reliability of the applied method of analysis.
Online documentation was found to be a very reliable source of data for tracking the inquiry process. Other reliable sources could be any means that capture the process in a non-retrospective way. These could include, for example, filming, recording discussions during the process, documenting in logbooks, periodical reports completed by students, or teachers’ running records on students’ progress.
What Is the Applicability of the LCSI Index? The LCSI index can be applied both in research and in education. Because of the index’s relative simplicity of
calculation, it can be used in various learning setups and can potentially be incorporated into science matriculation assessments. The index can be adapted to any sequence of stages for any inquiry type. In the present study, the first stage of the sequence was choosing an organism. In other sequences the first stage may be questioning, observation, or other. As long as the various stages are ordered and can be placed in a sequence, the LCSI index can yield a measure for the complexity of the inquiry process.
Researchers may use the LCSI index to gain deeper understanding of inquiry processes. The index can support research into questions such as: How do we know whether students who are conducting an inquiry are in effect gaining mastery of the skills required to perform a full inquiry? What are the major difficulties that students encounter in their passage through the unexpected bends and turns of the full inquiry? Researchers might be interested in looking at rhythms of advancement and retreat, such as those presented in Tables 1–5, to develop a deeper understanding of their effects on the overall process.
Furthermore, the index may be used for assessing metacognitive activity. The analysis of the protocols suggests that there is a strong connection between the LCSI index and the level of metacognitive activity. Teams who obtained high LCSI measurement also expressed more metacognitive activity compared to teams who obtained low scores.

E. Eilam
18 © 2015 iSER, International J. Sci. Env. Ed., 10(1), 1-20
What Inferences May be Suggested Regarding the Relationship between LCSI and Metacognitive Activity?
The relationship between inquiry processes and metacognitive activity has been a focus of research in science
education. For example, Chinn and Malhotra (2002) claimed that authentic inquiry requires cognitive and metacognitive skills that are more complex than required in simple inquiry tasks. Research indicates that metacognitive training supports skillfulness in diverse areas of learning such as mathematics literacy (e.g., Kramarski & Mevarech, 2003; Mevarech & Kramarski, 1997), science literacy (e.g., Michalsky, 2003; Hollingworth & McLoughlin, 2003; Loh et al., 2001), and other domains of skillfulness (e.g., Sternberg, 1998; Zohar, 1996). Further research is required for exploring these relationships in the context of the LCSI index.
What Are the Study’s Limitations? The present study’s main limitation is the small sample size. The reliability of the LCSI index was tested and
verified in interviews. For further validation there is a need to implement the index in diverse inquiry settings and on a larger sample.
More research is required in order to understand the various skills represented by the LCSI index and to understand how each of the skills associated with full inquiries is related to the index. The present study takes a first step in this direction by relating the index to metacognitive skillfulness. CONCLUSIONS
Complexity is a fundamental attribute of inquiry processes, as it captures various aspects of the “messiness” and
uncertainty that scientists encounter in the real world of scientific research. The developed LCSI index measures the level of complexity of scientific inquiry, as expressed by the number of deviations from a linear path and the magnitude of these deviations, all of which are expressions of the process’s complexity. The Index offers a new pathway for an in-depth assessment of the inquiry process as it authentically unfolds, rather than assessing the final outcomes. ACKNOWLEDGEMENT
I am deeply grateful for the support and advice given by Professor Zmira Mevarech, School of Education, Bar-Ilan University, Israel. Zmira contributed by overseeing the project from planning to completion. I would also like to extend my gratitude to the biology teaching team at Cabri-Manor Secondary School, in Israel. In particular to the team head Ms Roni Frost.
REFERENCES
American Association for the Advancement of Science. (1993). Benchmarks for science literacy (Project 2061). New York, NY: Oxford University Press.
Alonzo, A. & Aschbacher, P. R. (2004). Value Added? Long assessment of students’ scientific inquiry skills. Presented at the Annual Meeting of the American Educational Research Association, San Diego, CA.
Bandura, A., & Schunk, D. H. (1981). Cultivating competence, self-efficacy, and intrinsic interest through proximal self-motivation. Journal of Personality and Social Psychology, 41, 586–598.
Buck, L. B., Bretz, S. L., & Towns, M. H. (2008). Characterizing the level of inquiry in the undergraduate laboratory Journal of College Science Teaching, 52-58.
Chinn, C. A., & Malhotra, B. A. (2001). Epistemologically authentic scientific reasoning. In K. Crowley, C. D. Schunn, & T. Okada (Eds.), Designing for science: Implications from everyday, classroom, and professional settings (pp. 351–392). Mahwah, NJ: Erlbaum.
Chinn, C. A., & Malhotra, B. A. (2002). Epistemologically authentic inquiry in schools: A theoretical framework for evaluating inquiry tasks. Science Education, 86, 175-218.
Crawford, B. A. (2000). Embracing the essence of inquiry: New roles for science teachers. Journal of Research in Science Teaching, 37, 916–937.
Fahy, P. (2001). Addressing some common problems in transcript analysis. International Review of Research in Open and Distance Learning, 1(2). http://www.irrodl.org/content/v1.2/research.html/#Fahy (Retrieved August 15, 2013).

Measuring the Level of Complexity
© 2015 iSER, International J. Sci. Env. Ed., 10(1), 1-20 19
Gobert,J., Heffernan, N., Ruiz, C., & Ryung, K. (2007). AMI: ASSISTments Meets Inquiry. Proposal NSF-DRL# 0733286 funded by the National Science Foundation.
Gobert, J. D., Sao Pedro, M. A., Baker, R. S. J., Toto, E., & Montalvo, O. (2012). Leveraging educational data mining for real-time performance assessment of scientific inquiry skills within microworlds. The Journal of Educational Data Mining , 4, 105-143.
Gotwals, A. & Songer, N. (2006). Measuring Students’ Scientific Content and Inquiry Reasoning. In Eds. L. Erlbuam Associates (Ed.), Proceedings of the 7th International Conference of the Learning Sciences, (pp.196-202). ICLS 2006, S. Barab, K. Hay, and D. Hickey, Bloomington.
Herron, M. D. (1971). The nature of scientific enquiry. School Review, 79, 171-212. Hollingworth, W. R., & McLoughlin, C. (2003). Even foundation level students can get the HOTS for science!
Paper presented at the 7th Pacific Rim, First Year in Higher Education Conference, QUR Gardens Point Campus.
International Council for Science (2011). Report of the ICSU ad-hoc review panel on science education (2011). Paris, France: International Council for Science.
Kipnis, M., & Hofstein, A. (2008). The inquiry laboratory as a source of development of metacognitive skills. Science and Mathematics Education, 6, 601-627.
Kramarski, B., & Mevarech, Z. R. (2003). Enhancing mathematical reasoning in the classroom: The effects of cooperative learning and metacognitive training. American Educational Research Journal, 40, 281-298.
Lee, H. S., & Songer, N. B. (2003). Making authentic science accessible to students. International Journal of Science Education, 25, 1-26.
Loh, B., Reiser, B. J., Radinsky, J., Edelson, D. C., Gomez, L. M., & Marshall, S. (2001). Developing reflective inquiry practices: A case study of software, the teacher, and students. In K. Crowley, C. Schunn, & T. Okada (Eds.), Designing for science: Implications from everyday, classroom, and professional settings (pp. 279-323). Mahwah, NJ: Erlbaum.
Lorch, R. F., Lorch, E. P., Calderhead, W. J., Dunlap, E. E., Hodell, E. C., & Freer, B. D. (2010). Learning the control of variables strategy in higher and lower achieving classrooms: Contributions of explicit instruction and experimentation. Journal of Educational Psychology, 102, 1, 90–101.
Lunsford, E., & Melear, C. T. (2004). Using scoring rubrics to evaluate inquiry. Journal of College Science Teaching, 34, 34-38.
Martin-Hansen, Lisa. (2002). Defining Inquiry. The Science Teacher, 69(2), 34-37. Myers, M. J., & Burgess, A. B. (2003). Inquiry-based laboratory course improves students’ ability to design
experiments and interpret data. Advances in Physiology Education, 27(1), 26–33. Mevarech, Z. R., & Kramarski, B. (1997). IMPROVE: A multidimensional method for teaching mathematics in
heterogeneous classrooms. American Educational Research Journal, 34, 365-394. Michalsky, T. (2003). The effects of metacognitive guidance within asynchronous learning networks on inquiry
learning processes (Unpublished doctoral dissertation). Bar-Ilan University, Israel. National Research Council (1996). National science education standards. Washington, DC: National Academy Press. National Research Council (2000). Inquiry and the national science education standards: A guide for teaching and learning.
Washington, DC: National Academy Press National Research Council (2005). National science education standards. Washington, DC: National Academy Press. National Research Council (2012). A framework for K–12 science education: Practices, crosscutting concepts, and core ideas.
Washington, DC: National Academies Press. Organization for Economic Co-operation and Development. (2003). PISA literacy skills for the world of tomorrow: Further
results from PISA 2000. Paris, France: Organization for Economic Co-operation and Development. Pajares, F., & Miller, M. D. (1994). Role of self-efficacy and self-concept beliefs in mathematical problem solving: A
path analysis. Journal of Educational Psychology, 86, 193–203. Quellmalz, E., Timms, M., & Schneider, S. (2009). Assessment of student learning in science simulations and games.
National Research Council Report, Washington, D.C. Reiser, B. J., Tabak, I., Sandoval, W. A., Smith, B. K., Steinmuller, F., & Leone, A. J. (2001). BGuILE: Strategic and
conceptual scaffolds for scientific inquiry in biology classrooms. In S. M. Carver & D. Klahr (Eds.), Cognition and instruction: Twenty-five years of progress (pp. 263-305). Mahwah, NJ: Erlbaum.
Rourke, L., Anderson, T., Garrison, D. R., & Archer, W. (2001). Methodological issues in the content analysis of computer conference transcripts. International Journal of Artificial Intelligence in Education, 12, 8–22.
Ruiz, G. M., Carlton, J. T., Grosholtz, E. D., & Hines, A. H. (1997). Global invasions of marine and astuarine habitats by non- indigenous species: Mechanisms, extent and consequences. American Zoologist, 37, 621–632.

E. Eilam
20 © 2015 iSER, International J. Sci. Env. Ed., 10(1), 1-20
Salmon, G. (2002). Mirror, mirror, on my screen…Exploring online reflections. British Journal of Educational Technology, 33, 379-391.
Scalise, K., Timms, M., Clark, L., & Moorjani, A. (2009). Student learning in science simulatons: What makes a difference? Paper presented at the America Educational Research Association, San Diego, CA.
Schwab, J.J. (1962). The teaching of science as enquiry. In J.J. Schwab and P.F. Brandwein (ED.), The teaching of science, (pp. 3–103). Cambridge, MA: Harvard University Press.
Schwartz, R. S. Lederman, N. G. & Crawford, B. A. (2004). Developing views of nature of science in an authentic context: An explicit approach to bridging the gap between nature of science and scientific inquiry. Science Education, 88, 610-645.
Solomon, J. (1989). The social construction of school science. In R. Millar (Ed.), Doing science: Images of science in science education (pp. 126-136). Philadelphia, PA: The Falmer Press.
Spanier, E., & Galil, S. (1991). Lessepsian migration: A continuous biogeographical process. Endeavor, New Series, 15, 102-106.
Sternberg, R. J. (1998). Metacognition, abilities and developing expertise: What makes an expert student? Instructional Science, 26, 127-140.
Tamir, P., Nussinovitz, R., & Friedler, Y. (1982). The design and use of practical tests assessment inventory. Journal of Biological Education, 16, 42-50.
Tytler, R. (2007). Re-imagining science education: Engaging students in science for Australia’s future. Victoria, Australia: Australian Council for Educational Research Press.
Wu, P. Wu, H., & Hsu, Y. (2014). Establishing the criterion-related, construct, and content validities of a simulation-based assessment of inquiry abilities. International Journal of Science Education, 36(10), 1630-1650.
Zimmerman, B.J. (2000). Self-efficacy: An essential motive to learn. Contemporary Educational Psychology, 25, 82–91. Zohar, A. (1996). To learn, to think and to learn to think. [Hebrew]. Jerusalem, Israel: Branko Weiss Institution for
Development of Thinking.
Corresponding Author: Dr. Efrat Eilam, Victoria University, School of Education, Institute of Sustainability and Innovation, Victoria, Australia. E-Mail: [email protected] Please cite as: Eilam, E. (2015). Measuring the level of complexity of scientific inquiries: The LCSI index. International Journal of Environmental and Science Education, 10(1), 1-20. doi 10.12973/ijese.2015.227a