Measuring the innovative activity of New Zealand firms · EMBARGOED UNTIL 5AM 29 June 2015...
54
Measuring the innovative activity of New Zealand firms Working Paper 2015/2 June 2015 Authors: Simon Wakeman (NZPC), Trinh Le (Motu)
Transcript of Measuring the innovative activity of New Zealand firms · EMBARGOED UNTIL 5AM 29 June 2015...

EMBARGOED UNTIL 5AM 29 June 2015
Measuring the innovative activity of New Zealand firms Working Paper 2015/2
June 2015
Authors: Simon Wakeman (NZPC), Trinh Le (Motu)

ii New Zealand Productivity Commission Working Paper 2015/2
New Zealand Productivity Commission Working Paper: Measuring the innovative activity of New Zealand firms
Date: June 2015
JEL classification: O32 - Management of Technological Innovation and R&D; O38 - Government Policy
ISBN: 978-0-478-44011-9 (online only)
This paper was produced under the Productivity Partnership programme, part of the Productivity Hub.
Acknowledgements: We thank Paul Conway, Sally Davenport, Geoff Lewis, Lisa Meehan, Patrick Nolan, Murray Sherwin, and Guanyu Zheng (NZPC), Richard Fabling (Statistics New Zealand), Adam Jaffe (Motu), Sharon Pells (MBIE), Lynda Sanderson (Treasury), and Beth Webster (Swinburne University) for their comments on earlier drafts of this paper. We also thank Richard Fabling for sharing his code used to extract the data from the Statistics New Zealand servers. All errors are the responsibility of the authors.
How to cite this document: Wakeman, S. & Le, T. (2015). Measuring the innovative activity of New Zealand firms, New Zealand Productivity Commission Working Paper 2015/2, New Zealand Productivity Commission and Motu Economic and Public Policy Research.
Disclaimer: The opinions, findings, recommendations and conclusions expressed in this paper are those of the authors, not Statistics New Zealand or the New Zealand Productivity Commission.
The results in this paper have been created for research purposes from the Integrated Data Infrastructure (IDI) managed by Statistics New Zealand and are not official statistics. Access to the anonymised data used in this study was provided by Statistics New Zealand in accordance with security and confidentiality provisions of the Statistics Act 1975. Only people authorised by the Statistics Act 1975 are allowed to see data about a particular person, household, business or organisation and the results in this paper have been confidentialised to protect these groups from identification. Careful consideration has been given to the privacy, security and confidentiality issues associated with using administrative and survey data in the IDI. Further detail can be found in the privacy impact assessment for the IDI available from www.stats.govt.nz.
The results are based in part on tax data supplied by Inland Revenue to Statistics New Zealand under the Tax Administration Act 1994. This tax data must be used only for statistical purposes, and no individual information may be published or disclosed in any other form, or provided to Inland Revenue for administrative or regulatory purposes. Any person who has had access to the unit-record data has certified that they have been shown, have read, and have understood section 81 of the Tax Administration Act 1994, which relates to secrecy. Statistics NZ confidentiality protocols were applied to the data sourced from the Ministry of Business, Innovation and Employment. Any discussion of data limitations or weaknesses is in the context of using the IDI for statistical purposes, and is not related to the data's ability to support these government agencies' core operational requirements.
Information on the Productivity Commission can be found on www.productivity.govt.nz or by contacting +64 4 903 5150.

Measuring the innovative activity of New Zealand firms 1
Abstract International comparisons suggest that, although the New Zealand public sector invests considerable resources into scientific research, New Zealand firms are not particularly effective at generating applied knowledge and even less so at turning it into commercial products. However, these findings are based on aggregate data and there is limited evidence on innovative activity at the firm level. This paper provides an overview of measures that capture both the inputs into and outputs from the innovative activities of New Zealand firms, using data on firm-level innovation from 2005 to 2013 available from Statistics New Zealand’s Longitudinal Business Database. The paper finds that the various measures tell different stories about the pattern of innovative activity across New Zealand firms. Notably, R&D expenditure and intensity are only weakly correlated with, and display different patterns to, measures of innovative output. For example, different types of innovation output occur in firms that do not report any investment in R&D. Accordingly, to get a full picture of the innovative activity of New Zealand firms, it is necessary to use multiple measures to get a broader picture.

2 New Zealand Productivity Commission Working Paper 2015/2
Contents Abstract ................................................................................................................................... 1
Overview ................................................................................................................................. 3
1 Introduction .................................................................................................................... 4
2 Measuring innovation ..................................................................................................... 5 2.1 Defining innovation .............................................................................................................. 5 2.2 Proxies for innovation ........................................................................................................... 5 2.3 Conclusion ............................................................................................................................. 7
3 Existing literature on the innovative performance of New Zealand firms ....................... 9 3.1 Innovation indices ................................................................................................................. 9 3.2 Innovation rates by specific measures ............................................................................... 12 3.3 Characteristics of innovating firms..................................................................................... 14 3.4 Conclusion ........................................................................................................................... 14
4 Innovation activity ........................................................................................................ 16 4.1 Data sources and variables ................................................................................................ 16 4.2 Innovation rates by different measures ............................................................................. 18 4.3 Innovation rates by firm characteristics ............................................................................. 24 4.4 Firm persistence in innovation over time .......................................................................... 30
5 Discussion ..................................................................................................................... 34
Appendix A Additional tables ........................................................................................ 37
References ............................................................................................................................. 50
Tables Table 2.1: Alternative measures of innovation: Strengths and weaknesses .......................................... 8 Table 4.1: Data coverage of various sources of information on innovation ........................................ 17 Table 4.2: Correlation matrix of innovation indicators .......................................................................... 23 Table 4.3: Conditional innovation rates by firm characteristics (from regression on all
characteristics) .................................................................................................................. 28 Table 4.4: Mean persistence scores for each innovation indicator conditioned on firm
characteristics (from regression) ...................................................................................... 33 Table A.1: Within-industry correlation matrix of innovation indicators ............................................... 37 Table A.2: Correlation matrix of innovation indicators (R&D-active firms only) .................................. 39 Table A.3: Unconditional innovation rates by firm characteristics (mean probabilities/rates with
standard errors) ................................................................................................................ 40 Table A.4: Conditional innovation rates by firm characteristics (predictive margins with standard
errors) ................................................................................................................................ 42 Table A.5: Comparison of means for full sample vs. firms with IR10 data ........................................... 45 Table A.6: Comparison of means for firms in full BOS sample vs. innovation panel .......................... 46 Table A.7: Mean persistence scores for each innovation indicator conditioned on firm
characteristics (with standard errors) .............................................................................. 47
Figures Figure 3.1: New Zealand’s average ranking in top-level categories of OECD innovation indices .... 10 Figure 3.2: New Zealand’s ranking in top-level categories of the Global Innovation Index .............. 11 Figure 3.3: Rates of innovation activity for selected countries ............................................................. 12 Figure 4.1: Innovation rates by different measures (2005-2013) ........................................................... 19 Figure 4.2: Table of firm persistence in innovation by measure .......................................................... 31

Measuring the innovative activity of New Zealand firms 3
Overview
Key points
The proportion of New Zealand firms engaged in innovation ranges from 0.2% to 40%, depending on how innovation is measured.
There is fairly high overlap (i.e., correlation) between the different measures of innovation output, but firm-level measures of R&D intensity are only very weakly correlated with the innovation output measures.
Both the proportion of firms engaging in R&D activity and R&D intensity have increased over time while the share of firms filing trademarks and patents has been constant. However, innovation output rates of New Zealand firms have decreased since 2005, suggesting that the productivity of New Zealand firms in converting innovation inputs into outputs may have fallen.
Young firms (<5 years) are more likely than older firms to introduce new goods and services and marketing methods, and have a higher percentage of sales from new goods and services. This is consistent with international evidence that new firms often bring innovations to market. However, new firms in New Zealand are no more likely than old firms to be engaged in R&D or to introduce new operational or organisational processes.
Firms with foreign ownership and firms that are exporting are more likely to be innovating across both input and output measures.
Firms in the manufacturing sector are more likely to introduce new goods and services, but firms in the services sector are just as or more likely to introduce new organisational processes and marketing methods.
R&D intensity shows similar patterns to other innovation measures with respect to firm size and exporting status, but different patterns across time, and with respect to firm age, region and industry.
There is higher persistence over time in the set of firms that do R&D and file patents than in the set that report introducing innovative outputs. This indicates that there is a small and relatively stable set of R&D-active firms, but a much larger and more distributed set of firms that introduce innovative outputs.
4 New Zealand Productivity Commission Working Paper 2015/2
1 Introduction There is a popular perception in New Zealand that New Zealanders are internationally renowned for ingenuity and innovation.1 However, this view is not fully supported by the available evidence. According to the Global Innovation Index 2013 Report (Dutta, 2013), New Zealand ranks 6th in the world in academic publishing rates2 but only 26th in the impact of that research3 and 18th in patenting rates.4 New Zealand is even further down the rankings in terms of commercialising innovation - 31st in the OECD in business expenditure on research and development (OECD, 2012). Hence, these statistics suggest that, although New Zealand may be quite productive in generating scientific publications, upstream input does not necessarily flow through to downstream innovation.
Aggregate statistics such as these have been used as part of the explanation for New Zealand’s relatively low productivity and also to motivate policy responses to address it. Using cumulative business research and development expenditure (BERD) as a rough and partial proxy for knowledge-based capital, de Serres, Yashiro, and Boulhol (2014) argue that as much as 40% of New Zealand’s unexplained productivity gap may be the result of a low investment in knowledge-based capital. At the same time, the New Zealand Government has committed to “Creating the right business environment and incentives to encourage New Zealand’s business sector to double their expenditure on R&D to more than 1% of GDP by 2018” (New Zealand Government, 2014). However, prior research suggests there is uncertainty in the way BERD is measured (Fabling, 2008) and the drivers of New Zealand’s low levels (Di Maio & Blakeley, 2004; Mazoyer, 1999).
Although the aggregate data suggests that investment in innovation by New Zealand firms is relatively low, there is limited recent analysis of innovative activity at the firm level. To broaden our understanding of innovation by New Zealand firms, this paper provides an overview of the firm-level data on the innovative activity of New Zealand firms from 2005 to 2013. Specifically, the paper seeks to provide evidence on the following broad questions:
1. What firm-level measures of innovation by New Zealand firms are available?
2. What is the relationship between these various measures of innovation?
3. How do innovation rates according to these different measures vary by firm characteristics?
4. To what extent is the overall innovation rate driven by a specific set of New Zealand firms that innovate repeatedly over time?
We address these questions using Statistics New Zealand’s Longitudinal Business Database (LBD). The LBD draws on information from tax records, merchandise and services trade data, a variety of surveys on business practices and outcomes, patenting and trademark activity, and government programmes to construct an annual record of information on firms' demographic characteristics, financial data, input, output, R&D activity, innovative activity and participation in government programmes. (See Fabling, 2009, for a description.) Such broad data coverage provides valuable insights into the innovative activity of New Zealand firms and the characteristics of innovative firms. It also carries considerable potential for research to improve the effectiveness of government interventions aimed at lifting the innovative performance of New Zealand firms.
It is important to emphasize that this paper does not present any evidence about what causes New Zealand firms to be more innovative, or how innovation affects firm performance. Instead, it’s more modest aim is to provide a catalogue of the various ways in which innovation can be measured using information available in New Zealand’s Longitudinal Business Database and provide a platform on
1 See for instance http://media.newzealand.com/en/story-ideas/great-kiwi-inventions/ 2 Measured by publications in the top-quartile journals per GDP. NZ ranks similarly in OECD (2012) rankings. 3 Measured using the “citable documents H index” (Dutta, 2013). 4 Measured by PCT applicants per GDP (Dutta, 2013). OECD (2012) ranks New Zealand 19th in terms of triadic patent families per GDP.
Measuring the innovative activity of New Zealand firms 5
which future research can build. This paper is the first in a series of Productivity Commission/Motu Economic and Public Policy Research papers on innovation. In subsequent research we will examine the relationship between these innovation indicators and firm performance such as revenue and productivity.
Section 2 sets out the different ways in which firm-level innovation is measured. Section 3 describes what prior research has found about innovation by New Zealand firms using these and other measures. Section 4 describes the results of our analysis using the LBD. Section 5 discusses the issues these findings raise about how to measure the innovative activity of New Zealand firms.
2 Measuring innovation
2.1 Defining innovation
The Oslo Manual (OECD, 2005) defines innovation as “the implementation of a new or significantly improved product (good or service), or process, a new marketing method, or a new organisational method in business practices, workplace organisation or external relations”. This highlights that innovation involves not only the generation of new knowledge – invention or discovery – but also applying that new knowledge to meet a market need. Moreover, the Oslo Manual definition emphasises that innovation also encompasses new methods of production (process innovation), new ways of organising or managing the firm (organisational innovation), and new ways of opening up new opportunities (market innovation).
2.2 Proxies for innovation
There are a number of ways to measure innovation, all of which have different strengths and weaknesses. Table 2.1 summarises the strengths and weaknesses of these alternative innovation measures.
Responses to manager surveys A number of innovation studies use the results of innovation surveys following the approach developed by researchers over a number of years and now prescribed in the Oslo Manual (OECD, 2005). These surveys require managers to rate or quantify the firm’s innovative activities during a defined time period based on actions such as introducing new goods and services or operational processes; share of sales from innovative products; and R&D expenditure.
In New Zealand, the annual Business Operations Survey (BOS) includes a few questions about innovation and R&D expenditure, and every two years the survey includes a full innovation module that asks a range of questions about innovation-related issues.5 The majority of questions ask for binary responses (e.g., “did this business introduce onto the market any new or significantly improved goods or services?). However, the questionnaire also asks the firm to estimate some continuous innovation measures, in particular “the percentage of sales for this business that came from those new or significantly improved goods or services” or “for the last financial year, how much did this business spend on R&D activities?”6
The strength of innovation surveys is that they capture innovation activity more directly than any data collected for administrative purposes (such as intellectual property filings, R&D declared for tax, etc.). They also collect information about changes that would be very difficult if not impossible to identify
5 The BOS is administered annually to a sample of firms designed to be representative of the population of New Zealand firms with six or more employees, with between 5500 and 7000 useable responses. The core BOS (module A) contains one question about innovation activity - specifically “In the last financial year, did this business develop or introduce any new or improved goods and services, operational processes, organisational or managerial processes, or marketing methods?” Every two years BOS includes an additional module (B) on innovation specifically, containing a range of questions about the different types of innovation individually, the level of novelty (i.e., whether a good and service was new to the firm, new to New Zealand, or new to the world), the activities that supported innovation, the sources of ideas, etc. 6 An alternative way to measure innovation from manager surveys is to collect direct information on practices and then using measured changes in those practices as measures of innovation. In the case of organisational innovation in New Zealand, there is work that measures rates and correlates of adoption of various HR practices (Fabling & Grimes, 2010, 2014).

6 New Zealand Productivity Commission Working Paper 2015/2
from administrative data such as changes in organisation processes and marketing methods. Furthermore, as the methods for collecting these data have developed and been standardised internationally (via the Oslo Manual), survey-based measures of innovation can also be temporally and internationally comparable.
Nevertheless, innovation surveys conducted by the Oslo Manual approach also suffer from a number of limitations. Because the firm is used as the unit of analysis, survey information does not measure the level or rate of innovation per se. Instead, it tells us the number of innovating firms or the average rate of (for instance) sales from new goods and services across firms. Also, survey responses are to some extent subjective - e.g., requiring judgement about whether a change is new or significantly improved enough to constitute an innovation, etc. Furthermore, the Oslo Manual approach favours product development (and hence product or process innovations), the rate of which varies systematically across industries. Finally, although in principle the methods have been standardised by the Oslo Manual, in practice there are differences in definitions, methodology, population, and collection methods that make it difficult to compare across countries (Statistics New Zealand, 2012).
Counts of IP filings There are a number of legal mechanisms available to innovators to protect an innovation, including patents, trademarks, copyright, and registered designs. Each of these mechanisms protects a different aspect of innovation. The process for obtaining protection is also different. For patents, trademarks, and registered designs the innovator must apply to the government agency, while copyright applies automatically (i.e., even without an application). Hence, the first three leave a paper trail that researchers can use for measuring innovative activity.
The number of patented inventions (either filed or issued), or now more commonly the number of patented inventions weighted by the number of citations to that patent by subsequent patents, is a common measure of innovation performance used in academic research (Griliches, 1981; A. B. Jaffe & Trajtenberg, 2002). The advantage of this measure is that not only is it possible to count inventions but also to gauge their technological importance. The number of citations to a patent captures how often subsequent (patented) inventions touch on the technology covered in the cited patent, and hence reflects the subsequent technological impact of the cited invention. Moreover, once a benchmark is specified (e.g., an application filed under the Patent Cooperation Treaty (PCT) or a “triadic patent family”7), it is possible to make comparisons across countries.8
However, the number of patent applications provides only a partial, intermediate measure of innovation. To meet the threshold for filing a patent, let alone a PCT application or a triadic patent family, the invention must be of sufficient expected importance and commercial value, and so excludes a number of less commercially significant innovations. Moreover, not all inventions are patentable (e.g., business practices), and the use of patents varies by industry. In those industries where patents provide the primary means for protecting invention, such as chemicals and pharmaceuticals (Cohen, Nelson, & Walsh, 2000), a patent application may be a good indicator of innovation. However, in semiconductor manufacturing and several other industries a single innovation needs a suite of patents to protect it (Somaya, Teece, & Wakeman, 2011). Meanwhile, in a further set of industries, patents are rarely used, and instead innovators keep the innovation secret or use other, non-legal means of protection.
As a result, counting patent filings may underestimate the number of innovations in some cases and overestimate it in others. Furthermore, although patents signify the existence of an invention, further steps are required to turn that invention into an innovation with market value, including product development, manufacturing, and marketing.
7 A triadic patent family is a set of corresponding patents filed in the European Patent Office (EPO), Japan Patent Office (JPO) and United States Patent and Trademark Office (USPTO) for the same invention by the same applicant or inventor (http://en.wikipedia.org/wiki/Triadic_patent). 8 Prior to the Patents Act 2013, which passed into law on 13 September 2013 and came into force on 1 September 2014, novelty was measured relative only to other material published in New Zealand, so it was possible to patent inventions even if they were already known in other jurisdictions. Under the new regime, examiners may consider matter published or used in New Zealand or elsewhere. This change brought New Zealand law in line with other jurisdictions, including the US, Europe, and Japan, which had begun considering foreign material many years earlier.
Measuring the innovative activity of New Zealand firms 7
Trademark registrations are sometimes used as a measure of innovation (Greenhalgh & Rogers, 2007; Millot, 2009). Trademarks are typically associated with new product introductions, and hence may provide a proxy for product innovations new to the firm or the local market. There are also lower costs and limited novelty requirements associated with registering trademarks so they are likely to pick up a greater number of innovations than patents. Furthermore, they not only apply to technological innovations, but also cover innovations in the service sector, which distinguishes them from patent applications.
Business expenditure on R&D Outside academia, the measure perhaps most widely used to proxy for innovation is R&D expenditure. There is clearly a link between investment in R&D and knowledge creation. International research has established that there is a strong correlation between R&D expenditure on the one hand and both firm productivity (Griliches, 1994) and other aspects of firm performance (Hall, Mairesse, & Mohnen, 2009) on the other. It has also shown that R&D expenditure is correlated with other innovation measures (Crepon, Duguet, & Mairesse, 1998). Investment in R&D is also one way of building the ‘absorptive capacity’ that enables a firm to incorporate innovation from elsewhere (Cohen & Levinthal, 1989; Griffith, Redding, & Van Reenen, 2004).
R&D expenditure is an input into – and not an output from – innovation, and so by definition does not reflect the efficiency of organisations in turning R&D into innovation. Measured R&D expenditure is also only one type of spending on innovation that largely excludes expenditure on organisational and marketing innovations. Furthermore, the lack of mandatory reporting for R&D precludes systematic data collection, and what and whether it is reported depends on a firm’s strategic motives (Jensen & Webster, 2009). Tax incentives to encourage R&D (e.g., tax credits) are likely to increase the reporting of R&D and may lead firms to overstate it in order to benefit from the tax savings.
2.3 Conclusion As the discussion above highlights, all measures of innovation suffer from limitations. Each one proxies for a particular aspect of innovation through some other variable. This suggests that ultimately the best we can do is examine multiple indicators, each of which captures a different aspect of innovation, and then comparing the results from the different indicators in making an argument or coming to a conclusion.

8 New Zealand Productivity Commission Working Paper 2015/2
Table 2.1: Alternative measures of innovation: Strengths and weaknesses
Measure Source Strengths Weaknesses
Introduced goods/services new to New Zealand/ the world (self-reported)
Introduced other types of innovation (self-reported)
BOS Measures innovation output
Internationally standardised questions (as per Oslo Manual)
Self-reported ⇒ Responses affected by organisation and cultural
Does not measure overall rate of innovation (because firm is unit of analysis)
Differences in definitions, methodology, population, and collection methods across countries
Filed patent application(s)
Intellectual Property Office of New Zealand (IPONZ)
Reflects technological importance
Enables international benchmarking (e.g., PCT filing, triadic families)
Not all inventions are patentable/worth patenting; use of patents varies by industry; single innovation may involve multiple patents
Excludes less commercially significant innovations (due to financial barriers) and provides only limited information on the commercial value
Registered trademark IPONZ Associated with new product introductions ⇒ represents market need
Filed on product introductions ‘new to the country’ (cf. ‘new to the world’)
R&D expenditure (self-reported)
BOS Correlated with productivity and firm performance (Hall et al., 2009)
Does not reflect organisation’s efficiency in turning R&D into innovation
Only one type of spending on R&D/innovation
R&D expenditure declared to Inland Revenue
IR10 Available for large set of firms Does not include salaries and wages, etc.
Firms filing IR10 non representative of population (mainly smaller firms)
Received R&D grant Ministry of Business, Innovation and Employment (MBIE) government assistance programme
Associated with R&D activity
Potentially further information collected at time of grant
Only a subset of firms apply for and/or receive grants

Measuring the innovative activity of New Zealand firms 9
3 Existing literature on the innovative performance of New Zealand firms
This section summarises the existing literature on the innovative performance of New Zealand firms. The review highlights both what the literature says and what it does not say about the drivers of innovation by New Zealand firms.
3.1 Innovation indices
In 2012 the OECD published a report on the “Comparative performance of national science and innovation systems”, which presents aggregate statistics across 43 OECD and non-OECD countries.9 The latest report (OECD, 2012) ranks New Zealand in the top half of these countries in 15 out of 22 of the indicators. In particular, New Zealand ranks first in the top 500 universities per GDP, second in percentage of 15-year-old top performers in science, and fifth in trademarks per GDP.
The OECD does not aggregate these statistics into a single index. However, when the indicators are grouped into top-level categories, the results show that New Zealand does better in the innovation input measures (science base, human resources, and internet use) than in those that capture converting inputs into outputs (knowledge flows and commercialisation, business R&D and innovation, and entrepreneurship). Figure 3.1 presents New Zealand’s average ranking in the OECD’s top-level categories.
9 The measures include indicators of the science base (public R&D expenditure, top 500 universities, etc.); business R&D and innovation (business R&D expenditure, triadic patent families, etc.); entrepreneurship (venture capital, ease of entrepreneurship, etc.); internet use (broadband subscribers, e-government readiness, etc.); knowledge flows and commercialisation (industry-financed public R&D, international co-authorship/co-patenting, etc.); and human resources related to innovation (science and engineering PhDs, science and technology occupations in total employment).

10 New Zealand Productivity Commission Working Paper 2015/2
Figure 3.1: New Zealand’s average ranking in top-level categories of OECD innovation indices
Source: OECD (2012). Comparative performance of national science and innovation systems.
Since 2007, Soumitra Dutta has published an annual Global Innovation Index that ranks 142 countries across a range of measures. The ranking is based on a compilation of 84 individual measures considered to be related to innovation, ranging from political stability to video uploads on YouTube (per population aged 15–69). In 2013, New Zealand was ranked 17th overall, down from 13th in 2012 (Dutta, 2013). In the major categories, New Zealand ranks highest in institutions (3rd), followed by market sophistication (12th), creative outputs (13th), human capital and research (16th), infrastructure (26th), business sophistication (28th), and knowledge and technology outputs (29th). Figure 3.2 presents New Zealand’s ranking in the top-level categories of the Global Innovation Index.
7
11
12
20
19
26
1
6
11
16
21
26
31
Science base Human resourcesInternet use for
innovationBusiness R&D and
innovationKnowledge flows and
commercialisation EntrepreneurshipOECDranking

Measuring the innovative activity of New Zealand firms 11
Figure 3.2: New Zealand’s ranking in top-level categories of the Global Innovation Index
Source: Dutta (2013). INSEAD/Cornell Global Innovation Index.
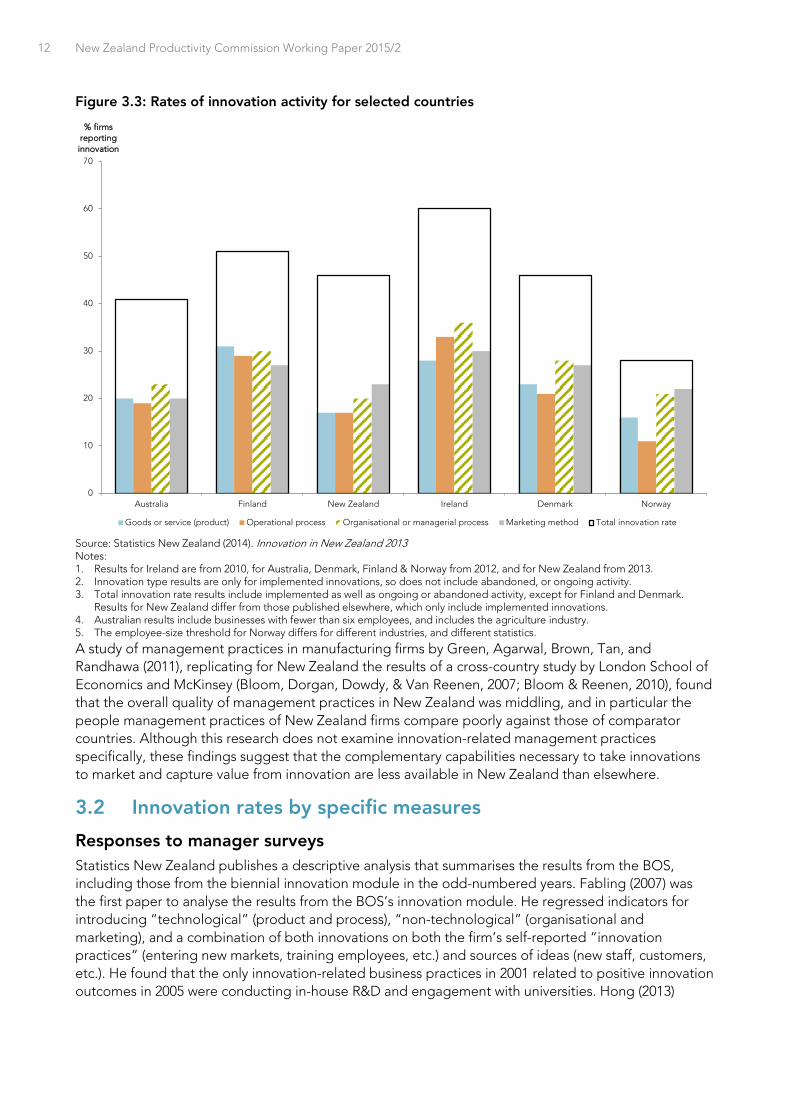
In a report titled “Innovation in New Zealand”, Statistics New Zealand compares the results from the BOS to similar surveys in Australia, Denmark, Finland, Ireland, and Norway. The latest report (Statistics New Zealand, 2014) shows that New Zealand’s rate of innovation is similar or above Norway across the range of output measures but below the other countries (with the exception of marketing methods vs. Australia).10 Figure 3.3 presents the results. However, in an earlier report Statistics New Zealand (2012) stated that differences in population scope, methodologies, and reporting periods limit direct comparisons, even with Australia.11
10 The employee-size threshold for Norway differs for different industries, and different statistics. 11 For instance, the New Zealand figure only includes businesses with six or more employees, while the Australian figure also includes businesses with 0–5 employees. New Zealand data suggest that smaller businesses have lower innovation rate on the binary indicators and if the same pattern applies in Australia then including the smallest businesses (0–5 employees) would lower the average innovation rate. Moreover, the differences in definitions, methodology, population, and collection methods are even greater to other countries beyond Australia, making comparisons even more difficult. The notes list some specific differences in definitions, methods, etc.
3
16
26
12
2829
13
1
6
11
16
21
26
31
InstitutionsHuman capital &
research Infrastructure Market sophisticationBusiness
sophisticationKnowledge &
technology outputs Creative outputsGII
ranking
12 New Zealand Productivity Commission Working Paper 2015/2
Figure 3.3: Rates of innovation activity for selected countries
Source: Statistics New Zealand (2014). Innovation in New Zealand 2013 Notes: 1. Results for Ireland are from 2010, for Australia, Denmark, Finland & Norway from 2012, and for New Zealand from 2013. 2. Innovation type results are only for implemented innovations, so does not include abandoned, or ongoing activity. 3. Total innovation rate results include implemented as well as ongoing or abandoned activity, except for Finland and Denmark.
Results for New Zealand differ from those published elsewhere, which only include implemented innovations. 4. Australian results include businesses with fewer than six employees, and includes the agriculture industry. 5. The employee-size threshold for Norway differs for different industries, and different statistics.
A study of management practices in manufacturing firms by Green, Agarwal, Brown, Tan, and Randhawa (2011), replicating for New Zealand the results of a cross-country study by London School of Economics and McKinsey (Bloom, Dorgan, Dowdy, & Van Reenen, 2007; Bloom & Reenen, 2010), found that the overall quality of management practices in New Zealand was middling, and in particular the people management practices of New Zealand firms compare poorly against those of comparator countries. Although this research does not examine innovation-related management practices specifically, these findings suggest that the complementary capabilities necessary to take innovations to market and capture value from innovation are less available in New Zealand than elsewhere.
3.2 Innovation rates by specific measures
Responses to manager surveys Statistics New Zealand publishes a descriptive analysis that summarises the results from the BOS, including those from the biennial innovation module in the odd-numbered years. Fabling (2007) was the first paper to analyse the results from the BOS’s innovation module. He regressed indicators for introducing “technological” (product and process), “non-technological” (organisational and marketing), and a combination of both innovations on both the firm’s self-reported “innovation practices” (entering new markets, training employees, etc.) and sources of ideas (new staff, customers, etc.). He found that the only innovation-related business practices in 2001 related to positive innovation outcomes in 2005 were conducting in-house R&D and engagement with universities. Hong (2013)
0
10
20
30
40
50
60
70
Australia Finland New Zealand Ireland Denmark Norway
% firmsreportinginnovation
Goods or service (product) Operational process Organisational or managerial process Marketing method Total innovation rate

Measuring the innovative activity of New Zealand firms 13
replicated Fabling’s analysis for 2005 with data for additional industries,12 and extended it to 2007 and 2009. Like Fabling, she found a positive relationship between whether a firm had R&D expenditure and whether it generated innovation output (across firms in the same year) but no relationship between the intensity of R&D expenditure and innovation output.
Counts of IP filings Crawford, Fabling, Grimes, and Bonner (2007) examine patenting (and business R&D) at the national level, seeking to explain New Zealand’s relatively low level of patenting activity. They find a relationship between the level of patenting and geographic distance from world markets and that after accounting for distance New Zealand’s patenting activity is higher than would be predicted.13 However, as the paper itself points out, while this is an interesting correlation, it does not provide evidence that New Zealand’s low patenting rate is caused by its remote location.
We are not aware of any analysis of innovation by New Zealand firms using firm-level IP data. Jiang and Sharp (2012) find that firms with patents have higher employment, revenue, value-added and labour productivity than firms without. However, they do not distinguish the effect of patenting from the effect of being more innovative or other firm characteristics, both of which likely to be correlated with both patenting and performance, and so cannot say whether obtaining patents actually increases the performance of New Zealand firms.
Business R&D expenditure As noted above, New Zealand consistently ranks below comparator countries in BERD per capita. Mazoyer (1999) benchmarks New Zealand’s R&D expenditure against ten other OECD countries using information on the manufacturing sector from OECD’s STAN database. She concludes that differences R&D intensity within industries provide a more important explanation than differences in industry structure.
Di Maio and Blakeley (2004) update this analysis using data from 2002, and also include data on primary and services sectors. They note that New Zealand is relatively unusual in that less than 40% of total R&D is funded by the business sector, while the OECD average is close to 70%. As for Mazoyer (1999), they find that New Zealand’s deficit in R&D expenditure relative to the OECD can be attributed to a combination of lower R&D intensity than the average within industries and a less R&D-intensive industry structure. They note that more than half the difference in R&D intensity within the existing structure is driven by the electrical equipment (including radio, TV, and communication) and the wood, paper and printing industries; the only industry in which New Zealand is more intensive than the OECD average is the (relatively non-intensive) financial information, computer and related activities (i.e., services).
Debski and Williams (2007) and Williams, Debski, and White (2008) study the measurement of New Zealand’s BERD. They argue that adjusting BERD intensity using industry-level purchasing power parity (PPP) rates the makes clearer the within-industry vs between-industry variations in BERD. After making this adjustment, they find that New Zealand’s level of BERD has a higher within-industry component than previously thought.
Fabling (2008) suggests that historically the level of BERD in New Zealand has been systematically underestimated. Correcting for this underestimation brings the historical levels closer to the current levels (at the time), but reduces the growth historically. Nevertheless, New Zealand’s level of BERD is still significantly below the levels of comparator countries.
12 Fabling (2007) dropped Electricity, Gas and Water Supply and Sport and Recreation industries to ensure consistency with the 2001 Business Practices Survey, against which he was comparing. 13 As discussed in footnote 8, historically New Zealand’s novelty requirements have been weaker than other jurisdictions and hence patents are not strictly comparable.
14 New Zealand Productivity Commission Working Paper 2015/2
3.3 Characteristics of innovating firms
Crawford et al. (2007) examine factors that predict BERD. They find a negative relationship between BERD per capita and geographic distance to major world markets, share of employment in primary industries, and share of employment in self-employment – all characteristics on which New Zealand has high scores. Fabling (2008) also presents correlates of BERD with firm characteristics, and finds that receiving government funding, being an exporter, having a relatively large market share, being in R&D intensive industries, having a lower debt to equity ratio, having higher retained profits, having performed R&D in the prior year, and foreign ownership are all correlated with the firm doing R&D. Neither paper claims that there is a causal relationship between these variables and BERD.
Both Hong, McCann, and Oxley (2013) and Oxley, Hong, and McCann (2013) also examine the relationship between innovation rates of New Zealand firms and a range of firm characteristics, regressing various combinations of the BOS innovation indicators on a set of characteristics of the firm and its environment. Hong et al. (2013) finds that employment count is positively correlated with introducing an operational process innovation but not with introducing a product innovation or a combination of the two (although new employment is positively correlated with the latter two variables). Based on their results Hong et al. (2013) argue that the small size of firms, the small size of the market, and the level of geographical isolation explain New Zealand’s the relatively poor performance in innovation.
Oxley et al. (2013) finds positive correlations between innovation and firm characteristics (firm size, high quality product, investment/R&D capability, major technology change, formal IP protection and new export markets) but no correlations between innovation and environmental characteristics (such as geography and market structure). They argue that “firm level innovations in New Zealand are highly dependent on the firms’ internal ability to develop new technologies and market demand” (page 20). Again, neither paper attempts to establish if the relationship that they observe are causal.
3.4 Conclusion
To summarise, the prior literature shows that New Zealand performs relatively well at the upstream end of the innovation process but performs relatively poorly as innovation progresses downstream. More specifically, New Zealand has relatively high scientific publishing rates and scores highly in terms of institutions that support innovation and is around the middle of the OECD in public R&D as a proportion of GDP (Dutta, 2013; OECD, 2012).
New Zealand does less well in generating innovation output. Business expenditure on R&D and patenting rates are low relative to other countries, but New Zealand firms apply for a high number of trademarks (OECD, 2012). The percentage of firms that report introducing new innovations in manager surveys appears similar to other countries, but differences in definitions, methods, etc. make comparisons difficult (Statistics New Zealand, 2012, 2014). Nevertheless, innovation indices consistently show that New Zealand ranks lower in the downstream activities such as entrepreneurship and proportion of output coming from knowledge/technology goods & services than in the upstream measures (Dutta, 2013; OECD, 2012).
Dissecting business R&D expenditure into its different parts reveals that the relatively low level of R&D intensity within industries provides a stronger explanation for New Zealand’s relatively low business expenditure than differences in industry structure (Di Maio & Blakeley, 2004; Mazoyer, 1999).
The most common explanations for the poor performance of New Zealand firms in R&D is New Zealand’s remote location/distance to major markets (Crawford et al., 2007) and the relatively small size of New Zealand firms (Hong et al., 2013). However, these papers do not establish a causal link between

Measuring the innovative activity of New Zealand firms 15
these factors and New Zealand’s innovation performance, and although these factors may be part of the explanation most likely the reasons are more complicated.
Comparing across firms, the prior literature shows correlations between exporting status, foreign ownership, market share, and being in a R&D-intensive industry and whether a firm is likely to be innovating (Fabling, 2008). The literature also shows that larger firms are more likely to engage in R&D and to innovate (Hong et al., 2013; Oxley et al., 2013), although again there is no evidence of a causal relationship between size and innovation.
In summary, while highlighting some interesting correlations, the prior literature does not tell us much about the drivers of New Zealand’s poor performance in innovation, or what might be done to remedy it. It is important to emphasize that this paper does not attempt to identify (econometrically) the drivers of innovation either. However it provides the platform on which future papers that attempt to identify the causal relationship both between the underlying characteristics and innovation and between innovation and firm performance can build.

16 New Zealand Productivity Commission Working Paper 2015/2
4 Innovation activity We now turn to our analysis of the various measures of innovative activity.
4.1 Data sources and variables
As described above, our data comes from the Longitudinal Business Database (LBD). A primary objective of this paper is to compare the range of measures for innovation available from within the LBD. We divide these into innovation output measures, intermediate innovation output measures (which we will shorten to intermediate measures), and innovation input measures.
The most direct measures of innovation outputs come from the Business Operations Survey (BOS), which is linked to the core longitudinal business frame (LBF). In our analysis we examine five indicators of innovation new to the firm: goods and services, operational processes, organisational or managerial processes, marketing methods, and any of the above. For goods & services in particular, we also include indicators of goods and services new to New Zealand and new to world (vs. new to the firm), and the percentage of sales that came from new goods & services.
The information on intermediate measures in LBD comes from patent applications, designs, and trademark registrations filed with the Intellectual Property Office of New Zealand (IPONZ). As discussed above, IP filings are only inputs into the innovation process in certain industries, and only reflect innovation of a certain type and sufficient degree. However in the appropriate circumstances they provide a useful intermediate indicator of innovation. Currently data on these variables is only available in the LBD up to 2009.
The core BOS also asks questions about the existence of R&D activity and the level of R&D expenditure. We use the answer to the binary R&D activity question as an indicator in our analysis. We also construct a measure of R&D intensity by dividing R&D expenditure by the firm’s total expenditure in the same year.14 The measure of total expenditure comes from either the firm’s IR10 or from its response to the Annual Enterprise Survey.15
The IR10 form, which is filed by about two-thirds of economically active firms, also includes a line item for R&D expenditure. However, the set of firms filing this form appears to be biased to smaller firms. Taxpayers that are “in business” have the option of filing either a set of their financial accounts or an “Accounts information” (IR 10) form, and smaller firms tend to opt for the latter. Moreover, the type of expenditure declared on IR10 appears to differ from the standard definition of R&D expenditure.16
14 The aggregate measure of R&D intensity used in international comparisons states R&D expenditure as a proportion of GDP. Hence the closest comparison would be a measure of firm output, such as revenue adjusted for changes in inventories, etc. However, because the benefits of R&D take time to be realised, output does not always occur in the same year as R&D expenditure and at a firm level such a measure can generate extreme values where R&D intensity is multiple times output in a number of cases. Moreover, revenue is endogenous: a firm with a good R&D programme will have successful programmes and hence more revenue than a firm with a mediocre R&D programme, making its R&D/output ratio lower. By comparison, expenditure is neutral with respect to the success of R&D in boosting sales. A further constraint is that the various data items necessary to calculate output are not available for a significant number of firms in the sample. Nevertheless, as a robustness check, we also constructed R&D intensity measure by dividing by firm sales (taken from Goods and Services tax records), which is closely related to output, and total employment (from Inland Revenue employment records), an arguably more stable measure of firm inputs. The two alternative measures are highly correlated with the measure of R&D intensity as a proportion of total expenditure. 15 As discussed in the following paragraph, about two-thirds of economically active firms complete the IR10, which collects information on total expenditure. At the same time, Statistics New Zealand collects information on total expenditure in the Annual Enterprise Survey (AES). The main objective of the AES is to provide representative data on financial performance and financial position, including total expenditure. However, because the sample is stratified by firm size, larger firms are disproportionately likely to be sampled and hence it complements – although not completely – the information collected on the IR10. Since the sources are different the measures of total expenditure is not strictly comparable to the R&D expenditure reported in the BOS, but it provides a fairly accurate measure. 16 R&D expenditure in the IR10 form is defined to include “farm development, drug development, machinery research and other scientific research and development”. However, there are separate line items for “depreciation”, “rates”, “rental and lease payments”, “repairs and maintenance”, “salaries and wages”, and “subcontractor payments”, so it is likely that firms allocate R&D-related expenditure falling under one of those categories to the other items.
Measuring the innovative activity of New Zealand firms 17
Furthermore, because there is no R&D tax credit in New Zealand (except for 2008-2009 year), there is no incentive to reclassify other expenses as “R&D expenses”. Hence arguably the R&D expenditure declared on the IR10 suffers from measurement error (Fabling, 2008). Nevertheless, the IR10 R&D expenditure variable should at least provide a reasonably good binary indicator of whether firms performed R&D in a given year (at least for those firms that file the IR10 form). Hence we use it to construct an alternative indicator of whether the firm engaged in R&D activity but do not rely on the actual value of R&D expenditure.17
The biennial R&D Survey collects a third measure of R&D expenditure. An advantage of the R&D Survey over BOS is that it asks respondents to estimate R&D expenditure across a range of items including wages & salaries, plant & equipment, etc. This not only gives additional information but may lead to more accurate reporting. Fabling (2007) compared R&D Survey and BOS responses for the sub-sample of firms that completed both forms and found that, at the micro level, BOS R&D figures are systematically lower than comparable R&D Survey figures. Nevertheless, he found a high correlation (0.872) between the logs of the two measures. The target population for the R&D survey only includes R&D-active firms so it is not representative of the whole population. As this primary objective of this paper is to describe the innovative activity of all New Zealand firms, we focus the BOS measure of R&D expenditure.
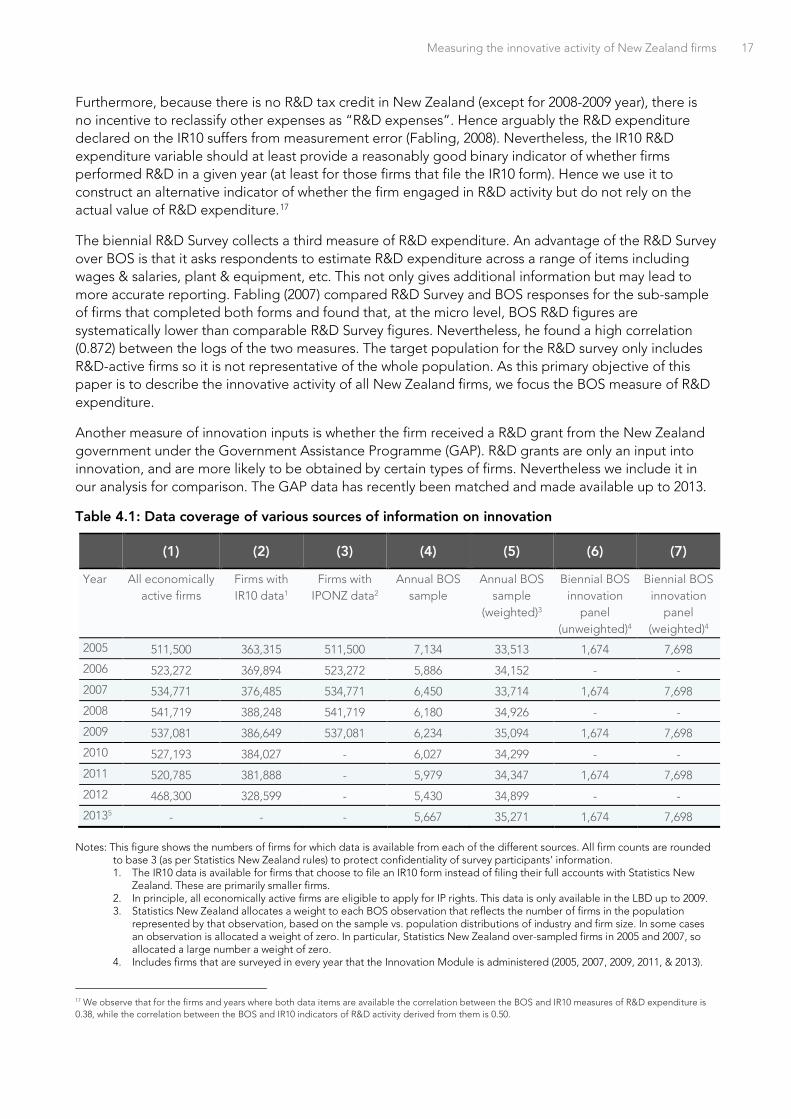
Another measure of innovation inputs is whether the firm received a R&D grant from the New Zealand government under the Government Assistance Programme (GAP). R&D grants are only an input into innovation, and are more likely to be obtained by certain types of firms. Nevertheless we include it in our analysis for comparison. The GAP data has recently been matched and made available up to 2013.
Table 4.1: Data coverage of various sources of information on innovation
(1) (2) (3) (4) (5) (6) (7)
Year All economically active firms
Firms with IR10 data1
Firms with IPONZ data2
Annual BOS sample
Annual BOS sample
(weighted)3
Biennial BOS innovation
panel (unweighted)4
Biennial BOS innovation
panel (weighted)4
2005 511,500 363,315 511,500 7,134 33,513 1,674 7,698
2006 523,272 369,894 523,272 5,886 34,152 - -
2007 534,771 376,485 534,771 6,450 33,714 1,674 7,698
2008 541,719 388,248 541,719 6,180 34,926 - -
2009 537,081 386,649 537,081 6,234 35,094 1,674 7,698
2010 527,193 384,027 - 6,027 34,299 - -
2011 520,785 381,888 - 5,979 34,347 1,674 7,698
2012 468,300 328,599 - 5,430 34,899 - -
20135 - - - 5,667 35,271 1,674 7,698 Notes: This figure shows the numbers of firms for which data is available from each of the different sources. All firm counts are rounded
to base 3 (as per Statistics New Zealand rules) to protect confidentiality of survey participants’ information. 1. The IR10 data is available for firms that choose to file an IR10 form instead of filing their full accounts with Statistics New
Zealand. These are primarily smaller firms. 2. In principle, all economically active firms are eligible to apply for IP rights. This data is only available in the LBD up to 2009. 3. Statistics New Zealand allocates a weight to each BOS observation that reflects the number of firms in the population
represented by that observation, based on the sample vs. population distributions of industry and firm size. In some cases an observation is allocated a weight of zero. In particular, Statistics New Zealand over-sampled firms in 2005 and 2007, so allocated a large number a weight of zero.
4. Includes firms that are surveyed in every year that the Innovation Module is administered (2005, 2007, 2009, 2011, & 2013).
17 We observe that for the firms and years where both data items are available the correlation between the BOS and IR10 measures of R&D expenditure is 0.38, while the correlation between the BOS and IR10 indicators of R&D activity derived from them is 0.50.
18 New Zealand Productivity Commission Working Paper 2015/2
5. The count of economically active firms in the LBD for 2013 is 158,136, but the data is still being updated and this count
clearly underreports the true number. However, there is no reason to believe that the size of the BOS sample (unweighted or weighted) is inaccurate.
Table 4.1 shows the number of firms for which data is available from each of the different sources. It shows that information from tax records and from IP filings is available for a lot more firms than the BOS survey data. However the IR10 data is only available primarily for smaller firms that choose to file an IR10 form instead of filing the full accounts with Statistics New Zealand and so is not representative. The data on IP filings is only available until 2009. By comparison, the BOS sample is representative of the larger, economically active firms. For the analysis that follows we use the sample of firms that responded to at least one of the biennial waves of the BOS from 2005 to 2013 – that is, the weighted sample shown in the odd years of column (5).
4.2 Innovation rates by different measures
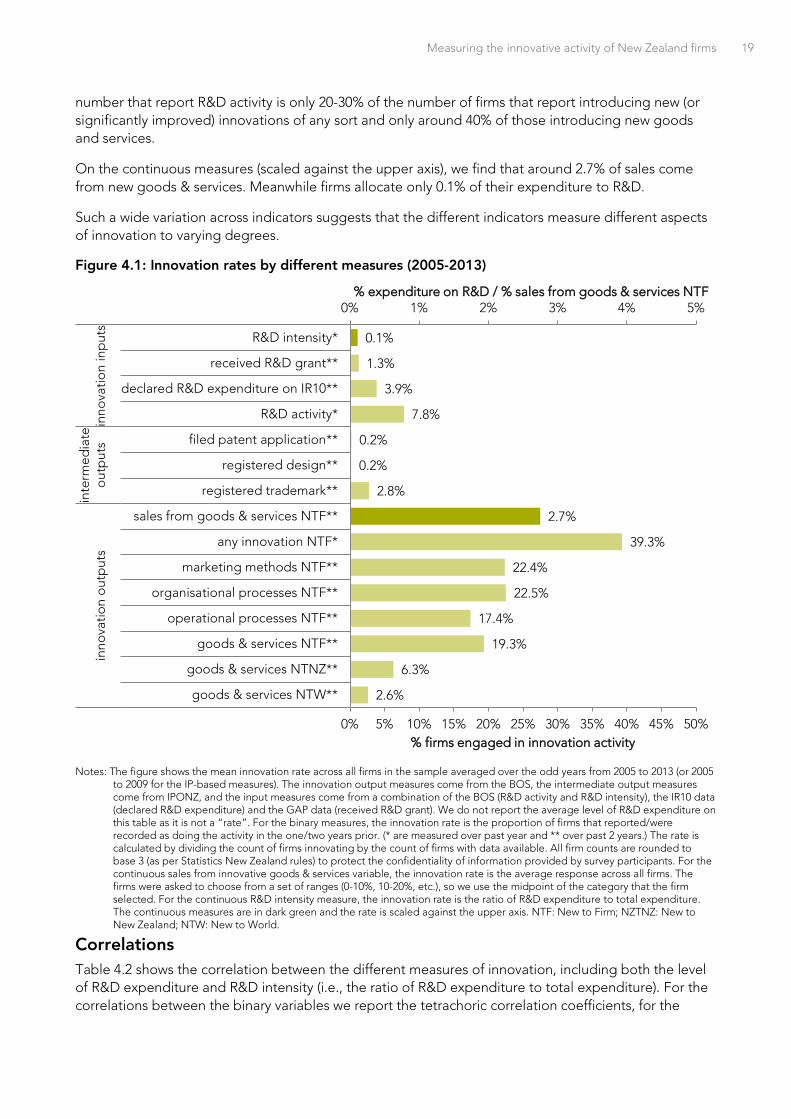
Levels Figure 4.1 shows the innovation “rate” by each of the measures. Since the BOS innovation module is only administered every second year, the survey questions ask about innovation in the two years prior. By contrast, the other measures – including the questions in the annual module A – correspond only to the past year. To enable comparison, for those other indicators for which we have annual data (i.e., IPONZ and GAP indicators) we construct a variable that captures whether the firm engaged in the activity over the past two years. However, because the BOS sample changes each year we are unable to create two-year measures of these indicators across the full sample. Hence we use the one-year indicators instead. Nevertheless, because these indicators have strong persistence over time (i.e., serial correlation), using the one-year indicators is unlikely to significantly affect the results.
The results show that, depending on how we measure it, the innovation rate ranges from around 0.2% (filing a patent application) to more than 40% of firms (introducing any type of innovation new to the firm). On the narrowest measure of innovation output – introducing good and services new to the world (developed by the firm or by the firm in partnership other firms) – only 2.6% of firms are engaged in this type of innovation. As we broaden the measure to include good and services new to New Zealand the proportion increases to around 6.3%, and including all goods and services generates a rate of 19.3%.
Looking across different types of innovation new to the firm, a similar proportion – around 17-22% – report to be introducing operational processes, marketing methods, and organisational processes, as are introducing goods and services, although a slightly larger proportion are introducing non-technological innovations (marketing methods and/or organisation processes) than technological innovations (goods and services or operational processes).
When we combine the four different types of innovation new to the firm to create a measure of innovation activity – the headline measure of innovation typically reported in innovation statistics – we observe that around 39% of firms are engaged in innovative activity of at least one type.
The “intermediate” and “input” indicators of innovation tell a different story. As discussed above, trademark registration is often considered a proxy for introducing new goods and services new to the firm. However, we see that only around 3% of firms registered a trademark, around the same level that introduced goods and services new to the world and well below the proportion that introduced goods and services new to the firm, all of which could potentially qualify for trademarks. Moreover, a much lower proportion of firms (0.2%) registered a design or applied for a patent.
Only 7.8% of firms report in the BOS that they are engaged in R&D activity, only 3.9% of firms that file an IR10 form declare any R&D expenditure, and around 1.3% of firms received an R&D grant. The
Measuring the innovative activity of New Zealand firms 19
number that report R&D activity is only 20-30% of the number of firms that report introducing new (or significantly improved) innovations of any sort and only around 40% of those introducing new goods and services.
On the continuous measures (scaled against the upper axis), we find that around 2.7% of sales come from new goods & services. Meanwhile firms allocate only 0.1% of their expenditure to R&D.
Such a wide variation across indicators suggests that the different indicators measure different aspects of innovation to varying degrees.
Figure 4.1: Innovation rates by different measures (2005-2013)
Notes: The figure shows the mean innovation rate across all firms in the sample averaged over the odd years from 2005 to 2013 (or 2005
to 2009 for the IP-based measures). The innovation output measures come from the BOS, the intermediate output measures come from IPONZ, and the input measures come from a combination of the BOS (R&D activity and R&D intensity), the IR10 data (declared R&D expenditure) and the GAP data (received R&D grant). We do not report the average level of R&D expenditure on this table as it is not a “rate”. For the binary measures, the innovation rate is the proportion of firms that reported/were recorded as doing the activity in the one/two years prior. (* are measured over past year and ** over past 2 years.) The rate is calculated by dividing the count of firms innovating by the count of firms with data available. All firm counts are rounded to base 3 (as per Statistics New Zealand rules) to protect the confidentiality of information provided by survey participants. For the continuous sales from innovative goods & services variable, the innovation rate is the average response across all firms. The firms were asked to choose from a set of ranges (0-10%, 10-20%, etc.), so we use the midpoint of the category that the firm selected. For the continuous R&D intensity measure, the innovation rate is the ratio of R&D expenditure to total expenditure. The continuous measures are in dark green and the rate is scaled against the upper axis. NTF: New to Firm; NZTNZ: New to New Zealand; NTW: New to World.
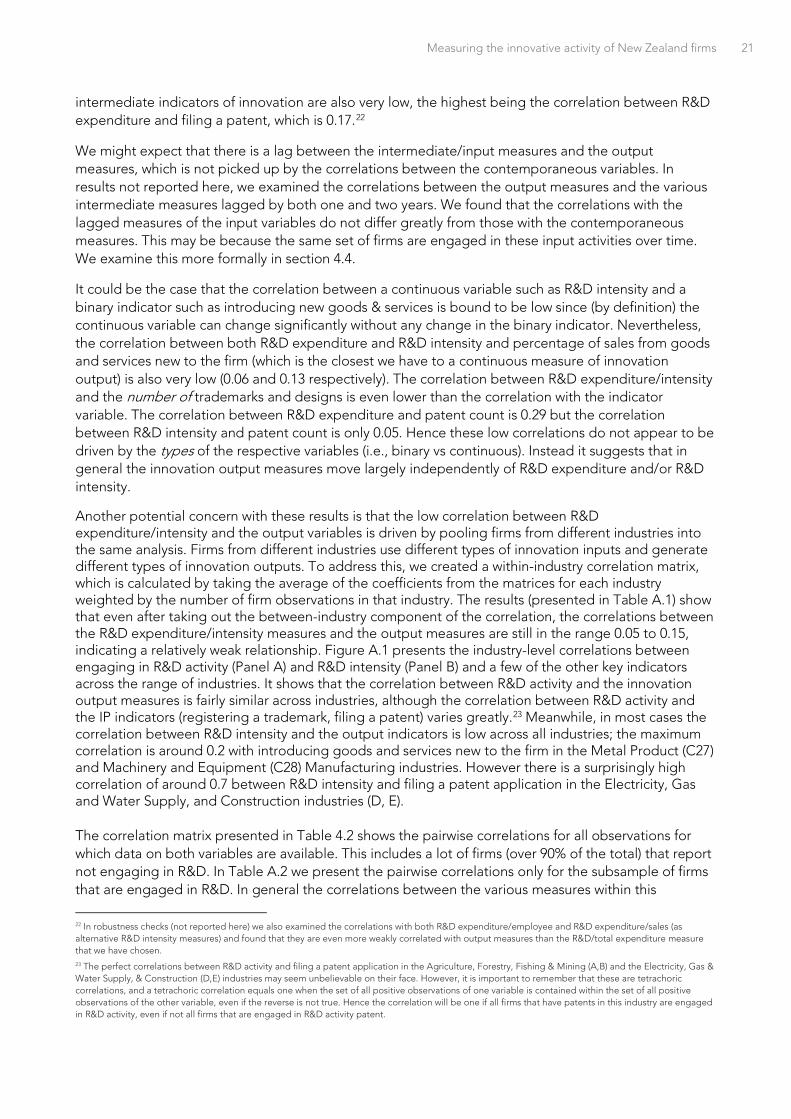
Correlations Table 4.2 shows the correlation between the different measures of innovation, including both the level of R&D expenditure and R&D intensity (i.e., the ratio of R&D expenditure to total expenditure). For the correlations between the binary variables we report the tetrachoric correlation coefficients, for the
2.6%
6.3%
19.3%
17.4%
22.5%
22.4%
39.3%
2.8%
0.2%
0.2%
7.8%
3.9%
1.3%
2.7%
0.1%
0% 1% 2% 3% 4% 5%
0% 5% 10% 15% 20% 25% 30% 35% 40% 45% 50%
goods & services NTW**
goods & services NTNZ**
goods & services NTF**
operational processes NTF**
organisational processes NTF**
marketing methods NTF**
any innovation NTF*
sales from goods & services NTF**
registered trademark**
registered design**
filed patent application**
R&D activity*
declared R&D expenditure on IR10**
received R&D grant**
R&D intensity*
inno
vatio
n o
utp
uts
inte
rmed
iate
out
put
sin
nova
tion
inp
uts
% expenditure on R&D / % sales from goods & services NTF
% firms engaged in innovation activity

20 New Zealand Productivity Commission Working Paper 2015/2
correlations between the one categorical variable (sales from new goods & services) and the binary variables we report the polychoric correlation coefficients, and for the correlations between the continuous variables (R&D expenditure and R&D intensity) and all other variables we report the Pearson correlation coefficients. All reported correlations are significantly different from zero.18
The correlation matrix reveals interesting information about the relationship between the different innovation measures. The correlations between the various BOS output indicators of innovation new to the firm range from 0.45 to 0.63, implying that although each indicator captures a different type of activity there is a considerable degree of overlap between the firms that engage in the different types. The percentage of sales from goods & services new to the firm is also quite strongly correlated with introducing the other types of innovation (0.40 to 0.51). The correlation coefficients for the correlation between introducing goods and services new to the world and the other types of innovation are smaller (0.29 to 0.36), although this is to be expected as the number of firms introducing goods and services new to the world is much smaller than those introducing goods and services new to the firm.
There is a stronger correlation between the binary intermediate output indicators (registering a trademark, filing for a patent, doing R&D) and introducing new good and services than with the other types of innovation output (introducing an operational process, organisational process or marketing method new to the firm). Moreover in most cases the input and intermediate output indicators are even more strongly correlated with introducing goods and services new to the world than with introducing goods and services new to the firm. This is consistent with the other types of innovation output not using the inputs measured by these various indicators.
Correlations between doing R&D and the other binary input/intermediate output indicators range from 0.41 to 0.67, indicating that there is a fairly strong overlap between the set of firms that are engaging in these different activities (e.g., patenting and doing R&D). The correlation between the BOS and IR10 measures of R&D activity (0.53) is much lower than we would expect if they were measuring the same activity.19 As noted above, the IR10 variable is available for only about two-thirds of the BOS sample so the sample used to calculate this correlation coefficient is different from that used to calculate the other correlation coefficients.20 This subsample is smaller and younger than the whole population, so excludes a number of firms that quite likely would report R&D under both measures, and this means the correlation coefficient will be biased down. Nevertheless, the relatively low correlation between these two variables also suggests that the IR10 measure is excluding a significant number of firms that are engaged in R&D activity.21
The correlation between both R&D expenditure and R&D intensity and all the output measures is very low (ranging from 0.03 with both operational and organisational processes new to the firm to 0.17 with good and services new to the world). The correlations between R&D expenditure/R&D intensity and the
18 The tetrachoric correlation, for binary data, and the polychoric correlation, for ordered-category data, are ways to measure what the correlation would be if the variables were sat on a continuous scale. They assume that the binary or ordered variable represents an underlying, normally distributed continuous latent variable. The tetrachoric correlation of a pair of binary variables equals one when the set of all positive observations of one variable is contained within the set of all positive observations of the other variable, even if the reverse is not true. For example, because all goods & services new to the world (NTW) are by definition new to the firm (NTF), the tetrachoric correlation is equal to one, even though not all goods & services new to the firm are new to the world. 19 For comparison, Fabling (2008) found a tetrachoric correlation of 0.669 between the BOS and IR10 responses to whether the firm engaged in R&D activity for 2005. 20 Table A.5 shows a comparison of means on the sample with IR10 vs. the whole sample, for both the complete set of firms in the LBD and for the BOS sample specifically. It reveals that the IR10 sample is significantly different from the full sample across the range of measures. In particular, the sample of firms with IR10 data are smaller (and younger) than the full population. It has better coverage in the manufacturing (C), retail (G), and hospitality (H) industries, but still only about 60% of the total. 21 In a separate analysis (not reported here) we found that (for those firms that report both) the correlation between the levels of R&D expenditure by the BOS and IR10 measures is around 0.37. Meanwhile the mean of R&D expenditure declared on BOS (c. $21,000) is 3 times the size of the R&D expenditure declared on the IR10 form (c. $6,700). The differences between two measures are outlined in section 4.1 above.
Measuring the innovative activity of New Zealand firms 21
intermediate indicators of innovation are also very low, the highest being the correlation between R&D expenditure and filing a patent, which is 0.17.22
We might expect that there is a lag between the intermediate/input measures and the output measures, which is not picked up by the correlations between the contemporaneous variables. In results not reported here, we examined the correlations between the output measures and the various intermediate measures lagged by both one and two years. We found that the correlations with the lagged measures of the input variables do not differ greatly from those with the contemporaneous measures. This may be because the same set of firms are engaged in these input activities over time. We examine this more formally in section 4.4.
It could be the case that the correlation between a continuous variable such as R&D intensity and a binary indicator such as introducing new goods & services is bound to be low since (by definition) the continuous variable can change significantly without any change in the binary indicator. Nevertheless, the correlation between both R&D expenditure and R&D intensity and percentage of sales from goods and services new to the firm (which is the closest we have to a continuous measure of innovation output) is also very low (0.06 and 0.13 respectively). The correlation between R&D expenditure/intensity and the number of trademarks and designs is even lower than the correlation with the indicator variable. The correlation between R&D expenditure and patent count is 0.29 but the correlation between R&D intensity and patent count is only 0.05. Hence these low correlations do not appear to be driven by the types of the respective variables (i.e., binary vs continuous). Instead it suggests that in general the innovation output measures move largely independently of R&D expenditure and/or R&D intensity.
Another potential concern with these results is that the low correlation between R&D expenditure/intensity and the output variables is driven by pooling firms from different industries into the same analysis. Firms from different industries use different types of innovation inputs and generate different types of innovation outputs. To address this, we created a within-industry correlation matrix, which is calculated by taking the average of the coefficients from the matrices for each industry weighted by the number of firm observations in that industry. The results (presented in Table A.1) show that even after taking out the between-industry component of the correlation, the correlations between the R&D expenditure/intensity measures and the output measures are still in the range 0.05 to 0.15, indicating a relatively weak relationship. Figure A.1 presents the industry-level correlations between engaging in R&D activity (Panel A) and R&D intensity (Panel B) and a few of the other key indicators across the range of industries. It shows that the correlation between R&D activity and the innovation output measures is fairly similar across industries, although the correlation between R&D activity and the IP indicators (registering a trademark, filing a patent) varies greatly.23 Meanwhile, in most cases the correlation between R&D intensity and the output indicators is low across all industries; the maximum correlation is around 0.2 with introducing goods and services new to the firm in the Metal Product (C27) and Machinery and Equipment (C28) Manufacturing industries. However there is a surprisingly high correlation of around 0.7 between R&D intensity and filing a patent application in the Electricity, Gas and Water Supply, and Construction industries (D, E). The correlation matrix presented in Table 4.2 shows the pairwise correlations for all observations for which data on both variables are available. This includes a lot of firms (over 90% of the total) that report not engaging in R&D. In Table A.2 we present the pairwise correlations only for the subsample of firms that are engaged in R&D. In general the correlations between the various measures within this
22 In robustness checks (not reported here) we also examined the correlations with both R&D expenditure/employee and R&D expenditure/sales (as alternative R&D intensity measures) and found that they are even more weakly correlated with output measures than the R&D/total expenditure measure that we have chosen. 23 The perfect correlations between R&D activity and filing a patent application in the Agriculture, Forestry, Fishing & Mining (A,B) and the Electricity, Gas & Water Supply, & Construction (D,E) industries may seem unbelievable on their face. However, it is important to remember that these are tetrachoric correlations, and a tetrachoric correlation equals one when the set of all positive observations of one variable is contained within the set of all positive observations of the other variable, even if the reverse is not true. Hence the correlation will be one if all firms that have patents in this industry are engaged in R&D activity, even if not all firms that are engaged in R&D activity patent.

22 New Zealand Productivity Commission Working Paper 2015/2
subsample are lower, and for most of the other variables the correlations are very similar to those over the whole sample (within 0.02). The one notable exception is the correlation between R&D intensity and percentage of sales from goods & services new to the firm, which is 0.20 (cf 0.13 in the whole sample). Although the correlation coefficient is still relatively low, it suggests that R&D intensity is a better proxy for innovation output when we look just at the subsample of R&D-active firms only than when we look across the population of New Zealand firms as a whole.
Overall, these results point to a much lower correlation between R&D expenditure/intensity and innovation output than we might expect if innovation followed a linear process of translating R&D into innovation output that is often implicitly assumed in research and policy.24 We even see a weak correlation between R&D expenditure/intensity and those types of innovation for which we might expect R&D to be a significant driver, such as introducing new operational processes.
This analysis reinforces that there are other types of innovation – in organisation, management, and marketing methods – that are only very weakly associated with R&D expenditure. Nevertheless, the correlation with R&D expenditure/intensity is stronger (albeit still relatively low) for introducing innovation new to the world, suggesting that firms at the cutting edge of innovation are more likely to engage in R&D investment. By contrast, innovation new to the firm – and particularly new organisational and marketing methods – are more likely to be driven by simple imitation and adaptation. Hence the significance of this finding depends on the type of innovation in which one is interested.
Nevertheless, this analysis does not control for the underlying drivers of innovation, and the correlation we observe may simply reflect other factors such as that better-performing firms both engage in R&D and do innovation. To get at the relationships between these variables more precisely, we need to take these other factors into account.
24 As Rosenberg (1994, p.139) pointed out, “Everyone knows that the linear model of innovation is dead”. Nevertheless, the simplicity of the linear model of innovation still makes it an attractive heuristic when thinking about policy.
Measuring the innovative activity of New Zealand firms 23 Table 4.2: Correlation matrix of innovation indicators
outputs intermediate outputs inputs
(1) (2) (3) (4) (5) (6) (7) (8) (9) (9a) (10) (10a) (11) (11a) (12) (13) (14) (15) (16)
out
put
s
(1) goods & services NTW* 1.00
(2) goods & services NTNZ* 1.00 1.00
(3) goods & services NTF* 1.00 1.00 1.00
(4) operational processes NTF* 0.36 0.47 0.56 1.00
(5) organisational processes NTF* 0.29 0.37 0.45 0.63 1.00
(6) marketing methods NTF* 0.33 0.42 0.53 0.54 0.61 1.00
(7) any innovation NTF* 0.49 0.57 0.67 0.63 0.62 0.58 1.00
(8) % sales from goods & services NTF** 0.66 0.76 1.00 0.51 0.40 0.48 0.62 1.00
inte
rmed
iate
(9) registered trademark* 0.35 0.37 0.32 0.23 0.20 0.24 0.27 0.26 1.00
(9a) number of trademarks*** 0.04 0.05 0.05 0.05 0.04 0.03 0.05 0.02 0.37 1.00
(10) registered design* 0.45 0.40 0.40 0.19 0.18 0.13 0.27 0.28 0.62 0.18 1.00
(10a) number of designs*** 0.06 0.04 0.05 0.01 0.02 0.02 0.02 0.01 0.12 0.13 0.59 1.00
(11) filed patent application* 0.53 0.47 0.44 0.27 0.18 0.14 0.30 0.32 0.64 0.08 0.79 0.20 1.00
(11a) number of patents*** 0.09 0.07 0.05 0.02 0.02 0.01 0.03 0.02 0.12 0.05 0.28 0.16 0.54 1.00
inp
uts
(12) self-reported R&D activity* 0.64 0.62 0.59 0.38 0.32 0.31 0.47 0.49 0.41 0.08 0.55 0.08 0.64 0.09 1.00
(13) declared R&D expenditure on IR10* 0.35 0.32 0.29 0.18 0.13 0.15 0.20 0.25 0.19 0.01 0.32 0.03 0.37 0.04 0.53 1.00
(14) received R&D grant* 0.56 0.49 0.41 0.24 0.17 0.18 0.28 0.35 0.40 0.09 0.45 0.05 0.55 0.11 0.67 0.45 1.00
(15) R&D expenditure*** 0.16 0.14 0.10 0.07 0.05 0.05 0.06 0.06 0.09 0.07 0.11 0.04 0.17 0.29 0.21 0.02 0.19 1.00
(16) R&D intensity*** 0.17 0.14 0.10 0.05 0.03 0.03 0.07 0.13 0.05 0.02 0.03 0.01 0.10 0.05 0.32 0.10 0.16 0.23 1.00
Notes: The table presents a correlation matrix of the various innovation indicators across all variables in the sample. The within-industry correlation matrix is presented in Table A.1 and the correlation matrix for the sample of R&D-active firms only in Table A.2. The matrix shows the tetrachoric correlations between the binary variables (denoted by *), the polychoric correlations between the categorical variable (denoted by **) and the binary variables, and the Pearson correlations between the continuous variables (denoted by ***) and all other variables (including the other continuous variables). All correlations are significantly different from zero. The tetrachoric correlation of a pair of binary variables equals one when the set of all positive observations of one variable is contained within the set of all positive observations of the other variable, even if the reverse is not true. Hence, because all goods & services new to the world (NTW) are by definition new to the firm (NTF), the tetrachoric correlation is equal to one, even though not all goods & services new to the firm are new to the world.

24 New Zealand Productivity Commission Working Paper 2015/2
4.3 Innovation rates and firm characteristics
In this section we examine how innovation measured by these different variables varies across time and according to firm characteristics. It is important to emphasise that the statistically significant results only indicate correlations between the variables, and should not be taken to imply that there is a causal relationship between the particular firm characteristic and the type of innovation. Although the results show how different innovation measures vary by firm characteristics, the main purpose is to examine the extent to which the measures tell the same or different stories about how innovation rates vary across different firm types.
Variable definition We focus on five key firm characteristics – age, employment size, foreign ownership, exporting status, industry/sector, and geographic location – as well as the year in which the innovation was reported.
We determine age from the answer to BOS question “Regardless of changes in ownership, what calendar year did this business commence operations?”25
Size is determined by the number of employees, which is defined by an enterprise's rolling mean employment (RME) count.26 RME is a 12-month moving average of the monthly employment count (EC) figure, obtained from tax data.27
Foreign ownership comes from the BOS question which asks “At the end of the last financial year, did any individual or business located overseas hold an ownership interest or shareholding in this business?”
We determine exporting status based on the answer the question: “For the last financial year, estimate the proportion of this business’s sales of goods and services that came from exports”
Industry/sector is constructed from the 1996 Australian and New Zealand Standard Industrial Classification (ANZSIC) codes. By joining smaller groups that appear from the data to have similar innovation patterns, we create the following 12 categories:
Agriculture, Forestry, Fishing, and Mining (A, B); Food, Beverage and Tobacco Manufacturing (C21); Petroleum, Coal, Chemical and Associated Product Manufacturing (C25); Metal Product Manufacturing (C27); Machinery and Equipment Manufacturing (C28); Other Manufacturing (C*); Electricity, Gas and Water Supply, and Construction (D-E); Wholesale Trade (F); Retail Trade (G); Accommodation, Cafes and Restaurants (H); Property and Business Services (L); Other services (I-Q).
We determine geographic location by the region in which the largest share of the firm’s employees is located.28
25 For clarity of presentation we group it into five categories: <5 years, 5-9 years, 10-19 years, 20-49 years, ≥50 years. 26 http://www.stats.govt.nz/browse_for_stats/businesses/business_growth_and_innovation/business-op-survey-2011-tables.aspx 27 We group employment count into the following five categories: 0-20, 20-50, 50-100, 100-500, ≥500. As an average number, RME can include decimal places. The categories include the lower bound but not the upper bound so (e.g.) a firm with 20 employees is included in “20-50 employees” category. 28 Constructing the geographic location is not a simple exercise because the BOS does not ask firms any information on firm location, nor is this information recorded at the firm level in any other dataset. Hence to construct this information we need to merge the firm-level dataset with three other datasets, specifically:

Measuring the innovative activity of New Zealand firms 25
Results In our analysis we disaggregate the innovation rates from the 13 different measures by year and firm characteristics. However, because a number of firm characteristics are correlated (for instance, older firms are more likely to be larger and to be exporting), cross-tabulation of innovation rates by firm characteristics do not make it clear which characteristic(s) are most closely associated with variation innovation rates. To get at this, we regress each measure of innovation on all the firm characteristics together.
Table 4.3 shows the predictive margins generated from a probit regression for the binary measures and from an ordinary least squares (OLS) regression for the continuous measures. For the binary measures, the predictive margins correspond to the proportion of firms innovating and for the continuous measures they correspond to the predicted mean values, conditional on the other characteristics being held at their mean. Table A.4 reports the same results along with their standard errors, from which it is possible to determine whether the differences in probabilities/rates between firm types are statistically significant.29 For comparison, Table A.3 presents the results from the cross-tabulations of these measures by firm characteristics – that is, the unconditional means – together with their standard errors.
After controlling for firm characteristics, we observe that all indicators of innovation output have dropped significantly since 2005, although the differences between the later years (2007-2013) are generally not statistically significant. Most noticeably, the percentage of sales from good and services new to the firm has steadily declined over time. At the same time there appears to be a slight upward trend in the likelihood of reporting R&D activity over time and a clear upward trend in R&D intensity.30 An analysis of the time trend for just R&D-active firms shows a similar trend in both the innovation output measures, especially the percentage of sales from new good and services (declining), and R&D intensity (increasing). Although these results do not provide conclusive evidence, they suggest that the productivity of the innovation process at the firm level may have declined.
The results show that larger firms are consistently more likely to report introducing innovations new to the firm, to register trademarks, and to be engaged in R&D activity.31 However, it is important to remember that larger firms typically do more of everything, and all else equal increasing the size of the firm on its own is likely to increase the chance that the firm will introduce new innovations, apply for trademarks, etc. Hence this finding is not terribly surprising. It would be more interesting to know whether larger firms are more innovative after adjusting for size.
There is no obvious way to adjust the results on the binary indicators for size as they contain no information on how many innovations the firm generated; a “yes“” could mean that the firm generated any number of innovations. However we observe that those measures that are already adjusted for size by their construction – the percentage of sales from new goods & services and R&D intensity – are flat
• Plant-level data including firm ownership and meshblock code (by ownership period, indicated start and finish dates);
• Firm-plant-level data on employment (by month); and
• Meshblock-level data on demographic information.
First we identify the set of plants each firm owned in a particular year and the employment by plant. Using the meshblock codes for each plant we then aggregate the plants into six regions (Auckland, Waikato, Wellington, Rest of North Island, Canterbury, and Rest of South Island) and determine the employment by region.
We allocate firms with plants in multiple regions to a primary location, based on the region with the highest proportion of their employment. A number of firms have equal employment shares across multiple regions over entire (LBD-recorded) history, as well as firms with multiple plants, all of which have zero employment during the reporting period. Moreover, some “relocations“” are pure noise: e.g., one personnel movement (for just 1 month) for firm with equal employment shares can arbitrarily shift primary location. To resolve these unclear cases we use ranking rules or in doubt we manually assign. In what follows we report the results based on this region indicator variable. However, as a robustness check we repeated the analysis using a fractional variable for firm location based on the proportion of employment. The results were qualitatively unchanged. 29 We do not indicate the “significance” of any individual coefficient (using the conventional stars) on any of these tables because whether the coefficient is significantly different from zero is not very meaningful. Instead, we are interested whether the coefficients are different from each other, for which we need the standard errors of both coefficients. 30 This trend is not evident in the aggregate statistics on R&D expenditure as a proportion of GDP. 31 The one exception is introducing goods and services new to the world, where the largest firms are still more likely to do so but the difference relative to medium-size firms (20-50 and 50-100 employees) is not statistically significant.

26 New Zealand Productivity Commission Working Paper 2015/2
or even decreasing with size. Therefore it would be wrong to conclude from these results that larger firms are more innovative; instead, it seems that smaller firms may be more innovative than larger firms.
The regression results reveal that the youngest firms (<5 years) are significantly more likely to report introducing new goods and services, marketing methods, and organisational processes, and have a higher percentage of sales from new goods & services, but all age groups have similar likelihood of introducing new operational processes. Younger firms are also most likely to register trademarks, but there is no difference by age in the likelihood of filing patent applications or engaging in R&D activity. Also, R&D expenditure and R&D intensity are both roughly constant across firms of different ages, except for the oldest firms, which – all else being equal – have lower R&D intensity. These results might suggest that younger firms are more innovative. However, an alternative explanation is that younger firms are simply more likely to answer positively to the survey questions as a lot of what they do is “new”. Moreover, the results do not contain any information about the “quality” of the innovations; as younger firms are no more likely to be engaged in R&D activity or filing patents, it is possible that the innovation which they generate is less significant.
After controlling for other characteristics, foreign-owned firms are significantly more likely to introduce new goods and services and organisational processes, and have a higher percentage of sales from new goods and services. However, there is no clear difference relative to domestically owned firms in the likelihood of introducing new operational processes or marketing methods, engaging in R&D, or applying for IP rights. Nevertheless we know that foreign firms tend to target high-performing New Zealand companies for acquisition (Fabling & Sanderson, 2014) and if these high-performing firms are also more innovative then this may just be the result of the same selection.
Exporting firms are significantly more likely to be innovating across all measures. Nevertheless this finding is common to most other countries (see, for instance, Roper & Love, 2002) and we have no evidence that would enable us to determine whether exporting drives innovation.
The results reveal different patterns of innovation across industries and sectors. Firms in the manufacturing sector appear to have significantly higher rates than services firms in introducing new goods and services and new operational processes. Firms in Petroleum, Coal, Chemical, & Associated Manufacturing (C25) and Machinery & Equipment Manufacturing (C28) industries are significantly more likely to introduce new goods and services and to be engaged in R&D activity than firms in other industries, with Food, Beverage & Tobacco Manufacturing (C21) firms not far behind. Firms in Machinery & Equipment Manufacturing (C28) have the highest percentage of sales from new goods and services, with other Manufacturing firms not far behind but other industries, especially Agriculture and Mining (A, B), are significantly lower. At the same time firms in the Manufacturing sector generally – all but Machinery & Equipment Manufacturing (C28) in particular – have the highest likelihood of introducing new operational processes.
It is predominantly firms in parts of the Services sector – Wholesale Trade (F), Retail Trade (G), and Accommodation, Cafes & Restaurants (H) – as well as the related industry of Food, Beverage & Tobacco Manufacturing (C21) that have the highest likelihood of introducing new marketing methods. Also, firms in Property & Business (L) and Other Services (I-Q) are as or more likely as firms in the Manufacturing sector to introduce new organisational processes. Given that the nature of innovation differs across industry, it is important to focus on the appropriate indicators to measure innovation in a particular industry or sector, and to use multiple indicators when measuring the performance of multiple sectors at the same time.
We also see that the pattern of R&D intensity across industries does not correspond well with the pattern on the innovation output measures. Firms in the Machinery & Equipment Manufacturing (C28) and Property & Business Services (L) industries have significantly higher R&D intensity than firms in all other industries, a pattern not seen on any other indicator.
The results on the location of firm activity show some variation in innovative activity across the regions. Firms with their primary location (i.e., the largest share of their employees) in Wellington are the highest

Measuring the innovative activity of New Zealand firms 27
across most of the innovation output measures, although the differences are statistically significant only when all innovations are taken together. When we look at the intermediate and input measures, we see that firms in Wellington are most likely to file trademark applications, but firms in Canterbury are most likely to file patent applications, to be engaged in R&D activity, and have the highest R&D intensity. (By these input measures, Canterbury has significantly higher innovation rates over some but not all other regions.) On the face of it, these results suggest that a firm based in Canterbury is more likely to be investing in innovation while a firm based in Wellington is more likely to be generating new innovation output. However, we are unable to tell from these results whether location actually affects innovation, whether innovating firms choose to locate in these regions, or whether location is simply associated with some (unobserved) characteristic that leads firms to be more innovative.

28 New Zealand Productivity Commission Working Paper 2015/2 Table 4.3: Conditional innovation rates by firm characteristics (from regression on all characteristics)
innovation outputs intermediate outputs
innovation inputs
goods & services
NTW
goods & services
NTF
oper. processe
s NTF
org. processe
s NTF
mktg methods
NTF
any innovatio
n NTF
sales from
goods & services NTF (%)
registered
trademark
filed patent appl.
engaged in R&D activity
received R&D grant
R&D exp. ($000)
R&D intensity (% total
exp.)
Year 2005 0.037 0.228 0.207 0.268 0.244 0.435 3.583 0.026 0.002 0.073 0.017 13.640 0.108 2007 0.025 0.205 0.160 0.221 0.221 0.378 3.146 0.029 0.002 0.063 0.016 16.093 0.094 2009 0.026 0.191 0.165 0.223 0.211 0.360 2.600 0.028 0.003 0.080 0.012 24.149 0.158 2011 0.024 0.181 0.170 0.212 0.221 0.367 2.568 - - 0.091 - 23.526 0.194 2013 0.021 0.169 0.176 0.212 0.229 0.437 1.994 - - 0.085 - 33.685 -
# employees
<20 0.025 0.183 0.162 0.210 0.219 0.382 2.820 0.018 0.001 0.070 0.010 7.772 0.132 20-50 0.031 0.221 0.194 0.264 0.228 0.419 2.647 0.030 0.002 0.094 0.017 23.968 0.201 50-100 0.029 0.235 0.243 0.309 0.263 0.463 2.458 0.056 0.004 0.105 0.031 69.652 0.123 ≥100 0.036 0.267 0.300 0.343 0.290 0.503 2.355 0.129 0.014 0.140 0.052 301.820 0.035
Age <5 years 0.039 0.233 0.196 0.274 0.275 0.471 4.719 0.045 0.007 0.071 0.021 25.531 0.171 5-10 years 0.028 0.205 0.201 0.266 0.244 0.415 2.885 0.026 0.001 0.091 0.014 21.718 0.141 10-20 years 0.031 0.201 0.170 0.209 0.223 0.391 2.604 0.028 0.001 0.077 0.017 23.484 0.158 20-50 years 0.022 0.178 0.163 0.206 0.207 0.369 2.212 0.023 0.003 0.081 0.014 22.066 0.140 ≥50 years 0.015 0.146 0.147 0.200 0.173 0.328 1.735 0.025 0.002 0.064 0.013 16.646 0.024
Foreign owned
No 0.025 0.189 0.175 0.225 0.223 0.392 2.653 0.026 0.002 0.076 0.016 17.582 0.112 Yes 0.040 0.256 0.182 0.252 0.248 0.430 4.244 0.038 0.003 0.097 0.013 85.627 0.520
Exporter No 0.014 0.167 0.160 0.216 0.210 0.374 2.370 0.021 0.001 0.050 0.005 12.389 0.059 Yes 0.067 0.316 0.247 0.282 0.302 0.496 4.668 0.049 0.005 0.189 0.041 71.148 0.601
Industry (ANZSIC96)
A,B 0.012 0.083 0.126 0.149 0.084 0.275 1.028 0.012 0.000 0.062 0.011 15.555 0.051 C21 0.030 0.276 0.244 0.236 0.246 0.479 3.167 0.086 0.001 0.147 0.028 31.630 -0.021 C22,C23,C24,C26,C29 0.039 0.258 0.228 0.225 0.236 0.428 3.472 0.039 0.002 0.098 0.016 -1.436 0.062 C25 0.071 0.338 0.243 0.219 0.216 0.475 3.237 0.059 0.003 0.189 0.034 31.898 0.031 C27 0.035 0.229 0.214 0.264 0.200 0.334 3.209 0.022 0.010 0.089 0.016 24.007 0.057 C28 0.090 0.293 0.169 0.243 0.218 0.418 4.427 0.034 0.012 0.181 0.044 123.088 0.558 D,E 0.006 0.131 0.150 0.258 0.176 0.386 2.249 0.005 0.001 0.073 0.006 22.122 0.126 F 0.030 0.254 0.171 0.223 0.271 0.432 3.083 0.047 0.004 0.075 0.011 2.949 -0.051 G 0.010 0.165 0.124 0.209 0.250 0.384 2.651 0.014 0.000 0.033 0.000 10.228 0.092 H 0.015 0.178 0.165 0.188 0.296 0.383 2.776 0.020 0.000 0.057 0.001 15.413 0.097 I,J,K,M,N,O,P,Q 0.019 0.209 0.210 0.269 0.227 0.434 2.756 0.024 0.001 0.057 0.003 11.538 0.077 L 0.035 0.203 0.204 0.245 0.235 0.398 3.271 0.031 0.001 0.098 0.030 53.473 0.479
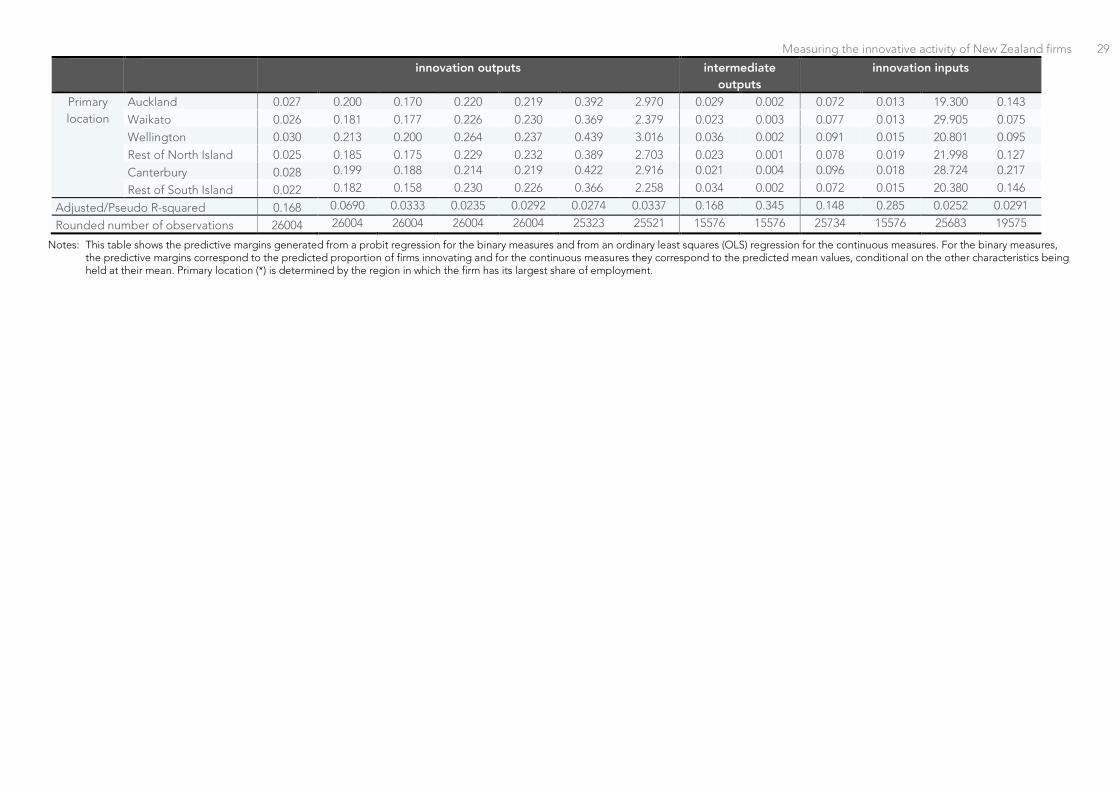
Measuring the innovative activity of New Zealand firms 29
innovation outputs intermediate outputs
innovation inputs
Primary location
Auckland 0.027 0.200 0.170 0.220 0.219 0.392 2.970 0.029 0.002 0.072 0.013 19.300 0.143 Waikato 0.026 0.181 0.177 0.226 0.230 0.369 2.379 0.023 0.003 0.077 0.013 29.905 0.075 Wellington 0.030 0.213 0.200 0.264 0.237 0.439 3.016 0.036 0.002 0.091 0.015 20.801 0.095 Rest of North Island 0.025 0.185 0.175 0.229 0.232 0.389 2.703 0.023 0.001 0.078 0.019 21.998 0.127 Canterbury 0.028 0.199 0.188 0.214 0.219 0.422 2.916 0.021 0.004 0.096 0.018 28.724 0.217
Rest of South Island 0.022 0.182 0.158 0.230 0.226 0.366 2.258 0.034 0.002 0.072 0.015 20.380 0.146
Adjusted/Pseudo R-squared 0.168 0.0690 0.0333 0.0235 0.0292 0.0274 0.0337 0.168 0.345 0.148 0.285 0.0252 0.0291
Rounded number of observations 26004 26004 26004 26004 26004 25323 25521 15576 15576 25734 15576 25683 19575
Notes: This table shows the predictive margins generated from a probit regression for the binary measures and from an ordinary least squares (OLS) regression for the continuous measures. For the binary measures, the predictive margins correspond to the predicted proportion of firms innovating and for the continuous measures they correspond to the predicted mean values, conditional on the other characteristics being held at their mean. Primary location (*) is determined by the region in which the firm has its largest share of employment.
30 New Zealand Productivity Commission Working Paper 2015/2
4.4 Firm persistence in innovation over time We now examine the extent to which firms continue to innovate over time. For this analysis we use the subset of firms in the BOS sample that responded in every year that module B was administered (i.e., the longitudinal sample). BOS has a dedicated longitudinal sample, and enhances this by re-surveying all respondents to the 2005 survey, whether or not they are part of the dedicated sample. However, because attrition of firms from the sample is not random (e.g., smaller and younger firms are more likely to drop out), the longitudinal sample has become less representative over time.32 Moreover, Statistics New Zealand does not generate any “longitudinal weights” that would allow us to weight the sample responses to represent the population. Table A.6 presents a comparison of the unweighted means for those firms in the full BOS sample vs. the BOS longitudinal sample. It shows that firms in the longitudinal sample are on average larger, older, and more likely to be both foreign owned and exporting. They are also more likely to be located in Auckland or Canterbury and in the Manufacturing sector (C) or Wholesale Trade (F). Hence the longitudinal sample is not representative of the whole population. To examine how firm-level innovation is related over time, we build on a measure of persistence developed by Palangkaraya, Stierwald, Webster, and Jensen (2010). They classified firms in their sample into four categories:
Persistent innovator: innovated every year
Sporadic innovator: innovated in more than one but not all years
One-time innovator: innovated only one year
Non-innovator: never innovated
Since we have five years of observations (2005, 2007, 2009, 2011, 2013), our set of “sporadic innovators” includes firms that innovated in two, three, and four years, and we break out these separately. For the purposes of exposition we create a “persistence score”, which is a count of the years in which a firm innovated by a given measure. More specifically, the formula for the persistence score (PS) is given by
𝑃𝑃𝑃𝑃𝑖𝑖 = 𝐼𝐼𝑖𝑖2005 + 𝐼𝐼𝑖𝑖2007 + 𝐼𝐼𝑖𝑖2009 + 𝐼𝐼𝑖𝑖2011 + 𝐼𝐼𝑖𝑖2013 where 𝐼𝐼𝑡𝑡 =1 if firm 𝑖𝑖 innovated in year 𝑡𝑡
Since the persistence measure counts the binary indicators of innovation, it is not possible to generate a persistence score for R&D expenditure or R&D intensity in this way.
Figure 4.2 shows the proportion of firms that were persistent, sporadic, and one-time innovators (excluding non-innovators) by each measure. Since each measure has a different underlying innovation rate, it is not very informative to compare the persistence scores across measures. Instead, we compare the distribution of persistence scores across firms to what we would expect to observe if innovation were distributed randomly across time (i.e., there was no serial correlation), using the chi-squared (Χ2) statistic.33 Figure 4.2 shows the percentage of firms that fall into each of the persistence scores. We report the weighted34 mean innovation rate for the set of firms in the longitudinal sample (from which we calculated the binomial distribution) in parentheses and overlay the Χ2 statistic on top of the bars.
32 The longitudinal sample was re-set in 2012, which will improve the representativeness of this sample in the future, but does not change the set of firms that have been in the sample since 2005. 33 If there were no serial correlation (i.e., if the likelihood that a firm innovated in a period were independent of whether it innovated in the previous period) then the distribution of persistence scores could be predicted by a binomial distribution, based on the probability of innovating in a given period. The chi-squared (Χ2) statistic provides a way of representing the “goodness of fit” between the observed distribution of persistence scores and the distribution predicted by the binomial model: the worse the fit between the distribution and a binomial model, the higher the Χ2 statistic and therefore the greater is the persistence in innovation. 34 Since we do not have longitudinal weights instead we use the cross-sectional weights.
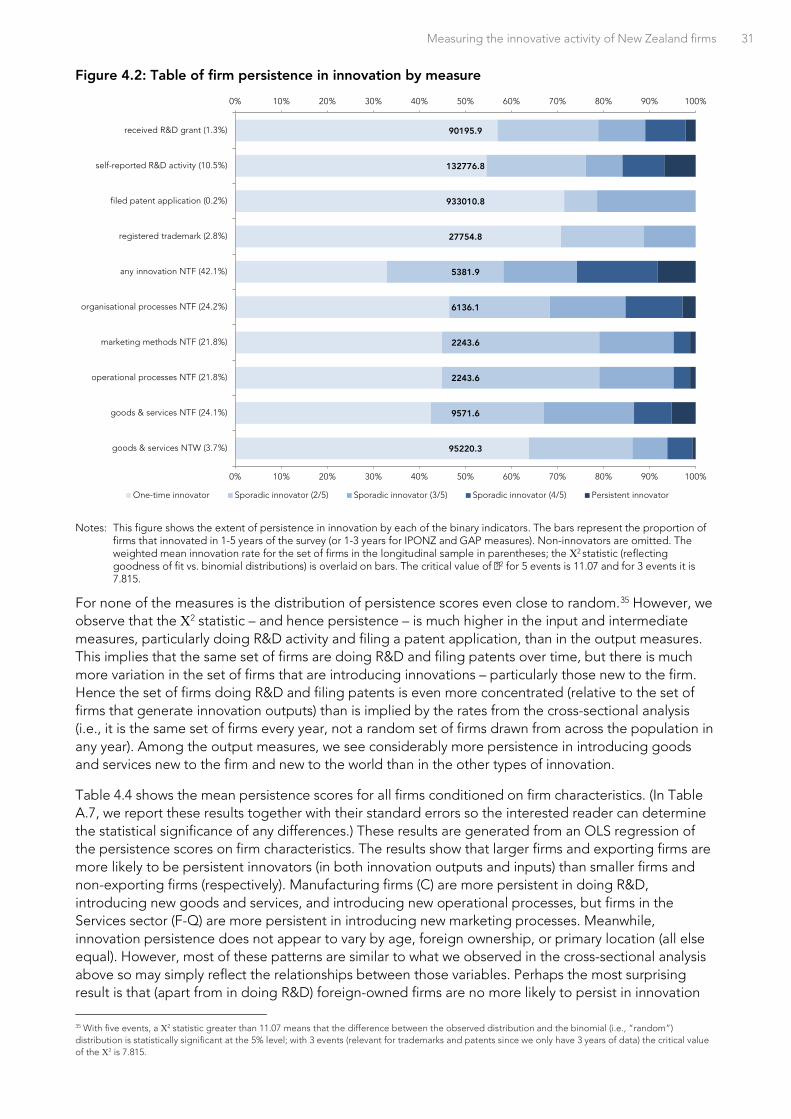
Measuring the innovative activity of New Zealand firms 31
Figure 4.2: Table of firm persistence in innovation by measure
Notes: This figure shows the extent of persistence in innovation by each of the binary indicators. The bars represent the proportion of firms that innovated in 1-5 years of the survey (or 1-3 years for IPONZ and GAP measures). Non-innovators are omitted. The weighted mean innovation rate for the set of firms in the longitudinal sample in parentheses; the Χ2 statistic (reflecting goodness of fit vs. binomial distributions) is overlaid on bars. The critical value of Χ2 for 5 events is 11.07 and for 3 events it is 7.815.
For none of the measures is the distribution of persistence scores even close to random.35 However, we observe that the Χ2 statistic – and hence persistence – is much higher in the input and intermediate measures, particularly doing R&D activity and filing a patent application, than in the output measures. This implies that the same set of firms are doing R&D and filing patents over time, but there is much more variation in the set of firms that are introducing innovations – particularly those new to the firm. Hence the set of firms doing R&D and filing patents is even more concentrated (relative to the set of firms that generate innovation outputs) than is implied by the rates from the cross-sectional analysis (i.e., it is the same set of firms every year, not a random set of firms drawn from across the population in any year). Among the output measures, we see considerably more persistence in introducing goods and services new to the firm and new to the world than in the other types of innovation.
Table 4.4 shows the mean persistence scores for all firms conditioned on firm characteristics. (In Table A.7, we report these results together with their standard errors so the interested reader can determine the statistical significance of any differences.) These results are generated from an OLS regression of the persistence scores on firm characteristics. The results show that larger firms and exporting firms are more likely to be persistent innovators (in both innovation outputs and inputs) than smaller firms and non-exporting firms (respectively). Manufacturing firms (C) are more persistent in doing R&D, introducing new goods and services, and introducing new operational processes, but firms in the Services sector (F-Q) are more persistent in introducing new marketing processes. Meanwhile, innovation persistence does not appear to vary by age, foreign ownership, or primary location (all else equal). However, most of these patterns are similar to what we observed in the cross-sectional analysis above so may simply reflect the relationships between those variables. Perhaps the most surprising result is that (apart from in doing R&D) foreign-owned firms are no more likely to persist in innovation
35 With five events, a Χ2 statistic greater than 11.07 means that the difference between the observed distribution and the binomial (i.e., “random”) distribution is statistically significant at the 5% level; with 3 events (relevant for trademarks and patents since we only have 3 years of data) the critical value of the Χ2 is 7.815.
95220.3
9571.6
2243.6
2243.6
6136.1
5381.9
27754.8
933010.8
132776.8
90195.9
0% 10% 20% 30% 40% 50% 60% 70% 80% 90% 100%
0% 10% 20% 30% 40% 50% 60% 70% 80% 90% 100%
goods & services NTW (3.7%)
goods & services NTF (24.1%)
operational processes NTF (21.8%)
marketing methods NTF (21.8%)
organisational processes NTF (24.2%)
any innovation NTF (42.1%)
registered trademark (2.8%)
filed patent application (0.2%)
self-reported R&D activity (10.5%)
received R&D grant (1.3%)
One-time innovator Sporadic innovator (2/5) Sporadic innovator (3/5) Sporadic innovator (4/5) Persistent innovator

32 New Zealand Productivity Commission Working Paper 2015/2
than domestically owned firms, even though foreign-owned firms generally have higher innovation rates than domestically owned firms. It suggests that foreign-owned firms may be more likely to engage in innovation on an occasional basis but not to do it regularly.
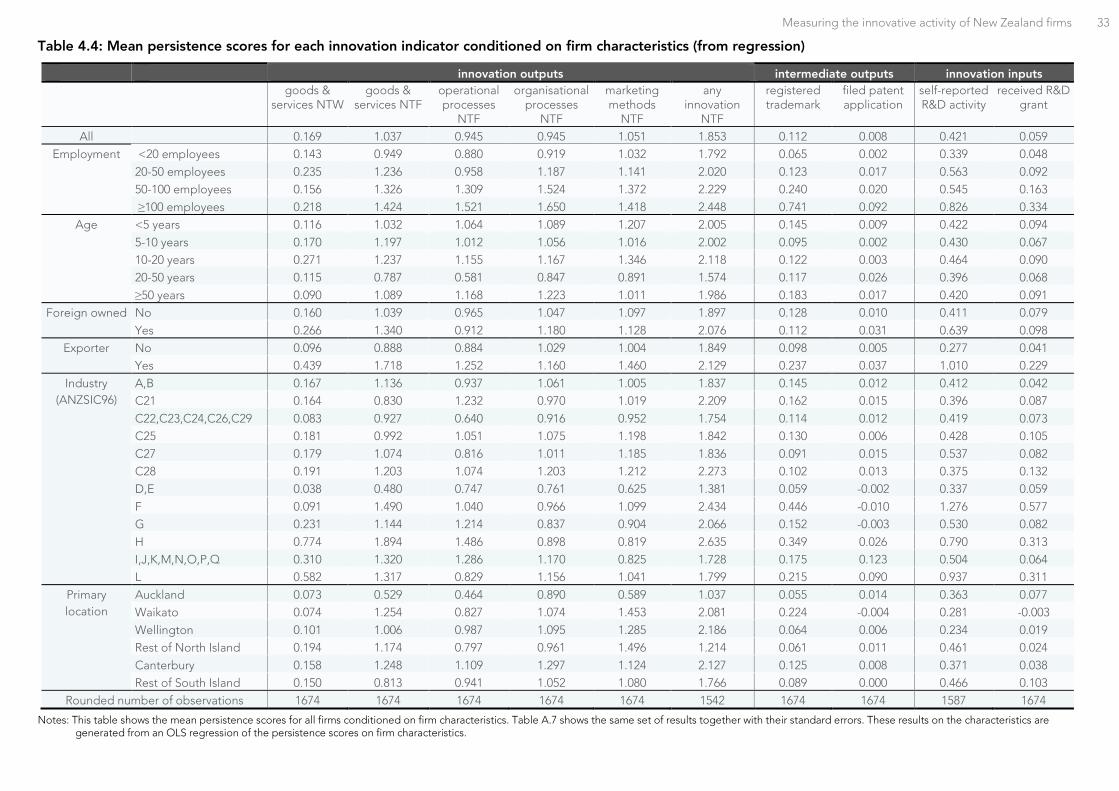
Measuring the innovative activity of New Zealand firms 33
Table 4.4: Mean persistence scores for each innovation indicator conditioned on firm characteristics (from regression)
innovation outputs intermediate outputs innovation inputs goods &
services NTW goods &
services NTF operational processes
NTF
organisational processes
NTF
marketing methods
NTF
any innovation
NTF
registered trademark
filed patent application
self-reported R&D activity
received R&D grant
All 0.169 1.037 0.945 0.945 1.051 1.853 0.112 0.008 0.421 0.059 Employment <20 employees 0.143 0.949 0.880 0.919 1.032 1.792 0.065 0.002 0.339 0.048
20-50 employees 0.235 1.236 0.958 1.187 1.141 2.020 0.123 0.017 0.563 0.092 50-100 employees 0.156 1.326 1.309 1.524 1.372 2.229 0.240 0.020 0.545 0.163 ≥100 employees 0.218 1.424 1.521 1.650 1.418 2.448 0.741 0.092 0.826 0.334
Age <5 years 0.116 1.032 1.064 1.089 1.207 2.005 0.145 0.009 0.422 0.094 5-10 years 0.170 1.197 1.012 1.056 1.016 2.002 0.095 0.002 0.430 0.067 10-20 years 0.271 1.237 1.155 1.167 1.346 2.118 0.122 0.003 0.464 0.090 20-50 years 0.115 0.787 0.581 0.847 0.891 1.574 0.117 0.026 0.396 0.068 ≥50 years 0.090 1.089 1.168 1.223 1.011 1.986 0.183 0.017 0.420 0.091
Foreign owned No 0.160 1.039 0.965 1.047 1.097 1.897 0.128 0.010 0.411 0.079 Yes 0.266 1.340 0.912 1.180 1.128 2.076 0.112 0.031 0.639 0.098
Exporter No 0.096 0.888 0.884 1.029 1.004 1.849 0.098 0.005 0.277 0.041 Yes 0.439 1.718 1.252 1.160 1.460 2.129 0.237 0.037 1.010 0.229
Industry (ANZSIC96)
A,B 0.167 1.136 0.937 1.061 1.005 1.837 0.145 0.012 0.412 0.042 C21 0.164 0.830 1.232 0.970 1.019 2.209 0.162 0.015 0.396 0.087 C22,C23,C24,C26,C29 0.083 0.927 0.640 0.916 0.952 1.754 0.114 0.012 0.419 0.073 C25 0.181 0.992 1.051 1.075 1.198 1.842 0.130 0.006 0.428 0.105 C27 0.179 1.074 0.816 1.011 1.185 1.836 0.091 0.015 0.537 0.082 C28 0.191 1.203 1.074 1.203 1.212 2.273 0.102 0.013 0.375 0.132 D,E 0.038 0.480 0.747 0.761 0.625 1.381 0.059 -0.002 0.337 0.059 F 0.091 1.490 1.040 0.966 1.099 2.434 0.446 -0.010 1.276 0.577 G 0.231 1.144 1.214 0.837 0.904 2.066 0.152 -0.003 0.530 0.082 H 0.774 1.894 1.486 0.898 0.819 2.635 0.349 0.026 0.790 0.313 I,J,K,M,N,O,P,Q 0.310 1.320 1.286 1.170 0.825 1.728 0.175 0.123 0.504 0.064 L 0.582 1.317 0.829 1.156 1.041 1.799 0.215 0.090 0.937 0.311
Primary location
Auckland 0.073 0.529 0.464 0.890 0.589 1.037 0.055 0.014 0.363 0.077 Waikato 0.074 1.254 0.827 1.074 1.453 2.081 0.224 -0.004 0.281 -0.003 Wellington 0.101 1.006 0.987 1.095 1.285 2.186 0.064 0.006 0.234 0.019 Rest of North Island 0.194 1.174 0.797 0.961 1.496 1.214 0.061 0.011 0.461 0.024 Canterbury 0.158 1.248 1.109 1.297 1.124 2.127 0.125 0.008 0.371 0.038 Rest of South Island 0.150 0.813 0.941 1.052 1.080 1.766 0.089 0.000 0.466 0.103
Rounded number of observations 1674 1674 1674 1674 1674 1542 1674 1674 1587 1674
Notes: This table shows the mean persistence scores for all firms conditioned on firm characteristics. Table A.7 shows the same set of results together with their standard errors. These results on the characteristics are generated from an OLS regression of the persistence scores on firm characteristics.
34 New Zealand Productivity Commission Working Paper 2015/2
5 Discussion Using data from the LBD, this paper describes the innovation rates of New Zealand firms by the various measures, the relationships between them, and how these innovation rates vary by firm characteristics. In comparing the different measures of innovation, it examines explicitly how R&D intensity relates to the other measures and hence how good a proxy R&D intensity is for innovation more generally.
We find that innovation rates can range from 0.2% to around 40% depending on which measure we use. The self-reported “output” measures – indicators of whether the firm changed anything in its portfolio of good and services, operational process, etc. within the past 2 years – give the highest rates (around 20-24% of firms on the individual measure or 40% on the “any“ measure), reflecting the low bar that these measures set. By contrast, measures such as filing patents and introducing goods and services new to world, which indicate the firm has done something of global novelty, set a higher bar that is met by only around 0.2-2% of firms.
Looking at the relationships between different measures, we observe that the various output measures have tetrachoric correlations around 0.5, meaning that firms which innovate by one metric are at least as likely as not to innovate by the other (or vice versa). However, the set of firms that are most likely to innovate by one measure does not completely overlap with the set of firms that are most likely to innovate by another. For instance, while firms in the manufacturing sector are more likely to introduce goods and services, firms in the services sector are just as or more likely to introduce organisational processes and marketing methods. This suggests that the different output measures are not simply proxies for the same underlying “innovation” phenomenon.
The differences between measures are even greater when we also compare output measures to intermediate and input measures. The correlation between whether a firm does R&D/files a patent and whether it introduces new goods and services is fairly high (around 0.6/0.45) but the correlation with the other innovation output measures is weaker (0.3/0.2). We also observe that the industries in which firms are more likely to be doing R&D/filing a patent are not necessarily the same industries as those in which they are likely to be generating the other types of innovation output. For instance, firms in the Manufacturing sector are much more likely to be doing R&D and filing a patent than firms in other sectors, but – as discussed above – they are no more likely to introduce organisational processes or marketing methods. This suggests that although investing in R&D/filing patents may increase the likelihood of introducing new goods & services, it is less likely to have an impact on the other types of innovation output.
The difference is starkest between R&D intensity and the output measures of innovation. The correlation between R&D intensity and the proportion of firms generating innovation output is very weak (only 0.03-0.10). The correlation between R&D intensity and percentage of sales from goods and services new to the firm (the closest variable to a continuous measure of innovation output) is also very low (0.20), even among those firms that report being engaged in R&D.
R&D intensity also appears to follow a different pattern to the other measures. While output-based innovation rates have fallen since 2005 (and stayed constant in more recent years), R&D intensity has clearly risen. This divergence in trends holds even within the set of R&D-active firms. R&D intensity is much higher in Machinery & Equipment Manufacturing and in Property & Business Services than in other industries, but this is not reflected in the pattern of innovation activity that we see in the other measures. The R&D intensity measure does follow a fairly similar pattern to the indicator of doing R&D, but in most cases the variation in R&D intensity by firm characteristics is much starker than we see with the binary indicator. These results suggest that R&D intensity measures a specific type of investment into innovation and does not provide a good proxy for innovation as a whole.
When we compare across the various measures in terms of firm-level persistence in innovation, we see higher persistence among firms in the input measures – particularly, doing R&D and filing patents – than in the innovation output measures. Part of the explanation may be that innovation output is
Measuring the innovative activity of New Zealand firms 35
“lumpier” over time than innovation inputs such as R&D (i.e., even though firms invest at fairly constant rates over the year they only generate outputs occasionally). However, it also tells us that the set of R&D-active firms is quite concentrated (i.e., it is the same, small set of firms that innovate repeatedly year after year), while the set of firms that generate innovation is much more distributed across the population. Taking this result together with the finding that a much larger proportion of firms report generating innovation than doing R&D in any particular year suggests that there are paths to innovation other than investing in R&D.
The weak correlations between R&D intensity and the other measures indicate that we cannot rely simply on R&D intensity to proxy for the innovation rate of New Zealand firms. Even in those industries in which we would expect R&D to matter, R&D intensity does not appear to be closely related to the rate of innovation output we observe. Although we observe a relatively high correlation between R&D intensity and patenting in Manufacturing, the correlations with innovation output measures are much weaker.36 Meanwhile, our persistence measures tell us that the set of R&D-active firms appear to be even more concentrated (relative to the set of firms that generate innovation outputs), and so R&D intensity is measuring an activity that is only ever engaged in by a small proportion of the population.
These results suggest that the indicator of whether a firm is engaged in R&D – or, at an aggregate level, the proportion of firms engaged in R&D – might be a better indicator of the overall level of innovation in the economy than R&D intensity. The binary indicator has a much higher correlation than R&D intensity with a range of innovation output measures. Nevertheless, the indicator of R&D activity does not follow the same pattern as the innovation output measures, suggesting it is picking up a different phenomenon, so we cannot rely on it as the sole proxy for innovation either.
If the correlation between R&D intensity and innovation output is so weak, it also begs the question what else might be related to innovation. It is important to emphasise that the results shown in this paper are only correlations and at this stage we do not have any evidence to conclude that increasing R&D activity or intensity leads – or does not lead – to an increase in innovation37. We only examine the relationship between R&D intensity and innovation output because R&D expenditure/intensity is often used as a proxy for innovation. It is not within the scope of this paper to examine the drivers of innovation among New Zealand firms. Nevertheless, we posit a number of other factors that might have an effect on innovation:
• Other internal firm activity that is not specifically aimed at increasing knowledge but nevertheless exposes the firm to new ideas, such as learning by doing.
• External sources of new ideas including new employees, contracted research providers, partners/collaborators, universities, and competitors.
• Management practices and organisational structure that increase the firm’s ability to motivate/extract value from knowledge workers, flexibility/receptiveness to new ideas.
An alternative explanation for why we find such a low correlation between our R&D-based measures and innovation output measures is that our output measures themselves are imperfect proxies for the “true” innovation that we are trying to measure. Most of the output measures are self-reported, binary measures. As binary measures they do not capture the number or the magnitude of innovations. The primary indicators also set a relatively low bar – whether the firm changed something internally – and may simply reflect other types of changes within the firm that are unrelated to innovation. That said, we also see a very similar (weak) relationship between R&D intensity and percentage of sales from new goods & services so the low correlation cannot be attributed entirely to using binary measures. As self-reported measures, they may be influenced by the respondent’s personal characteristics and be more reflective of the respondent’s attitude than they are of the actual activity within the firm. Hence the low correlation may be because the innovation output measure is inaccurate or noisy.
36 Although international research (discussed above) has found a strong relationship between R&D spending and innovation (at the firm level), these papers typically measure innovation output using patents and the sample only includes manufacturing firms. 37 A. Jaffe and Le (2015) find a positive R&D grants increase product innovation among the same set of firms.

36 New Zealand Productivity Commission Working Paper 2015/2
Ultimately, we wish to understand what drives firm productivity and/or performance. Economic theory posits a strong relationship between innovation and firm performance. Innovation enables a firm either to increase the value of its product to customers or to reduce its own cost of production. Moreover, to the extent that the innovation cannot easily be copied or is protected by IP rights, it gives the firm a competitive advantage from which it can earn higher profits. Innovation allows a firm to extract more value from its inputs – either increasing the value the firm extracts from the same set of inputs or reducing the amount of inputs it needs to generate the same output – and thereby increases firm productivity. Hence when we measure innovative activity it is important to know the variable or variables that are related to economic performance.
This paper builds the foundations necessary to analyse the extent to which innovation – or the lack of it – by New Zealand firms contributes to New Zealand’s productivity gap. It is intended to be the first in a series of papers that examines the relationship between innovation and productivity in New Zealand. In ongoing work we will test this relationship using the measures for innovation described in this paper and a set of firm-level performance measures. In particular, we will examine whether there is a causal link between innovation – as measured by the variables described in this paper – and performance variables such as revenue growth, profitability, and labour and multi-factor productivity.

Measuring the innovative activity of New Zealand firms 37
Appendix A Additional tables Table A.1: Within-industry correlation matrix of innovation indicators
outputs intermediate inputs
(1) (2) (3) (4) (5) (6) (7) (8) (9) (9a) (10) (10a) (11) (11a) (12) (13) (14) (15) (16)
out
put
s
(1) goods & services NTW 1.00
(2) goods & services NTNZ 1.00 1.00
(3) goods & services NTF 1.00 1.00 1.00
(4) operational processes NTF 0.34 0.47 0.55 1.00
(5) organisational processes NTF 0.28 0.37 0.44 0.63 1.00
(6) marketing methods NTF 0.34 0.42 0.53 0.54 0.60 1.00
(7) any innovation NTF 0.49 0.57 0.67 0.63 0.61 0.57 1.00
(8) % sales from goods & services NTF 0.66 0.76 0.87 0.51 0.40 0.48 0.62 1.00
inte
rmed
iate
(9) registered trademark 0.28 0.35 0.28 0.23 0.20 0.25 0.25 0.25 1.00
(9a) number of trademarks 0.05 0.07 0.05 0.04 0.03 0.04 0.05 0.02 0.45 1.00
(10) registered design -0.03 0.30 0.27 0.42 0.14 0.37 0.17 0.23 0.54 0.19 1.00
(10a) number of designs 0.03 0.03 0.02 0.01 0.01 0.02 0.01 0.00 0.09 0.19 0.65 1.00
(11) filed patent application 0.47 0.49 0.42 0.31 0.17 0.20 0.33 0.27 0.70 0.12 0.60 0.24 1.00
(11a) number of patents 0.05 0.05 0.03 0.02 0.01 0.01 0.02 0.01 0.10 0.11 0.41 0.44 0.55 1.00
inp
uts
(12) self-reported R&D activity 0.53 0.55 0.53 0.38 0.33 0.33 0.46 0.49 0.37 0.10 0.33 0.05 0.63 0.07 1.00
(13) declared R&D expenditure on IR10 0.16 0.21 0.21 0.15 0.12 0.13 0.16 0.25 0.10 0.02 -0.18 0.02 0.00 0.02 0.45 1.00
(14) received R&D grant 0.27 0.27 0.27 0.14 0.07 0.11 0.32 0.35 0.39 0.07 0.30 0.05 0.44 0.09 0.47 0.35 1.00
(15) R&D expenditure* 0.12 0.13 0.10 0.07 0.05 0.05 0.06 0.05 0.13 0.14 0.18 0.17 0.16 0.21 0.27 0.02 0.17 1.00
(16) R&D intensity* 0.15 0.13 0.11 0.06 0.05 0.05 0.08 0.11 0.07 0.03 0.05 0.04 0.18 0.08 0.42 0.10 0.16 0.30 1.00
Notes: The table presents a correlation matrix of the various innovation indicators within industry. It shows the tetrachoric correlations between the binary variables, the polychoric correlations between the categorical variable (sales from new goods & services) and the binary variables, and the Pearson correlations between the continuous variables (denoted by *) and all other variables (including the other continuous variables). All correlations are significantly different from zero. The tetrachoric correlation of a pair of binary variables equals one when the set of all positive observations of one variable is contained within the set of all positive observations of the other variable, even if the reverse is not true. Hence, because all goods & services new to the world (NTW) are by definition new to the firm (NTF), the tetrachoric correlation is equal to one, even though not all goods & services new to the firm are new to the world. The within-industry correlation for the whole sample is calculated by taking the weighted average of the within-industry correlations for each industry, weighted by the number of firms in that industry.

38 New Zealand Productivity Commission Working Paper 2015/2
Figure A.1 Correlations between R&D activity/intensity and select indicators by industry
Panel A: R&D activity
Panel B: R&D intensity
Notes: This figure presents the correlations by industry between various innovation indicators and R&D activity (in Panel A and R&D
intensity (in Panel B). They are taken from a series of correlation matrices (similar to Table 4.2) on the industry subsamples.
0.0
0.1
0.2
0.3
0.4
0.5
0.6
0.7
0.8
0.9
1.0
goods & servicesNTF**
operational processesNTF**
organisationalprocesses NTF**
marketing methodsNTF**
registeredtrademark**
filed patentapplication**
A,B: Agriculture, Forestry Fishing & Mining C21: Food, Beverage & TobaccoC22,C23,C24,C26,C29: Other Manufacturing C25: Petroleum, Coal, Chemical & Assoc. Pdct MfgC27: Metal Product Manufacturing C28: Machinery & Equipment ManufacturingD,E: Electricity, Gas & Water Supply, & Construction F: Wholesale Trade
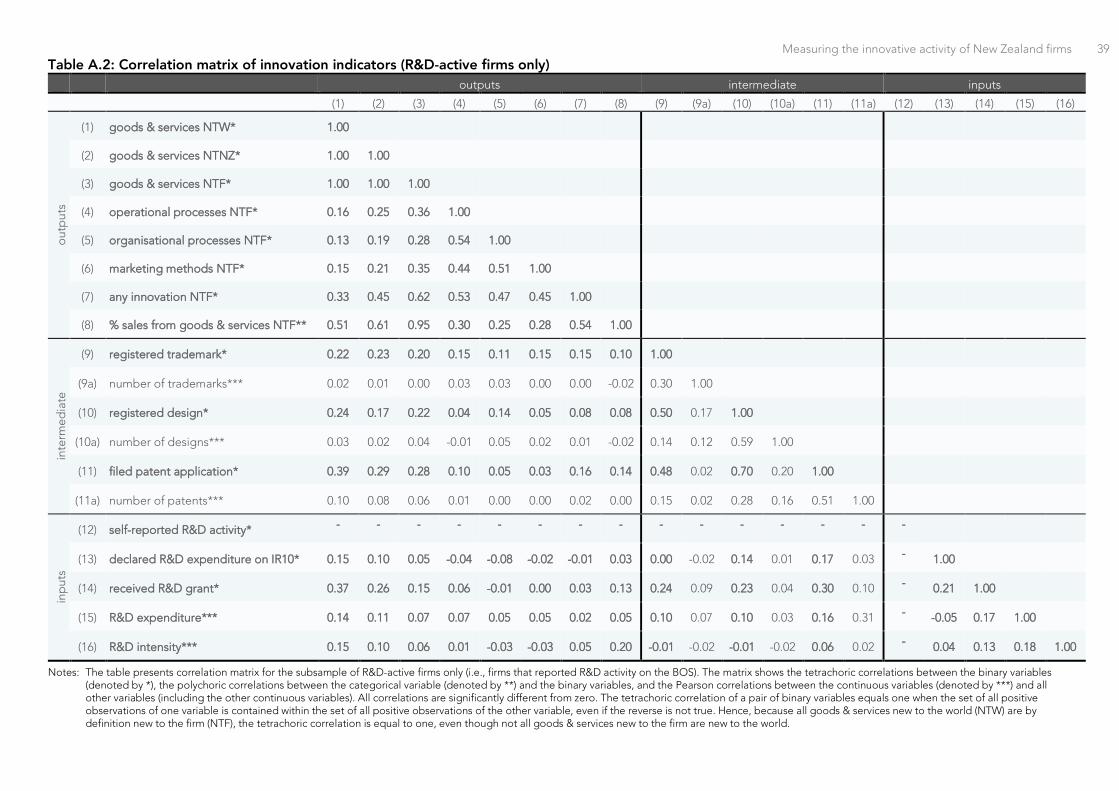
Measuring the innovative activity of New Zealand firms 39 Table A.2: Correlation matrix of innovation indicators (R&D-active firms only)
outputs intermediate inputs
(1) (2) (3) (4) (5) (6) (7) (8) (9) (9a) (10) (10a) (11) (11a) (12) (13) (14) (15) (16)
out
put
s
(1) goods & services NTW* 1.00
(2) goods & services NTNZ* 1.00 1.00
(3) goods & services NTF* 1.00 1.00 1.00
(4) operational processes NTF* 0.16 0.25 0.36 1.00
(5) organisational processes NTF* 0.13 0.19 0.28 0.54 1.00
(6) marketing methods NTF* 0.15 0.21 0.35 0.44 0.51 1.00
(7) any innovation NTF* 0.33 0.45 0.62 0.53 0.47 0.45 1.00
(8) % sales from goods & services NTF** 0.51 0.61 0.95 0.30 0.25 0.28 0.54 1.00
inte
rmed
iate
(9) registered trademark* 0.22 0.23 0.20 0.15 0.11 0.15 0.15 0.10 1.00
(9a) number of trademarks*** 0.02 0.01 0.00 0.03 0.03 0.00 0.00 -0.02 0.30 1.00
(10) registered design* 0.24 0.17 0.22 0.04 0.14 0.05 0.08 0.08 0.50 0.17 1.00
(10a) number of designs*** 0.03 0.02 0.04 -0.01 0.05 0.02 0.01 -0.02 0.14 0.12 0.59 1.00
(11) filed patent application* 0.39 0.29 0.28 0.10 0.05 0.03 0.16 0.14 0.48 0.02 0.70 0.20 1.00
(11a) number of patents*** 0.10 0.08 0.06 0.01 0.00 0.00 0.02 0.00 0.15 0.02 0.28 0.16 0.51 1.00
inp
uts
(12) self-reported R&D activity* - - - - - - - - - - - - - - -
(13) declared R&D expenditure on IR10* 0.15 0.10 0.05 -0.04 -0.08 -0.02 -0.01 0.03 0.00 -0.02 0.14 0.01 0.17 0.03 - 1.00
(14) received R&D grant* 0.37 0.26 0.15 0.06 -0.01 0.00 0.03 0.13 0.24 0.09 0.23 0.04 0.30 0.10 - 0.21 1.00
(15) R&D expenditure*** 0.14 0.11 0.07 0.07 0.05 0.05 0.02 0.05 0.10 0.07 0.10 0.03 0.16 0.31 - -0.05 0.17 1.00
(16) R&D intensity*** 0.15 0.10 0.06 0.01 -0.03 -0.03 0.05 0.20 -0.01 -0.02 -0.01 -0.02 0.06 0.02 - 0.04 0.13 0.18 1.00
Notes: The table presents correlation matrix for the subsample of R&D-active firms only (i.e., firms that reported R&D activity on the BOS). The matrix shows the tetrachoric correlations between the binary variables (denoted by *), the polychoric correlations between the categorical variable (denoted by **) and the binary variables, and the Pearson correlations between the continuous variables (denoted by ***) and all other variables (including the other continuous variables). All correlations are significantly different from zero. The tetrachoric correlation of a pair of binary variables equals one when the set of all positive observations of one variable is contained within the set of all positive observations of the other variable, even if the reverse is not true. Hence, because all goods & services new to the world (NTW) are by definition new to the firm (NTF), the tetrachoric correlation is equal to one, even though not all goods & services new to the firm are new to the world.

40 New Zealand Productivity Commission Working Paper 2015/2
Table A.3: Unconditional innovation rates by firm characteristics (mean probabilities/rates with standard errors)
(1) (2) (3) (4) (5) (6) (7) (8) (9) (10) (11) (12) (13)
innovation outputs intermediate outputs innovation inputs
goods & services
NTW
goods & services
NTF
oper. processes
NTF
mktg methods
NTF
org. processes
NTF
any innovation
NTF
sales from goods & services NTF (%)
registered trademark
filed patent application
engaged in R&D activity
received R&D grant
R&D exp. ($000)
R&D intensity (% total
exp.)
Total 0.026 0.194 0.174 0.225 0.224 0.393 2.749 0.028 0.002 0.078 0.015 23.293 0.111
(0.000) (0.001) (0.001) (0.001) (0.001) (0.001) - (0.001) (0.000) (0.001) (0.000) (0.000) (0.000)
Year
2005 0.036 0.074 0.230 0.203 0.266 0.242 3.588 0.433 0.027 0.002 0.073 0.018 13.170 (0.001) (0.001) (0.002) (0.002) (0.002) (0.002) (0.312) (0.003) (0.001) (0.000) (0.001) (0.001) (1.935) 2007 0.026 0.058 0.206 0.160 0.224 0.220 3.133 0.381 0.029 0.002 0.063 0.016 22.182 (0.001) (0.001) (0.002) (0.002) (0.002) (0.002) (0.335) (0.003) (0.001) (0.000) (0.001) (0.001) (3.753) 2009 0.025 0.061 0.188 0.166 0.223 0.209 2.555 0.359 0.027 0.002 0.080 0.012 25.896 (0.001) (0.001) (0.002) (0.002) (0.002) (0.002) (0.200) (0.003) (0.001) (0.000) (0.001) (0.001) (3.155) 2011 0.023 0.062 0.178 0.170 0.211 0.219 2.451 0.364 - - 0.089 - 24.979 (0.001) (0.001) (0.002) (0.002) (0.002) (0.002) (0.211) (0.003) - - (0.002) - (2.915) 2013 0.021 0.059 0.168 0.172 0.204 0.228 2.077 0.430 - - 0.085 - 29.400 (0.001) (0.001) (0.002) (0.002) (0.002) (0.002) (0.146) (0.003) - - (0.001) - (0.000)
Emp
loym
ent
<20 employees 0.022 0.176 0.159 0.207 0.218 0.379 2.715 0.017 0.001 0.066 0.009 5.524 0.088 (0.000) (0.001) (0.001) (0.001) (0.001) (0.001) (0.140) (0.000) (0.000) (0.001) (0.000) (0.522) (0.010)
20-50 employees 0.037 0.237 0.201 0.267 0.228 0.415 2.842 0.032 0.003 0.104 0.022 29.070 0.202 (0.001) (0.003) (0.003) (0.003) (0.003) (0.003) (0.123) (0.001) (0.000) (0.002) (0.001) (4.016) (0.030)
50-100 employees 0.043 0.275 0.261 0.323 0.269 0.474 2.922 0.073 0.008 0.138 0.045 84.957 0.203 (0.002) (0.005) (0.005) (0.006) (0.005) (0.006) (0.123) (0.004) (0.001) (0.004) (0.003) (11.051) (0.029)
≥100 employees 0.054 0.322 0.318 0.356 0.296 0.519 3.027 0.169 0.022 0.188 0.076 341.066 0.174 (0.003) (0.006) (0.006) (0.006) (0.006) (0.007) (0.123) (0.006) (0.002) (0.005) (0.004) (33.508) (0.018)
Ag
e
<5 years 0.027 0.208 0.180 0.256 0.268 0.450 4.576 0.030 0.002 0.053 0.012 11.785 0.110 (0.001) (0.003) (0.003) (0.003) (0.003) (0.003) (0.540) (0.001) (0.000) (0.001) (0.001) (2.605) (0.026)
5-10 years 0.024 0.191 0.192 0.258 0.237 0.405 2.788 0.019 0.001 0.078 0.010 18.221 0.100 (0.001) (0.002) (0.002) (0.002) (0.002) (0.003) (0.208) (0.001) (0.000) (0.002) (0.001) (3.986) (0.016)
10-20 years 0.029 0.200 0.168 0.208 0.223 0.390 2.579 0.026 0.001 0.073 0.014 19.672 0.128 (0.001) (0.002) (0.002) (0.002) (0.002) (0.002) (0.166) (0.001) (0.000) (0.001) (0.001) (2.138) (0.020)
20-50 years 0.026 0.191 0.170 0.211 0.208 0.376 2.266 0.029 0.005 0.093 0.019 30.176 0.121 (0.001) (0.002) (0.002) (0.002) (0.002) (0.002) (0.141) (0.001) (0.000) (0.001) (0.001) (2.973) (0.015)
≥50 years 0.022 0.168 0.168 0.221 0.183 0.351 1.850 0.045 0.005 0.089 0.026 43.951 0.054 (0.001) (0.003) (0.003) (0.003) (0.003) (0.004) (0.353) (0.002) (0.001) (0.002) (0.002) (5.552) (0.008)
Fore
ign
owne
d
No 0.023 0.181 0.169 0.220 0.219 0.386 2.595 0.023 0.002 0.071 0.013 13.374 0.084 (0.000) (0.001) (0.001) (0.001) (0.001) (0.001) (0.118) (0.000) (0.000) (0.001) (0.000) (1.059) (0.007)
Yes 0.072 0.353 0.240 0.297 0.287 0.499 4.963 0.092 0.009 0.171 0.037 139.315 0.498 (0.002) (0.004) (0.004) (0.004) (0.004) (0.005) (0.369) (0.003) (0.001) (0.003) (0.002) (11.840) (0.080)
Exp
orte
r No 0.012 0.160 0.156 0.215 0.210 0.370 2.333 0.018 0.001 0.045 0.004 8.474 0.043 (0.000) (0.001) (0.001) (0.001) (0.001) (0.001) (0.120) (0.000) (0.000) (0.001) (0.000) (1.007) (0.005)
Yes 0.093 0.356 0.261 0.276 0.292 0.505 4.774 0.080 0.012 0.241 0.073 95.690 0.479 (0.002) (0.003) (0.003) (0.003) (0.003) (0.003) (0.286) (0.002) (0.001) (0.003) (0.002) (6.800) (0.049)
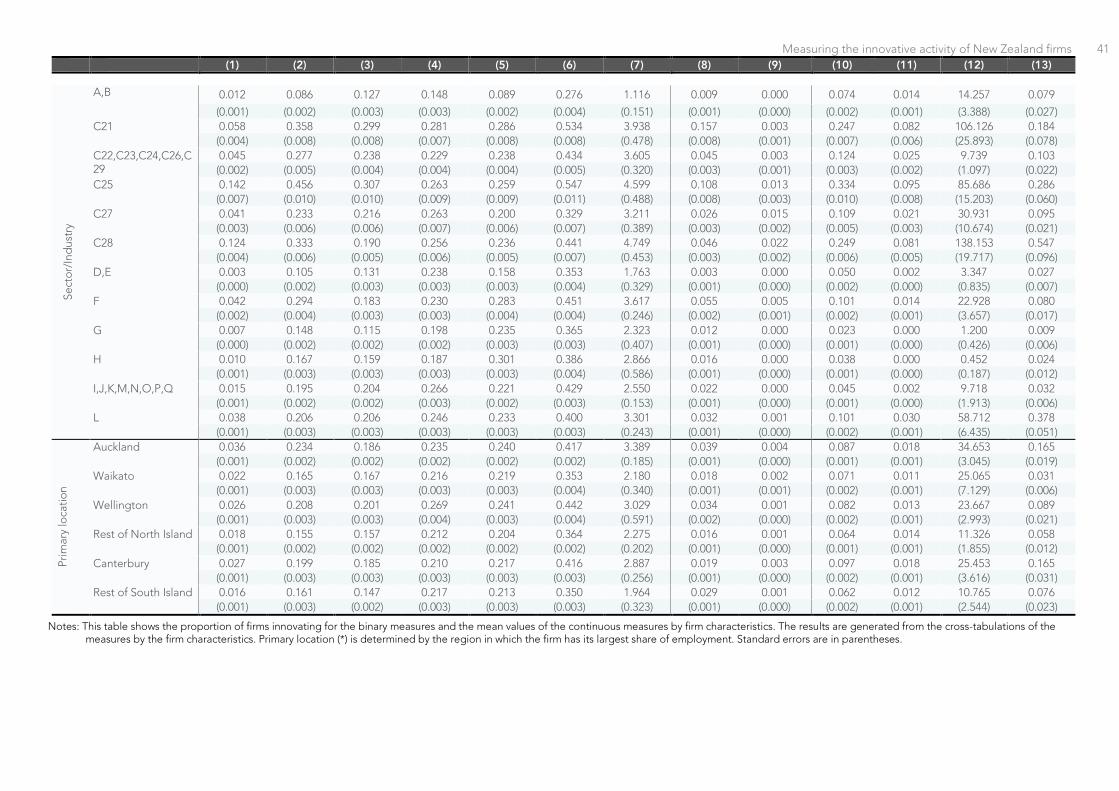
Measuring the innovative activity of New Zealand firms 41
(1) (2) (3) (4) (5) (6) (7) (8) (9) (10) (11) (12) (13)
Sect
or/I
ndus
try
A,B 0.012 0.086 0.127 0.148 0.089 0.276 1.116 0.009 0.000 0.074 0.014 14.257 0.079
(0.001) (0.002) (0.003) (0.003) (0.002) (0.004) (0.151) (0.001) (0.000) (0.002) (0.001) (3.388) (0.027) C21 0.058 0.358 0.299 0.281 0.286 0.534 3.938 0.157 0.003 0.247 0.082 106.126 0.184
(0.004) (0.008) (0.008) (0.007) (0.008) (0.008) (0.478) (0.008) (0.001) (0.007) (0.006) (25.893) (0.078) C22,C23,C24,C26,C29
0.045 0.277 0.238 0.229 0.238 0.434 3.605 0.045 0.003 0.124 0.025 9.739 0.103 (0.002) (0.005) (0.004) (0.004) (0.004) (0.005) (0.320) (0.003) (0.001) (0.003) (0.002) (1.097) (0.022)
C25 0.142 0.456 0.307 0.263 0.259 0.547 4.599 0.108 0.013 0.334 0.095 85.686 0.286 (0.007) (0.010) (0.010) (0.009) (0.009) (0.011) (0.488) (0.008) (0.003) (0.010) (0.008) (15.203) (0.060)
C27 0.041 0.233 0.216 0.263 0.200 0.329 3.211 0.026 0.015 0.109 0.021 30.931 0.095 (0.003) (0.006) (0.006) (0.007) (0.006) (0.007) (0.389) (0.003) (0.002) (0.005) (0.003) (10.674) (0.021)
C28 0.124 0.333 0.190 0.256 0.236 0.441 4.749 0.046 0.022 0.249 0.081 138.153 0.547 (0.004) (0.006) (0.005) (0.006) (0.005) (0.007) (0.453) (0.003) (0.002) (0.006) (0.005) (19.717) (0.096)
D,E 0.003 0.105 0.131 0.238 0.158 0.353 1.763 0.003 0.000 0.050 0.002 3.347 0.027 (0.000) (0.002) (0.003) (0.003) (0.003) (0.004) (0.329) (0.001) (0.000) (0.002) (0.000) (0.835) (0.007)
F 0.042 0.294 0.183 0.230 0.283 0.451 3.617 0.055 0.005 0.101 0.014 22.928 0.080 (0.002) (0.004) (0.003) (0.003) (0.004) (0.004) (0.246) (0.002) (0.001) (0.002) (0.001) (3.657) (0.017)
G 0.007 0.148 0.115 0.198 0.235 0.365 2.323 0.012 0.000 0.023 0.000 1.200 0.009 (0.000) (0.002) (0.002) (0.002) (0.003) (0.003) (0.407) (0.001) (0.000) (0.001) (0.000) (0.426) (0.006)
H 0.010 0.167 0.159 0.187 0.301 0.386 2.866 0.016 0.000 0.038 0.000 0.452 0.024 (0.001) (0.003) (0.003) (0.003) (0.003) (0.004) (0.586) (0.001) (0.000) (0.001) (0.000) (0.187) (0.012)
I,J,K,M,N,O,P,Q 0.015 0.195 0.204 0.266 0.221 0.429 2.550 0.022 0.000 0.045 0.002 9.718 0.032 (0.001) (0.002) (0.002) (0.003) (0.002) (0.003) (0.153) (0.001) (0.000) (0.001) (0.000) (1.913) (0.006)
L 0.038 0.206 0.206 0.246 0.233 0.400 3.301 0.032 0.001 0.101 0.030 58.712 0.378 (0.001) (0.003) (0.003) (0.003) (0.003) (0.003) (0.243) (0.001) (0.000) (0.002) (0.001) (6.435) (0.051)
Prim
ary
loca
tion
Auckland 0.036 0.234 0.186 0.235 0.240 0.417 3.389 0.039 0.004 0.087 0.018 34.653 0.165 (0.001) (0.002) (0.002) (0.002) (0.002) (0.002) (0.185) (0.001) (0.000) (0.001) (0.001) (3.045) (0.019)
Waikato 0.022 0.165 0.167 0.216 0.219 0.353 2.180 0.018 0.002 0.071 0.011 25.065 0.031 (0.001) (0.003) (0.003) (0.003) (0.003) (0.004) (0.340) (0.001) (0.001) (0.002) (0.001) (7.129) (0.006)
Wellington 0.026 0.208 0.201 0.269 0.241 0.442 3.029 0.034 0.001 0.082 0.013 23.667 0.089 (0.001) (0.003) (0.003) (0.004) (0.003) (0.004) (0.591) (0.002) (0.000) (0.002) (0.001) (2.993) (0.021)
Rest of North Island 0.018 0.155 0.157 0.212 0.204 0.364 2.275 0.016 0.001 0.064 0.014 11.326 0.058 (0.001) (0.002) (0.002) (0.002) (0.002) (0.002) (0.202) (0.001) (0.000) (0.001) (0.001) (1.855) (0.012)
Canterbury 0.027 0.199 0.185 0.210 0.217 0.416 2.887 0.019 0.003 0.097 0.018 25.453 0.165 (0.001) (0.003) (0.003) (0.003) (0.003) (0.003) (0.256) (0.001) (0.000) (0.002) (0.001) (3.616) (0.031)
Rest of South Island 0.016 0.161 0.147 0.217 0.213 0.350 1.964 0.029 0.001 0.062 0.012 10.765 0.076 (0.001) (0.003) (0.002) (0.003) (0.003) (0.003) (0.323) (0.001) (0.000) (0.002) (0.001) (2.544) (0.023)
Notes: This table shows the proportion of firms innovating for the binary measures and the mean values of the continuous measures by firm characteristics. The results are generated from the cross-tabulations of the measures by the firm characteristics. Primary location (*) is determined by the region in which the firm has its largest share of employment. Standard errors are in parentheses.

42 New Zealand Productivity Commission Working Paper 2015/2
Table A.4: Conditional innovation rates by firm characteristics (predictive margins with standard errors)
(1) (2) (3) (4) (5) (6) (7) (8) (9) (10) (11) (12) (13)
innovation outputs intermediate outputs innovation inputs goods & services
NTW
goods & services
NTF
oper. processes
NTF
mktg methods
NTF
org. processes
NTF
any innovation
NTF
sales from goods & services NTF (%)
registered trademark
filed patent
application
engaged in R&D
activity
received R&D grant
R&D exp. ($000)
R&D intensity (% total exp.)
Year
2005 0.037 0.228 0.207 0.268 0.244 0.435 3.583 0.026 0.002 0.073 0.017 13.640 0.108
(0.004) (0.012) (0.011) (0.013) (0.013) (0.015) (0.321) (0.003) (0.000) (0.007) (0.002) (2.234) (0.021) 2007 0.025 0.205 0.160 0.221 0.221 0.378 3.146 0.029 0.002 0.063 0.016 16.093 0.094 (0.004) (0.011) (0.011) (0.013) (0.013) (0.015) (0.325) (0.003) (0.001) (0.005) (0.002) (2.255) (0.019) 2009 0.026 0.191 0.165 0.223 0.211 0.360 2.600 0.028 0.003 0.080 0.012 24.149 0.158 (0.003) (0.009) (0.008) (0.010) (0.010) (0.012) (0.204) (0.003) (0.001) (0.005) (0.002) (2.963) (0.021) 2011 0.023 0.178 0.170 0.211 0.219 0.364 2.568 - - 0.089 0.007 24.979 0.192 (0.001) (0.002) (0.002) (0.002) (0.002) (0.003) (0.215) - - (0.002) (0.001) (2.915) (0.026) 2013 0.021 0.168 0.172 0.204 0.228 0.430 1.994 - - 0.085 0.013 29.400 - (0.001) (0.002) (0.002) (0.002) (0.002) (0.003) (0.153) - - (0.001) (0.001) (0.000) -
Em
plo
ymen
t
<20 employees
0.025 0.183 0.162 0.210 0.219 0.382 2.820 0.018 0.001 0.070 0.009 7.772 0.132 (0.002) (0.006) (0.006) (0.007) (0.007) (0.008) (0.150) (0.002) (0.001) (0.004) (0.001) (1.126) (0.016)
20-50 employees
0.031 0.221 0.194 0.264 0.228 0.419 2.647 0.030 0.002 0.094 0.015 23.968 0.201 (0.003) (0.009) (0.008) (0.009) (0.009) (0.011) (0.141) (0.003) (0.001) (0.006) (0.002) (3.504) (0.039)
50-100 employees
0.029 0.235 0.243 0.309 0.263 0.463 2.458 0.056 0.004 0.105 0.027 69.652 0.123 (0.003) (0.008) (0.008) (0.009) (0.009) (0.010) (0.167) (0.005) (0.001) (0.006) (0.002) (13.822) (0.034)
≥100 employees
0.036 0.267 0.300 0.343 0.290 0.503 2.355 0.129 0.014 0.140 0.045 301.820 0.035 (0.004) (0.011) (0.011) (0.012) (0.011) (0.013) (0.213) (0.010) (0.003) (0.009) (0.005) (52.296) (0.042)
Ag
e
<5 years 0.039 0.233 0.196 0.274 0.275 0.471 4.719 0.045 0.007 0.071 0.020 25.531 0.171 (0.007) (0.016) (0.015) (0.016) (0.017) (0.019) (0.530) (0.007) (0.003) (0.009) (0.004) (3.956) (0.035)
5-10 years 0.028 0.205 0.201 0.266 0.244 0.415 2.885 0.026 0.001 0.091 0.012 21.718 0.141 (0.004) (0.011) (0.011) (0.013) (0.013) (0.014) (0.217) (0.004) (0.000) (0.007) (0.002) (3.522) (0.021)
10-20 years 0.031 0.201 0.170 0.209 0.223 0.391 2.604 0.028 0.001 0.077 0.013 23.484 0.158 (0.004) (0.009) (0.008) (0.009) (0.011) (0.012) (0.173) (0.003) (0.000) (0.005) (0.002) (3.278) (0.027)
20-50 years 0.022 0.178 0.163 0.206 0.207 0.369 2.212 0.023 0.003 0.081 0.011 22.066 0.140 (0.002) (0.008) (0.008) (0.010) (0.010) (0.012) (0.156) (0.002) (0.001) (0.005) (0.001) (4.087) (0.024)
≥50 years 0.015 0.146 0.147 0.200 0.173 0.328 1.735 0.025 0.002 0.064 0.011 16.646 0.024 (0.002) (0.014) (0.015) (0.018) (0.015) (0.022) (0.371) (0.003) (0.000) (0.008) (0.002) (6.397) (0.017)

Measuring the innovative activity of New Zealand firms 43
(1) (2) (3) (4) (5) (6) (7) (8) (9) (10) (11) (12) (13) Fo
reig
n o
wne
d No 0.025 0.189 0.175 0.225 0.223 0.392 2.653 0.026 0.002 0.076 0.012 17.582 0.112
(0.002) (0.005) (0.005) (0.006) (0.006) (0.007) (0.120) (0.002) (0.001) (0.003) (0.001) (2.161) (0.012) Yes
0.040 0.256 0.182 0.252 0.248 0.430 4.244 0.038 0.003 0.097 0.016 85.627 0.520 (0.005) (0.016) (0.012) (0.015) (0.016) (0.019) (0.484) (0.009) (0.001) (0.009) (0.002) (14.957) (0.118)
Exp
ort
er No 0.014 0.167 0.160 0.216 0.210 0.374 2.370 0.021 0.001 0.050 0.005 12.389 0.059
(0.002) (0.005) (0.005) (0.006) (0.006) (0.007) (0.117) (0.002) (0.000) (0.003) (0.001) (1.588) (0.008) Yes
0.067 0.316 0.247 0.282 0.302 0.496 4.668 0.049 0.005 0.189 0.032 71.148 0.601 (0.006) (0.015) (0.012) (0.013) (0.014) (0.016) (0.369) (0.006) (0.001) (0.012) (0.004) (8.660) (0.082)
Sect
or/
Ind
ustr
y
A,B 0.012 0.083 0.126 0.149 0.084 0.275 1.028 0.012 0.000 0.062 0.008 15.555 0.051 (0.004) (0.008) (0.010) (0.012) (0.009) (0.015) (0.184) (0.003) (0.000) (0.008) (0.002) (4.809) (0.035) C21 0.030 0.276 0.244 0.236 0.246 0.479 3.167 0.086 0.001 0.147 0.022 31.630 -0.021 (0.006) (0.029) (0.024) (0.022) (0.025) (0.030) (0.618) (0.015) (0.000) (0.023) (0.005) (23.319) (0.096) C22,C23,C24, C26,C29
0.039 0.258 0.228 0.225 0.236 0.428 3.472 0.039 0.002 0.098 0.013 -1.436 0.062 (0.008) (0.015) (0.014) (0.014) (0.014) (0.017) (0.337) (0.006) (0.001) (0.010) (0.003) (2.818) (0.030)
C25 0.071 0.338 0.243 0.219 0.216 0.475 3.237 0.059 0.003 0.189 0.035 31.898 0.031 (0.016) (0.031) (0.027) (0.027) (0.027) (0.035) (0.538) (0.016) (0.001) (0.023) (0.007) (20.411) (0.087) C27 0.035 0.229 0.214 0.264 0.200 0.334 3.209 0.022 0.010 0.089 0.015 24.007 0.057 (0.010) (0.026) (0.024) (0.025) (0.022) (0.027) (0.444) (0.006) (0.004) (0.015) (0.005) (14.470) (0.028) C28 0.090 0.293 0.169 0.243 0.218 0.418 4.427 0.034 0.012 0.181 0.038 123.088 0.558 (0.012) (0.022) (0.016) (0.020) (0.021) (0.027) (0.501) (0.009) (0.005) (0.019) (0.006) (35.275) (0.146) D,E 0.006 0.131 0.150 0.258 0.176 0.386 2.249 0.005 0.001 0.073 0.004 22.122 0.126 (0.004) (0.015) (0.017) (0.021) (0.018) (0.025) (0.340) (0.001) (0.001) (0.011) (0.001) (2.885) (0.016) F 0.030 0.254 0.171 0.223 0.271 0.432 3.083 0.047 0.004 0.075 0.010 2.949 -0.051 (0.005) (0.016) (0.014) (0.015) (0.018) (0.020) (0.300) (0.007) (0.002) (0.010) (0.002) (5.587) (0.033) G 0.010 0.165 0.124 0.209 0.250 0.384 2.651 0.014 0.000 0.033 0.000 10.228 0.092 (0.005) (0.017) (0.015) (0.020) (0.021) (0.024) (0.436) (0.004) (0.000) (0.007) (0.000) (2.264) (0.018) H 0.015 0.178 0.165 0.188 0.296 0.383 2.776 0.020 0.000 0.057 0.000 15.413 0.097 (0.008) (0.026) (0.023) (0.024) (0.030) (0.030) (0.593) (0.008) (0.000) (0.016) (0.000) (2.754) (0.026) I,J,K,M,N,O,P,Q
0.019 0.209 0.210 0.269 0.227 0.434 2.756 0.024 0.001 0.057 0.003 11.538 0.077 (0.003) (0.010) (0.009) (0.010) (0.010) (0.012) (0.173) (0.003) (0.000) (0.006) (0.001) (2.540) (0.012)
L 0.035 0.203 0.204 0.245 0.235 0.398 3.271 0.031 0.001 0.098 0.026 53.473 0.479 (0.005) (0.012) (0.011) (0.012) (0.012) (0.015) (0.295) (0.005) (0.000) (0.008) (0.004) (9.185) (0.078)

44 New Zealand Productivity Commission Working Paper 2015/2
(1) (2) (3) (4) (5) (6) (7) (8) (9) (10) (11) (12) (13) R
egio
n
Auckland 0.027 0.200 0.170 0.220 0.219 0.392 2.970 0.029 0.002 0.072 0.011 19.300 0.143 (0.003) (0.008) (0.008) (0.009) (0.009) (0.012) (0.204) (0.002) (0.001) (0.005) (0.001) (3.860) (0.025) Waikato 0.026 0.181 0.177 0.226 0.230 0.369 2.379 0.023 0.003 0.077 0.011 29.905 0.075 (0.006) (0.020) (0.019) (0.020) (0.021) (0.026) (0.442) (0.005) (0.001) (0.009) (0.002) (8.744) (0.015) Wellington 0.030 0.213 0.200 0.264 0.237 0.439 3.016 0.036 0.002 0.091 0.016 20.801 0.095 (0.008) (0.018) (0.018) (0.020) (0.019) (0.024) (0.623) (0.006) (0.001) (0.012) (0.003) (5.129) (0.030) Rest of North Island
0.025 0.185 0.175 0.229 0.232 0.389 2.703 0.023 0.001 0.078 0.015 21.998 0.127 (0.004) (0.011) (0.011) (0.013) (0.014) (0.015) (0.227) (0.004) (0.001) (0.007) (0.003) (3.245) (0.023)
Canterbury 0.028 0.199 0.188 0.214 0.219 0.422 2.916 0.021 0.004 0.096 0.015 28.724 0.217 (0.004) (0.014) (0.012) (0.014) (0.015) (0.018) (0.278) (0.004) (0.001) (0.010) (0.002) (6.746) (0.051) Rest of South Island
0.022 0.182 0.158 0.230 0.226 0.366 2.258 0.034 0.002 0.072 0.013 20.380 0.146 (0.004) (0.016) (0.014) (0.017) (0.019) (0.020) (0.311) (0.008) (0.001) (0.008) (0.003) (4.328) (0.029)
Adj./Pseudo R2 0.168 0.0690 0.0333 0.0235 0.0292 0.0274 0.0337 0.168 0.345 0.148 0.285 0.0252 0.0291 #obs. (rounded) 26004 26004 26004 26004 26004 25323 25521 15576 15576 25734 26004 25683 19575
Notes: This table shows the predictive margins generated from a probit regression for the binary measures and from an OLS regression for the continuous measures. For the binary measures, the predictive margins correspond to the predicted proportion of firms innovating and for the continuous measures they correspond to the predicted mean values, conditional on the other characteristics being held at their mean. Primary location (*) is determined by the region in which the firm has its largest share of employment. Robust standard errors, clustered by firm, are in parentheses.

Measuring the innovative activity of New Zealand firms 45
Table A.5: Comparison of means for full sample vs. firms with IR10 data All firms in LBD BOS sample all with IR10
data N(with IR10 data)
/N(all) all with IR10
data N(with IR10 data)
/N(all) variable category mean mean mean mean
Goods & services NTW 3.9% 3.0%*** 40.8% Goods & services NTNZ 9.9% 7.9%*** 42.0% Goods & services NTF 24.6% 22.0%*** 47.3% Operational processes NTF 22.9% 21.3%*** 49.0% Organisational processes NTF 27.7% 26.0%*** 49.5% Marketing methods NTF 24.1% 23.2%** 50.9% Any innovation NTF 43.8% 41.5%*** 49.8% Sales from goods & services NTF (%) 3.03 2.90 50.5% Registered trademark 6.1% 4.0%*** 42.5% Filed patent application 0.7% 0.4%*** 33.3% Engaged in R&D activity 12.2% 9.5%*** 41.0% Received R&D grant 3.2% 2.2%*** 37.0% R&D exp. ($000) $86.7 $21.5*** 13.0% R&D intensity (% total exp.) 0.26 0.31* 80.3%
Year 2005 11.8% 12.2%*** 71.0% 22.7% 28.5%*** 66.4% 2007 12.4% 12.6%*** 70.4% 20.5% 24.9%*** 64.1% 2009 12.4% 13.0%*** 72.0% 19.8% 23.9%*** 63.6% 2011 12.0% 12.8%*** 73.3% 19.0% 22.7%*** 63.1% 2013 3.7% 0.0%*** 0.0% 18.0% 0.0%*** 0.0%
# employees
n 3.40 2.68*** 55.4% 77.29 40.79*** 27.8% 0 35.1% 28.9%*** 57.7% - - - <20 63.1% 69.5%*** 77.3% 44.3% 48.7%*** 58.0% 20-50 1.2% 1.2%*** 67.6% 25.2% 27.3%*** 57.3% 50-100 0.3% 0.3%*** 54.1% 16.8% 16.1%** 50.6% ≥100 0.3% 0.1%*** 33.8% 13.7% 7.9%*** 30.4%
Age
n 25.47 22.41*** 46.3% <5 years 10.1% 11.6%*** 60.6% 5-10 years 16.5% 18.7%*** 59.7% 10-20 years 28.4% 29.6%*** 54.8% 20-50 years 31.8% 30.0%*** 49.8% ≥50 years 13.2% 10.1%*** 40.0%
Foreign owned
No 85.5% 93.4%*** 57.8% Yes 14.5% 6.6%*** 24.2%
Exporter No 76.0% 80.5%*** 55.9% Yes 24.0% 19.5%*** 42.8%
Sector/Industry (ANSIC96)
A,B 16.3% 16.9%*** 71.2% 10.2% 11.8%*** 61.2% C21 0.5% 0.5%*** 64.2% 3.5% 2.7%*** 40.5% C22,C23,C24,C26,C29 2.6% 2.6% 68.9% 10.2% 10.2% 52.9% C25 0.3% 0.3%*** 62.5% 2.4% 1.7%*** 37.3% C27 0.9% 0.9% 69.2% 2.6% 2.7% 54.9% C28 1.5% 1.5%** 69.9% 4.7% 4.4%** 48.4% D,E 11.7% 11.7%*** 68.5% 5.3% 5.6% 56.3% F 4.5% 4.3%*** 66.7% 8.7% 7.1%*** 43.0% G 10.1% 10.0%*** 68.0% 7.5% 8.6%*** 60.8% H 3.4% 3.2%*** 64.6% 3.3% 3.8%** 59.3% I,J,K,M,N,O,P,Q 16.3% 16.4%*** 69.4% 23.0% 21.7%*** 49.9% L 31.9% 31.9%** 68.7% 18.6% 19.7%*** 56.0%
Primary location
Auckland 38.3% 34.0%*** 47.0% Waikato 7.8% 7.9% 53.8% Wellington 9.7% 9.0%*** 48.8% Rest of North Island 20.3% 22.0%*** 57.1% Canterbury 12.7% 14.6%*** 60.7% Rest of South Island 11.2% 12.5%*** 59.0%
Notes: This table compares the means of the sample with IR10 vs. the whole sample, for both the complete set of firms in the LBD and for the BOS sample specifically. *, **, and *** indicate that the difference in means – mean(all) minus mean(with IR10 data) – is statistically significant at 10%, 5%, and 1% levels, respectively.

46 New Zealand Productivity Commission Working Paper 2015/2
Table A.6: Comparison of means for firms in full BOS sample vs. innovation panel
BOS sample BOS innovation panel N(BOS innovation panel)/ N(BOS sample)
variable category mean mean Goods & services NTW 3.9% 4.8%*** 35.7% Goods & services NTNZ 9.9% 11.4%*** 33.7% Goods & services NTF 24.6% 27.9%*** 33.1% Operational processes NTF 22.9% 25.1%*** 32.0% Organisational processes NTF 27.7% 27.9% 29.4% Marketing methods NTF 24.1% 24.7% 30.0% Any innovation NTF 43.8% 44.4% 29.8% Sales from goods & services NTF (%) 3.03 2.87* 27.9% Registered trademark 6.1% 9.3% 42.5% Filed patent application 0.7% 1.0%** 42.2% Engaged in R&D activity 12.2% 15.3% 36.8% Received R&D grant 3.2% 4.3% 40.0% R&D exp. ($000) $86.1 $115.2** 39.7% R&D intensity (% total exp.) 0.20% 0.17% 25.3%
Year 2005 22.7% 20.0%*** 25.7% 2007 20.5% 20.0% 28.5% 2009 19.8% 20.0% 29.5% 2011 19.0% 20.0%** 30.7% 2013 18.0% 20.0%*** 32.4%
# employees
n 77.29 108.64*** 41.1% <20 44.3% 30.0%*** 19.8% 20-50 25.2% 25.5% 29.6% 50-100 16.8% 22.6%*** 39.3% ≥100 13.7% 21.8%*** 46.6%
Age n 25.63 32.89*** 37.5% <5 years 10.1% 2.7%*** 7.9% 5-10 years 16.5% 10.5%*** 18.7% 10-20 years 28.4% 28.3% 29.6% 20-50 years 31.8% 38.9%*** 36.3% ≥50 years 13.2% 19.6%*** 44.0%
Foreign owned
No 85.5% 82.3%*** 28.1% Yes 14.5% 17.7%*** 35.6%
Exporter No 76.0% 70.1%*** 26.9% Yes 24.0% 29.9%*** 36.4%
Sector/ Industry
(ANSIC96)
A,B 10.2% 8.0%*** 23.1% C21 3.5% 5.4%*** 44.6% C22,C23,C24,C26,C29 10.2% 12.3%*** 35.3% C25 2.4% 3.4%*** 41.3% C27 2.6% 2.6% 29.7% C28 4.7% 5.8%*** 35.7% D,E 5.3% 4.0%*** 22.3% F 8.7% 11.0%*** 36.9% G 7.5% 6.8%** 26.5% H 3.3% 2.4%*** 21.1% I,J,K,M,N,O,P,Q 23.0% 23.6% 30.0% L 18.6% 14.5%*** 22.8%
Primary location
Auckland 38.3% 40.1%*** 30.6% Waikato 7.8% 7.0%*** 26.2% Wellington 9.7% 9.3% 27.9% Rest of North Island 20.3% 19.5%* 28.0% Canterbury 12.7% 13.2% 30.3% Rest of South Island 11.2% 10.9% 28.5%
Notes: This table compares the unweighted means of the continuous variables and the proportion of firms for the binary indicators for the sample of firms for which we have observations for full BOS sample vs. the BOS longitudinal sample. . *, **, and *** indicate that the difference in means – mean(BOS sample) minus mean(BOS innovation panel) – is statistically significant at 10%, 5%, and 1% levels, respectively.

Measuring the innovative activity of New Zealand firms 47
Table A.7: Mean persistence scores for each innovation indicator conditioned on firm characteristics (with standard errors)
(1) (2) (3) (4) (5) (6) (7) (8) (9) (10)
outputs intermediate outputs inputs
goods & services NTW
goods & services NTF
oper. processes
NTF
mktg methods NTF
org. processes NTF
any innovation NTF
registered trademark
filed patent application
engaged in R&D activity
received R&D grant
Em
plo
ymen
t
<20 employees
0.1429 0.2990 0.9494 0.8801 0.9190 1.0318 1.7923 0.0653 0.0020 0.0022
(0.0253) (0.0383) (0.0720) (0.0688) (0.0705) (0.0941) (0.1125) (0.0129) (0.0012) (0.0019)
20-50 employees
0.2350 0.4395 1.2355 0.9582 1.1868 1.1409 2.0200 0.1227 0.0077 0.0172
(0.0489) (0.0719) (0.1024) (0.0803) (0.1062) (0.1193) (0.1059) (0.0260) (0.0040) (0.0134) 50-100 employees
0.1558 0.4597 1.3255 1.3087 1.5240 1.3720 2.2291 0.2399 0.0208 0.0199
(0.0351) (0.0514) (0.0896) (0.0845) (0.0828) (0.0828) (0.1073) (0.0370) (0.0097) (0.0122)
≥100 employees
0.2178 0.6120 1.4240 1.5207 1.6495 1.4184 2.4480 0.7411 0.0797 0.0918
(0.0416) (0.0693) (0.1001) (0.0859) (0.0882) (0.0959) (0.1104) (0.0710) (0.0226) (0.0242)
Ag
e
<5 years 0.1161 0.3627 1.0320 1.0635 1.0886 1.2073 2.0047 0.1446 0.0082 0.0094
(0.0319) (0.0724) (0.1682) (0.1596) (0.1771) (0.2120) (0.2217) (0.0333) (0.0027) (0.0048)
5-10 years 0.1695 0.3627 1.1971 1.0119 1.0556 1.0157 2.0015 0.0954 0.0008 0.0016
(0.0505) (0.0712) (0.1172) (0.1014) (0.1056) (0.1168) (0.1508) (0.0230) (0.0026) (0.0042) 10-20 years 0.2706 0.4636 1.2371 1.1549 1.1666 1.3462 2.1184 0.1222 0.0059 0.0025
(0.0512) (0.0687) (0.1065) (0.0998) (0.1143) (0.1632) (0.1392) (0.0216) (0.0026) (0.0028)
20-50 years 0.1150 0.3047 0.7869 0.5806 0.8473 0.8910 1.5739 0.1170 0.0147 0.0260
(0.0232) (0.0378) (0.0798) (0.0699) (0.0980) (0.1126) (0.1400) (0.0194) (0.0044) (0.0113) ≥50 years 0.0904 0.2202 1.0887 1.1675 1.2228 1.0111 1.9862 0.1833 0.0140 0.0165
(0.0305) (0.0620) (0.1741) (0.1794) (0.1405) (0.1887) (0.2714) (0.0345) (0.0071) (0.0082)
Fore
ign
ow
ned
No 0.1595 0.3339 1.0389 0.9646 1.0467 1.0967 1.8971 0.1279 0.0088 0.0100
(0.0203) (0.0290) (0.0540) (0.0506) (0.0548) (0.0709) (0.0789) (0.0123) (0.0022) (0.0039) Yes 0.2663 0.6401 1.3403 0.9117 1.1796 1.1276 2.0759 0.1123 0.0084 0.0306
(0.0838) (0.1413) (0.1913) (0.1276) (0.1264) (0.1554) (0.1919) (0.0459) (0.0117) (0.0148)
Exp
ort
er No 0.0960 0.2532 0.8884 0.8838 1.0293 1.0037 1.8493 0.0976 0.0049 0.0050
(0.0185) (0.0289) (0.0576) (0.0569) (0.0576) (0.0736) (0.0899) (0.0107) (0.0015) (0.0021) Yes 0.4387 0.7499 1.7179 1.2517 1.1603 1.4601 2.1285 0.2371 0.0236 0.0365
(0.0725) (0.0894) (0.1503) (0.1003) (0.1439) (0.1824) (0.1637) (0.0388) (0.0060) (0.0151)

48 New Zealand Productivity Commission Working Paper 2015/2
(1) (2) (3) (4) (5) (6) (7) (8) (9) (10) Se
cto
r/In
dus
try
A,B 0.0381 0.1370 0.4803 0.7471 0.7607 0.6245 1.3806 0.0592 0.0023 -0.0021 (0.0379) (0.0694) (0.1145) (0.1208) (0.1212) (0.1411) (0.2325) (0.0232) (0.0022) (0.0034) C21 0.0911 0.4895 1.4895 1.0404 0.9658 1.0992 2.4338 0.4460 -0.0008 -0.0101 (0.1089) (0.1801) (0.3220) (0.2212) (0.2196) (0.2839) (0.2876) (0.1134) (0.0096) (0.0114) C22,C23,C24,C26,C29
0.2309 0.5721 1.1436 1.2136 0.8371 0.9035 2.0655 0.1517 0.0197 -0.0026 (0.0971) (0.1244) (0.1689) (0.1426) (0.1019) (0.1291) (0.2240) (0.0412) (0.0086) (0.0048)
C25 0.7743 1.2211 1.8938 1.4864 0.8981 0.8188 2.6348 0.3490 0.0765 0.0256 (0.2577) (0.3211) (0.3445) (0.2181) (0.2138) (0.2394) (0.3572) (0.1091) (0.0433) (0.0222) C27 0.3104 0.4621 1.3202 1.2858 1.1695 0.8251 1.7276 0.1749 0.0150 0.1226
(0.1697) (0.2154) (0.3750) (0.2350) (0.1824) (0.2561) (0.2416) (0.0896) (0.0108) (0.0908) C28 0.5815 0.7482 1.3170 0.8286 1.1555 1.0412 1.7994 0.2152 0.0607 0.0904 (0.1688) (0.1809) (0.2234) (0.1690) (0.1944) (0.2434) (0.2639) (0.0708) (0.0268) (0.0363) D,E 0.0729 0.1484 0.5294 0.4637 0.8904 0.5886 1.0366 0.0548 0.0062 0.0135
(0.0251) (0.0313) (0.1141) (0.1182) (0.1293) (0.1564) (0.2083) (0.0140) (0.0023) (0.0050) F 0.0738 0.2775 1.2540 0.8270 1.0738 1.4528 2.0806 0.2237 0.0023 -0.0037 (0.0399) (0.0825) (0.1269) (0.1071) (0.1231) (0.2181) (0.1552) (0.0561) (0.0067) (0.0089) G 0.1005 0.1568 1.0061 0.9871 1.0951 1.2854 2.1864 0.0635 0.0046 0.0063
(0.0369) (0.0406) (0.1602) (0.1714) (0.1959) (0.2376) (0.2765) (0.0201) (0.0025) (0.0037) H 0.1938 0.5766 1.1735 0.7972 0.9605 1.4956 1.2142 0.0613 0.0079 0.0111 (0.1116) (0.2378) (0.3529) (0.3163) (0.3791) (0.5035) (0.4416) (0.0216) (0.0038) (0.0066) I,J,K,M,N,O,P,Q
0.1583 0.3828 1.2484 1.1091 1.2970 1.1237 2.1274 0.1253 0.0038 0.0078
(0.0359) (0.0609) (0.1122) (0.0925) (0.1026) (0.1052) (0.1465) (0.0283) (0.0017) (0.0037) L 0.1495 0.3131 0.8132 0.9406 1.0521 1.0796 1.7664 0.0893 -0.0024 0.0002 (0.0527) (0.0671) (0.1288) (0.1045) (0.1143) (0.1521) (0.2027) (0.0301) (0.0020) (0.0032)
Prim
ary
loca
tion
Auckland 0.1671 0.3884 1.1360 0.9369 1.0611 1.0045 1.8369 0.1454 0.0133 0.0120
(0.0384) (0.0543) (0.1015) (0.0758) (0.0947) (0.0958) (0.1215) (0.0222) (0.0042) (0.0079) Waikato 0.1644 0.2505 0.8301 1.2320 0.9702 1.0194 2.2093 0.1619 0.0073 0.0152 (0.1011) (0.1061) (0.1771) (0.2654) (0.1902) (0.2207) (0.3517) (0.0365) (0.0041) (0.0072) Wellington 0.0834 0.3071 0.9269 0.6397 0.9158 0.9524 1.7539 0.1136 0.0075 0.0122
(0.0324) (0.0594) (0.1108) (0.1332) (0.1525) (0.1437) (0.2063) (0.0286) (0.0056) (0.0102) Rest of North Island
0.1809 0.3389 0.9918 1.0510 1.0753 1.1980 1.8417 0.1304 0.0043 0.0063
(0.0390) (0.0510) (0.1066) (0.1150) (0.1074) (0.1699) (0.1895) (0.0313) (0.0021) (0.0035) Canterbury 0.1792 0.3551 1.0737 0.8158 1.0110 1.1848 1.8363 0.0912 0.0105 0.0149
(0.0486) (0.0963) (0.1576) (0.0970) (0.1565) (0.2132) (0.1550) (0.0209) (0.0063) (0.0080) Rest of South Island
0.1906 0.4060 1.2032 1.0743 1.2033 1.2117 2.2725 0.1023 0.0051 0.0129
(0.0505) (0.0730) (0.1638) (0.1489) (0.1901) (0.2220) (0.2245) (0.0267) (0.0035) (0.0065) #obs. (rounded) 1674 1674 1674 1674 1674 1542 1674 1674 1587 1674

Measuring the innovative activity of New Zealand firms 49
Notes: This table shows the mean persistence scores for all firms conditioned on firm characteristics with their standard errors. These results are generated from an OLS regression of the persistence scores on firm characteristics. The dependent variables are the mean persistence scores for the various binary innovation indicators. The mean persistence score is a count of the number of years in which the firm responded “yes” to the appropriate question in the BOS, and ranges from 0 to 5 (i.e., responding yes in all odd years from 2005 to 2013.

50 New Zealand Productivity Commission Working Paper 2015/2
References Bloom, N., Dorgan, S., Dowdy, J., & Van Reenen, J. (2007). Management practice and productivity: Why
they matter.
Bloom, N., & Reenen, J. V. (2010). Why do management practices differ across firms and countries? The Journal of Economic Perspectives, 203-224.
Cohen, W. M., & Levinthal, D. A. (1989). Innovation and Learning: The Two Faces of R&D. Economic Journal, 99(397), 569-596.
Cohen, W. M., Nelson, R. R., & Walsh, J. P. (2000, February 2000). Protecting Their Intellectual Assets: Appropriability Conditions and Why U.S. Manufacturing Firms Patent (or Not). NBER Working Paper, (7552). National Bureau of Economic Research, Inc.
Crawford, R., Fabling, R., Grimes, A., & Bonner, N. (2007). National R&D and patenting: is New Zealand an outlier? New Zealand Economic Papers, 41(1), 69-90.
Crepon, B., Duguet, E., & Mairesse, J. (1998). Research, Innovation And Productivity: An Econometric Analysis At The Firm Level. Economics of Innovation and New Technology, 7(2), 115-158. doi: 10.1080/10438599800000031
de Serres, A., Yashiro, N., & Boulhol, H. (2014). An International Perspective on the New Zealand Productivity Paradox. Paper presented at the New Zealand Productivity Commission Working Paper, Wellington, New Zealand.
Debski, I., & Williams, J. (2007, 27-29 June 2007). Business Research and Development in New Zealand: The relevance of industry composition and R&D intensity. Paper presented at the New Zealand Association of Economists' Conference, Christchurch, New Zealand.
Di Maio, M., & Blakeley, N. (2004). Business Research and Development and Industry Structure. New Zealand Treasury.
Dutta, S. (2013). The Global Innovation Index Report 2013.
Fabling, R. (2007). How Innovative are New Zealand Firms? Quantifying and Relating Organizational and Marketing Innovation to Traditional Science and Technology Indicators. Paper presented at the Science, Technology and Innovation Indicators in a Changing World: Responding to Policy Needs, OECD, Paris.
Fabling, R. (2008). Will a BERD model fly? Estimating aggregate R&D expenditure using a micro model.
Fabling, R. (2009). A Rough Guide to New Zealand's Longitudinal Business Database. Global COE Hi-Stat Discussion Paper Series, (gd09-103). Institute of Economic Research, Hitotsubashi University.
Fabling, R., & Grimes, A. (2010). HR practices and New Zealand firm performance: what matters and who does it? The International Journal of Human Resource Management, 21(4), 488-508. doi: 10.1080/09585191003611994
Fabling, R., & Grimes, A. (2014). The “Suite” Smell of Success: Personnel Practices and Firm Performance. ILR Review, 67(4), 1095-1126. doi: 10.1177/0019793914546297
Fabling, R., & Sanderson, L. (2014). Foreign acquisition and the performance of New Zealand firms. New Zealand Economic Papers, 48(1), 1-20.
Green, R., Agarwal, R., Brown, P., Tan, H., & Randhawa, K. (2011). Management Matters in New Zealand: How Does Manufacturing Measure Up? Occasional Paper, 11, 03.

Measuring the innovative activity of New Zealand firms 51
Greenhalgh, C., & Rogers, M. (2007). Trade Marks and Performance in UK Firms: evidence of Schumpeterian competition through innovation. Department of Economics, University of Oxford.
Griffith, R., Redding, S., & Van Reenen, J. (2004). Mapping the two faces of R&D: productivity growth in a panel of OECD industries. Review of Economics and Statistics, 86(4), 883-895.
Griliches, Z. (1981). Market value, R&D, and patents. Economic Letters, 7, 183-187.
Griliches, Z. (1994). Productivity, R&D, and the Data Constraint. The American Economic Review, 84(1), 1-23. doi: 10.2307/2117968
Hall, B. H., Mairesse, J., & Mohnen, P. (2009). Measuring the Returns to R&D: National Bureau of Economic Research.
Hong, S. (2013). Innovation in New Zealand: A Firm-Level Analysis. (Doctor of Philosophy), University of Canterbury. Retrieved from http://hdl.handle.net/10092/7659
Hong, S., McCann, P., & Oxley, L. (2013). Innovation in New Zealand: issues of firm size, local market size and economic geography Handbook of Industry Studies and Economic Geography (pp. 459).
Jaffe, A., & Le, T. (2015). The impact of R&D subsidy on on innovation: a study of New Zealand firms. Motu Working Papers, (WP 15-08).
Jaffe, A. B., & Trajtenberg, M. (2002). Patents, citations, and innovations: A window on the knowledge economy. Cambridge, MA: MIT Press.
Jensen, P. H., & Webster, E. (2009). Another look at the Relationship between Innovation Proxies. Australian Economic Papers, 48(3), 252-269. doi: 10.1111/j.1467-8454.2009.00374.x
Jiang, N., & Sharp, B. (2012, June 2012). Intellectual Property and Productivity. Ministry of Economic Development Occasional Paper.
Mazoyer, P. (1999). Analysis of R&D structure and intensities. Research Paper. Wellington.
Millot, V. (2009). Trademarks as an indicator of product and marketing innovations: OECD Publishing.
New Zealand Government. (2014). Business Growth Agenda: Future Direction 2014. Wellington: New Zealand Government.
OECD. (2005). Oslo manual: Guidelines for collecting and interpreting innovation data: OECD publishing.
OECD. (2012). Comparative performance of national science and innovation systems OECD Science, Technology and Industry Outlook 2012: OECD Publishing.
Oxley, L., Hong, S., & McCann, P. (2013). Why Size Maters: Investigating the Drivers of Innovation and Economic Performance in New Zealand using the Business Operation Survey.
Palangkaraya, A., Stierwald, A., Webster, E., & Jensen, P. H. (2010). Examining the Characteristics of Innovative Firms in Australia: A Report for the Australian Government Department of Innovation, Industry, Science and Research.
Roper, S., & Love, J. H. (2002). Innovation and export performance: evidence from the UK and German manufacturing plants. Research policy, 31(7), 1087-1102.
Rosenberg, N. (1994). Exploring the Black Box: Technology, Economics, and History. Cambridge: Cambridge University Press.
Somaya, D., Teece, D., & Wakeman, S. (2011). Innovation in multi-invention contexts: Mapping solutions to technological and intellectual property complexity. California Management Review, 53(4), 47-79.

52 New Zealand Productivity Commission Working Paper 2015/2
Statistics New Zealand. (2012). Innovation in New Zealand: 2011.
Statistics New Zealand. (2014). Innovation in New Zealand: 2013. Wellington: Statistics New Zealand.
Williams, J. P., Debski, I., & White, R. (2008). Business Expenditure on Research and Development in New Zealand: Future potential and future industries. Ministry of Research Science and Technology.