Measuring the Gig Economy: Current Knowledge and Open...
51
Measuring the Gig Economy: Current Knowledge and Open Issues * Katharine G. Abraham University of Maryland and NBER [email protected] John C. Haltiwanger University of Maryland and NBER [email protected] Kristin Sandusky U.S. Census Bureau [email protected] James R. Spletzer U.S. Census Bureau [email protected] March 2, 2017 * Any opinions and conclusions expressed herein are those of the authors and do not necessarily represent the views of the U.S. Census Bureau. All results have been reviewed to ensure that no confidential information is disclosed. We thank Ron Jarmin and Kristin McCue for helpful comments and suggestions on an earlier draft.
Transcript of Measuring the Gig Economy: Current Knowledge and Open...
Measuring the Gig Economy: Current Knowledge and Open Issues*
Katharine G. Abraham University of Maryland and NBER
John C. Haltiwanger University of Maryland and NBER
Kristin Sandusky U.S. Census Bureau
James R. Spletzer U.S. Census Bureau
March 2, 2017
* Any opinions and conclusions expressed herein are those of the authors and do not necessarily represent the views of the U.S. Census Bureau. All results have been reviewed to ensure that no confidential information is disclosed. We thank Ron Jarmin and Kristin McCue for helpful comments and suggestions on an earlier draft.
1 | P a g e
I. Introduction
In recent years, the popular press has been full of stories premised on the idea that the share of
U.S. jobs that do not involve a formal employer-employee relationship is large and growing. Both media
sources and scholars have adopted the term “gig economy” to refer broadly to these less structured work
arrangements as well as more narrowly to the subset of flexible jobs mediated through various online
platforms. The latter have been viewed as yielding an increasingly “on demand” economy where goods
and services can be acquired through apps on smartphones and other web based applications. The current
discussion regarding alternative work arrangements echoes an earlier discussion that arose in the late
1980s and 1990s (e.g., Abraham 1988, 1990; Barker and Christensen 1998). Then as now, there was talk
of dramatic growth in the numbers of people working in contingent or precarious jobs – positions in
which workers had no long-term connection to a particular business, but were employed to complete a
specific task or for a defined period of time – or under other non-standard employment arrangements.
The recent resurgence of interest in non-traditional work arrangements reflects the perception that new
technology, along with the restructuring of business enterprises made possibly by this technology, is
producing an accelerated pace of change in the organization of work that is having important effects on
both workers and firms.
Much of the discussion of the gig economy, as well as the broader discussion of non-employee
work arrangements, has focused on the implications of growth in these arrangements for workers and
their families. On the one hand, gig work may enable individuals to better match their skills to work
projects in a flexible manner that they find attractive. Making a similar point, Hurst and Pugsley (2011),
for example, argue that self-employed workers enjoy substantial non-pecuniary benefits in the form of
being one’s own boss, enjoying flexible hours and so on. On the other hand, some of those performing
gig work are not doing so by choice. Similar to others who are not employees of the firms for which they
are providing labor services, gig workers do not enjoy the legal rights and protections afforded under the
unemployment insurance system, the workers compensation system, the Fair Labor Standards Act and
other laws and regulations written with more traditional employment arrangements in mind (Harris and
2 | P a g e
Krueger 2015). Further, they are markedly less likely to have health insurance or to have a retirement
plan (Jackson, Looney and Romnath 2017) and may have hours and earnings that are substantially more
variable and less predictable.
Advances in technology resting on digitization and the inter-connectivity of the internet have
made it increasingly attractive for firms to re-organize their activities so that a greater share of work is
performed by individuals who are not employees of the firm. These new technologies make it more
feasible for firms to organize their workforce on a project-specific basis, utilizing a changing cast of
workers with the mix of skills that is appropriate for each project (National Academies Press 2017). Such
a shift from traditional employees to non-employees may be viewed as a means of reducing wage and
benefit costs (Abraham and Taylor 1996; Dube and Kaplan 2010; Goldschmidt and Schmieder 2015) in
addition to positioning the firm to be able to respond quickly to shifts in demand. In a related manner,
these same technological advances have facilitated the segmentation of the various aspects of firms’
production processes (see, e.g., Fort 2016). On the other hand, while offering some clear advantages to
firms, increased reliance on outsourcing also implies less accumulation of firm-specific human capital.
Even within narrowly defined sectors, there is enormous heterogeneity in the productivity and
profitability of individual firms (see, e.g., Foster, Haltiwanger and Krizan 2001). Differences in the
ability to attract, train and retain high quality workers, especially those performing functions that are core
to the firm, seem likely to be an important contributor to this heterogeneity in firm-level outcomes.
Growth in non-employee work also matters for the measurement of economic activity. The
current system of economic measurement is designed for a world in which work generally occurs within
traditional employment relationships. Each month, for example, the Current Population Survey (CPS)
collects information from households about work that household members have done for pay or profit.
Like other ongoing household surveys, however, the survey questionnaire may not always cue
respondents to report work that they do not think of as a job and, beyond asking broad questions to
distinguish wage and salary work from self-employment or unpaid family work, is not designed to probe
regarding the nature of the arrangements under which work occurs. Further, even the questions that are
3 | P a g e
asked focus primarily on the main job. These limitations could mean that important changes in work
activity, including changes in the prevalence of multiple job-holding, are not being captured. Other
surveys collect information from businesses on the number of people they employ and the hours those
employees work, but do not capture the labor input of people who are not on those businesses’ payrolls.
To the extent that an increasing share of the labor input embodied in firms’ products is supplied by non-
employees whose hours are not well captured by existing data collections, measures of labor productivity
growth may be distorted. To illustrate, the Bureau of Labor Statistics (BLS) major sector productivity
program uses CPS data to measure the labor input of the self-employed. If recent increases in non-
employee work are not well captured by the CPS, then labor productivity growth may have been
overstated. Further, if different sectors have made more or less intensive use of non-employee labor
input, the pattern of growth in productivity may be distorted as well. These potential distortions in
sectoral measures of productivity are related to the longstanding issue of whether purchased services are
well captured in collected statistics.
While there has been considerable discussion about the changing nature of work and its broader
implications for workers and firms, different sources of data send conflicting messages regarding the
prevalence of non-employee work generally and gig employment specifically. Individuals performing
non-employee work should be classified as self-employed. In the CPS and other household surveys,
however, the percentage of the workforce that is self-employed has shown no upward trend and in fact
has been drifting downwards since at least the mid-1990s. In contrast, administrative data derived from
tax filings provide stronger support for the popular perception that non-employee work arrangements are
a growing phenomenon (Katz and Krueger 2016; Abraham et al in progress).
Further, relatively little is known about the answers to other important questions about the gig
economy. Who are the people engaged in gig work? Where are they working and what type of work are
they doing? To what extent is gig work a primary source of earnings for those who do it as opposed to a
source of supplementary income that complements earnings from a wage and salary job? Do those
engaged in gig work tend to be low-earning or high-earning individuals? Where does such work fit into
4 | P a g e
the life cycle career path of individuals? Do individuals engage in such work because they are pushed
into doing it or do they do it by choice? Has any or all of this changed over time?
In this paper, we seek to clarify what different sources of data can tell us about changes in the
prevalence and nature of both gig employment and non-employee work arrangements more generally
over time. We begin with a discussion in Section II of the heterogeneity of non-employee work and the
challenges this heterogeneity poses to its measurement and assessment. Section III considers the two
main types of data that have been used to study past trends in non-employee work – surveys of
households and administrative data. The discrepancy between the flat or declining trend in self-
employment shown by measures based on household surveys and the long term growth in similar
measures based on administrative data is a significant puzzle. To reconcile these conflicting trends, we
turn to analysis of a newly-created linked data file that contains household survey and administrative
information based on tax records for the same individuals. Preliminary findings based on this linked file
are reported in Section IV. Although there is some CPS self-employment for which we can find no
corresponding tax records, the amount of such undocumented self-employment has been relatively stable;
in contrast, there has been a notable increase in the volume of self-employment activity reported to the
Internal Revenue Service (IRS) that is not reported on the CPS. Looking to the future, Section V
considers ways in which household survey data on non-traditional employment might be improved and
Section VI evaluates how administrative data, employer survey data and naturally occurring private sector
data might be used more effectively to improve our understanding of gig employment specifically and
non-employee work more generally. Finally, Section VII offers some initial thoughts about a path
forward. Recognizing the limitations of each of the individual available sources of data, our major
conclusion is that efforts to develop linked data sets that combine household survey data, employer survey
data and, potentially, naturally occurring private sector data are likely to have a high payoff, permitting
greater insight into the changing nature of work than is possible using any single data source.
5 | P a g e
II. Typology of Work Arrangements
Although there has been a great deal of interest in the growth in non-traditional work
arrangements in the U.S. labor market, the ensuing discussion has not always fully recognized the
considerable heterogeneity in these arrangements. Combining arrangements with very different
characteristics and then attempting to draw conclusions about them has the potential to be quite
misleading. In Table 1, we have laid out a typology of work arrangements and their characteristics that
begins to clarify the similarities and differences across a variety of types of work arrangements. The table
also identifies where these arrangements might be captured in household survey and administrative data,
as well as where gig employment specifically might be counted.
Work Arrangements and Their Characteristics
One challenge in characterizing the evolution of work arrangements is that there are many
different possible ways in which work may be organized. The first column of Table 1 lists a number of
such arrangements that have been discussed in the literature. These categories are not necessarily
mutually exclusive and, in some cases, a job might fall into more than one category. In addition, any
given person may have multiple jobs and work under multiple arrangements. The next five columns of
the table identify some key dimensions along with the listed work arrangements may differ.
Despite the ongoing changes in the labor market, traditional employment still accounts for the
largest share of work in the U.S. labor market. These are jobs on which workers are paid a wage or
salary; generally can anticipate continuing if they so choose; may be full-time or part-time, but have hours
and earnings that are relatively predictable; and whose incumbents are supervised by the same firm that
pays the incumbent’s salary. On-call workers also appear on the payroll of the firm where they are
employed; they are called to work only as needed by the firm, though when called they may be scheduled
to work for several days or weeks in a row. A seasonal worker is someone whose term of employment is
for some defined part of the year, such as a lifeguard hired for the summer or a sales clerk in a department
6 | P a g e
store hired for the busy holiday season. Interestingly, the share of jobs that are seasonal has dropped
significantly in recent decades (Hyatt and Spletzer 2017).
As an alternative to using direct hires to meet irregular, temporary or seasonal demand for labor, a
firm with a task or tasks to be performed may call upon a temporary help agency to supply workers or
turn to a contract firm whose employees provide needed services. Under both of these arrangements, the
firm on whose behalf work is being performed (the client) is a different entity than the firm writing the
worker’s paycheck (the agency or contract firm).
The self-employed are an important but highly heterogeneous group. Some of the self-employed
may own a stable incorporated business, pay themselves a salary, and enjoy relatively predictable hours
and earnings thanks to a well-established clientele. Others, however, may operate as unincorporated sole
proprietors who earn money by performing a series of one-time jobs for which they are paid agreed sums
but who cannot count on continuing employment and whose hours and earnings may be volatile. Given
this heterogeneity, as can be seen in Table 1, we have broken the self-employed into several distinct
categories. Our operating assumption is that the costs associated with incorporating a business or forming
a partnership are sufficiently large that they would not be worth incurring unless a relatively stable flow
of work was anticipated. In contrast, many but not all unincorporated sole proprietors may have work
that is more sporadic or at least less predictable.
Independent contractor is a related term that has been used in several statistical data collections.
The Bureau of Labor Statistics defines an independent contractor as anyone who self-identifies as an
independent contractor, independent consultant, or freelance worker. It is listed separately in Table 1
primarily because it is a group about which various surveys have collected information. Independent
contractors generally should be classified as self-employed, though in some cases they may have
incorporated for business purposes and thus pay themselves a wage or salary.
A day laborer is a person who gets work by waiting at a place where employers pick up people to
help with short-term tasks. In some communities, for example, individuals seeking work may be known
to wait in a convenience store parking lot or other similar location. On-demand or platform workers can
7 | P a g e
be thought of as the modern version of a day laborer, but with work obtained by claiming tasks listed
through an online intermediary rather than by waiting for work at a physical location. Examples of on-
line platforms that facilitate the matching of workers to those requiring services include Uber, TaskRabbit
and Amazon Turk.
The first characteristic we have identified as relevant to distinguishing among the various work
arrangements is simply whether the person is paid a wage or salary. This can be thought of as a shorthand
for whether those working under the arrangement are likely to be covered by unemployment insurance,
workers compensation, the Fair Labor Standards Act, and other labor market laws and regulations
applicable to employees.1
A second important characteristic of a work arrangement is whether the work relationship can be
expected to continue. This construct has been used by the BLS as the basis of its definition of contingent
work (Polivka 1996a). In published BLS statistics based on the Contingent Worker Supplement to the
CPS, a contingent worker is anyone for whom no implicit or explicit contract for a continuing work
relationship exists. Most traditional employees would not view their employment as contingent. The
same is likely to be true of most self-employed individuals who have an incorporated business, a
partnership or an established sole proprietorship with regular clients. For consistency with the way that
the BLS has applied this concept, however, we have allowed for the possibility that those in such
positions might consider their job to be time-limited due to an expectation that the business where they
work will fail or for other similar reasons. Accordingly, we have entered “some” rather than “yes” in the
relevant cells of Table 1 for these groups. An on-call worker may not work regularly, but nonetheless
may have an ongoing relationship with the firm at which they work when called and thus may be
considered to have an implicit or explicit contract for continuing employment. Somewhat similarly,
workers supplied by a temporary help agency or contract firm may have only a short-term relationship
1 The application of these laws and regulations to the owners of incorporated businesses who pay themselves a wage or salary is complicated, but in many states they are permitted to opt in to coverage under the unemployment insurance and workers compensation systems.
8 | P a g e
with the different firms that make use of their services, but a continuing relationship with the temporary
help agency or contract firm. Again, we have entered “some” in the relevant cells of the column
summarizing whether a continuing work relationship exists. In contrast to the arrangements just listed,
sole proprietors whose work consists of a series of less predictable one-time jobs, seasonal workers, day
laborers, and on-demand or platform workers do not have an expectation of continuity in their work
relationship. Contingent workers in the sense that term is used by the BLS thus can be expected to
include all of those in these four categories, plus some of those working in each of the other listed
categories.
The third and fourth work characteristic columns pertain to whether the person in the listed work
arrangement has a predictable work schedule and whether their earnings when working are predictable.
For a traditional employee, both of these conditions generally would obtain. There is more diversity with
respect to the predictability of hours and earnings among the self-employed. Both hours and earnings are
apt to be unpredictable for day laborers and on-demand or platform workers. An on-call worker or
temporary help agency worker often will have unpredictable hours, but his or her pay while working is
likely to be quite predictable.
A final work characteristic, applicable only to those who are paid a wage or salary, captures
whether on-the-job supervision is provided by the same firm that pays the worker’s salary. This would be
the case for traditional employees, on-call workers, and seasonal workers, all of whom are hired onto the
payroll of the firm requiring their services. It would not be the case, however, for the employees of
temporary help agencies or contract firms who perform tasks under the supervision of the client firm but
are paid by a different firm. This characteristic is associated with the so-called fissuring in the labor
market that has been identified by some scholars as having weakened the opportunities and protections
for workers who previously would have been employed directly by the firm for which they provide
services but now are employed by a different company (Weil 2014).
9 | P a g e
Capturing Different Work Arrangements in Household Survey and Administrative Data
The next three columns of Table 1 indicate where the different work arrangements might appear
in household survey and tax data. Household surveys such as the CPS, the American Community Survey
(ACS) and others commonly distinguish among wage and salary workers, the incorporated self-employed
and the unincorporated self-employed. In addition to traditional employees, on-call workers, seasonal
workers, temporary help agency workers and contract firm workers generally should be categorized as
wage and salary in these data. The incorporated self-employed also typically are treated as wage and
salary workers in published household survey data, but if a different breakout is desired it is possible to
identify them separately. Work arrangements for which the table’s first column indicated not being paid a
wage or salary generally should be categorized as unincorporated self-employment in the household
survey data; this includes partnerships, sole proprietorships, most independent contractors, day laborers,
and on-demand or platform workers.
Tax data permit distinctions to be made between wage and salary work and self-employment
work. Any job on which the person who holds it earns $600 or more in wages or salary during the year
should generate the filing of a Form W-2. If the recipient is required to file a tax return, that income will
be reported on their Form 1040. This includes the owners of incorporated businesses who pay themselves
a wage or salary. Incorporated business owners also may receive distributions of business profits reported
on a Form W-2, a Schedule K1, or payments of dividends reported on a Form 1099-DIV. Assuming that
the individual is required to file a tax return, that income will be reported on their Form 1040. Proceeds
flowing from a partnership business to the individual partners are reported to the recipient on a Schedule
K1 and, when the individual partners file their tax return, these proceeds are reported on their Form
1040s.
In contrast to wage and salary workers, the owners of incorporated businesses and partners in
partnership businesses, a substantial share of the payments made to sole proprietors and others doing non-
employee work generate no associated information return. If there is an information return, it is likely to
be a Form 1099-MISC (for payments of non-employee compensation of $600 or more made by a business
10 | P a g e
during the year) or, since 2011, possibly a Form 1099-K (for settlement of payment card transactions or
of transactions conducted through third-party networks such as PayPal that exceed certain thresholds).
While self-employment earnings are only partially covered by information return reporting, anyone
receiving non-wage payments in return for services provided is expected to report those payments on
Schedule C of their Form 1040. This is true even if they received no information returns associated with
those payments and even if their business expenses fully offset the gross payments received. In addition,
anyone with net self-employment earnings in excess of $433 over the course of the year is required to file
a Schedule SE, the form used to calculate liability for payroll taxes on self-employment earnings.
We also are interested in where we should expect gig employment to appear in household survey
and administrative data. To answer this question, we first need to define what we mean by a gig worker.
The term “gig” originated in the music industry, where musicians go into the studio to record one song or
play in a band for one performance. The musicians with such gigs have no expectation of recording at the
same studio the following day or playing with the same band the following night. Borrowing from the
music industry, we define “gig employment” as one-time jobs where workers are employed on a
particular task or for a defined period of time. In terms of the work arrangement characteristics examined
in Table 1, a gig worker is not paid a wage or salary; does not have an implicit or explicit contract for a
continuing work relationship; and does not have a predictable work schedule or predictable earnings when
working. Applying this definition, some sole proprietors, some independent contractors, and anyone who
is a day laborer or on-demand/platform worker should be considered a gig worker.
In household survey data, gig workers are included among the unincorporated self-employed, but
that group is broader than gig workers. Because many household surveys focus on main jobs to the
exclusion of supplemental employment, however, they may not capture gig work that is taken on as a
supplement to a person’s primary employment. In tax data, some gig workers may receive a Form 1099-
MISC, but the same form also may be used to report payments to other self-employed individuals who are
not gig workers. The same is true of payments reported on a Form 1099-K. We would need to know
more about the reason a payment was received – specifically, whether it was a payment to an
11 | P a g e
unincorporated self-employed worker performing one-time jobs – to determine whether the recipient was
a gig worker. Further, not all gig work generates either a Form 1099-MISC or Form 1099-K. All gig
workers should file a Schedule C and Schedule SE to report their earnings from the gig job, but not all
Schedule C or Schedule SE filers are gig workers.
In both household survey and tax data, then, we are able to identify the number of unincorporated
self-employed. In the case of some household surveys, this may encompass only those for self-
employment is their primary work activity. Where both primary and secondary employment as an
unincorporated self-employed worker is captured, the size of this group is an upper bound of the number
of gig workers. Trends in unincorporated self-employment, which are publicly available from multiple
sources, thus are a first place to look for suggestive evidence of whether gig employment has been
growing over time.
III. Historical Data on Non-Employee Work Arrangements
Several household surveys conducted by the U.S. Census Bureau produce regular information
about the prevalence of self-employment among working Americans. The monthly Current Population
Survey (CPS), conducted by the Census Bureau for the Bureau of Labor Statistics, is the source of official
statistics about the U.S. labor market. It is an interviewer-administered household survey that includes
questions about labor market activity during a specific reference week. CPS data can be used to
characterize the main job each household member held during the reference week as self-employment or
wage-and-salary employment. Each spring, the Annual Social and Economic (ASEC) supplement to the
CPS collects information about income and employment over the prior calendar year, including
information on the longest job and on calendar year self-employment earnings and wage-and-salary
earnings. Finally, since 2005, the American Community Survey (ACS), a large mixed-mode survey
conducted on a rolling basis throughout the year, has been another source of published self-employment
estimates. These refer to the main job during the survey’s reference week (described to the respondent as
“last week”).
12 | P a g e
More recently, analysts have turned to tax records in an effort to learn about the prevalence and
nature of non-employee work. Sole proprietors, general partners and farmers who have net earnings at or
above a fairly low threshold (set since 1994 at $433) are required to file a Schedule SE, Self-Employment
Tax. The Master Earnings File (MEF) database maintained by the Social Security Administration
incorporates information on self-employment income from the Schedule SE together with information on
wage earnings from any Form W-2’s a person has received during the year. The U.S. Census Bureau
receives an extract (called the Detailed Earnings Record, or DER) that includes MEF records for each
CPS respondent for whom a Protected Identity Key (PIK), an encrypted Social Security Number, is
available and this extract can be used to produce an estimate of the number of Schedule SE recipients. In
addition, unincorporated self-employed individuals with any gross non-employee or business income on
their individual tax return are required to file a Schedule C. Schedule C information is a key ingredient in
the construction of the master list of non-employer businesses maintained by Census. Whereas both
Schedule SE and Schedule C are filed by the recipients of self-employment income, Form 1099-MISC is
filed by businesses that make payments of non-employee income of $600 or more to any entity or
individual during the calendar year. Tracking entities or people who received one or more Form 1099-
MISC’s during a calendar year offers another perspective on trends in self-employment, though the use of
these data is complicated by the fact that some Form 1099-MISC’s report payments made to businesses
rather than individuals and a considerable amount of self-employment income has no associated Form
1099-MISC.2 Since 2011, Form 1099-K has been used to report settlement of payment card transactions
or settlement of third-party network transactions that exceed $20,000 or 200 transactions per year. Some
self-employed individuals may receive a Form 1099-K, but this is relatively unusual and most Form
1099-Ks are not issued to unincorporated self-employed individuals.
2 The Data Appendix provides additional details about the various household survey and administrative data sources just described. Although occasional supplements to the monthly CPS have asked more probing questions about the nature of individuals’ employment arrangements, these questions have not been asked routinely and consideration of the data generated by these occasional supplements is deferred to later in the paper.
13 | P a g e
Figure 1 shows the trend in a number of different measures of the self-employment rate (the
number self-employed under different definitions as a percent of the corresponding total employment
measure).3 The four series at the bottom of Figure 1 all derive from household survey data. The longest
of these series, based on the monthly CPS, captures the percent of employed people who are self-
employed on the main job held during the survey reference week, averaged across the twelve months of
the year. This series has trended steadily downwards, falling from 8.3% in 1996 to 6.7% in 2012. The
main job series based on ACS data is conceptually comparable to the monthly CPS series and, although
somewhat lower in level, shows a similar downward trend over the years for which it is available. The
remaining two household survey measures, derived from the annual CPS-ASEC, show the percent of
people with any employment during the year whose longest job was in self-employment and the percent
of people in the same group who reported any self-employment income. Again, both series exhibit a clear
downward trend. By construction, the first three of these series do not capture self-employment that is
supplemental to a primary job. In principle, however, the CPS-ASEC series based on having earned any
self-employment income during the year should pick up income-generating self-employment activity
whether it is a person’s primary activity or supplemental to a primary job and that measure behaves very
similarly to the others.
Five self-employment series based on administrative data series appear in the upper part of Figure
1. These series are most comparable in concept to the CPS-ASEC series based on earnings during the
calendar year. The numerator in each case is some measure of the number of people or entities with self-
employment earnings during the year; the denominator for all of the measures is the number of
individuals with earnings from any source in the DER. The share of persons with any earnings in the
DER who have self-employment earnings has trended steadily upwards, rising from 9.5% in 1996 to
11.3% in 2012. Census counts of non-employers are available from 1997 through 2014 (2015
Nonemployer statistics will be released in May 2017); sole-proprietor non-employers are identified
3 In Figure 1 and throughout this paper, all analysis that presents results from the CPS-ASEC or from the DER is based upon the weighted CPS-DER linked data.
14 | P a g e
separately in published data beginning in 2004. Both of these series have trended upwards as a percent of
the number of earners and, over the years where both are available, sole-proprietor non-employers have
represented a fairly steady fraction of the overall non-employer population. Finally, the number of
entities receiving non-employee compensation reported on a Form 1099-MISC, taking individuals and
businesses together, and the number of individuals for whom such compensation was reported are
available for the period 2000-2012. These measures also have shown growth relative to the number of
people with earnings.
Figure 1 makes clear that published data sources provide quite different answers to the simple
question of what is the level and trend of self-employment in the U.S. economy. Others have noted
divergences between specific series; Katz and Krueger (2016), for example, show the divergent trends in
estimates of self-employment based on monthly CPS data and IRS Schedule C filings. Figure 1 shows
that this divergence is quite general. Household surveys consistently show lower levels of self-
employment than administrative data sources and a relatively flat long-term trend in self-employment as
contrasted with the upward trend that is evident in administrative data.
It would be nice to be able to say that one or the other type of measure – estimates based on
household survey data or estimates based on tax data – accurately represents the prevalence and evolution
of self-employment over time. In truth, however, measures of both types suffer from potential
weaknesses. On the one hand, constraints on the length of the monthly CPS and ACS questionnaires
mean that neither survey instrument probes deeply about household members’ work arrangements. This
may lead to a variety of reporting errors. For example, a household member who is doing work for a
business may be reported as an employee of that business, even in cases where further probing might
reveal that the person is in fact an independent contractor. To take another example, a household survey
respondent might simply fail to mention informal work that they do not think of as a job, something that,
again, further probing might recover. To the extent that non-traditional work arrangements are of
growing importance, these problems could have become more serious over time.
15 | P a g e
On the other hand, administrative data capture only the information that is reported to the tax
authorities on tax or information returns. Non-reporting or under-reporting of income to the tax
authorities is an acknowledged issue, especially with regard to self-employment and other hard-to-verify
types of income. As already noted, anyone who makes payments of wage or salary income of $600 or
more to an employee over the course of the year is required to file a Form W-2 documenting that payment
with the IRS. In contrast, the tax reporting required for payments to self-employed individuals is much
less complete. Businesses that make payments of $600 or more to a self-employed individual for services
rendered are required to report them on a Form 1099-MISC. In 2011, business tax forms were modified
so that business owners must certify that all required Form 1099-MISCs have been filed. Also taking
effect in 2011 was the requirement that payment settlement entities that process electronic payments to
businesses must report those payments to the IRS on a Form 1099-K if they exceed certain thresholds.
There is no requirement, however, that households paying for services file a 1099-MISC. Despite efforts
by the Congress to tighten the requirements for information reporting, a great deal of self-employment
income generates no associated information return (GAO 2007, Slemrod et al 2015). Further, any
information return that is filed captures only the gross payment made. It is equally important to be able to
gauge the expenses incurred in connection with this gross income to determine net self-employment
earnings, but these expenses are generally not subject to required information reporting (GAO 2007,
Slemrod et al 2015). Not surprisingly, tax audit studies have shown that virtually all wage and salary
income is reported on individual tax returns, but that a much smaller share of net non-farm proprietor
income and net farm income is reported (Slemrod and Bakija 2008).
One question is whether changes in information reporting requirements, such as those introduced
in 2011, could have affected the reported prevalence and amounts of self-employment income. Research
to date has not identified discontinuities in the administrative time series related to self-employment
associated with changes in reporting requirements. With respect specifically to the changes introduced in
2011, this may be in part because the relatively minor increases in reported gross self-employment
16 | P a g e
income that the changes appear to have induced were offset by the reporting of increased expenses
(Slemrod et al 2015).
Another potential issue to flag is that, in the household survey data we have examined, our
attention has been focused on the unincorporated self-employed. One reason for this is that the
unincorporated self-employed as measured in the CPS and ACS are conceptually most comparable to the
measure of self-employment that we are able to produce using data from the DER. Were it the case that a
growing share of the self-employed are now choosing to incorporate, the trend in unincorporated self-
employed in the household survey data could be misleading (Hipple and Hammond 2016). To check on
this possibility, we have recomputed each of the four household survey self-employment series with the
incorporated self-employed included. Although these data show that the self-employed have become
somewhat more likely to incorporate, including them in the series does not change the conclusion that
self-employment as measured in the household survey data has been at a lower level and steady or
declining, rather than increasing as is the case in the tax-based administrative data.
IV. Reconciling Household Survey and Administrative Estimates of Nonemployee Work
The most straightforward approach to understanding the discrepancies between household survey
estimates and administrative data estimates of self-employment is to compare information from the two
sources for the same set of people. Using an internal Census Bureau identifier—the Protected Identify
Key or PIK—we have linked records covering the years 1996 through 2012 from the Annual Social and
Economic Supplement to the CPS (the ASEC files) to administrative records from the DER. In both of
the linked data sets, we identify self-employment based on reports of any earnings from unincorporated
self-employment during the calendar year, meaning that they are conceptually comparable.
We have used these data to ask how well the CPS-ASEC and the DER agree with respect to the
classification of individuals as self-employed. Table 2, taken from Abraham et al (in progress), displays a
weighted cross-tabulation of self-employment status in the CPS-ASEC with self-employment status in the
DER, using data that are pooled across the years 1996-2012. Despite the comparability of the definition
17 | P a g e
of self-employment in the two data sources, there is substantial disagreement between them regarding
individuals’ self-employment status. On average over the 17 years for which we have data,
approximately 65% of those with self-employment income in the DER do not report any self-employment
income in the CPS. Conversely, approximately 51% percent of those with self-employment income in the
CPS-ASEC do not report any self-employment income in the DER.
The fact that there is disagreement between the household survey and administrative data
employment measures is not surprising. In earlier research, we found that, on average over the period
1996-2003, about 6% of individuals who had unemployment insurance (UI) earnings during the first
quarter of the year reported no CPS wage-and-salary employment in a UI-covered sector during the year’s
first three months; conversely, about 18% of individuals reporting CPS wage-and-salary employment in a
UI-covered sector during the first three months of the year had no first-quarter UI earnings (Abraham et al
2013). Similarly, in weighted tabulations using the linked data file that we are using to explore the
sources of discrepancy in alternative self-employment series, about 9% of those with DER wage-and-
salary income had no reported CPS-ASEC wage-and-salary income for the same year; conversely, about
12% of those with reported CPS-ASEC wage-and-salary income for a year had no DER wage-and-salary
income for that same year.
What is surprising, however, is the size of the off-diagonal cells in the tabulations shown in Table
2. Whether taking the DER self-employed or the CPS self-employed as the base, a majority of those who
are categorized as self-employed in the data set in question are not so categorized in the other data set. At
least to some extent, this reflects the complexity of self-employment activity. There are many different
types of self-employment work and a highly heterogeneous set of arrangements under which such work
might occur. Neither the household survey data nor the administrative data may be ideally suited to pick
up all of that activity.
We also are interested in how the discrepancy between the CPS-ASEC and the DER measures of
self-employment has changed over time. Figure 2A displays the number of self-employed people as
measured in the CPS-ASEC annual earnings data and the corresponding measure based on earnings data
18 | P a g e
from the DER. While self-employment based on the DER grew markedly between 1996 and the mid-
2000s, the corresponding CPS-ASEC measure has been stagnant. Figure 2B shows the off-diagonals
associated with cross-tabulating the CPS-ASEC and DER data on a year-by-year basis. That is, it plots
the number of people who are self-employed in the DER but not the CPS-ASEC and, separately, the
number who are self-employed in the CPS-ASEC but not the DER. It is apparent that virtually all of the
growth in DER self-employment relative to CPS-ASEC self-employment can be attributed to growth in
the share of people who are self-employed in the DER but not in the CPS-ASEC.
To further explore the discrepancy between the two measures of self-employment, we have
looked a bit more closely at these off-diagonals. We have grouped those who are self-employed in the
DER but not the CPS-ASEC into three mutually exclusive categories:
1) No CPS employment: No employment income in the CPS-ASEC; self-employment income in
the DER.
2) Self-employment second job not reported in CPS: Only wage-and-salary income in the CPS-
ASEC; both wage-and-salary income and self-employment income in the DER.
3) CPS job wage and salary, classification issue: Only wage-and-salary income in the CPS-ASEC;
only self-employment income in the DER.
Those in the first two groups may be people performing self-employment work who do not think of
themselves (or are not thought of by the CPS respondent in their household) as self-employed, whether
because the activity in question generated only a small amount of earnings or for some other reason. The
third group may be capturing those who think of themselves as employees and may in fact be employees
according to the relevant legal criteria, but are paid as non-employees and classified that way in the
administrative data. Given the growing concerns about worker misclassification (see, e.g., Leberstein
2012), this group may for some purposes be the most interesting.
We also have grouped those who are self-employed in the CPS-ASEC but not in the DER into
three mutually exclusive categories:
19 | P a g e
4) No DER employment: No employment income in the DER; self-employment income in the CPS-
ASEC.
5) Self-employment second job not recorded in the DER: Only wage-and-salary income in the DER;
both wage-and-salary income and self-employment income in the CPS-ASEC.
6) CPS job self-employed, classification issue: Only wage-and-salary income in the DER; only self-
employment income in the CPS-ASEC.
The fourth and fifth categories capture self-employment income that is reported in the CPS but does not
appear in the administrative data, either work generating too little income to trigger tax reporting
requirements or off-the-books work. Category six may be capturing individuals who are indeed self-
employed but operate an incorporated business, meaning that they should not have been counted in the
CPS measure of non-incorporated self-employment and would appear in the administrative data as having
wage and salary income, but not self-employment income.
Figure 3A shows the evolution of the three groups within the DER{SE=1}/CPS-ASEC{SE=0}
category; Figure 3B shows the evolution of the three groups with the CPS-ASEC{SE=1}/DER{SE=0}
category. Whereas there has been growth in all three of the DER{SE=1}/CPS-ASEC{SE=0} groups,
employment in the three CPS-ASEC{SE=1}/DER{SE=0} has changed very little.
One way to summarize the information presented in these figures is to ask what share of the
growing discrepancy between the number of people with self-employment income according to the DER
and the number of self-employed people according to the CPS-ASEC is accounted for by each of the
groups. For this purpose, we have averaged the numbers for the two starting years and the two ending
years in our data series, then calculated the overall change in the discrepancy between those averaged
endpoints. Note that either increases in the size of the DER{SE=1}/CPS-ASEC{SE=0} groups or
decreases in the size of the CPS-ASEC{SE=1}/DER{SE=0} groups may add to the overall discrepancy.
The percentages of the growth in the overall discrepancy accounted for by each of the six groups
described above are shown in Table 3. As was apparent from Figure 2, the growing discrepancy between
the DER and CPS-ASEC estimates of self-employment is accounted for entirely by the growing number
20 | P a g e
of people identified as self-employed in the DER who are not so identified in the CPS-ASEC. This
growth is split roughly evenly between the three DER{SE=1}/CPS-ASEC{SE=0} groups. The net effect
of changes in the size of the CPS-ASEC{SE=1}/DER{SE=0} off-diagonals is small and works in the
direction of slightly offsetting the growing size of the DER{SE=1}/CPS-ASEC{SE=0} off-diagonals. In
other words, the main issue would appear to be that there are people who are earning self-employment
income and reporting that income to the tax authorities, but are not answering the questions on the CPS in
such a way that this work can be identified in those data.
V. Improving Household Survey Measures of Non-Employee Work
The preceding discussion shows clearly that the standard CPS-ASEC questions asked about
calendar year earnings miss a significant and increasing amount of self-employment activity. Because
this series has behaved so similarly to other series based on household survey data, there is every reason
to suspect that the same is true of other household survey measures of self-employment.
One way to improve on the existing household survey measures of self-employment and
alternative work arrangements more generally would be to add questions to these surveys that probe more
directly regarding these arrangements, either as part of the core survey or (perhaps more plausibly) on
periodic supplements. Three household surveys on which such additional questions have been asked and
thus are potential sources for national estimates of the prevalence of alternative work arrangements are
listed in Table 4. The Contingent Worker Supplement (CWS) to the CPS, fielded on several occasions
between 1995 and 2005, takes as given the responses to core questions regarding whether a person was
employed and then asks further questions about the nature of any main job reported. The same basic
approach has been adopted by Katz and Krueger for the Rand-Princeton Contingent Work Survey
(RPCWS) and by the Quality of Worklife Supplement to the General Social Survey. Each of the three
surveys has produced estimates of the prevalence of each of four different categories of alternative work
performed as a person’s main job—independent contractors, on-call workers, temporary agency workers
and workers at contract firms.
21 | P a g e
Several other surveys have collected information that could shed light on the prevalence on
alternative work arrangements, but for various reasons these surveys seem less useful for our purposes.
The Survey of Income and Program Participation includes a category for reported work on a person’s
main job that cannot easily be classified as either work for an employee or self-employment, but these
data do not allow different arrangements within the “other” category to be distinguished.4 The
Enterprising and Informal Work Activities (EIWA) Survey (Robles and McGee 2016) and the McKinsey
Global Institute (MGI) independent work survey (Manyika et al 2016) are recent one-time efforts that
attempted to capture all informal or independent work, whether it represented a person’s primary work or
was supplemental to a primary job. The EIWA survey was designed to collect detailed information about
those performing informal work, but because anyone who did not report such work in response to the
initial screener items was not questioned further, it is not suitable for estimating the overall share of
employed individuals who are engaged in informal work. The independent work concept applied in the
MGI survey is not comparable to that applied in other research.
The CWS was first fielded as a supplement to the CPS in February 1995 (Polivka 1996a, 1996b;
Cohany 1996) and then repeated in February of 1997, 1999, 2001 and 2005. In addition to collecting
information on contingent employment (main jobs in which the individual lacks an explicit or implicit
contract for long-term employment), the CWS also included questions to identify those employed on their
main job in any of four alternative work arrangements (working as an independent contractor, employee
of a temporary help firm, employee of a contract firms, or on-call worker). Due to budget pressures, the
CWS has not been repeated since 2005, though it is scheduled to be fielded again in May 2017.5 Katz and
Krueger (2016) arranged for the core CWS questions to be administered on the RPCWS, fielded through
4 The “other arrangement” category is a catchall that includes a heterogeneous mix of “odd jobs, on-call work, day labor, one-time jobs, and informal arrangements like babysitting, lawn mowing or leaf raking for neighbors.” 5 As described in the Federal Register notice, BLS is proposing to add four new questions to the end of the CWS. These new questions will explore whether individuals obtain customers or online tasks through companies that electronically match them, often through mobile apps, and examine whether work obtained through electronic matching platforms is a source of secondary earnings.
22 | P a g e
the Rand Corporation’s online American Life Panel during October and November 2015. The intention
was to produce estimates for 2015 that could be compared to the CWS estimates for earlier years.
Estimates based on the CWS and the RPCWS are shown in the upper panels of Table 5. The first
set of CWS estimates are those originally published by the BLS; the second set are those recomputed by
Katz and Krueger to be conceptually comparable to the numbers it was possible to produce using the
RPCWS.6 Taken at face value, comparison of the RPCWS numbers with those from the earlier CWS
surveys suggests that there has been dramatic growth in three of the four types of alternative work
arrangements, (independent contractor, on-call worker and, especially, contract firm employee). This
finding has received extensive press coverage, but there is reason to be skeptical about the comparability
of estimates from the RPCWS to those from the original CWS. Although Katz and Krueger have
produced estimates based on microdata from the original CWS that are comparable in concept to those
based on the RPCWS microdata, the very different underpinnings of the RPCWS and CWS surveys may
mean they are not comparable in practice.
One reason for concern about the comparability of the RPCWS estimates with the earlier CWS
estimates is that that RPCWS data were collected through an online panel, the ALP, whose members are
assembled from a variety of sources with an unknown response rate. This means that the RPCWS sample
may be less representative of the population than the CPS in ways that reweighting based on observables
cannot correct.7 Second, the CWS asks respondents to provide information for all household members,
whereas the RPCWS asks respondents to report only for themselves. To the extent that respondents
report more fully about their own experience than about the experiences of others in their household, this
6 One difference is that the Katz and Krueger CWS estimates do not restrict contract workers to those “who are usually assigned to only one customer and usually work at the customer’s worksite.” In addition, because the RPCWS question about day laborers was not strictly comparable to the question on the original CWS, this small group was excluded from the Katz and Krueger CWS on-call worker estimates. Finally, the Katz and Krueger calculations impose the requirement that an individual have worked during the survey reference week, excluding those with a job but not at work. 7 The technical documentation for the American Life Panel available on the RAND website at https://alpdata.rand.org/index.php?page=panel includes information on the observable characteristics of panel members and on survey completion rates for those in the panel, but no information on the rate at which potential sample members from different sources were successfully recruited into the panel initially.
23 | P a g e
could mean that the RPCWS responses are more accurate than the CWS responses, but by the same token
also could mean that the RPCWS reports of non-employee work are elevated compared to the
corresponding CWS responses. Third, though this seems less likely to matter very much, the RPCWS
and the CWS have different reference periods, with the CWS asking about work during a mid-February
reference week and the RPCWS asking about work during reference week during October or November.
These differences between the RPCWS and the earlier CWS surveys suggest caution in drawing strong
conclusion about trends in the prevalence and nature of non-employee work arrangements based on
comparisons between the two.
Estimates of alternative work arrangements for 2002, 2006, 2010 and 2014 from the Quality of
Worklife Supplement to the General Social Survey (GSS) are reported in the bottom panel of Table 5. In
contrast to the significant growth for several of these arrangements implied by a comparison of the
RPCWS estimates for 2015 with the CWS estimates for 2005, the GSS measurements based on a
consistent methodology show no consistent pattern of growth. This provides further grounds for caution
about making too much of the comparison between the RPCWS and CWS estimates.
One feature of the surveys discussed thus far is that, by design, they ask only relatively simple
questions about work arrangements and inquire only about each person’s main job. This implies that they
could be missing a significant amount of non-employee work. In the linked data described in the previous
section of the paper, there are a significant number of people for whom no self-employment is recorded in
the household data but who have self-employment income that is captured in the DER. These are divided
between people with no employment at all in the CPS (19%, averaged across all years); with a CPS main
job that is wage and salary but a secondary self-employment job in the DER (45%, averaged across all
years); and people who have only wage and salary income in the CPS and only self-employment income
in the DER (36%, averaged across all years). The typical household survey probes for learning about
alternative work arrangements, such as those in the CWS and the Quality of Worklife Survey in the GSS,
would not ask about self-employment for the first two sets of cases. Focusing narrowly on the nature of
reported CPS main jobs is likely to miss important ongoing changes.
24 | P a g e
As described in greater detail in Abraham and Amaya (in progress), a recent survey experiment
provides some new information about how different approaches to probing for informal employment
might affect the share of people for whom employment activity is reported (the employment rate) and the
share of those with employment for whom more than one job is reported (the multiple job holding rate).
The data collected as part of the experiment also shed light on potential differences in effects between a
person reporting for themselves and a person reporting as a proxy for others in the household.
The experiment was embedded in a survey carried out for the 2016 Joint Program in Survey
Methodology (JPSM) practicum. Subjects for the survey were recruited using Mechanical Turk,
Amazon’s crowdsourcing platform. Respondents were younger and considerably more educated than the
population as a whole. In addition, the fact that all of the respondents are Turkers means that, even were
the data to be reweighted to match the observable demographic characteristics of the overall population,
the employment estimates derived from the survey responses could not be generalized to the population
as a whole. The survey findings should be informative, however, about the sensitivity of survey estimates
to asking more probing questions or structuring the probes in different ways.
The first section of the survey collected information on the characteristics of all members of a
respondent’s household, including standard questions concerning age, marital status, race and ethnicity,
education and relationship to the household respondent. The second section of the survey asked questions
to identify each household member’s employment status and, for those who were employed, whether they
held more than one job. With the exception of some special questions concerning sexual orientation and
gender identify included for testing, all of the questions about household members’ characteristics and
employment status were taken directly from the Current Population Survey (CPS) questionnaire. The use
of the CPS employment questions on the JPSM practicum survey means that the responses can be used to
construct CPS-like measures of both employment and multiple job holding during the survey reference
week (“last week,” defined as the most recent completed week beginning on a Sunday and ending on a
Saturday).
25 | P a g e
Additional questions about informal or gig employment were asked about one randomly-selected
member of each survey respondent’s household. In one version, randomly assigned to half of the cases,
respondents were asked a global yes/no gig employment question (the global question). In the second
version, respondents were asked about each of six different possible types of gig employment, with
examples provided for each of them, and to indicate whether any other type of gig work had been
performed (the detailed question).8 In cases where CPS employment had been reported for the person to
whom the question applied, the respondent was asked to indicate whether the activity reported in response
to the gig employment question had been included in the CPS job count.
The first step in analyzing the data was to construct measures of the employment rate (the percent
of people in the sample who were employed) and the multiple job holding rate (the percent of employed
persons with two or more jobs) based on the responses to the standard CPS questions. Next, these
measures were recomputed taking into account the additional information provided in response to the
probes for whether the person in question had done informal work for pay during the survey reference
week. Finally, a measure of the difference between the two measures was constructed. In these
calculations, multiple job-holders are defined as those for whom more than one job was reported in
response to the CPS questions or for whom one CPS job plus some additional informal employment not
included in the CPS job count was reported.
The first row in the upper panel of Table 6 displays the employment rate that is estimated based
on the standard CPS questions; the second row displays the augmented employment rate that incorporates
the additional information provided in response to the informal employment probe; and the third row
shows the difference between the two estimates. Estimates are shown separately for respondents asked to
report for themselves and respondents asked to report for another member of their household, in each case
differentiated by whether the respondent received the global gig employment question or the more
8 The exact wording of the questions asked is displayed in Appendix B.
26 | P a g e
detailed gig employment question. The second panel of Table 6 reports similar information on the
multiple job-holding rate for those identified as employed based on the standard CPS questions.
One clear message conveyed by the findings shown in Table 6 is that probing to ask about
possible gig employment leads to higher estimated employment rates and higher multiple job-holding
rates. This is true both when respondents are reporting for themselves and when they are reporting for
other members of their household. Although little can be concluded from the magnitude of these
estimates, the fact that probing consistently raises the estimates does suggest that learning about informal
work arrangements is likely to require asking more than the standard employment questions.
A second clear message concerns the differential impact of asking the global question about
possible gig employment versus asking the more detailed question listing different types of work
someone might have done. For those reporting about their own work activity, the two forms of the
question have very comparable impacts, raising the estimated employment rate by a few percentage
points and the multiple job-holding rate among those who are CPS employed by 24 percentage points.
Looking at the answers that respondents provide for others in their household, however, the more detailed
question appears to have a significantly larger impact. The detailed probe raises the estimated
employment rate for other household members by about 7 percentage points versus an increase of about 3
percentage points when the global question is asked. It raises the estimated multiple job-holding rate
among other household members who are CPS employed by about 11 percentage points versus an
increase of about 3 percentage points when the global question is asked. Again, given the way in which
the survey sample was selected, comparisons between the estimates for respondents and the estimates for
others in their household could be misleading, but the fact that more detailed probing makes a larger
difference when the respondent is being asked about others in the household does seem meaningful.
In summary, there has been growing recognition that standard household survey questions may
miss some individuals’ primary work activities if the survey respondent does not think of those activities
as a job. Further, to the extent that non-employee work reflects marginal jobs or activities of individuals
marginally attached to the labor force, detailed probing is likely to be needed to overcome the tendency of
27 | P a g e
individuals to focus on their primary activities in their survey responses, whether that primary activity is
employee work, being a student, being engaged in childcare or care of other family members, or
transitioning to retirement from the workforce. Devising an appropriate set of more probing questions
that could be asked at regular intervals on ongoing household surveys would allow trends in work activity
and work arrangements to be gauged more accurately.
VI. Other Sources of Information on Non-employee Work
In additional to household survey data and administrative data derived from tax returns, useful
information about non-employee work could be gleaned from employer surveys, records of information
reporting for tax purposes, private financial data or other private sector data. We discuss each of these
potential data sources briefly in turn. A core theme of our discussion is that integration of these
additional types of data with survey and administrative data has the potential to add important new
insights to our understanding of the changing nature of work.
Employer Surveys. A natural approach to learning about alternative work arrangements would be
to ask employers. Efforts to date suggest on the one hand that this approach has potential, but on the
other hand suggests that it faces a number of challenges. Dey, Houseman and Polivka (2012) used a
longitudinal version of the Occupational Establishment Survey to generate estimates of the extent to
which Temporary Help Service (THS) and Professional Employee Organizations (PEO) were placing
workers at manufacturing firms. They found a significant volume of such activity and showed that
accounting for it had an impact not only on manufacturing employment but also in turn on measures of
labor productivity in manufacturing. In spite of these findings suggesting that there is an important issue
to be addressed, however, both BLS and Census have faced challenges in developing more systematic
survey approaches to capturing THS and PEO activity for official statistics. At BLS, a study of the
feasibility of collecting the industries where workers were placed from THS and PEO firms in the Current
Establishment Survey (CES) was carried out in 2005. Many firms were unable or unwilling to provide
this information. Likewise, at Census, questions added to the 2002 Economic Census on employee
28 | P a g e
leasing activity also yielded low response rates. In both of these cases, the primary objective was to
improve the allocation of employment by industry which is an important but limited objective. Even had
they been successful, these approaches would not have gotten at payments to non-employees or
information on their hours worked.
Another approach that may have promise is to add modules to existing employer surveys that
provide more information about the extent of non-employee work at different types of firms. A module
along these lines was included in the 2015 Annual Survey of Entrepreneurs (ASE).9 The 2015 ASE
module includes questions on types of workers, such as full time, part time, and contractors, independent
contractors, or outside consultants, as well as questions regarding the types of tasks performed by each
type of worker. For our purposes, this approach is especially interesting since it offers the possibility of
insights into the use of non-employee workers by young businesses that may be innovative in their
workforce organizational structure. The tabulations for the 2015 ASE and the underlying micro data have
not yet been made available for research purposes so we don’t yet know about the success of this
approach or the new insights that may emerge from these data.
Tax Data. The integration of the CPS with the DER already shows the value added of integrated
survey and administrative data. The further integration with the full LEHD data infrastructure based on
the UI wage records has great potential for analyzing how non-employee work fits into the career paths of
workers. Integration of the Form 1099-MISC data into this infrastructure also would be very valuable.
Being able to track the longitudinal relationship between individuals identified through their PIKs (SSNs)
and the EINs issuing the Form 1099-MISC’s to those individuals would be especially interesting. Some
individuals may have longstanding relationships with one firm; these would be reflected in the individual
receiving a 1099-MISC from only one firm for many years consecutively. Other individuals may be
receiving multiple 1099-MISC’s from multiple EINs with considerable turnover in the latter. These two
patterns imply quite different work arrangements from the perspective of both the individual and the firm.
9 The ASE is a survey of approximately 290,000 employer firms, where roughly 47% of these firms are less than 10 years old. See Foster and Norman (2016) for more detail about the ASE.
29 | P a g e
Financial Data. Another potential source of information about certain forms of non-employee
work consists of anonymized individual-level financial records. In an interesting recent study, Farrell and
Greig (2016) use data from customers with Chase banking and credit card accounts to examine flows of
income that come through online platforms. Their findings suggest that online platform workers reflect a
small but rapidly growing sector of the workforce. However, their findings also suggest that such work is
mostly a secondary source of income for most households. At this point, however, no long time series of
such data exists and there are questions about the generalizability of findings from this sort of private data
source that have yet to be answered. Greater access by the research community to these type of private
data would greatly facilitate what we can learn from them. Even better would be integration in an
appropriately secure environment of such data at an individual level with the type of survey and
administrative data discussed above.
Private Sector Company Data. Researchers increasingly are gaining access through a variety of
arrangements to individual company level data for research purposes. This has included researchers
interested in the rise of the online platform economy who have obtained access to personnel data from
companies in the online platform sector to gain insights about the nature of work for non-employee
workers. Hall and Krueger (2015), for example, have analyzed administrative data on Uber’s
“driver/partners” derived from the company’s records. In addition, to enhance the administrative data,
they also carried out a survey of these driver/partners. To help provide perspective on their findings, they
compare patterns of activity of drivers/partners to information from the ACS on taxi drivers and
chauffeurs. They find, for example, that Uber drivers/partners work fewer hours per week than taxi
drivers and chauffeurs. In this respect, their findings are consistent with those of Farrell and Greig (2016)
suggesting that being an Uber driver/partner is a secondary source of income for families. Using such
individual firm level data for companies that are engaged in new forms of workplace organization has
great potential but also great challenges that mimic those we stated above for private financial data.
Greater data access and integration with other data sources are needed.
30 | P a g e
VII. Conclusion and A Path Forward
The widely perceived rise of the gig economy is as yet not well understood or well measured.
Gig economy workers should be classified as self-employed, but the core traditional household surveys
do not show an increase in self-employment activity. There is more evidence in the administrative data of
growth in the number of individuals receiving income from self-employment activity but it is unclear to
what extent this is driven by growth in gig activity as conceived in popular perception. This warrants our
attention, since mismeasurement of any increase in nontraditional employment may mean that our
estimates of employment growth are too low, that our estimates of aggregate productivity growth are too
high, and that the pattern of productivity growth has been distorted.
. Our review of the state of knowledge in this area highlights that a challenge in understanding and
measuring the rise of the gig economy is to be clear about where such activity fits into the full range of
non-employee work. Identifying the key attributes that characterize different forms of non-employee
work, such as independent contractors, self-employed business owners, on call workers, temporary help
agency workers, and seasonal workers, help us close in on the traits of jobs that are most consistent with
gig work. In the framework we have developed, gig workers are a subset of contingent workers and also
are a subset of the unincorporated self-employed as identified in multiple data sources. We have
discussed the challenges to quantifying the prevalence of gig employment using existing household
survey data or administrative records by themselves.
Our analysis highlights the potential payoff from improvements in economic measurement along
two key dimensions. First, there is a high potential payoff from survey modules conducted at regular
intervals on ongoing surveys that probe more deeply about non-employee work activities. This should
not be surprising, since gig employment is often a secondary source of income that does not occur
regularly. This means it is likely not to be mentioned by respondents for whom gig work is not their
primary activity and who may not understand the subtle differences in terms such as self-employment,
contract worker, and independent contractor. To the extent that job attributes define the various types of
31 | P a g e
non-employee work arrangements, one possible path forward is to supplement employment probes with
questions relating to job attributes.
A second improvement in economic measurement would be to develop estimates based on survey
and administrative data that have been integrated at the individual level. Such integration offers great
potential for understanding the changing nature of work, particularly for non-traditional work activities
that are inherently difficult to define and measure. Our analysis shows that tax data measures an
increasing amount of self-employment activity that is missed in household surveys, yet this tax data by
itself is not informative about who these workers are. Linking tax data with household survey data gives
us not only the worker’s demographic characteristics, but also the worker’s family characteristics –
something that is crucially important for understanding how gig employment is related to family income
and health insurance coverage.
A key missing piece of the puzzle is to understand where non-traditional work fits into the career
paths of workers. This issue is of general interest but especially important in terms of understanding the
role of the gig economy in changing the nature of work in the future. One view, which the current limited
evidence seems to support, is that much of the online platform/on-demand non-employee work is
supplemental in nature. That is, there is not yet compelling evidence that the primary activity over the
course of an individual’s career is increasingly taking the form of non-employee work. This inference
must be drawn with great caution, however, because the type of survey and administrative data
integration that we are advocating is at a very early stage. Longitudinal matched employer-employee data
that also fully integrates non-employee work activity is needed to address these questions. Developing
such data infrastructure is a challenge but one we believe can be surmounted by building on the work we
have already carried out using the CPS-DER and LEHD data infrastructures. Pushing in this direction
would be greatly facilitated by full integration of Form 1099-MISC data that includes identifiers for both
the recipients and the providers of the reported payments of non-employee compensation. More
generally, the objective should be to develop the survey and administrative data so that the full taxonomy

32 | P a g e
of non-employee work as characterized in Table 1 could be measured and analyzed in the context of the
career paths of workers over their life cycle.
33 | P a g e
References Abraham, Katharine G. 1988. “Flexible Staffing Arrangements and Employers' Short-term Adjustment
Strategies,” in R.A. Hart, ed., Employment, Unemployment and Labour Utilization, London: Unwin Hyman, 288-311.
Abraham, Katharine G. 1990. “Restructuring the Employment Relationship: The Growth of Market-
Mediated Work Arrangements,” in K.G. Abraham and R.B. McKersie, eds., New Developments in the Labor Market: Toward a New Institutional Paradigm, Cambridge, Massachusetts: MIT Press, 85-119.
Abraham, Katharine G. and Ashley Amaya. In progress. “Probing for Informal Work Activity,”
unpublished working paper. Abraham, Katharine G., John Haltiwanger, Kristin Sandusky and James R. Spletzer. 2013. “Exploring
Differences in Employment between Household and Establishment Data,” Journal of Labor Economics, 31(2) S129-S172.
Abraham, Katharine G., John Haltiwanger, Kristin Sandusky and James R. Spletzer. In progress. “Is the
Gig Economy Growing?: Divergent Trends in Alternative Self-Employment Series,” unpublished working paper.
Abraham, Katharine G. and Susan K. Taylor. 1996. “Firms’ Use of Outside Contractors: Theory and
Evidence,” Journal of Labor Economics, 14(3) 394-424. Barker, Kathleen and Kathleen Christensen. 1998. Contingent Work: American Employment Relations in
Transition, Ithaca, New York: Cornell University Press. Cohany, Sharon R. 1996. “Workers in alternative employment arrangements,” Monthly Labor Review,
October, 31-45. Dey, Matthew, Susan Houseman, and Anne Polivka. 2012. “Manufacturers’ Outsourcing to Staffing
Services,” Industrial and Labor Relations Review, 65(3) 533–559. Dube, Arindrajit and Ethan Kaplan. 2010. “Does Outsourcing Reduce Wages in the Low-Wage Service
Occupations? Evidence from Janitors and Guards,” Industrial and Labor Relations Review, 63(2) 287–306.
Farrell, Diana and Fiona Greig. 2016. “Paychecks, Paydays, and the Online Platform Economy,” J.P.
Morgan Chase Institute Report, February. Foster, Lucia, John C. Haltiwanger and C.J. Krizan. 2001. “Aggregate Productivity Growth: Lessons
from Microeconomic Evidence,” in C. R. Hulten, E. R. Dean and M. J. Harper, eds., New Developments in Productivity Analysis, Chicago: University of Chicago Press, 303 – 372.
Foster, Lucia and Patrice Norman. “The Annual Survey of Entrepreneurs: An Introduction.” CES
Working Paper #15-40R, May 2016. ftp://ftp2.census.gov/ces/wp/2015/CES-WP-15-40R.pdf (accessed January 31, 2017).
Fort, Teresa. 2016. “Technology and Production Fragmentation: Domestic Versus Foreign Sourcing”,
Review of Economic Studies, (forthcoming).
34 | P a g e
Government Accountability Office. 2007. “A Strategy for Reducing the Gap Should Include Options for
Addressing Sole Proprietor Noncompliance,” GAO-07-1014, Report to the Committee on Finance, U.S. Senate.
Goldschmidt, Deborah and Johannes F. Schmieder, 2015. “The Rise of Domestic Outsourcing and the
Evolution of the German Wage Structure,” Quarterly Journal of Economics, forthcoming. Hall, Jonathan and Alan Krueger. 2015. “An Analysis of the Labor Market for Uber’s Driver-Partners in
the United States,” Industrial Relations Section Working Paper, January. Harris, Seth D. and Alan B. Krueger. 2015. “A Proposal for Modernizing Labor Laws for Twenty-First-
Century Work: The ‘Independent Worker’,” Hamilton Project Discussion Paper 2015-10, December.
Hipple, Steven F. and Laurel A. Hammond. 2016. “Self-Employment in the United States,” Bureau of
Labor Statistics, Spotlight on Statistics, March. https://www.bls.gov/spotlight/2016/self-employment-in-the-united-states/home.htm (accessed January 31, 2017).
Hurst, Erik and Benjamin Wild Pugsley. 2011. “What Do Small Businesses Do?” Brooking Papers on
Economic Activity, Fall 2011, 73-118. Hyatt, Henry R. and James R. Spletzer. 2017. “The Recent Decline in Single Quarter Jobs.” Labour
Economics, forthcoming. Jackson, Emilie, Adam Looney, and Shanthi Ramnath. 2017. “The Rise of Alternative Work
Arrangements: Evidence and Implications for Tax Filing and Benefit Coverage,” Office of Tax Analysis Working Paper 114. January.
Katz, Lawrence F. and Alan B. Krueger. 2016. “The Rise and Nature of Alternative Work Arrangements
in the United States, 1995-2015,” unpublished working paper. Leberstein, Sarah. 2012. “Independent Contractor Misclassification Imposes Huge Costs on Workers
and Federal and State Treasuries,” National Employment Law Project. August. Manyika, James, Susan Lund, Jacques Bughin, Kelsey Robinson, Jan Mischke, and Deepa Mahajan.
2016. “Independent work: Choice, necessity, and the gig economy.” McKinsey Global Institute. October. Available at http://www.mckinsey.com/global-themes/employment-and-growth/independent-work-choice-necessity-and-the-gig-economy (accessed January 31, 2017).
National Academies Press. 2017. Information Technology and the Workforce: Automation, Augmentation
and Transformation, Washington, DC. Polivka, Anne E. 1996a. “Contingent and alternative work arrangements, defined,” Monthly Labor
Review, October, 3-9. Polivka, Anne E. 199b. “A profile of contingent workers,” Monthly Labor Review, October, 10-21. Robles, Barbara and Marysol McGee. 2016. “Exploring Online and Offline Informal Work: Findings
from the Enterprising and Informal Work Activities (EIWA) Survey,” Finance and Economics Discussion Series 2016-089. Washington: Board of Governors of the Federal Reserve System.
35 | P a g e
Slemrod, Joel, Brett Collins, Jeffrey Hoopes, Daniel Reck, and Michael Sebastiani, 2015. “Does credit-
card information reporting improve small-business tax compliance?,” NBER Working Paper No. 21412. July.
Slemrod, Joel and Jon Bakija. 2008. Taxing Ourselves: A Citizen’s Guide to the Debate over Taxes,
Fourth Edition, Cambridge, Massachusetts: MIT Press. U.S. Department of the Treasury. 2015. Letter from Anne Wall, Assistant Secretary for Legislative
Affairs, to Senator Mark Warner. October 27. Published in Tax Notes Today: Treasury Tax Correspondence, November 18, 2015.
Weil, David. 2014. “The Fissured Workplace.” Cambridge MA: Harvard University Press.
36 | P a g e
Appendix A: Available Household Survey and Administrative Self-Employment Data Series
Household survey data on self-employment. The Current Population Survey (CPS) is a monthly
household survey with a sample that represents the civilian population of the United States. The basic
monthly CPS questionnaire collects relatively rich information on the characteristics of all members of
selected households age 16 and older, including their age, sex, race, ethnicity, nativity, disability status,
and education. The monthly instrument also contains questions to determine whether household members
were employed during the survey reference week (normally the week that includes the 12th of the month)
and, if so, whether each person had more than one job during that week. For those categorized as
employed, the CPS asks about the occupation and industry of the main job, hours on the main job, and
combined hours on any other jobs. Additional questions are asked that allow the main job to be
categorized as a wage and salary, self-employed or unpaid family worker position. In published Bureau
of Labor Statistics (BLS) statistical series on self-employment, individuals who operate an incorporated
business are categorized as wage and salary workers rather than as self-employed, but both the
incorporated and the unincorporated self-employed can be identified in the underlying microdata.
Information on the industry, occupation and type of employment for any reported second jobs is collected
for just a quarter of the sample—those in the so-called outgoing rotation groups—and is not collected at
all for any additional jobs. Finally, for the quarter of the sample in the outgoing rotation groups, the
monthly CPS collects information on earnings on the main job. All of these data are available on a
consistent basis beginning in 1994, the year of the most recent major CPS redesign.
The Annual Social and Economic (ASEC) supplement that is administered each spring to CPS
households collects information for the preceding calendar year. Respondents are asked about the
number of weeks during the year worked by each member of the CPS household, the number of jobs held
at different times during the year, and the industry, occupation and type of the longest job.10 These data
10 Individuals who hold two jobs simultaneously rather than in sequence are instructed to report holding just one job.
37 | P a g e
allow the longest job held during the year to be categorized as self-employed or wage-and-salary. In
addition, the CPS-ASEC supplement contains questions intended to identify business income and wage
and salary income received during the year. Business income consists of income from both incorporated
and unincorporated self-employment. Data from the CPS-ASEC supplement are available beginning in
1962.
The American Community Survey (ACS) is a Census Bureau survey with a very large sample
that represents the U.S. civilian population. For each household member age 15 years or older, the ACS
asks whether the person worked for pay during the prior seven days (“last week”). For those who are
reported to have worked, additional questions collect information about the main job held during the
reference week—the industry and occupation of the work and whether the person was an employee, self-
employed with an incorporated business, self-employed with an unincorporated business, or an unpaid
family worker. In addition, the ACS requests the total amounts of self-employment income and employee
compensation earned by each household member over the prior 12 months that could in principle be used
to construct a measure of self-employment activity based on receipt of business income that is similar to
that based on CPS-ASEC data. ACS estimates of self-employment on the main job are available from
2005 through the present. Some ACS data were collected beginning in 2001, the survey was not fully
implemented until 2005 and that is the first year for which published estimates are available.
Tax data on self-employment. The Master Earnings File (MEF) maintained by the Social
Security Administration (SSA) is one source of administrative data on self-employment earnings. The
MEF includes information on each W-2 a person received for a calendar year, for 1978 onward, including
the earnings reported on the W-2 and the employer from whom those earnings were received, and on the
total self-employment earnings reported for the year on a Schedule SE filed by a taxpayer. A Schedule
SE is required of sole proprietors, general partners and farmers with gross self-employment earnings
above a defined threshold that has been set effectively at $433 over the period covered by our analysis.
More than 85 percent of Schedule SE filers are sole proprietors (Jackson, Looney and Ramnath 2016).
The MEF records are not public, but an extract called the Detailed Earnings Record (DER) covering all
38 | P a g e
linked CPS-ASEC and SIPP respondents between 1991 and the present have been provided to the Census
Bureau for specified statistical uses.
The Census Bureau’s Business Register (BR) is the master business list that the Census Bureau
maintains for use as a sample frame for all of its business surveys as well as a source that is tabulated
directly to produce a variety of business statistics. The BR is based primarily on administrative data from
business income and payroll tax returns. It includes records for both employer businesses and non-
employer businesses. Each record on the file is assigned a detailed industry code. Employer businesses
are those with positive payroll in a year while non-employer businesses are those with qualifying business
revenue but no paid employment. As stated on the Census Bureau’s website, “most nonemployers are
self-employed individuals operating unincorporated businesses (known as sole proprietorships), which
may or may not be the owner's principal source of income.” To be included in the non-employer universe
for tabulation, other than in construction, a business must have at least $1,000 in revenue. Businesses
with more than some maximum amount of annual revenue are excluded from the non-employer universe
on the grounds that businesses with revenues over the threshold amount are likely to have employees and
thus to appear on the list of employer businesses. The upper revenue threshold is determined based on the
business’s legal form of organization (sole proprietorship, partnership or corporation) and industry. The
information about payroll and business costs recorded in the BR make it possible to distinguish between
sole proprietors who are running an independent business (with or without employees) versus those who
are engaged in the type of non-employee work that is the focus of this analysis.11 The Census non-
employer data are available beginning in 1997.
One challenge in making the non-employer microdata useful for person-level analysis is the
ability to cleanly identify the owner of the business. Non-employer businesses most frequently are sole
proprietorships and are thus identified based on the filing of a Schedule C. Individuals with any gross
11 The revenue and cost data for sole proprietors are from the Form 1040 Schedule C. Our approach for distinguishing business owners from non-employee workers is similar in spirit to that employed in work in progress by Jackson, Looney and Ramnath (2016).
39 | P a g e
non-employee or business income on their individual tax return are required to file a Schedule C. For
these sole proprietorships, Census integrates information from the Schedule SE filed by the owner
(roughly 75 percent of Schedule C filers also submit a Schedule SE). In these cases, it is straightforward
to identify the business owner. Among the 25 percent of Schedule C filers who do not submit a Schedule
SE, it is also straightforward to assign ownership if the Schedule C does not accompany a 1040 submitted
by a married and jointly filing household. Among Schedule Cs filed by married and jointly filing
households with no accompanying Schedule SE information, Census uses all observed ownership history
as well as wage and salary work history to impute which spouse to associate with the Schedule C.
Finally, roughly twenty percent of active non-employer entities file as partnership or incorporated entities.
In these cases, the identity of the owner is currently not observed.
The Form 1099-MISC also contains information relevant to assessing trends in self-employment
income. This is the tax form used by businesses to report payments of non-employee compensation.
Applicable regulations require that a Form 1099-MISC be filed by business payers when nonemployee
compensation paid to any source equals or exceeds $600 over the course of a year; applicable amounts are
recorded in Box 7 of the form. One complication is that a Form 1099-MISC may be issued either to an
individual (using an SSN) or to a business (using an EIN). Further, the dollar amounts reported on the
Form 1099-MISC are gross payments rather than the net amounts earned by the recipient after expenses.
Individuals or businesses performing work for a homeowner rather than for a business will not receive a
Form 1099-MISC.12 Staff at the Department of the Treasury have compiled counts of the number of
individuals and the number of businesses receiving Form 1099-MISCs that had positive amounts reported
in Box 7, Non-employee Compensation, for each year from 2000 through 2012. These counts are
available from U.S. Department of the Treasury (2015).
Linked Household-Administrative Data File. Individuals in our linked sample were interviewed
by the CPS-ASEC in at least one year between 1997 and 2013 and provide employment and earnings
12 See U.S. Department of the Treasury (2015) for a more detailed discussion of Form 1099-MISC reporting.

40 | P a g e
information for the prior calendar year, 1996 through 2012. These CPS-ASEC individuals were linked to
W-2 and Schedule SE earnings information provided to the Census Bureau by the Social Security
Administration (SSA) in the form of the Detailed Earnings Record (DER), an extract from the SSA
Master Earnings File. This linking is performed using a Protected Identity Key (PIK), which is a
replacement identifier for the SSN. We restrict our analysis sample to the set of CPS respondents with a
PIK.
One complication in creating the linked file is that the PIK is missing for 20 to 30 percent of
ASEC respondents, depending on the year. We use propensity score methods to reweight the sample of
people for whom we have a PIK so that they represent the population as a whole. For each year, we
estimate a regression model in which an indicator for having a PIK is regressed on indicators for age
group, gender, race, education, marital status, foreign-born status, state of residence, and whether the
person reported being employed in the relevant CPS-ASEC. The coefficients from this model are used to
calculate each individual’s probability of having a PIK and a weight adjustment equal to the inverse of
this probability is applied to the CPS-ASEC estimation weight. Individuals with a PIK are retained in our
sample regardless of whether we are able to locate any W-2 or Schedule SE earnings for them in the
DER.
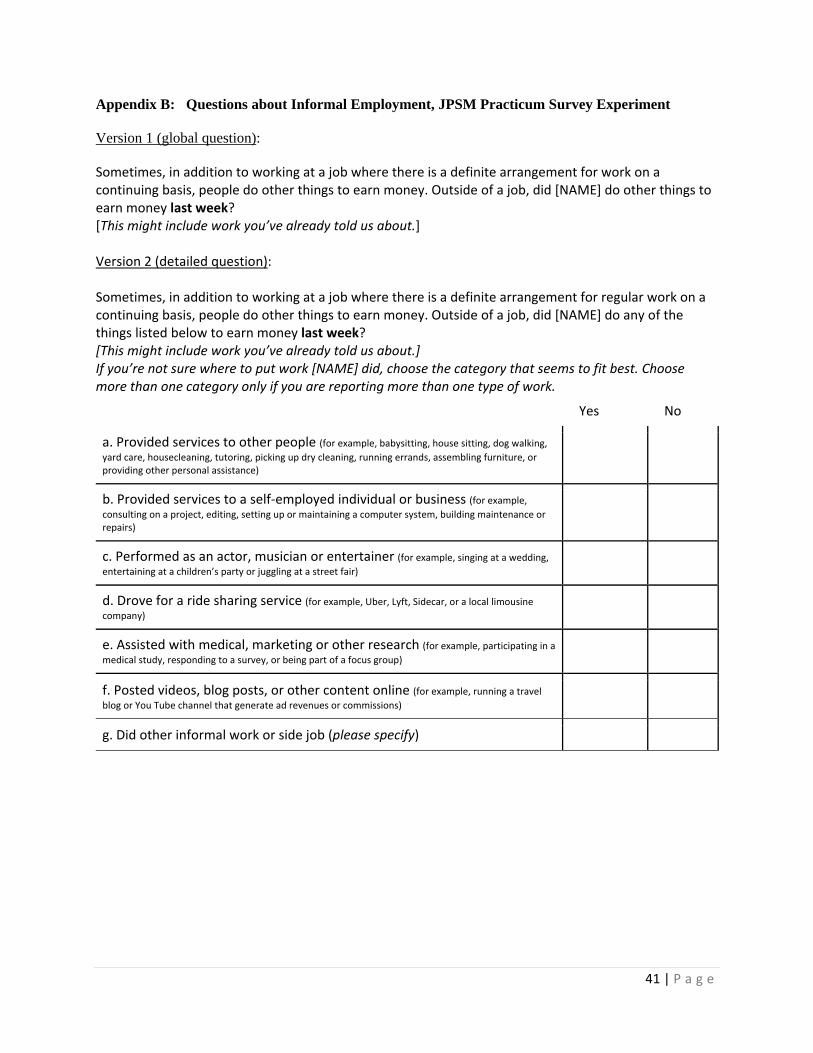
41 | P a g e
Appendix B: Questions about Informal Employment, JPSM Practicum Survey Experiment
Version 1 (global question):
Sometimes, in addition to working at a job where there is a definite arrangement for work on a continuing basis, people do other things to earn money. Outside of a job, did [NAME] do other things to earn money last week? [This might include work you’ve already told us about.]
Version 2 (detailed question): Sometimes, in addition to working at a job where there is a definite arrangement for regular work on a continuing basis, people do other things to earn money. Outside of a job, did [NAME] do any of the things listed below to earn money last week? [This might include work you’ve already told us about.] If you’re not sure where to put work [NAME] did, choose the category that seems to fit best. Choose more than one category only if you are reporting more than one type of work.
Yes No
a. Provided services to other people (for example, babysitting, house sitting, dog walking,
yard care, housecleaning, tutoring, picking up dry cleaning, running errands, assembling furniture, or providing other personal assistance)
b. Provided services to a self‐employed individual or business (for example,
consulting on a project, editing, setting up or maintaining a computer system, building maintenance or repairs)
c. Performed as an actor, musician or entertainer (for example, singing at a wedding,
entertaining at a children’s party or juggling at a street fair)
d. Drove for a ride sharing service (for example, Uber, Lyft, Sidecar, or a local limousine
company)
e. Assisted with medical, marketing or other research (for example, participating in a
medical study, responding to a survey, or being part of a focus group)
f. Posted videos, blog posts, or other content online (for example, running a travel
blog or You Tube channel that generate ad revenues or commissions)
g. Did other informal work or side job (please specify)
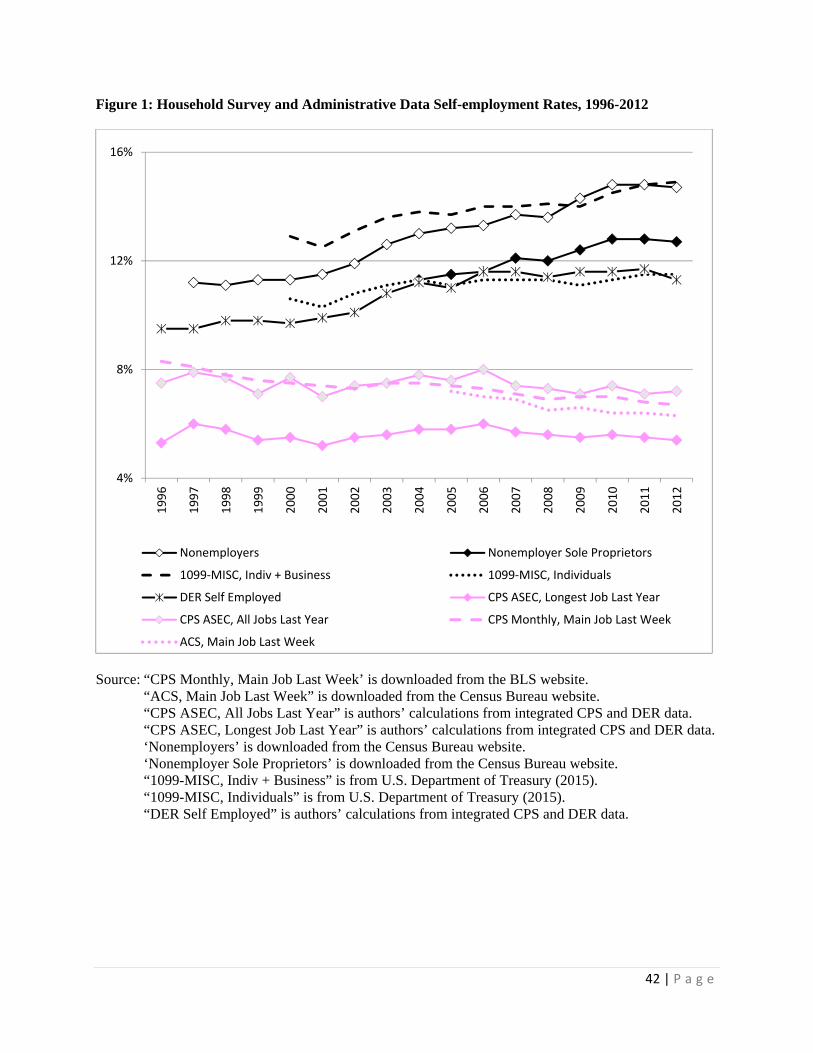
42 | P a g e
Figure 1: Household Survey and Administrative Data Self-employment Rates, 1996-2012
Source: “CPS Monthly, Main Job Last Week’ is downloaded from the BLS website. “ACS, Main Job Last Week” is downloaded from the Census Bureau website. “CPS ASEC, All Jobs Last Year” is authors’ calculations from integrated CPS and DER data. “CPS ASEC, Longest Job Last Year” is authors’ calculations from integrated CPS and DER data. ‘Nonemployers’ is downloaded from the Census Bureau website. ‘Nonemployer Sole Proprietors’ is downloaded from the Census Bureau website. “1099-MISC, Indiv + Business” is from U.S. Department of Treasury (2015). “1099-MISC, Individuals” is from U.S. Department of Treasury (2015). “DER Self Employed” is authors’ calculations from integrated CPS and DER data.
4%
8%
12%
16%1996
1997
1998
1999
2000
2001
2002
2003
2004
2005
2006
2007
2008
2009
2010
2011
2012
Nonemployers Nonemployer Sole Proprietors
1099‐MISC, Indiv + Business 1099‐MISC, Individuals
DER Self Employed CPS ASEC, Longest Job Last Year
CPS ASEC, All Jobs Last Year CPS Monthly, Main Job Last Week
ACS, Main Job Last Week
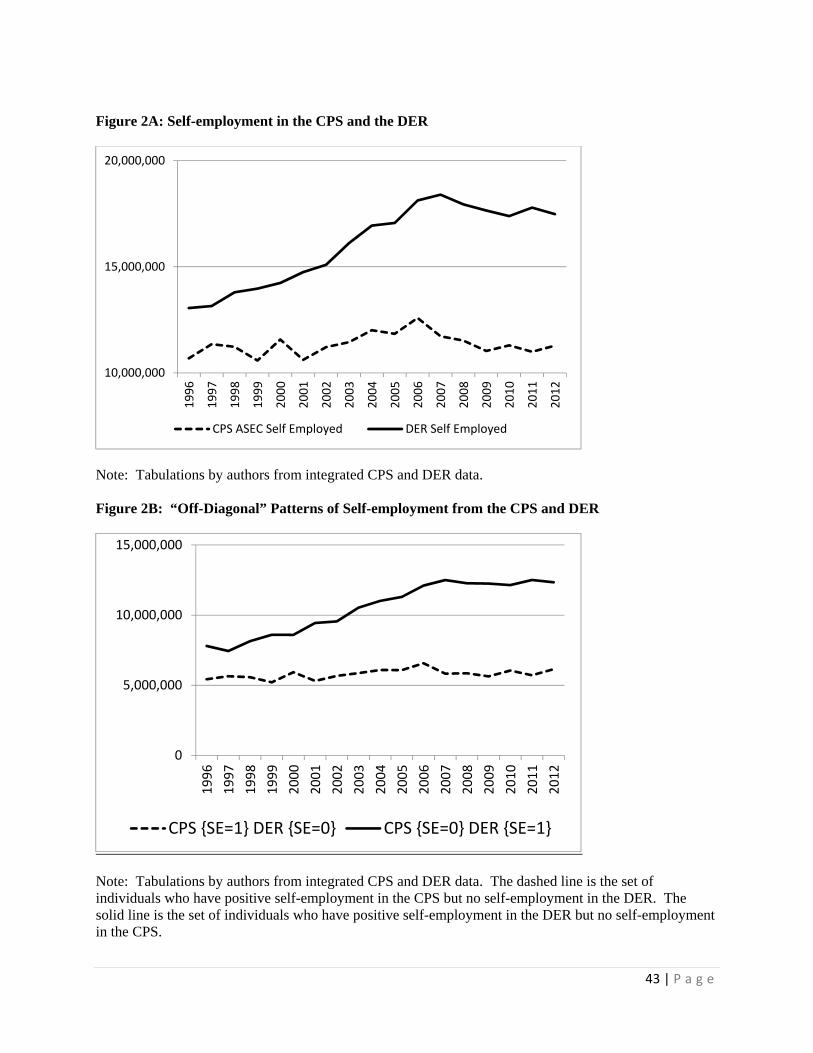
43 | P a g e
Figure 2A: Self-employment in the CPS and the DER
Note: Tabulations by authors from integrated CPS and DER data.
Figure 2B: “Off-Diagonal” Patterns of Self-employment from the CPS and DER
Note: Tabulations by authors from integrated CPS and DER data. The dashed line is the set of individuals who have positive self-employment in the CPS but no self-employment in the DER. The solid line is the set of individuals who have positive self-employment in the DER but no self-employment in the CPS.
10,000,000
15,000,000
20,000,000
1996
1997
1998
1999
2000
2001
2002
2003
2004
2005
2006
2007
2008
2009
2010
2011
2012
CPS ASEC Self Employed DER Self Employed
0
5,000,000
10,000,000
15,000,000
1996
1997
1998
1999
2000
2001
2002
2003
2004
2005
2006
2007
2008
2009
2010
2011
2012
CPS {SE=1} DER {SE=0} CPS {SE=0} DER {SE=1}
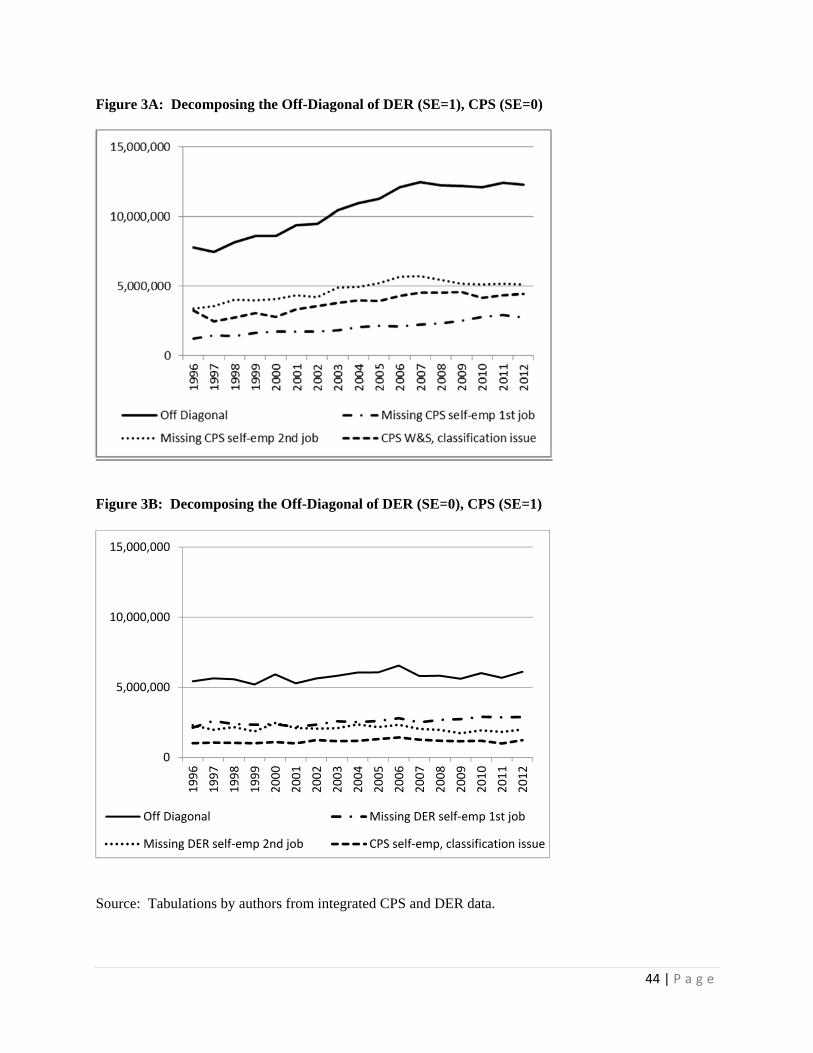
44 | P a g e
Figure 3A: Decomposing the Off-Diagonal of DER (SE=1), CPS (SE=0)
Figure 3B: Decomposing the Off-Diagonal of DER (SE=0), CPS (SE=1)
Source: Tabulations by authors from integrated CPS and DER data.
0
5,000,000
10,000,000
15,000,000
1996
1997
1998
1999
2000
2001
2002
2003
2004
2005
2006
2007
2008
2009
2010
2011
2012
Off Diagonal Missing DER self‐emp 1st job
Missing DER self‐emp 2nd job CPS self‐emp, classification issue
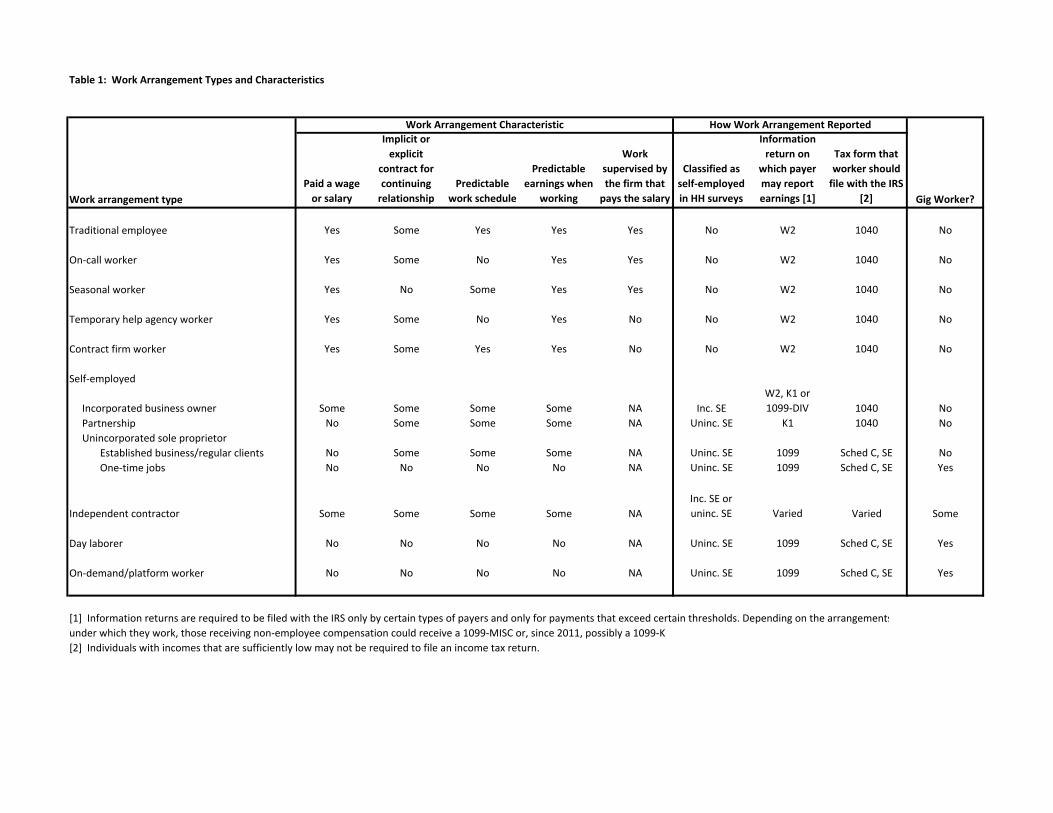
Table 1: Work Arrangement Types and Characteristics
Paid a wage
or salary
Implicit or
explicit
contract for
continuing
relationship
Predictable
work schedule
Predictable
earnings when
working
Work
supervised by
the firm that
pays the salary
Classified as
self‐employed
in HH surveys
Information
return on
which payer
may report
earnings [1]
Tax form that
worker should
file with the IRS
[2]
Traditional employee Yes Some Yes Yes Yes No W2 1040 No
On‐call worker Yes Some No Yes Yes No W2 1040 No
Seasonal worker Yes No Some Yes Yes No W2 1040 No
Temporary help agency worker Yes Some No Yes No No W2 1040 No
Contract firm worker Yes Some Yes Yes No No W2 1040 No
Self‐employed
Incorporated business owner Some Some Some Some NA Inc. SE
W2, K1 or
1099‐DIV 1040 No
Partnership No Some Some Some NA Uninc. SE K1 1040 No
Unincorporated sole proprietor
Established business/regular clients No Some Some Some NA Uninc. SE 1099 Sched C, SE No
One‐time jobs No No No No NA Uninc. SE 1099 Sched C, SE Yes
Independent contractor Some Some Some Some NA
Inc. SE or
uninc. SE Varied Varied Some
Day laborer No No No No NA Uninc. SE 1099 Sched C, SE Yes
On‐demand/platform worker No No No No NA Uninc. SE 1099 Sched C, SE Yes
[1] Information returns are required to be filed with the IRS only by certain types of payers and only for payments that exceed certain thresholds. Depending on the arrangements
under which they work, those receiving non‐employee compensation could receive a 1099‐MISC or, since 2011, possibly a 1099‐K.
[2] Individuals with incomes that are sufficiently low may not be required to file an income tax return.
Work arrangement type
Work Arrangement Characteristic How Work Arrangement Reported
Gig Worker?
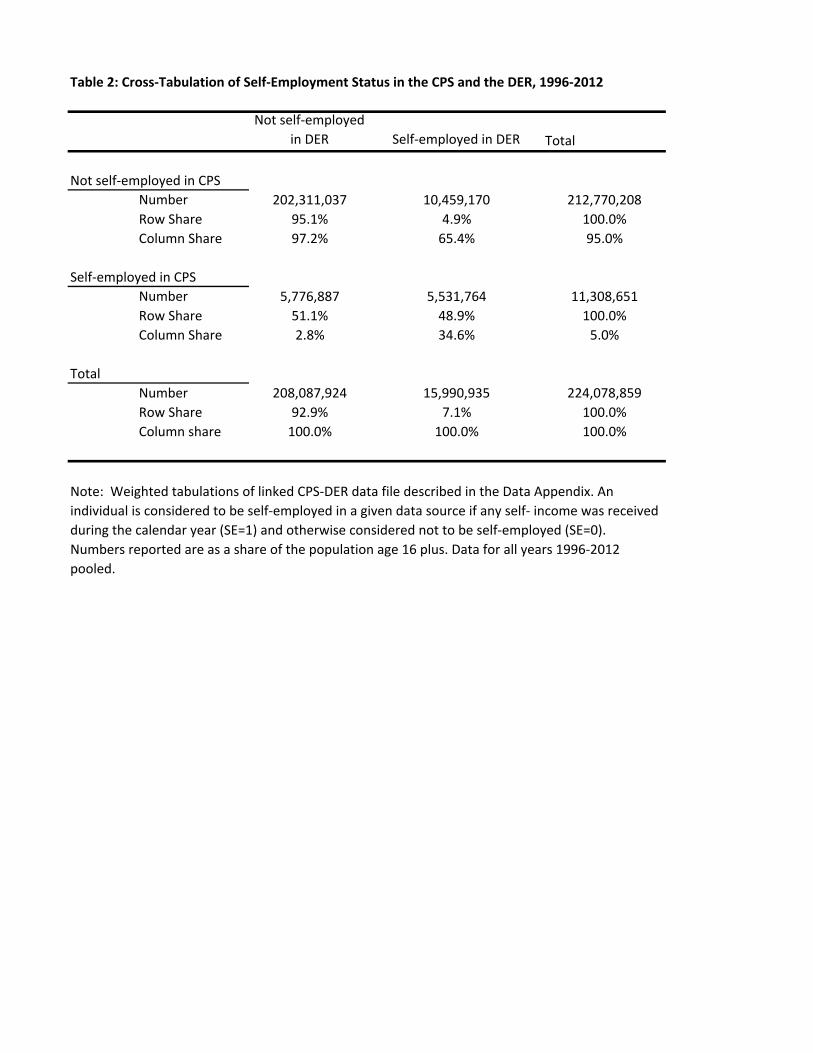
Table 2: Cross‐Tabulation of Self‐Employment Status in the CPS and the DER, 1996‐2012
Not self‐employed
in DER Self‐employed in DER Total
Not self‐employed in CPS
Number 202,311,037 10,459,170 212,770,208
Row Share 95.1% 4.9% 100.0%
Column Share 97.2% 65.4% 95.0%
Self‐employed in CPS
Number 5,776,887 5,531,764 11,308,651
Row Share 51.1% 48.9% 100.0%
Column Share 2.8% 34.6% 5.0%
Total
Number 208,087,924 15,990,935 224,078,859
Row Share 92.9% 7.1% 100.0%
Column share 100.0% 100.0% 100.0%
Note: Weighted tabulations of linked CPS‐DER data file described in the Data Appendix. An
individual is considered to be self‐employed in a given data source if any self‐ income was received
during the calendar year (SE=1) and otherwise considered not to be self‐employed (SE=0).
Numbers reported are as a share of the population age 16 plus. Data for all years 1996‐2012
pooled.
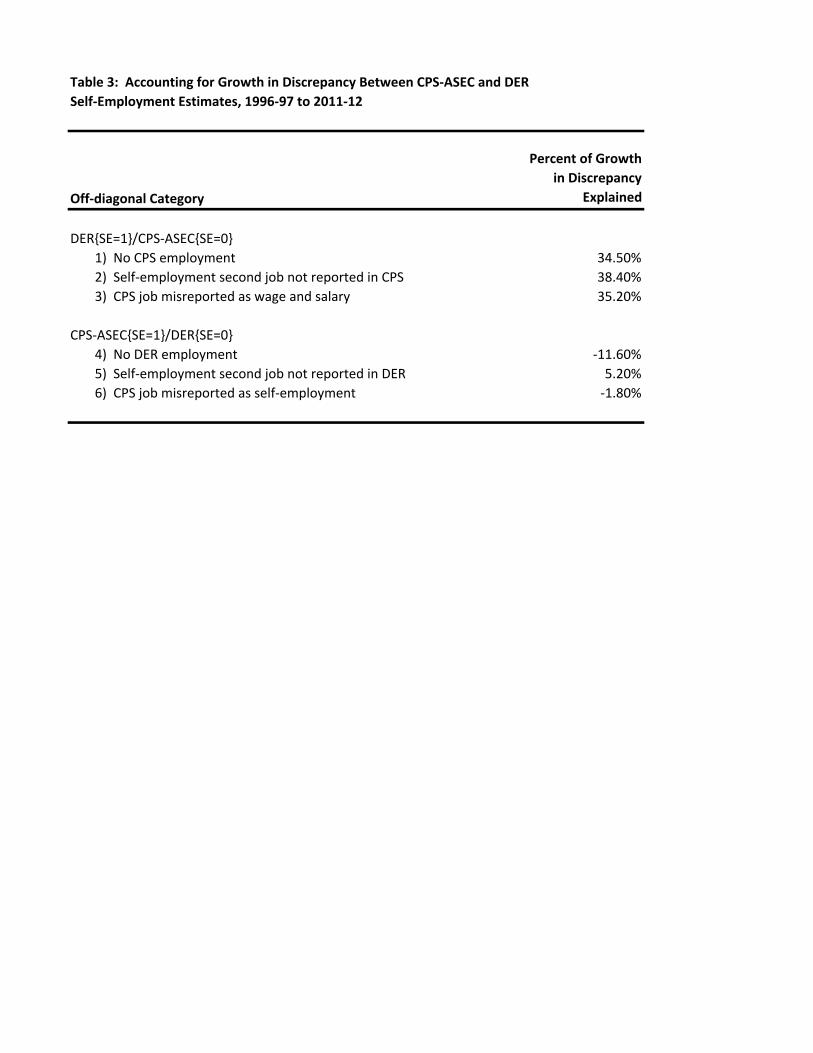
Table 3: Accounting for Growth in Discrepancy Between CPS‐ASEC and DER
Self‐Employment Estimates, 1996‐97 to 2011‐12
Off‐diagonal Category
Percent of Growth
in Discrepancy
Explained
DER{SE=1}/CPS‐ASEC{SE=0}
1) No CPS employment 34.50%
2) Self‐employment second job not reported in CPS 38.40%
3) CPS job misreported as wage and salary 35.20%
CPS‐ASEC{SE=1}/DER{SE=0}
4) No DER employment ‐11.60%
5) Self‐employment second job not reported in DER 5.20%
6) CPS job misreported as self‐employment ‐1.80%
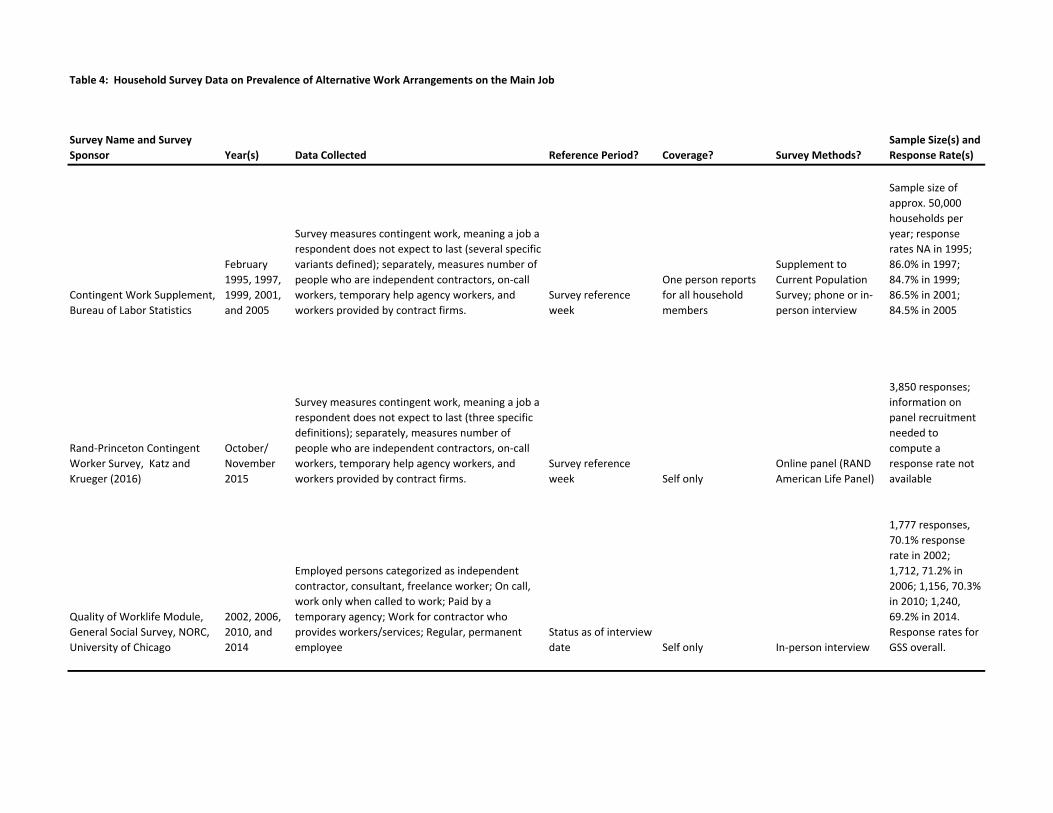
Table 4: Household Survey Data on Prevalence of Alternative Work Arrangements on the Main Job
Survey Name and Survey
Sponsor Year(s) Data Collected Reference Period? Coverage? Survey Methods?
Sample Size(s) and
Response Rate(s)
Contingent Work Supplement,
Bureau of Labor Statistics
February
1995, 1997,
1999, 2001,
and 2005
Survey measures contingent work, meaning a job a
respondent does not expect to last (several specific
variants defined); separately, measures number of
people who are independent contractors, on‐call
workers, temporary help agency workers, and
workers provided by contract firms.
Survey reference
week
One person reports
for all household
members
Supplement to
Current Population
Survey; phone or in‐
person interview
Sample size of
approx. 50,000
households per
year; response
rates NA in 1995;
86.0% in 1997;
84.7% in 1999;
86.5% in 2001;
84.5% in 2005
Rand‐Princeton Contingent
Worker Survey, Katz and
Krueger (2016)
October/
November
2015
Survey measures contingent work, meaning a job a
respondent does not expect to last (three specific
definitions); separately, measures number of
people who are independent contractors, on‐call
workers, temporary help agency workers, and
workers provided by contract firms.
Survey reference
week Self only
Online panel (RAND
American Life Panel)
3,850 responses;
information on
panel recruitment
needed to
compute a
response rate not
available
Quality of Worklife Module,
General Social Survey, NORC,
University of Chicago
2002, 2006,
2010, and
2014
Employed persons categorized as independent
contractor, consultant, freelance worker; On call,
work only when called to work; Paid by a
temporary agency; Work for contractor who
provides workers/services; Regular, permanent
employee
Status as of interview
date Self only In‐person interview
1,777 responses,
70.1% response
rate in 2002;
1,712, 71.2% in
2006; 1,156, 70.3%
in 2010; 1,240,
69.2% in 2014.
Response rates for
GSS overall.
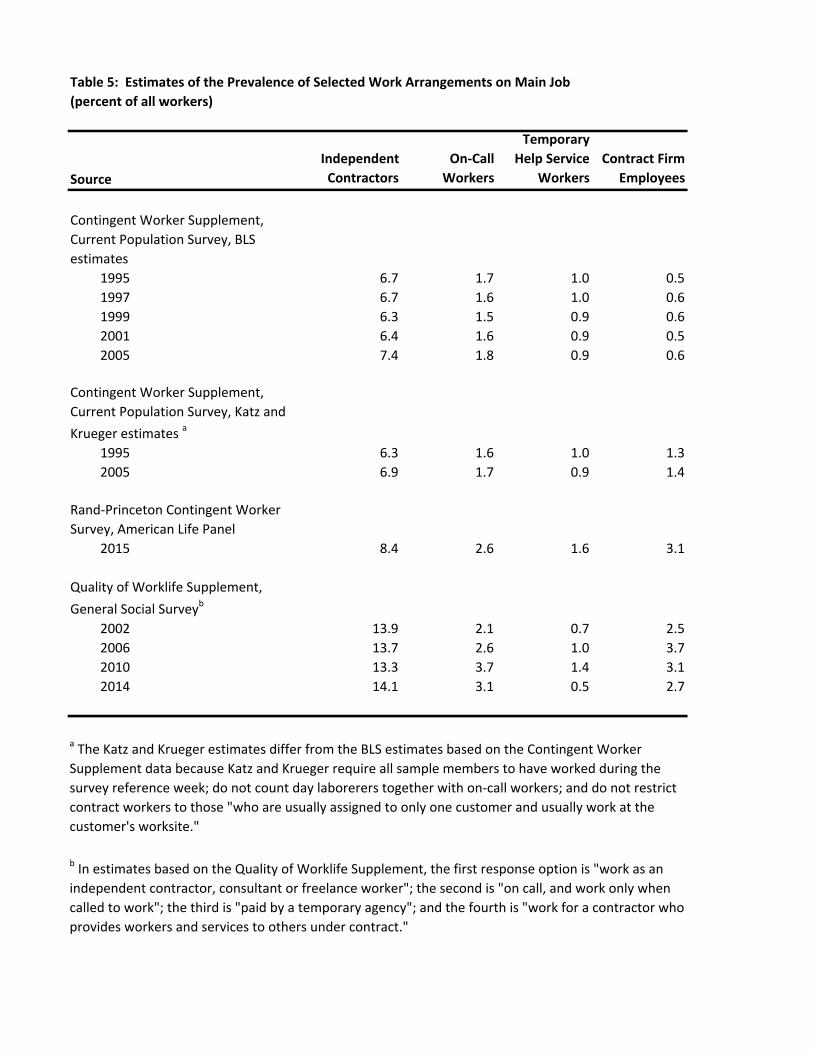
Table 5: Estimates of the Prevalence of Selected Work Arrangements on Main Job
(percent of all workers)
Source
Independent
Contractors
On‐Call
Workers
Temporary
Help Service
Workers
Contract Firm
Employees
1995 6.7 1.7 1.0 0.5
1997 6.7 1.6 1.0 0.6
1999 6.3 1.5 0.9 0.6
2001 6.4 1.6 0.9 0.5
2005 7.4 1.8 0.9 0.6
1995 6.3 1.6 1.0 1.3
2005 6.9 1.7 0.9 1.4
2015 8.4 2.6 1.6 3.1
Quality of Worklife Supplement,
General Social Surveyb
2002 13.9 2.1 0.7 2.5
2006 13.7 2.6 1.0 3.7
2010 13.3 3.7 1.4 3.1
2014 14.1 3.1 0.5 2.7
Contingent Worker Supplement,
Current Population Survey, BLS
estimates
Contingent Worker Supplement,
Current Population Survey, Katz and
Krueger estimates a
Rand‐Princeton Contingent Worker
Survey, American Life Panel
a The Katz and Krueger estimates differ from the BLS estimates based on the Contingent Worker
Supplement data because Katz and Krueger require all sample members to have worked during the
survey reference week; do not count day laborerers together with on‐call workers; and do not restrict
contract workers to those "who are usually assigned to only one customer and usually work at the
customer's worksite."
b In estimates based on the Quality of Worklife Supplement, the first response option is "work as an
independent contractor, consultant or freelance worker"; the second is "on call, and work only when
called to work"; the third is "paid by a temporary agency"; and the fourth is "work for a contractor who
provides workers and services to others under contract."
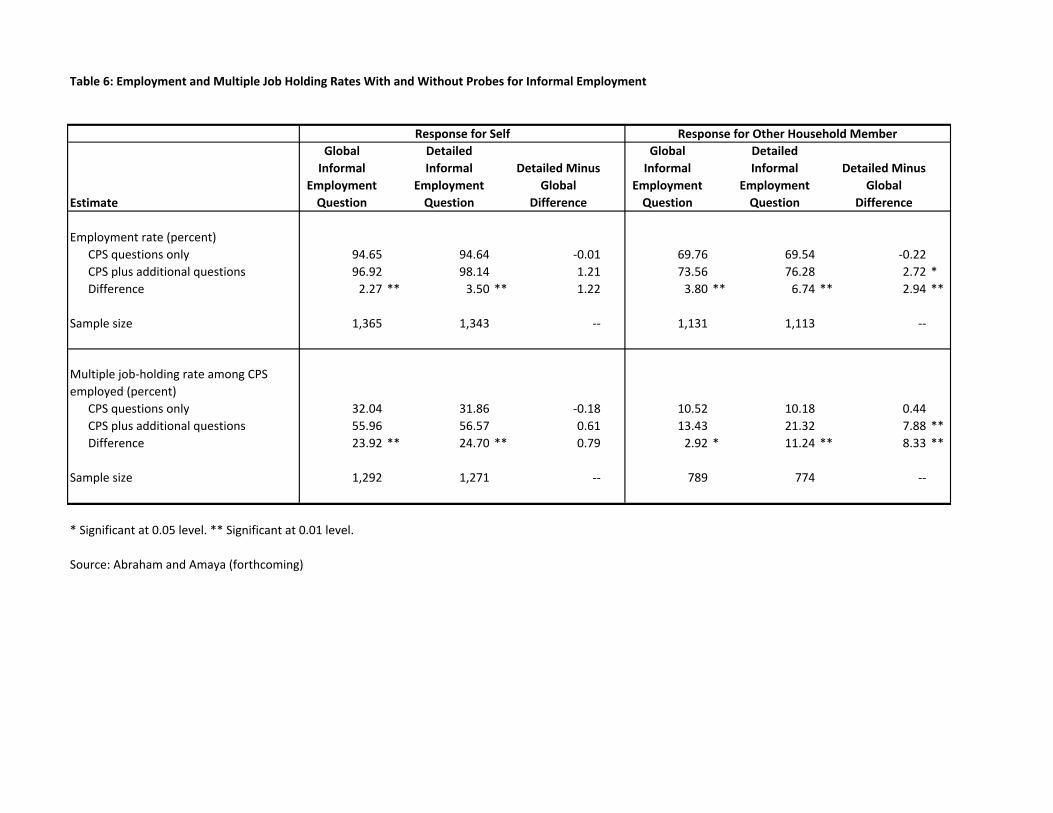
Table 6: Employment and Multiple Job Holding Rates With and Without Probes for Informal Employment
Estimate
Global
Informal
Employment
Question
Detailed
Informal
Employment
Question
Detailed Minus
Global
Difference
Global
Informal
Employment
Question
Detailed
Informal
Employment
Question
Detailed Minus
Global
Difference
Employment rate (percent)
CPS questions only 94.65 94.64 ‐0.01 69.76 69.54 ‐0.22
CPS plus additional questions 96.92 98.14 1.21 73.56 76.28 2.72 *
Difference 2.27 ** 3.50 ** 1.22 3.80 ** 6.74 ** 2.94 **
Sample size 1,365 1,343 ‐‐ 1,131 1,113 ‐‐
CPS questions only 32.04 31.86 ‐0.18 10.52 10.18 0.44
CPS plus additional questions 55.96 56.57 0.61 13.43 21.32 7.88 **
Difference 23.92 ** 24.70 ** 0.79 2.92 * 11.24 ** 8.33 **
Sample size 1,292 1,271 ‐‐ 789 774 ‐‐
* Significant at 0.05 level. ** Significant at 0.01 level.
Source: Abraham and Amaya (forthcoming)
Response for Self Response for Other Household Member
Multiple job‐holding rate among CPS
employed (percent)