Measuring the educational impact of child labour ...
17
Measuring the educational impact of child labour: Indicators available from common household survey instruments April 2008 Understanding Children’s Work Project Working Paper Series, April 2008 Public Disclosure Authorized Public Disclosure Authorized Public Disclosure Authorized Public Disclosure Authorized Public Disclosure Authorized Public Disclosure Authorized Public Disclosure Authorized Public Disclosure Authorized
Transcript of Measuring the educational impact of child labour ...

�
� �
�Measuring the educational impact of
child labour:
Indicators available from commonhousehold survey instruments
April 2008Und
erst
andi
ng C
hild
ren’
s Wor
k Pr
ojec
t Wor
king
Pap
er S
erie
s, A
pril
2008
Pub
lic D
iscl
osur
e A
utho
rized
Pub
lic D
iscl
osur
e A
utho
rized
Pub
lic D
iscl
osur
e A
utho
rized
Pub
lic D
iscl
osur
e A
utho
rized
Pub
lic D
iscl
osur
e A
utho
rized
Pub
lic D
iscl
osur
e A
utho
rized
Pub
lic D
iscl
osur
e A
utho
rized
Pub
lic D
iscl
osur
e A
utho
rized
wb394321
Typewritten Text
64522

Measuring the educational impact of child labour:Indicators available from common household
survey instruments
Working Paper
April 2008
Understanding Children’s Work (UCW) Project University of Rome “Tor Vergata” - Faculty of Economics
V. Columbia 2 00133 Rome Tor Vergata
Tel: +39 06.7259.5618Fax: +39 06.2020.687
Email: [email protected]�
�
�
�
As part of broader efforts towards durable solutions to child labor, the International Labour Organization (ILO), the United Nations Children’s Fund (UNICEF), and the World Bank initiated the interagency Understanding Children’s Work (UCW) project in December 2000. The project is guided by the Oslo Agenda for Action, which laid out the priorities for the international community in the fight against child labor. Through a variety of data collection, research, and assessment activities, the UCW project is broadly directed toward improving understanding of child labor, its causes and effects, how it can be measured, and effective policies for addressing it. For further information, see the project website at www.ucw-project.org.
This paper is part of the research carried out within UCW (Understanding Children's Work), a joint ILO, World Bank and UNICEF project. The views expressed here are those of the authors' and should not be attributed to the ILO, the World Bank, UNICEF or any of these agencies’ member countries.

Measuring the educational impact of child labour:indicators available from common household
survey instruments�
�
Working Paper
April 2008
�
�
ABSTRACT �
Understanding the interplay between education and child labour is critical to achieving both EFA and child labour elimination goals. This note forms part of UCW broader efforts towards improving this understanding. It elaborates an expanded list of education indicators available from common household survey instruments that can be used for assessing the educational impact of child labour. These indicators cover not only school attendance but also school progression and survival, and therefore extend beyond the information on child labour and education typically provided in the research literature to date. �
� �

Measuring the educational impact of child labour:indicators available from common household
survey instruments�
�
Working Paper
April 2008
CONTENTS
1. Introduction............................................................................................................................................. 1 2. Expanded list of core education indicators ........................................................................................ 1
2.1 School entry and participation ............................................................................... ........... 2
2.2 School progression ................................................................................................... ........... 4
3. Data requirements and availabilty ........................................................................................................ 6 4. Expanded core education indicators list: an illustration ................................................................... 9
� 1� UCW WORKING PAPER SERIES, APRIL 2008
1. INTRODUCTION 1. The international community's efforts to achieve Education For All (EFA) and the progressive elimination of child labour are closely linked. Education – and, in particular, education of good quality up to the minimum age for entering into employment – is a key element in the prevention of child labour. At the same time, child labour is one of the main obstacles to EFA, as involvement in child labour is generally at a cost to children’s ability to attend and perform in school. 2. Understanding the interplay between education and child labour is therefore critical to achieving both EFA and child labour elimination goals. This note forms part of UCW broader efforts towards improving this understanding. It elaborates an expanded list of education indicators available from common household survey instruments that can be used for assessing the educational impact of child labour. These indicators cover not only school attendance but also school progression and survival, and therefore extend beyond the information on child labour and education typically provided in the research literature to date. 3. Child labour is a legal rather than statistical concept, and is defined in broad terms by the international legal standards for child labour.1 It is not possible to develop any single statistical measure of child labour valid across all countries, as the flexibility clauses in the international legal standards give countries considerable leeway in setting the boundaries for child labour. For the purposes of this note, children involvement in economic activity is used as a proxy for child labour, following loosely on the approach adopted by ILO in its published global estimates of child labour. A similar exercise, however, could be conducted employing a variety of other possible child labour measures. �
�
2. EXPANDED LIST OF CORE EDUCATION INDICATORS 4. An expanded list of core education indicators for use in child labour analysis is presented below.2 When disaggregated by children’s work status, these indicators can provide insight into differences between working and non-working children in terms of their ability to enter and participate in school, and to survive and progress through the school system once there. These indicators can also be used to assess differences in school participation, survival and progression within the population of child workers, e.g., child working in different economic sectors, under different ������������������������������������������������������������1 Principally, ILO Convention No. 138 (Minimum Age), ILO Convention No. 182 (Worst Forms) and UN Convention on the Rights of the Child. 2 Education Indicators: Technical Guidelines (UNESCO Institute of Statistics, undated) was the main technical resource for this section.
�2�
MEASURING THE EDUCATIONAL IMPACT OF CHILD LABOUR: INDICATORS AVAILABLE FROM COMMON HOUSEHOLD SURVEY INSTRUMENTS
work modalities, in different seasons or for different amounts of time each day. This is important in light of the possibility that it is not work per se that interferes with schooling, but the rather the specific nature of the work or the conditions and time intensity with which it is performed. Data requirements for the expanded indicators list are taken up in section 3. �
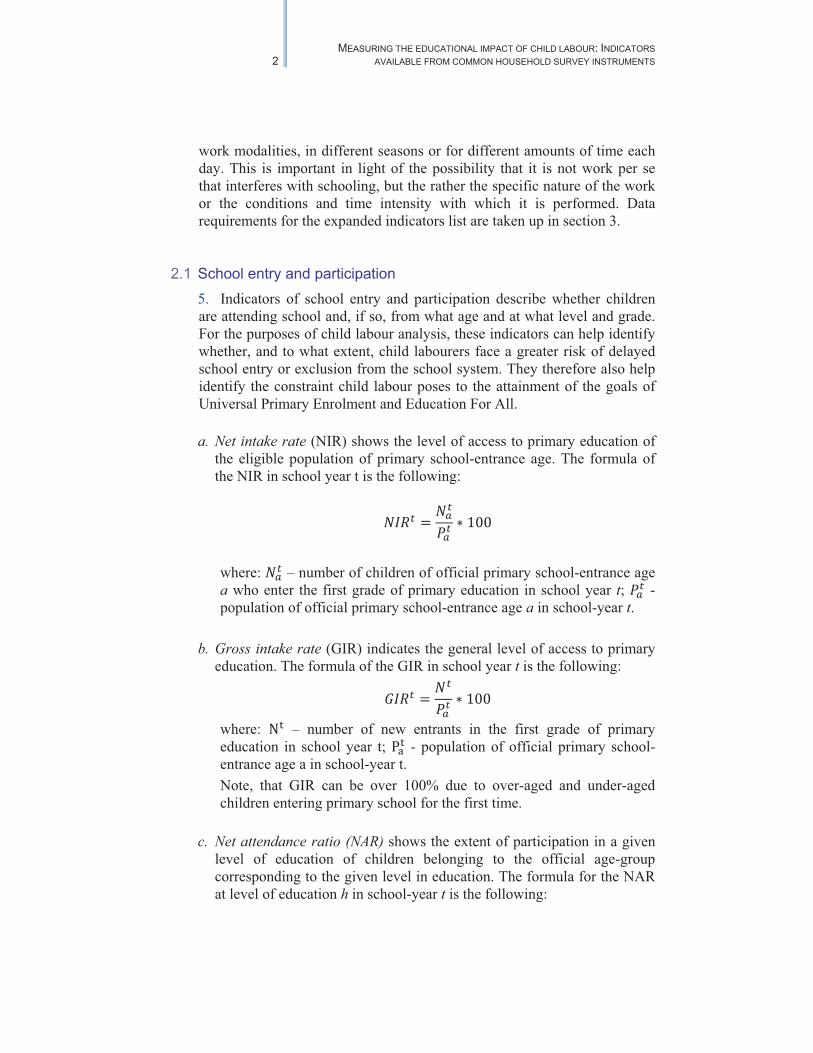
2.1 School entry and participation 5. Indicators of school entry and participation describe whether children are attending school and, if so, from what age and at what level and grade. For the purposes of child labour analysis, these indicators can help identify whether, and to what extent, child labourers face a greater risk of delayed school entry or exclusion from the school system. They therefore also help identify the constraint child labour poses to the attainment of the goals of Universal Primary Enrolment and Education For All. �a. Net intake rate (NIR) shows the level of access to primary education of
the eligible population of primary school-entrance age. The formula of the NIR in school year t is the following:
���� � ���
�� ���
where: ��� – number of children of official primary school-entrance age a who enter the first grade of primary education in school year t; �� - population of official primary school-entrance age a in school-year t.
b. Gross intake rate (GIR) indicates the general level of access to primary education. The formula of the GIR in school year t is the following:
��� � ��
�� ���where: �� – number of new entrants in the first grade of primary education in school year t; ��� - population of official primary school-entrance age a in school-year t. Note, that GIR can be over 100% due to over-aged and under-aged children entering primary school for the first time.
c. Net attendance ratio (NAR) shows the extent of participation in a given level of education of children belonging to the official age-group corresponding to the given level in education. The formula for the NAR at level of education h in school-year t is the following:

� 3� UCW WORKING PAPER SERIES, APRIL 2008
����� � �����
���� ���where: �h��� - attendance of the population of age-group a at level of education h in school year t; �h��� - population in age group a which officially corresponds to level of education h in school-year t.
d. Gross attendance ratio (GAR) shows the general level of participation in a given level of education. The formula for the GAR at level of education h in school year t is the following:
���� � ���
���� ���
where: �h� – attendance at the level of education h in school year t; �h��� -
population in age group a which officially corresponds to level of education h in school-year t. Note, that GAR can be over 100% due to the inclusion of over-aged and under-aged pupils because of early or late entrants, and grade repetition.
e. Age specific attendance ratio (ASAR) shows the extent of the participation of a specific age cohort in educational activities. The formula of the ASAR of the population of age a in school year t is the following:
������ � ���
�� ���
where: ��� - attendance of the population of age a in school year t; ��� - population of age a in school-year t.
f. School attendance parity index (PI) shows to which extent economic active children are disadvantaged in terms of their ability to go to school. The formula for the index at an age a in year t is the following:
��� � ������ ����� ������ ������ �!�!����� ������
where �"�#�� �$%&� '%()*$ +�,&,�$%&� '%()*$ is the age specific attendance ratio of economic active/non economic active children.
g. School life expectancy (SLE) provides a measure of the total number of years of education that a child can expect to achieve in the future.

�4�
MEASURING THE EDUCATIONAL IMPACT OF CHILD LABOUR: INDICATORS AVAILABLE FROM COMMON HOUSEHOLD SURVEY INSTRUMENTS
Relatively higher school life expectancy indicates greater probability of spending more years in education, but expected number of years does not necessarily coincide with the expected number of grades of education completed, because of grade repetition. The formula of the SLE at an age a in year t is the following:
"-.�� � /�0�
�0�012
01�
where: ��� - attendance of the population of age i (i=a, a+1,…,n) in school year t; n – the theoretical upper age-limit of schooling; �0� - population of age i in school-year t.
h. Out-of-school children is a measure of education exclusion. It is calculated as the proportion of children of official schooling age who are not enrolled in school.
�
2.2 School progression 6. Indicators of school progression describe the ability of children to proceed in a timely fashion through the school system. For the purposes of child labour analysis, these indicators can help identify whether, and to what extent, child labourers are disadvantaged in terms of being able to perform in the classroom and remain in the school system. �
a. Transition rate (TR) conveys information on the degree of access or transition from one cycle or level of education to a higher one. The formula of the TR from cycle or level of education h to h+1 in school year t is following:
3����45� � ��45�5�45 6 ��45�5�45
���7� ���
where �h45�5�45 – number of pupils attending first grade at level of education h+1 in school year t+1; #h45�5�45 – number of pupils repeating the first grade at level of education h+1 in school year t+1; �h�2� – number of pupils attending final grade n at level of education h in school year t.
� 5� UCW WORKING PAPER SERIES, APRIL 2008
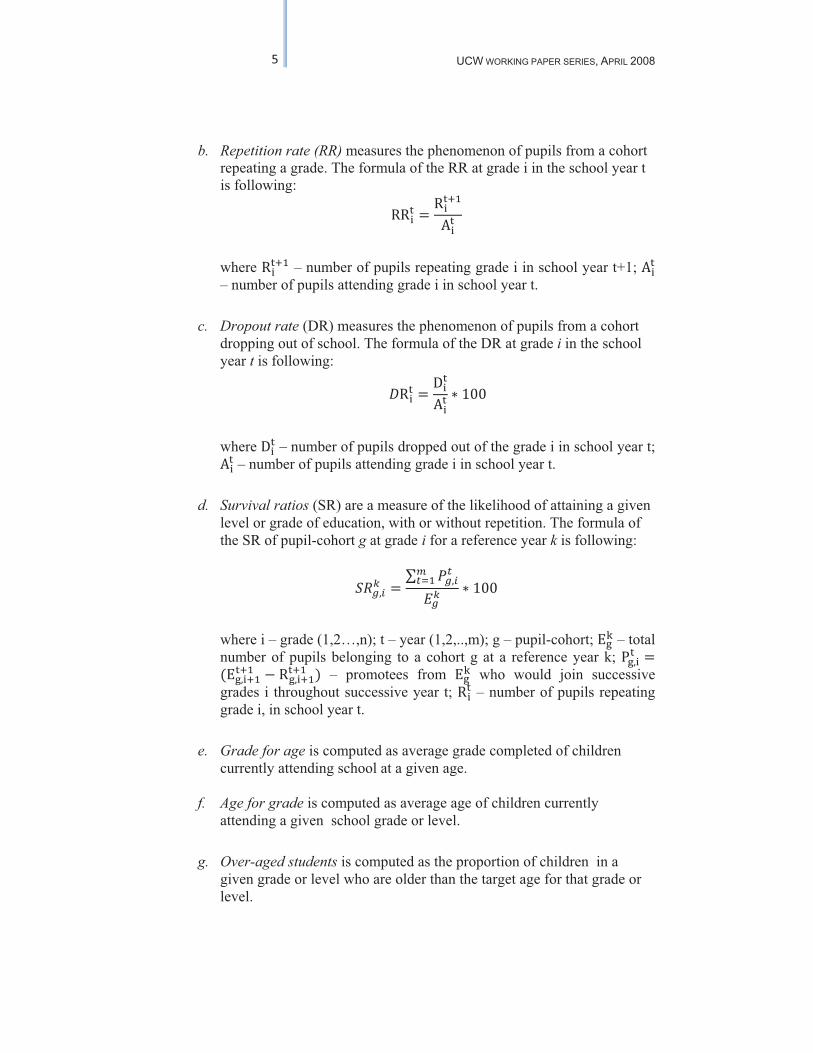
b. Repetition rate (RR) measures the phenomenon of pupils from a cohort repeating a grade. The formula of the RR at grade i in the school year t is following:
##0� � #0�45
�0�
where #0�45 – number of pupils repeating grade i in school year t+1; �0�– number of pupils attending grade i in school year t.
c. Dropout rate (DR) measures the phenomenon of pupils from a cohort dropping out of school. The formula of the DR at grade i in the school year t is following:
8#0� � 90�
�0� ���
where 90� – number of pupils dropped out of the grade i in school year t; �0� – number of pupils attending grade i in school year t.
d. Survival ratios (SR) are a measure of the likelihood of attaining a given level or grade of education, with or without repetition. The formula of the SR of pupil-cohort g at grade i for a reference year k is following:
��:�;< � = :�;�>�15?:<
���
where i – grade (1,2…,n); t – year (1,2,..,m); g – pupil-cohort; .@A – total number of pupils belonging to a cohort g at a reference year k; �@�0� ��.@�045�45 6 #@�045�45 – promotees from .@A who would join successive grades i throughout successive year t; #0� – number of pupils repeating grade i, in school year t.
e. Grade for age is computed as average grade completed of children currently attending school at a given age.
f. Age for grade is computed as average age of children currently attending a given school grade or level.
g. Over-aged students is computed as the proportion of children in a given grade or level who are older than the target age for that grade or level.

�6�
MEASURING THE EDUCATIONAL IMPACT OF CHILD LABOUR: INDICATORS AVAILABLE FROM COMMON HOUSEHOLD SURVEY INSTRUMENTS
3. DATA REQUIREMENTS AND AVAILABILITY 7. Data requirements for each of the core indicators discussed above are provided in Table 1. As shown, the data requirements for indicators relating to school entry and participation are less stringent, in that information for only one school year is necessary. The required cross-sectional information on school attendance by grade and age can be derived readily from the education module contained in most standard household survey instruments used for child labour analysis (e.g., UNICEF MICS surveys, IPEC SIMPOC surveys, World Bank LSMS surveys and national labour force surveys). It is worth noting that these surveys instruments typically collect information on current school attendance, a narrower but more useful concept than school enrolment. Unlike most published education statistics, therefore, the school participation indicators are framed in terms of “attendance” rather than “enrolment”. 8. Data for indicators relating to grade for age (or the converse) are also readily available from most standard education modules used in child labour survey instruments. Data requirements for other indicators of school survival and progression, however, are more stringent, in that they require information on schooling status for two consecutive school years. This in turn requires either two-year panel data or retrospective questions relating to school attendance (for the calculation of dropout-out rates) and relating to grade level (for the calculation of transition and repetition rates). The survival ratio requires panel data for several years (true cohort method) or data on drop-out and repetition (reconstructed cohort method). With the important exception of the MICS survey instrument, the standard survey instruments used for child labour analysis typically do not meet the data requirements of these school survival and progression indicators.

� 7� UCW WORKING PAPER SERIES, APRIL 2008
Table 1. Data requirements for core list of education indicators
Category Indicator Data required Minimumreference period
School entry and participation
Net (gross) intake rate
New entrants in first grade of primary education by single years of age; population of official primary school age
One school year
Net (gross) attendance ratio
Attendance by single years of age for a given level of education; population of the age group corresponding to the given level of education
One school year
Age specific attendance ratio
Attendance by single years of age; population of the corresponding age
One school year
Child labour disadvantage index
Children’s work status; attendance by single years of age; population of the corresponding age
One school year
School life expectancy
Attendance by age at all levels of education; population of official school age for all levels of education for single years of age; (or age-specific attendance ratios of all levels of education)
One school year
Out-of-school children
Attendance by single years of age; population of the corresponding age
One school year
School survival and progression
Transition rate Attendance in the final grade of a given cycle or level of education for school year t and new entrants to the first grade of the higher cycle of level of education for school year t+1
Two consecutive school years
Repetition rate Attendance by grade for school year t and number of repeaters from the same cohort by grade for year t+1
Two consecutive school years�
Dropout rate Attendance by single years of age for years t and t+1 Two consecutive school years�
Survival rate by grade
Attendance by grade for years t and t+1; number of repeaters by grade for year t+1
Two consecutive school years�
Grade for age Attendance by single years of age for a given level of education One school year�Age for grade Attendance by single years of age for a given level of education One school year�Over-agedstudents
Attendance by single years of age for a given level of education One school year�
Source: UCW and UNESCO, Education Indicators: Technical Guidelines UNESCO Institute for Statistics�
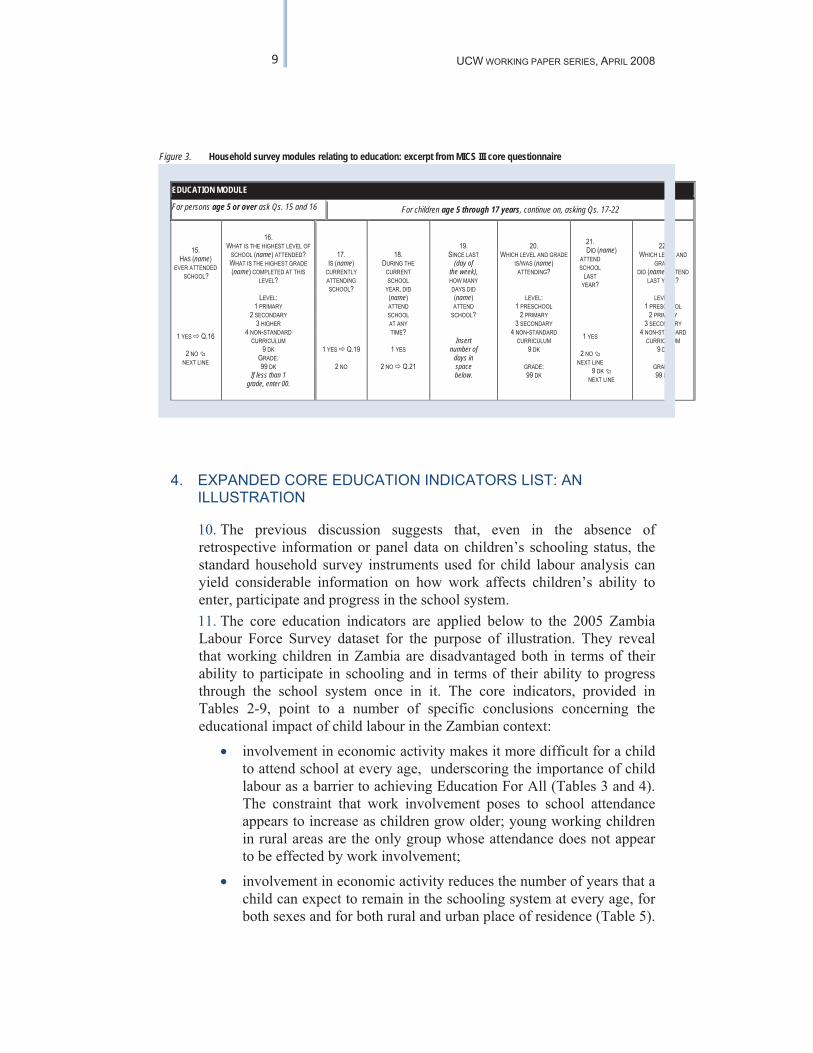
9. Excerpts of education modules from common survey instruments are provided in Figures 1-3 below for the purpose of illustration. The first example, from a Zambia Labour Force Survey, covers current attendance and grade but collects no retrospective information on attendance and grade in the previous year. Similarly, the second example, from the SIMPOC model questionnaire, covers current attendance (level and grade) and retrospective information on ever-attendance and education attainment, but does not cover school attendance in the previous school year. The third example, from the MICS 3 core survey questionnaire, is the only one containing questions on current school status as well as on a child’s school attendance, level and grade “last” year.� �

�8�
MEASURING THE EDUCATIONAL IMPACT OF CHILD LABOUR: INDICATORS AVAILABLE FROM COMMON HOUSEHOLD SURVEY INSTRUMENTS
Figure 1. Household survey modules relating to education: excerpt from the Zambia Labour Force Survey, 2005
Section II EDUCATION AND SCHOOL ATTENDANCE OF ALL PERSONS AGED 5 AND ABOVE
�
Has�(Name)�ever�attended�school?�
�
Yes��
No>Q6�
�
�
�
What�was�the�highest�grade/level�(Name)�completed�at�this�level?�
�
ENTER�GRADE/HIGHEST�LEVEL�COMPLETED�
IS�(NAME)�CURRENTLY�ATTENDING�SCHOOL?�
�
Yes�
No>>Q6�
What�grade/level�is�(Name)�currently�attending?�
�
ENTER�GRADE/�LEVEL�CURRENTLY�ATTENDING�
Q2� Q3 Q4 Q5�
Figure 2. Household survey modules relating to education: excerpt from SIMPOC model questionnaire
�
� 9� UCW WORKING PAPER SERIES, APRIL 2008
Figure 3. Household survey modules relating to education: excerpt from MICS III core questionnaire
EDUCATION MODULE
For persons age 5 or over ask Qs. 15 and 16 For children age 5 through 17 years, continue on, asking Qs. 17-22
15. HAS (name)
EVER ATTENDED SCHOOL?
1 YES � Q.16
2 NO �NEXT LINE
16. WHAT IS THE HIGHEST LEVEL OF
SCHOOL (name) ATTENDED?WHAT IS THE HIGHEST GRADE (name) COMPLETED AT THIS
LEVEL?
LEVEL:1 PRIMARY
2 SECONDARY3 HIGHER
4 NON-STANDARDCURRICULUM
9 DKGRADE:99 DK
If less than 1 grade, enter 00.
17. IS (name)
CURRENTLYATTENDINGSCHOOL?
1 YES � Q.19
2 NO
18. DURING THE
CURRENTSCHOOL
YEAR, DID(name)ATTENDSCHOOLAT ANYTIME?
1 YES
2 NO � Q.21
19. SINCE LAST
(day of the week), HOW MANYDAYS DID(name)ATTEND
SCHOOL?
Insert number of
days in space below.
20. WHICH LEVEL AND GRADE
IS/WAS (name)ATTENDING?
LEVEL:1 PRESCHOOL
2 PRIMARY3 SECONDARY
4 NON-STANDARDCURRICULUM
9 DK
GRADE:99 DK
21. DID (name)
ATTENDSCHOOL
LASTYEAR?
1 YES
2 NO �NEXT LINE
9 DK �NEXT LINE
22. WHICH LEVEL AND
GRADEDID (name) ATTEND
LAST YEAR?
LEVEL:1 PRESCHOOL
2 PRIMARY3 SECONDARY
4 NON-STANDARDCURRICULUM
9 DK
GRADE:99 DK
4. EXPANDED CORE EDUCATION INDICATORS LIST: AN ILLUSTRATION�
10. The previous discussion suggests that, even in the absence of retrospective information or panel data on children’s schooling status, the standard household survey instruments used for child labour analysis can yield considerable information on how work affects children’s ability to enter, participate and progress in the school system.11. The core education indicators are applied below to the 2005 Zambia Labour Force Survey dataset for the purpose of illustration. They reveal that working children in Zambia are disadvantaged both in terms of their ability to participate in schooling and in terms of their ability to progress through the school system once in it. The core indicators, provided in Tables 2-9, point to a number of specific conclusions concerning the educational impact of child labour in the Zambian context:
� involvement in economic activity makes it more difficult for a child to attend school at every age, underscoring the importance of child labour as a barrier to achieving Education For All (Tables 3 and 4). The constraint that work involvement poses to school attendance appears to increase as children grow older; young working children in rural areas are the only group whose attendance does not appear to be effected by work involvement;
� involvement in economic activity reduces the number of years that a child can expect to remain in the schooling system at every age, for both sexes and for both rural and urban place of residence (Table 5).

�10�
MEASURING THE EDUCATIONAL IMPACT OF CHILD LABOUR: INDICATORS AVAILABLE FROM COMMON HOUSEHOLD SURVEY INSTRUMENTS
This suggests that work is an important factor behind early school drop-out and consequently reduced levels of education attainment;
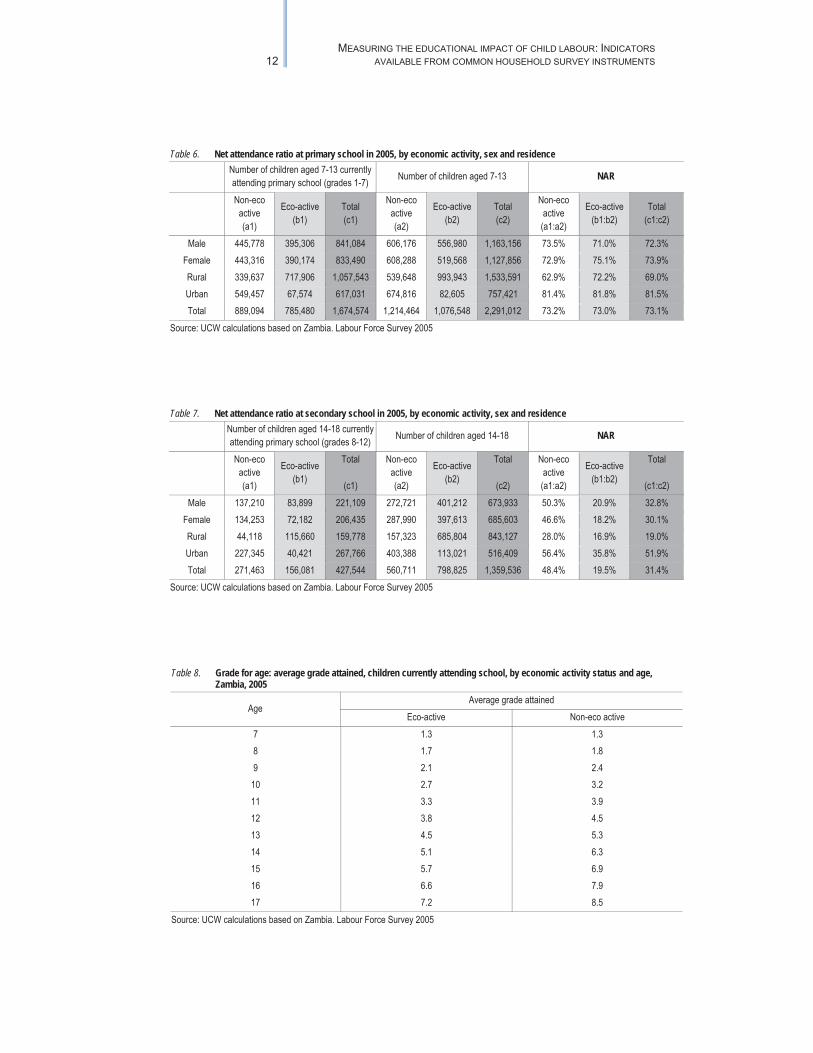
� involvement in economic activity slows grade progression, pointing to the difficulty that working children face in keeping up in the classroom with children that are not burdened with work responsibilities. By the age of 13 years, working children lag almost full grade behind their non-working counterparts, with the gap in progression widening thereafter (Table 8). Looked at another way, working children in grades 1-7 are 1.5 years older on average than non-working children in the same grade range (Table 9). Working students are almost twice as likely as non-working students to be overaged in the primary cycle (Table 10). Working students are also much more likely to be overaged at the secondary level (Table 11).
Table 2. Net intake rates, by economic activity, sex and residence, Zambia 2005
Number of children aged 7 currently attending the first grade of primary
school Number of children aged 7 NIR
Non-ecoactive (a1)
Eco-active (b1)
Total
(c1)
Non-ecoactive (a2)
Eco-active (b2)
Total
(c2)
Non-ecoactive (a1:a2)
Eco-active (b1:b2)
Total
(c1:c2) Male 21,816 13,769 35,585 108,610 65,761 174,371 20.1% 20.9% 20.4%
Female 25,985 11,633 37,618 112,480 53,381 165,861 23.1% 21.8% 22.7%Rural 23,532 23,738 47,270 124,166 112,719 236,885 19.0% 21.1% 20.0%Urban 24,269 1,664 25,933 96,924 6,423 103,347 25.0% 25.9% 25.1%Total 47,801 25,402 73,203 221,090 119,142 340,232 21.6% 21.3% 21.5%
Source: UCW calculations based on Zambia. Labour Force Survey 2005
�
Table 3. Age specific attendance ratios, by economic activity status, sex and residence, Zambia, 2005 age Economic active Non economic active
Male Female Urban Rural Total Male Female Urban Rural Total7 40% 41% 58% 39% 40% 48% 48% 65% 34% 48%8 57% 65% 70% 60% 61% 67% 67% 82% 53% 67%9 74% 78% 89% 75% 76% 80% 81% 90% 69% 81%
10 79% 82% 92% 79% 80% 85% 84% 89% 78% 84%11 79% 88% 80% 84% 84% 92% 90% 93% 88% 91%12 83% 86% 98% 83% 85% 87% 89% 90% 84% 88%13 80% 77% 80% 79% 79% 88% 87% 89% 87% 88%14 79% 73% 89% 75% 77% 93% 88% 90% 91% 91%15 78% 63% 67% 71% 71% 88% 87% 87% 88% 88%16 74% 51% 67% 62% 63% 82% 84% 84% 82% 83%17 61% 46% 40% 57% 54% 85% 73% 77% 86% 79%18 51% 28% 31% 40% 75% 50% 61% 62%
Source: UCW calculations based on Zambia. Labour Force Survey 2005

� 11� UCW WORKING PAPER SERIES, APRIL 2008
Table 4. School attendance parity index, by sex and residence, Zambia, 2005
age Attendance parity index (1=parity in attendance between economically active children and non-economically active
children)
Male Female Urban Rural Total 7 0.83 0.85 0.89 1.15 0.83 8 0.85 0.97 0.85 1.13 0.91 9 0.93 0.96 0.99 1.09 0.94 10 0.93 0.98 1.03 1.01 0.95 11 0.86 0.98 0.86 0.95 0.92 12 0.95 0.97 1.09 0.99 0.97 13 0.91 0.89 0.90 0.91 0.90 14 0.85 0.83 0.99 0.82 0.85 15 0.89 0.72 0.77 0.81 0.81 16 0.90 0.61 0.80 0.76 0.76 17 0.72 0.63 0.52 0.66 0.68 18 0.68 0.56 0.51 0.65
Source: UCW calculations based on Zambia. Labour Force Survey 2005
�
�
Table 5. School life expectancy, by economic activity status, sex and residence, Zambia, 2005
age Economic active Non economic active Total
Male Female Urban Rural Male Female Urban RuralAt age 7 8.35 7.78 8.61 8.04 9.7 9.28 9.97 9.02 8.69At age 8 7.95 7.37 8.03 7.65 9.22 8.8 9.32 8.68 8.24At age 9 7.38 6.72 7.33 7.05 8.55 8.13 8.5 8.15 7.6
At age 10 6.64 5.94 6.44 6.3 7.75 7.32 7.6 7.46 6.82At age 11 5.85 5.12 5.52 5.51 6.9 6.48 6.71 6.68 6At age 12 5.06 4.24 4.72 4.67 5.98 5.58 5.78 5.8 5.13At age 13 4.23 3.38 3.74 3.84 5.11 4.69 4.88 4.96 4.27At age 14 3.43 2.61 2.94 3.05 4.23 3.82 3.99 4.09 3.44At age 15 2.64 1.88 2.05 2.3 3.3 2.94 3.09 3.18 2.61At age 16 1.86 1.25 1.38 1.59 2.42 2.07 2.22 2.3 1.83At age 17 1.12 0.74 0.71 0.97 1.6 1.23 1.38 1.48 1.11Note: the theoretical upper age-limit of schooling=18Source: UCW calculations based on Zambia. Labour Force Survey 2005
�
�
�
�
�12�
MEASURING THE EDUCATIONAL IMPACT OF CHILD LABOUR: INDICATORS AVAILABLE FROM COMMON HOUSEHOLD SURVEY INSTRUMENTS
Table 6. Net attendance ratio at primary school in 2005, by economic activity, sex and residence
Number of children aged 7-13 currently attending primary school (grades 1-7) Number of children aged 7-13 NAR
Non-ecoactive (a1)
Eco-active (b1)
Total (c1)
Non-ecoactive (a2)
Eco-active (b2)
Total (c2)
Non-ecoactive (a1:a2)
Eco-active (b1:b2)
Total (c1:c2)
Male 445,778 395,306 841,084 606,176 556,980 1,163,156 73.5% 71.0% 72.3%Female 443,316 390,174 833,490 608,288 519,568 1,127,856 72.9% 75.1% 73.9%Rural 339,637 717,906 1,057,543 539,648 993,943 1,533,591 62.9% 72.2% 69.0%Urban 549,457 67,574 617,031 674,816 82,605 757,421 81.4% 81.8% 81.5%Total 889,094 785,480 1,674,574 1,214,464 1,076,548 2,291,012 73.2% 73.0% 73.1%
Source: UCW calculations based on Zambia. Labour Force Survey 2005
�
�
Table 7. Net attendance ratio at secondary school in 2005, by economic activity, sex and residence
Number of children aged 14-18 currently attending primary school (grades 8-12) Number of children aged 14-18 NAR
Non-ecoactive (a1)
Eco-active (b1)
Total
(c1)
Non-ecoactive (a2)
Eco-active (b2)
Total
(c2)
Non-ecoactive (a1:a2)
Eco-active (b1:b2)
Total
(c1:c2) Male 137,210 83,899 221,109 272,721 401,212 673,933 50.3% 20.9% 32.8%
Female 134,253 72,182 206,435 287,990 397,613 685,603 46.6% 18.2% 30.1%Rural 44,118 115,660 159,778 157,323 685,804 843,127 28.0% 16.9% 19.0%Urban 227,345 40,421 267,766 403,388 113,021 516,409 56.4% 35.8% 51.9%Total 271,463 156,081 427,544 560,711 798,825 1,359,536 48.4% 19.5% 31.4%
Source: UCW calculations based on Zambia. Labour Force Survey 2005
Table 8. Grade for age: average grade attained, children currently attending school, by economic activity status and age, Zambia, 2005
AgeAverage grade attained
Eco-active Non-eco active 7 1.3 1.3 8 1.7 1.8 9 2.1 2.4
10 2.7 3.2 11 3.3 3.9 12 3.8 4.5 13 4.5 5.3 14 5.1 6.3 15 5.7 6.9 16 6.6 7.9 17 7.2 8.5
Source: UCW calculations based on Zambia. Labour Force Survey 2005

� 13� UCW WORKING PAPER SERIES, APRIL 2008
Table 9. Age for grade: average age of pupils currently attending grades 1-7 and 8-12 , by economic activity status, sex and residence, Zambia 2005
Average age at primary school (grades 1-7)
Average age at secondary school (grades 8-12)
Non-eco active Eco-active Non-eco active Eco-activeMale 10.65 12.4 17.0 18.4
Female 10.66 11.8 16.8 17.9 Rural 10.8 12.2 17.3 18.2 Urban 10.6 11.9 16.8 18.5 Total 10.7 12.2 17.0 18.2
Source: UCW calculations based on Zambia. Labour Force Survey 2005
�
�
Table 10. Overaged students, primary school: proportion of children/youth in primary school who are older than the target age for that level
Non-eco active Eco-active
number of 14-24 year-olds in
primary school (a)
number of 7-24 year-olds in
primary school (b)
Proportion
overage
(a)/(b)
number of 14-24 year-olds in
primary school (a)
number of 7-24 year-olds in
primary school (b)
Proportion
overage
(a)/(b)
Male 97,446 543,224 17.9% 215,425 610,731 35.3%
Female 90,890 534,206 17.0% 139,011 529,185 26.3%
Rural 92,208 431,845 21.4% 330,324 1,048,230 31.5%
Urban 96,128 645,585 14.9% 24,112 91,686 26.3%
Total 188,336 1,077,430 17.5% 354,436 1,139,916 31.1%
Source: UCW calculations based on Zambia. Labour Force Survey 2005
�
�
Table 11. Overaged students, secondary school: proportion of children/youth in secondary school who are older than the target age for that level
Non-eco active Eco-active
number of 19-24 year-olds in
secondary school (a)
number of 14-24 year-olds in
secondary school (b)
Proportion
overage
(a)/(b)
number of 19-24 year-olds in
secondary school(a)
number of 14-24 year-olds in
secondary school (b)
Proportion
overage
(a)/(b)
Male 46,286 183,496 25.2% 65,100 148,999 43.7%
Female 34,842 169,095 20.6% 25,551 97,733 26.1%
Rural 15,967 60,085 26.6% 73,572 189,232 38.9%
Urban 65,161 292,506 22.3% 17,079 57,500 29.7%
Total 81,128 352,591 23.0% 90,651 246,732 36.7%
Source: UCW calculations based on Zambia. Labour Force Survey 2005
�