MEASURING THE CREATIVE ECONOMY - … · MEASURING THE CREATIVE ECONOMY INTRODUCTION . Why Measure...
20
1 MEASURING THE CREATIVE ECONOMY INTRODUCTION Why Measure the Creative Economy? The creative economy is often thought of as “the arts,” which is itself often identified with a particular set of institutions (galleries, museums, symphony orchestras, theaters, art, and music). Although “the arts” is a core component of the creative economy, it is still just one component. The creative economy includes all the creative workers who develop or contribute to the development of creative products, services, and performances. It also includes all the businesses, non-profits, and individuals whose jobs are part of the value chain for creative content. This study focuses primarily on direct jobs, rather than economic impact. This type of economic analysis is, in principle, the same type of analysis that is regularly performed as part of studies of industry clusters like information technology, manufacturing, energy, or biotechnology. The goal is to help readers understand the true scale and shape of the Capital Region’s creative economy—and also to try to see where it is heading. Trying to quantify a region’s creative economy is not as simple as trying to quantify a region’s manufacturing base or its healthcare sector, because the lines are not as neatly defined. Often, the importance of the creative economy is overlooked because people do not see the full breadth of economic activity surrounding creative production, including different forms of employment, different types of workers, and different industries. To deal with some of the special challenges that the creative economy poses for data gathering and analysis, this report uses data from Economic Modeling Specialists, Inc. (EMSI). 1 The Importance of Self-employment EMSI’s data sets, which researchers and practitioners in the economic development field widely use, combine several publicly available data sources with its own proprietary data to produce a much more complete picture of employment than would otherwise be available. This is particularly valuable for work on the creative economy because it incorporates data on self-employment and data on employment by both occupation and industry. One important feature of the analysis in this section that differentiates it from most traditional studies is the inclusion of self- employment in the jobs figures. Self- employment is common in many parts of the economy, but it is particularly important in the creative economy. Nationally, about 47 percent of the jobs in the creative industries are actually income streams from self- employment. In the Capital Region, this share is even higher at 53 percent. Most labor market studies are based on data from the 1 The statistics and figures in this analysis all derive from EMSI’s fourth quarter 2013 data release, except for a few small cases for creative occupations. (See Methodology for a discussion of instances in which other sources were used.) Except where class-of-worker is specified, employment and earnings figures include wage and salary jobs (including QCEW and non-QCEW) as well as self-employment (including primary jobs and jobs providing supplemental income).
Transcript of MEASURING THE CREATIVE ECONOMY - … · MEASURING THE CREATIVE ECONOMY INTRODUCTION . Why Measure...
1
MEASURING THE CREATIVE ECONOMY
INTRODUCTION
Why Measure the Creative Economy?
The creative economy is often thought of as “the arts,” which is itself often identified with a particular set of institutions (galleries, museums, symphony orchestras, theaters, art, and music). Although “the arts” is a core component of the creative economy, it is still just one component. The creative economy includes all the creative workers who develop or contribute to the development of creative products, services, and performances. It also includes all the businesses, non-profits, and individuals whose jobs are part of the value chain for creative content.
This study focuses primarily on direct jobs, rather than economic impact. This type of economic analysis is, in principle, the same type of analysis that is regularly performed as part of studies of industry clusters like information technology, manufacturing, energy, or biotechnology. The goal is to help readers understand the true scale and shape of the Capital Region’s creative economy—and also to try to see where it is heading.
Trying to quantify a region’s creative economy is not as simple as trying to quantify a region’s manufacturing base or its healthcare sector, because the lines are not as neatly defined. Often, the importance of the creative economy is overlooked because people do not see the full breadth of economic activity surrounding creative production, including different forms of employment, different types of workers, and different industries.
To deal with some of the special challenges that the creative economy poses for data gathering and analysis, this report uses data from Economic Modeling Specialists, Inc. (EMSI).1
The Importance of Self-employment
EMSI’s data sets, which researchers and practitioners in the economic development field widely use, combine several publicly available data sources with its own proprietary data to produce a much more complete picture of employment than would otherwise be available. This is particularly valuable for work on the creative economy because it incorporates data on self-employment and data on employment by both occupation and industry.
One important feature of the analysis in this section that differentiates it from most traditional studies is the inclusion of self-employment in the jobs figures. Self-employment is common in many parts of the economy, but it is particularly important in the creative economy. Nationally, about 47 percent of the jobs in the creative industries are actually income streams from self-employment. In the Capital Region, this share is even higher at 53 percent. Most labor market studies are based on data from the
1 The statistics and figures in this analysis all derive
from EMSI’s fourth quarter 2013 data release, except for a few small cases for creative occupations. (See Methodology for a discussion of instances in which other sources were used.) Except where class-of-worker is specified, employment and earnings figures include wage and salary jobs (including QCEW and non-QCEW) as well as self-employment (including primary jobs and jobs providing supplemental income).
2
Bureau of Labor Statistics’ Quarterly Census of Employment and Wages (QCEW) and/or Occupational Employment Statistics (OES). These sources are based on unemployment insurance records and surveys of employers, neither of which cover self-employed workers. Studies using these sources sometimes present data that make the creative economy look much less significant than it really is.
While some creative workers rely on creative freelance work as their primary source of income, for others it is a supplemental source of income. Unlike data based on the Census’s American Community Survey, EMSI’s data includes both forms of self-employment. Including both types is critical for understanding the creative economy because so many artists and freelancers do their work in addition to a “day job”—in the Capital Region’s creative industries, approximately three-fourths of the self-employment jobs are secondary income sources, according to EMSI’s data.
Creative Industries and Creative Occupations
There are two different ways to categorize jobs based on the economic activity of which they are a part. They can be divided by industry based on the type(s) of goods or services offered by the enterprise that pays the worker (or the individual worker in the case of self-employment). For example, jobs at enterprises that primarily publish books are part of the book publishing industry. Jobs can also be sorted by occupation based on what kind of work the job actually involves. For example, people who design graphics are part of an occupation called “graphic designers,” whether they work for a graphic design enterprise or not. In theory, every job has both an industry and an occupation.
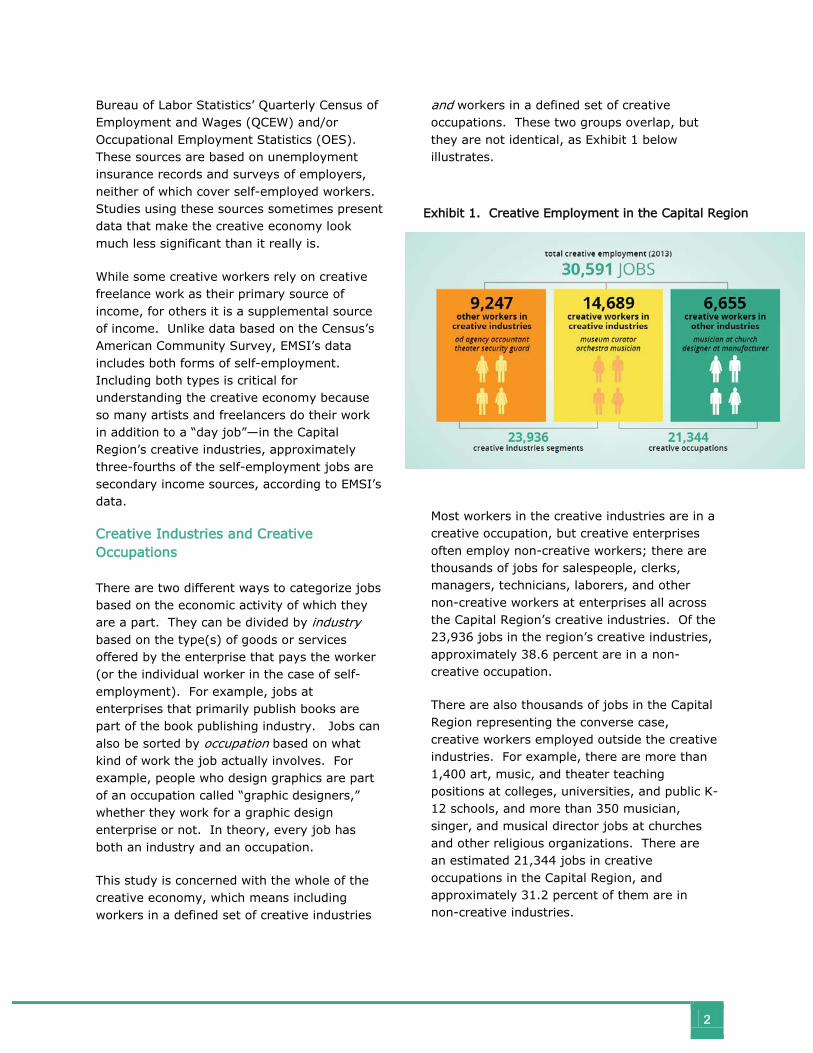
This study is concerned with the whole of the creative economy, which means including workers in a defined set of creative industries
and workers in a defined set of creative occupations. These two groups overlap, but they are not identical, as Exhibit 1 below illustrates.
Most workers in the creative industries are in a creative occupation, but creative enterprises often employ non-creative workers; there are thousands of jobs for salespeople, clerks, managers, technicians, laborers, and other non-creative workers at enterprises all across the Capital Region’s creative industries. Of the 23,936 jobs in the region’s creative industries, approximately 38.6 percent are in a non-creative occupation.
There are also thousands of jobs in the Capital Region representing the converse case, creative workers employed outside the creative industries. For example, there are more than 1,400 art, music, and theater teaching positions at colleges, universities, and public K-12 schools, and more than 350 musician, singer, and musical director jobs at churches and other religious organizations. There are an estimated 21,344 jobs in creative occupations in the Capital Region, and approximately 31.2 percent of them are in non-creative industries.
Exhibit 1. Creative Employment in the Capital Region
3
Putting these numbers together shows the Capital Region’s creative economy directly accounts for approximately 30,591 jobs in total—14,689 creative jobs in the region’s creative industries, 6,655 creative jobs in the region’s non-creative industries, and 9,247 non-creative jobs in creative industries.
The following section, Creative Industries, focuses on employment in the region’s creative industries. The section that follows, Creative Occupations, presents data on employment in the region’s creative occupations.
CREATIVE INDUSTRIES
Defining the Creative Industries
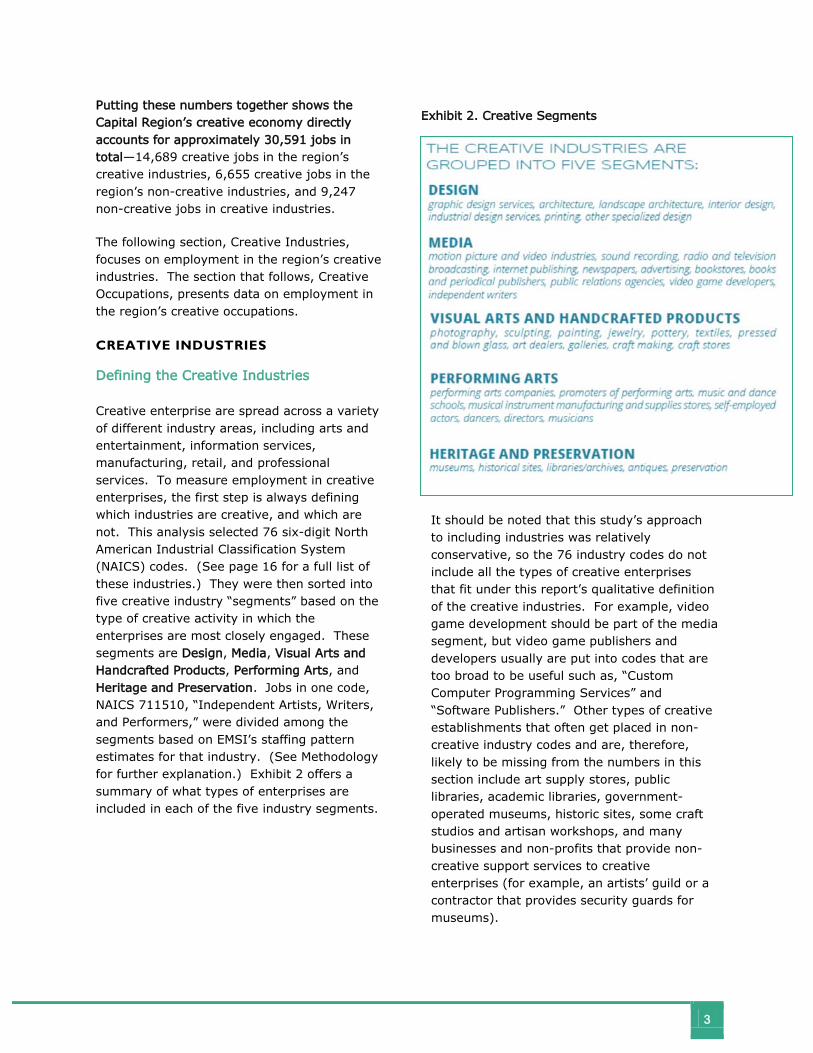
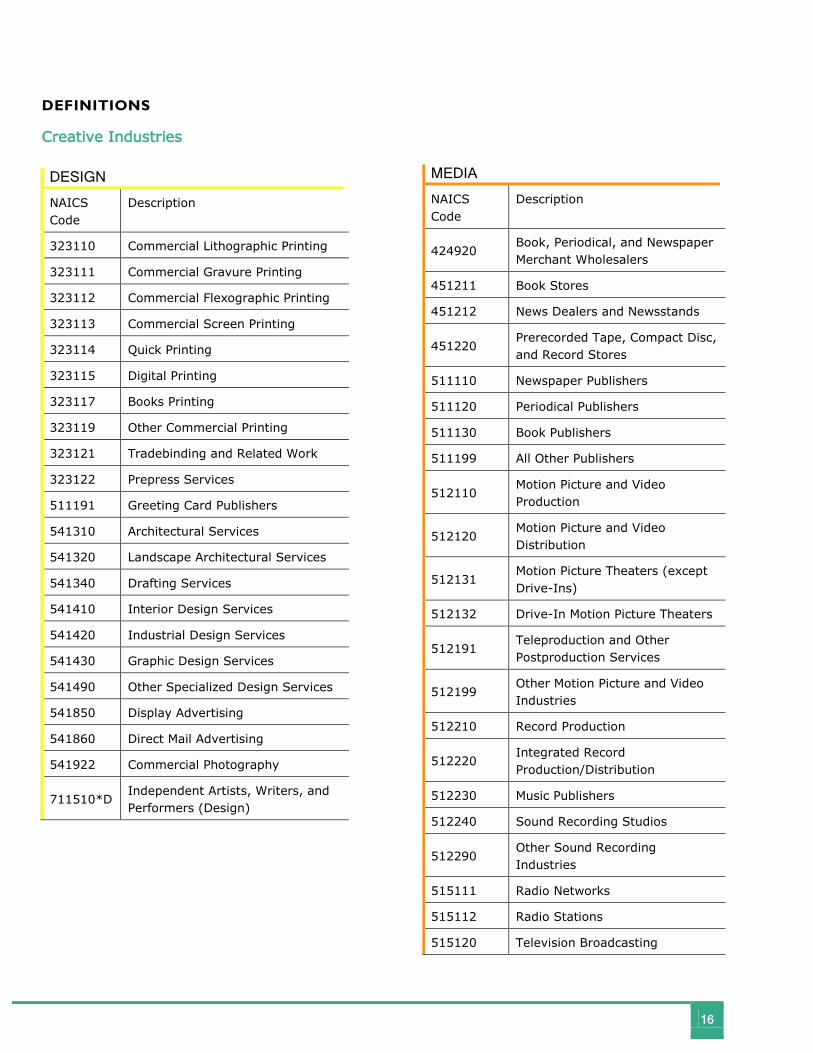
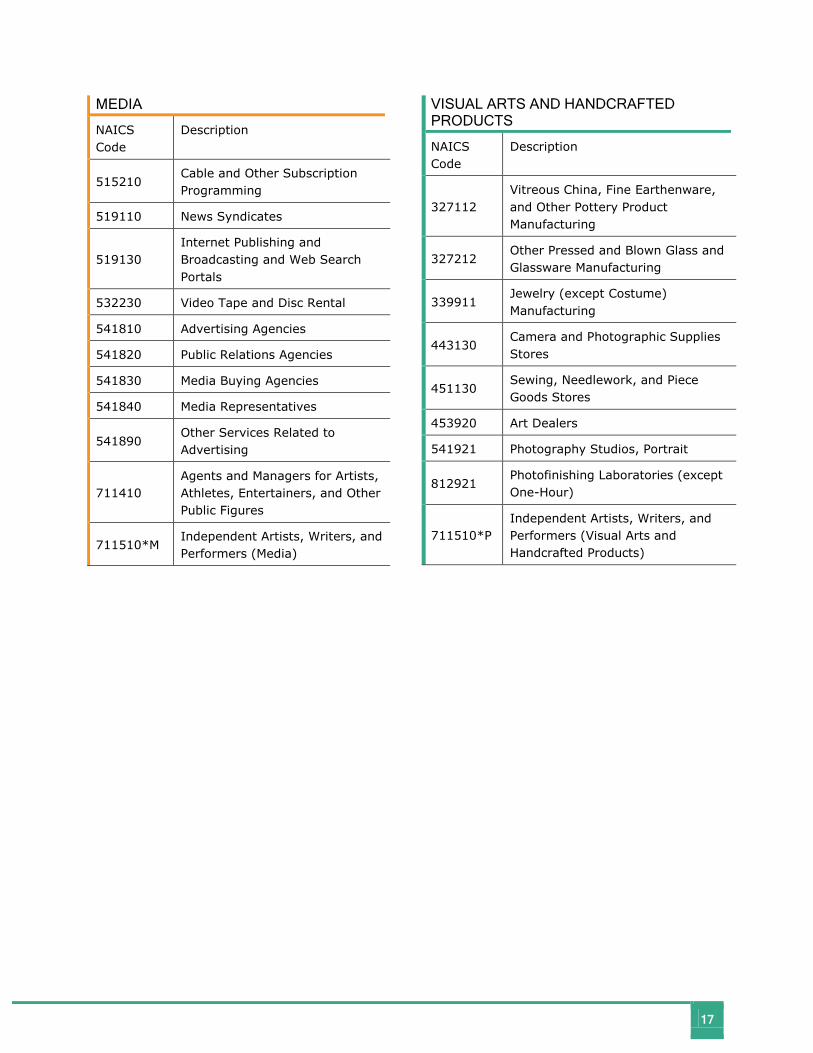
Creative enterprise are spread across a variety of different industry areas, including arts and entertainment, information services, manufacturing, retail, and professional services. To measure employment in creative enterprises, the first step is always defining which industries are creative, and which are not. This analysis selected 76 six-digit North American Industrial Classification System (NAICS) codes. (See page 16 for a full list of these industries.) They were then sorted into five creative industry “segments” based on the type of creative activity in which the enterprises are most closely engaged. These segments are Design, Media, Visual Arts and Handcrafted Products, Performing Arts, and Heritage and Preservation. Jobs in one code, NAICS 711510, “Independent Artists, Writers, and Performers,” were divided among the segments based on EMSI’s staffing pattern estimates for that industry. (See Methodology for further explanation.) Exhibit 2 offers a summary of what types of enterprises are included in each of the five industry segments.
It should be noted that this study’s approach to including industries was relatively conservative, so the 76 industry codes do not include all the types of creative enterprises that fit under this report’s qualitative definition of the creative industries. For example, video game development should be part of the media segment, but video game publishers and developers usually are put into codes that are too broad to be useful such as, “Custom Computer Programming Services” and “Software Publishers.” Other types of creative establishments that often get placed in non-creative industry codes and are, therefore, likely to be missing from the numbers in this section include art supply stores, public libraries, academic libraries, government-operated museums, historic sites, some craft studios and artisan workshops, and many businesses and non-profits that provide non-creative support services to creative enterprises (for example, an artists’ guild or a contractor that provides security guards for museums).
Exhibit 2. Creative Segments
4
Findings
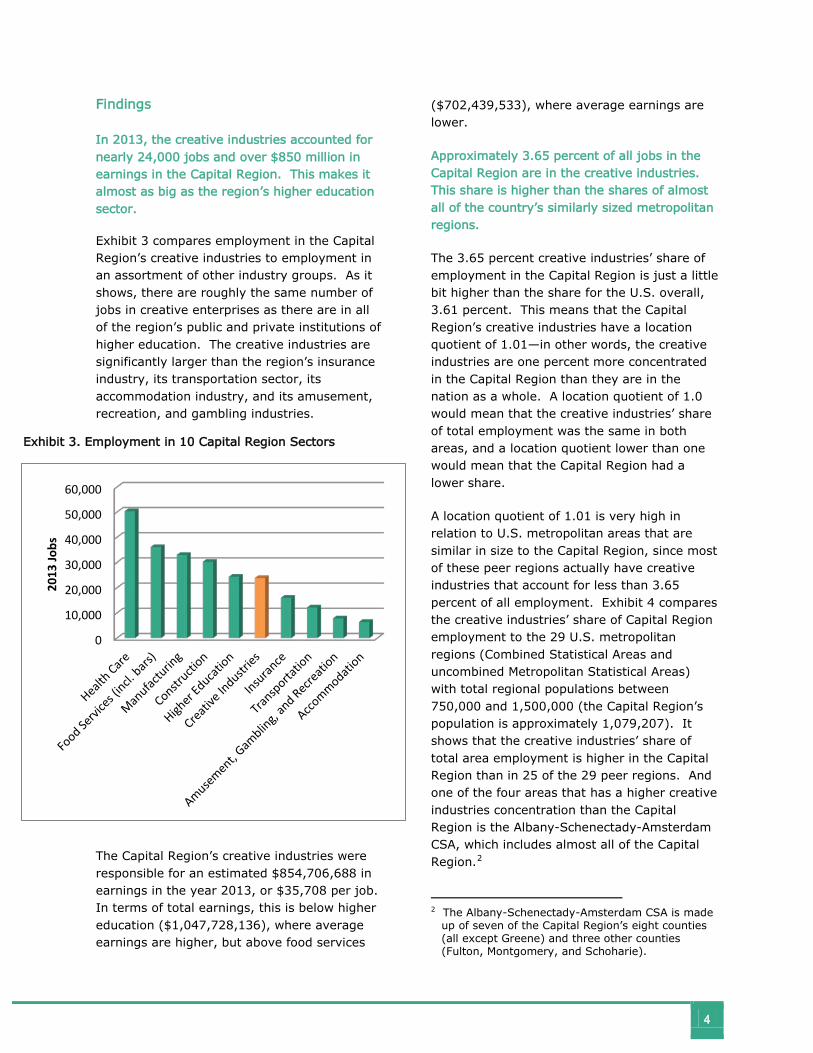
In 2013, the creative industries accounted for nearly 24,000 jobs and over $850 million in earnings in the Capital Region. This makes it almost as big as the region’s higher education sector.
Exhibit 3 compares employment in the Capital Region’s creative industries to employment in an assortment of other industry groups. As it shows, there are roughly the same number of jobs in creative enterprises as there are in all of the region’s public and private institutions of higher education. The creative industries are significantly larger than the region’s insurance industry, its transportation sector, its accommodation industry, and its amusement, recreation, and gambling industries.
The Capital Region’s creative industries were responsible for an estimated $854,706,688 in earnings in the year 2013, or $35,708 per job. In terms of total earnings, this is below higher education ($1,047,728,136), where average earnings are higher, but above food services
($702,439,533), where average earnings are lower.
Approximately 3.65 percent of all jobs in the Capital Region are in the creative industries. This share is higher than the shares of almost all of the country’s similarly sized metropolitan regions.
The 3.65 percent creative industries’ share of employment in the Capital Region is just a little bit higher than the share for the U.S. overall, 3.61 percent. This means that the Capital Region’s creative industries have a location quotient of 1.01—in other words, the creative industries are one percent more concentrated in the Capital Region than they are in the nation as a whole. A location quotient of 1.0 would mean that the creative industries’ share of total employment was the same in both areas, and a location quotient lower than one would mean that the Capital Region had a lower share.
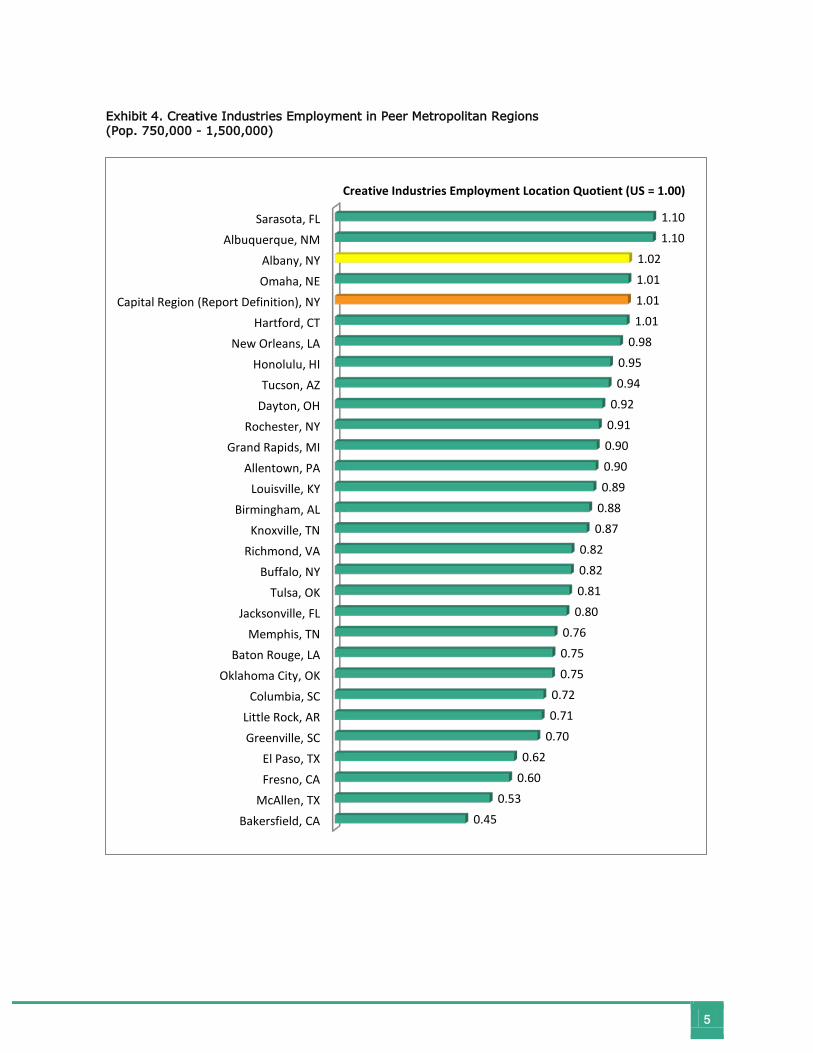
A location quotient of 1.01 is very high in relation to U.S. metropolitan areas that are similar in size to the Capital Region, since most of these peer regions actually have creative industries that account for less than 3.65 percent of all employment. Exhibit 4 compares the creative industries’ share of Capital Region employment to the 29 U.S. metropolitan regions (Combined Statistical Areas and uncombined Metropolitan Statistical Areas) with total regional populations between 750,000 and 1,500,000 (the Capital Region’s population is approximately 1,079,207). It shows that the creative industries’ share of total area employment is higher in the Capital Region than in 25 of the 29 peer regions. And one of the four areas that has a higher creative industries concentration than the Capital Region is the Albany-Schenectady-Amsterdam CSA, which includes almost all of the Capital Region.2
2 The Albany-Schenectady-Amsterdam CSA is made
up of seven of the Capital Region’s eight counties (all except Greene) and three other counties (Fulton, Montgomery, and Schoharie).
0
10,000
20,000
30,000
40,000
50,000
60,000
2013
Jobs
Exhibit 3. Employment in 10 Capital Region Sectors
5
Sarasota, FL Albuquerque, NM
Albany, NY Omaha, NE
Capital Region (Report Definition), NY Hartford, CT
New Orleans, LA Honolulu, HI
Tucson, AZ Dayton, OH
Rochester, NY Grand Rapids, MI
Allentown, PA Louisville, KY
Birmingham, AL Knoxville, TN
Richmond, VA Buffalo, NY
Tulsa, OK Jacksonville, FL
Memphis, TN Baton Rouge, LA
Oklahoma City, OK Columbia, SC
Little Rock, AR Greenville, SC
El Paso, TX Fresno, CA
McAllen, TX Bakersfield, CA
1.10 1.10
1.02 1.01 1.01 1.01
0.98 0.95 0.94
0.92 0.91 0.90 0.90 0.89
0.88 0.87
0.82 0.82 0.81 0.80
0.76 0.75 0.75
0.72 0.71
0.70 0.62
0.60 0.53
0.45
Creative Industries Employment Location Quotient (US = 1.00)
Exhibit 4. Creative Industries Employment in Peer Metropolitan Regions (Pop. 750,000 - 1,500,000)
6
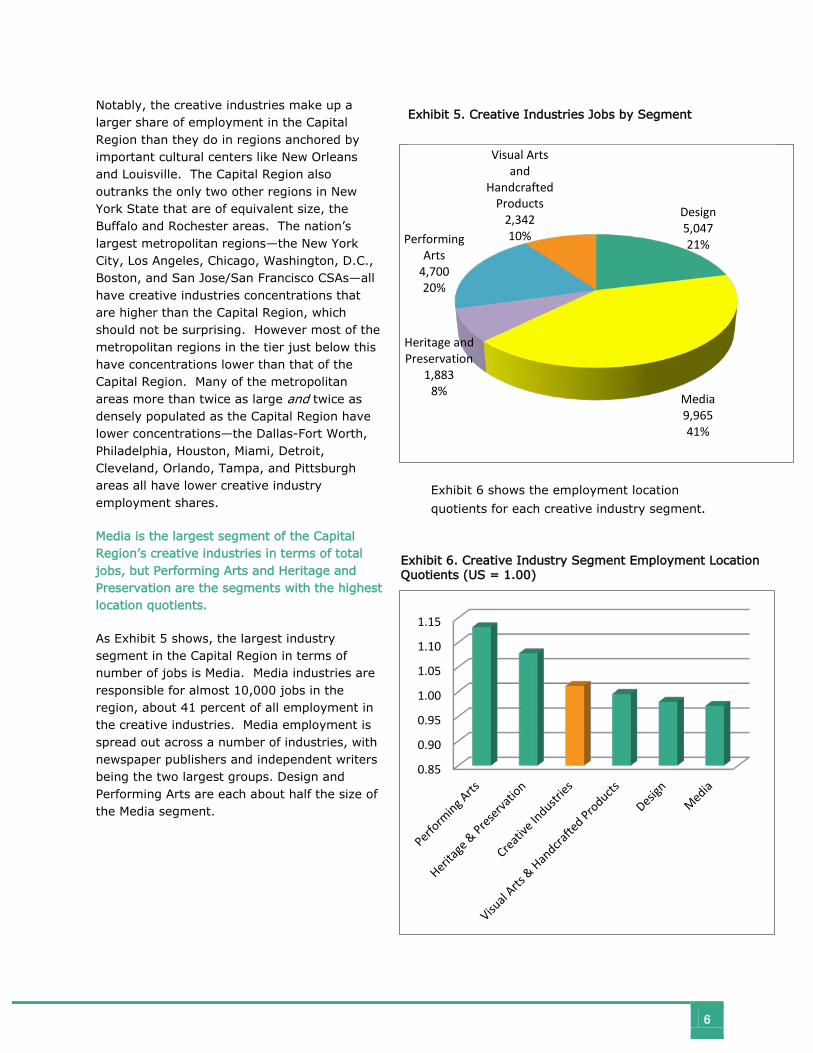
Design 5,047 21%
Media 9,965 41%
Heritage and Preservation
1,883 8%
Performing Arts
4,700 20%
Visual Arts and
Handcrafted Products
2,342 10%
Notably, the creative industries make up a larger share of employment in the Capital Region than they do in regions anchored by important cultural centers like New Orleans and Louisville. The Capital Region also outranks the only two other regions in New York State that are of equivalent size, the Buffalo and Rochester areas. The nation’s largest metropolitan regions—the New York City, Los Angeles, Chicago, Washington, D.C., Boston, and San Jose/San Francisco CSAs—all have creative industries concentrations that are higher than the Capital Region, which should not be surprising. However most of the metropolitan regions in the tier just below this have concentrations lower than that of the Capital Region. Many of the metropolitan areas more than twice as large and twice as densely populated as the Capital Region have lower concentrations—the Dallas-Fort Worth, Philadelphia, Houston, Miami, Detroit, Cleveland, Orlando, Tampa, and Pittsburgh areas all have lower creative industry employment shares.
Media is the largest segment of the Capital Region’s creative industries in terms of total jobs, but Performing Arts and Heritage and Preservation are the segments with the highest location quotients.
As Exhibit 5 shows, the largest industry segment in the Capital Region in terms of number of jobs is Media. Media industries are responsible for almost 10,000 jobs in the region, about 41 percent of all employment in the creative industries. Media employment is spread out across a number of industries, with newspaper publishers and independent writers being the two largest groups. Design and Performing Arts are each about half the size of the Media segment.
Exhibit 6 shows the employment location
quotients for each creative industry segment.
Exhibit 5. Creative Industries Jobs by Segment
Exhibit 6. Creative Industry Segment Employment Location Quotients (US = 1.00)
0.85
0.90
0.95
1.00
1.05
1.10
1.15
7
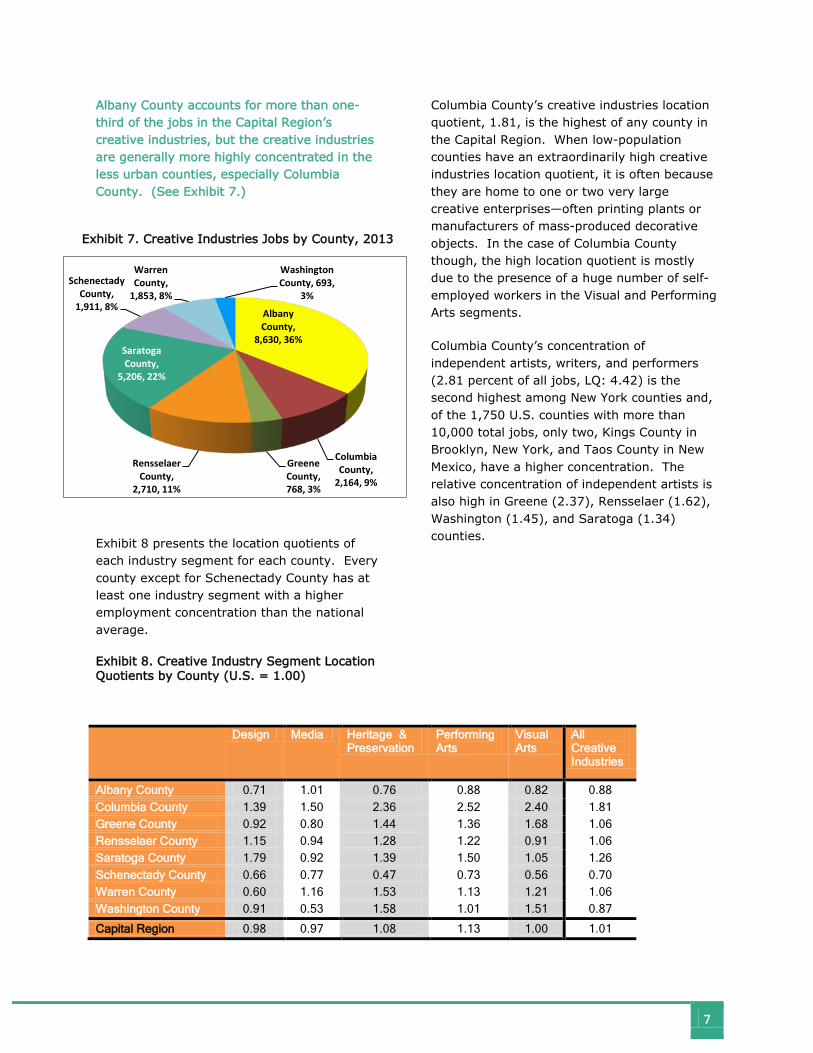
Albany County,
8,630, 36%
Columbia County,
2,164, 9%
Greene County, 768, 3%
Rensselaer County,
2,710, 11%
Saratoga County,
5,206, 22%
Schenectady County,
1,911, 8%
Warren County,
1,853, 8%
Washington County, 693,
3%
Albany County accounts for more than one-third of the jobs in the Capital Region’s creative industries, but the creative industries are generally more highly concentrated in the less urban counties, especially Columbia County. (See Exhibit 7.)
Exhibit 8 presents the location quotients of each industry segment for each county. Every county except for Schenectady County has at least one industry segment with a higher employment concentration than the national average.
Exhibit 8. Creative Industry Segment Location Quotients by County (U.S. = 1.00)
Columbia County’s creative industries location quotient, 1.81, is the highest of any county in the Capital Region. When low-population counties have an extraordinarily high creative industries location quotient, it is often because they are home to one or two very large creative enterprises—often printing plants or manufacturers of mass-produced decorative objects. In the case of Columbia County though, the high location quotient is mostly due to the presence of a huge number of self-employed workers in the Visual and Performing Arts segments.
Columbia County’s concentration of independent artists, writers, and performers (2.81 percent of all jobs, LQ: 4.42) is the second highest among New York counties and, of the 1,750 U.S. counties with more than 10,000 total jobs, only two, Kings County in Brooklyn, New York, and Taos County in New Mexico, have a higher concentration. The relative concentration of independent artists is also high in Greene (2.37), Rensselaer (1.62), Washington (1.45), and Saratoga (1.34) counties.
Design Media Heritage & Preservation
Performing Arts
Visual Arts
All Creative Industries
Albany County 0.71 1.01 0.76 0.88 0.82 0.88 Columbia County 1.39 1.50 2.36 2.52 2.40 1.81 Greene County 0.92 0.80 1.44 1.36 1.68 1.06 Rensselaer County 1.15 0.94 1.28 1.22 0.91 1.06 Saratoga County 1.79 0.92 1.39 1.50 1.05 1.26 Schenectady County 0.66 0.77 0.47 0.73 0.56 0.70 Warren County 0.60 1.16 1.53 1.13 1.21 1.06 Washington County 0.91 0.53 1.58 1.01 1.51 0.87
Capital Region 0.98 0.97 1.08 1.13 1.00 1.01
Exhibit 7. Creative Industries Jobs by County, 2013
8
-8.00%
-6.00%
-4.00%
-2.00%
0.00%
2.00%
4.00%
6.00%
Perc
ent C
hang
e in
Jobs
(200
4 =
Base
Yea
r)
Capital Region U.S.
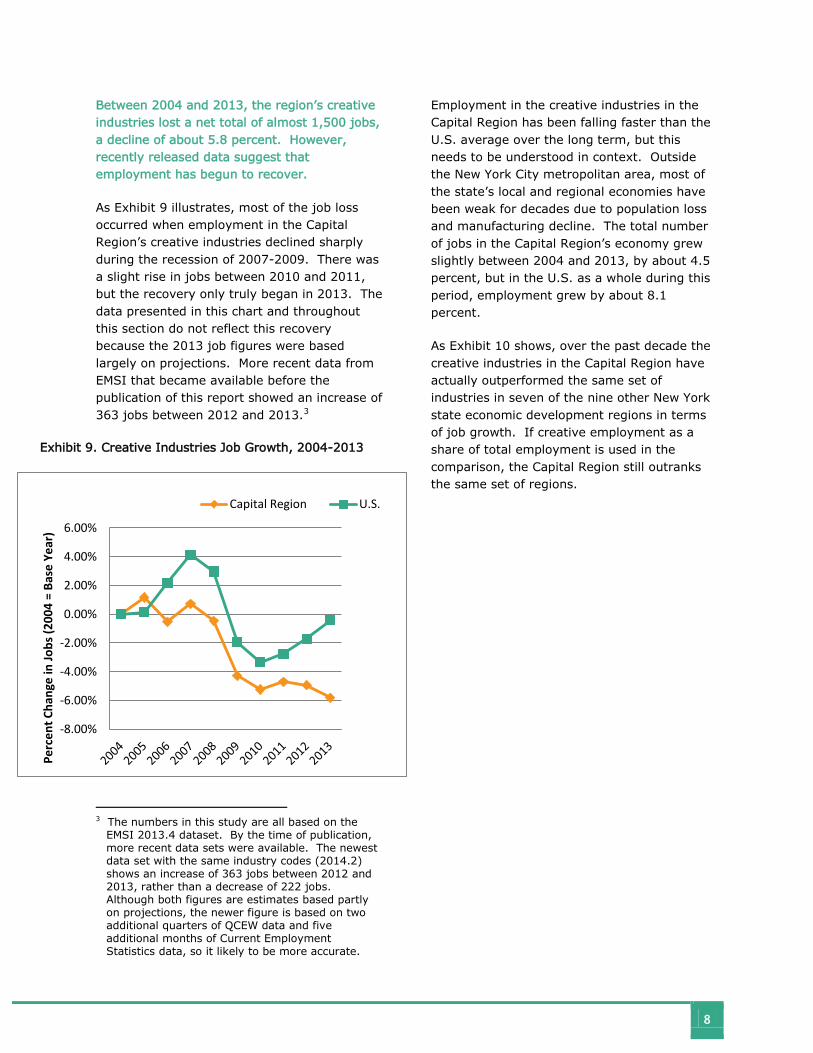
Between 2004 and 2013, the region’s creative industries lost a net total of almost 1,500 jobs, a decline of about 5.8 percent. However, recently released data suggest that employment has begun to recover.
As Exhibit 9 illustrates, most of the job loss occurred when employment in the Capital Region’s creative industries declined sharply during the recession of 2007-2009. There was a slight rise in jobs between 2010 and 2011, but the recovery only truly began in 2013. The data presented in this chart and throughout this section do not reflect this recovery because the 2013 job figures were based largely on projections. More recent data from EMSI that became available before the publication of this report showed an increase of 363 jobs between 2012 and 2013.3
3 The numbers in this study are all based on the
EMSI 2013.4 dataset. By the time of publication, more recent data sets were available. The newest data set with the same industry codes (2014.2) shows an increase of 363 jobs between 2012 and 2013, rather than a decrease of 222 jobs. Although both figures are estimates based partly on projections, the newer figure is based on two additional quarters of QCEW data and five additional months of Current Employment Statistics data, so it likely to be more accurate.
Employment in the creative industries in the Capital Region has been falling faster than the U.S. average over the long term, but this needs to be understood in context. Outside the New York City metropolitan area, most of the state’s local and regional economies have been weak for decades due to population loss and manufacturing decline. The total number of jobs in the Capital Region’s economy grew slightly between 2004 and 2013, by about 4.5 percent, but in the U.S. as a whole during this period, employment grew by about 8.1 percent.
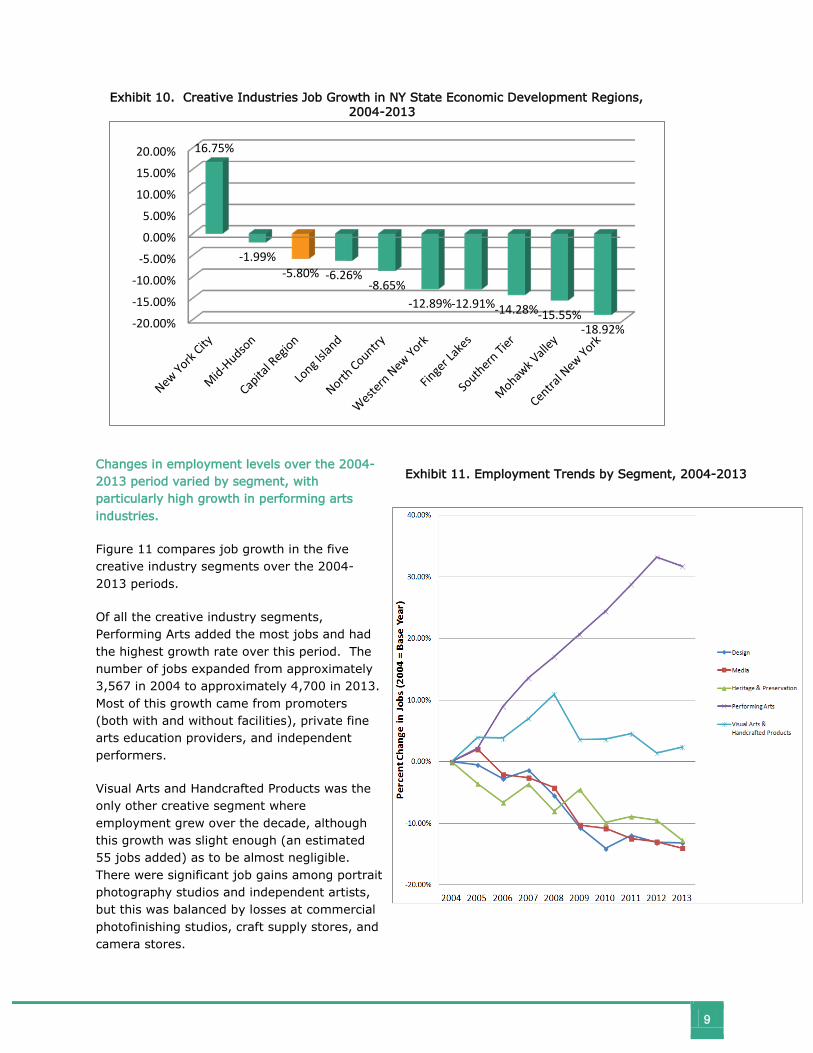
As Exhibit 10 shows, over the past decade the creative industries in the Capital Region have actually outperformed the same set of industries in seven of the nine other New York state economic development regions in terms of job growth. If creative employment as a share of total employment is used in the comparison, the Capital Region still outranks the same set of regions.
Exhibit 9. Creative Industries Job Growth, 2004-2013
9
-20.00%
-15.00%
-10.00%
-5.00%
0.00%
5.00%
10.00%
15.00%
20.00% 16.75%
-1.99% -5.80% -6.26%
-8.65% -12.89% -12.91% -14.28% -15.55%
-18.92%
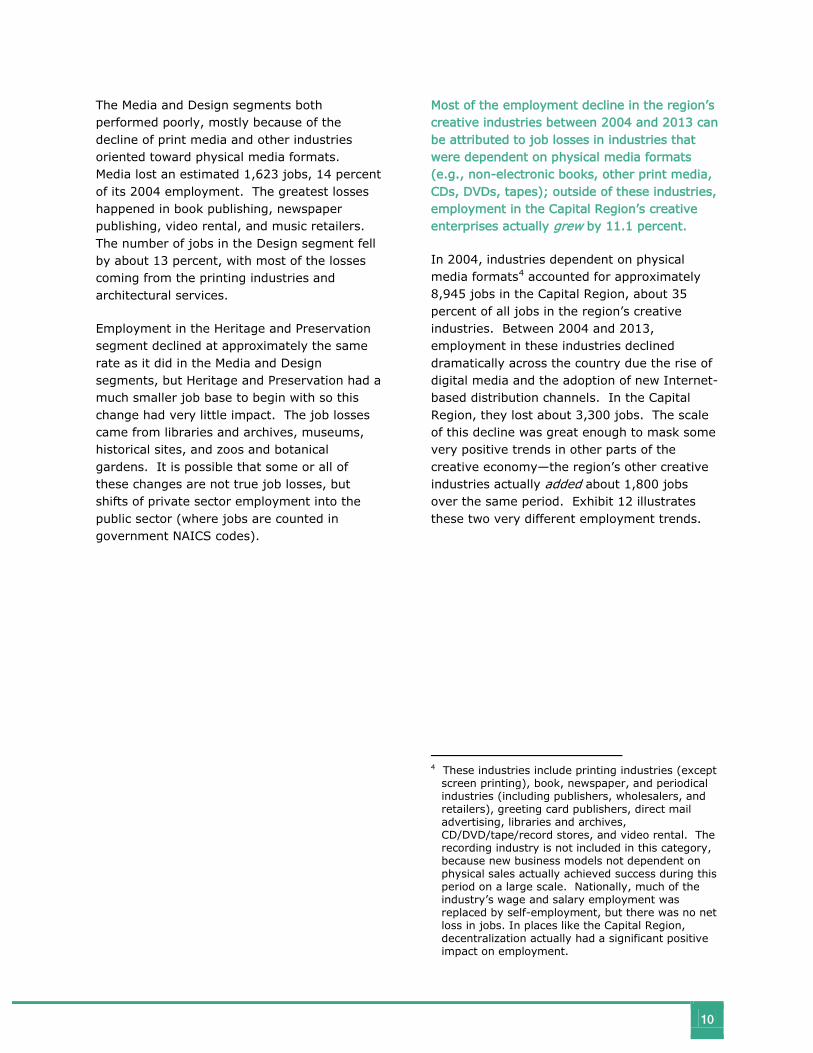
Changes in employment levels over the 2004-2013 period varied by segment, with particularly high growth in performing arts industries.
Figure 11 compares job growth in the five creative industry segments over the 2004-2013 periods.
Of all the creative industry segments, Performing Arts added the most jobs and had the highest growth rate over this period. The number of jobs expanded from approximately 3,567 in 2004 to approximately 4,700 in 2013. Most of this growth came from promoters (both with and without facilities), private fine arts education providers, and independent performers.
Visual Arts and Handcrafted Products was the only other creative segment where employment grew over the decade, although this growth was slight enough (an estimated 55 jobs added) as to be almost negligible. There were significant job gains among portrait photography studios and independent artists, but this was balanced by losses at commercial photofinishing studios, craft supply stores, and camera stores.
Exhibit 10. Creative Industries Job Growth in NY State Economic Development Regions, 2004-2013
Exhibit 11. Employment Trends by Segment, 2004-2013
10
The Media and Design segments both performed poorly, mostly because of the decline of print media and other industries oriented toward physical media formats. Media lost an estimated 1,623 jobs, 14 percent of its 2004 employment. The greatest losses happened in book publishing, newspaper publishing, video rental, and music retailers. The number of jobs in the Design segment fell by about 13 percent, with most of the losses coming from the printing industries and architectural services.
Employment in the Heritage and Preservation segment declined at approximately the same rate as it did in the Media and Design segments, but Heritage and Preservation had a much smaller job base to begin with so this change had very little impact. The job losses came from libraries and archives, museums, historical sites, and zoos and botanical gardens. It is possible that some or all of these changes are not true job losses, but shifts of private sector employment into the public sector (where jobs are counted in government NAICS codes).
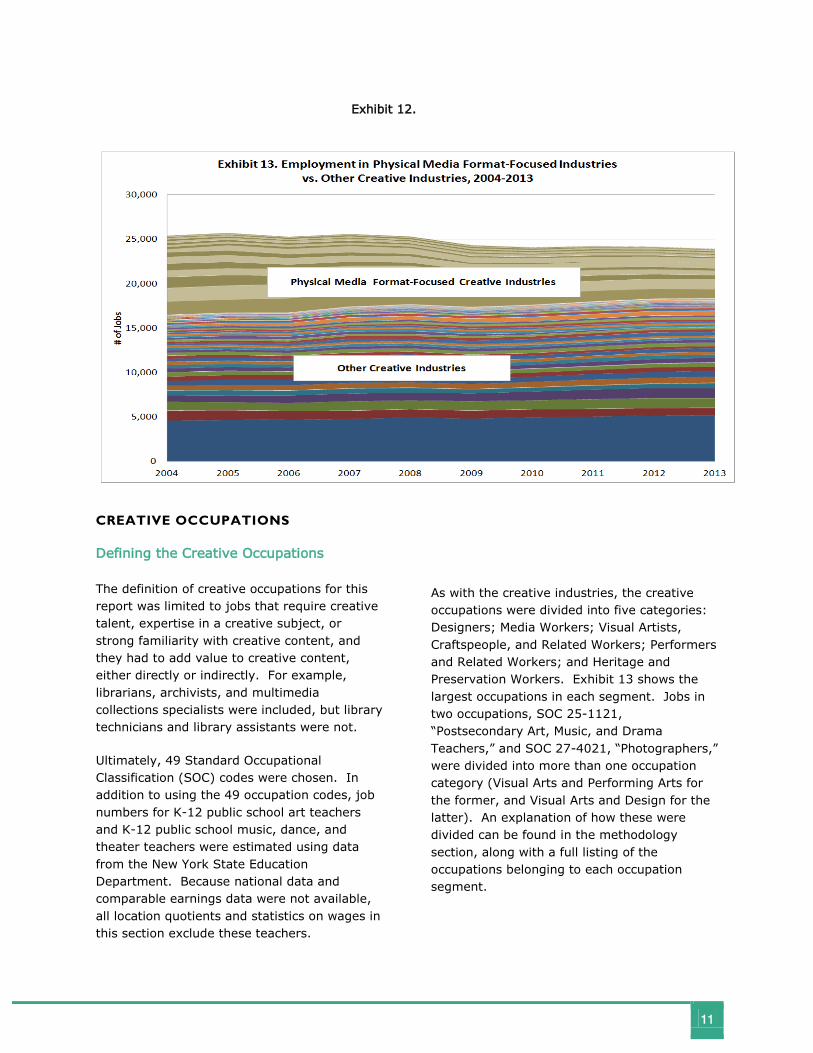
Most of the employment decline in the region’s creative industries between 2004 and 2013 can be attributed to job losses in industries that were dependent on physical media formats (e.g., non-electronic books, other print media, CDs, DVDs, tapes); outside of these industries, employment in the Capital Region’s creative enterprises actually grew by 11.1 percent.
In 2004, industries dependent on physical media formats4
accounted for approximately 8,945 jobs in the Capital Region, about 35 percent of all jobs in the region’s creative industries. Between 2004 and 2013, employment in these industries declined dramatically across the country due the rise of digital media and the adoption of new Internet-based distribution channels. In the Capital Region, they lost about 3,300 jobs. The scale of this decline was great enough to mask some very positive trends in other parts of the creative economy—the region’s other creative industries actually added about 1,800 jobs over the same period. Exhibit 12 illustrates these two very different employment trends.
4 These industries include printing industries (except
screen printing), book, newspaper, and periodical industries (including publishers, wholesalers, and retailers), greeting card publishers, direct mail advertising, libraries and archives, CD/DVD/tape/record stores, and video rental. The recording industry is not included in this category, because new business models not dependent on physical sales actually achieved success during this period on a large scale. Nationally, much of the industry’s wage and salary employment was replaced by self-employment, but there was no net loss in jobs. In places like the Capital Region, decentralization actually had a significant positive impact on employment.
11
CREATIVE OCCUPATIONS
Defining the Creative Occupations
The definition of creative occupations for this report was limited to jobs that require creative talent, expertise in a creative subject, or strong familiarity with creative content, and they had to add value to creative content, either directly or indirectly. For example, librarians, archivists, and multimedia collections specialists were included, but library technicians and library assistants were not.
Ultimately, 49 Standard Occupational Classification (SOC) codes were chosen. In addition to using the 49 occupation codes, job numbers for K-12 public school art teachers and K-12 public school music, dance, and theater teachers were estimated using data from the New York State Education Department. Because national data and comparable earnings data were not available, all location quotients and statistics on wages in this section exclude these teachers.
As with the creative industries, the creative occupations were divided into five categories: Designers; Media Workers; Visual Artists, Craftspeople, and Related Workers; Performers and Related Workers; and Heritage and Preservation Workers. Exhibit 13 shows the largest occupations in each segment. Jobs in two occupations, SOC 25-1121, “Postsecondary Art, Music, and Drama Teachers,” and SOC 27-4021, “Photographers,” were divided into more than one occupation category (Visual Arts and Performing Arts for the former, and Visual Arts and Design for the latter). An explanation of how these were divided can be found in the methodology section, along with a full listing of the occupations belonging to each occupation segment.
Exhibit 12.

12
There are an estimated 21,344 jobs in creative occupations in the Capital Region. The concentration of jobs in creative occupations in the Capital Region is higher than in the U.S. overall.
The location quotient of 1.12 for employment in creative occupations indicates that it is significantly more concentrated in the region than in the U.S. overall. Exhibit 14 shows how the jobs in the Capital Region’s creative occupations are categorized, and also what the location quotient is for each occupation category.
Of the 21,000 individuals who are in creative occupations, the largest numbers, about 35 percent, are in media occupations. This is partially due to the large number of public relations specialists related to the work associated with Albany being the state capital. However, there are large numbers of writers and multimedia artists/animators, and there are also many jobs in design occupations—most notably, graphic designers, web developers, architects, and art directors.
The occupation category with the highest relative concentration is Heritage and Preservation. These occupations have a location quotient of 1.61 in the Capital Region, which means that they represent over 60 percent more of the workforce in the Capital Region than they do in the nation as a whole. Media, visual arts, and performing arts occupations also have relatively high levels of concentration in the Capital Region.
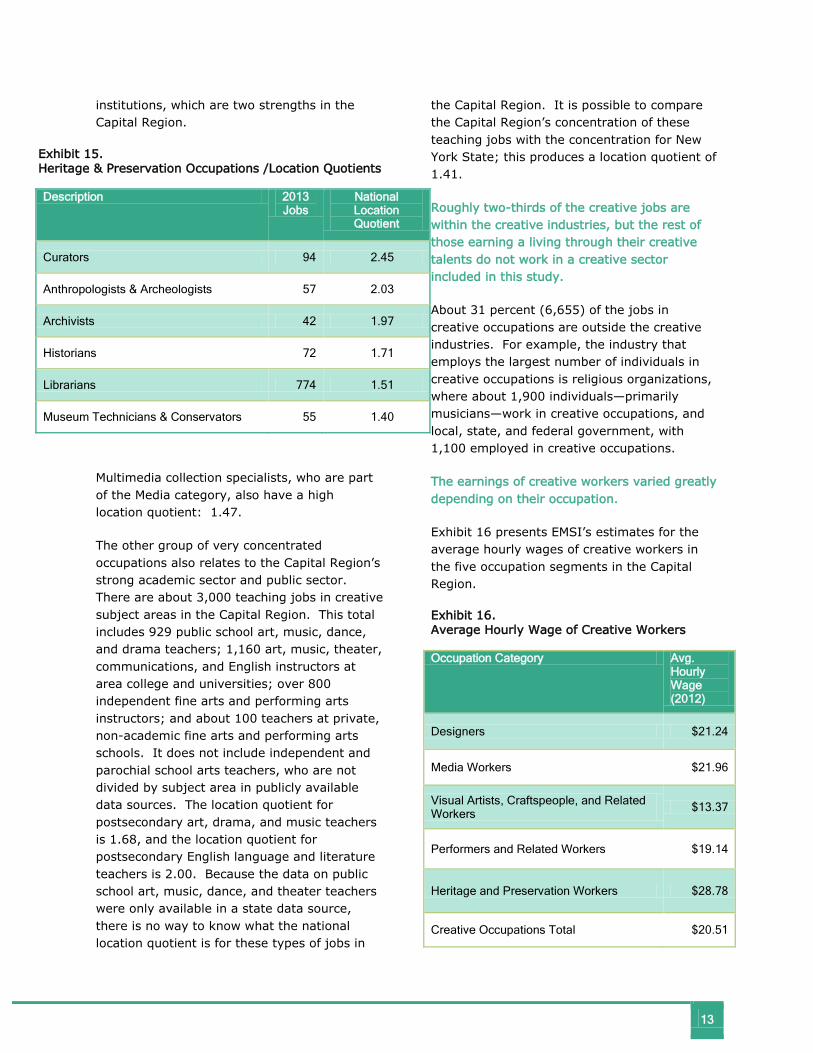
The Capital Region has particularly strong employment in occupations commonly employed by governmental and academic institutions. These include curation, preservation, research, and teaching jobs.
Every Heritage and Preservation occupation has a location quotient above 1.4 in the Capital Region, as Exhibit 15 illustrates. Most of these workers work for governmental or academic
Occupation Category
Five Largest Occupations
Designers Graphic Designers, Web Developers, Architects (Exc. Landscape and Naval), Art Directors, Photographers (Commercial)
Media Workers Writers and Authors, Public Relations Specialists, Editors, Multimedia Artists and Animators, Postsecondary English Language and Literature Teachers
Visual Artists, Craftspeople, and Related Workers
Photographers (Art and Portrait), K-12 Art Teachers (Public Schools Only), Craft Artists, Fine Artists (Inc. Painters, Sculptors, and Illustrators), Postsecondary Art Teachers
Performers and Related Workers
Musicians and Singers, K-12 Music, Drama, and Dance Teachers (Public Schools Only), Music Directors and Composers, Actors, Postsecondary Drama, and Music Teachers
Heritage and Preservation Workers
Librarians, Curators, Historians, Anthropologists and Archeologists, Museum Technicians and Conservators
Exhibit 13. Largest Occupations in Each Segment
Occupation Category 2013 Jobs
National Location Quotient
Designers 5,598 0.98
Media Workers 7,390 1.21
Visual Artists, Craftspeople, and Related Workers 3,019 1.09
Performers and Related Workers 4,242 1.14
Heritage and Preservation Workers 1,094 1.61
Creative Occupations Total 21,344 1.12
Exhibit 14. Location Quotient by Occupational Category
13
institutions, which are two strengths in the Capital Region.
Exhibit 15. Heritage & Preservation Occupations /Location Quotients
Description 2013 Jobs
National Location Quotient
Curators 94 2.45
Anthropologists & Archeologists 57 2.03
Archivists 42 1.97
Historians 72 1.71
Librarians 774 1.51
Museum Technicians & Conservators 55 1.40
Multimedia collection specialists, who are part of the Media category, also have a high location quotient: 1.47.
The other group of very concentrated occupations also relates to the Capital Region’s strong academic sector and public sector. There are about 3,000 teaching jobs in creative subject areas in the Capital Region. This total includes 929 public school art, music, dance, and drama teachers; 1,160 art, music, theater, communications, and English instructors at area college and universities; over 800 independent fine arts and performing arts instructors; and about 100 teachers at private, non-academic fine arts and performing arts schools. It does not include independent and parochial school arts teachers, who are not divided by subject area in publicly available data sources. The location quotient for postsecondary art, drama, and music teachers is 1.68, and the location quotient for postsecondary English language and literature teachers is 2.00. Because the data on public school art, music, dance, and theater teachers were only available in a state data source, there is no way to know what the national location quotient is for these types of jobs in
the Capital Region. It is possible to compare the Capital Region’s concentration of these teaching jobs with the concentration for New York State; this produces a location quotient of 1.41.
Roughly two-thirds of the creative jobs are within the creative industries, but the rest of those earning a living through their creative talents do not work in a creative sector included in this study.
About 31 percent (6,655) of the jobs in creative occupations are outside the creative industries. For example, the industry that employs the largest number of individuals in creative occupations is religious organizations, where about 1,900 individuals—primarily musicians—work in creative occupations, and local, state, and federal government, with 1,100 employed in creative occupations.
The earnings of creative workers varied greatly depending on their occupation.
Exhibit 16 presents EMSI’s estimates for the average hourly wages of creative workers in the five occupation segments in the Capital Region.
Exhibit 16. Average Hourly Wage of Creative Workers
Occupation Category Avg. Hourly Wage (2012)
Designers $21.24
Media Workers $21.96
Visual Artists, Craftspeople, and Related Workers $13.37
Performers and Related Workers $19.14
Heritage and Preservation Workers $28.78
Creative Occupations Total $20.51
14
Design and heritage/preservation workers tend to make above the national average for their occupations. This is probably due to the high share of academic and governmental employment. Visual artists and performers tend to make wages below the national average.
Average wages can vary widely between individual occupations within the segments, so these wages should not be taken to represent every type of job. There is sometimes also a great deal of variation in wages within individual occupations. For example, an actor in the 25th percentile of hourly earnings makes an estimated $16.12 an hour, but an actor in the 75th percentile makes an estimated $29.30 an hour.
METHODOLOGY
Data Sources
The employment data (including jobs and earnings) in the section on creative industries come from the fourth quarter 2013 dataset published by Economic Modeling Specialists, Inc. Data on creative occupations also came from EMSI, with two small exceptions. The numbers used for postsecondary instructor jobs, including art, music, and theater teachers, communications teachers, and English language and literature teachers, came from the New York State Department of Labor’s 2013 occupation data, which are based on the national Occupational Employment Statistics survey. Information on the number of K-12 art, music, and theater teachers at public schools came from the New York State Education Department’s 2012-2013 Personnel Master File. Because there is no equivalent national data source on K-12 teachers in creative fields, these jobs were excluded from the calculation of location quotients. The hourly wage figures in this section exclude teachers because the alternate sources did not have income data comparable to EMSI’s figures.
Except where it is otherwise noted, jobs and earnings figures in this report are based on the combined data from all four of EMSI’s class-of-worker categories. This includes wage and salary employment covered by QCEW, wage and salary employment not covered by QCEW, primary self-employment (“self-employed”), and secondary self-employment (“extended proprietorships”).
Adjustments to the Original Data
For employment in creative industries, the figures in this report are, for the most part, directly based on EMSI’s reported figures.
However, in one very important case, jobs in an industry were divided into different segments. NAICS 711510, “Independent Artists, Writers, and Performers,” is an industry code that accounts for more than one-fifth of all the jobs in the Capital Region’s creative enterprises. As its name suggests, the industry includes jobs that belong in several segments: visual arts, media, performing arts, and (sometimes) design. To account for this issue, EMSI’s staffing patterns estimates (the occupational employment by industry) were used to determine what proportion of the jobs in NAICS 711510 belonged to each segment.
For occupation numbers, the process was a little more complex. This is because EMSI’s occupational data for secondary self-employment (extended proprietorships) are heavily based on estimates, and its algorithms produce certain predictable biases. The most significant alteration made to EMSI’s occupational data for this report data was an adjustment applied to the photographer occupation. EMSI’s algorithms usually produce relatively accurate estimates, but in the process of doing the research for this study, it was discovered that the numbers for photographers operating extended
15
proprietorships were significantly inflated.5
The other alteration was to adjust the total number of extended proprietorships in creative occupations to match the number of extended proprietorships in creative industries, scaling the numbers for every occupation down, slightly. This produces more accurate figures because the underlying data EMSI uses are industry based.
To account for this problem, extended proprietorship jobs in the photographers SOC code, which EMSI had placed in non-photography industries under NAICS 5419, were not treated as creative.
Finally, jobs in two occupation codes were split into more than one of the five occupation categories. Postsecondary art, drama, and theater instructors were divided into the performing arts worker category and the visual arts worker category based on the K-12 public school teacher distribution (the best data available). Photographers were put into the designers category or the visual arts worker category based on the industry in which they worked, using EMSI’s inverse staffing patterns estimates.
5 This problem relates to NAICS 5419, which
includes two photography codes and also NAICS 541990 “All other professional, scientific, and technical services.” NAICS 541990 is a code that produces problems in the data because in tax return-based data it accounts for a huge number of proprietorships, but in other data sources it is rarely used. When the industry staffing patterns for the broader industry code, NAICS 5419, are estimated by EMSI based on non-tax return data and then applied to tax return data, it produces unrealistically high estimates of the number of extended proprietorships in the photographer occupation.
Combining Industry and Occupation Data
Producing the figure for total creative economy employment (30,591 jobs) required a separate cross-staffing analysis. This is because adding the total number of jobs in creative occupations to the total number of jobs in creative industries would be double-counting jobs that are in creative occupations and in creative industries.
To come up with the total, EMSI’s inverse staffing patterns were use to produce an estimate of the number of jobs in creative occupations outside of creative industries. Because all self-employed workers in creative occupations were, by definition, part of the creative industries, this analysis used only wage and salary employment.
16
DEFINITIONS
Creative Industries
MEDIA
NAICS Code
Description
424920 Book, Periodical, and Newspaper Merchant Wholesalers
451211 Book Stores
451212 News Dealers and Newsstands
451220 Prerecorded Tape, Compact Disc, and Record Stores
511110 Newspaper Publishers
511120 Periodical Publishers
511130 Book Publishers
511199 All Other Publishers
512110 Motion Picture and Video Production
512120 Motion Picture and Video Distribution
512131 Motion Picture Theaters (except Drive-Ins)
512132 Drive-In Motion Picture Theaters
512191 Teleproduction and Other Postproduction Services
512199 Other Motion Picture and Video Industries
512210 Record Production
512220 Integrated Record Production/Distribution
512230 Music Publishers
512240 Sound Recording Studios
512290 Other Sound Recording Industries
515111 Radio Networks
515112 Radio Stations
515120 Television Broadcasting
DESIGN
NAICS Code
Description
323110 Commercial Lithographic Printing
323111 Commercial Gravure Printing
323112 Commercial Flexographic Printing
323113 Commercial Screen Printing
323114 Quick Printing
323115 Digital Printing
323117 Books Printing
323119 Other Commercial Printing
323121 Tradebinding and Related Work
323122 Prepress Services
511191 Greeting Card Publishers
541310 Architectural Services
541320 Landscape Architectural Services
541340 Drafting Services
541410 Interior Design Services
541420 Industrial Design Services
541430 Graphic Design Services
541490 Other Specialized Design Services
541850 Display Advertising
541860 Direct Mail Advertising
541922 Commercial Photography
711510*D Independent Artists, Writers, and Performers (Design)
17
MEDIA
NAICS Code
Description
515210 Cable and Other Subscription Programming
519110 News Syndicates
519130 Internet Publishing and Broadcasting and Web Search Portals
532230 Video Tape and Disc Rental
541810 Advertising Agencies
541820 Public Relations Agencies
541830 Media Buying Agencies
541840 Media Representatives
541890 Other Services Related to Advertising
711410 Agents and Managers for Artists, Athletes, Entertainers, and Other Public Figures
711510*M Independent Artists, Writers, and Performers (Media)
VISUAL ARTS AND HANDCRAFTED PRODUCTS
NAICS Code
Description
327112 Vitreous China, Fine Earthenware, and Other Pottery Product Manufacturing
327212 Other Pressed and Blown Glass and Glassware Manufacturing
339911 Jewelry (except Costume) Manufacturing
443130 Camera and Photographic Supplies Stores
451130 Sewing, Needlework, and Piece Goods Stores
453920 Art Dealers
541921 Photography Studios, Portrait
812921 Photofinishing Laboratories (except One-Hour)
711510*P Independent Artists, Writers, and Performers (Visual Arts and Handcrafted Products)
18
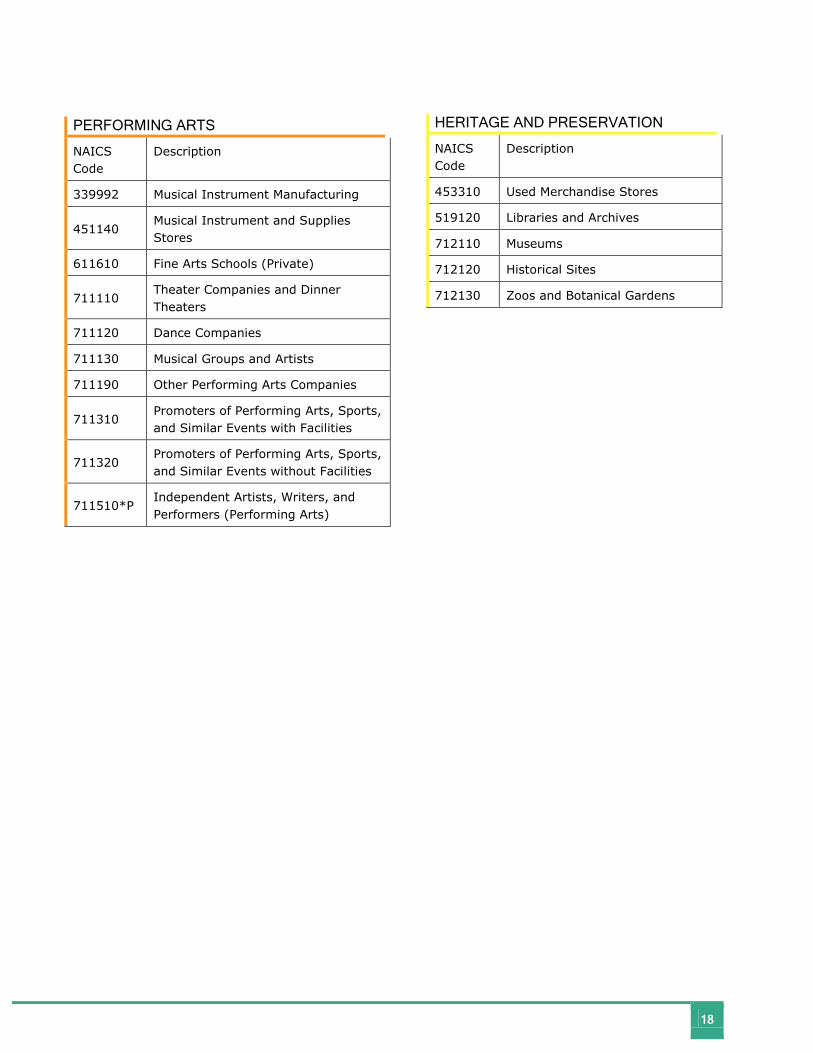
PERFORMING ARTS
NAICS Code
Description
339992 Musical Instrument Manufacturing
451140 Musical Instrument and Supplies Stores
611610 Fine Arts Schools (Private)
711110 Theater Companies and Dinner Theaters
711120 Dance Companies
711130 Musical Groups and Artists
711190 Other Performing Arts Companies
711310 Promoters of Performing Arts, Sports, and Similar Events with Facilities
711320 Promoters of Performing Arts, Sports, and Similar Events without Facilities
711510*P Independent Artists, Writers, and Performers (Performing Arts)
HERITAGE AND PRESERVATION
NAICS Code
Description
453310 Used Merchandise Stores
519120 Libraries and Archives
712110 Museums
712120 Historical Sites
712130 Zoos and Botanical Gardens
19
DEFINITIONS
Creative Occupations
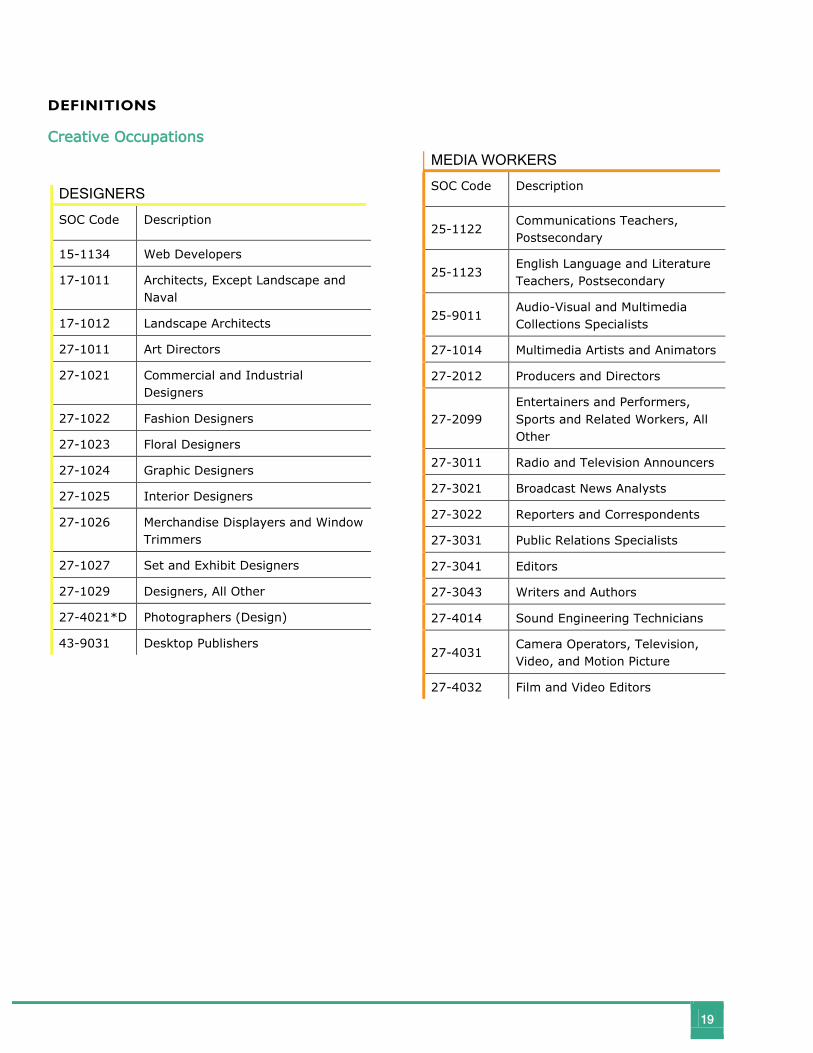
DESIGNERS
SOC Code Description
15-1134 Web Developers
17-1011 Architects, Except Landscape and Naval
17-1012 Landscape Architects
27-1011 Art Directors
27-1021 Commercial and Industrial Designers
27-1022 Fashion Designers
27-1023 Floral Designers
27-1024 Graphic Designers
27-1025 Interior Designers
27-1026 Merchandise Displayers and Window Trimmers
27-1027 Set and Exhibit Designers
27-1029 Designers, All Other
27-4021*D Photographers (Design)
43-9031 Desktop Publishers
MEDIA WORKERS
SOC Code Description
25-1122 Communications Teachers, Postsecondary
25-1123 English Language and Literature Teachers, Postsecondary
25-9011 Audio-Visual and Multimedia Collections Specialists
27-1014 Multimedia Artists and Animators
27-2012 Producers and Directors
27-2099 Entertainers and Performers, Sports and Related Workers, All Other
27-3011 Radio and Television Announcers
27-3021 Broadcast News Analysts
27-3022 Reporters and Correspondents
27-3031 Public Relations Specialists
27-3041 Editors
27-3043 Writers and Authors
27-4014 Sound Engineering Technicians
27-4031 Camera Operators, Television, Video, and Motion Picture
27-4032 Film and Video Editors
20
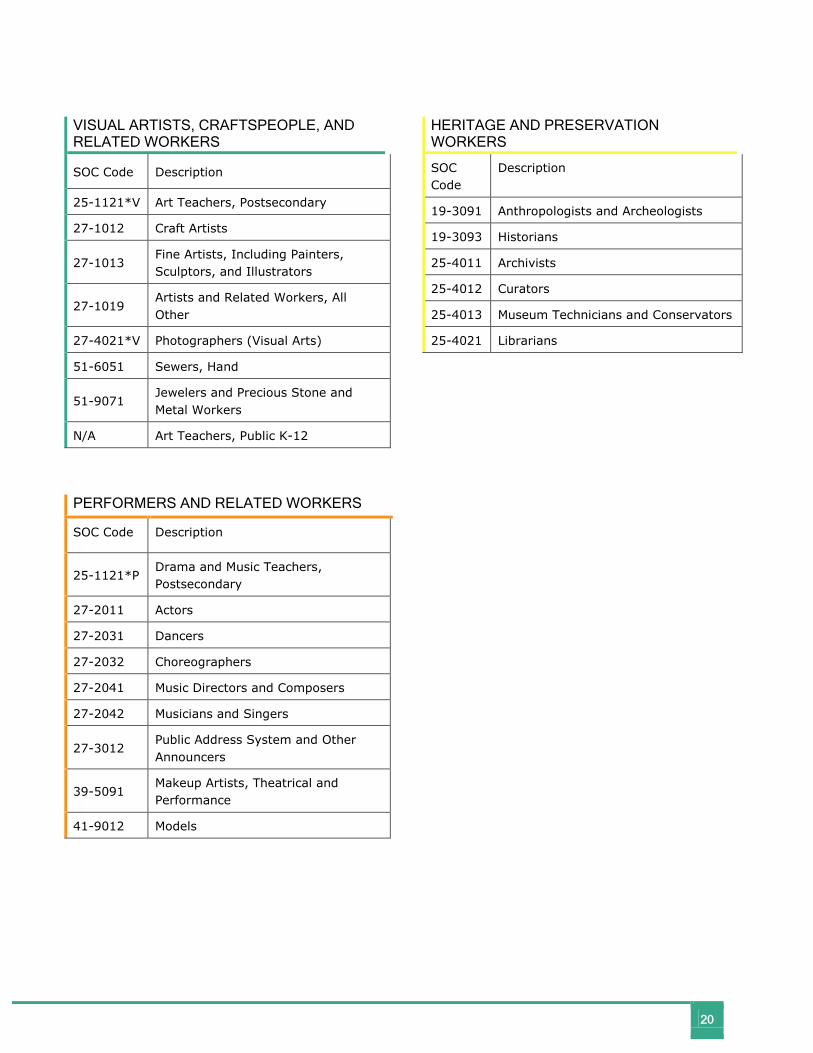
VISUAL ARTISTS, CRAFTSPEOPLE, AND RELATED WORKERS
SOC Code Description
25-1121*V Art Teachers, Postsecondary
27-1012 Craft Artists
27-1013 Fine Artists, Including Painters, Sculptors, and Illustrators
27-1019 Artists and Related Workers, All Other
27-4021*V Photographers (Visual Arts)
51-6051 Sewers, Hand
51-9071 Jewelers and Precious Stone and Metal Workers
N/A Art Teachers, Public K-12
PERFORMERS AND RELATED WORKERS
SOC Code Description
25-1121*P Drama and Music Teachers, Postsecondary
27-2011 Actors
27-2031 Dancers
27-2032 Choreographers
27-2041 Music Directors and Composers
27-2042 Musicians and Singers
27-3012 Public Address System and Other Announcers
39-5091 Makeup Artists, Theatrical and Performance
41-9012 Models
HERITAGE AND PRESERVATION WORKERS
SOC Code
Description
19-3091 Anthropologists and Archeologists
19-3093 Historians
25-4011 Archivists
25-4012 Curators
25-4013 Museum Technicians and Conservators
25-4021 Librarians