MEASURING THE BURDEN OF DISEASE: DISABILITY ADJUSTED ...
33
1 MEASURING THE BURDEN OF DISEASE: DISABILITY ADJUSTED LIFE YEAR (DALY) Doncho Donev, Lijana Zaletel-Kragelj, Vesna Bjegovic, Genc Burazeri THEORETICAL BACKGROUND Burden of disease Various diseases people suffering from put different amount of disease-burden on populations. In last decades this burden is increasingly measured across the nations with intention to compare it. We could define burden of disease (BoD) as the burden that a particular disease process has in a particular area as measured by cost, morbidity, and mortality. It is quantified by so called summary measures of population health. Summary measures of population health Summary measures of population health are measures that combine information on mortality and non-fatal health outcomes to represent the health of a particular population as a single number. Over the past 30 years or so, several indicators have been developed to adjust mortality to reflect the impact of morbidity or disability. These measures fall into two basic categories, health expectancies and health gaps (1-3). 1. Health expectancies. Health expectancies measure years of life gained or years of improved quality of life. In this group of measures, among others, following measures are classified: • active life expectancy (ALE), • disability-free life expectancy (DFLE), • disability-adjusted life expectancy (DALE), • healthy adjusted life expectancy (HALE), • quality adjusted life expectancy (QALE). 2. Health gaps. Health gaps measure lost years of full health in comparison with some ‘ideal’ health status or accepted standard. In this group of measures among others, following measures (indicators) are classified: • potential years of life lost (PYLL), • healthy years of life lost (HYLL), • quality adjusted life years (QALY), • disability adjusted life years (DALY). Both approaches use time and multiply number of years lived (or, not lived in case of premature death) by the “quality” of those years. The process of adjustment of the years of healthy life lived is called “quality adjustment” (expressed as QALYs), and the process of adjustment of the years of healthy life lost is called “disability adjustment” (expressed as DALYs) (4,5). It means that QALYs represent a gain which should be maximised, and DALYs represent a loss which should be minimised. In the QALY approach the quality is weighted (sometimes called “utility”, as it is the case of cost-utility
Transcript of MEASURING THE BURDEN OF DISEASE: DISABILITY ADJUSTED ...

1
MEASURING THE BURDEN OF DISEASE: DISABILITY ADJUSTED LIFE YEAR (DALY) Doncho Donev, Lijana Zaletel-Kragelj, Vesna Bjegovic, Genc Burazeri THEORETICAL BACKGROUND
Burden of disease Various diseases people suffering from put different amount of disease-burden on populations. In last decades this burden is increasingly measured across the nations with intention to compare it. We could define burden of disease (BoD) as the burden that a particular disease process has in a particular area as measured by cost, morbidity, and mortality. It is quantified by so called summary measures of population health.
Summary measures of population health Summary measures of population health are measures that combine information on mortality and non-fatal health outcomes to represent the health of a particular population as a single number. Over the past 30 years or so, several indicators have been developed to adjust mortality to reflect the impact of morbidity or disability. These measures fall into two basic categories, health expectancies and health gaps (1-3).
1. Health expectancies. Health expectancies measure years of life gained or years of improved quality of life. In this group of measures, among others, following measures are classified:
• active life expectancy (ALE), • disability-free life expectancy (DFLE), • disability-adjusted life expectancy (DALE), • healthy adjusted life expectancy (HALE), • quality adjusted life expectancy (QALE).
2. Health gaps.
Health gaps measure lost years of full health in comparison with some ‘ideal’ health status or accepted standard. In this group of measures among others, following measures (indicators) are classified:
• potential years of life lost (PYLL), • healthy years of life lost (HYLL), • quality adjusted life years (QALY), • disability adjusted life years (DALY).
Both approaches use time and multiply number of years lived (or, not lived in case
of premature death) by the “quality” of those years. The process of adjustment of the years of healthy life lived is called “quality adjustment” (expressed as QALYs), and the process of adjustment of the years of healthy life lost is called “disability adjustment” (expressed as DALYs) (4,5). It means that QALYs represent a gain which should be maximised, and DALYs represent a loss which should be minimised. In the QALY approach the quality is weighted (sometimes called “utility”, as it is the case of cost-utility

2
analyses) on a scale from 1 indicating perfect health and the highest quality of life, to 0 indicating no quality of life and is synonymous to death. In the DALY approach the scale goes in opposite way: a disability weighted zero indicates perfect health (no disability), and weighted 1 indicates death. The disability weighting is the most difficult and controversial part of the DALY approach (5). A typology of summary measures of population health is presented in Figure 1.
Figure 1. A typology of summary measures. Adapted from Murray CJL and Lopez AD (1).
LEGEND: A=time lived in optimal health, B=time lived in suboptimal health, C=time lost due to mortality.
There are two lines (upper and lower) and three areas (A, B and C) (Figure 1). The upper line is the survivorship curve from a hypothetical life table population. The lower curve is a hypothetical curve of survivors to each “age x” in optimal health. Area A represents time lived in optimal health, area B time lived in suboptimal health, and area C time lost due to mortality. Total life expectancy at birth is given by the area under the upper curve (Equation 1):
BA EL += Equation 1.
LE = total life expectancy at birth A = time lived in optimal health B = time lived in suboptimal health
Health expectancies are population indicators that estimate the average time that a person could expect to live in a defined state of health. In terms of Figure 1, health expectancy is given by following equation (Equation 2):
( )BfA EH += Equation 2.
HE = health expectancy A = time lived in optimal health B = time lived in suboptimal health f(B) = function that assigns weights to years lived in suboptimal health (optimal health
has a weight of 1)
Health gaps measure the difference between actual population health and some specified standard or goal (Equation 3):

3
( )BgCG H += Equation 3.
HG = health gap B = time lived in suboptimal health C = time lost due to mortality (premature death) f(B) = function that assigns weights to health states lived during time B, but where a
weight of 1 equals to time lived in a health state equivalent to death One of the most employed measures of health gaps is DALY measure (1,2).
Disability-Adjusted Life Year (DALY) concept Introduction
DALY is an indicator of BoD in a population. It takes into account not only premature mortality, but also disability caused by disease or injury. As a new single summary measure was introduced in a 1990 Global Burden of Disease Study (GBDS) (6), that represented a major step in quantifying global and regional effects of diseases, injuries, and risk factors on population health. It is worth to note that DALYs are an inverse form of the more general concept of QALYs (7).
Two dimensions of DALYs The DALY is a time-based measure that combines years of life lost due to premature mortality and years of life lost due to time lived in health states less than ideal health. One DALY can be thought of as one lost year of “healthy” life, and the BoD can be thought of as a measurement of the gap between current health status and an ideal situation where everyone lives into old age, free of disease and disability (1,4,8-11). In other words, DALYs are the combination (more precisely the sum) of two dimensions: the present value of future years of lifetime lost through premature mortality, and the present value of years of future lifetime adjusted for the average severity (frequency and intensity) of any mental or physical disability caused by a disease or injury (10-12).
The years of life lost dimension As a basis for the DALY measure, a “gold standard”, or most desirable life, is defined as living in a completely healthy state until death at age around 80 years. Perfect health is 1 on the y-axis and death is 0 on the DALY diagram shown in Figure 2. The “ideal” life is quantified as the total area in the box, a combination of the number of years lived and the full quality of life without disability (5,8).
For each premature death1, the number of years lost is counted up to the “standardised” maximum life span. The standardized maximum life span is 82.5 years for females and 80 years for males. It is taken from the country with the highest life expectancy in the world, Japan. Such a measure of premature death in number of years lost is known as "years of life lost" (YLL) (8).
1 Here, a premature death is defined as one that occurs before the age to which a person could have
expected to survive assuming a life expectancy at birth approximately equal to that of the world's longest-surviving population - Japan (1,8,9).

4
Figure 2. Graphical presentation of a life in full health until sudden death at the age of 80 years (8). The following example illustrates how the YLLs could be calculated (Example 1).
A scenario: a man dies in a car accident at 30 years of age. In terms of years of life lost, 50 years are lost due to this premature
death (YLLs = 80-30 years). This could be illustrated as presented in a Figure 3. The gray area represents the time lost due to premature death.
Example 1.
Figure 3. Presentation of a life in full health until sudden death at the age of 30 years. The gray area
represents the time lost due to premature death.
The disability dimension Injury and disease cause not only deaths but also varying time periods with morbidity and disability. The time period in years that is lived in states of poor health or disability due to each disease is another dimension of the DALY measure.
The disability is measured in length in years and in severity.

5
Severity weights have been appointed for each disabling condition on a scale from one to zero2 (11,13,14). The disability severity weight for each disease reflects the average degree of disability a person suffers with each condition. Panels of healthy experts with knowledge about disease conditions have determined the weights. We will discuss the disability weights in details later in this module.
The severity weight is then multiplied by the average time a person is suffering from the disability from each disease (5,8). A measure of years lived in health states less than ideal health is known as "years lived with disability" (YLD) (8). Two examples from a person's life are presented in continuation (Examples 2 and 3).
A scenario: at the age of 30, a man gets a knee injury and his health is jeopardized with a weighted severity of 0.1. The injury is incurable and a man suffers until he dies at the age of 80 years.
In terms of years lost due to disability this man’s health is only 0.9 of the maximum of 1.0 for the entire 50-year period. This could be illustrated (Figure 4). The grey area in Figure 4 represents his life years lost due to disability, and YLDs corresponds to 5 years (YLDs = 0.1×50 = 5 years).
Example 2.
Figure 4. Illustration of life of a man who gets a knee injury at the age of 30. The injury is
incurable and a man suffers until he dies at the age of 80 years. The grey area represents life years lost due to disability.
A scenario: at the age of 30, a man gets a knee injury and his health is jeopardized with a weighted severity of 0.1. During the years he suffers from the knee injury his health is only 0.9 of the maximum of 1.0. After At the age 35 he is successfully operated and recovers completely.
In terms of years lost due to disability this man suffers from the knee injury and his health is only 0.9 of the maximum of 1.0 for the 5-year period. This could be illustrated in a figure (Figure 5). The grey area in Figure 5 represents his life years lost due to disability, and YLDs correspond to 0.5 years (YLDs = 0.1×5 = 0.5 years).
Example 3.
2 For example, schizophrenia was given a weighted severity loss of 0.8, whereas the common cold
only causes a loss of 0.007.

6
Figure 5. Illustration of life of a man who gets a knee injury at the age of 30. At the age 35 he is
successfully operated and recovers completely. A man is healthy until he dies at the age of 80 years. The grey area represents life years lost due to disability.
Both dimensions combined Usually, both dimensions are combined. Another two examples from a person's life are presented in continuation (Examples 4 and 5).
A scenario: at the age of 40, a man gets cancer which disables him for a certain amount but after a surgery he is in remission for 10 years. After 10 years he suffers from a progress of a disease which disables him substantially more. At the age of 60 years he dies.
In terms of years of life lost, 20 years are lost due to this premature death (YLLs = 80-60 years) (Figure 6, dark grey area).
In terms of years lost due to disability the health of this man is 0.9 for the 10-year period and after a progression is 0.6. YLDs in this case correspond to 5 years (YLDs = 0.1×10 + 0.4×10 = 1+4 = 5 years) (Figure 6, light grey area).
The total loss, that is DALYs, is 25 years (DALYs = YLDs+YLLs = 20+5 = 25)
Example 4.
Figure 6. Illustration of a life of a man who gets a cancer at the age of 40. The disease disables him
more and more. He dies at the age of 60. The grey area represents life years lost due to disability (light gray) and due to premature death (dark gray).

7
A scenario in this example is very similar as in Example 4. The difference is that the disease disables a man gradually more and more until he finally dies at the age of 70 years (Figure 7).
Example 5.
Figure 7. Illustration of a life of a man who gets a cancer at the age of 40. The disease disables him
gradually more and more until he finally dies at the age of 70 years. The grey area represents life years lost due to disability (light gray) and due to premature death (dark gray).
The calculation in this case is more complex than presented in Examples 1-4.
Calculation of DALYs The DALY measure is the sum of both dimensions/components just described - the sum of the YLLs and the YLDs (4,10,11,15-19) (Equation 4):
YLDYLLALYD += Equation 4.
DALY = disability adjusted life years YLL = years of life lost due to premature death YLD = years lost due to disability
For YLLs we already know that they measure the number of years lost when a person dies prematurely. Consecutively, the younger is the age at which death occurs, the greater is the number of YLLs. The YLDs measure the number of years of healthy life lost due to temporary or permanent disability. Consecutively, the more severe disability or the longer the duration of this disability associated with a given health condition, the greater is the number of YLDs.
Another characteristic is that DALYs basically comprise so called social values/preferences. The two basic ones are:
• the sex differences which are built in the YLL component (standard life expectancies are separate for men and for women), and
• disability weighting which is built in the YLDs component.

8
But they could comprise additional social preferences, for example discounting and age weighting as well. According to this characteristic, DALYs could be computed:
• without considering age weighting and discounting, • with considering age weighting, or • with considering age weighting and discounting.
All procedures will be discussed in continuation but only the most simple, without considering age weighting and discounting will be presented in details since both other procedures are out of the scope of this module.
Basic procedure considering basic social preferences Before presenting the basic procedure of calculation of DALYs the main characteristics of two basic social preferences built in the DALY calculation procedure need to be discussed in more details.
Two basic social preferences - sex differences and disability weighting Major characteristics of basic social preferences are:
1. Sex differences. To assess premature mortality, a standard life table for all populations, with life expectancies at birth fixed at 82.5 years for women and 80 years for men is utilized. Life expectancy is calculated separate for men and for women because women live on average longer than men. This table could be accessed in full or abridged form from the publicly available World Health Organization (WHO) web page3 (20,21). It is also presented in Appendix (Appendix, Table A1). The same table was used by Murray and co-workers (22). What this table tells us is illustrated in Example 6.
Standard life expectancy table tells that (23):
• a male infant who dies shortly after birth would lose all 80.00 years of his life he would have been expected to live (Appendix, Table A1),
• a man who dies at age 50 would lose 30.99 years of expected life, because if he has already survived up to age 50 he has a life expectancy of 80.99 years (50 years + 30.99 years) (Appendix, Table A1),
• a man who dies at age 75 would lose only 10.17 years of expected life, because his life expectancy at age 75 is 85.17 years (75 years + 10.17 years) (Appendix, Table A1).
Example 6.
3 The GBD methods can be applied on a national or sub-national level and tailored to health
values of that country. WHO provides practical tools for people undertaking a BoD study. A link to software to help create life tables and disease models, a manual, supplementary files to help with calculations, and examples of where these methods have been applied by researchers around the globe.

9
A standard life expectancy allows deaths at the same age to contribute
equally to the BoD irrespective of where the death occurs. Alternatives, such as using different life expectancies for different populations that more closely match their actual life expectancies, violate this egalitarian principle. As life expectancy is rarely equal for men and women, a lower reference life expectancy could be used for both sexes because of “biological differences in survival potential”, as well as men are higher exposed to various risks such as alcohol, tobacco, and occupational injury (1,5,9,24).
2. Disability weights. On one side, there are health conditions that frequently cause significant disability or death, while on the other side there are those conditions that rarely cause death but may cause severe and/or prolonged disability. The other health conditions can cause severe disability but they occur late in life and they are of shorter duration (Example 7).
Here we give some examples:
• Alzheimer’s disease often cause severe disability but it typically occurs in older ages and consecutively lasts shorter,
• Down syndrome is a congenital anomaly that causes limited ability to perform most activities for entire life of a person,
• stroke is highly lethal disease etc.
Example 7.
In order to quantify time lived with a non-fatal health outcome and assess disabilities in a way that will help to inform health policy, disability must be defined, measured, and valued in a clear framework that inevitably involves simplifying reality.
Disabilities were assigned severity weights ranging from zero, representing perfect health, to one, representing death. These weights were determined at a meeting of experts in international health who had not participated in the first GBDS. In order to reduce the number of weights to be assigned and to emphasize large differences in the severity of disability, each disability condition was assigned to one of six classes. In Table 1 definitions of each of these classes are presented (22).
In continuation, for disability, the incidence of cases by age, sex, and demographic region was estimated on the basis of community surveys or, failing that, on expert opinion; the number of years of healthy life lost was then obtained by multiplying the expected duration of the condition (up to remission or to death) by a severity weight that measured the severity of the disability in comparison with loss of life.
For the GBDS 2000 and 2004 some updates were made and diseases were grouped into seven classes of severity of disability. For example, class IV, which includes arm or below-the-knee amputation, deafness etc., was given a range of severity weight from 0.24-0.36, and class VI, which includes AIDS cases not on antiretroviral drugs, Alzheimer and other dementias, blindness etc., was assigned a severity weight of 0.6 (range from 0.5-0.7) (Table 2) (11,14).

10
Table 1. Definitions of disbility weighting classes. Adapted from Murray (22).
Class Description Weight 1 Limited ability to perform at least one activity in one of the
following areas: recreation, education, procreation or occupation 0.096
2 Limited ability to perform most activities in one of the following areas: recreation, education, procreation or occupation
0.220
3 Limited ability to perform activities in two or more of the following areas: recreation, education, procreation or occupation
0.400
4 Limited ability to perform most activities in all of the following areas: recreation, education, procreation or occupation
0.600
5 Needs assistence with instrumental activities of daly living such as meal preparation, shopping or housework
0.810
6 Needs assistence with activities of daly living such as eating, personal hygiene or toilet use
0.920
Table 2. Disability classes for the Global Burden of Disease Study (GBDS), with examples of
long-term disease and injury sequelae falling in each class¹ (11,14). Dysability class
Severity weights
Conditions²
I 0.00-0.02 Stunting due to malnutrition, schistosomiasis infection, long-term scarring due to burns (less than 20% of body)
II 0.02-0.12 Amputated finger, asthma case, edentulism, mastectomy, severe anaemia, stress incontinence, watery diarrhoea
III 0.12-0.24 Angina, HIV not progressed to AIDS, alcohol dependence and problem use, radius fracture in a stiff cast, infertility, erectile disfunction, rheumatoid arthritis, angina, low vision (<6/18, >3/60)
IV 0.24-0.36 Amputated arm, below-the-knee amputation, deafness, congestive heart failure, drug dependence, Parkinson disease, tuberculosis
V 0.36-0.50 Bipolar affective disorder, rectovaginal fistula, mild mental retardation, neurological sequelae of malaria
VI 0.50-0.70 AIDS cases not on antiretriviral drugs, Alzheimer and other dementias, blindness, paraplegia, Down syndrome,
VII 0.70-1.00 Active psychosis (schizophrenia), severe depression, severe migraine, quadriplegia, terminal stage cancer
¹ Based on average severity weight globally for both sexes and all ages in the GBDS 2004 update ² Conditions are listed in the disability class for their global average weight. Most conditions will
have distributions of severity spanning more than one disability class, potentially up to all seven
Two methods are commonly used to formalize social preferences for different states of health. Both involve asking people to make judgements about the trade-off between quantity and quality of life. This can be expressed as a trade-off in time (how many years lived with a given disability a person would trade for a fixed period of perfect health) or a trade-off between persons (whether the person would prefer to save 1 year of life for 1,000 perfectly healthy individuals or 1 year of life for perhaps 2,000 individuals in a worse health state). The DALY approach which is the basis of the GBDS currently in use has been much criticised because the method presupposes that life years of disabled people are worth less

11
than life years of people without disabilities (1,5,9). The GBDS for example developed a protocol based on the person trade-off method. In a formal exercise involving health workers from all regions of the world, the severity of a set of 22-indicator disabling conditions - such as blindness, depression, and conditions that cause pain - was weighted between 0 (perfect health) and 1 (equivalent to death). These weights were then grouped into seven classes where class 1 has a weight between 0 and 0.02 and class VII a weight between 0.70 and 1 (Table 2). In the protocol, a life year for 1,000 healthy people has been set as equally valuable as one life year for (1,5):
• 9,524 people with quadriplegia; • 2,660 blind people; • 1,686 people with Down’s syndrome without cardiac malformation; • 1,499 deaf people; • 1,236 infertile people.
WHO has announced changes to such approach.
Classification for estimating mortality and disability
Deaths were classified using a tree structure, in which the first level of disaggregation comprises three broad cause categories of diseases (1,9,14,16):
• Group I: communicable diseases, perinatal, and nutritional conditions; • Group II: non-communicable diseases; • Group III: injuries.
Each group was then subdivided into categories: for example, cardiovascular
diseases and malignant neoplasms are two subcategories of group II. Beyond this level, there are two further disaggregation levels such that 107 individual causes from the ninth revision of the ICD (ICD-9) can be listed separately. Consistent with the goal of providing disaggregated estimates of BoD to assist priority setting in the health sector, estimates were prepared by age and sex and for eight broad geographic regions of the world: Established Market Economies, Formerly Socialist Economies of Europe, China, India, Latin America and the Caribbean, Middle-Eastern Crescent, Other Asia and Islands, and sub-Saharan Africa (1,9).
The disabilities in a particular class differ in kind (for example, blindness versus paralysis) but were considered to be of equal severity. Each participant then voted on the weight to be assigned to the entire class, not to individual disabilities, and the class was weighted according to the average vote. It is important to note that many disabling conditions lead to two or more distinct disabilities, which may be classified in more than one class of severity (9,11,24).
There is surprisingly wide agreement between cultures on what constitutes a severe or a mild disability. For example, a year lived with blindness appears to most people to be a more severe disability than a year lived with watery diarrhoea, while quadriplegia is regarded as more severe than blindness. These judgements must be made formal and explicit if they are to be incorporated into measurements of BoD (1,9,14).
When one would like to perform calculation of YLD, he/she will need to find the actual list of disability weights. In the GBDS 2004 update publication is stated that the authors used for the weight factor the weights listed in Annex Table A6 of a
12
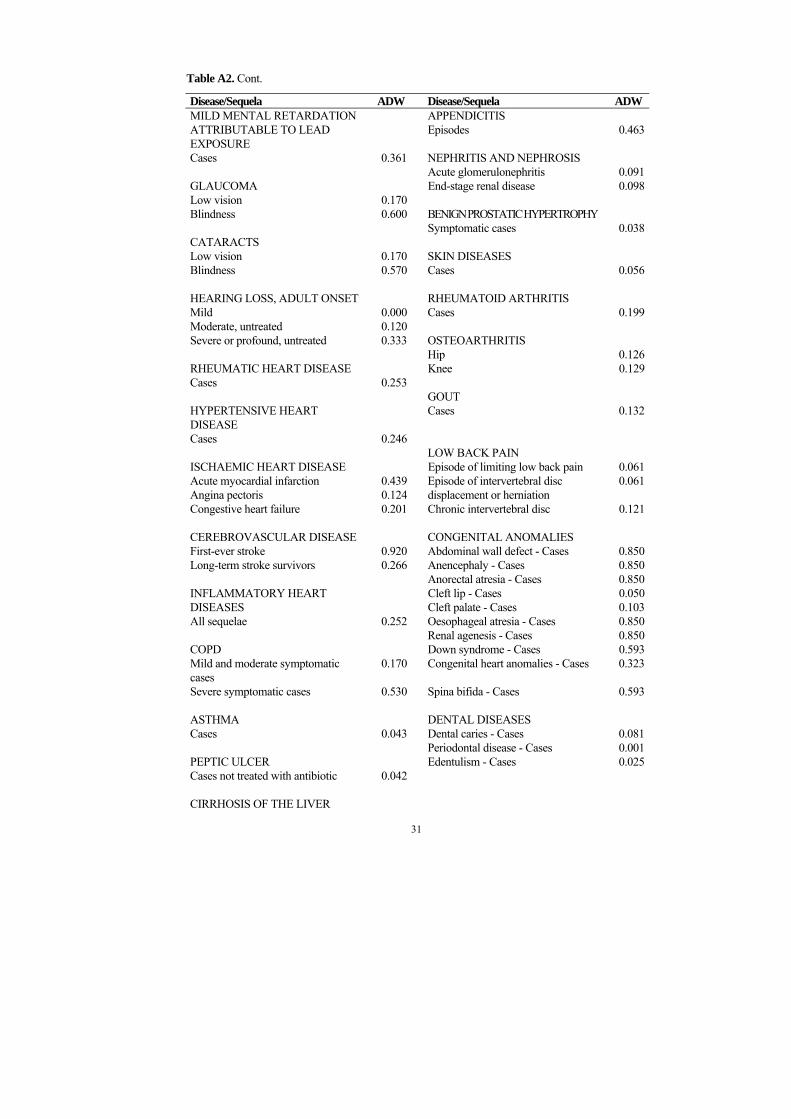
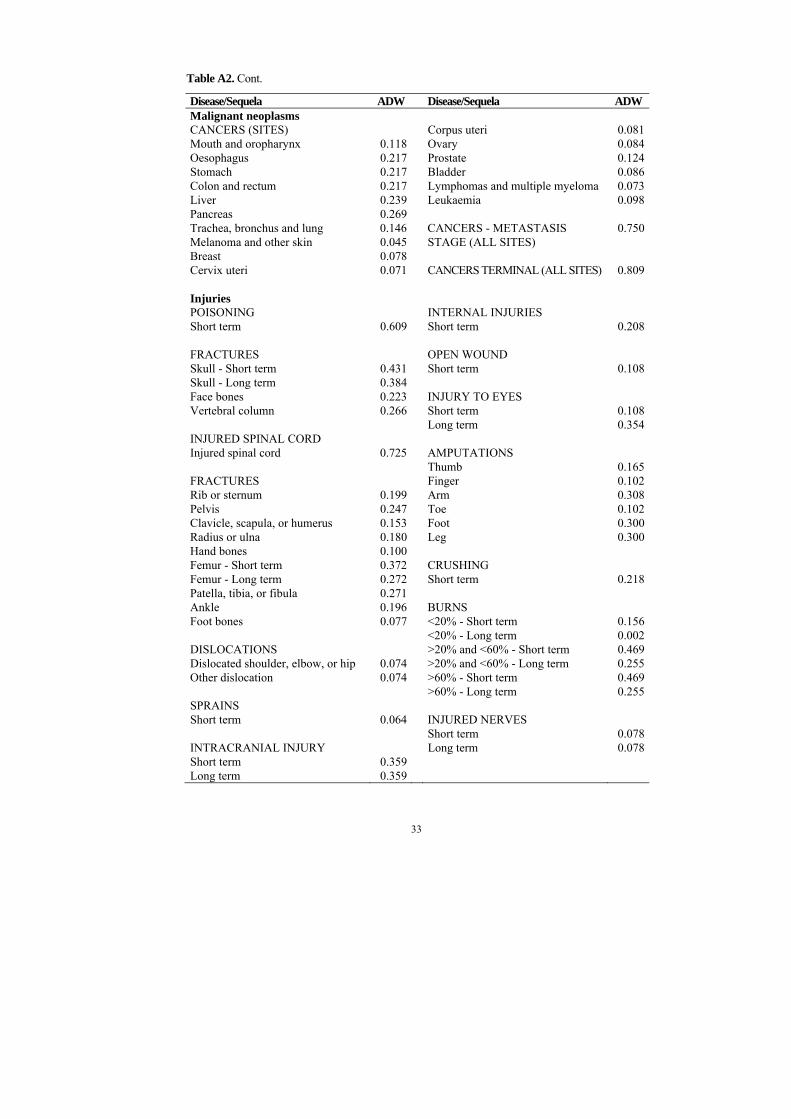
publication of Mathers et al (7). The same table could be obtained as special WHO document available on the Internet (25), while more detailed table, including weights according to age, is available on special WHO web page on the Internet (20,26). For the purposes of this module an adapted table presenting average disability weights for diseases and conditions including cancers and injuries is available in Appendix (Appendix, Table A2).
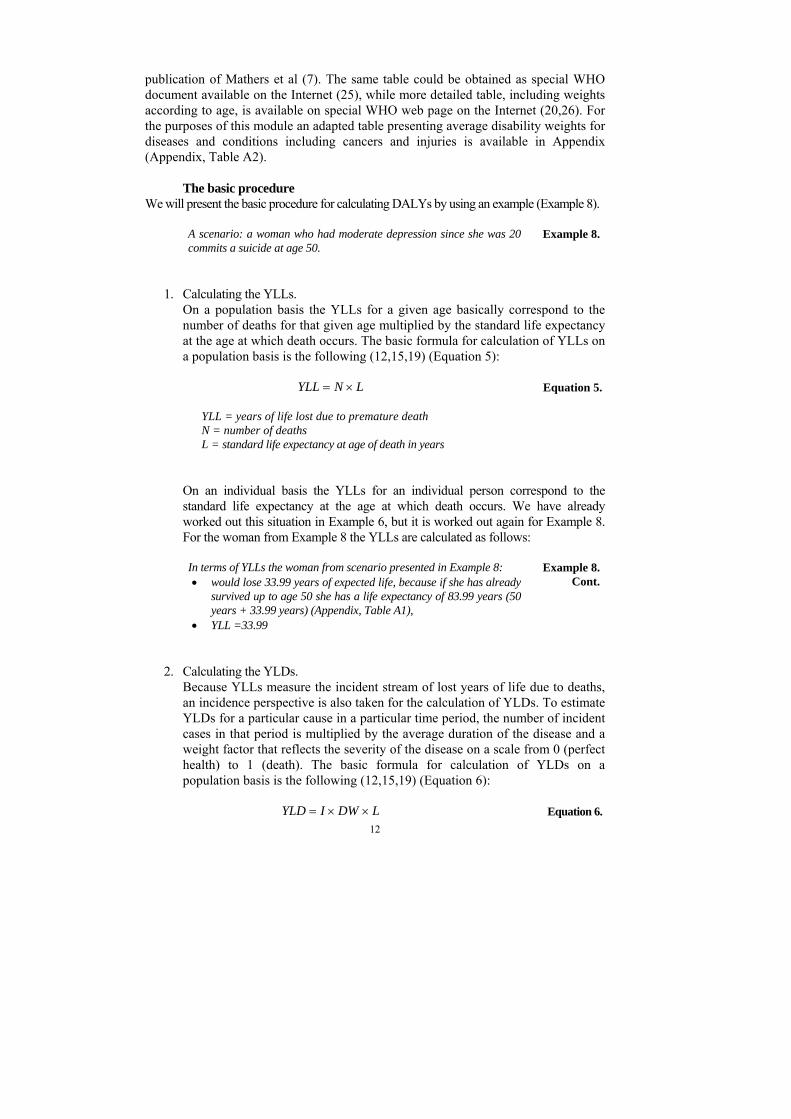
The basic procedure We will present the basic procedure for calculating DALYs by using an example (Example 8).
A scenario: a woman who had moderate depression since she was 20 commits a suicide at age 50.
Example 8.
1. Calculating the YLLs. On a population basis the YLLs for a given age basically correspond to the number of deaths for that given age multiplied by the standard life expectancy at the age at which death occurs. The basic formula for calculation of YLLs on a population basis is the following (12,15,19) (Equation 5):
LNYLL ×= Equation 5.
YLL = years of life lost due to premature death N = number of deaths L = standard life expectancy at age of death in years
On an individual basis the YLLs for an individual person correspond to the standard life expectancy at the age at which death occurs. We have already worked out this situation in Example 6, but it is worked out again for Example 8. For the woman from Example 8 the YLLs are calculated as follows:
In terms of YLLs the woman from scenario presented in Example 8: • would lose 33.99 years of expected life, because if she has already
survived up to age 50 she has a life expectancy of 83.99 years (50 years + 33.99 years) (Appendix, Table A1),
• YLL =33.99
Example 8. Cont.
2. Calculating the YLDs. Because YLLs measure the incident stream of lost years of life due to deaths, an incidence perspective is also taken for the calculation of YLDs. To estimate YLDs for a particular cause in a particular time period, the number of incident cases in that period is multiplied by the average duration of the disease and a weight factor that reflects the severity of the disease on a scale from 0 (perfect health) to 1 (death). The basic formula for calculation of YLDs on a population basis is the following (12,15,19) (Equation 6):
LDWIYLD ××= Equation 6.

13
YLD = years lost due to disability I = number of incident cases DW= disability weight L = average duration of the case until remission or death (years)
On an individual basis the basic formula for calculation of YLDs is the following (Equation 7):
LDWYLD ×= Equation 7.
YLD = years lost due to disability DW= disability weight L = duration of the case until remission or death (years)
For the woman from Example 8 the YLDs are calculated as follows: In terms of YLDs: • her disability is weighted to 0.350 (disability weight for moderate
depressive episode) (Appendix, Table A2), • it lasts for 30 years (50-20 years), • YLD = (20×0) + (30×0.350) = 10.50 years
Example 8. Cont.
3. Calculating DALYs. At the end the YLLs and the YLDs are summed up according to Equation 4. For the woman from Example 8 the DALYs are calculated as follows: DALY = 33.99 + 10.50 = 44.49 The burden of disease in this case in terms of DALYs is 44.49 years.
Example 8. Cont.
Procedures considering additional social preferences
Before presenting procedures of calculation of DALYs that consider additional social preferences their main characteristics are briefly discussed.

14
Additional basic social preferences – discounting and age weighting Major characteristics of additional social preferences are:
1. Discounting. Discounting means that future gains and losses are counted less than if they had occurred today. The years lost in the future are discounted, so that years lost now are worth more than years lost in the future. This is a standard procedure and common practice in economics when it comes to valuing material goods, and in the DALY calculations a discount rate of 3% per year is used (5,8,9,16,27).
The innovative GBDS for example calculated the total sum of the combined loss of all premature deaths that occurred in the world in 1990 and the loss of healthy life from disability in future years from specific diseases arising in that year (28). The study used all possible data sources of recorded causes of death and prevalence and incidence of disease, as well as expert judgment when data were not available (8).
Individuals commonly discount future benefits against current benefits similarly to the way that they may discount future dollars against current dollars. Whether a year of healthy life, like a dollar, is also deemed to be preferable now rather than later, is a matter of debate among economists, medical ethicists, and public health planners, since discounting future health affects both measurements of disease burden and estimates of the cost-effectiveness of an intervention (3,12). There are arguments for and against discounting. In the GBDS, for example, future life years were discounted by 3% per year. This means that a year of healthy life bought for 10 years hence is worth around 24% less than one bought for now, as discounting is represented as an exponential decay function. Another effect is that it reduces the value of interventions, especially preventive, that provide benefits largely in the future, such as vaccinating against hepatitis B, which may prevent thousands of cases of liver cancer, but some decades later (1,9,11,12).
2. Age weighting. Another characteristic of the DALY measure is that years lost due to premature deaths or disability could give different values at different ages. These differences in values are introduced in DALY calculations by what is called “age weights”'. The age weight used in the DALY calculations is obtained from a scale where the value of a year lost rises steeply from zero at birth to a maximum at 25 years of age, and then decreases progressively in older ages (Figure 8). From the Figure 8 it could be seen that the relative value of a life year is below 1 for the children under 10, and for the persons more than about 55 years of age.
Because of weighting the value of the lifetime the years of life in childhood and old age are counted less because of social roles vary with age and social value of that time may be different i.e. “young, and often elderly, depend on the rest of society for physical, emotional and financial support” (3,5,24). This means that if a newborn girl dies, 32.5 weighted years are lost, if she dies at age 30, 29 weighted years are lost, and at age 60, 12 weighted years are lost (8). For males, the above figures will be slightly lower, because their shorter life expectancy is taken into consideration. Another example is that living with disability, e.g. blindness, for a person aged 80 years is considered “less bad” than living with blindness for a 25-year old individual (1,5,9,16,24).

15
Figure 8. Relative values of a year of life. Adapted from the World Bank development report
1993 (9).
If individuals are forced to choose between saving a year of life for a 2-year old and saving it for a 22-year old, most prefer to save the 22-year old one. A range of studies confirms this broad social preference to weight the value of a year lived by a young adult more heavily than one lived by a very young child, or an older adult. Adults are widely perceived to play a critical role in the family, community, and society. It was for these reasons that the GBDS incorporated age weighting into the DALYs. It was assumed that the relative value of a year of life rises rapidly from birth to a peak in the early twenties, after which it declines steadily (1,3,8).
Calculation of DALYs with discounting When 3% discounting and uniform age weights are considered, the formulas for calculating YLLs (Equation 8) and YLDs (Equation 9) on the population basis are the following (19,29):
( )L03.0e103.0NYLL −−= Equation 8.
YLL = years of life lost due to premature death N = number of deaths L = standard life expectancy at age of death in years
( )03.0
e1IDWYLDL03.0−−
= Equation 9.
YLD = years lost due to disability I = number of incident cases DW= disability weight L = average duration of the case until remission or death (years)

16
Detailed presentation of this procedure is out of the scope of this module.
Calculation of DALYs with discounting and age weighting When non-zero discounting and age weighing are considered, the formulas for calculating YLLs (Equation 10) and YLDs (Equation 11) on an individual basis are the following (12,19,29):
( )
( )( )[ ]( )( )[ ]
( )[ ]( )[ ]
( )⎥⎦⎤
⎢⎣⎡ −
−+
⎥⎥⎥⎥⎥
⎦
⎤
⎢⎢⎢⎢⎢
⎣
⎡
−+−−
−++−
+= −
+−
++−
rLar
aLr
2
rae1
rK1
1are
1aLre
rKCeYLL
β
β
β β
β
Equation 10
YLL = years of life lost due to premature death K = age-weighting modulation constant (e.g. K=1) C = adjustment constant for age weights (GBDS standard value is 0.1658) r = discount rate (GBDS standard value is 0.03) a = age of death (years) β�= age-weighting constant (GBDS standard value is 0.04) L = standard life expectancy at age of death (years)
( )
( )( )[ ]( )( )[ ]
( )[ ]( )[ ]
( )⎪⎪
⎭
⎪⎪
⎬
⎫
⎪⎪
⎩
⎪⎪
⎨
⎧
⎥⎦⎤
⎢⎣⎡ −
−+
⎥⎥⎥⎥⎥
⎦
⎤
⎢⎢⎢⎢⎢
⎣
⎡
−+−−
−++−
+= −
+−
++−
rLar
aLr
2
rae1
rK1
1are
1aLre
rKCeDWYLL
β
β
β β
β
Equation 11.
YLD = years lost due to disability DW= disability weight K = age-weighting modulation constant (e.g. K=1) C = age-weighting correction constant (GBDS standard value is 0.1658) r = discount rate (GBDS standard value is 0.03) a = age of onset β�= parameter from the age-weighting function (GBDS standard value is 0.04) L = duration of disability (years)
Detailed presentation of this procedure is out of the scope of this module since it is very complicated and a separate module is needed to present it. For all who want to study this procedure in more details, a paper by Fox-Rushby and Hanson (12), is recommended where also the formulas in Excel programme for calculation of YLLs and YLDs are given.
These formulas have also been programmed into calculation spreadsheet templates for calculation of DALYs on a population basis (19,29), available at the WHO web site (20,30).

17
Sensitivity analysis
To gauge the impact of changing these social choices on the final measures of BoD, the GBDS assessments were recalculated with alternative age weighting and discount rates, and with alternative methods for weighting the severity of disabilities. Overall, the rankings of diseases and the distribution of burden by broad cause groups are largely unaffected by age weighting and only slightly affected by changing the method for weighting disability. Changes to the discount rate, by contrast, may have a more significant effect on the overall results. Changes in the age distribution of burden, in turn, affect the distribution by cause, as communicable and perinatal conditions are most common in children while non-communicable diseases are most common in adults. The most significant effect of changing the discount and age weights is a reduction in the importance of several psychiatric conditions (1,11,24).
However, sensitivity analysis has shown that the results of the GBDS are not greatly affected by these social preferences. Another problem is that the GBDS calculates DALY on data, which on some continents are of poor quality. Especially for the disability calculations, the data is of varied quality in different regions, e.g. Sub-Saharan Africa, and for different disease conditions, e.g. depression (8,11).
Controversies and criticism Some critical articles on the DALY approach have questioned both the validity of the results as well as the underlying value-judgements (5,24,27). In the Journal of Health Economics Anand and Hanson argues that: “the conceptual and technical basis for DALYs is flawed, and that the assumptions and value judgements underlying it are open to serious question” (24).
According to some authors, the DALY concept has “the potential to revolutionize the way in which we measure the impact of disease, how we choose interventions, and how we track the success or failure of our intervention (31,32). Furthermore, DALYs are considered to be an “advancement” over other composite indicators, such as QALYs, because the value choices incorporated in the DALYs are made explicit: “The black box of the decision-maker’s relative values is then opened for public scrutiny and influence” (24). Yassin (33), pointed out several advantages for using DALY in studies of health inequalities:
• the DALY is the only measure that can infuse information about non-fatal health outcomes into debates of health inequalities,
• DALY uncouples social and epidemiological assessment of health inequalities from advocacy,
• the DALY can measure the magnitude of premature death and non-fatal health outcomes attributable to proximal biological causes, including diseases and injuries or attributable to more distal causes such as poor living standards, tobacco use or socio-economic determinants,
• the DALY is a stable measure that can be used for purposes of comparisons either between different communities or between different points of time.
Jankovic (3), emphasized that DALY measurement of clinical outcomes and
cost-effectiveness analyses allows existing or prospective interventions to be judged both in terms of cost-effectiveness, and their relative impact in reducing the BoD and

18
ill-health. DALY as a composite indicator is a useful analytical tool for health policy-makers and analysts in priority setting and resource allocation in health systems providing unique and desirable health information on non-fatal health outcomes that is essential for determining appropriate health research priorities, too (3).
The DALY measure has been criticized because of the four built-in social preferences:
• different weights for sexes, • different age weights, • discounting future years lost, and • severity weighting of disabilities.
Many argue that life years for men and women should be given the same weight. However, as has been described above the difference is small and only gives a slightly greater value for diseases that affect females. Some people argue that all years lost should be given the same value independently of the age at which the years are lost. Others argue that discounting years is wrong, because they value the current and the future years equally. In a complex measure like DALY, the built-in social preferences may conceal issues of inequity. The most difficult part of any approach combining data on quality of life and length of life is how to measure the quality of life. Many philosophical questions as well as questions regarding the limits of natural sciences arise. The first requirement of a valid measurement is that one knows what is being measured. The concept of quality of life is, however, vaguely defined, and different people as well as different cultures may have very different opinions on the main elements of a good life (5,16).
The approach has been criticized for violating the principle of treating people equally and for discriminating the young, the elderly, future generations (future health benefits), the disabled, and the women (5,16,24).
Use of DALYs This approach increased the validity of comparisons of the burden of different diseases between world regions and countries over time. In fact, the World Bank and the World Health Organization (WHO) were the first institutions to use the DALY measures to compare the BoD in different regions of the world and thereby the value and effectiveness of different health interventions and changes in living conditions. It became possible to estimate and compare the cost of avoiding the loss of a DALY for each intervention (4,8,9).
Prior to the GBDS, which began in 1992, there had been no comprehensive efforts to provide comparable regional and global estimates and projections of the causes of loss of health and disease and injury burden in populations based on a common methodology and denominated in a common metric comparable across populations and over time (1,9).
One of the major goals of the GBDS was to facilitate the inclusion of non-fatal illness/conditions and their long-term health consequences/outcomes (mental and musculoskeletal disorders, blindness etc.) into debates on international health policy, beside the causes of death and mortality data. In addition, there was a need to quantify the BoD using a measure that could then be used for cost-effectiveness analysis. The GBDS method quantifies not merely the number of deaths but also the impact of premature death

19
and disability in a population, combining these measures into a single unit of measurement of the overall BoD in the population - the DALY. DALYs allow the losses or the BoD from the premature death and nonfatal consequences of over 100 diseases and injuries to be expressed in the same unit. The study also presented the first global and regional estimates of disease and injury burden attributable to certain risk factors for disease, such as tobacco, alcohol, poor water and sanitation, and unsafe sex. The method uses 107 diagnoses, covering all conceivable causes of death and 95% of all possible causes of disability (1).
The methods of the GBDS 1990 created a common metric system to estimate the health loss associated with morbidity and mortality. It generated widely published findings and comparable information on disease and injury incidence and prevalence for all world regions. It also stimulated numerous national studies of BoD. These results have been used by governments and non-governmental agencies to inform priorities for research, development, policies and funding. In 2000, the WHO began publishing regular GBDS updates for the world and 14 regions. These revisions were aided by methodological improvements and more extensive data collection that covered key aspects of the global BoD, including mortality estimation, cause of death analysis, and measurement and valuation of functional health status. Standardized concepts and approaches to comparative risk assessment were applied for over 25 risk factors (10,11).
Conclusion Bearing its inherent weaknesses in mind, DALY is still a very useful measure, because it is the first comprehensive attempt made to summarise the world's burden of injury, disease and premature death. It has initiated a debate and new research to find even better complex indicators for global comparisons (34). The DALY measure is useful to describe the disease burden across the world and to make projections for the future. At present, many countries are exploring the possibility of using DALYs as a measure of trends in disease burden and as a tool for cost-effectiveness studies and priority setting (8,32).
In 1999 WHO has started to include the DALY measure in their annual reports. This allows for refinement of the results from the initial study because of new health data. From the year 2000, they also included a DALE, disability-adjusted life expectancy, which was renamed as the more cheery HALE, health-adjusted life expectancy, in 2002. This measure is based on life expectancy at birth, but includes an adjustment for the time spent in poor health. It is the equivalent of the number of years a newborn can expect to live in full health, based on current statistics of mortality and morbidity. In Japan, for instance, the HALE is 72 years, while in Afghanistan only 35 years. Many find this a measure that is instinctively easier to understand compared to DALY (3,8).

20
CASE STUDY
A scenario In a heavy frontal car collision of two cars 7 people are involved. In the first car a 4-member family dies, while in the second car 3 young people are heavily injured. The sequelae of a car collision for every participant are presented in Table 3. Table 3. The sequelae of a car collision for every participant with their weights. Participant Sequela Disability
weight CAR 1 1. 36 years of age father dies 1 2. 29 years of age mother dies 1 3. 7 years of age
daughter dies 1
4. 2 years of age son dies 1 CAR 2 5. 27 years of age man Injured spinal cord (lifelong) 0.725 6. 25 years of age
woman Intracranial injury - short term (½ year) 0.359 7. 22 years of age
woman Fractured ribs (¼ year) 0.199
Calculation (basic procedure) In continuation we will calculate the DALYs for this car accident. In Table 4 is presented calculation of elements of DALYs - YLLs and YLDs - and the final result (DALYs). Table 4. Elements of calculation of DALYs and final result. Participant YLLs YLDs DALYs 1. 44.58 years LE 2. 54.25 years LE 3. 75.97 years LE 4. 78.36 years LE 5. 53.49 years LE × 0.725 = 38.78 6. 0.5 × 0.359 =0.18 7. 0.25× 0.199 =0.05 Total 253.16 39.01 292.17 LEGEND: DALY = disability adjusted life years; YLL = years of life lost due to premature death; YLD = years lost due to disability; LE = life expectancy In summary, altogether 292.17 DALYs are lost in this heavy frontal car collision.

21
EXERCISE Task 1
After introductory lecture, students carefully read the part on theoretical background of this module and corresponding recommended readings.
Task 2 Students consider following scenario: in the age 55 a previously healthy man is diagnosed a prostate cancer. After a surgery and radiotherapy he is in remission for 15 years. In the age of 70 he is diagnosed a metastatic disease. He dies in the age of 75.
In groups of 2-3 in a process of calculation of DALYs students should follow the following steps:
• make graphical presentation (a sketch) of a time horizon for this case, • calculate DALYs4, • compare results to the results of other student groups.
Task 3 This task is based on the examples presented in the manual »Selecting an essential package of health services using cost-effectiveness analysis: a manual for professionals in developing countries« (35).
Let us imagine a 5-year old girl who falls sick with poliomyelitis at this age. Following scenarios are possible:
1. immediately after she contracts poliomyelitis at age 5, she dies, 2. after she contracts the disease at age 5 she lives unitil age 10 with a disability, 3. after she contracts the disease at age 5 she becomes permanently disabled over
her entire life span (77.95 years), 4. after she contracts the disease at age 5 she is in an acute phase of the disease
confined to bed for ½ month (disability weight 0.500). Afterwards she fully recovers. In a process of calculation of DALYs students (this task is to be done by every
student alone) should follow the following steps: • make graphical presentation (a sketch) of a time horizon for each of these
scenarios, • calculate DALYs (be careful in calculating YLLs and YLDs; help yourself
with graphical presentations) for each scenario5, • compare results to the results of other students.
4 Final result: 31.93 years 5 Final results:
Scenario 1: 77.95 years Scenario 1: 74.835 years Scenario 1: 28.764 years Scenario 1: 0.021 years

22
Task 4
This task is continuation of the Task 3 and is basing on working paper of Homedes (36). Let us imagine that in a particular community there are 20 girls who fall sick
with poliomyelitis at age 5: • 2 of them die immediately, • 2 die at age 10 after a 5-year period of disability, • 10 of them are permanently disabled, and • 6 recover completely after the ½ month acute phase of the disease.
Calculate the total number of DALYs lost due to poliomyelitis in this community6.
Task 5 Students first carefully study the data presented in Table 5. Table 5. Morbidity and mortality from ishaemic heart disease (heart attack), by the age of getting
heart attack and period of survival, in the population of the Region X in SEE, 2008.
Health outcome of the heart attack
Age group < 35 35-39 40-44 45-49 50-54 55-59 60-64 65 +
Dea
ths
No. of cases
9 14 16 13 12 10 8 7
YLL per case
40 35 30 25 20 15 10 5
Disa
bilit
y (w
eight
0.3
) No. of cases
9 14 16 13 12 10 8 7
Years of survival
40 35 30 25 20 15 10 5
Afterwards they should consider following tips:
• they discuss what these data present, • they calculate BoD (expressed as DALYs) using the data from the Table 5, • they should use the basic formula for a simple way of calculation, without age-
weighting and discounting, • they should compare the results7, • if possible, students should calculate DALYs for various diseases and injuries
causing disability and/or premature death, using official data from their own countries or local communities.
6 Final result: 593.336 years 7 Final result: 2,808 years

23
Task 6 This task is comprised of following steps:
• on PubMed Central students should try to find papers using DALYs as summary measure of BoD,
• they should analyze the ratio DALYs calculated according to basic method: DALYs calculated using discounting or/and age weighting,
• they should critically discuss the pros and contras of these different methods.
REFERENCES 1. Murray CJL, Lopez AD. Assessing health needs: the Global Burden of Disease Study. In:
Detels R, McEwen J, Beaglehole R, Tanaka H, editors. Oxford Textbook of Public Health - Fourth edition. New York: Oxford University Press Inc.; 2004. p.243-54.
2. Atanackovic-Markovic Z, Bjegovic V, Jankovic S, et al. The burden of disease and injury in Serbia. Serbian Burden of Disease study - an EU funded project managed by the European Agency for Reconstruction. Belgrade: Ministry of Health of the Republic of Serbia; 2003.
3. Jankovic S. Summary measures of population health and their relevance for health policy. In: Galan A, Scintee G, editors. Public Health Strategies. A handbook for teachers, researchers, health professionals and decision makers. Lage: Hans Jacobs Publishing Company; 2005. p.190-207. Available from URL: http://www.snz.hr/ph-see/publications.htm. Accessed: August 14, 2009.
4. Tulchinsky TH, Varavikova EA. Measuring and evaluating the health of a population. In: Tulchinsky TH, Varavikova EA. The New Public Health. An Introduction for the 21st century. San Diego: Academic Press; 2000. p.113-68.
5. Arnesen TM, Norheim OF. Disability Adjusted Life Years - possibilities and problems. National Institute of Public Health, Oslo, Norway. Available from URL: http://iier.isciii.es/supercourse/lecture/lec2911/index.htm. Accessed: April 8, 2009.
6. World Health Organization. About the Global Burden of Disease (GBD) project [homepage on the Internet]. Available from URL: http://www.who.int/healthinfo/global_burden_disease/about/en/index.html. Accessed: August 14, 2009.
7. Mathers CD, Lopez AD, Murray CJL. The burden of disease and mortality by condition: data, methods and results for 2001. In: Lopez AD, Mathers CD, Ezzati M, Murray CJL, Jamison DT, eds. Global burden of disease and risk factors. New York, Oxford University Press; 2006. p.45-240. Available from URL: http://www.dcp2.org/pubs/GBD. Accessed: August 26, 2009.
8. Lindstrand A, Bergstrom S, Rosling H, Rubenson B, Stenson B, Tylleskar T. Global health - an introductory textbook. Copenhagen: Narayana Press; 2008.
9. The World Bank. The World Bank development report 1993. Investing in Health. New York, NY: Oxford University Press; 1993. Available from URL: http://www-wds.worldbank.org/external/default/main?pagePK=64193027&piPK=64187937&theSitePK=523679&menuPK=64187510&searchMenuPK=64187283&siteName=WDS&entityID=000009265_3970716142319. Accessed: August 14, 2009.
10. World Health Organization. Global burden of disease study. Study overview. Available from URL: http://www.who.int/healthinfo/global_burden_disease/GBD_2005_study/en/index.html Accessed: April 16, 2009.
11. World Health Organization. Global Burden of Disease 2004 Update. Geneva: World Health Organization; 2004. Available from URL:

24
http://www.who.int/healthinfo/global_burden_disease/GBD_report_2004update_full.pdf. Accessed: August 14, 2009.
12. Fox-Rushby JA, Hanson K. Calculating and presenting disability adjusted life years (DALYs) in cost-effectiveness analysis. H Health Economics and Financing Programme, Health Policy Unit, London School of Hygiene and Tropical Medicine, London, UK. Available from URL: http://heapol.oxfordjournals.org/cgi/reprint/16/3/326. Accessed: April 15, 2009.
13. Stibich M. Disability Adjusted Life Years - DALYs - Measuring Suffering. Available from URL: http://longevity.about.com/od/longevity101/g/dalys.htm Accessed: April 18, 2009.
14. Galan A. Disability-Adjusted Life Years: A Method for the analysis of the burden of disease. In: Bjegović V, Donev D, editors. Health systems and their evidence based development. A handbook for teachers, researchers, health professionals and decision makers. Lage: Hans Jacobs Publishing Company; 2004. p.140-50. Available from URL: http://www.snz.hr/ph-see/publications.htm. Accessed: August 14, 2009.
15. World Health Organization. Metrics: Disability-Adjusted Life Year (DALY) - quantifying the burden of disease from mortality and morbidity. Available from URL: http://www.who.int/healthinfo/global_burden_disease/metrics_daly/en/index.html Accessed: April 16, 2009.
16. Holden B. DALYs and disagreement. Available from URL: http://blog.givewell.net/?p=269 Accessed: April 20, 2009.
17. Somerford P, Katzenellenbogen J, Western Australian Burden of Disease Study: Disability-Adjusted Life Years: Technical overview. Perth: Department of Health; 2004. Available from URL: http://www.health.wa.gov.au/publications/documents/BOD/BOD9.pdf. Accessed: April 9,2009.
18. World Health Organization. Global Burden of Disease (GBD). Available from URL: http://www.who.int/healthinfo/global_burden_disease/en/index.html Accessed: April 12, 2009.
19. Prüss-Üstün A, Mathers C, Corvalan C, Woodward A. Introduction and methods: assessing the environmental burden of disease at national and local levels. WHO Environmental Burden of Disease Series, No. 1. Geneva: World Health Organization; 2003. Available from URL: http://www.who.int/quantifying_ehimpacts/publications/9241546204/en/index.html. Accessed: August 26, 2009.
20. World Health Organization. National tools [homepage on the Internet]. Available from URL: http://www.who.int/healthinfo/global_burden_disease/tools_national/en/. Accessed: August 26, 2009.
21. World Health Organization. National tools. National burden of disease supplementary files. Standard life table. Available from URL: http://www.who.int/healthinfo/bodreferencestandardlifetable.xls. Accessed: August 26, 2009.
22. Murray CJ. Quantifying the burden of disease: the technical basis for disability-adjusted life years. Bull World Health Organ. 1994;72:429-445. Available from URL: http://www.pubmedcentral.nih.gov/articlerender.fcgi?tool=pubmed&pubmedid=8062401. Accessed: August 26, 2009.
23. Los Angeles County Department of Health Services, UCLA Center for Health Polocy Research. The burden of disease in Los Angeles County. Available from URL: www.lapublichealth.org/epi/reports/dburden.pdf. Accessed: August 26, 2009.
24. Anand S, Hanson K. Disability adjusted life years: a critical review. Journal of Health Economics, 1997;16:658-702.
25. World Health Organization. Global burden of disease 2004 update: disability weights for diseases and conditions. Geneva: World Health Organization; 2004. Available from URL: http://www.who.int/healthinfo/global_burden_disease/GBD2004_DisabilityWeights.pdf. Accessed: August 26, 2009.
25
26. World Health Organization. National tools [homepage on the Internet]. Available from URL: http://www.who.int/healthinfo/bodreferencedisabilityweights.xls. Accessed: August 26, 2009.
27. World Health Organization. Global Burden of Disease (GBD) 2005 study [homepage on the Internet]. Available from URL: http://www.who.int/healthinfo/global_burden_disease/GBD_2005_study/en/index.html Accessed: April 12, 2009.
28. Murray CJL, Lopez AD, editors. The Global Burden of Disease: a comprehensive assessment of mortality and disability from diseases, injuries, and risk factors in 1990 and projected to 2030. Global Burden of Disease and Injury Series, Vol. 1. Cambridge, MA: Harvard University Press; 1996.
29. World Health Organization, Global Program on Evidence for Health Policy. National burden of disease studies: a practical guide. Geneva: World Health Organization; 2001. Available from URL: http://www.who.int/healthinfo/nationalburdenofdiseasemanual.pdf. Accessed: August 25, 2009.
30. World Health Organization. DALY calculation template. Available from URL: http://www.who.int/healthinfo/bodreferencedalycalculationtemplate.xls. Accessed: August 26, 2009.
31. Foege W. Preventive medicine and public health. Journal of American Medical Association, 1994;271:1704-5.
32. Bobadilla JL, Cowley P, Musgrove P, Saxenian H. Design, Content and Financing of an Essential National Package of Health Services. The World Bank Group Private and Public Initiatives: Working Together in Health and Education. The World Bank, March 17,1995:1-10. Available at: http://www.worldbank.org/html/extdr/hnp/health/hlt_svcs/pack1.htm Accessed: Jan. 11, 2004.
33. Yassin K, Galan A. Inequalities in Health as Assessed by the Burden of Disease Method - Case Study. In: Bjegović V, Donev D, eds. Health systems and their evidence based development. A handbook for teachers, researchers, health professionals and decision makers. Lage: Hans Jacobs Publishing Company, 2004:163-9.
34. Murray CJ, Lopez AD. Progress and directions in refining the global burden of disease approach: a response to Williams. Health Economics. 2000;9:69-82.
35. Brenzel L. Selecting an essential package of health services using cost-effectiveness analysis: a manual for professionals in developing countries. Washington, DC, Boston, MA: The World Bank, Population, Health and Nutrition Department; Harvard School of Public Health, Department of Population Studies and International Health; 1993. Available from URL: http://www.hsph.harvard.edu/ihsg/publications/pdf/No-5.PDF. Accessed: August 31, 2009.
36. Homedes N. The disability-adjusted life year (DALY): definition, measurement and potential use. Human Capital Development and Operations Policy Working Paper. Washington DC: The World Bank; 1995. Avalible from URL: http://www-wds.worldbank.org/external/default/WDSContentServer/WDSP/IB/1996/07/01/000009265_3970311114344/Rendered/PDF/multi0page.pdf. Accessed: August 31, 2009.
RECOMMENDED READINGS 1. Jankovic S. Summary measures of population health and their relevance for health policy.
In: Galan A, Scintee G, editors. Public Health Strategies. A handbook for teachers, researchers, health professionals and decision makers. Lage: Hans Jacobs Publishing Company; 2005. p.190-207. Available from URL: http://www.snz.hr/ph-see/publications.htm. Accessed: August 14, 2009.

26
2. Murray CJ. Quantifying the burden of disease: the technical basis for disability-adjusted life years. Bull World Health Organ. 1994;72:429-445. Available from URL: http://www.pubmedcentral.nih.gov/articlerender.fcgi?tool=pubmed&pubmedid=8062401. Accessed: August 26, 2009.
3. Murray CJL, Lopez AD. Assessing health needs: the Global Burden of Disease Study. In: Detels R, McEwen J, Beaglehole R, Tanaka H, editors. Oxford Textbook of Public Health - Fourth edition. New York: Oxford University Press Inc.; 2004. p.243-54.
4. Prüss-Üstün A, Mathers C, Corvalan C, Woodward A. Introduction and methods: assessing the environmental burden of disease at national and local levels. WHO Environmental Burden of Disease Series, No. 1. Geneva: World Health Organization; 2003. Available from URL: http://www.who.int/quantifying_ehimpacts/publications/9241546204/en/index.html. Accessed: August 26, 2009.
5. World Health Organization, Global Program on Evidence for Health Policy. National burden of disease studies: a practical guide. Geneva: World Health Organization; 2001. Available from URL: Available from URL: http://www.who.int/healthinfo/nationalburdenofdiseasemanual.pdf. Accessed: August 25, 2009.

27
APPENDIX Table A1. Standard life expectancy table. Adapted from World Health Organization (21).
Sex Sex Sex Age Males Females Age Males Females Age Males Females
0 80,00 82,50 34 46,55 49,36 68 15,15 17,90 1 79,36 81,84 35 45,57 48,38 69 14,36 17,05 2 78,36 80,87 36 44,58 47,41 70 13,58 16,20 3 77,37 79,90 37 43,60 46,44 71 12,89 15,42 4 76,38 78,92 38 42,61 45,47 72 12,21 14,63 5 75,38 77,95 39 41,63 44,50 73 11,53 13,85 6 74,39 76,96 40 40,64 43,53 74 10,85 13,06 7 73,39 75,97 41 39,67 42,57 75 10,17 12,28 8 72,39 74,97 42 38,69 41,61 76 9,62 11,60 9 71,40 73,98 43 37,72 40,64 77 9,08 10,93
10 70,40 72,99 44 36,74 39,68 78 8,53 10,25 11 69,40 72,00 45 35,77 38,72 79 7,99 9,58 12 68,41 71,00 46 34,81 37,77 80 7,45 8,90 13 67,41 70,01 47 33,86 36,83 81 7,01 8,36 14 66,41 69,01 48 32,90 35,88 82 6,56 7,83 15 65,41 68,02 49 31,95 34,94 83 6,12 7,29 16 64,42 67,03 50 30,99 33,99 84 5,68 6,76 17 63,42 66,04 51 30,06 33,07 85 5,24 6,22 18 62,43 65,06 52 29,12 32,14 86 4,90 5,83 19 61,43 64,07 53 28,19 31,22 87 4,56 5,43 20 60,44 63,08 54 27,26 30,29 88 4,22 5,04 21 59,44 62,10 55 26,32 29,37 89 3,88 4,64 22 58,45 61,12 56 25,42 28,46 90 3,54 4,25 23 57,46 60,13 57 24,52 27,55 91 3,30 3,98 24 56,46 59,15 58 23,61 26,65 92 3,05 3,71 25 55,47 58,17 59 22,71 25,74 93 2,80 3,43 26 54,48 57,19 60 21,81 24,83 94 2,56 3,16 27 53,49 56,21 61 20,95 23,95 95 2,31 2,89 28 52,50 55,23 62 20,09 23,07 96 2,14 2,71 29 51,50 54,25 63 19,22 22,20 97 1,97 2,53 30 50,51 53,27 64 18,36 21,32 98 1,80 2,36 31 49,52 52,29 65 17,50 20,44 99 1,63 2,18 32 48,53 51,31 66 16,71 19,59 100 1,46 2,00 33 47,54 50,34 67 15,93 18,74

28
Table A2. Average disability weights (ADW) for diseases and conditions including cancers and injuries. Adapted from World Health Organization8 (25,29).
Disease/Sequela ADW Disease/Sequela ADW Diseases and conditions except cancers and injuriesTUBERCULOSIS DIARRHOEAL DISEASES Cases 0.271 Diarrhoeal diseases - episodes 0.105 SYPHILIS PERTUSSIS Congenital syphilis 0.315 Episodes 0.137 Primary 0.015 Encephalopathy 0.452 Secondary 0.048 Tertiary - Neurologic 0.283 POLIOMYELITIS Poliomyelitis - Cases - lameness 0.369 CHLAMYDIA Ophthalmia neonatorum 0.180 DIPHTHERIA Cervicitis 0.049 Episodes 0.231 Neonatal pneumonia 0.280 Neurological complications 0.078 Pelvic inflammatory disease 0.329 Myocarditis 0.323 Ectopic pregnancy 0.549 Tubo-ovarian abscess 0.548 MEASLES - EPISODES Chronic pelvic pain 0.122 Measles - Episodes 0.152 Infertility 0.180 Symptomatic urethritis 0.067 TETANUS Epididymitis 0.167 Episodes 0.638 GONORRHOEA BACTERIAL MENINGITIS, Ophthalmia neonatorum 0.180 MENINGOCOCCAEMIA Corneal scar - Blindness 0.600 Streptococcus pneumoniae - Episodes 0.615 Corneal scar - Low vision 0.233 Haemophilus influenzae - Episodes 0.616 Cervicitis 0.049 Neisseria meningitidis - Episodes 0.615 Meningococcaemia without 0.152 Pelvic inflammatory disease 0.169 meningitis - Episodes Ectopic pregnancy 0.549 Deafness 0.229 Tubo-ovarian abscess 0.548 Seizure disorder 0.100 Chronic pelvic pain 0.122 Motor deficit 0.381 Infertility 0.180 Mental retardation 0.459 Symptomatic urethritis 0.067 Epididymitis 0.167 HEPATITIS B AND HEPATITIS C Stricture 0.151 Hepatitis B - Episodes 0.075 Hepatitis C - Episodes 0.075 HIV Cases 0.135 MALARIA AIDS cases not on ART 0.505 Episodes 0.191 AIDS cases on ART 0.167 Anaemia 0.012 Neurological sequelae 0.471
8 Only average disability weights are given in this table. Many of sequelas varies with age, and
many varies also with treatment. For details please see special WHO document available on the Internet (25), and a special WHO web page on the Internet (20,26).

29
Table A2. Cont.
Disease/Sequela ADW Disease/Sequela ADW TRYPANOSOMIASIS Cotemporaneous cognitive deficit 0.006 Episodes 0.350 Cognitive impairment 0.463 Intestinal obstruction 0.024 CHAGAS DISEASE Infection 0.000 TRICHURIASIS Cardiomyopathy without congestive 0.062 High intensity infection 0.000 heart failure Cotemporaneous cognitive deficit 0.006 Cardiomyopathy with congestive heart
0.270 Massive dysentery syndrome 0.116
Failure Cognitive impairment 0.024 Megaviscera 0.240 HOOKWORM DISEASE - SCHISTOSOMIASIS ANCYLOSTOMIASIS AND Infection 0.005 NECATORIASIS Advanced renal disease 0.104 High intensity infection 0.006 Advancerd hepatic disease 0.104 Anaemia 0.024 Cognitive impairment 0.024 LEISHMANIASIS Visceral 0.243 LOWER RESPIRATORY Cutaneous 0.023 INFECTIONS Episodes 0.279 LYMPHATIC FILARIASIS Chronic sequelae 0.099 Hydrocele >15 cm 0.073 Bancroftian lymphoedema 0.106 UPPER RESPIRATORY Brugian lymphoedema 0.116 INFECTIONS Episodes 0.000 ONCHOCERCIASIS Pharyngitis 0.070 Blindness 0.594 Itching 0.068 OTITIS MEDIA Low vision 0.170 Episodes 0.023 Deafness 0.229 LEPROSY Cases 0.000 MATERNAL HAEMORRHAGE Disabling leprosy 0.152 Episodes 0.000 Severe anaemia 0.093 DENGUE Dengue fever 0.197 MATERNAL SEPSIS Dengue haemorrhagic fever 0.545 Episodes 0.000 Infertility 0.180 JAPANESE ENCEPHALITIS Episodes 0.616 HYPERTENSIVE DISORDERS OF Cognitive impairment 0.468 PREGNANCY Neurological sequelae 0.379 Episodes 0.000 TRACHOMA OBSTRUCTED LABOUR Blindness 0.581 Episodes 0.000 Low Vision 0.170 Stress incontinence 0.025 Rectovaginal fistula 0.430 ASCARIASIS High intensity infection 0.000

30
Table A2. Cont.
Disease/Sequela ADW Disease/Sequela ADW ABORTION UNIPOLAR DEPRESSION Episodes 0.000 DISORDERD Infertility 0.180 Mild depressive episode 0.140 Reproductive tract infection 0.067 Moderate depressive episode 0.350 Severe depressive episode 0.760 OTHER MATERNAL Dysthymia 0.140 CONDITIONS Stress incontinence 0.025 BIPOLAR DISORDER Cases 0.367 LOW BIRTH WEIGHT - ALL SEQUELAE SCHIZOPHRENIA All sequelae 0.106 Cases 0.528 BIRTH ASPHYXIA AND BIRTH EPILEPSY TRAUMA - Cases 0.113 All sequelae 0.372 ALCOHOL USE DISORDERS PROTEIN-ENERGY Cases 0.134 MALNUTRITION Wasting 0.053 ALZHEIMER AND OTHER Stunting 0.002 DEMENTIAS Developmental disability 0.024 Cases 0.666 IODINE DEFICIENCY PARKINSON DISEASE Total goitre rate (G1 + G2) 0.000 Cases 0.351 Mild developmental disability 0.006 Cretinoidism 0.255 MULTIPLE SCLEROSIS Cretinism 0.804 Cases 0.411 VITAMIN A DEFICIENCY DRUG USE DISORDERS Xerophthalmia 0.000 Cases 0.252 Corneal scar 0.277 POST-TRAUMATIC STRESS IRON-DEFICIENCY ANAEMIA DISORDER Mild 0.000 Cases 0.105 Moderate 0.011 Severe 0.090 OBSESSIVE-COMPULSIVE Very severe 0.249 DISORDERS Cognitive impairment 0.024 Cases 0.127 DIABETES MELLITUS PANIC DISORDER Cases 0.015 Cases 0.165 Diabetic foot 0.133 Neuropathy 0.072 INSOMNIA (PRIMARY) Retinopathy - Blindness 0.552 Cases 0.100 Amputation 0.102 MIGRAINE Cases 0.029
31
Table A2. Cont.
Disease/Sequela ADW Disease/Sequela ADW MILD MENTAL RETARDATION APPENDICITIS ATTRIBUTABLE TO LEAD Episodes 0.463 EXPOSURE Cases 0.361 NEPHRITIS AND NEPHROSIS Acute glomerulonephritis 0.091 GLAUCOMA End-stage renal disease 0.098 Low vision 0.170 Blindness 0.600 BENIGN PROSTATIC HYPERTROPHY Symptomatic cases 0.038 CATARACTS Low vision 0.170 SKIN DISEASES Blindness 0.570 Cases 0.056 HEARING LOSS, ADULT ONSET RHEUMATOID ARTHRITIS Mild 0.000 Cases 0.199 Moderate, untreated 0.120 Severe or profound, untreated 0.333 OSTEOARTHRITIS Hip 0.126 RHEUMATIC HEART DISEASE Knee 0.129 Cases 0.253 GOUT HYPERTENSIVE HEART DISEASE
Cases 0.132
Cases 0.246 LOW BACK PAIN ISCHAEMIC HEART DISEASE Episode of limiting low back pain 0.061 Acute myocardial infarction 0.439 Episode of intervertebral disc 0.061 Angina pectoris 0.124 displacement or herniation Congestive heart failure 0.201 Chronic intervertebral disc 0.121 CEREBROVASCULAR DISEASE CONGENITAL ANOMALIES First-ever stroke 0.920 Abdominal wall defect - Cases 0.850 Long-term stroke survivors 0.266 Anencephaly - Cases 0.850 Anorectal atresia - Cases 0.850 INFLAMMATORY HEART Cleft lip - Cases 0.050 DISEASES Cleft palate - Cases 0.103 All sequelae 0.252 Oesophageal atresia - Cases 0.850 Renal agenesis - Cases 0.850 COPD Down syndrome - Cases 0.593 Mild and moderate symptomatic cases
0.170 Congenital heart anomalies - Cases 0.323
Severe symptomatic cases 0.530 Spina bifida - Cases 0.593 ASTHMA DENTAL DISEASES Cases 0.043 Dental caries - Cases 0.081 Periodontal disease - Cases 0.001 PEPTIC ULCER Edentulism - Cases 0.025 Cases not treated with antibiotic 0.042 CIRRHOSIS OF THE LIVER

32
Symptomatic cases 0.330
33
Table A2. Cont.
Disease/Sequela ADW Disease/Sequela ADW Malignant neoplasms CANCERS (SITES) Corpus uteri 0.081 Mouth and oropharynx 0.118 Ovary 0.084 Oesophagus 0.217 Prostate 0.124 Stomach 0.217 Bladder 0.086 Colon and rectum 0.217 Lymphomas and multiple myeloma 0.073 Liver 0.239 Leukaemia 0.098 Pancreas 0.269 Trachea, bronchus and lung 0.146 CANCERS - METASTASIS 0.750 Melanoma and other skin 0.045 STAGE (ALL SITES) Breast 0.078 Cervix uteri 0.071 CANCERS TERMINAL (ALL SITES) 0.809 Injuries POISONING INTERNAL INJURIES Short term 0.609 Short term 0.208 FRACTURES OPEN WOUND Skull - Short term 0.431 Short term 0.108 Skull - Long term 0.384 Face bones 0.223 INJURY TO EYES Vertebral column 0.266 Short term 0.108 Long term 0.354 INJURED SPINAL CORD Injured spinal cord 0.725 AMPUTATIONS Thumb 0.165 FRACTURES Finger 0.102 Rib or sternum 0.199 Arm 0.308 Pelvis 0.247 Toe 0.102 Clavicle, scapula, or humerus 0.153 Foot 0.300 Radius or ulna 0.180 Leg 0.300 Hand bones 0.100 Femur - Short term 0.372 CRUSHING Femur - Long term 0.272 Short term 0.218 Patella, tibia, or fibula 0.271 Ankle 0.196 BURNS Foot bones 0.077 <20% - Short term 0.156 <20% - Long term 0.002 DISLOCATIONS >20% and <60% - Short term 0.469 Dislocated shoulder, elbow, or hip 0.074 >20% and <60% - Long term 0.255 Other dislocation 0.074 >60% - Short term 0.469 >60% - Long term 0.255 SPRAINS Short term 0.064 INJURED NERVES Short term 0.078 INTRACRANIAL INJURY Long term 0.078 Short term 0.359 Long term 0.359