Measuring Temperature in Emission Testing Micro-Chambers
19
NISTIR 8155 Measuring Temperature in Emission Testing Micro-Chambers Evaluation of Potential Temperature Measurement Methods for ASTM WK40293: Standard Test Method for Estimating Chemical Emissions from Spray Polyurethane Foam (SPF) Insulation Using Micro-Scale Environmental Test Chambers Dustin Poppendieck Edwin Guillermo Havishk Tripathi This publication is available free of charge from: https://doi.org/10.6028/NIST.IR.8155
Transcript of Measuring Temperature in Emission Testing Micro-Chambers
NISTIR 8155
Measuring Temperature in Emission Testing Micro-Chambers
Evaluation of Potential Temperature Measurement Methods for ASTM WK40293: Standard Test Method for Estimating
Chemical Emissions from Spray Polyurethane Foam (SPF) Insulation Using Micro-Scale Environmental Test Chambers
Dustin Poppendieck Edwin Guillermo Havishk Tripathi
This publication is available free of charge from: https://doi.org/10.6028/NIST.IR.8155
NISTIR 8155
Measuring Temperature in Emission Testing Micro-Chambers
Evaluation of Potential Temperature Measurement Methods for ASTM WK40293: Standard Test Method for Estimating
Chemical Emissions from Spray Polyurethane Foam (SPF) Insulation Using Micro-Scale Environmental Test Chambers
Dustin Poppendieck Edwin Guillermo Havishk Tripathi
Energy and Environment DivisionEngineering Laboratory
This publication is available free of charge from: https://doi.org/10.6028/NIST.IR.8155
October 2016
U.S. Department of Commerce Penny Pritzker, Secretary
National Institute of Standards and Technology Willie May, Under Secretary of Commerce for Standards and Technology and Director
i
This publication is available free of charge from: https://doi.org/10.6028/N
IST.IR.8155
Abstract
ASTM subcommittee D22.05 Indoor Air Quality is developing WK40293: Standard Test Method for Estimating Chemical Emissions from Spray Polyurethane Foam (SPF) Insulation Using Micro-Scale Environmental Test Chambers. One of the key issues is determining the best method to accurately measure the temperature in the micro-chambers. Properly characterizing micro-chamber temperature is vital to obtain comparable emission data between different tests. Three methods of determining micro-chamber temperature with a thermocouple were investigated using two micro-chamber systems: 1) place the thermocouple in the airspace of a micro-chamber, 2) tape the thermocouple to the bottom of the air filled micro-chamber, 3) place the thermocouple in a micro-chamber filled 50 % to 75 % with water. The results show that air measurements (Method 1) are dependent upon the thermocouple placement due to the stratification present in both micro-chamber systems tested. Taping the thermocouple to the bottom of the micro-chamber (Method 2) resulted in average values that were similar to a water filled micro-chamber for one system, but not for the other. The air and tape methods resulted in 1 °C to 2 °C temperature cycles in one of the systems, but not in the other. The water method (3) consistently resulted in temperature data with the smallest standard deviation. As a result of these findings, the authors propose new prescriptive and performance text for temperature measurement in ASTM WK40293.

ii
This publication is available free of charge from: https://doi.org/10.6028/N
IST.IR.8155
Table of Contents
1. Introduction ____________________________________________________ 1
2. Methods _______________________________________________________ 22.1. Chamber A _________________________________________________________________ 3
2.2. Chamber B __________________________________________________________________ 4
3. Results and Discussion ____________________________________________ 43.1. Chamber A: Depth ___________________________________________________________ 4
3.2. Chamber A: Tape ____________________________________________________________ 6
3.3. Chamber A: Water ___________________________________________________________ 7
3.4. Chamber A: Summary ________________________________________________________ 9
3.5. Chamber B: Depth __________________________________________________________ 10
3.6. Chamber B: Tape ___________________________________________________________ 11
3.7. Chamber B: Water __________________________________________________________ 12
3.8. Chamber B: Summary _______________________________________________________ 13
4. Conclusions ___________________________________________________ 13
5. Proposed WK40293 Text _________________________________________ 14
6. Disclaimer ____________________________________________________ 15
7. Reference _____________________________________________________ 15

1
This publication is available free of charge from: https://doi.org/10.6028/N
IST.IR.8155
1. IntroductionCurrently, ASTM subcommittee D22.05 Indoor Air Quality is working to finalize WK40293: Standard TestMethod for Estimating Chemical Emissions from Spray Polyurethane Foam (SPF) Insulation Using Micro-Scale Environmental Test Chambers. One of the remaining issues in WK40293 is describing how toaccurately measure the temperature in the micro-chamber.
The temperature of the micro-chamber directly influences chemical emissions from tested materials. Previously published data (Poppendieck et al., 2016) show that concentrations of both Bis (2-Dimethylaminoethyl) ether (BDMAEE) and Tris-(1-chloro-2-propyl) phosphate (TCPP) vary logarithmically with temperature. Curve fits of four data points (28 °C to 60 °C) have r-squared values greater than 0.99. Table 1 illustrates the BDMAEE and TCPP concentration values using those curve fits near the proposed WK40293 temperature of 35 °C. The results demonstrate that a 2 °C error in temperature can result in a concentration that is 20 % off the true 35 °C value. An error of 4 °C could result in an error in the concentration measurement of up to 45 %. For comparability purposes, emission data from micro chambers need to be gathered at consistent temperatures. Properly characterizing micro-chamber temperature is therefore vital to obtain comparable emission data.
Table 1: Illustrative concentration temperature dependence of chemicals emitting from SPF in a 114 mL microchamber.
Temperature (°C)
BDMAEE (mg/m3)
Percentage of 35°C Concentration (%)
TCPP (mg/m3)
Percentage of 35°C Concentration (%)
33 102 82 178 80 34 112 91 199 89 35 123 100 223 100 36 136 110 251 112 37 150 121 281 126
Recent D22.05 deliberations have suggested three methods to determine micro-chamber temperature with a thermocouple: 1) place the thermocouple in the airspace of an empty, closed micro-chamber with airflow, 2) tape the thermocouple to the bottom of an empty, closed micro-chamber with airflow, and, 3) fill 75 % of the volume of the micro-chamber with water and place the thermocouple in the water of a closed micro-chamber with airflow. Water is a material with a high heat capacity and it has the effect of averaging temperature fluctuations due to depth and heating cycles.
There are two issues with the first method:
1. The micro-chamber temperature may vary as the micro-chamber heater turns on and off.2. The micro-chamber temperature may vary with depth. Hence, recorded temperatures may be
dependent upon the depth of the thermocouple.
There are three issues with the second method:
1. The micro-chamber temperature may vary as the micro-chamber heater turns on and off.2. The temperature at the bottom of the chamber may not adequately represent the temperature
of the airspace of the micro-chamber.3. Taping a thermocouple to different locations in a micro-chamber may result in different
temperature values.

2
This publication is available free of charge from: https://doi.org/10.6028/N
IST.IR.8155
There are two issues with the final method:
1. The water may require significant time to heat to a constant temperature.2. Water is being placed in chambers that have electrical connections, which could cause safety
issues or the equipment to malfunction. This issue is not directly addressed in this documentother than to recommend the micro-chambers be removed and filled with water external to thetesting system.
This document investigates these three measuring techniques for the two types of micro-chambers that are current being used to develop WK40293.
2. MethodsTwo types of micro-chambers were tested. The first system is referred to in this document as ChamberA and has four 114 mL cylindrical micro-chambers. The second system is referred to in this document asChamber B and has one 250 mL cylindrical micro-chamber with a conical top. Each system was testedusing type-K thermocouples. Four thermocouples were calibrated using a platinum resistancethermometer that has been calibrated to the NIST primary temperature standard. Temperature datawas averaged and recorded for each thermocouple every minute. The thermocouples were placed in awater filled beaker with a stir bar to demonstrate constancy for this analysis. The data (Table 2, Figure 1)demonstrate that the thermocouples produce readings within 0.1 °C of each other.
Table 2: Comparison of average thermocouple temperature data in a water filled beaker.
Thermocouple Count
(n) Average
(°C)
Standard Deviation
(°C)
Relative Standard
Deviation (%)
Maximum Temperature
Difference (°C) 1 308 24.80 0.02 0.09 0.12 2 308 24.88 0.02 0.07 0.11 3 308 24.93 0.02 0.07 0.11 4 308 24.86 0.02 0.07 0.11

3
This publication is available free of charge from: https://doi.org/10.6028/N
IST.IR.8155
Figure 1: Temperature from four thermocouples placed in a stirred water filled beaker. For comparability the vertical scale has the same net 3.5 °C span as the following figures.
2.1. Chamber A The temperature of each of four Chamber A micro-chambers was measured in three different ways: 1) with the thermocouple located at three different depths in an empty chamber with 50 mL/minairflow, 2) with the thermocouple taped to four locations in the bottom of the micro chamber with a50 mL/min airflow, and 3) with the thermocouple submerged in water (75 mL) with a 50 mL/minairflow. The Chamber A set point was 37 °C to account for the current 2 °C offset for this system.
For the depth experiments the chambers were divided into three zones. The probes of the thermocouples were placed in the middle of each zone, i.e., depths of 6 mm, 17 mm, and 29 mm (the chambers are 35 mm deep). The average flow through each micro-chamber was 50.0 mL/min, 48.6 mL/min, 20.9 mL/min and 47.7 mL/min. The low flow in the third chamber was likely due to a faulty o-ring.
For the taped experiments, the thermocouple was taped to four locations on the bottom of the micro-chamber (radius (r) of 22 mm): 1) center of the micro-chamber (r = 0 mm), 2) one third of the radius (r = 9 mm), 3) two thirds of the radius (r = 16 mm), and 4) the corner of the micro-chamber where the bottom and wall meet (r = 22 mm). The average flow through each micro-chamber was 53.8 mL/min, 52.9 mL/min, 50.0 mL/min and 52.8 mL/min.
For the water experiments, 75 mL of deionized water was poured into the micro-chambers external to the Chamber A system to avoid damaging the instrument’s electronics. The micro-chambers were carefully placed into the Chamber A system. Thermocouples were placed in the chamber at a depth above the bottom of the chamber, but deep enough so that the tips were fully submerged.

4
This publication is available free of charge from: https://doi.org/10.6028/N
IST.IR.8155
2.2. Chamber B The temperature of the Chamber B micro-chamber was measured in three different ways: 1) with the thermocouple located at three different depths in an empty chamber with 100 mL/min airflow, 2) with the thermocouple taped to three locations in the bottom of the micro chamber with a100 mL/min airflow, and 3) with the thermocouple submerged in water (100 mL) with a 100 mL/minairflow.
The temperature of each micro-chamber was measured at three different depths. The Chamber B set point was 39 °C to account for the current 4 °C offset for this system. The chamber’s depth of 53 mm was divided into three zones. The probes of the thermocouples were placed in the middle of each zone, i.e., depths of 9 mm, 27 mm, and 44 mm.
For the taped experiments, the thermocouple was taped to three locations on the bottom of a micro-chamber (radius (r) of 45 mm): 1) center of the micro-chamber (r = 0 mm), 2) one half of the radius (r = 22 mm), and 3) the corner of the micro-chamber where the bottom and wall meet (r = 45 mm). The average airflow through each micro-chamber was 100.0 mL/min.
For the water experiments, 100 mL of deionized water was poured into the micro-chamber external to the Chamber B system to avoid damaging the electronics. The micro-chamber was carefully placed into the Chamber B system. The thermocouple was placed in the chamber at a depth above the bottom of the chamber, but deep enough so that the tip was fully submerged.
3. Results and DiscussionBoth Chamber A and Chamber B micro-chambers were measured under three different conditions asdescribed above. This section describes the results for each system separately.
3.1. Chamber A: Depth During the depth experiments the measured temperatures in the Chamber A micro-chambers varied with chamber, depth and time. Averaged data are summarized in Table 3. There was greater than a 1 °C variation in the average temperature between:
1. The chambers at any depth.2. The minimum and maximum temperature in the micro-chamber during a power
cycle.3. The top 1/3 of the chamber and bottom 1/3 of the chamber.
At 35 °C there was an average temperature oscillation of roughly 1 °C over a 10 min timespan. (Figure 2). The worst case measurement would be to measure the air temperature in one chamber for 1 min at an arbitrary depth. One measured value could be up to 3 °C off another measured value at a different time in a different chamber (difference between minimum and maximum in Figure 2; maximum temperature difference in Table 3).
These results indicate that if air is to be used for a temperature measurement in Chamber A micro-chambers, a defined depth and averaging time is required.

5
This publication is available free of charge from: https://doi.org/10.6028/N
IST.IR.8155
Table 3: Data from Chamber A micro-chambers for thermocouple placed at various depths in air.
Chamber Depth (mm)
Count (n)
Average (°C)
Standard Deviation
(°C)
Relative Standard
Deviation (%)
Maximum Temperature
Difference (°C) 1 6 70 34.00 0.30 0.87 0.97 1 17 49 34.72 0.34 0.97 1.06 1 29 64 35.21 0.32 0.90 0.99 2 6 70 34.45 0.30 0.86 0.97 2 17 49 35.21 0.29 0.82 0.90 2 29 64 35.59 0.26 0.73 0.81 3 6 70 34.87 0.31 0.89 0.99 3 17 49 35.46 0.33 0.92 0.97 3 29 64 35.78 0.27 0.76 0.88 4 6 70 35.30 0.35 0.98 1.19 4 17 49 35.83 0.40 1.12 1.26 4 29 64 36.20 0.38 1.06 1.18
Figure 2: Temperature data in Chamber A micro-chambers for thermocouple placed at various depths in air. Left to Right: Depth 6 mm (prior to 12:45 PM), 17 mm (12:50 PM to 1:45 PM), and 29 mm (After 1:45 pm).

6
This publication is available free of charge from: https://doi.org/10.6028/N
IST.IR.8155
3.2. Chamber A: Tape Table 4 summarizes the measured temperatures at each location where the thermocouple was taped to the bottom of the Chamber A micro-chambers. One thermocouple was used in each chamber and moved sequentially through the radii (Figure 3). The Chamber A thermocouple at r = 16 mm was not effectively taped to the bottom and the data is not reported.
The largest variation in average temperature between the four taped positions in the four Chamber A micro-chambers was 0.4 °C (Chamber 4). This variation is smaller than the variation due to the heating cycle of the chambers which had a maximum temperature difference of 0.6 °C to 1.4 °C (Figure 3). The magnitude of the temperature cycle variation (Figure 3) was larger in the corners (1.0 °C) than the center of the chamber (0.6 °C). While the magnitude of temperature cycle is similar to what was monitored when the thermocouples were in the air rather than taped (Table 3), the thermocouples taped to the bottom gave more consistent results between radius (within 0.4 °C) than thermocouples placed in the airflow with changing depth (within 1.3 °C). When the thermocouples were placed cold into a micro-chamber, the temperature of the thermocouples rose 0.3 °C to 0.5 °C over 20 min before reaching a steady state performance.
As was highlighted with the Chamber A, r = 16 mm case, care must be taken to ensure all thermocouples are properly secured to the bottom of the micro-chamber. These results indicate that if taped thermocouples are to be used for a temperature measurement in Chamber A micro-chambers, a defined warmup time (20 min) and averaging time (at least 10 min) are required.
Table 4: Data from Chamber A micro-chambers for thermocouples taped to the bottom of the micro-chamber. The Chamber A thermocouple at r = 16mm was not effectively taped to the bottom and the data is not reported.
Chamber Radius (mm)
Count (n)
Average (°C)
Standard Deviation
(°C)
Relative Standard
Deviation (%)
Maximum Temperature
Difference (°C) 1 0 78 35.95 0.32 0.90 0.90 1 9 50 35.67 0.36 0.99 1.07 1 16 ND ND ND ND ND 1 22 47 35.64 0.39 1.09 1.18 2 0 78 35.93 0.22 0.61 0.63 2 9 50 35.75 0.39 1.10 0.74 2 16 75 35.93 0.24 0.68 0.79 2 22 47 35.79 0.37 1.03 1.10 3 0 78 35.83 0.23 0.64 0.67 3 9 50 36.02 0.27 0.74 0.81 3 16 75 36.02 0.22 0.63 0.72 3 22 47 36.00 0.34 0.93 1.00 4 0 78 35.91 0.46 1.29 1.41 4 9 50 36.31 0.36 0.99 1.15 4 16 75 36.22 0.35 0.96 1.10 4 22 47 35.92 0.38 1.07 1.14

7
This publication is available free of charge from: https://doi.org/10.6028/N
IST.IR.8155
Figure 3: Illustrative temperature data from a Chamber A micro-chamber for thermocouples taped to the bottom of the micro-chamber: 1) center of the micro-chamber (r = 0 mm), 2) one third of the radius (r = 9 mm) 3) two thirds of the radius (r = 16 mm), and 4) the corner of the micro-chamber where the bottom and wall meet (r = 22 mm).
3.3. Chamber A: Water To determine if water is an effective thermal mass to determine average values of temperature the chambers were filled with 75 mL distilled water and allowed to reach a steady state temperature. The thermocouples were placed in the chamber at a depth to be submerged but not touching the bottom. It took roughly one hour for the water to reach an equilibrium temperature (Figure 4).

8
This publication is available free of charge from: https://doi.org/10.6028/N
IST.IR.8155
Figure 4: Temperature data for four Chamber A micro-chambers filled with 75 mL of water.
The vertical axes on Figures 2, 3 and 4 are the same. Comparing the figures demonstrates the smaller variability in the measurements made in water compared to the air or tape methods. The standard deviation of the thermocouples in the water (Table 5, 0.03 °C to 0.04 °C) was an order of magnitude lower than when the chambers were measured with thermocouples in the air (0.50 °C to 0.67 °C) or taped to the bottom (0.27 °C to 0.63 °C). In addition, the difference between the maximum and minimum measured temperature in all the chambers was also lower for the water samples (0.33 °C to 0.45 °C) compared to the thermocouples in the air (1.82 °C to 2.52°C) or taped to the bottom (1.16 °C to 2.57 °C). This indicates that water is an effective thermal mass to average out the temperature fluctuations in the chamber.
The average tape values (average of all locations) were within 0.2 °C of the average water values for all four chambers. This is nearly equal to the variability between the thermocouples used (Table 2, 0.1 °C). The average air values (average value of all depths) were up to 0.7 °C cooler than the average water values for all four chambers. However, the average air values in the deepest zone (29 mm) were within 0.2 °C of the average value for water.

9
This publication is available free of charge from: https://doi.org/10.6028/N
IST.IR.8155
Table 5: Comparison of Chamber A temperature data for air (all zones combined), taped (all locations combined) and water methods.
Condition Chamber Count (n) Average (°C) Standard
Deviation (°C)
Max Temp Difference All Chambers (°C)
Air 1 184 34.61 0.61 2.19 Tape 1 250 35.51 0.63 2.50
Water 1 250 35.33 0.04 0.38 Air 2 184 35.06 0.57 1.99
Tape 2 250 35.85 0.31 2.14 Water 2 250 35.73 0.03 0.33
Air 3 184 35.34 0.50 1.82 Tape 3 250 35.97 0.27 1.16
Water 3 250 35.96 0.03 0.32 Air 4 184 35.75 0.55 2.52
Tape 4 250 36.09 0.42 2.57 Water 4 250 36.15 0.04 0.45
3.4. Chamber A: Summary
Overall, the data indicate that the three methods to measure the temperature in Chamber A micro-chambers can give similar average results when optimized, however each method has issues.
1) Measure in air at a depth of 29 mm. This requires accurate vertical placement of thethermocouple in the chamber. If the thermocouple slips the data could be up to 1 °C low. Inaddition, the data indicate there can be temperature differences of up to 2.5 °C due totemperature cycles, requiring averaging times of at least 10 min of data (preferably 30 minto get three cycles of data). A warmup time may be required.
2) Measure with the thermocouple taped to the bottom of the micro-chamber. For theChamber A micro-chamber it does not appear to matter where on the bottom thethermocouple is taped. Care must be taken to ensure the thermocouples do not slip out ofthe tape. A warmup time may be required. Finally, averaging times of at least 10 min of data(preferably 30 min to get three cycles of data) is required.
3) Measure with the thermocouple in 75 mL of water. This method gives the least variabilityin the data meaning the averaging time can be one cycle (10 min). However, using waterrequires a warm up time of 60 min and places water in the vicinity of electricity.
10
This publication is available free of charge from: https://doi.org/10.6028/N
IST.IR.8155
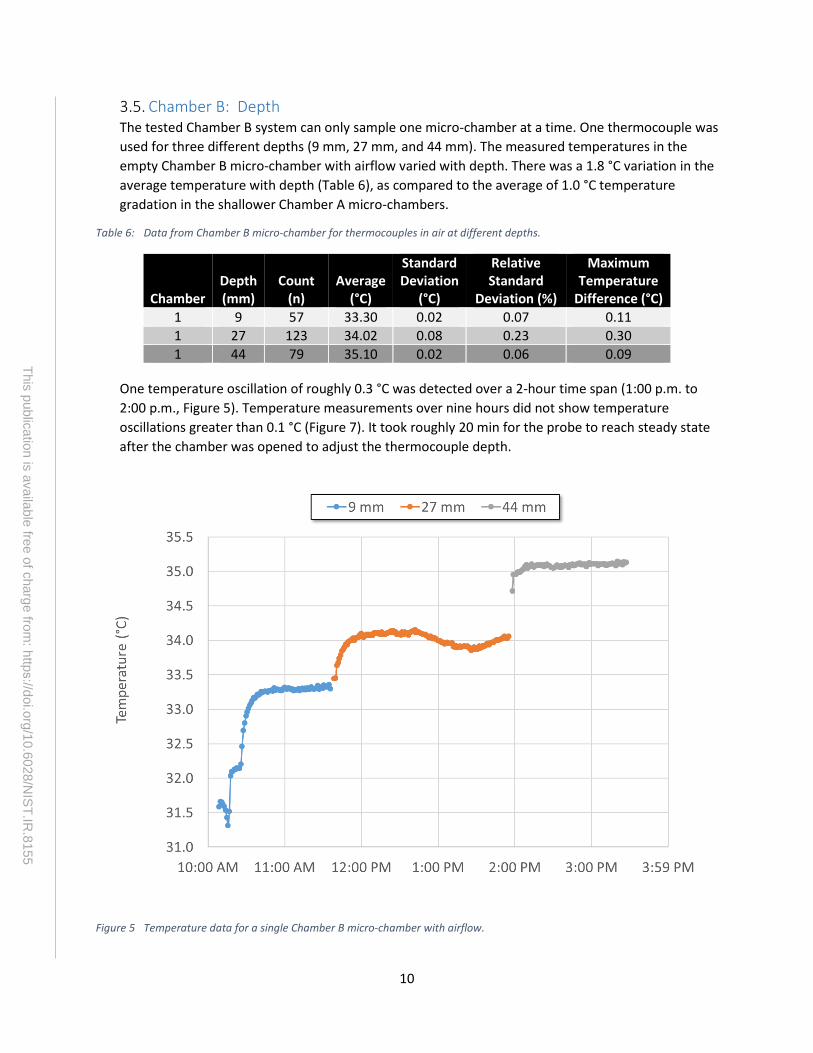
3.5. Chamber B: Depth The tested Chamber B system can only sample one micro-chamber at a time. One thermocouple was used for three different depths (9 mm, 27 mm, and 44 mm). The measured temperatures in the empty Chamber B micro-chamber with airflow varied with depth. There was a 1.8 °C variation in the average temperature with depth (Table 6), as compared to the average of 1.0 °C temperature gradation in the shallower Chamber A micro-chambers.
Table 6: Data from Chamber B micro-chamber for thermocouples in air at different depths.
Chamber Depth (mm)
Count (n)
Average (°C)
Standard Deviation
(°C)
Relative Standard
Deviation (%)
Maximum Temperature
Difference (°C) 1 9 57 33.30 0.02 0.07 0.11 1 27 123 34.02 0.08 0.23 0.30 1 44 79 35.10 0.02 0.06 0.09
One temperature oscillation of roughly 0.3 °C was detected over a 2-hour time span (1:00 p.m. to 2:00 p.m., Figure 5). Temperature measurements over nine hours did not show temperature oscillations greater than 0.1 °C (Figure 7). It took roughly 20 min for the probe to reach steady state after the chamber was opened to adjust the thermocouple depth.
Figure 5 Temperature data for a single Chamber B micro-chamber with airflow.

11
This publication is available free of charge from: https://doi.org/10.6028/N
IST.IR.8155
The data indicate that there is stratification in the chamber when air is flowing. Tests showed that when no flow was present in the empty chamber the variation with depth was up to 5°C (data not shown). Hence, WK40293 should require flow when measuring temperature.
3.6. Chamber B: Tape Three thermocouples were taped to the bottom of the Chamber B micro-chamber at three different radii (0 mm, 22 mm, and 45 mm). The chamber was operated at 100 mL/min. It took roughly 20 min for the probes to reach a steady state value (Figure 6).
There was a 0.7 °C difference (Table 7) between the center thermocouple (r = 0 mm) and the thermocouple in the corner of the micro-chamber where the bottom and wall meet (r = 45 mm). This temperature difference is greater than the 0.4 °C difference seen in the Chamber A micro-chambers.
The taped temperatures were 0.3 °C to 1.1 °C greater than the highest temperature measured in the air (44 mm, Table 6).
Table 7: Data from Chamber B micro-chamber for thermocouples taped to the bottom at different radii.
Chamber Radius (mm)
Count (n)
Average (°C)
Standard Deviation
(°C)
Relative Standard
Deviation (%)
Maximum Temperature
Difference (°C) 1 0 110 35.49 0.13 0.37 0.42 1 22 110 35.76 0.11 0.31 0.52 1 45 110 36.23 0.08 0.22 0.41
Figure 6 Temperature data for all tape locations for the Chamber B micro-chamber: 1) center of the micro-chamber (r = 0 mm), 2) one half of the radius (r = 22 mm) and 3) the corner of the micro-chamber where the bottom and wall meet (r = 44mm).

12
This publication is available free of charge from: https://doi.org/10.6028/N
IST.IR.8155
3.7. Chamber B: Water The average Chamber B water temperature measurement was 0.6 °C greater than the average air temperature measurement and 0.9 °C less than the average taped measurement (Table 8). The standard deviations of both the air and tape data were five to ten times larger than the water data. It took roughly 90 min for the water to reach a steady state temperature.
Table 8: Comparison of Chamber B temperature data for air (all depths), taped (all locations) and water.
Condition Count (n) Average (°C) Standard
Deviation (°C) Max Temp
Difference (°C) Air 259 34.20 0.66 1.93
Tape 330 35.73 0.27 1.07 Water 216 34.80 0.05 0.23
The average air temperature at a depth of 44 mm was measured twice (Figure 5 and Figure 7). For the second measurement (Figure 7), the data was collected immediately prior to the water measurement. The micro-chamber was measured empty with airflow overnight and at roughly 10 a.m., the chamber was filled with 75 mL of water.
Figure 7 Temperature Data for Chamber B micro-chamber. Orange data is measured at 44 mm in air with 100 mL/min flow. Blue data in water with 100 mL/min flow.
The average water temperature measurement was 0.2 °C greater than the average temperature at a depth of 44 mm in air for the consecutive measurement and 0.3 °C less for the first measurement

13
This publication is available free of charge from: https://doi.org/10.6028/N
IST.IR.8155
(Table 6 and Figure 5). These differences compare favorably with the Chamber A difference of 0.2 °C between the deepest air sampling position (29 mm) and water average. It should be noted that both of these comparisons are dependent upon the exact position of the thermocouple, which may not be repeatable user to user.
3.8. Chamber B: Summary
Overall, the data indicate that the three methods to measure the temperature in Chamber B micro-chambers give average results that vary by 1.5 °C. The following conclusions can be made about each method:
1) Measure in air at a depth of 44 mm. There was a 1.8 °C difference in temperature withdepth in the Chamber B micro-chamber. Measurements at the deepest depth (44 mm)resulted in temperature measurements that were closest to the measurements with water(within 0.3 °C). In addition, one standard deviation at this depth (0.02 °C) was less than thewater standard deviation (0.05 °C). This method requires accurate vertical placement of thethermocouple in the chamber. Unlike the Chamber A system there is no obvious cycling oftemperature, making the required averaging time less clear.
2) Don’t measure with the thermocouple taped to the bottom of the micro-chamber. For theChamber B micro-chamber none of the taped measurements were within 0.7 °C of thewater average temperature. Thermocouples taped to the corner read 1.4 °C greater thanthe water temperature.
3) Measure with the thermocouple in 75 mL of water. This method gives the least overallvariability in the data. However, using water requires a warm up time of 90 min and putswater in the proximity of electronics.
4. ConclusionsThe data gathered on both instruments allow the following conclusions:
1. Measure the temperature of each micro-chamber. The temperature output to the unit displaymay not be the actual temperature in the chamber. The Chamber A system operated 2 °C lowerthan the displayed temperature, while the Chamber B unit was 4 °C lower than the displayedtemperature. This may be due to the environmental conditions around the unit (e.g., if the unitis placed in a fume hood). Regardless, this indicates that WK40293 should require that thetemperature of the micro-chamber be independently measured. In addition, the Chamber Amicro-chambers are not at a consistent temperature within the same system. If thermocouplesare not placed in each micro-chamber for every test, the recorded value could be up to 1 °Cdifferent from the actual average value.
2. When measuring temperature with the thermocouple in air, place the thermocouple in thedeepest position with airflow averaging over at least three heating cycles. Placing athermocouple at an arbitrary depth in the micro-chamber will lead to variability in temperaturemeasurement. The Chamber A system had temperature variations with depth of greater than1.0 °C, while the variation in the Chamber B unit was nearly 2.0 °C. The temperaturestratification was worse when there was no flow in the micro-chamber. When the units were

14
This publication is available free of charge from: https://doi.org/10.6028/N
IST.IR.8155
measured with the thermocouple depth closest to the bottom, the measured temperatures were within 0.2 °C of the water temperature. This method requires accurate vertical placement of the thermocouple in the chamber, a warmup of two heating cycles or 20 min, and a long enough averaging time to ensure data is collected for at least three heating cycle.
3. Use thermocouples taped to the bottom of the micro chamber for the Chamber A system, butnot the Chamber B system. The location of the taped thermocouples in the Chamber A systemhad minimal impact on the measured temperature and the average taped values were verysimilar to the water values. In contrast, for the Chamber B system there was up to a 1.7 °Ctemperature difference for different locations, and the average taped values were all greaterthan the water values. For the Chamber A system this method requires a warmup of twoheating cycles and a long enough averaging time to ensure data is collected for at least threeheating cycle.
4. Use water filled micro-chambers to obtain data with the lowest standard deviation. Thestandard deviations in the water filled chambers were lower than for the taped and air methods.The water serves as a thermal mass that smooths out temperature variations in the system. Thismethod requires a 60-min warmup for the Chamber A system to reach steady state temperatureand a 90-min warmup period for the Chamber B system. This method has advantages ofsimplicity and repeatability in thermocouple placement, but also the danger of putting waternear electronic instruments.
5. Proposed WK40293 TextGiven these conclusions the authors propose the following prescriptive and performance text for section7.3.2 in WK40293:
Verify the interior temperature of each micro-scale chamber cell with a traceable device. The device used to measure temperature must have an accuracy of at least ± 0.1 oC between 30 °C and 40 °C.
Every three months remove each cell from the system and fill each cell with distilled or deionized water to between 50 % and 75 % of the cell volume. Place the water containing cells in the system and set the system to the prescribed test temperature of 35 °C. Insert the temperature device through the sampling port so that it is immersed in the water. The airflow through the chamber shall be set as described in section 7.4.3. Allow the chamber to equilibrate for at least 90 min. Determine the average cell temperature from at least five data points evenly spaced over a time that is equal to or greater than 10 min. Record the average chamber temperature and standard deviation to the nearest 0.1 °C. If the average temperature is not between 34.0 °C and 36.0 °C, the temperature control shall be rectified.
Prior to every experiment, determine the temperature of each cell using a traceable device and a method that meets the following performance requirements. The method must be verified in each cell in the system used in the experiments to produce an average value that is within ±0.5 °C of the most recent average water filled value measured as described above. The average value must be calculated from at least five data points evenly spaced over a time that is equal to or greater than 10 min. If the average temperature is not between 34.0 °C and 36.0 °C, the data shall not be used or, the data must be qualified with the statement that the test did not meet the quality criteria for temperature control.

15
This publication is available free of charge from: https://doi.org/10.6028/N
IST.IR.8155
Note 1: Other methods to measure cell temperature include placing a traceable device in the air space of the chamber or taping the device to the bottom of the chamber. Both methods are faster than measuring temperature with water filled cells, but result in greater standard deviations in measured values. All methods shall be performed with the airflow through the chamber set as described in section 7.4.3. Micro-scale chamber cells are stratified with respect to temperature. Devices in air shall be placed in the bottom 1/3 of the chamber to get values that represent the water determined values. The ability of temperature devices taped to or touching the bottom of the cell to represent the water determined values is dependent upon the chamber design. The heating and cooling cycle in some micro-scale chamber cells designs can result in 1 °C to 2 °C cycles (at 35 °C) when measuring with a traceable device in the air space of the chamber or taped to the bottom of the cell. The averaging time should be three times the temperature cycling time. Finally, each method requires time for the system and temperature measuring device to reach equilibrium prior to measurement (up to 20 min).
6. DisclaimerCertain commercial equipment, instruments, or materials are identified in this paper in order to specifythe experimental procedure adequately. Such identification is not intended to imply recommendation orendorsement by the National Institute of Standards and Technology, nor is it intended to imply that thematerials or equipment identified are necessarily the best available for the purpose.
7. ReferencePoppendieck, D., M. Gong and S. Emmerich (2016). Characterization of emissions from a spraypolyurethane foam: Final report to U.S. Consumer Product Safety Commission interagency agreementCPSC-i-14-0023. NIST.