Measuring Student Understanding of Genetics: Psychometric ...
125
Measuring Student Understanding of Genetics: Psychometric, Cognitive, and Demographic Considerations A Dissertation Presented by Robyn Tornabene to The Graduate School in Partial Fulfillment of the Requirements for the Degree of Doctor of Philosophy in Science Education Stony Brook University August 2018
Transcript of Measuring Student Understanding of Genetics: Psychometric ...

Measuring Student Understanding of Genetics:
Psychometric, Cognitive, and Demographic Considerations
A Dissertation Presented
by
Robyn Tornabene
to
The Graduate School
in Partial Fulfillment of the
Requirements
for the Degree of
Doctor of Philosophy
in
Science Education
Stony Brook University
August 2018
ProQuest Number:
All rights reserved
INFORMATION TO ALL USERSThe quality of this reproduction is dependent upon the quality of the copy submitted.
In the unlikely event that the author did not send a complete manuscriptand there are missing pages, these will be noted. Also, if material had to be removed,
a note will indicate the deletion.
ProQuest
Published by ProQuest LLC ( ). Copyright of the Dissertation is held by the Author.
All rights reserved.This work is protected against unauthorized copying under Title 17, United States Code
Microform Edition © ProQuest LLC.
ProQuest LLC.789 East Eisenhower Parkway
P.O. Box 1346Ann Arbor, MI 48106 - 1346
10843153
10843153
2018

Copyright by
Robyn Tornabene
2018

ii
Stony Brook University
The Graduate School
Robyn Tornabene
We, the dissertation committee for the above candidate for the
Doctor of Philosophy degree, hereby recommend
acceptance of this dissertation.
Ross H. Nehm, Ph.D.
Associate Professor, Department of Ecology and Evolution
Gregory Rushton, Ph.D.
Associate Professor, Department of Chemistry
John True, Ph.D.
Associate Professor, Department of Ecology & Evolution
Stephen Finch, Ph.D.
Professor, Department of Applied Mathematics and Statistics
This dissertation is accepted by the Graduate School
Charles Taber
Dean of the Graduate School

iii
Abstract of the Dissertation
Measuring Student Understanding of Genetics:
Psychometric, Cognitive, and Demographic Considerations
by
Robyn Tornabene
Doctor of Philosophy
in
Science Education
Stony Brook University
2018
Genetics is universally recognized as a core aspect of biological and scientific literacy.
Beyond genetics’ own role as a major unifying topic within the biological sciences,
understanding genetics is essential for understanding other integral ideas such as evolution and
development. Genetics understanding also underlies public decision making about modern
advances in health sciences and biotechnology and broader socio-scientific issues.
Consequently, educators have attempted to measure student and teacher understanding of this
domain. Using Rasch modeling--a superior but underutilized framework for instrument
evaluation--this dissertation explored psychometric, cognitive, and demographic aspects of
educational measurement in the field of genetics education in order to generate evidence-based
examples to illustrate how instruments can be more carefully developed and robustly evaluated.
The first study (Chapter 3) sought to expand the sources of evidence supporting validity
and reliability inferences produced by a relatively new concept inventory (the Genetic Drift
Inventory [GeDI]) designed for use in diagnosing undergraduate students’ conceptual
understanding of genetic drift. Concept Inventories (CIs) are commonly used tools for assessing
student understanding of normative (scientific) and non-normative (naive) ideas, yet the body of
empirical evidence supporting the inferences drawn from CI scores is often limited in scope and
remains deeply rooted in Classical Test Theory (CTT) despite the availability of more robust
Item Response Theory (IRT) and Rasch frameworks. Specifically, this study focused on: (1)
GeDI instrument and item properties as revealed by Rasch modeling, (2) item order effects on
response patterns, and (3) generalization to a new geographic sample. A sample of 336 advanced
undergraduate biology majors completed one of four randomly assigned and equivalent versions
of the GeDI that differed in presentation order of the GeDI item suites. Rasch analysis indicated
the GeDI was unidimensional, with good fit to the Rasch model. Items had high reliability and
were well matched to the ability of the sample. Person reliability was low. Rotating the GeDI’s
vignette-based item suites had no significant impact on overall scores, suggesting each vignette
functioned independently. Scores from this new sample from the Northeast United States were

iv
comparable to those from other geographic regions and provide evidence in support of score
generalizability. Suggestions for improvement include: (1) incorporation of additional items to
differentiate high-ability persons and improve person reliability, and (2) re-examination of items
with redundant or low difficulty levels. These results expand the range and quality of evidence in
support of validity claims and illustrate changes that are likely to improve the quality of the
GeDI (and other) evolution education instruments.
The second study (Chapter 4) sought to determine how situational features impact
inferences about participants’ understanding of Mendelian genetics. Understanding how
situational features of assessment tasks impact reasoning is important for many educational
pursuits, notably the selection of curricular examples to illustrate phenomena, the design of
formative and summative assessment items, and determination of whether instruction has
fostered the development of abstract schemas divorced from particular instances. To test for
context effects, an experimental research design was employed to measure differences in item
difficulty among items varying only in situational features (e.g., plant, animal, human, fictitious)
across five common genetics problem types. A multi-matrix test design was employed, and item
packets were randomly distributed to a sample of undergraduate biology majors (n=444). Rasch
analyses of participant scores produced good item fit, person reliability, and item reliability.
Surprisingly, no significant differences in performance occurred among the animal, plant, and
human item contexts, or between the fictitious and “real” item contexts. Also notable, incomplete
dominance problems proved to be more difficult than dominant-recessive problems, and
problems featuring homozygous parents were more difficult than those featuring heterozygous
parents. Tests for differences in performance between genders, among ethnic groups, and by
prior biology coursework revealed that none of these factors had a meaningful impact upon
performance or context effects. Thus some, but not all, types of genetics problem solving or item
formats are impacted by situational features.
Overall, substantial evidence was generated about how current knowledge in the field of
genetics education is measured and how measurement in this domain may be improved. The
studies included herein exemplify some ways in which new and existing instruments can be
examined to amass robust evidence for the quality of inferences generated by an instrument.
Only with rigorously evaluated instruments can the educational community be confident that
inferences about student learning are accurate and that consequent decisions are evidence-based.

v
Dedication Page
This work is dedicated to the teachers whose influence ultimately led me to seek this
degree: Olga Verzar who, through ballet, taught me the value of humble dedication and hard
work; Doris Akins whose extensive knowledge and passion for biology ignited my own
fascination; and Dr. Joanne M. Willey whose expertise in scientific research elevated my
academic aspirations and who directly encouraged me to pursue a Ph.D.
Through their individual examples of talent, ambition, confidence, and independence, and
through their high expectations and belief in my abilities, I leaned that I could set and achieve
higher goals than I ever thought possible.

vi
Table of Contents
Abstract of the Dissertation iii
Dedication Page v
Table of Contents vi
List of Tables viii
List of Figures ix
Preface x
Acknowledgments xi
Chapter 1. Literature- Genetics Education 1
1.1 Introduction 1
1.2 Challenges in learning genetics and solving genetics problems 1
1.3 Modelling as a means of improving genetics understanding 7
1.4 Argumentation in genetics education 8
1.5 Theoretical and empirical limitations of genetics education research and areas for future
research 9
1.6 Conclusion 13
1.7 References (Chapter 1) 14
Chapter 2. Psychometric Analysis Using Item Response Theory 26
2.1 Introduction 26
2.1 Instrument evaluation using Item Response Theory 26
2.3 Advantages of Rasch and IRT 27
2.4 Use of IRT in this project 31
2.5 References (Chapter 2) 31
Chapter 3. Testing Validity Inferences for Genetic Drift Inventory Scores Using Rasch
Modeling and Item Order Analyses 34
3.1 Introduction 34
3.2 Instrument evaluation using Item Response Theory 37
3.3 Additional relevant considerations for instrument evaluation 39
3.4 Methods 41

vii
3.5 Results 43
3.6 Discussion 49
3.7 Limitations and further research 51
3.8 References (Chapter 3) 52
Chapter 4. Testing the impact of surface features on students’ Mendelian genetics
understanding 57
4.1 Introduction 57
4.2 Research question 62
4.3 Methods 62
4.4 Results 67
4.5 Discussion 71
4.6 Limitations and further research 75
4.7 References (Chapter 4) 76
References 85
Appendix A - Overview of items used for study “Testing the impact of surface features on
students’ Mendelian genetics understanding” (Chapter 4) 102
Appendix B. Example Items Used for Study “Testing the impact of surface features on
students’ Mendelian genetics understanding” (Chapter 4) 106

viii
List of Tables
Table 3.1 Instruments measureing knowledge of evolutionary processes: Potential to elicit
normative and non-normative ideas about adaptive and non-adaptive evolution 36
Table 3.2 GeDI vignettes and associated items 37
Table 3.3 Summary of validity and reliability evidence for the GeDI. 41
Table 3.4 Design of GeDI forms 42
Table 3.5 GeDI Rasch fit properties 44
Table 3.6 Mean GeDI item measures and standard error by vignette rotation position 46
Table 3.7 Comparison of performancea on GeDI by form, course, and region 48
Table 3.8 GeDI item difficulty rank in initial and present administrations 48
Table 4.1 Recent assessments of genetic understanding that include the measurement of
transmission genetics 60
Table 4.2 Five types of Mendelian inheritance problems used in the study 64
Table 4.3 Example of variation in situational features for a Mendelian inheritance problem 65

ix
List of Figures
Figure 3.1 Wright map derived from Rasch analysis of GeDI responses 45
Figure 3.2 Position effects on GeDI item difficulty values 47
Figure 4.2 Boxplots comparing item difficulty by taxon featured in items 69
Figure 4.3 Boxplots comparing item difficulty by types of Mendelian inheritance problems 70
Figure 4.4 Boxplots comparing item difficulties by problem types and situational features 71
x
Preface
Genetics is universally recognized as a core aspect of biological and scientific literacy.
Consequently, educators have attempted to measure student and teacher understanding in this
domain. This dissertation explores psychometric, cognitive, and demographic aspects of
educational measurement in the field of genetics education in order to generate evidence-based
examples to illustrate how instruments can be more carefully developed and robustly evaluated.
Chapters 1 and 2 of this dissertation will serve to frame the work, and include,
respectively, a literature review on challenges to genetics problem solving and a description of
the Rasch methodology that was central to the psychometric evaluation of the instruments in the
study. Chapters 3 and 4 present two journal articles that detail investigations into psychometric,
cognitive, and demographic considerations for assessment of genetics understanding.
Specifically, Chapter 3 contains a study using Rasch methodology for psychometric evaluation
and item order analysis to explore cognitive aspects of design for a published genetics and
evolution education instrument. Chapter 4 uses a project-specific instrument, for which Rasch-
based validity and reliability evidence is provided, to explore possible interactions between
gender or ethnicity and measurement, genetics problem type and item difficulty, and the impact
of situational features on measures of genetics understanding.
Overall, substantial evidence was generated about how current knowledge in the field of
genetics education is measured and how measurement in this domain may be improved. The
outcome of this work was a series of recommendations (contained in Chapters 3 and 4) for the
design and evaluation of genetics instruments to produce more accurate and useful measures of a
universally recognized aspect of biological literacy.

xi
Acknowledgments
There are many people whose support has enabled me to complete my doctoral studies,
and to whom I am very grateful.
I have been extremely fortunate to work under the guidance of my advisor Dr. Ross H.
Nehm, whose judicious professional vision, excellent organization, and unwavering optimism
conveyed a steady sense of purpose that made this experience productive and enjoyable. I thank
you for always keeping me motivated and for your myriad efforts that show your true dedication
to your students’ success. Thank you to my dissertation committee members, Dr. Gregory
Rushton, Dr. John True, and Dr. Stephen Finch, for insightful comments and thought-provoking
questions. It has been a wonderful learning experience and a true pleasure working with all of
you.
I am very grateful to Dr. Erik Lavington and Dr. Philipp Schmiemann for their important
contributions to the work in Chapters 3 and 4, respectively. Thanks also to fellow Rasch
enthusiasts Dr. Gena Sbeglia, Dr. Minsu Ha, Donna Shapiro, and Daniela Fielder for many
valuable discussions.
I thank the faculty and staff at the Institute for STEM Education for excellent instruction
and assistance, especially Dr. Keith Sheppard for guidance throughout the program. The
collegiality of the committed, intellectually inquisitive, and expert educators of Cohorts 1-3 kept
me motivated throughout this process and provided a continual resource for learning about both
the field of science education and my own teaching. Special thanks to Caren Gough and Dr.
Linda Padwa for perpetual wise advice and encouragement.
It is not without the combined efforts and patience of dear family and friends that I was
able to accomplish this long-time goal. Deepest respect to my parents who instilled a strong
sense of academic responsibility and encouraged all of their children in our broad endeavors. The
exemplary work ethic and witty encouragement of my brothers helped motivate me to complete
my work. I am incredibly thankful to my family and friends who saw that my children were
loved and entertained--and to my children for their patience--while I worked. I am also deeply
grateful to my husband, who picked up extra responsibility at home and encouraged and
supported me.
The National Association of Research in Science Teaching Scholarship for Classroom
Teachers and Informal Educators provided financial support for aspects of this dissertation. Drs.
Nehm and Schmiemann graciously supported open access publication of the portions of this
dissertation mentioned below.
Portions of Chapter 3 have been published in the paper Tornabene, R.E., Lavington, E.,
& Nehm, R.H. (2018).Testing validity inferences for Genetic Drift Inventory scores using Rasch
modeling and item order analyses. Evolution: Education and Outreach DOI: 11:6
https://doi.org/10.1186/s12052-018-0082-x
Portions of Chapter 4 have been published in the paper Schmiemann, P., Nehm, R. H., &
Tornabene, R. E. (2017). Assessment of genetics understanding: Under what conditions do
situational features have an impact on measures? Science & Education, 26(10), 1161-1191., for
which I am the corresponding author.
Permission to adapt portions of the publications for this dissertation has been granted by
all coauthors, and copyright for both papers is retained by the respective authors. Both
publications are distributed open access under the Creative Commons 4.0 License.

1
Chapter 1. Literature- Genetics Education
1.1 Introduction
Genetics is a major unifying theme across the domain of biology and a central aspect of
biology education. Mastery of genetics concepts is essential for understanding other integral
themes in biology such as evolution and development. Knowledge of genetics also underlies
public decision making about broader health, technological, and socio-scientific issues such as
reproductive technology, cloning, stem cells, genetic testing, and genetic modification of
organisms. Despite the core position of genetics within the domain of biology, its complex nature
causes many students to struggle with many aspects of genetics learning. Given the importance
of genetics in both the scientific and social arenas, it is necessary for the education community to
develop an understanding of how students learn and apply genetics knowledge and how to best
design assessments, organize curricula, and tailor instruction to facilitate development of
knowledge in genetics and a genetically literate society.
Stewart, Cartier, & Passmore (2005) developed a three-part model of genetics knowledge
comprising genetic (e.g.,, classical, Mendelian, or transmission genetics), meiotic (e.g., processes
relating to the production of gametes), and molecular (e.g., gene expression) understanding.
Stewart (2005) asserts that genetics literacy requires understanding within each of the three
model areas as well as understanding of the interactions among areas. This chapter will describe
the better-understood barriers students encounter while learning genetics, with a focus on
transmission genetics. Theoretical and empirical limitations of genetics problem solving studies
and further areas for research will also be considered.
1.2 Challenges in learning genetics and solving genetics problems
A substantial literature has identified and attempted to explain the widespread struggles
faced by secondary and undergraduate students attempting to master genetics concepts (eg.
Bahar, Johnstone, & Hansell 1999; Hackling & Treagust 1984; Lewis, Leach, & Wood-Robinson
2000; Pearson & Hughes 1988; Stewart 1982). Evidence has been drawn from diverse sources
including student and teacher interviews, textbooks and curricula, student discourse, instructor
discourse and practices, and mainly, studies of genetics problem solving. Several, often
interrelated, reasons have emerged to explain why conceptual expertise in genetics is so difficult
to attain.
1.2.1. Linguistic challenges
Success in genetics--especially problem solving--is largely dependent on mastering
abundant and difficult domain-specific terminology. Despite this centrality, genetics terminology
has been shown to be confusing, inconsistent, and misleading, as used within the scientific
community (Beurton, Falk, & Rheinberger 2000; Gericke & Hagberg 2007; Morange 2001;
Portin 2002; Portin & Wilkins 2017; Smith & Adkinson 2010; Venville & Donovan 2005), in
textbooks and textbook-style problems (Dos Santos, Joaquim, & El-Hani, 2012; Gericke et al.
2014; Evans 1976; Knippels, Waarlo, & Boersma 2005; Pearson & Hughes 1988), and in
teacher discourse during instruction (Thorne, Gericke & Hagberg 2013).
The concept of the gene, as used in the scientific community, has evolved as knowledge
of gene structure, function, regulation, and interaction has expanded, and, the meaning of the

2
term “gene” is often context-dependent. Several historic models of the gene (e.g., Mendelian,
classical, classical-biochemical, neoclassical, modern) have been clearly delineated in the
literature (e.g., Beurton, Falk, & Rheinberger 2000; Gericke & Hagberg 2007; Morange 2001;
Portin 2002), and still additional models and definitions have been proposed (e.g., Morange
2001, Portin & Wilkins 2017). Initially, new knowledge about genes, chromosomes, and
biochemistry served to more precisely define the “gene” concept through the first half of the
twentieth century. The late twentieth century (through present) has brought discoveries of
overlapping genes, transposable elements, nested genes, interrupted genes, repeating genes,
pesudogenes, multiple alternate promoters, polyprotein genes, functional RNAs and many other
phenomena, which collectively have served to stretch the boundaries of conventional gene
definitions (Beurton, Falk, & Rheinberger 2000; Morange 2001; Portin & Wilkins 2017). With a
single term seeming insufficient to accurately address the diversity of gene structure and
function, some have argued that the scientific community is in need of new terminology and new
definitions of the gene (e.g., Portin & Wilkins 2017). Despite a deeper understanding of gene
function, many areas of traditional genetics instruction still rely heavily on early models of gene
function (Gericke & Hagberg 2007; Gericke et al. 2014).
Adding an additional layer of ambiguity to the gene concept is the tendency of different
biological disciplines to utilize different operational gene definitions (Morange 2001, Portin
2002; Gericke & Hagberg 2007). Consider, for example, the differing roles a gene plays from the
perpective of a population geneticist, evolutionary biologist, developmental biologist, molecular
biologist, and a genomicist. Textbooks and teachers have been found to be inconsistent in their
use of genetics terminology and gene models as well. For example, a sample of Swedish high
school teachers who were observed during lessons were inconsistent in their use of the term gene
and omitted the use of the term allele altogether (Thorne, Gericke & Hagberg 2013). Textbooks
often switch between gene models (and definitions) or present conflicting gene models without
warning, or even present mixed or hybrid models of gene function (Gericke et al. 2014).
In addition to the complexity of the term “gene,” more than one research group has noted
student confusion about the meanings of words such as “dominant” and “mutation,” particularly
as meanings differ between the contexts of scientific research and everyday use (Pearson &
Hughes 1988; Radford & Bird-Stewart 1982; Smith & Good 1984). Using a history of science
perspective, Jamieson and Radick (2013) argued that some of the confusion about dominance
can be attributed to widespread curricular representations that are actually misinterpretations of
Mendel’s original model. Further, the conceptual closeness and physical proximity of structures
such as alleles, genes, chromosomes, and chromatids make it unsurprising that students such as
those in two United Kingdom studies reported being unable to distinguish among the terms
(Bahar et al. 1999; Longden 1982). Similar sounding words--such as homologue, homologous,
homozygous, homozygote--further complicate communication (Bahar et al. 1999). Indeed,
Burian & Kampourakis (2013) and Smith & Adkinson (2010) have proposed replacement
language phrases for teaching genetics in order to better reflect our modern molecular
understandings and the complex nature of traits.
1.2.2 Reasoning across organizational levels and divisions
Adding to the complexity of learning genetics is the need for simultaneous thinking about
processes that occur at different organizational levels (i.e., macro, micro, and molecular). For
example, one must understand trait manifestation at the organismal (macro) level, the cellular

3
(micro) level, and chromosome, gene, DNA, or protein (molecular) level (e.g., Bahar et al. 1999;
Duncan & Reiser 2007; Marbach-Ad & Stavy 2000; Marbach-Ad 2001). Beyond that, in
genetics problem solving one must correctly apply symbols to represent one level (typically the
molecular or micro level), manipulate the symbols according to specific rules that are cued by
interpretations of domain-specific terminology and which employ probability and ratios, then
reason back to another level (usually macro) to deduce an outcome (Bahar et al. 1999). Duncan
& Reiser (2007) used the term “hybrid hierarchical” to describe the ways in which a change in a
function at one level affects a function at another level. The complex nature of problem solving
means that there is a high cognitive demand and multiple points at which student thinking might
get derailed. Duncan, Freidenreich, Chinn, & Bausch (2011) designed and successfully
implemented a “learning scaffold” depicting genes, proteins, cells, and traits to help students
think across these organizational levels.
Because genetics draws on interrelated information from several subtopics (commonly
referred to as the meiotic, Mendelian, and molecular aspects of genetics; Stewart, Cartier &
Passmore 2005), confusion in any one area--or about the links among these areas--can impede
the development of expertise. Many studies document student problems with meiosis or the
meiotic mechanisms behind segregation and recombination, including the representation of these
ideas in Punnett squares (Browning & Lehman 1988; Cavallo 1994, 1996; Kindfield 1991; Moll
& Allen 1987; Smith & Good 1984; Stewart 1983; Stewart & Dale 1989; Stewart, Hafner &
Dale 1990; Tolman 1982; Todd & Romine 2017). Still other studies document a disconnect
between the molecular and Mendelian models (e.g., Stewart & Dale 1989; Lewis & Kattman
2004; Duncan & Reiser 2007; Todd & Romine 2017). Most recently, while developing their
learning progression of molecular genetics, Todd and Romine (2017) confirmed that, even after
instruction, most high school and college students have difficulty integrating the meiotic and
Mendelian models and the Mendelian and molecular models. Until the missing links between
these three facets of genetics learning can be clearly described (and methods can be devised and
tested to address these conceptual breaks), genetics will remain a challenging subject. Research-
informed, empirically-tested interventions such a Duncan et al.’s (2011) scaffolds are an
important step in bridging the gaps among the three genetics subtopics.
1.2.3 Textbooks and curricula
Research from the nature, history, and philosophy of science perspective has identified
inconsistencies in representations of genetics in educational research literature, textbooks, and
teaching which may contribute to students’ confusion about genetics. Gericke and Hagberg
(2007) analyzed historic models of the gene as described in genetics education literature and
concluded that misrepresented, misunderstood, or hybridized representations of the phenomena
of gene function in historic models can contribute to alternate, non-normative ideas about how
genes function. Specific areas of incoherence included gene function within different
organizational levels, consideration of definitions of the gene from: “top-down” versus “bottom-
up” perspectives; the relationships between genotype and phenotype; and the relationships
between genes and the environment. With colleagues, Gericke et al. (2014) also found that
textbooks across six countries commonly presented hybridized versions and inconsistent
representations of different historical gene models. Based on literature showing that textbooks
largely shape the content, organization, and discussion of biological concepts within classrooms,
Gericke et al. reasoned that hybridized and incoherent models of gene function also abound in

4
genetics classes. They suggest that, to avoid confusion, teachers and textbooks need to: (1) make
explicit the idea that different sub-disciplines of genetics and/or research maintain different
conceptual models of the gene relevant to the uses and goals of each sub-discipline, and (2)
continually help students organize ideas along conceptual scaffolds during instruction.
Several researchers maintain that additional roadblocks to genetics learning lie in
curricular organization. Temporally (Longden 1982; Kindfield 1991) or conceptually (Tolman
1982; Longden 1982) disjointed and potentially inappropriate (Cho et al. 1985) sequencing of
genetics-related topics within the school curriculum are thought to exacerbate confusion about
genetics. In particular, the common separation of units on meiosis and inheritance, especially
without making explicit attempts to depict a conceptual connection (Cho et al. 1995), seem to
add to troubles students have connecting these concepts (Knippels, Waarlo & Boersma 2005;
Longden 1982). Recent results from Duncan, Castro-Faix, and Choi’s (2016) exploration of a
middle school genetics learning progression demonstrated that an understanding of molecular
genetics seemed to bootstrap understanding of Mendelian genetics, making a case for teaching
molecular genetics before Mendelian genetics. Dougherty (2009) argued, given that our modern
understanding of genetics acknowledges most traits are indeed “complex” (e.g., polygenic,
quantitative, and multifactorial), and that our current “historic” approach (from the concepts of
genes to dominance to alleles and then molecular aspects) is not very effective, curricula should
be reorganized to teach quantitative and multifactorial traits before monogenic traits. (It should
be noted that Dougherty’s proposal for an inverted curriculum includes the Mendelian and
meiotic aspects of genetics but does not address the molecular components). Indeed, which
treatment and sequence of genetics material is best to facilitate deep understanding has been and
remains a topic of debate (e.g., Tolman 1982; Smith & Gericke 2015). Robust empirical
measures will be central to generating evidence-based evaluations of these alternative
perspectives.
1.2.4 Genetics problem types and cognitive demands
When considering difficulties in genetics problem solving, it is important to consider the
wide array of problems that are commonly used in classrooms and which have been employed in
research as it has been suggested that different inheritance problem types elicit different
cognitive demands. Typical textbook and assessment genetics problems usually involve a cross,
or mating, in which information is given about the parents, and questions are asked about the
offspring, or vice versa. Symbols and Punnett squares are conventionally used to diagram the
combinatorial or probabilistic thinking required in these problems, although they can be solved
without construction of a Punnett square as well. A variety of genetics problems exist and can be
classified according to several criteria (Collins & Stewart 1989; Hackling & Lawrence 1988;
Hickey et al. 2000; Smith & Sims 1992; Stewart 1988):
1. Problem format [e.g., traditional cross (giving parental information asking for
offspring information), backward thinking cross (predicting parental information
given offspring information), pedigree (family tree using diagrams to represent
traits)]
2. Inheritance pattern (e.g., complete dominance, codominance, sex linkage)
3. Number of traits involved (e.g., monohybrid, dihybrid)
4. Type of reasoning involved (cause to effect or effect to cause)

5
Some evidence from problem solving research and cognitive theory suggests that
different genetics problem types elicit different cognitive demands (though more research is
needed in this area). Traditional problems (which are the most common) are also considered the
easiest because they often can be solved by rote algorithms with limited knowledge of
inheritance processes (e.g., Cavallo 1994, 1996; Smith & Good 1984; Stewart 1983; Stewart,
Hafner & Dale 1990; Browning & Lehman 1988). As the number of traits simultaneously
studied increases, so does problem difficulty; with two or more traits, the Punnett square method
becomes cumbersome and students must switch to a multiplication of ratios approach to combine
the probabilities of individual trait inheritance. Smith & Sims (1992) note that the latter
approach, while more efficient, requires higher-level thought. In contrast to traditional crosses,
pedigree, or family tree problems, interpretation problems tend to be more open-ended and
require more advanced reasoning and genetics knowledge because one must deduce information
about inheritance modes and genotypes from a given diagram prior to solving any further
questions (e.g., Hackling & Lawrence 1988; Smith & Sims 1992). With respect to inheritance
pattern, Collins & Stewart (1989) considered incomplete dominance problems to be less
demanding than simple dominance problems. Incomplete dominance features a 1:1 mapping of
each genotype to phenotype, whereas in simple dominance both homozygous dominant and
heterozygous genotypes are mapped to the dominant phenotype, which can be confusing for
novice learners. Likewise, cause-to-effect problems have been shown to be less demanding for
students than effect-to-cause problems (Hackling & Lawrence 1988; Hickey et al. 2000; Smith &
Sims 1992; Stewart 1988). Cause-to-effect problems require 1:1 mapping of the genotype to
phenotype whereas effect-to-cause problems require consideration of more than one possible
genotypic antecedent for a given phenotypic effect (Hackling & Lawrence 1988; Smith & Sims
1992; Stewart 1988). It is clear that the wide variety of genetic problem types adds to the
complexity of successfully understanding (and demonstrating competency in) transmission
genetics. Students are tasked first with correctly identifying a problem type from a problem
statement and then appropriately applying a complicated domain-specific, knowledge-dependent,
mathematically-driven heuristic to reach a solution.
Several studies have documented challenges posed by the highly abstract and even
mathematical nature of reasoning required in genetics. Genetics has been described as a highly
theoretical field requiring a significant amount of abstract thought (Baker & Lawson 2001; Banet
& Ayuso 2000) and hypothetico-deductive reasoning (Baker & Lawson 2001). Many studies
have noted that genetics involves highly developed levels of reasoning at Piaget’s formal
operational level (Cavallo 1996; Gipson, Abraham & Renner 1989; Smith & Sims 1992; Walker
1979, 1980). Smith & Sims (1992) clarified that formal operational reasoning ability--in the
forms of proportional, probabilistic, and combinatorial reasoning specifically--was not an
absolute requirement for genetics problem solving (as some students were able to solve
problems by alternative routes), however formal reasoning was very helpful to increase success.
As an elaborative example, Cavallo (1996) found reasoning ability was a better predictor of
student success at correctly solving Punnett square problems, but not for understanding meiotic
events underlying genetics (discussed below in the section on meaningful learning).
Probabilistic reasoning and computational skills (Browning & Lehman 1988; Kinnear
1983; Smith & Good 1984) as well as symbolic representation (Bahar et al. 1999; Thomson &
Stewart 1985) are key requirements for solving genetics problems. Students sometimes lack the
simple computational skills necessary to perform mathematical calculations of genetics problems
(Browning & Lehman 1988; Smith & Sims 1992). Instructors and textbooks commonly employ

6
inconsistent systems of symbolism to represent common genetics topics (Bahar et al. 1999), and
students sometimes manipulate symbols and alter algorithms without proper consideration of
genetic laws (Thompson & Stewart 1985). Improper choice of symbols, use of symbols without
understanding what they are intended to represent, or manipulation of symbols in a manner
inconsistent with the rules relevant to the content represented by the symbols can lead to
incorrect conclusions. Such pitfalls are especially characteristic of students who attempt to solve
genetics problems by rote rather than understanding (e.g., Smith & Sims 1992).
1.2.5 Approaches to problem solving
The overwhelming tendency of students is to approach genetics by rote--relying on
simple algorithms to obtain fixed ratios (Cavallo 1994, 1996; Smith & Good 1984; Stewart 1983;
Stewart, Hafner & Dale 1990; Browning & Lehman 1988). This strategy promotes reliance on
superficial problem features instead of mechanistic processes (Smith & Good 1984; Smith &
Sims 1992; Stewart, Hafner & Dale 1990). This approach clearly limits deeper conceptual
understanding (Cho et al. 1985; Longden 1982, Novak 2002; Smith & Good 1984). Despite the
eventual learning constraints arising from rote approaches to problem solving, many students
persist in this approach because it efficiently rewards a correct answer (Cavallo 1994; Moll &
Allen 1987; Smith & Sims 1992; Stewart 1983). Students who avoid this pitfall are those whose
epistemic stance is oriented toward meaningful learning (i.e., deliberately connecting new ideas
to existing ideas while learning; Ausubel 1963). It has been suggested that students have an
inherent and identifiable orientation toward either meaningful or rote learning (Entwistle &
Ramsden 1983; Novak 2002) and some interventions in genetics learning have been aimed at
providing scaffolding to help students make meaning by connecting ideas. One example centers
on the observation that students who draw on knowledge of meiosis have greater success solving
problems (Cavallo & Schafer 1994; Moll & Allen 1987). When Cavallo & Shafer provided
students with parallel assessment tasks which differed only in one suggestion to consider
knowledge of meiosis while solving the problem, the additional prompt to connect knowledge
enabled more students to solve the task. Similar results have been noted by Duncan et al. (2011),
Moll & Allen (1987), and Novak (2002).
1.2.6 Content knowledge
Because genetics problem solving draws heavily on domain-specific content knowledge
while simultaneously requiring complex domain-specific heuristics, several problem-solving
barriers exist for students who have not amassed sufficient prior content knowledge.
Specifically, prior knowledge is accessed when successful problem solvers look for cues as to
characterize problem type (Hackling 1990; Hackling & Lawrence 1988; Slack & Stewart 1990;
Smith 1983; Smith & Good 1984), activate schemas (Slack & Stewart 1990), generate and test
hypotheses and test alternate hypotheses to disprove alternate modes of inheritance (Collins
1986; Hackling 1990; Hackling & Lawrence 1988), justify inheritance according to meiotic
models (Cavallo & Schafer 1994; Stewart and Dale 1981), employ domain vocabulary to
summarize data (Collins 1986; Collins & Stewart 1989; Simmons & Lunetta 1993), and check
for consistency with the problem and the larger body of genetics knowledge (Smith 1983; Smith
& Good 1984). Overall, a broader knowledge base affords a larger library of schema and
schema-cuing situations, and connections between cues and schemas are stronger; it thus

7
becomes easier to select clues in the problem, apply a heuristic, and work out the problem. Given
that an appreciable portion of secondary students begin to study genetics having yet to develop
the understandings that certain organisms are alive, and that they contain cells, chromosomes,
and genes (Banet & Ayuso 2000), it is not surprising that many students remain ill-equipped to
solve genetics problems. Hackling (1990; Hackling & Lawrence 1988) has experimented with
problem-solving scaffolding by directing students to check for certain things and respond with
certain behaviors during problem solving, much like experts do.
Given the large amount of content knowledge required to solve genetics problems, and
the importance that baseline knowledge plays in selecting appropriate problem-solving
heuristics, it is not surprising that Stewart (1983; Stewart & Van Kirk 1990) and Hafner (Hafner
& Stewart 1995) recommend problem solving within the domain as a way of developing domain-
specific knowledge as well as domain-specific and domain-general skills. On the contrary,
Sweller (1988) presents evidence from cognitive psychology to suggest that, in some instances
(such as less skilled individuals employing a means-end approach), high cognitive load demands
may interfere with learning and acquisition of appropriate problem solving schema. It is possible
that a threshold model applies in which problem solving can reinforce concepts and skills in
learners who have attained at least a certain baseline level of prior knowledge, but problems that
are too challenging create roadblocks to learning. While problem solving practice is a common
learning vehicle in many domains, the impact of excessive cognitive load in genetics problem
solving is not to be overlooked. Clearly, more work is needed on this topic.
1.2.7 Life experiences reinforce misconceptions
A simple but potentially important impediment to learning genetics may be that everyday
life experiences work against the development of an adequate understanding of genetics. Some
research suggests that the public is resistant to developing an accurate understanding of genetics
because everyday social relationships and practices regularly reinforce the naive concept of
kinship (Richards 1996). Kinship conceptions are typically held by young children as they begin
to understand relatedness in families and animals. Children observe and consequently expect
similar traits in organisms based on social constructs such as perceived degree of relatedness.
This expectation may even extend to certain acquired traits. Kinship theory is problematic
because it fails to consider the physical basis of inheritance, such as DNA, genes, or
chromosomes; indeed students have been noted to apply molecular-deficient reasoning when
they go so far as to conflate genes with traits (e.g., Lewis and Kattmann 2004). Social
reinforcement of insufficient explanatory elements such a kinship may be thus associated with
misconceptions about the true causes of traits (Venville, Gribble & Donovan 2005).
1.3 Modeling as a means of improving genetics understanding
Several researchers in genetics problem solving (in addition to Moll & Allen 1987) have
documented how the inclusion of supports such as diagrammatic-, physical-, analogic-, or
computer-generated models can enhance problem-solving ability. It is possible that these
supports provide the scaffolding to help students attend to important cues or skills in order to
work forward, thereby also decreasing cognitive load for struggling students. Kindfield (1994)
noted that successful problem solvers constructed and used diagrams of meiosis to recall and
accumulate relevant knowledge to support problem solving, then checked their own reasoning

8
against diagrams that they had created. Consequently, she advocated for the addition of
instructional activities that involve creating and using diagrams as biological models for
learning. Several other researchers have invented creative means for modeling meiosis, including
using: students as chromosomes (Chinnici, Yue & Torres 2004), string and paper (Stencel 1995),
socks (Chinnici, Neth & Sherman 2006), and cards (Krauskopf 1999), though most have not
empirically demonstrated significant learning gains associated with these activities. Venville and
Donovan (2008) described using an analogical model to support the language of genetics.
Learning gains were modest and best revealed qualitatively, and were also dependent on students
prior knowledge and interactions with the model. A large scale interactive computer modeling
project, GenScope (a precursor to BioLogica), was also shown to produce only modest learning
gains for most groups of students (Horwitz et al. 1998). However, the program had a very strong
effect on improving the very low baseline knowledge of a group of urban at-risk participants. It
would be interesting to explore whether other similar effects might be noted from similar
computer interventions with populations such as this.
Tsui & Treagust (2007) performed an extensive analysis of student learning gains with
GenScope’s successor program (the interactive computer modeling project BioLogica). Some
(but not all) students showed gains, and some gains seemed to be linked to the students’ prior
knowledge (or how intently they interacted with the program). These finding echo the results of
Cavallo’s (1996; Cavallo & Schafer’s 1994) study on the intersections among meaningful
learning orientation, prior knowledge, and genetics success. Regardless of overall assessment
results, most students claimed that the interactive computer models helped them visualize the
processes and understand what was happening (for example, an animation of meiosis labeled
with alleles played while students answered questions about what they saw) although it did not
translate into measurable results. In both Tsui & Treagust’s (2003, 2007) studies, BioLogica was
most effective when used in conjunction with teacher scaffolding and cooperative student
interaction to support the construction of knowledge. Essentially, Tsui & Treagust were
describing the efficacy of a cooperative constructivist learning model, and thus these findings
could be viewed as support for the importance of meaningful learning behaviors in genetics. A
conclusion that can be drawn from this collective body of research is that it is the interactions
with the model that seemed to be the important factor related to learning outcomes. Models can
clearly support--but do not on their own account for or replace--deep, meaningful learning.
1.4 Argumentation in genetics education
In line with recent efforts to provide more authentic science education programs that
couple scientific practices with scientific content to better reflect the nature and work of
scientists (NGSS Lead States 2013), studies have begun to examine the relationships between
genetics and argumentation. Argumentation in genetics may serve as an alternative to traditional
“problem solving,” and may function as a way of learning as well as a means of assessing
understanding in genetics (e.g., Jimenez-Aleixandre, Rodriguez & Duschl 2000; NGSS Lead
States 2013). Research in genetics argumentation has shown that stronger genetics content
knowledge was associated with higher quality argumentation when confronted with
socioscientific issues in genetics (Sadler & Donnelly 2006; Sadler & Fowler 2006; Sadler &
Zeidler 2005). Sadler & Donnelly proposed a threshold model in which the relationship between
content knowledge and argumentation is not linear but does exist. In their model, individuals
with expert-like knowledge were less impacted by contextual features than those with a lesser

9
knowledge base. Shea, Duncan & Stevenson (2015) expanded on the Sadler model to include the
impact of context in argumentation quality. Specifically, individuals with strong content
knowledge offered the most robust arguments regardless of context, while those with limited or
partial subject knowledge produced arguments of varying strengths in relation to the contextual
framing of the question prompt (discussed further below.) This is in alignment with findings on
the role of context in other science content areas, (e.g., Chi et al.1981; Opfer, Nehm & Ha 2012;
Ware & Gelman 2014). Overall, although it is clear that Mendelian genetics problems remain a
central part of the curriculum (discussed further in Section 4.1.2), increasing attention in genetics
education research is being focused on argumentation and modelling as means for measuring
genetics understanding (e.g., Jiménez-Aleixandre 2014; Jiménez-Aleixandre et al. 2000; Sadler
& Donnelly 2006; Shea, Duncan & Stevenson 2015).
1.5 Theoretical and empirical limitations of genetics education research and areas for
future research
1.5.1 Samples and study types
While nearly forty years of research has produced a sizeable literature on genetics
problem solving, there remain several substantial limitations of past research and several
additional issues deserving attention. Most studies of genetics problem solving have been
smaller-scale qualitative studies, which have yielded rich, detailed information of problem
solving procedures and pitfalls, but lack evidence of generalizability to other populations. While
overlapping findings from several descriptive studies in varied settings may serve to provide
some degree of corroboration, the body of literature reviewed above remains subject to common
theoretical limitations of qualitative studies (e.g., limits of subjects’ vocalizations during
interviews or “think-alouds,” interactions with the researcher, small sample sizes lacking
representativeness). In general, this work lacks large-scale, broad-context, empirically-designed,
and more rigorously-validated studies capable of refuting, corroborating, or extending existing
understandings.
For example, in addition to existing novice-expert studies, more studies performed on
large samples drawn from middle school, high school, and early and late stage university levels
might yield generalizable findings about how genetics problem solving may improve or what
challenges are faced at each level. Todd and Romine’s and Duncan’s research groups have begun
to lay early groundwork in this area. Additionally, while the body of genetics problem solving
research represents a patchwork of national contexts, studies intentionally comparing different
geographic areas might shed light on similarities and differences in how diverse students
approach similar problems. Much work also has failed to consider whether demographic factors,
such as gender, are significantly associated with measures of genetics learning (discussed
below). Overall, experimental studies with greater attention to sample size, composition,
representativeness and generalizability are needed in the field of genetics education research in
order to generate robust evidence-based claims.
1.5.2. Genetics problem selection
Most of the studies reviewed above have relied on measures of genetics understanding.
More rigorous statistical analyses employing (at minimum) Classical Test Theory (CTT) or

10
(ideally) Item Response Theory (IRT) perspectives in alignment with some of the guidelines set
forth in the Standards for Educational and Psychological Testing (AERA, APA, NCME 2014)
would offer higher-quality insights into the degree to which specific genetics tasks are able to
generate valid and reliable inferences about student performance. The vast majority of studies in
genetics problem solving, especially prior to the last decade, have involved such small item sets
(and often few participants) that statistical validity and reliability analyses for tasks were not
possible. Although the tendency in the research community has been to draw problems from
popular textbooks or craft similar-style problems, there is really no indication- beyond items
having met a textbook editor’s or the principal investigator’s approval- that any of the problems
used in these studies are “good” or functioning in the manner the researcher has anticipated.
Indeed, few studies even make an attempt to offer any evidence toward the content or substantive
validity of their questions (see Chapter 3, below). Larger, more robust, and empirically
substantiated experimental studies are needed to complement the array of descriptive studies in
genetics problem solving.
The array of genetics problems employed in the extant body of research is neither evenly
representative of all genetics problem types nor organized according to any rational principle.
The lack of consistency in problem selection precludes this body of work from yielding more
coherent insights into the cognitive demands elicited by each problem type. Most genetics
problem-solving studies focus on monohybrid crosses featuring complete, and to a lesser extent,
incomplete dominance. Dihybrid crosses, pedigrees, and sex-linkage problems constitute a
smaller portion of the research, and other problem types are nearly absent from the literature.
More studies are needed that are able to experimentally isolate and compare problems by type
and represent a broader sample of problem types. For example, a study might examine whether
genetics rules are applied consistently across problem types regardless of number of traits
studied. This could be achieved by developing a carefully constrained set of traits (with attention
to a consistent organism type, similar trait type and mode of trait inheritance) and examining
student responses to monohybrid, dihybrid, and even trihybrid crosses systematically constructed
from the constrained feature set. Another study might examine whether inheritance pattern
impacts problem solving ability by comparing multiple parallel problems featuring otherwise
comparable dominant, recessive, incompletely- and co-dominant traits. Other studies might
compare “cause to effect” to “effect to cause” reasoning by employing a constrained problem set
varying only by whether a problem demanded forward or backward reasoning. Such
experimental rotation of problem types is likely to generate a large item set and may require a
multi-matrix design to disperse smaller, overlapping groups of problems over a large participant
set, requiring sophisticated IRT analysis as mentioned prior. Still additional studies are needed to
explore advanced and underrepresented inheritance patterns such as sex-linkage, multiple alleles,
lethal alleles, epistasis, and quantitative traits. Clearly, there is much work that remains to be
done in genetics education relating to problem solving.
It has been well-documented that most types of genetics problems can be solved by rote
without drawing on deeper knowledge and, consequently, are not always true indicators of
student understanding (Browning & Lehman 1988; Cavallo 1994, 1996; Cho et al. 1985;
Longden 1982; Smith & Sims 1992; Smith & Good 1984; Stewart 1983; Stewart, Hafner & Dale
1990). Yet the larger body of genetics problem-solving research has continued to employ
algorithmic problems. It is essential that this field of research experiment with a variety of
alternative and ill-structured problem types and formats to shed more light on reasoning,
behaviors, and knowledge use during problem solving. More open-ended formats such as

11
pedigree-based problems (e.g., Hackling 1990; Hackling & Lawrence 1988; Smith 1988) are but
one example. A variety of less-structured problem types may accompany traditional genetics
problems and extend and clarify information gleaned from traditional problem types. For
example, Cavallo accompanied Punnett square problems with additional, related questions
(Cavallo & Schafer 1994) or with open-ended questions (Cavallo 1996), and Kindfield (1994)
assessed knowledge using diagrams. More recently, Tsui & Treagust (2010) have used a CTT-
validated, two-tiered instrument to measure genetics knowledge. The first tier offers a forced-
choice question and the second tier asks for the student’s reasoning for the choice made in the
first tier. Todd & Romine (2016) used a similar two-tied IRT-validated genetics instrument in
which the second tier asks students about their extent of guessing (on the first-tier, forced-choice
items). Two-tier instruments represent a practical solution to the need to gather rich information
while managing large sample sizes. Automated machine scoring of constructed response items,
such a those employed by Nehm and colleagues in the domain of evolution learning (Ha, Nehm,
Urban-Lurain & Merrill 2011; Nehm, Ha, & Mayfield 2012) offers another solution to the
question-quality versus scoring-quantity dilemma. Overall, the field of genetics problem solving
will benefit from exploration of more modern and robust problem types in combination with the
technology-enabled approaches.
Beyond the eclectic assemblage of problem types employed in genetics problem solving
research, remarkably little consideration has been given to whether the superficial features of
genetics problems or the contexts problems are situated in impact problem solving ability or
measures of student understanding. A substantial literature in cognitive psychology and science
education, much dating back to the 1970s and 1980s, offers evidence that assessment task
features can impact the retrieval of scientific knowledge and resulting measures of participants’
conceptual understanding (e.g., Chi, Feltovich, & Glaser 1981; further reviewed in Nehm & Ha
2011). In biology this has been documented most extensively by Nehm and colleagues who
found, in large international samples, effects of evolution task features varied predictably
depending on (1) taxon featured (2) the scale of evolutionary comparisons, (3) the familiarity of
the taxa and traits, and (4) polarity of evolutionary change, and manifest most strongly in
participants with low expertise in the domain (Federer et al. 2016; Nehm & Reilly 2007; Nehm
& Ha 2011; Nehm et al. 2012; Nehm & Ridgway 2011; Opfer, Nehm, & Ha 2012).
In genetics, Smith (1992), too, found that superficial features of genetics problems
influence the manner in which novices categorize problems. Because problem categorization is a
key first step in problem solving, it is reasonable to imagine that task context would impact
genetics problem-solving ability. Indeed, some studies in inheritance have hinted that contextual
features impact genetics knowledge formation and retrieval (Banet & Ayuso 2000; Clough &
Driver 1986; Kargbo, Hobbs, and Erickson 1980; Ware and Gelman 2014; Freidenreich, Duncan,
and Shea 2011; Shea, Duncan, and Stephenson 2015). However, remarkably few studies have
experimentally explored impacts of task context on a large scale (Banet & Ayuso 2000 and
Ware and Gelman 2014 are a notable exception). Equally important to understanding how
surface features impact student reasoning is an understanding of which surface features impact
reasoning and under what situations. In line with the findings of Nehm and colleagues, it is
reasonable to expect that surface features such as taxon of organism (human, animal, plant),
familiarity with organism, scale on which a trait is presented (macroscopic, microscopic, or
molecular level), whether a trait is advantageous or deleterious, and whether an allele variant
confers a gain or loss of function, may impact formation and retrieval of genetics knowledge.

12
Further research, especially from larger empirical studies, is clearly needed to elucidate
which situational features impact particular types of genetics problems, and how these features
impact measures of student learning. An understanding of how task cover stories, contexts, or
situational features impact reasoning are important for many culturally relevant educational
activities, including the selection of curricular examples to illustrate scientific phenomena, the
design of formative and summative assessment items, and determination of whether instruction
has fostered the development of abstract schemas divorced from particular instances (Mayer
2016). Indeed, research needs to move away from the general documentation of context effects
and towards domain-specific models that may be leveraged to improve teaching and learning of
core ideas.
1.5.3 Demographic factors
Most studies in genetics education have not explicitly considered the role of demographic
factors (e.g., gender, race) in their research designs despite a half century of research
demonstrating differences in attitudes, understanding, achievement, and participation (Linn &
Hyde 1989; Kahle & Meece 1994; Weinburgh 1995; Scantlebury & Baker 2007; Scantlebury
2014; Eddy & Brownell 2016; Peng, Wright, & Hill 1995; Lee & Luykx 2007). Differences in
science achievement may be due to factors specific to a demographic group’s experience (Peng,
Wright, & Hill 1995; Scantlebury & Baker 2007), or as a result of bias in curriculum,
instructional practices, school climate, or assessment methods (Lee & Luykx 2007).
Understanding how either of these reasons can impact performance are important for practicing
culturally-relevant pedagogy. In biology education, the roles of gender and ethnicity on domain-
specific performance remain unsettled. Some studies, for example, have documented the absence
of significant gender effects (e.g., Shepardson & Pizzini 1994; Dimitrov 1999; Huppert et al.
2002; Lauer et al. 2013; Willoughby & Metz 2009) or impact of ethnicity (e.g., Creech and
Sweeder 2012; Dimitrov 1999; Nehm and Schonfeld 2008) on biology performance. Other
studies, in contrast, have found advantages for males in undergraduate biology course grades
(Creech & Sweeder 2012) and test scores (Eddy, Brownell, & Wenderoth. 2014; Stanger-Hall
2012; Wright et al. 2016) whereas other studies have found that females outperformed males on
concept maps (Pearsall et al. 1997) and on tests of labeling errors (Soyibo 1999). In genetics,
gender effects were not found by Cavallo (1994) in high school participants’ written
explanations of genetics and meiosis or by Dogru-Atay and Tekkaya’s (2008) study of eighth
graders’ multiple-choice responses about inheritance and genetics crosses. Franke and Bogner
(2011), however, showed a female advantage for retaining new conceptions about molecular
genetics and genetics technology on a multiple-choice test. To ensure accurate measures of
learning and appropriately-designed curriculum and instructional methods, more information is
needed about how different assessment methods measure understanding in the various branches
of biology across all demographic groups.
1.5.4 Alignment with current educational standards and goals
Lastly, it is important to consider the modernization of genetics problem-solving research
to address next-generation scientific problems that tackle content and practices and are in line
with recent science education standards. Since the wave of problem-solving studies in the 1980s
and 1990s, the standards for U.S. science education such as the National Science Education

13
Standards (NRC 1996) and Next Generation Science Standards (NGSS Lead States 2013) have
shifted much of the basic traditional genetics material to the middle school level, yet few studies
(excepting Duncan and colleagues’ learning progression work) have examined how genetics
problem solving is approached in young adolescents. To the contrary, a substantial body of
genetics problem solving work has been carried out in undergraduates, who presumably exceed
adolescents in reasoning ability, mathematical ability, prior biology knowledge, maturity,
academic experience and life experience. All of these areas have some bearing, whether explicit
or implicit, on genetics problem solving success. Even some item surface features might be
expected to resonate differently with a thirteen year old and a nineteen year old. Work is in order
to determine the extent to which insights from the existing body of knowledge in genetics
learning and problem solving can be applied to middle school students and what new challenges
may exist. Beyond studying genetics learning at individual educational levels, multi-level studies
(e.g., Schmiemann, Nehm, & Tornabene 2017), especially those that are learning progression
aligned (e.g., Todd & Romine 2016; Todd, Romine, & Cook Whitt 2017) can offer valuable
insights into how students interact with genetics concepts as they progress through their
educational experience.
Kampourakis et al. (2014) argue that the current teaching in the field of genetics is in
need of better alignment with the current knowledge in the field and the current socioscientific
issues that exist. A growing awareness of the important role of the nature of science and the need
to empower students to be scientifically literate citizens who can engage in scientific practices to
learn about the world and navigate modern socioscientific issues is reflected in the new
education Standards (NGSS Lead States 2013). While it is clear that Mendelian inheritance
remains a part of the curriculum, new standards require students’ engagement in scientific
practices such as the construction of domain-specific models to develop and demonstrate
knowledge about scientific phenomena and employ scientific discourse and argumentation to
support and evaluate claims about data and phenomena. These practices will serve both as a
vehicle for learning and as a means of measuring of understanding in genetics. Research on
learning in genetics must therefore continue to move away from problem-solving heuristics and
towards model-use and argumentation. Some notable examples are an early work by Hafner &
Stewart (1995) and Finkel (1996) on revision of meiotic models for dominant inheritance
patterns in order to facilitate knowledge construction for additional inheritance patterns. More
recent studies in problem-based learning and genetics argumentation have been conducted by the
Duncan group (e.g., Hmelo-Silver, Duncan, Chinn 2007; Shea, Duncan & Stephenson 2015),
Sadler and colleagues (Sadler & Donnelly 2006; Sadler & Fowler 2006; Sadler & Zeidler 2005)
and Jiménez-Aleixandre (2014) and colleagues (Jimenez-Aleixandre et al. 2000). Work in these
arenas (e.g., Shea, Duncan and Stephenson 2015) has identified the roles that task context and
prior knowledge play in new measures of genetics literacy. Specifically, they have explored how
task context, prior knowledge use, and learning approaches can be extended to contemporary
measures of genetics understanding. Studies such as these are essential to inform teaching and
measurement practices in line with the Next Generation Science Standards (NGSS).
1.6 Conclusion Genetics is one of the most widely-researched divisions of biology education, and with
good cause. Its conceptual centrality means that genetics is a foundation for understanding the
very nature of biological characteristics, change, and diversity. Its abstract, theoretical, and

14
ontologically broad nature means that genetics is particularly challenging to master, and
especially difficult to teach. As a field, genetics offers a point of personal connection, as it
provides some answers, although only partial, as to why we are the way we are. We have
witnessed continuing technological advances that have facilitated exponential expansion of
genetics knowledge and applications. The field has, in many cases, ‘grown up’ alongside us.
Most of us will now have occasion to interact directly with diagnostic methods or treatments
related to genetics.
Just as the field of genetics has changed, so have our goals for scientific literacy and
consequent goals for science education. The field of genetics education needs to move beyond
the confines of small, descriptive studies and employ more robust, empirically validated
experimental studies. Within genetics problem solving research, variables such as problem type,
pattern of inheritance, participant level of education, and impact of problem context must be
explored in samples from diverse settings to generate robust, generalizable conclusions about
genetics learning. Extending the field of problem solving, research much focus on newer,
standards-aligned and philosophically-aligned methods of developing and measuring genetics
understanding (such as the use of models and argumentation). The field of traditional genetics
learning is transitioning away from the days of a teacher standing at the board and students
solving textbook-style problems on their own, and towards students working in collaborative
groups while the teacher facilitates discourse development and model revision to construct
arguments and explanations. Attention to the success of all students, and aims for culturally-
relevant instruction, require that research designs consider how the demographic constitution of
participants may interact with instructional practices and assessment. Improved understanding of
cognitive aspects of learning and assessment warrant consideration of how selection of curricular
examples, assessment item contexts, and presentation order may interact with student learning
and measures of such. New technologies in the form of computer automated testing, scoring, and
psychometric analysis are available to support these improvements in research.
1.7 References (Chapter 1)
American Educational Research Association, American Psychological Association, and National
Council on Measurement in Education (AERA, APS, NCME). (2014). The Standards for
Educational and Psychological Testing. Washington, DC: Author.
Bahar, M., Johnstone, A. H., & Hansell, M. H. (1999). Revisiting learning difficulties in biology.
Journal of Biological Education, 33(2), 84-86.
Baker, W. P., & Lawson, A. E. (2001). Complex instructional analogies and theoretical concept
acquisition in college genetics. Science Education, 85(6), 665-683.
Banet, E., & Ayuso, E. (2000). Teaching genetics at secondary school: a strategy for teaching
about the location of inheritance information. Science Education, 84(3), 313-351.
Beurton, P. J., Falk, R., & Rheinberger, H. J. (Eds.). (2000). The concept of the gene in
development and evolution: Historical and epistemological perspectives. Cambridge University
Press.

15
Browning, M. E., & Lehman, J. D. (1988). Identification of student misconceptions in genetics
problem solving via computer program. Journal of Research in Science Teaching, 25(9), 747-
761.
Burian, R. M., & Kampourakis, K. (2013). Against “Genes For”: Could an Inclusive Concept of
Genetic Material Effectively Replace Gene Concepts?. In The Philosophy of Biology (pp. 597-
628). Springer, Dordrecht.
Cavallo, A. M. L. (1994). Do females learn biological topics by rote more than males?. The
American Biology Teacher, 56(6), 348-352.
Cavallo, A. M. L. (1996). Meaningful learning, reasoning ability, and students' understanding
and problem solving of topics in genetics. Journal of Research in Science Teaching, 33(6), 625-
56.
Cavallo, A. M. L., & Schafer, L. E. (1994). Relationships between students' meaningful learning
orientation and their understanding of genetics topics. Journal of Research in Science Teaching,
31(4), 393-418.
Chi, M.T.H., Feltovich, P.J., & Glaser, R. (1981). Categorization and representation of physics
problems by experts and novices. Cognitive Science, 5(2), 121–152.
Chinnici, J., Joyce W. Yue, & Kieron M. Torres. (2004). Students as "Human Chromosomes" in
Role-Playing Mitosis & Meiosis. The American Biology Teacher, 66(1), 35-39.
Chinnici, J., Somalin Zaroh Neth, & Leah R. Sherman. (2006). Using "Chromosomal Socks" to
Demonstrate Ploidy in Mitosis & Meiosis. The American Biology Teacher, 68(2), 106-109.
Cho, H. H., Kahle, J. B., & Nordland, F. H. (1985). An investigation of high school biology
textbooks as sources of misconceptions and difficulties in genetics and some suggestions for
teaching genetics. Science Education, 69(5), 707-719.
Clough, E. E., & Driver, R. (1986). A study of consistency in the use of students' conceptual
frameworks across different task contexts. Science Education, 70(4), 473-496.
College Board. (2015). AP Biology Course and Exam Description. https://secure-
media.collegeboard.org/digitalServices/pdf/ap/ap-biology-course-and-exam-description.pdf.
Accessed 2 January 2016.
Collins, A. (1986). Strategic knowledge required for desired performance in solving
transmission genetics problems. (Unpublished Doctoral dissertation, University of Wisconsin--
Madison)
Collins, A., & Stewart, J. H. (1989). The knowledge structure of Mendelian genetics. The
American Biology Teacher, 51(3), 143-149.

16
Corbett, A., Kauffman, L., Maclaren, B., Wagner, A., & Jones, E. (2010). A Cognitive Tutor for
genetics problem solving: Learning gains and student modeling. Journal of Educational
Computing Research, 42(2), 219-239.
Creech, L. R., & Sweeder, R. D. (2012). Analysis of student performance in large-enrollment life
science courses. CBE-Life Sciences Education, 11(4), 386-391.
Dikmenli, M. (2010). Misconceptions of cell division held by student teachers in biology: A
drawing analysis. Scientific Research and Essays, 5(2), 235-247.
Dimitrov, D. M. (1999). Gender differences in science achievement: Differential effect of ability,
response format, and strands of learning outcomes. School science and mathematics, 99(8), 445-
450.
Dogru-Atay, P., & Tekkaya, C. (2008). Promoting participants' learning in genetics with the
learning cycle. The Journal of Experimental Education, 76(3), 259-280.
Dos Santos, V. C., Joaquim, L. M., & El-Hani, C. N. (2012). Hybrid deterministic views about
genes in biology textbooks: A key problem in genetics teaching. Science & Education, 21(4),
543-578.
Dougherty, M. J. (2009). Closing the gap: inverting the genetics curriculum to ensure an
informed public. The American Journal of Human Genetics, 85(1), 6-12.
Dougherty, M. J., Pleasants, C., Solow, L., Wong, A., & Zhang, H. (2011). A comprehensive
analysis of high school genetics standards: are states keeping pace with modern genetics?. CBE-
Life Sciences Education, 10(3), 318-327.
Duncan, R., Castro-Faix, M., & Choi, J. (2016). Informing a learning progression in genetics:
Which should be taught first, Mendelian inheritance or the central dogma of molecular biology?.
International Journal of Science & Mathematics Education, 14(3).
Duncan, R. G., Freidenreich, H. B., Chinn, C. A., & Bausch, A. (2011). Promoting middle school
students’ understandings of molecular genetics. Research in Science Education, 41(2), 147-167.
Duncan, R. G., & Reiser, B. J. (2007). Reasoning across ontologically distinct levels: Students'
understandings of molecular genetics. Journal of research in Science Teaching, 44(7), 938-959.
Eddy, S. L., & Brownell, S. E. (2016). Beneath the numbers: A review of gender disparities in
undergraduate education across science, technology, engineering, and math disciplines. Physical
Review Physics Education Research, 12(2), 020106.
Eddy, S. L., Brownell, S. E., & Wenderoth, M. P. (2014). Gender gaps in achievement and
participation in multiple introductory biology classrooms. CBE-Life Sciences Education, 13(3),
478-492.

17
ETS. (2015). The Praxis Study Companion- Biology: Content Knowledge.
https://www.ets.org/s/praxis/pdf/5235.pdf. Accessed 2 January 2016.
Evans, J. D. (1976). The treatment of technical vocabulary in textbooks of biology. Journal of
Biological Education, 10(1), 19-30.
Federer, M. R., Nehm, R. H., & Pearl, D. K. (2016). Examining Gender Differences in Written
Assessment Tasks in Biology: A Case Study of Evolutionary Explanations. CBE-Life Sciences
Education, 15(1), ar2.
Finkel, E. A. (1996). Making sense of genetics: Students' knowledge use during problem solving
in a high school genetics class. Journal of Research in Science Teaching: The Official Journal of
the National Association for Research in Science Teaching, 33(4), 345-368.
Franke, G., & Bogner, F. X. (2011). Conceptual change in participants’ molecular biology
education: tilting at windmills?. The Journal of Educational Research, 104(1), 7-18.
Freidenreich, H. B., Duncan, R. G., & Shea, N. (2011). Exploring middle school students’
understanding of three conceptual models in genetics. International Journal of Science
Education, 33(17), 2323-2349.
Gericke, N. M., & Hagberg, M. (2007). Definition of historical models of gene function and their
relation to students’ understanding of genetics. Science & Education, 16(7-8), 849-881.
Gericke, N. M., Hagberg, M., dos Santos, V. C., Joaquim, L. M., & El-Hani, C. N. (2014).
Conceptual variation or incoherence? Textbook discourse on genes in six countries. Science &
Education, 23(2), 381-416.
Gipson, M. H., Abraham, M. R., & Renner, J. W. (1989). Relationships between formal‐
operational thought and conceptual difficulties in genetics problem solving. Journal of Research
in Science Teaching, 26(9), 811-821.
Ha, M., & Nehm, R. H. (2014). Darwin’s difficulties and students’ struggles with trait loss:
cognitive-historical parallelisms in evolutionary explanation. Science & Education, 23(5), 1051-
1074.
Ha, M., Nehm, R. H., Urban-Lurain, M., & Merrill, J. E. (2011). Applying computerized-scoring
models of written biological explanations across courses and colleges: prospects and limitations.
CBE—Life Sciences Education, 10(4), 379-393.
Hackling, M. W. (1990). The development of expertise in genetic pedigree problem solving
(unpublished Doctoral dissertation, Murdoch University).
Hackling, M. W., & Lawrence, J. A. (1988). Expert and novice solutions of genetic pedigree
problems. Journal of Research in Science Teaching, 25(7), 531-546.

18
Hackling, M. W., & Treagust, D. (1984). Research data necessary for meaningful review of
grade ten high school genetics curricula. Journal of Research in Science Teaching, 21(2), 197-
209.
Hafner, R., & Stewart, J. (1995). Revising explanatory models to accommodate anomalous
genetic phenomena: Problem solving in the “context of discovery”. Science Education, 79(2),
111-146.
Hickey, D. T., Wolfe, E. W., & Kindfield, A. C. (2000). Assessing learning in a technology-
supported genetics environment: Evidential and systemic validity issues. Educational
Assessment, 6(3), 155-196.
Hildebrand, A. C. (1991). Pictorial representations and understanding genetics: An expert/novice
study of meiosis knowledge. (unpublished Doctoral dissertation, University of California,
Berkeley)
Hmelo-Silver, C. E., Duncan, R. G., & Chinn, C. A. (2007). Scaffolding and achievement in
problem-based and inquiry learning: a response to Kirschner, Sweller, and. Educational
psychologist, 42(2), 99-107.
Horwitz, P., Schwartz, J., Kindfield, A. C., Yessis, L. M., Hickey, D. T., Heidenberg, A. J., &
Wolfe, E. W. (1998). Implementation and evaluation of the GenScope learning environment:
Issues, solutions, and results. In Guzdial, M., Kolodner, J., & Bruckman, A. (Eds.) (1998).
Proceedings of the Third International Conference of the Learning Sciences. Charlottesville,
VA: Association for the Advancement of Computers in Education.
Hott, A. M., Huether, C. A., McInerney, J. D., Christianson, C., Fowler, R., Bender, H., Jenkins,
J., Wysocki, A., Markle, G. & Karp, R. (2002). Genetics content in introductory biology courses
for non-science majors: Theory and practice. BioScience, 52(11), 1024-1035.
Huppert, J., Lomask, S. M., & Lazarowitz, R. (2002). Computer simulations in the high school:
students’ cognitive stages, science process skills and academic achievement in microbiology.
International Journal of Science Education, 24(8), 803–821.
International Baccalaureate Organization. (2014). Diploma Programme Biology Guide. Cardiff,
Wales: Author.
Jamieson, A., & Radick, G. (2013). Putting Mendel in his place: how curriculum reform in
genetics and counterfactual history of science can work together. In The philosophy of biology
(pp. 577-595). Springer, Dordrecht.
Jiménez-Aleixandre, M. P. (2014). Determinism and underdetermination in genetics:
Implications for students’ engagement in argumentation and epistemic practices. Science &
Education, 23(2), 465-484.

19
Jimenez-Aleixandre, M. P., Rodriguez, A. B., & Duschl, R. A. (2000). " Doing the lesson" or
"doing science": Argument in high school genetics. Science Education, 84(6), 757-792.
Jungck, J. R., & Calley, J. (1988). Genetics construction kit. Quality Undergraduate Education
Simulation Tools. CD-ROM.
Kahle, J. B., and Meece, J. (1994). Research on gender issues in the classroom. In D.E. Gabel
(Ed.). Handbook of research on science teaching and learning (pp. 542-557). New York: Simon
& Schuster Macmillan.
Kampourakis, K., Reydon, T. A., Patrinos, G. P., & Strasser, B. J. (2014). Genetics and
Society—Educating Scientifically Literate Citizens: Introduction to the Thematic Issue. Science
& Education, 23(2), 251-258.
Kargbo, D. B., Hobbs, E. D., & Erickson, G. L. (1980). Children's beliefs about inherited
characteristics. Journal of Biological Education, 14(2), 137-146.
Kindfield, A. C. (1991). Confusing chromosome number and structure: a common student error.
Journal of Biological Education, 25(3), 193-200.
Kindfield, A. C. (1994). Understanding a basic biological process: Expert and novice models of
meiosis. Science Education, 78(3), 255-283.
Kinnear, J. F. (1983). Identification of misconceptions in genetics and the use of computer
simulations in their correction. In Proceedings of the international seminar on misconceptions in
science and mathematics (pp. 84-92). Ithaca, NY: Cornell University.
Kinnear, J. F. (1986). Computer Simulation & Problem Solving in Genetics. Paper presented at
the annual meeting of the American Educational Research Association, San Francisco, CA. April
16-20.
Kinnear, J. F., & Simmons, P. E. (1990). " Expert" and" novice" subjects’ approaches to genetic
problem solving in a computer-based setting. Research in Science Education, 20(1), 171-180.
Knippels, M. C. P., Waarlo, A. J., & Boersma, K. T. (2005). Design criteria for learning and
teaching genetics. Journal of Biological Education, 39(3), 108-112.
Krauskopf, S. (1999). Doing the Meiosis Shuffle. The American Biology Teacher, 61(1), 60-61.
Lauer, S., Momsen, J., Offerdahl, E., Kryjevskaia, M., Christensen, W., & Montplaisir, L.
(2013). Stereotyped: investigating gender in introductory science courses. CBE-Life Sciences
Education, 12(1), 30-38.
Lawson, A. E., & Renner, J. W. (1975). Relationships of science subject matter and
developmental levels of learners. Journal of Research in Science Teaching, 12(4), 347-358.

20
Lee, O., and Luykx, A. (2007). Science education and student diversity: Race/ethnicity,
language, culture, and socioeconomic status. In S. K. Abell & N. G. Lederman (Eds.), Handbook
of research on science education, 1, 171-197. New York: Routledge.
Lewis, J., Leach, J., & Wood-Robinson, C. (2000). Chromosomes: the missing link—young
people's understanding of mitosis, meiosis, and fertilisation. Journal of Biological Education,
34(4), 189-199.
Lewis, J., & Kattmann, U. (2004). Traits, genes, particles and information: re‐visiting students’
understandings of genetics. International Journal of Science Education, 26(2), 195-206.
Linn, M. C., & Hyde, J. S. (1989). Gender, mathematics, and science. Educational Researcher,
18(8), 17-27.
Longden, B. (1982). Genetics—are there inherent learning difficulties?. Journal of Biological
Education, 16(2), 135-140.
Marbach-Ad, G. (2001). Attempting to break the code in student comprehension of genetic
concepts. Journal of Biological Education, 35(4), 183-189.
Marbach-Ad, G., & Stavy, R. (2000). Students' cellular and molecular explanations of genetic
phenomena. Journal of Biological Education, 34(4), 200-205.
Mayer, R. (2013). Problem solving. In D. Reisberg (Ed.), Oxford Handbook of Cognitive
Psychology (pp. 769-778). New York: Oxford.
Moll, M. B., & Allen, R. D. (1987). Student difficulties with Mendelian genetics problems. The
American Biology Teacher, 49(4), 229-233
Morange, M. (2001). The misunderstood gene. Cambridge, MA: Harvard University Press.
National Research Council (Ed.). (1996). National science education standards. Washington,
DC: National Academy Press.
National Research Council. (2012). A Framework for K-12 Science Education: Practices,
Crosscutting Concepts, and Core Ideas. Washington, DC: The National Academies Press.
Nehm, R. H., Beggrow, E. P., Opfer, J. E., & Ha, M. (2012). Reasoning about natural selection:
Diagnosing contextual competency using the ACORNS instrument. The American Biology
Teacher, 74(2), 92–98.
Nehm, R. H., & Ha, M. (2011). Item feature effects in evolution assessment. Journal of Research
in Science Teaching, 48(3), 237–256.

21
Nehm, R. H., Ha, M., & Mayfield, E. (2012). Transforming biology assessment with machine
learning: automated scoring of written evolutionary explanations. Journal of Science Education
and Technology, 21(1), 183-196.
Nehm, R. H., & Reilly, L. (2007). Biology majors’ knowledge and misconceptions of natural
selection. BioScience, 57(3), 263–272.
Nehm, R. H., Ridgway, J. (2011). What do experts and novices “see” in evolutionary problems?
Evolution Education and Outreach. 4(4), 666-679.
Nehm, R. H., & Schonfeld, I. S. (2008). Measuring knowledge of natural selection: a comparison
of the CINS, an open‐response instrument, and an oral interview. Journal of Research in Science
Teaching, 45(10), 1131-1160.
Novak, J. D. (2002). Meaningful learning: The essential factor for conceptual change in limited
or inappropriate propositional hierarchies leading to empowerment of learners. Science
education, 86(4), 548-571.
NGSS Lead States. (2013). Next Generation Science Standards: For states, by states.
Washington, DC: The National Academies Press.
Opfer, J., Nehm, R. H., Ha, M. (2012). Cognitive Foundations for Science Assessment Design:
Knowing What Students Know about Evolution. Journal of Research in Science Teaching.
49(6), 744–777
Pearson, J. T., & Hughes, W. J. (1988). Problems with the use of terminology in genetics
education: 1, A literature review and classification scheme. Journal of Biological Education,
22(3), 178-182.
Pearsall, N. R., Skipper, J. E. J., & Mintzes, J. J. (1997). Knowledge restructuring in the life
sciences: A longitudinal study of conceptual change in biology. Science Education, 81(2), 193-
215.
Peng, S. S., Wright, D., and Hill, S. T. (1995). Understanding racial-ethnic differences in
secondary school science and mathematics achievement (NCES 95-710). Washington, DC: U. S.
Department of Education.
Portin, P. (2002). Historical development of the concept of the gene. In The Journal of Medicine
and Philosophy: A Forum for Bioethics and Philosophy of Medicine (Vol. 27, No. 3, pp. 257-
286). Journal of Medicine and Philosophy Inc.
Portin, P., & Wilkins, A. (2017). The Evolving Definition of the Term “Gene”. Genetics, 205(4),
1353-1364.
Radford, A., & Bird-Stewart, J. A. (1982). Teaching genetics in schools. Journal of Biological
Education, 16(3), 177-180.

22
Richards, M. (1996). Lay and professional knowledge of genetics and inheritance. Public
Understanding of Science, 5(3), 217-230.
Sabella, M.S., & Redish, E.F. (2007). Knowledge organization and activation in physics problem
solving. American Journal of Physics, 75, 1017–1029.
Sadler, T. D. (2003). Informal Reasoning Regarding Socioscientific Issues: The Influence of
Morality and Content Knowledge. (Unpublished Doctoral Dissertation). University of South
Florida, FL.
Sadler, T. D., & Donnelly, L. A. (2006). Socioscientific argumentation: The effects of content
knowledge and morality. International Journal of Science Education, 28(12), 1463-1488.
Sadler, T. D., & Fowler, S. R. (2006). A threshold model of content knowledge transfer for
socioscientific argumentation. Science Education, 90(6), 986-1004.
Sadler, T. D., & Zeidler, D. L. (2005). The significance of content knowledge for informal
reasoning regarding socioscientific issues: Applying genetics knowledge to genetic engineering
issues. Science Education, 89(1), 71-93
Scantlebury, K. (2014). Gender Matters. In N. K. Lederman & S. K. Abell (Eds.), Handbook of
Research on Science Education, 2, (pp. 187-203). New York: Routledge.
Scantlebury, K., and Baker, D. (2007). Gender issues in science education: Remembering where
the difference lies. In S. K. Abell & N. G. Lederman (Eds.), Handbook of research on science
education, 1, (pp. 31-56). New York: Routledge.
Schmiemann, P., Nehm, R. H., & Tornabene, R. E. (2017). Assessment of Genetics
Understanding. Science & Education, 26(10), 1161-1191.
Shea, N. A., Duncan, R. G., & Stephenson, C. (2015). A tri-part model for genetics literacy:
Exploring undergraduate student reasoning about authentic genetics dilemmas. Research in
Science Education, 45(4), 485-507.
Shepardson, D. P., & Pizzini, E. L. (1994). Gender, achievement, and perception toward science
activities. School Science and Mathematics, 94(4), 188-193.
Simmons, P. E., & Lunetta, V. N. (1993). Problem‐solving behaviors during a genetics computer
simulation: Beyond the expert/novice dichotomy. Journal of Research in Science Teaching,
30(2), 153-173.
Slack, S. J., & Stewart, J. (1990). High school students' problem‐solving performance on realistic
genetics problems. Journal of Research in Science Teaching, 27(1), 55-67.

23
Smith, M.U. (1983). A comparative analysis of the performance of experts and novices while
solving selected classical genetics problems. (Unpublished doctoral dissertation). Florida State
University, FL.
Smith, M. U. (1988). Successful and unsuccessful problem solving in classical genetic pedigrees.
Journal of Research in Science Teaching, 25(6), 411-433.
Smith, M. U., & Adkison, L. R. (2010). Updating the model definition of the gene in the modern
genomic era with implications for instruction. Science & Education, 19(1), 1-20.
Smith, M. U., & Good, R. (1984). Problem solving and classical genetics: Successful versus
unsuccessful performance. Journal of Research in Science Teaching, 21(9), 895-912.
Smith, M. U., & Gericke, N. M. (2015). Mendel in the modern classroom. Science & Education,
24(1-2), 151-172.
Smith, M. U., & Sims, O. S. (1992). Cognitive development, genetics problem solving, and
genetics instruction: A critical review. Journal of Research in Science Teaching, 29(7), 701-713.
Soyibo, K. (1999). Gender differences in Caribbean participants' performance on a test of errors
in biological labelling. Research in Science & Technological Education, 17(1), 75-82.
Stanger-Hall, K. F. (2012). Multiple-choice exams: an obstacle for higher-level thinking in
introductory science classes. CBE-Life Sciences Education, 11(3), 294-306.
Stanley, W. B., & Brickhouse, N. W. (1994). Multiculturalism, universalism, and science
education. Science education, 78(4), 387-398.
Stencel, J. (1995). A string & paper game of meiosis that promotes thinking. The American
Biology Teacher, 57(1), 42-45.
Stewart, J. H. (1982). Difficulties experienced by high school students when learning basic
Mendelian genetics. The American Biology Teacher, 44(2), 80-89.
Stewart, J. (1983). Student problem solving in high school genetics. Science Education, 67(4),
523-540.
Stewart, J. (1988). Potential learning outcomes from solving genetics problems: A typology of
problems. Science Education, 72(2), 237-254
Stewart, J., Cartier, J. L., & Passmore, P. M. (2005). Developing understanding through model-
based inquiry. In M. S. Donovan & J. D. Bransford (Eds.), How students learn (pp. 515–565).
Washington D.C: National Research Council.
Stewart, J., & Dale, M. (1981). Solutions to genetics problems: Are they the same as correct
answers. The Australian Science Teacher, 27(3), 59-64.
24
Stewart, J., & Dale, M. (1989). High school students' understanding of chromosome/gene
behavior during meiosis. Science Education, 73(4), 501-521.
Stewart, J., Hafner, B. & Dale, M. (1990). Students' alternate views of meiosis. The American
Biology Teacher, 52(4), 228-232.
Stewart, J., & Van Kirk, J. (1990). Understanding and problem‐solving in classical genetics.
International Journal of Science Education, 12(5), 575-588.
Sweller, J. (1988). Cognitive load during problem solving: Effects on learning. Cognitive
science, 12(2), 257-285.
Thomson, N., & Stewart, J. (1985). Secondary school genetics instruction: making problem
solving explicit and meaningful. Journal of Biological Education, 19(1), 53-62.
Thörne, K., & Gericke, N. (2014). Teaching Genetics in Secondary Classrooms: a Linguistic
Analysis of Teachers' Talk About Proteins. Research in Science Education, 44(1).
Thörne, K., Gericke, N. M., & Hagberg, M. (2013). Linguistic challenges in Mendelian genetics:
Teachers’ talk in action. Science Education, 97(5), 695-722.
Todd, A., & Kenyon, L. (2016). Empirical refinements of a molecular genetics learning
progression: The molecular constructs. Journal of Research in Science Teaching, 53(9), 1385-
1418.
Todd, A., & Romine, W. L. (2016). Validation of the Learning Progression-based Assessment of
Modern Genetics in a college context. International Journal of Science Education, 38(10), 1673-
1698.
Todd, A., & Romine, W. L. (2017) Difficulties in Integrating the Genetic-Meiotic and Genetic-
Molecular Models of Genetics. Paper presented at NARST Annual International Conference, San
Antonio, TX, April 22-25.
Todd, A., Romine, W. L., & Cook Whitt, K. (2017). Development and Validation of the
Learning Progression–Based Assessment of Modern Genetics in a High School Context. Science
Education, 101(1), 32-65.
Tolman, R. R. (1982). Difficulties in Genetics Problem Solving. American biology teacher,
44(9), 525-27.
Tsui, C. Y., & Treagust, D. F. (2003). Genetics reasoning with multiple external representations.
Research in Science Education, 33(1), 111-135.
Tsui, C. Y., & Treagust, D. F. (2007). Understanding genetics: Analysis of secondary students'
conceptual status. Journal of Research in Science Teaching, 44(2), 205-235.

25
Tsui, C. Y., & Treagust, D. (2010). Evaluating secondary students’ scientific reasoning in
genetics using a two‐tier diagnostic instrument. International Journal of Science Education,
32(8), 1073-1098.
Venville, G., & Donovan, J. (2008). How pupils use a model for abstract concepts in genetics.
Journal of Biological Education, 43(1), 6-14.
Venville, G., Gribble, S. J., & Donovan, J. (2005). An exploration of young children's
understandings of genetics concepts from ontological and epistemological perspectives. Science
Education, 89(4), 614-633.
Walker, R. A. (1979). Formal operational reasoning patterns and scholastic achievement in
genetics. Journal of College Science Teaching, 8(3), 156-58.
Walker, R. A., Hendrix, J. R., & Mertens, T. R. (1980). Sequenced instruction in genetics and
Piagetian cognitive development. The American Biology Teacher, 42(2), 104-108.
Ware, E. A., & Gelman, S. A. (2014). You get what you need: An examination of purpose‐based
inheritance reasoning in undergraduates, preschoolers, and biological experts. Cognitive science,
38(2), 197-243.
Weinburgh, M. (1995). Gender differences in student attitudes toward science: A meta‐analysis
of the literature from 1970 to 1991. Journal of Research in Science Teaching, 32(4), 387-398.
Willoughby, S. D., & Metz, A. (2009). Exploring gender differences with different gain
calculations in astronomy and biology. American Journal of Physics, 77(7), 651-657.
Wright, C. D., Eddy, S. L., Wenderoth, M. P., Abshire, E., Blankenbiller, M., and Brownell, S.
E. (2016). Cognitive Difficulty and Format of Exams Predicts Gender and Socioeconomic Gaps
in Exam Performance of Students in Introductory Biology Courses. CBE-Life Sciences
Education, 15(2), ar23.

26
Chapter 2. Psychometric Analysis Using Item Response Theory
2.1 Introduction
Accurate measurements of student understanding are essential for educators and
researchers alike (Campbell & Nehm 2013). A growing array of assessments are being
developed to generate data about undergraduate understanding in a variety of STEM disciplines,
whether study-specific instruments (e.g., Cavallo 1996; Tsui & Treagust 2010), Concept
Inventories (e.g., chemical bonding, physical forces, genetics, and natural selection) or broader
learning-progression aligned instruments (e.g., Todd & Romine 2016). Although organizations
such as the American Educational Research Association, American Psychological Association,
National Council on Measurement in Education (AERA, APA & NCME 2014) and measurement
experts such as Messick (1995) have outlined standards for construct validity and reliability of
assessment scores, such evidence for the majority of these instruments remains limited, and
rooted in classical test theory (CTT), despite the known advantages of Item Response Theory
(IRT) and Rasch modeling (Boone, Staver & Yale 2014). For example, of ten recently-developed
instruments assessing Mendelian inheritance (see Chapter 4), only six were supported by any
form of validity or reliability evidence, only one of which used IRT/Rasch analysis (see Table
4.1). More robust evidence in support of the validity and reliability of inferences generated by
measurement instrument scores is essential to support claims in science education. In a recent
review of the status of genetics instruction in higher education, McElhinny et al. (2014)
specifically identified the need for genetics measurement instruments evaluated using the more
powerful IRT framework. The studies produced for this dissertation provide additional evidence
to that end.
The IRT framework and Rasch modelling provide several advantages over CTT for
instrument evaluation and the generation of accurate scores. This chapter provides background
on IRT and Rasch, describes several advantages of the IRT framework, and explains how Rasch
modeling via WINSTEPS (Linacre 2017a) or ConQuest (Adams et al. 2016) software is
employed to empirically evaluate the validity and reliability of inferences derived from the
scores of the instruments used in the studies herein (the Genetic Drift Inventory [GeDI; Price
et.al. 2014] and a project-specific Mendelian inheritance instrument) for their respective
populations (Chapters 3 and 4, respectively).
2.1 Instrument evaluation using Item Response Theory
The frameworks for developing and evaluating assessment instruments have changed
substantially over the past few decades. Familiarity with modern instrument evaluation methods
is essential in order to understand the strengths and weaknesses of the measures that are derived
from science education instruments (AERA, APA, NCME 2014). Classical Test Theory (CTT)
and Item Response Theory (IRT) are two conceptual and empirical frameworks commonly used
for analyzing and evaluating measurement instruments.
Item response theory is a model-based psychometric approach centered on the premise
that responses to an item set measuring a single trait are functions of both the test taker’s
attributes (i.e., ability level on the trait) and the item’s attributes (i.e., difficulty). IRT posits a
predictable response pattern (model) whereby easier items are correctly answered more
frequently than difficult items, and more able persons correctly answer more items, including the
27
more difficult items. Parameters of person ability and item difficulty are estimated from a set of
iterative comparisons of response patterns according to this premise. A variety of IRT models
exist, varying in the type of instrument responses they accommodate (e.g., dichotomous or
polytomous) and in the number of parameters considered (e.g., the 1 parameter logistic, or 1PL,
model considers the parameter of item difficulty, while the two parameter logistic model, 2PL,
considers both difficulty and discrimination; see Bond & Fox 2007 for more information).
Rasch methodologies share much in common with the IRT framework, and are often
considered to be a form of IRT. The dichotomous Rasch model (used in the Chapters 3 and 4) is
mathematically equivalent to the 1PL IRT model. A key philosophical and practical distinction
between Rasch and other IRT analyses is that Rasch considers only the first IRT parameter (item
difficulty) and does not alter the model (e.g., add parameters) to fit the data. As such, Rasch
affords characterization of persons and items in a manner that is more robust, with greater
inferential potential, than CTT or other IRT approaches (Bond & Fox 2007; Boone et al. 2014).
Several of Rasch’s advantages that are discussed in the following paragraphs stem from this
distinction.
2.3 Advantages of Rasch and IRT
2.3.1 Ratio-scale logit scores for persons and items
The vast majority of science education instruments have been developed and evaluated
using CTT as a guiding framework. IRT/Rasch frameworks address many inherent limitations of
CTT (Bond & Fox 2007; Nehm & Schonfeld 2008; Boone et al. 2014). One major advantage of
IRT and Rasch methods is their conversion of raw (interval scale) test scores into linear, ratio-
scaled scores. This feature is essential for addressing unequal difficulty intervals between raw
test scores. Consider, for example, the ability difference between two low performing individuals
whose raw scores differ by one point (e.g., scores of 70 and 71 out of 100) and the ability
difference between two high performing individuals whose scores also differ by one point (e.g.,
scores of 99 and 100). It is unlikely that the items that separated the two high-achieving students
have the same difficulty value as the items that separated the low achieving students, and yet for
both pairs the difference between raw scores is equal (1 point). Because raw scores are calculated
without consideration of item difficulty, they do not adequately represent the true ability
difference between individuals. Put another way, the quantity “one point” does not seem to
measure the same attribute in these four students; the true difference in ability between the two
high achieving students would be much greater than the difference between the two lower-
scoring students. Rasch ratio-scale scores are calculated with consideration of item difficulty and
thus remedy raw score inconsistencies. Conversion to linear data is also crucial to satisfy the
assumptions of parametric statistical analyses commonly conducted using test scores. In sum,
IRT/Rasch methods address a fundamental problem with CTT scores: non-ratio-scaled data.
Rasch scores (or “measures”) for persons and items are reported as logit units and derive
from a probability-based logarithmic equation that considers both item difficulty and person
ability. Using the same logit scale to quantify both item difficulty and person ability facilitates
comparison among items, persons, and items and persons. It also affords analyses capable of
determining the probability that a particular person could solve a particular item. In typical
Rasch analyses, mean item difficulty and mean person ability are set at 0 logits. More difficult
items (or higher achievers) are given higher scores, while easier items (or lower achievers) are

28
given lower (more negative) scores. When logit values for person measure and item measure are
equivalent, an individual has a 50% probability of correctly answering the item (Bond & Fox
2007, p. 38).
2.3.2 Instrument dimensionality
An important component of instrument evaluation is confirmation of the instrument’s
dimensionality. Most instrument evaluation methods and parametric analyses of data generated
by instruments assume unidimensionality, or that the instrument measures one (and only one)
construct (Neumann et al. 2011). Attempting to capture more than one construct at a time, or
probing distinct facets of a single construct, can introduce multidimensionality.
Multidimensionality presents complications when reporting an individual’s instrument scores as
a single value (e.g., Which portions of the total score represent which construct?) and for
analyses--including Rasch--that inherently assume one construct is being measured. (Note that
methodological extensions of Rasch do exist that can accommodate multidimensionality.) Thus,
multidimensional instruments must either (1) be treated as multiple unidimensional instruments,
with scores reported and analyzed as such (along with corresponding validity evidence), or (2) be
analyzed with advanced psychometric methodologies specific to multidimensionality.
Traditional CTT-aligned approaches to ascertaining dimensionality (e.g., confirmatory
factor analysis and principal component analysis) can be problematic: these analyses typically
require data to be normally distributed and conform to an equal interval scale, which, as has been
mentioned, is most often not the case. In evaluating the degree to which an instrument is
multidimensional, principal components analysis of Rasch-scaled scores offers information on
the response variance that can be attributed to the items (i.e., variance explained by the model;
first contrast in Rasch-scaled principal component analysis) and the degree to which response
variance is unexplained (i.e., the second contrast, and so on). A second dimension is
hypothesized to exist if the unexplained variance is larger than what would be expected to be due
to random noise in the data (for details, see Raiche 2005). Variance beyond the random noise
threshold can be attributed to additional dimensions within the instrument, though other
considerations such as construct structure, variance in responses, and the purpose of
measurement afford some degree of flexibility in this interpretation (Linacre 2017b).
2.3.3 Wright maps
A display of all person and item measures for a unidimensional construct on a shared
logit scale (commonly known as a Wright map, e.g., Figures 3.1 and 4.1) is another powerful and
unique application of Rasch. This side-by-side comparison enables researchers to examine the
alignment of test items to test taker “ability” and to identify possible measurement gaps (i.e.
difficulty/ability ranges in which items are lacking). Items are represented by their respective
number on the right side of the scale, while persons are represented by “X’s” on the left side of
the scale. Given the probabilistic nature of the analysis, each person has a 50% chance of
correctly answering an item with an equivalent measure. In a well-designed instrument, question
difficulty should be aligned with test-taker ability, with items present that are able to differentiate
among learners at all ability levels. Thus, instrument evaluation using a Wright map includes
examining the match of the “spread” of test takers to the “spread” of test items. Items that are too
easy appear below the lowest test takers (having been estimated to be correctly answered by

29
everyone, these items likely add little value to the measures), while items that are too difficult
appear above the highest test takers (these items may be too challenging for the sample). If all of
the persons are plotted above the highest item or below the lowest item, then the items lack
alignment with ability level. Multiple items aligned at the same difficulty levels on the Wright
map, and testing the same concept or misconception, add little to measurement and are
candidates for elimination. Large clusters of persons at the same ability level indicate locations
where additional items could be added to better separate their abilities. Overall, the Wright map
is a useful visual tool for examining instrument properties and person-item relationships.
2.3.4 Item and person fit
Analyses of the degree to which the empirical data fit the statistical Rasch model are one
approach for evaluating the quality of the test items, the test instrument, and overall evidence in
support of validity claims (Boone et al. 2014). Rasch analysis includes several parameters to
examine model fit. Overall item fit and person fit scores describe how well the collective item set
and collective person sample fit the Rasch model respectively. These values provide insights into
overall instrument function. Individual item and person fit statistics are useful for determining
whether items and persons fit the Rasch model. Poor model fit reveals when items and persons
behave unexpectedly (e.g., an item may be interpreted differently and elicit inconsistent
responses, a person may guess, a high ability person may get some low difficulty items wrong).
Accordingly, poorly functioning individual items or persons can be identified using these fit
statistics.
In Rasch measurement, fit is expressed as weighted (“infit”) or unweighted (“outfit”)
values for the mean square parameter (MNSQ), and calculation of fit is based on a chi-square
test of how well the empirical data fit the Rasch model (Bond & Fox 2007, p. 238). For a
standard multiple choice assessment, MNSQ values above 1.3 are considered to be
“underfitting”, indicating that the response pattern for that item is erratic. Values below 0.7 are
considered to be “overfitting”, indicating that the response pattern is overly predictable. Both
overfit and underfit suggest that the item is not functioning properly (i.e., eliciting information
consistent with test-taker ability). Cut off values of 0.7 and 1.3 are used for the MNSQ parameter
to ensure an adequate match between the empirical data and the statistical model (Boone et al.
2014; Bond & Fox 2007). Z-Standard (ZSTD) scores are transformed t-test statistics that report
the probability of MNSQ scores occurring by chance when the data fit the Rasch model (Linacre
2017b). Ideal ZSTD scores range from 0 to 2. However, as sample size increases, accumulation
of random responses tends to elevate ZSTD scores (Smith et al. 2008). For this reason, and
because ZSTD statistics are based on MNSQ statistics, ZSTD values are considered secondary to
MNSQ scores. Depending upon measurement goals and sample sizes, ZSTD scores may be
ignored if MNSQ values are acceptable (Linacre 2017b). With multiple indicators of fit that
correspond to different causes of misfit as well as parameters to report the probability of fit
statistics, Rasch and IRT provide a much more detailed characterization of item fit properties
compared to CTT.
2.3.5 Item and person reliability
Further indicators of instrument quality include Rasch item and person (separation)
reliability measures, which reflect internal consistency and can be interpreted analogously to

30
Cronbach’s alpha in CTT (cf. Wright & Stone 1979). Together, acceptable item reliability and
person reliability indicate that the item set functions to differentiate the measured trait into a
number of ability levels sufficient for measurement goals in manner that can be replicated in
comparable samples. Specifically, item reliability addresses whether the persons sampled
demonstrated sufficiently diverse abilities to support the calculated item difficulty structure,
while person reliability addresses whether the item difficulty structure is sufficient to reliably
produce person measures. Together these are again a more nuanced measurement of reliability
than CTT affords.
Item reliability values <0.9 suggest that the participant sample is likely to be too small to
confirm the apparent item-difficulty structure. Person reliability values <0.8 suggest that
assessment items are insufficient to distinguish among test takers. This may also suggest that the
Rasch person measure score (or how well each person performed based on the Rasch ratio-score
model) may not be a reliable reflection of person ability (Boone et al. 2014). These values are
guidelines for a “general” instrument and sample, and should be interpreted according to specific
characteristics of an instrument including its format (e.g., number of items, number of response
choices), and the stated goals of measurement (e.g., norm- or criterion-referenced) (Boone et al.
2014; Linacre 2017b).
2.3.6 Missing data
A key benefit of IRT and Rasch modeling is the ability to readily accommodate
“missing” data. Because person estimates are based on the probability a person will correctly
respond to a given item of a particular difficulty, failure to answer a few items among many
others whose difficulty is known does not significantly impact person estimates; the model is
able to predict how a person would likely have answered a skipped question based on responses
to items of similar difficulty. Similarly, because item measures are estimated based on the
probability that a person of a determined ability will select a correct answer for that item, item
estimates are not impacted by the absence of a few individuals’ responses from among many
responses of known ability. These properties ensure that Rasch person scores are item-
independent and item scores are sample-independent, characteristics which afford researchers the
widespread benefit of being able to confidently utilize partially completed student response sets.
Accommodation of missing data is also essential for computer adaptive testing (Bond & Fox
2007) and multi-matrix studies in which participants are assigned only a subset of items from the
total collection of questions (cf. Sirotnik and Wellington 1977; e.g., Schmiemann, Nehm &
Tornabene 2017). Such designs allow testing of a wider variety of items while minimizing
participant test fatigue. Accommodation of missing data is also important in strategies intended
to minimize the impact of guessing, including multi-tiered instruments that incorporate answer
confidence tiers (cf. Romine, Schaffer & Barrow 2015). In sum, Rasch and IRT hold
considerable potential for expanding the body of empirical evidence on instrument quality, yet
remain broadly underutilized. The analysis of the GeDI presented in Chapter 3 provides an
example of how Rasch analysis can offer greater insight into the measurement capabilities and
limitations of educational measurement instruments.

31
2.3.7 Rating scale optimization
Rasch converts ordinal rating scale survey responses into linear data affording more
meaningful interpretation and analysis of rating scale surveys. Though not specific to this
project, this point is worth mentioning because many biology education instruments include
rating scales (e.g., Carver al. 2017; Glynn et al. 2011; Nadelson & Southerland 2012; Rutledge &
Warden 1999; Smith, Snyder & Devereaux 2016). Rasch analysis further provides information
about how well each item’s rating scale category functions to capture respondents’ perspectives,
which facilitates revision and optimization of rating scale categories. These represent notable
advantages over CTT and traditional item analysis, which are unable to account for arbitrary and
inconsistently spaced rating scale categories and consequently cannot yield conclusive
information about the trait of interest (Boone et al. 2014). More studies are needed throughout
the science education field, especially for rating scale instruments, to improve the quality of
measurement in all science disciplines.
2.4 Use of IRT in this project
The present project employs Rasch analysis to generate evidence about the validity,
reliability and generalizability of score inferences from two genetics education instruments-- one
relating to genetic drift (GeDI) and one on Mendelian inheritance. This aspect of the project will
serve to (1) add to the body of empirical evidence underlying the quality of research instruments
(2) suggest possible limitations of selected instruments and identify possible areas for instrument
improvement, and (3) empirically support conclusions to additional research questions posed
herein about measurement of genetics knowledge (cf. Chapter 4).
2.5 References (Chapter 2)
Adams, R., Wu, M., Macaskill, G., Haldane, S. A., & Sun, X. X. (2016). ConQuest [Computer
software]. Melbourne: Australian Council for Educational Research.
American Educational Research Association, American Psychological Association, and National
Council on Education (AERA, APS, NCEM). (2014). The Standards for Educational and
Psychological Testing. Washington, DC: Author. (2014).
Bond, T. G., & Fox, C. M. (2007). Applying the Rasch model: Fundamental measurement in the
human sciences (2nd ed.). Mahwah, NJ: Lawrence Erlbaum Associates.
Boone, J., Staver, J. R., & Yale, M. S. (2014). Rasch analysis in the human sciences. Dordrecht,
Netherlands: Springer.
Campbell, C. E., & Nehm, R. H. (2013). A critical analysis of assessment quality in genomics
and bioinformatics education research. CBE-Life Sciences Education, 12(3), 530-541.
Carver, R. B., Castéra, J., Gericke, N., Evangelista, N. A. M., & El-Hani, C. N. (2017). Young
adults’ belief in genetic determinism, and knowledge and attitudes towards modern genetics and
genomics: the PUGGS questionnaire. PloS one, 12(1), e0169808.
32
Cavallo, A.M.L., (1996). Meaningful learning, reasoning ability, and students' understanding and
problem solving of topics in genetics. Journal of Research in Science Teaching, 33(6), 625-56.
Glynn, S. M., Brickman, P., Armstrong, N., & Taasoobshirazi, G. (2011). Science motivation
questionnaire II: Validation with science majors and nonscience majors. Journal of research in
science teaching, 48(10), 1159-1176.
Linacre, J. M. (2017a). Winsteps® Rasch measurement computer program. Beaverton, Oregon:
Winsteps.com
Linacre, J. M. (2017b). Winsteps® Rasch measurement computer program User's Guide.
Beaverton, Oregon: Winsteps.com
Messick, S. (1995). Validity of psychological assessment: Validation of inferences from persons'
responses and performances as scientific inquiry into score meaning. American Psychologist,
50(9), 741-749.
McElhinny, T. L., Dougherty, M. J., Bowling, B. V., & Libarkin, J. C. (2014). The status of
genetics curriculum in higher education in the United States: goals and assessment. Science &
Education, 23(2), 445-464.
Nadelson, L. S., & Southerland, S. (2012). A more fine-grained measure of students' acceptance
of evolution: development of the Inventory of Student Evolution Acceptance—I-SEA.
International Journal of Science Education, 34(11), 1637-1666.
Nehm, R. H., & Schonfeld, I. S. (2008). Measuring knowledge of natural selection: a comparison
of the CINS, an open‐response instrument, and an oral interview. Journal of Research in Science
Teaching, 45(10), 1131-1160.
Neumann, I., Neumann, K., & Nehm, R. (2011). Evaluating instrument quality in science
education: Rasch-based analyses of a nature of science test. International Journal of Science
Education, 33(10), 1373–1405.
Price, R.M., Andrews T.M., McElhinny T.L., Mead L.S., Abraham J.K., Thanukos A., Perez
K.E. (2014). The Genetic Drift Inventory: A tool for measuring what undergraduates have
mastered about genetic drift. CBE-Life Science Education, 13(1), 65–75.
Raîche, G. (2005). Critical Eigenvalue Sizes (Variances) in Standardized Residual Principal
Components Analysis.Rasch Measurement Transactions. 19(1): 1012
http://www.rasch.org/rmt/rmt221j.htm
Romine, W. L., Schaffer, D. L., & Barrow, L. (2015). Development and application of a novel
Rasch-based methodology for evaluating multi-tiered assessment instruments: Validation and
utilization of an undergraduate diagnostic test of the water cycle. International Journal of
Science Education, 37(16), 2740-2768

33
Rutledge, M. L., & Warden, M. A. (1999). The development and validation of the measure of
acceptance of the theory of evolution instrument. School Science and Mathematics, 99(1), 13-18.
Schmiemann, P., Nehm, R. H., & Tornabene, R. E. (2017). Assessment of genetics
understanding: Under what conditions do situational features have an impact on measures?
Science & Education, 26(10), 1161-1191.
Sirotnik, K., & Wellington, R. (1977). Incidence sampling: an integrated theory for matrix
sampling. Journal of Educational Measurement, 14(4), 343–399.
Smith, A. B., Rush, R., Fallowfield, L. J., Velikova, G., & Sharpe, M. (2008). Rasch fit statistics
and sample size considerations for polytomous data. BMC Medical Research Methodology, 8(1),
33.
Smith, M. U., Snyder, S. W., & Devereaux, R. S. (2016). The GAENE—Generalized acceptance
of evolution evaluation: Development of a new measure of evolution acceptance. Journal of
Research in Science Teaching, 53(9), 1289-1315.
Todd, A., & Romine, W. L. (2016). Validation of the Learning Progression-based Assessment of
Modern Genetics in a college context. International Journal of Science Education, 38(10), 1673-
1698.
Tsui, C. Y., & Treagust, D. (2010). Evaluating secondary students’ scientific reasoning in
genetics using a two‐tier diagnostic instrument. International Journal of Science Education,
32(8), 1073-1098.
Wright, B. D., & Stone, M. (1979). Best Test Design. Rasch Measurement. Chicago: MESA
Press.

34
Chapter 3. Testing Validity Inferences for Genetic Drift Inventory Scores Using Rasch
Modeling and Item Order Analyses
3.1 Introduction
The accurate measurement of student understanding is an essential feature of educational
practice because it provides evidence-based insights into students’ conceptual ecologies, guides
learning progression development, and permits empirical evaluation of the efficacy of alternative
educational interventions (National Research Council 2001). A diverse array of assessment tools
and types have been developed for evolution educators (Table 3.1). They range from static,
multiple-choice formats (e.g., Price et al. 2014) to open-ended questions whose answers can be
scored by computers (e.g., Moherrari et al. 2014). Available assessment tools cover many
different evolutionary concepts, including natural selection, evo-devo, genetic drift, and
macroevolution. These assessments vary significantly in the types of information that they can
reveal about student understanding, in the situations in which they are most appropriately
implemented, and in the robustness of the inferences that they are able to support (AAAS 2011;
AERA, APS, NCME 2014; Nehm and Schonfeld 2008).
3.1.1 Concept Inventories as valid and reliable tools to generate inferences about student
understanding
Concept Inventories (CIs) are a type of research-based educational assessment designed
to rapidly reveal (through easy administration and scoring) students’ preferences for normative
(i.e., scientifically accurate) or non-normative (e.g., preconceptions, misconceptions) facets of
core ideas (e.g., natural selection, genetic drift) (Nehm & Haertig 2012, p. 56-57). Although CIs
have become indispensable tools for assessing undergraduate students’ conceptual
understandings of many core ideas in the sciences (e.g., force and motion, chemical bonding),
few have been carefully evaluated in terms of (1) the forms of validity outlined in the Standards
for Educational and Psychological Testing (AERA, APA, NCME 2014), (2) item order effects
and associated response biases (Federer et al. 2015, 2016), or (3) item properties using ratio-
scaled data (generated by Rasch or Item Response Theory [IRT] analyses; Boone, Staver & Yale
2014). Consequently, validity evidence--that is, evidence that the measures derived from CIs
accurately reflect the construct of interest--remains limited. Given the centrality of accurate
measurement to evidence-based educational practices, evolution education research must include
the study of instrument quality. Such studies help to support instructional decisions firmly rooted
in high-quality evidence.
Given the paucity of work on evolution education instrument quality (Nehm and
Schonfeld 2010), our study examines the psychometric properties of a relatively new evolution
education instrument known as the Genetic Drift Inventory (GeDI). As the only instrument
designed to measure conceptions of non-adaptive evolutionary mechanisms, the GeDI fills a
crucial gap in the array of evolution education instruments and holds potential to offer insights
into a much neglected area of student thinking about evolution. To date, use of the GeDI for
research on genetic drift conceptions and validity evidence for inferences generated by the GeDI
both remain limited to CTT-based data (Price et al. 2014; Price et al. 2016; Price & Perez 2016),
despite availability of more robust IRT and Rasch methodologies (Boone et al. 2014).

35
3.1.2 Research Questions
In order to build a larger body of validity evidence in support of evolution education
assessments in general, and to empirically examine the strengths and weaknesses of the
inferences that may be drawn from GeDI scores in particular, our study explores three research
questions: (1) How well does the GeDI function when studied within the context of the Rasch
model? (2) Does the presentation order of instrument vignettes (and associated item suites)
impact measures of student understanding? And (3) Does the GeDI measure student knowledge
in a manner that is generalizable across geographic regions of the United States (e.g., Northeast,
Southeast, and Midwest) when administered to students of similar academic backgrounds? Prior
to discussing our psychometric approach, we begin with a brief review of the position of genetic
drift within evolution education, continue with an overview of Classical Test Theory and Item
Response Theory frameworks for instrument evaluation, and end with a summary of GeDI
instrument properties and prior validation work relative to these frameworks.
3.1.3 Genetic Drift and Evolution Education
A major goal of science education is to promote student understanding that is aligned
with expert conceptions, practices, and dispositions. The scientific community recognizes both
adaptive and nonadaptive causes of evolutionary change (reviewed in Beggrow & Nehm 2012,
Masel 2012). While standards and textbooks vary in the extent to which they address non-
adaptive evolutionary processes, genetic drift is recognized foremost among the various-non
adaptive evolutionary factors (Beggrow & Nehm 2012; Price & Perez 2016). Genetic drift is
included in college textbooks for biology majors (Beggrow & Nehm 2012), is a recommended
topic in undergraduate biology curricula, and is also taught in Advanced Placement (AP) Biology
(reviewed in Price & Perez 2016; The College Board 2015). International Baccalaureate (IB)
Biology (a popular alternative to AP biology), however, fails to mention non-adaptive
mechanisms for evolution (International Baccalaureate Organization 2014).
At the introductory high school biology level, the Next Generation Science Standards
(NGSS Lead States 2013) also omit non-adaptive evolutionary mechanisms. Recent editions of
popular high school textbooks, however, continue to include genetic drift (e.g., Miller & Levine
2014; Nowicki 2017), leaving the option to cover this topic in the hands of individual teachers,
schools, or districts. While genetic drift is commonly taught in evolution courses (e.g., Masel
2012) or within evolution units of biology survey courses (e.g., The College Board 2015; Masel
2012; Urry et al. 2017), it may also be taught in genetics courses (e.g., Masel 2012; Stony Brook
University 2017, p. 49). Overall, while there is consensus that nonadaptive causes of evolution
are an essential component of biology education, inconsistent attention to genetic drift (and other
non-adaptive evolutionary concepts) in high-school and college curricula makes it difficult to
determine the extent to which students are exposed to instruction on non-adaptive evolutionary
processes as well as the degree to which they are able to integrate it into their mental models of
evolutionary change (Nehm 2018). The Genetic Drift CI was developed to address the latter
issue and is an important advance in evolution assessment.

36
Table 3.1 Instruments measuring knowledge of evolutionary processes: Potential to elicit
normative and non-normative ideas about adaptive and non-adaptive evolution
Instrument Formata and target
population
Conceptions measuredb
NS-N NS-NN GD-N GD-NN
Bishop & Anderson's
Diagnostic Instrument (Bishop
& Anderson 1990)
Combination MC and
ORc: Undergraduates
(introductory biology
non-majors )
Intended
Intended Possibled Possibled
Concept Inventory of Natural
Selection (CINS; Anderson,
Fisher & Norman 2002)
20 MC:
Undergraduates
Intended Intended
Assessing Contextual Reasoning
about Natural Selection
(ACORNS; Nehm, Beggrow,
Opfer & Ha 2012)
Flexible number OR:
Undergraduates
Intended Intended Possibled Possibled
Conceptual Assessment of
Natural Selection (CANS;
Kalinowski, Leonary & Taper
2016)
24 MC:
Undergraduates
(introductory biology
majors)
Intended Intended e
Daphne Assessment for Natural
Selection (DANS; Furtak,
Morrison, and Kroog 2014)
26 MC: High school Intended Intended
Genetic Drift Inventory (GeDI;
(Price et al. 2014)
22 TF:
Undergraduates
(upper-division
biology majors)
Intended Intended Intended
Evo-Devo Concept Inventory
(Perez et al. 2013)
11 MC:
Undergraduates
Intended Intended
Measure of Understanding of
Macroevolution (MUM;
Nadelson & Southerland
2009)
27 MC and 1 OR:
Undergraduates
OR:
Possiblef
OR:
Possiblef
OR:
Possiblef
OR:
Possiblef
a Multiple choice (MC), Open response (OR), True-false (TF) b Natural selection, normative ideas (NS-N), Natural selection, non-normative ideas (NS-NN), Genetic
drift, normative ideas (GD-N), Genetic drift, non-normative ideas (GD-NN); “Intended” indicates that the
instrument intentionally targeted ideas of this type. c Bishop & Anderson’s instrument includes 2 OR, 3 MC with OR explanation, and 1 question about belief
in evolution d Open response format affords the possibility of capturing reasoning about genetic drift, although, in line
with instrument’s intent, scoring guide addresses natural selection only. e Includes one question (item 20) asking whether chance plays a role in whether a cactus will produce a
seedling f MC items address macroevolution. OR item asks student to explain how two species might have arisen
from one. Authors state that item does not address speciation by means beyond natural selection, though
they include a student response mentioning genetic drift.
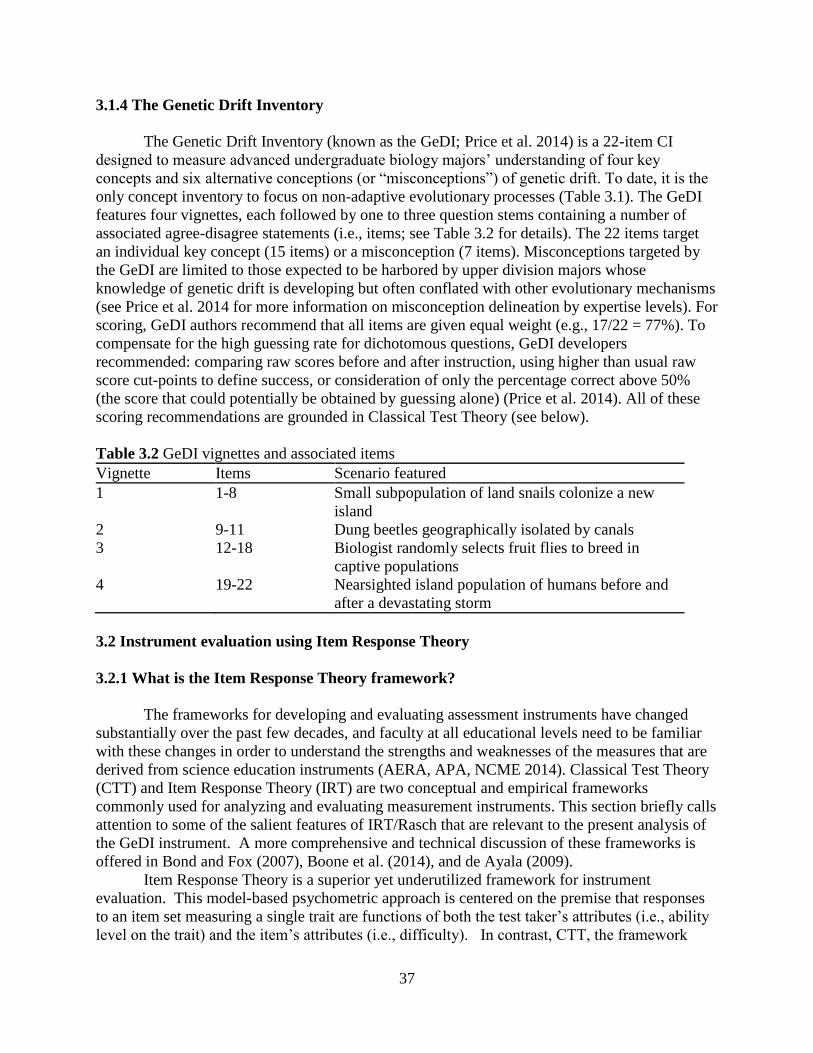
37
3.1.4 The Genetic Drift Inventory
The Genetic Drift Inventory (known as the GeDI; Price et al. 2014) is a 22-item CI
designed to measure advanced undergraduate biology majors’ understanding of four key
concepts and six alternative conceptions (or “misconceptions”) of genetic drift. To date, it is the
only concept inventory to focus on non-adaptive evolutionary processes (Table 3.1). The GeDI
features four vignettes, each followed by one to three question stems containing a number of
associated agree-disagree statements (i.e., items; see Table 3.2 for details). The 22 items target
an individual key concept (15 items) or a misconception (7 items). Misconceptions targeted by
the GeDI are limited to those expected to be harbored by upper division majors whose
knowledge of genetic drift is developing but often conflated with other evolutionary mechanisms
(see Price et al. 2014 for more information on misconception delineation by expertise levels). For
scoring, GeDI authors recommend that all items are given equal weight (e.g., 17/22 = 77%). To
compensate for the high guessing rate for dichotomous questions, GeDI developers
recommended: comparing raw scores before and after instruction, using higher than usual raw
score cut-points to define success, or consideration of only the percentage correct above 50%
(the score that could potentially be obtained by guessing alone) (Price et al. 2014). All of these
scoring recommendations are grounded in Classical Test Theory (see below).
Table 3.2 GeDI vignettes and associated items
Vignette Items Scenario featured
1 1-8 Small subpopulation of land snails colonize a new
island
2 9-11 Dung beetles geographically isolated by canals
3 12-18 Biologist randomly selects fruit flies to breed in
captive populations
4 19-22 Nearsighted island population of humans before and
after a devastating storm
3.2 Instrument evaluation using Item Response Theory
3.2.1 What is the Item Response Theory framework?
The frameworks for developing and evaluating assessment instruments have changed
substantially over the past few decades, and faculty at all educational levels need to be familiar
with these changes in order to understand the strengths and weaknesses of the measures that are
derived from science education instruments (AERA, APA, NCME 2014). Classical Test Theory
(CTT) and Item Response Theory (IRT) are two conceptual and empirical frameworks
commonly used for analyzing and evaluating measurement instruments. This section briefly calls
attention to some of the salient features of IRT/Rasch that are relevant to the present analysis of
the GeDI instrument. A more comprehensive and technical discussion of these frameworks is
offered in Bond and Fox (2007), Boone et al. (2014), and de Ayala (2009).
Item Response Theory is a superior yet underutilized framework for instrument
evaluation. This model-based psychometric approach is centered on the premise that responses
to an item set measuring a single trait are functions of both the test taker’s attributes (i.e., ability
level on the trait) and the item’s attributes (i.e., difficulty). In contrast, CTT, the framework

38
used to evaluate the vast majority of science education measurement instruments, presumes
responses are functions only of the test taker’s ability, along with an expected degree of
measurement error. Various IRT models exist to accommodate diverse types of instrument
responses (e.g., dichotomous or polytomous) and which consider different numbers of
parameters during estimation (e.g., the 1 parameter logistic, or 1PL, model considers the
parameter of item difficulty, while the two parameter logistic model, 2PL, considers both
difficulty and discrimination; see Bond & Fox 2007 for more information).
Rasch methodologies share much in common with the IRT framework, and are
considered by many to be a form of IRT (although strict Rasch enthusiasts maintain a firm
distinction, e.g., Boone et al. 2014). The dichotomous Rasch model used in this study is
mathematically equivalent to the 1PL IRT model. As such, Rasch affords characterization of
persons and items in a manner that is more robust, with greater inferential potential, than
Classical Test Theory or other IRT approaches (Bond & Fox 2007; Boone et al. 2014).
3.2.2 Advantages of IRT
Versatility
IRT and Rasch frameworks address many inherent limitations of CTT (Bond & Fox
2007; Nehm & Schonfeld 2008; Boone et al. 2014). A broad advantage is the existence of
diverse IRT and Rasch models suitable for different types of data (unidimensional,
multidimensional, dichotomous, polytomous, large and small data sets), permitting analyses to
be more closely matched to study type. Also, missing data are readily accommodated in
IRT/Rasch frameworks, adjusted for during the iterative comparisons of person and item
response patterns used to estimate person and item scores. Not only does this enable researchers
to utilise a greater proportion of survey responses, it is particularly useful for research designs
which minimize test fatigue by intentionally assigning individuals only a subset of questions
from wider variety of items such as in computer adaptive testing (Bond & Fox 2007) and multi-
matrix studies (cf. Sirotnik and Wellington 1977; e.g., Schmiemann, Nehm & Tornabene 2017).
Overall, Rasch and IRT are designed for adaptability to support a wide range of study formats.
Ratio scale scores
An integral and unparalleled advantage of IRT and Rasch approaches is production of
person and item scores on a linear, ratio-scale (rather than ordinal raw data). Linear data is
essential to accurately quantify person and item characteristics as well as to satisfy the
assumptions of parametric statistical analyses commonly conducted using test scores.
Dimensionality analyses, necessary to ascertain which theoretical model (unidimensional,
multidimensional) used for evaluations is appropriate, are also properly conducted with linear
ratio scale data. The distinction between ratio scale IRT/Rasch scores and ordinal CTT scores
lies in CTT’s failure to consider the existence of varying item difficulties or their impact on test
score when calculating score values. Overall, IRT and Rasch’s system of reporting item and
person scores on a ratio scale fundamentally improves the quality of most inferences drawn from
test results.

39
Common Logit Scale for Person and Item Score Reporting
IRT and Rasch report person and item measures on the same logit scale. This facilitates
comparison among and within participants and items: When logit values for person measure and
item measure are equivalent, an individual has a 50% probability of correctly answering the item
(Bond & Fox 2007, p. 38). Graphical displays of persons and items on a common logit scale
(known as “Wright maps”), are a unique feature of Rasch and IRT which enable researchers to
explicitly examine the alignment of test items to test taker “ability” and to identify possible
measurement gaps (i.e. difficulty/ability ranges in which items are lacking) or areas of
redundancy.
Multiple Indicators of Fit and Reliability
Rasch and IRT feature multiple indicators of fit (e.g., infit and outfit mean square
[MNSQ]) that correspond to different causes of misfit and also include parameters to report the
probability of fit statistics (e.g., Z-standardized t scores [ZSTD]). Fit statistics are provided both
at the item/person level and instrument/sample level. Together, these parameters provide a much
more detailed characterization of item and person fit properties compared to CTT. Similarly,
IRT/Rasch derived values for individual and overall item reliability and person reliability
together afford a more nuanced measurement of reliability than CTT. Item reliability values
convey whether the persons sampled demonstrated sufficiently diverse abilities to support the
calculated item difficulty structure, and person reliability values address whether the item
difficulty structure is sufficient to reliably produce person measures.
Overall, Rasch and IRT hold considerable potential for expanding the body of empirical
evidence on instrument quality, yet remain broadly underutilized in science education. The
present analysis of the GeDI provides an example of how Rasch analysis can offer greater insight
into the measurement capabilities and limitations of measurement instruments.
3.3 Additional relevant considerations for instrument evaluation
3.3.1 Item order effects on student performance
An extensive body of work extending back to the 1950’s (e.g., MacNicol 1956;
Mollenkopf 1950) has found that instrument scores may be influenced by interactions among (1)
item position (that is, which questions students encounter first, second, third, etc.) and item
difficulty, (2) item format (multiple choice, constructed response; qualitative or quantitative),
and (3) test type (aptitude or achievement) (reviewed in Federer et al. 2015; Leary & Dorans
1985). For example, working with the ACORNS instrument, Federer et al. (2015) found an
interaction between item order and taxon familiarity on student performance measures. The
GeDI contains several separate vignettes with associated item suites that vary in task contexts
(cf. Table 3.2) and item difficulty levels (Price et al. 2014). It is possible that these (or other
unidentified) aspects of the items could influence student responses to subsequent items (cf.
Federer et al. 2015). Hence, investigation of whether vignette order impacts student performance
is a worthwhile step towards understanding the measurement properties of the GeDI.

40
3.3.2 Generalizability of instrument scores
Evidence for generalization validity is important to substantiate claims that an instrument
measures a trait in the same manner across different populations and administration contexts.
Instruments are designed to measure a specific construct under specific circumstances, such as a
particular educational level (e.g., undergraduate biology majors, elementary students) under
certain administration conditions (e.g., unproctored computerized testing, timed paper-and-pencil
tests), and for particular purposes (e.g., formative evaluation of instructional interventions,
employment screening). Explicit delineation of such contexts and evidence to support validity
and reliability of inferences generated under these circumstances should accompany instruments
(AERA, APA, NCME 2014). Under alternative administration contexts (e.g., sample
populations, testing conditions), items are subject to differing interpretations or stress factors
which may bias responses. For instance, a question may be beyond the comprehension level of a
group, may be scrutinized more stringently by those with greater subject expertise, or may
contain terms whose meaning differs according to the cultural or regional background of a
sample. Accordingly, biased item responses compromise the validity of inferences about the
latent trait (AERA, APA, NCME 2014). When an instrument is used in a new context, evidence
is needed to support the validity and reliability of inferences generated in the new context.
The GeDi is intended to measure upper division biology majors’ conceptions of genetic
drift across different institution types and in different courses. While development and initial
validation sampled a broad array of students from different biology courses and institution types
throughout the Midwest and Central United States regions, samples from the Northeast were not
included (Price et al. 2014). Given that regions of the United States vary widely in demographic
composition, religion, and evolution acceptance, additional information from a Northeastern
population would further substantiate claims about the utility of the GeDI across geographic
regions.
3.3.3 Summary of validity and reliability evidence for the GeDI
Now that we have reviewed some of the salient empirical evidence that may be used to
evaluate the quality of the inferences derived from assessment scores, we can turn our attention
to the GeDI. The GeDI has only been evaluated using Classical Test Theory methods despite
many known limitations of using raw data to interpret item and instrument properties (as
discussed in Chapter 2; Boone et al. 2014). A summary of the forms of evidence used to support
validity inferences for the GeDI are shown in Table 3.3. The present study expands upon prior
validity and reliability work by (1) employing Rasch Modeling, which produces more accurate
ratio-scaled scores and can contribute evidence to examine dimensionality, construct validity,
internal structure validity, item properties, and reliability, (2) examining item order effects, and
(3) studying a participant population from a new geographic region of the country (Table 3.3).

41
Table 3.3 Summary of validity and reliability evidence for the GeDI. Validity/Reliability
Evidence Type and Descriptiona
CTT Framework
(Price et al. 2014)
Rasch Framework
(Present Study)
Construct validity:
Instrument appropriately represents
the specified knowledge domain
Textbook analysis, expert survey,
student interviews, review of
student work and literature review
for misconceptions
Rasch model fit, Rasch
dimensionality analysis, item fit,
person reliability
Substantive validity:
Participants use the thought
processes that were anticipated for
each item
Student interviews (none)
Internal structure validity:
Items capture a single construct
Cronbach’s alpha Rasch dimensionality test, person
& item reliability
External structure validity:
Scores are appropriately associated
(positively or negatively) with an
independent measure
(none) (none)
Generalization validity:
Score inferences hold true in
different administrative contexts
Five campuses over two geographic
areas (Southeast/Midwest)
New population (Northeast)
Consequential validity:
Considers positive or negative
consequences of score use
Not applicable Not applicable
Reliability:
Reproducibility of scores
Test-retest Item and person reliabilities
Item properties:
Individual item performance
characteristics
Difficulty, discrimination Item measures, item fit statistics,
Wright map
Item order effects: Possible item
interactions and associated
sequence biases
(none) ANOVA of Rasch-scaled scores
from forms rotating item-suite
order
aBased on Campbell & Nehm (2013); Messick (1995); Nitko & Brookhart (2010)
3.4 Methods
3.4.1 Item order
The GeDI features four vignettes, each followed by one to three question stems
containing a number of associated agree-disagree statements (i.e., items; see Table 3.2). The
GeDI’s vignettes differ in situational features (cf. Table 3.2) and difficulty, two factors which
have been shown to demonstrate item-order effects in prior studies (reviewed in Federer et al.
2014). In order to determine whether the sequence of vignettes and related items within the GeDI
instrument impacted student performance, four complete forms of the GeDI were generated,

42
which differed only in the presentation sequence of vignettes. A four-by-four Latin square design
was used to rotate vignette sequence among the test forms (see Table 3.4). Each of the four
vignettes (and related items) constituted a block in the square; the original order of the vignettes
and items (Price et al. 2014) was used to seed the Latin square, and the original order of the
items within a block was maintained throughout all forms (see Table 3.4).
Table 3.4 Design of GeDI forms
Position 1 Position 2 Position 3 Position 4
GeDI Form 1 Sequence Vignette 1 Vignette 2 Vignette 3 Vignette 4
GeDI Form 2 Sequence Vignette 2 Vignette 3 Vignette 4 Vignette 1
GeDI Form 3 Sequence Vignette 3 Vignette 4 Vignette 1 Vignette 2
GeDI Form 4 Sequence Vignette 4 Vignette 1 Vignette 2 Vignette 3
The presentation sequence of the four vignettes (and accompanying item suites that comprise
the GeDI) was rotated among four equivalent test forms using to a Latin square design. A
Latin square is an array of n rows and n columns, with each row and each column containing
units 1 through n exactly once. By rotating experimental treatments in this manner, the
researcher can generate data to determine whether an adjacent treatment (or, in this case, item
suite placement) influences overall performance. For a description of vignettes and
associated items see Table 3.2.
3.4.2 Sample and administration
The GeDI forms (Table 3.4) were administered online using a learning management
system in the spring semester of an upper division (300-level) genetics class at a large,
Northeastern Doctoral-granting university. This course was chosen because it aligns with the
target population for GeDI use and is among the course types used in the development and initial
validation studies of the GeDI (Price et al. 2014). Students were randomly assigned to one of
four experimental groups, each of which had access to only one of the four forms of the
assessment (Table 3.4). Students were provided a 60-minute time limit and allowed one attempt
to complete the activity, with extra credit offered as an incentive for participation. Random
student identification numbers were assigned to anonymize response data. The assessment was
open for a period of one week beginning in the 10th week of the semester, prior to which no
instruction relating to genetic drift had occurred. Of the 480 students enrolled, 336 (70%)
completed the assessment in the following distribution: n form 1 = 91, n form 2 = 78, n form 3 = 80
and n form 4 = 87. All data collection qualified for IRB exemption status under IRB number 2013-
2298-R1.
3.4.3 Data analysis
In order to empirically evaluate the validity and reliability inferences derived from GeDI
scores, Rasch modeling was performed using WINSTEPS v 3.682 (Lincre 2017a).
43
Dimensionality was examined via a Principal Components Analysis (PCA) of Rasch residuals.
The overall fit of items and persons to the unidimensional Rasch model were examined by infit
and outfit mean square (MNSQ) values and Z standard (ZSTD) values. A Wright map was
generated to visualize item difficulty relative to test-taker ability, and individual item fit values
were considered. Item reliability was calculated to determine whether responses were varied
enough to confirm the item difficulty structure, person reliability was calculated to determine
whether the items differentiated among achievement levels sufficiently. To determine if item
order impacted test performance, a one-way ANOVA was performed on Rasch-scaled scores for
the four GeDI forms. Finally, total scores and item difficulty ranks were compared across
administrations in order to examine score generalizability.
3.5 Results
3.5.1 Dimensionality
Principal Components Analysis (PCA) of Rasch residuals was used to compare the
amount of variance explained by items and persons in relation to unexplained variance (which
might correspond to additional dimensions). For our sample, items explained 13.3% of the
variance while 6.6% remained unexplained, and person measures explained approximately as
much. With an approximate 2:1 ratio of variance due to items versus unexplained variance, a
high loading for the first dimension was apparent. High unexplained variance is common for
samples demonstrating narrow ranges of ability (see Figure 1). For an instrument with 22 items,
an Eigenvalue greater than two would suggest additional dimensions (Linacre 2017b). For our
sample, the Eigenvalue was 1.8 in the first contrast. Thus, the analysis did not support additional
dimensions for the GeDI.
3.5.2 Overall model fit
Overall item fit and person fit values are measures of how well a dataset fits the Rasch
model. Values outside of the acceptable range (MNSQ = 0.7-1.3 and Z standard values < 2.0)
suggest that test takers were responding in a manner that was either overly predictable, very
erratic, or inconsistent with their ability. Excellent overall person fit values (infit MNSQ = 1.0,
ZSTD = 0.0; outfit MNSQ = 0. 99, ZSTD = 0.0) and item fit values (infit MNSQ = 1.0, ZSTD =
0.0; outfit MNSQ = 0. 99, ZSTD = -0.1) were apparent (Table 3.5) and indicated that the
participant sample responses fit the Rasch model very well.
3.5.3 Individual item fit
Rasch infit and outfit MNSQ and ZSTD values were used to assess how well individual
GeDI items aligned with the student population and with the Rasch model. Infit and outfit
MNSQ values for all test items were within acceptable ranges (Table 3.5) and are thus
functioning to elicit responses consistent with test-taker ability. Five items (2, 9, 16, 19, and 22)
had infit and/or outfit ZSTD values outside of the acceptable range. According to Linacre
(2017b), misfitting ZSTD scores are very sensitive to sample size, and may be disregarded when
samples are large (over 300 observations) and MNSQ scores are acceptable. This is because
ZSTD values reflect how perfectly data fit the Rasch model rather than how usefully data fit the

44
model, and in large samples (over 300 observations), the accumulation of rare individual atypical
responses can inflate ZSTD scores without having a bearing on the usefulness of the data.
Table 3.5 GeDI Rasch fit properties.
Infit
MNSQ
Infit
ZSTD
Outfit
MNSQ
Outfit
ZSTD
Item 1.00 0.0 0.99 0.0
Person 1.00 0.0 0.99 -0.01
Item 1 1.09 1.28 1.11 0.94
Item 2 1.14 3.75 1.22 3.84
Item 3 0.96 -0.86 0.92 -1.06
Item 4 1.08 1.40 1.09 0.91
Item 5 0.93 -1.68 0.89 -1.94
Item 6 0.99 -0.21 0.96 -0.54
Item 7 1.02 0.45 1.07 0.91
Item 8 0.96 -0.64 0.96 -0.56
Item 9 0.92 -2.04 0.88 -1.67
Item 10 1.03 0.74 1.05 0.69
Item 11 1.02 0.41 1.03 0.43
Item 12 1.00 -0.07 1.00 -0.05
Item 13 1.00 0.13 0.98 -0.35
Item 14 0.98 -0.46 0.95 -0.80
Item 15 0.99 -0.12 0.96 -0.43
Item 16 1.20 4.05 1.27 4.24
Item 17 0.99 -0.20 1.00 -0.04
Item 18 0.98 -0.35 0.88 -1.05
Item 19 0.93 -2.12 0.88 -2.25
Item 20 0.98 -0.54 0.96 -0.63
Item 21 0.96 -0.79 0.92 -0.89
Item 22 0.91 -2.61 0.86 -2.54
Bold values refer to higher than expected values
3.5.6 Wright map
Wright map depicts item difficulty measures (on the right side) and person ability scores
(on the left side) on the same logit scale (Figure 1). This side-by-side comparison enables one to
understand how well test-takers are performing relative to item difficulty, and how well items are
functioning relative to test-taker ability. Item numbers are plotted on the right side of the map,
while persons are represented by the # symbols on the left side of the map. Mean item difficulty
and mean person ability are set to zero, with the most difficult items and highest performers
appearing toward the top of the map and the easiest items and lowest scorers appearing toward
the bottom of the map. Typically, question difficulty should be well-matched with test-taker
ability, with the presence of items that can differentiate among learners at all ability levels. A
person has a fifty percent probability of correctly answering an item with an equivalent logit
value.

45
Figure 3.1 Wright map derived from Rasch analysis of GeDI responses. The distribution of
persons (on the left) and GeDI items (on the right) are illustrated on the same log interval (-2 to
4) scale. Each # = 4 persons.
The logit scores for test items and persons in Figure 1 demonstrate that the GeDI item
difficulty is generally well matched to test-taker ability, with the exception of the top of the logit
scale. About 12.5% of participants had logit scores above the most difficult item (item 8). Thus,
the GeDI successfully differentiates most of this student population, but, from a strict
perspective, requires additional (high difficulty) items to differentiate the highest scorers.
Further, almost all test takers correctly answered item 1, indicating that it is “too easy” to
differentiate students’ knowledge levels. The Wright map also illustrates three instances of test
items displaying equivalent difficulty levels (see “Redundant difficulty” in Figure 1). Items of
redundant difficulty are not functioning to discriminate among test-takers and may be candidates
for removal in the interest of a removing uninformative items, unless such items are necessary
for content validity, or some other aspect of construct validity. In this particular case (i.e., items
14 and 6, and items 10, 7, and 9), items with equivalent difficulty address different concepts or

46
“misconceptions.” Items 12 and 17, however, address the same misconception: “Natural
selection is always the most powerful mechanism of evolution, and it is the primary agent of
evolutionary change” (Price et al. 2014).
Table 3.6 Mean GeDI item measures (Measure) and standard error (S.E.) by vignette rotation
position
Position 1 Position 2 Position 3 Position 4
Item Measure S.E. Measure S.E. Measure S.E. Measure S.E.
1 -0.85 0.24 -1.04 0.26 -1.52 0.31 -1.35 0.3
2 0.19 0.22 0.64 0.23 -0.08 0.25 -0.05 0.24
3 -0.05 0.22 -0.78 0.25 -0.52 0.26 -0.29 0.25
4 -0.91 0.25 -0.78 0.25 -0.79 0.27 -0.95 0.27
5 0.75 0.23 0.75 0.24 0.84 0.25 0.43 0.24
6 1.14 0.24 0.81 0.24 1.32 0.27 0.67 0.25
7 -0.79 0.24 -0.6 0.24 -0.33 0.25 -0.29 0.25
8 1.2 0.25 1.1 0.25 0.97 0.26 1.2 0.27
9 -0.41 0.25 -0.73 0.24 -0.54 0.24 -0.08 0.25
10 -0.16 0.25 -0.46 0.23 -0.48 0.24 -1.09 0.28
11 -0.73 0.26 -0.57 0.23 -0.32 0.23 -0.72 0.26
12 1.11 0.26 1.13 0.26 0.86 0.23 0.75 0.24
13 1.11 0.26 1.06 0.26 0.44 0.22 0.16 0.23
14 1.18 0.27 1.2 0.27 0.8 0.23 0.81 0.24
15 -0.52 0.26 -0.87 0.27 -0.51 0.23 -0.84 0.25
16 1.18 0.27 0.61 0.25 0.44 0.22 0.92 0.24
17 0.92 0.29 1.63 0.25 0.8 0.23 0.54 0.24
18 -0.97 0.26 -1.52 0.31 -0.73 0.26 -1.24 0.27
19 0.32 0.23 -0.2 0.25 -0.35 0.25 0.34 0.22
20 0.06 0.23 -0.72 0.26 -0.35 0.25 -0.3 0.23
21 -0.97 0.26 -1.17 0.28 -0.35 0.25 -0.62 0.23
22 0.06 0.23 -0.08 0.25 -0.23 0.25 0.29 0.22
3.5.7 Reliability
Rasch person and item reliabilities reflect internal consistency reliability. Item reliability
values <0.9 suggest that the test-taker sample is not large enough to confirm the apparent item-
difficulty structure. Person reliability (separation) values <0.8 suggest that the items are
insufficient for precisely and reproducibly distinguishing among the apparent abilities of test
takers. Such values may also suggest that the Rasch person measure score (or how well each
person performed based on the Rasch ratio-score model) may not be a reliable reflection of
person ability (Linacre 2017b).
The overall item reliability value for the GeDI was 0.97 and the overall person reliability
was 0.62. (As a point of comparison, Cronbach's alpha for this administration was 0.65.) The
high Rasch item reliability value indicates that the student sample in this study is sufficient to
support the item difficulty and item fit values. Low person reliability scores are commonly

47
associated with a narrow range of test-taker ability or an instrument with few items or few
options for each item (which consequently elicits less varied responses than an instrument with
many items and many answer options). In both cases, lack of variance in responses translates to
fewer increments among which to delineate test taker ability (Linacre 2017b). This interpretation
seems appropriate given the moderate number of items in the GeDI, the dichotomous response
options, the presence of three items of redundant difficulty on the Wright map, the instrument’s
failure to distinguish among the top 12.5% (n=42) of test takers in this administration, and the
bulk of test takers clustered between -1 and 1 on the logit scale (Figure 3.1).
Figure 3.2 Position effects on GeDI item difficulty values.
GeDI items appear on the X axis and mean item measures for each GeDI item are plotted on the Y axis. Symbols
denote vignette position (1, 2, 3, or 4) in a counterbalanced rotation sequence of vignettes and accompanying item
suites (see methods section for description). Error bars represent two standard errors of measurement about each
mean item measure. As an example, item 4 showed little variation in item measure regardless of presentation order,
and was also easier overall than item 13. In contrast, item 13 showed a slightly larger variation in item measure by
position. Overall, no substantial differences were found between item difficulty and item position when controlling
for the number of tests.
3.5.8 Item order effects
Raw score group means for all four forms of the GeDI were very similar, ranging
between 12.02 to 12.20 (SD 3.30-3.98) out of a possible 22 (Table 3.7). A one-way ANOVA
confirmed that there was no statistically significant difference in Rasch-scaled scores for each of
the four GeDI forms (F[3,332]= 0.038, p = 0.990). This result indicates that the order of
vignettes did not impact overall performance. Comparisons of mean item measures for the first,
second, third, or fourth rotation position showed no apparent differences in item difficulty when
controlling for the number of statistical tests (Figure 3.2). Detailed information on item measures
for all items and rotation positions is available in the Table 3.6.

48
Table 3.7 Comparison of performancea on GeDI by form, course, and region
Course, Region (number tested) Mean of items correct (SD)
300-level genetics, Northeast (N=336)b 12.11 (3.59)
form 1 (n=81) b 12.02 (3.30)
form 2 (n= 78)b 12.15 (3.61)
form 3 (n= 80)b 12.20 (3.98)
form 4 (n=87)b 12.09 (3.54)
300-level genetics, Southeast (N=318)c 12.35 (3.29)
300-level genetics, Midwest (N=141)c 11.94 (3.35)
300-level cell biology, Northwest (N=51)c 13.35 (3.64)
300-level evolution, Northwest (N=91)c 14.47 (3.78)
400-level evolution, Midwest (N=60)c 16.66 (3.44) a Raw scores were used for comparison as Rasch-scaled data were not available from prior
studies. b Denotes present study. c Denotes data from Price et al. 2014. All institutions were
Doctoral-granting. Maximum number of correct items is 22.
Table 3.8 GeDI item difficulty rank in initial and present administrations
Items addressing key concepts Items addressing key concepts
Price et al. 2014 Present study Price et al. 2014 Present study
16 16 8 8 13 13 6 6 10 3 12 14 4 10 17 12 5 15 5 17 3 4 14 5 1 1 2 2 11 19 18 22 20 20 9 9 7 7 19 11 22 21 21 18
Items listed from most challenging items (top) to least challenging items (bottom). Difficulty
rank based on CTT difficulty (P) values for initiala study and Rasch item measures for present
study.
3.5.9 Comparisons with other undergraduate participant samples
Given that evolution acceptance, religion, and demographic variables differ across the
United States, it is important to determine if instrument properties generalize. GeDI scores from
our sample of undergraduates from the Northeastern United States were nicely aligned with the
scores obtained by Price et al. (2014) from similar courses from other regions of the country
(Table 3.7). In particular, no significant difference was found between raw scores from the 300-
level genetics class in our sample (M= 12.35, SD = 3.59) and those of 300-level genetics classes
in the Midwest (M=11.94, SD=3.35; t(475)=0.481, p=0.631) or the Southeast (M=12.35,

49
SD=3.29; t(652)=0.890, p=0.374). Similarity in scores across institutions indicates that the GeDI
is functioning to elicit similar responses in comparable populations across the country and may
suggest generalizability of score inferences (cf. Messick 1995). It should be noted that no Rasch-
scaled scores are available from prior GeDI administrations so comparisons are limited to raw
scores. Raw score similarity also provides limited evidence that Rasch-based validity measures
obtained with our population may generalize to the GeDI as a whole, though this should be
confirmed in future studies.
To examine whether individual items functioned similarly across administrations, item
difficulty rank from our sample was compared to CTT-based item difficulty (P) rank from Price
et al. 2014 (Table 3.8). Overall, most items maintained a similar or only slightly shifted difficulty
order, though a few notable differences in item difficulty across administrations were found.
Among items targeting key concepts, the hardest and easiest items maintained the same difficulty
position and mid-level items showed only minor rearrangement. Item 3 (relating to a loss of
variation associated with genetic drift), initially ranked as an easy item by Price et al. 2014,
ranked among the more difficult key concept items in our administration. Among items targeting
misconceptions, many items maintained a similar difficulty ranking, but items 14, 19 and 22 (all
of which addressed “genetic drift is random mutation”) were notably more difficult in the present
administration. Items 11 and 18 (addressing “genetic drift is gene flow”) were notably easier in
the present administration. Overall, most of the GeDI questions maintained the general difficulty
hierarchy across diverse samples, which may be used as evidence in support of generalization
validity. Difficulty rank differences in items 3, 11, 14, 18, 19 and 22 should be investigated
further.
3.6 Discussion
3.6.1 Insights about instrument quality from Rasch modelling
Rasch and IRT afford a more comprehensive and rigorous evaluation of instrument
quality compared to CTT approaches (Boone et al. 2014). The present study has generated
further evidence in support of the GeDI’s use as an instrument capable of generating valid and
reliable inferences about upper-level undergraduates’ knowledge of genetic drift in American
samples. The GeDI was found to be unidimensional, with item response patterns consistent with
Rasch model expectations. The difficulty levels of items on the GeDI were generally well-
calibrated for upper division students, with the exception of the highest scorers, for whom
challenging items were lacking.
Rasch analysis is useful to help a test developer to improve test quality because it can
provide information on how items function individually and as a whole. While the GeDI overall
functioned very well within the IRT framework and Rasch modeling, we offer a few
recommendations that may further improve the quality of measurement from a psychometric
perspective. Item 1 was not difficult enough to differentiate students in this sample. Price et al.’s
(2014) CTT analysis produced similar findings for item 1, however, they retained this item to
satisfy validation criteria for earlier GeDI drafts. Future versions might revise, replace, or
remove item 1. Further investigation is also needed to determine whether items 12 and 17, which
test the same misconception at the same difficulty level, should both be retained in their present
form or perhaps removed or revised. From an empirical perspective, inclusion of additional high-
difficulty items or perhaps adjustment of a few current items would be beneficial to target the
50
highest-ability test-takers and would likely improve person reliability scores. Of course, any
decision about test design must balance consideration of both empirical properties and theoretical
concerns such as construct representation, so adjustment of items to improve psychometric
properties is only appropriate if it continues to satisfy content validity criteria. Developers
specified that the GeDI targets what they refer to as “stage 2” (mid-level) misconceptions,
wherein drift is conflated with other evolutionary mechanisms. The true/false format of the GeDI
precluded assessment of more nuanced “stage 3” (advanced-knowledge level) misconceptions,
characterized by inappropriate constraints on the situations in which drift may occur. Further
exploration is necessary to determine whether the GeDI might be modified to better measure the
small group of high performers or whether the observed response pattern indeed represents the
successful mastery of the upper bounds of the intended construct. As is always the case, any
modifications of the existing instrument would require additional validation studies (cf. Table
3.3). Beyond these concerns about item difficulty, all items functioned appropriately in all other
aspects of the analysis.
3.6.2 Impact of presentation order of instrument vignettes (and associated item suites) on
measures of student understanding
The GeDI features four vignettes differing in taxonomic context and item difficulty, two
factors which have been associated with item position effects in studies with other instruments
(cf. Federer et al. 2014). Rearranging the order of GeDI vignettes and associated
item suites has no significant impact on test scores, thus each vignette is functioning
independently to assess student knowledge and does not appear to be impacting responses to
subsequent items. Almost no other concept inventories in biology education have been tested for
order effects.
3.6.3 Generalization validity
The ability of the GeDI to generate comparable scores and fairly similar item difficulty
rank patterns among academically similar students from diverse institutions from different
geographic regions could be used as a source of evidence in support of claims of generalization
validity (AERA, APA, NCME 2014; Mesick 1995). The addition of evidence from a Northeast
population is particularly important because evolution acceptance and associated factors vary
widely across different U.S. geographic regions (which differ in religion and political party
affiliations; see www.pewresearch.org).
3.6.4 Genetic drift, natural selection, and their interrelationships
Empirical studies on teaching, learning, and assessing non-adaptive contributors to
evolution have been scarce in a vast body of evolution education research dominated by studies
on natural selection (Andrews et al. 2012; Beggrow & Nehm 2012; Price & Perez 2016). How
students conceptualize genetic drift and how genetic drift fits into the broader conceptual
ecology of evolutionary thought are two areas that have only recently begun to be explored.
Current research indicates that student thinking about genetic drift and understanding of genetic
drift are both typically secondary to--and independent of--understanding of adaptive evolutionary
change (Beggrow & Nehm 2012; Andrews et al. 2012). Students appear to conceptualize non-
51
adaptive mechanisms as alternatives to natural selection rather than co-occurring processes
(Beggrow & Nehm 2012). When openly prompted to describe mechanisms for evolutionary
change, students rarely suggest genetic drift (Beggrow & Nehm 2012), and, when specifically
prompted to write about drift, many students still struggle to identify or explain drift (Andrews et
al. 2012). Studying these responses, Andrews et al. (2012) developed a hypothetical framework
describing how genetic drift conceptual development might progress: They suggest students may
shift from (1) naive and limited conceptions of evolution and genetics to (2) a state where
students are aware of various evolutionary processes (e.g., genetic drift) but still unclear on the
differences between them, to (3) a state where students may distinguish between different
evolutionary processes (e.g., genetic drift) but the new knowledge is still marked with
inaccuracies specific to each process. Later, Price et al. (2016) noted that students developing
expertise may exhibit elements of stage 2 and stage 3 conceptions simultaneously. Specifically,
students with mid-level expertise in genetic drift often confuse drift with normative or non-
normative ideas about natural selection or other evolutionary events such as
bottlenecks/population boundaries, random mutation, migration/gene flow, or speciation in
general (Andrews et al. 2012; Beggrow & Nehm 2012). In contrast, students with more advanced
ideas about drift tend to place inaccurate constraints on the situations under which drift occurs
(Andrews et al. 2012).
The development of the GeDI to target stage 2 (mid-level) misconceptions about genetic
drift is an important addition to the body of evolution measurement tools because it both gauges
understanding of a previously neglected evolutionary mechanism and holds potential to capture
some simultaneous reasoning about natural selection (as it relates to drift). Given the incoherence
of naive student thought about evolution (inappropriately both conflating and failing to recognize
simultaneous adaptive and non-adaptive processes), attention toward developing instruments that
can simultaneously capture thought on adaptive and nonadaptive mechanisms is warranted. Few
instruments are capable of simultaneously eliciting thought about natural selection and genetic
drift, and none were designed with the intent to robustly measure knowledge of both processes
(Table 3.1). More fully capturing the array of student thought about diverse evolutionary
mechanisms, including how thoughts on diverse mechanisms intersect, will better equip
educators to develop appropriate instructional strategies and develop curricula.
This work has provided evidence in support of validity inferences for the GeDI using
contemporary instrument evaluation methods, and identified a few areas that would improve
measurement quality. These findings are significant given the very limited set of assessment
tools available for exploring student understanding of non-adaptive processes.
3.7 Limitations and further research
A limitation to the analysis of the effects of item position on student performance was
that the sample size for each test form was limited (n = 78-87); larger samples would afford more
robust conclusions about possible item order effects (Linacre 1994). Specifically, more replicates
generate more precise and stable item measures and increased statistical power to reduce the
chance of a type II error. Further, we did not investigate whether possible item order effects
might exist within question suites sharing a common vignette; our primary concern was whether
vignette presentation order impacted responses to subsequent vignettes.
Although our study adds additional evidence in support of the validity and reliability of
the inferences generated by GeDI scores, further work in line with the measurement Standards is

52
needed (AERA, APA, NCME 2014; Mesick 1995). For instance, although surface feature effects
have been well-documented in evolution assessment (e.g., Federer et al. 2016; Nehm et al. 2012;
Nehm and Ha 2011; Nehm 2018; Opfer et al. 2012), such effects have yet to be examined for the
GeDI. Future work might also investigate how the GeDI functions when data are disaggregated
by gender, ethnicity, or other demographic factors (cf. Federer, Nehm & Pearl 2016;
Schmiemann et al. 2017). Additionally, because all of the GeDI’s items offer dichotomous
answer choices, the impact of guessing bears more significantly on inferences about
understanding than on a traditional multiple choice instrument. Thus, an exploration of the extent
to which guessing impacts inferences generated by the GeDI would be a worthwhile step. Such
an investigation might consider how the instrument functions if item responses were to be
moderated by a paired question tier to indicate student confidence in their responses (cf. Romine,
Schaffer & Barrow 2015) or examined for guessing using Rasch or IRT (e.g., Andrich, Marais &
Humphry 2012; Boone et al. 2014; Gershon 1992; Linacre 2017b). Overall, while the GeDI now
stands among the more robustly evaluated evolution instruments, additional work remains to
comprehensively characterize the validity and reliability of inferences generated by this (and
many other) evolution education instrument(s). Attention should also be given to whether the
array of measurement instruments available can adequately gauge normative and non-normative
ideas about adaptive and nonadaptive evolution.
3.8 Conclusions
Validity evidence for the vast majority of instruments in biology education is based on CTT, and
most instruments have only one form of validity evidence (i.e., content validity) (e.g., Campbell
& Nehm 2013). The evolution education research community must place greater emphasis on the
analysis of ratio-scaled data and expand its efforts to include studies of a more diverse array of
forms of validity evidence to support the inferences derived from assessment scores (cf. AERA,
APA, NCME 2014). The present study provides further evidence that the inferences derived
from the GeDI are valid indicators of student understanding while identifying areas of
improvement. The methodological approach we introduced provides a template for future studies
of other evolution instruments that were validated using CTT methods.
3.8 References (Chapter 3)
American Association for the Advancement of Science (AAAS). (2011). Vision and change in
undergraduate biology education. Washington, DC. http://visionandchange.org/ Accessed 20
February 2018.
American Educational Research Association, American Psychological Association, and National
Council for Measurement in Education (AERA, APA, NCME). (2014). The Standards for
Educational and Psychological Testing. Washington, DC: Author.
Anderson, D. L., Fisher, K. M., & Norman, G. J. (2002). Development and evaluation of the
conceptual inventory of natural selection. Journal of research in science teaching, 39(10), 952-
978.

53
Andrews, T. M., Price, R. M., Mead, L. S., McElhinny, T. L., Thanukos, A., Perez, K. E., ... &
Lemons, P. P. (2012). Biology undergraduates’ misconceptions about genetic drift. CBE-Life
Sciences Education, 11(3), 248-259.
Andrich, D., Marais, I., & Humphry, S. (2012). Using a theorem by Andersen and the
dichotomous Rasch model to assess the presence of random guessing in multiple choice items.
Journal of educational and behavioral statistics, 37(3), 417-442.
Beggrow, E. P., & Nehm, R. H. (2012). Students’ mental models of evolutionary causation:
natural selection and genetic drift. Evolution: Education and Outreach, 5(3), 429-444.
Bishop, B. A., & Anderson, C. W. (1990). Student conceptions of natural selection and its role in
evolution. Journal of research in science teaching, 27(5), 415-427.
Bond, T. G., & Fox, C. M. (2007). Applying the Rasch model: fundamental measurement in the
human sciences (2nd ed.). Mahwah: Lawrence Erlbaum Associates.
Boone, W.J., Staver, J.R., & Yale, M.S. (2014). Rasch analysis in the human sciences.
Dordrecht, the Netherlands: Springer.
Campbell, C. E., & Nehm, R. H. (2013). A critical analysis of assessment quality in genomics
and bioinformatics education research. CBE-Life Sciences Education, 12(3), 530-541.
College Board. (2015). AP biology: Course and exam description. New York: Author.
https://secure-media.collegeboard.org/digitalServices/pdf/ap/ap-biology-course-and-exam-
description.pdf . Accessed 28 Sept 2017.
de Ayala, R. J. (2009). The theory and practice of item response theory. New York: The Guilford
Press
Federer, M. R., Nehm, R. H., Opfer, J. E., & Pearl, D. (2015). Using a constructed-response
instrument to explore the effects of item position and item features on the assessment of
students’ written scientific explanations. Research in Science Education, 45(4), 527-553.
Federer, M. R., Nehm, R. H., & Pearl, D. K. (2016). Examining gender differences in written
assessment tasks in biology: a case study of evolutionary explanations. CBE-Life Sciences
Education, 15(1), ar2.
Furtak, E., Morrison, D., & Kroog, H. (2014). Investigating the link between learning
progressions and classroom assessment. Science Education, 98(4), 640-673.
Gershon, R. 1992. Guessing and Measurement. Rasch Measurement Transactions, 6:2 p. 209-
10.
International Baccalaureate Organization. (2014). Diploma programme biology guide. Cardiff:
Author

54
Kalinowski, S. T., Leonard, M. J., & Taper, M. L. (2016). Development and validation of the
conceptual assessment of natural selection (CANS). CBE-Life Sciences Education, 15(4), ar64.
Leary, L. F., & Dorans, N. J. (1985). Implications for altering the context in which test items
appear: A historical perspective on an immediate concern. Review of Educational research,
55(3), 387-413.
Linacre, J. M. (1994). Sample Size and Item Calibration Stability. Rasch Measurement
Transactions, 7(4) p.328
Linacre, J. M. (2017a). Winsteps® Rasch measurement computer program. Beaverton, Oregon:
Winsteps.com
Linacre, J. M. (2017b). A Users Guide to Winsteps/Ministep Rasch Model Computer Programs.
Program Manual 4.0.0 http://www.winsteps.com/a/Winsteps-ManualPDF.zip . Accessed 10
February 2018.
MacNicol, K. (1956). Effects of varying order of item difficulty in an unspeeded verbal test.
Unpublished manuscript, Educational Testing Service, Princeton, NJ.
Masel, J. (2012). Rethinking Hardy–Weinberg and genetic drift in undergraduate biology.
BioEssays, 34(8), 701-710.
Messick, S. (1995). Validity of psychological assessment. American Psychologist, 50, 741–749.
Miller, K. & Levine, J. (2017). Miller and Levine Biology. Upper Saddle River (NJ): Pearson
Prentice Hall.
Moharreri, K., Ha, M., & Nehm, R. H. (2014). EvoGrader: an online formative assessment tool
for automatically evaluating written evolutionary explanations. Evolution: Education and
Outreach, 7(1), 15.
Mollenkopf, W. G. (1950). An experimental study of the effects on item-analysis data of
changing item placement and test time limit. Psychometrika, 15(3), 291-315.
Nadelson, L. S., & Southerland, S. A. (2009). Development and preliminary evaluation of the
measure of understanding of macroevolution: introducing the MUM. The Journal of
Experimental Education, 78(2), 151-190.
National Research Council. (2001). Knowing what students know: The science and design of
educational assessment. Washington, DC: National Academies Press.
Nehm, R.H. (2018). Evolution (Chapter 14), In: Kampourakis, K., Reiss, M. Teaching Biology In
Schools. Routledge: New York.
55
Nehm, R. H., Beggrow, E. P., Opfer, J. E., & Ha, M. (2012). Reasoning about natural selection:
diagnosing contextual competency using the ACORNS instrument. The American Biology
Teacher, 74(2), 92-98.
Nehm, R. H., & Ha, M. (2011). Item feature effects in evolution assessment. Journal of Research
in Science Teaching, 48(3), 237–256.
Nehm, R.H., Haertig, H. (2012). Human vs. Computer Diagnosis of Students' Natural Selection
Knowledge: Testing the Efficacy of Text Analytic Software. Journal of Science Education and
Technology. 21(1), 56-73.
Nehm, R. H., & Schonfeld, I. S. (2008). Measuring knowledge of natural selection: a comparison
of the CINS, an open-response instrument, and an oral interview. Journal of Research in Science
Teaching, 45(10), 1131–1160.
Nehm, R. H., & Schonfeld, I. S. (2010). The future of natural selection knowledge measurement:
a reply to Anderson et al.(2010). Journal of Research in Science Teaching, 47(3), 358-362.
NGSS Lead States. (2013). Next generation science standards: For states, by states.
Washington, DC: The National Academies Press.
Nitko A.J., Brookhart S.M. (2010). Educational Assessment of Students (6th ed.). Upper Saddle
River, NJ: Pearson Prentice Hall.
Nowicki, S. (2017). HMH Biology 2017. Boston MA: Houghton Mifflin Harcourt Publishing
Company
Opfer, J. E., Nehm, R. H., & Ha, M. (2012). Cognitive foundations for science assessment
design: knowing what students know about evolution. Journal of Research in Science Teaching,
49(6), 744-777.
Perez, K. E., Hiatt, A., Davis, G. K., Trujillo, C., French, D. P., Terry, M., & Price, R. M. (2013).
The EvoDevoCI: A concept inventory for gauging students’ understanding of evolutionary
developmental biology. CBE-Life Sciences Education, 12(4), 665-675.
Price, R.M., Andrews T.M., McElhinny T.L., Mead L.S., Abraham J.K., Thanukos A., Perez
K.E. (2014). The Genetic Drift Inventory: A tool for measuring what undergraduates have
mastered about genetic drift. CBE-Life Science Education, 13(1), 65–75.
Price, R. M., & Perez, K. E. (2016). Beyond the adaptationist legacy: Updating our teaching to
include a diversity of evolutionary mechanisms. The American Biology Teacher, 78(2), 101-108.
Price, R. M., Pope, D. S., Abraham, J. K., Maruca, S., & Meir, E. (2016). Observing populations
and testing predictions about genetic drift in a computer simulation improves college students’
conceptual understanding. Evolution: Education and Outreach, 9(1), 8.

56
Romine, W. L., Schaffer, D. L., & Barrow, L. (2015). Development and application of a novel
Rasch-based methodology for evaluating multi-tiered assessment instruments: Validation and
utilization of an undergraduate diagnostic test of the water cycle. International Journal of
Science Education, 37(16), 2740-2768.
Schmiemann, P., Nehm, R. H., & Tornabene, R. E. (2017). Assessment of genetics
understanding: Under what conditions do situational features have an impact on measures?
Science & Education, 26(10), 1161-1191.
Sirotnik, K., & Wellington, R. (1977). Incidence sampling: an integrated theory for matrix
sampling. Journal of Educational Measurement, 14(4), 343–399.
Stony Brook University. (2017). Undergraduate Course Bulletin.
http://sb.cc.stonybrook.edu/bulletin/current/courses/index.pdf Accessed 12 December 2017.
Urry, L.A., Cain, M.L., Wasserman, S.A., Minorsky, P. V., & Reece, J.B. (2017). Campbell
Biology (11th ed.). Boston: Pearson.
Wright, B. D., & Stone, M. (1979). Best test design: Rasch measurement. Chicago: MESA Press.

57
Chapter 4. Testing the impact of surface features on students’ Mendelian genetics
understanding
4.1 Introduction
A substantial literature in cognitive psychology has produced clear and convincing
evidence that assessment task features -- such as the framing, context, or situation in which
problems are posed -- can impact the retrieval of scientific knowledge and resulting measures of
participants’ conceptual understanding (e.g., Chi, Feltovich, & Glaser 1981). Studies of student
reasoning in many science domains, including chemistry, physics, earth science, and biology
have demonstrated the ubiquity of what have been termed assessment “context effects” or item
surface features (reviewed in Nehm & Ha 2011). Understanding of how task cover stories,
contexts, or situational features impact reasoning is important for many educational activities,
including the selection of curricular examples to illustrate scientific phenomena, the design of
formative and summative assessment items, and determination of whether instruction has
fostered the development of abstract schemas divorced from particular instances (Mayer 2013).
Although the recognition of context effects on scientific reasoning has been widespread
following Chi et al.’s (1981) seminal study, remarkably few experimental studies have been
performed that clarify which contexts meaningfully impact measures of particular types of
problem solving in relation to scientific ideas. Indeed, research needs to move away from the
general documentation of context effects and towards domain-specific models that may be
leveraged to improve teaching and learning of core ideas (see Nehm & Ha 2011).
In biology education, studies of the impact of situational features on student reasoning
have been most extensively explored for the concept of natural selection (e.g., Ha & Nehm 2014;
Settlage 1994). Nehm and colleagues used large samples of American participants’ constructed-
response answers to carefully manipulated items to show that the measurement of student
understanding was significantly and meaningfully impacted by the taxon included in the item
(e.g., plant, animal, human), by the scale of evolutionary comparisons (e.g., within- vs. between
species), by the familiarity of the taxa and traits (e.g., penguin vs. prosimian), and by the polarity
of evolutionary change (e.g., the gain or loss of a trait) (Federer, Nehm, & Pearl 2016; Nehm,
Beggrow, Opfer, & Ha 2012; Nehm & Ha 2011; Nehm & Reilly 2007; Nehm & Ridgway 2011;
Opfer, Nehm, & Ha 2012). Some of these situational effects have also been documented in
international participants subjected to different educational experiences and cultural contexts
(e.g., Ha & Nehm 2014). This body of work shows that novice participants’ evolutionary
reasoning is strongly influenced by situational features, and that as expertise in the domain of
evolution increases, the impact of situational features on problem solving decreases (Nehm &
Ridgway 2011). Against this background it seems reasonable to investigate the impact of
situational features on students’ reasoning and performance measures for diverse problems and
particular (sub-)domains.
4.1.1 Genetics education
Although a large body of work has explored student difficulties with genetics problem
solving (e.g., Collins & Stewart 1989; Shea, Duncan, & Stephenson 2015; Smith 1983; Todd &
Romine 2016), much less work has explored the roles that situational features or contexts play in
the measurement of genetics understanding. An important early study on elementary school

58
children by Kargbo, Hobbs, and Erickson (1980) found that while students held intuitive notions
that environmentally-acquired characteristics could be transmitted to offspring, the belief did not
transfer uniformly across questions featuring representatives from familiar plant and animal taxa.
Humans were presumed to inherit acquired traits more often than dogs, and trees were rarely
presumed to inherit such traits. This work was an early indication that situational features could
bias genetic reasoning processes.
In a longitudinal study of the consistency of twelve through sixteen year olds’
conceptions about inheritance of acquired characteristics and other scientific phenomena, Clough
and Driver (1986) found that task context was most significant for students who had yet to
develop normative scientific understanding. Interviews of students with lower knowledge levels
revealed conceptions about acquired characteristics that displayed less consistency across
parallel tasks (e.g., taillessness in mice, athletic ability in humans, and rough skin caused by
gardening in humans) compared to interviews of students with higher knowledge levels. Clough
and Driver concluded that students have multiple alternative frameworks which are employed to
varying degrees depending on the context of the question. The authors went on to suggest the
“hopeful finding …that once students learn and use a correct scientific explanation in one
context, they are more likely to employ it in others” (Clough & Driver 1986: 489).
More recently, Ware and Gelman (2014) examined the degree to which animals’
phenotypic trait properties impacted student reasoning about inheritance. Specifically,
inheritance prompts were manipulated to highlight the functional properties (function-predictive,
e.g., “She uses her sharp claws to catch fish”) or habitat-relevant properties (habitat-predictive,
e.g., “Animals with bumpy skin live in the desert”) relative to a null condition (“non-
predictive”). Their empirical work showed that undergraduates believed that it was possible for
an animal to acquire a physical property in its lifetime provided that it had a useful function or
was a good fit with environmental conditions (Ware & Gelman 2014: 234). Like Kargbo et al.’s
(1980) and Clough & Driver’s (1986) studies, student ideas about inheritance were impacted by
item features, although in this case aspects of animal trait functions.
In a study of middle school students, Freidenreich, Duncan, and Shea (2011) found that
participants offered more robust genetic explanations for tasks using human examples compared
to those using plants and bacteria. Shea, Duncan, and Stephenson (2015) also found that
situational features play a significant role in some aspects of undergraduate participants’ genetics
reasoning. Specifically, a problem featuring human albinism elicited higher quality arguments
among early career biology majors than an equivalent task featuring genetically modified corn,
despite similar knowledge use across both tasks. Based on their findings, Shea et al. (p. 4) argued
that “Expanding the definition of genetics literacy to include the role of situational features is
critical, as the research literature suggests that [an] [individual’s] ability to generate and support
arguments about authentic genetics issues relies on their capacity to consider how issues are
framed by unique situational features.” The question remains as to which situational features
impact particular types of genetics problems, and how these features impact measures of student
learning. One possible starting point is Mendelian genetics.
4.1.2 Mendelian genetics
Although in recent years science education researchers have reconceptualized genetics
literacy, Mendelian transmission genetics remains a central component of biology education
(criticisms notwithstanding; see Smith & Gericke 2015). Stewart, Cartier, and Passmore (2005),

59
for example, developed a three-part model comprising genetic (e.g., classical, Mendelian, or
transmission genetics), meiotic (e.g., processes relating to the production of gametes), and
molecular (e.g., gene expression) understanding. Stewart’s model more recently was refined to
encompass a broader range of more carefully delineated genetic constructs and was situated
within a learning progression framework (see, for example, Duncan, Rogat and Yarden 2009;
Todd & Romine 2016). Despite several conceptual reorganizations, classical transmission
genetic problem solving has been retained within these new frameworks, although reformulated
to some extent (Todd & Romine 2016, p. 1678).
With improved understanding of genomics and molecular genetics, the limitations of
traditional inheritance-centered approaches to genetics education have become clearer.
Increasing consideration from both theoretical and empirical perspectives has been given to the
proper role of Mendelian genetics in the curriculum and as a component of genetics literacy (eg.
Duncan et al. 2009; Jamieson & Radick 2013; Smith & Gericke 2015; Todd & Romine 2016).
From a biological perspective, it has been long recognized that attempts to characterize complex
traits within a Mendelian framework are insufficient; even acrobatic adaptations of Mendelian
“rules” in cases such as pleiotropy, epistasis, multiple alleles, and incomplete penetrance fail to
explain the observed phenotypic patterns of many traits. Indeed, most human traits are
multifactorial and can only be fully explained by addressing the molecular link between
genotype and phenotype. Key molecular considerations beyond the scope of Mendelian genetics
are the roles of variation in genetic code and protein structure, the interaction of genes and gene
products (including RNA) with other gene products and the environment, the various mediators
of gene expression, and epigenetics (Dougherty et al. 2011; Jamieson & Radick 2013; Smith &
Gericke 2015). While these have been included to varying extents within the molecular model of
genetics (Stewart et al. 2005; Duncan et al. 2009; Todd & Romine 2016), students often struggle
draw connections between Mendelian and molecular aspects of genetics (Lewis & Kattman
2004; Todd & Romine 2016). From a pedagogical perspective, Mendelian-centric presentations
of genetics have been associated with fueling students’ tendency to accept the simplest
explanation over more accurate but complex explanations for trait variant (Dougherty et al. 2011;
Gericke et al. 2014; Jamieson & Radick 2013), feeding into existing confusion about the concept
of dominance (Allchin 2005; Jamieson & Radick 2013), and promoting exaggerated
deterministic perspectives on inheritance which can contribute to related social extensions of
deterministic views (Gericke et al. 2014; Castéra & Clément 2014; Castéra et al. 2008; Jamieson
& Radick 2013, 2017). Together, these concerns underpin the importance of research toward
clearly delineating the place of Mendelian genetics within learning progressions and associated
curricula. Careful study of how students respond to genetics problems situated in different
contexts will further help to refine educators’ understanding of thinking and learning in genetics
toward that end.
New assessments developed for genetics learning progressions (e.g., Duncan et al. 2009)
and genetics learning in undergraduate settings (e.g., Bowling et al. 2008) continue to include
items that fall under the umbrella of “Mendelian transmission genetics” (see Table 4.1). These
assessments are variable in terms of the contexts or situational features that are used to measure
student understanding, and disproportionately use animal (including human) contexts. Given the
relative stability of “Mendelian transmission” questions in historical and contemporary
educational research on genetics learning, and the continued use of assessments that differ in
situational features (see Table 4.1), this study focused on the role of situational features on
Mendelian problem solving performance.
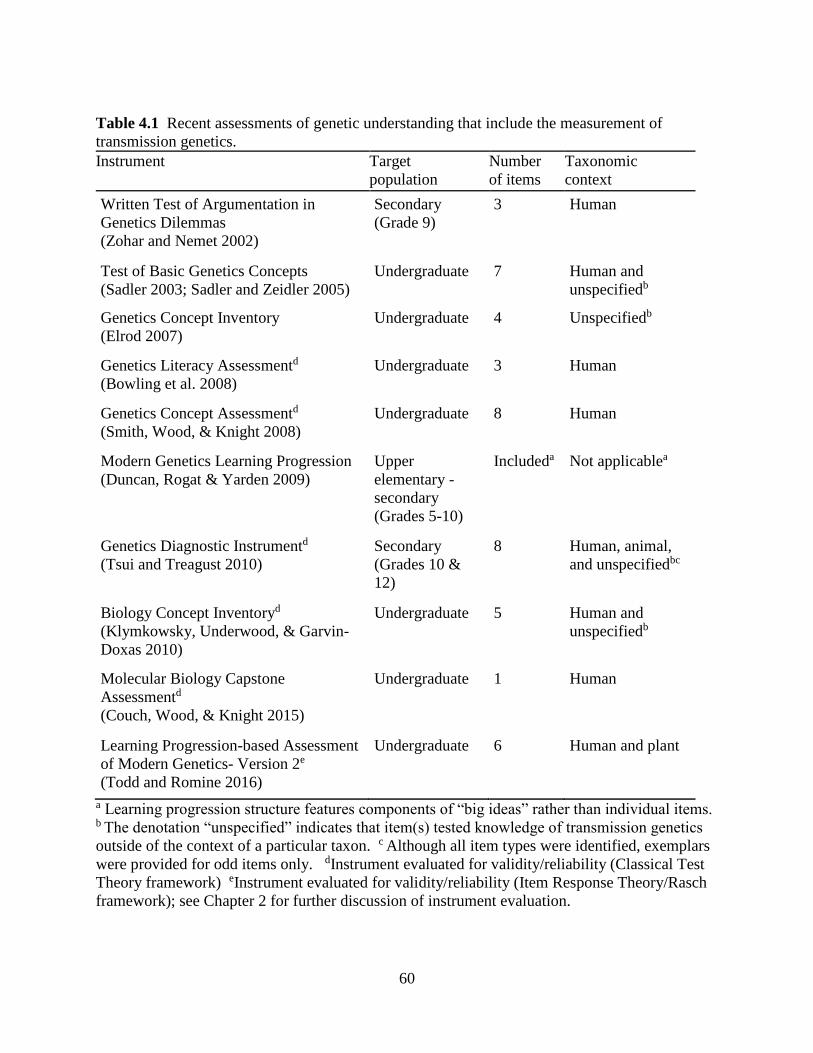
60
Table 4.1 Recent assessments of genetic understanding that include the measurement of
transmission genetics.
Instrument Target
population
Number
of items
Taxonomic
context
Written Test of Argumentation in
Genetics Dilemmas
(Zohar and Nemet 2002)
Secondary
(Grade 9)
3 Human
Test of Basic Genetics Concepts
(Sadler 2003; Sadler and Zeidler 2005)
Undergraduate 7 Human and
unspecifiedb
Genetics Concept Inventory
(Elrod 2007)
Undergraduate 4 Unspecifiedb
Genetics Literacy Assessmentd
(Bowling et al. 2008)
Undergraduate 3 Human
Genetics Concept Assessmentd
(Smith, Wood, & Knight 2008)
Undergraduate 8 Human
Modern Genetics Learning Progression
(Duncan, Rogat & Yarden 2009)
Upper
elementary -
secondary
(Grades 5-10)
Includeda Not applicablea
Genetics Diagnostic Instrumentd
(Tsui and Treagust 2010)
Secondary
(Grades 10 &
12)
8 Human, animal,
and unspecifiedbc
Biology Concept Inventoryd
(Klymkowsky, Underwood, & Garvin-
Doxas 2010)
Undergraduate 5 Human and
unspecifiedb
Molecular Biology Capstone
Assessmentd
(Couch, Wood, & Knight 2015)
Undergraduate 1 Human
Learning Progression-based Assessment
of Modern Genetics- Version 2e
(Todd and Romine 2016)
Undergraduate 6 Human and plant
a Learning progression structure features components of “big ideas” rather than individual items. b The denotation “unspecified” indicates that item(s) tested knowledge of transmission genetics
outside of the context of a particular taxon. c Although all item types were identified, exemplars
were provided for odd items only. dInstrument evaluated for validity/reliability (Classical Test
Theory framework) eInstrument evaluated for validity/reliability (Item Response Theory/Rasch
framework); see Chapter 2 for further discussion of instrument evaluation.

61
4.1.3 Genetics Problem types
The field of genetics problem solving research has employed a variety of problem
structures and types. Monohybrid crosses featuring simple dominance and, to a lesser degree,
incomplete or codominance, have been used widely in genetics problem-solving research (e.g.,
Browning & Lehman 1988; Cavallo 1994; Corbett, Kauffman, Maclaren, Wagner, & Jones 2010;
Gipson, Abraham & Renner 1989; Moll & Allen 1987; Simmons & Lunetta 1993; Slack &
Stewart 1990; Smith & Good 1984; Stewart 1983). Simple dominance and codominance
represent two of the four types or “classes” of genetics problems (simple dominance,
codominance, sex linkage and multiple alleles) identified by Collins and Stewart (1989) in their
categorization of Mendelian genetics knowledge structure. It should be noted that the distinction
between incomplete dominance and codominance can be blurry, and, since the transmission
pattern is the same, they are often considered together. Tasks involving sex linkage and multiple
alleles are considered to be more complex and have been employed less frequently in education
research.
Stewart (1988) also classified genetics problems according to whether they require the
more commonly used “cause to effect” reasoning or the more cognitively demanding “effect to
cause” reasoning. Hickey (2000) and Tsui and Treagust (2010) expanded Stewart’s
categorization into six types of genetics problems. These authors proposed that Stewart’s
reasoning types (plus a third type, process reasoning, not relevant to the present study) constitute
a domain-general thought dimension which intersects with the domain-specific dimension of
within-generation (simpler) or between-generation (complex) thought. In line with this
theoretical perspective on the construct, this study includes problems testing knowledge of
transmission between generations (which subsumes knowledge of the simpler within-generation
mechanisms) with both “cause to effect” and “effect to cause” examples.
Although the United States lacks a national science curriculum, Mendelian transmission
genetics and associated genetic crosses are a commonly encountered topic and problem type
from upper elementary through undergraduate classrooms. The subject is included in (1) the K-
12 science education standards (National Research Council 1996, 2012), (2) the Next Generation
Science Standards (NGSS 2013), (3) the American Society for Human Genetics recommended
content for the collegiate level (Hott et al. 2002), and (4) nearly all college biology textbooks
(e.g., Hott et al. 2002; McElhinny, Dougherty, Bowling, & Libarkin 2014). In addition, biology
teacher certification exams, such as Praxis (ETS 2015), include items on Mendelian inheritance,
and genetic crosses remain in the most recent versions of high school Advanced Placement
Biology (College Board 2015) and International Baccalaureate Biology curricula (International
Baccalaureate Organization 2014). In sum, transmission genetics is a core aspect of genetics
learning in the United States.
4.1.4 Demographic factors and genetics education
Many studies in genetics education have not explicitly considered the role of
demographic factors (e.g., gender, race) in their research designs despite a half century of
research demonstrating differences in attitudes, understanding, achievement, and participation
(Eddy & Brownell 2016; Kahle & Meece 1994; Lee & Luykx 2007; Linn & Hyde 1989; Peng,
Wright, & Hill 1995; Scantlebury 2014; Scantlebury & Baker 2007; Weinburgh 1995).
Differences in science achievement may be due to factors specific to a demographic group

62
(Peng, Wright, & Hill 1995; Scantlebury & Baker 2007) or as a result of bias in curriculum,
instructional practices, school climate, or assessment methods (Lee & Luykx 2007).
In biology education, the roles of gender and ethnicity on domain-specific performance
remain unsettled. Some studies, for example, have documented the absence of significant gender
effects on biology performance (e.g., Dimitrov 1999; Huppert, Lomask & Lazarowitz 2002;
Lauer et al. 2013; Shepardson & Pizzini 1994; Willoughby & Metz 2009). Dimitrov (1999) and
Creech and Sweeder (2012) found no impact of ethnicity on biology performance, and Nehm and
Schonfeld (2008) found similar types of alternative conceptions in underrepresented students as
documented in other demographic groups. Other studies, in contrast, have found advantages for
males in undergraduate biology course grades (Creech & Sweeder 2012) and test scores (Eddy,
Brownell, & Wenderoth 2014; Stanger-Hall 2012, Wright et al. 2016), particularly on multiple-
choice (Stanger-Hall 2012) and high-difficulty (Wright et al. 2016) items. Other studies have
found that females outperformed males on concept maps (Pearsall et al. 1997) and on tests of
labeling errors (Soyibo 1999). Overall, gender and race/ethnicity have been shown to play
significant roles in some studies and in some item formats, but not others (Federer et al. 2016).
Many studies in genetics education have failed to consider the roles that demographic
factors might play on measures of performance and inferences about genetics learning
challenges. An absence of gender effects was noted by Cavallo (1994) in high school
participants’ written explanations of genetics and meiosis, and by Dogru-Atay and Tekkaya
(2008) in eighth graders’ multiple-choice responses about inheritance and genetics crosses.
However, Franke and Bogner (2011) showed a female advantage for retaining new conceptions
about molecular genetics and genetics technology on a multiple-choice test. To ensure accurate
measures of learning and appropriately designed curriculum and instructional methods, more
information is needed about how different assessment methods measure understanding in the
various branches of biology across all demographic groups. Because of the importance of gender
and race/ethnicity to science education, and the paucity of work in genetics education in
particular, this study disaggregates data by gender and ethnicity to examine any potential testing
bias or performance discrepancies.
4.2 Research question
The study employs an experimental research design in order to investigate the degree to which
situational features of genetics problems impact measures of student understanding. Using a suite
of Mendelian inheritance problems about complete dominance and incomplete dominance, the
following research question is posed: Do Mendelian inheritance problems that differ in taxon
(animal, plant, human) or familiarity (real, fictitious) produce equivalent measures of student
understanding in university participants across genders and ethnic backgrounds?
4.3 Methods
4.3.1 Item design
To understand whether Mendelian inheritance problems differing in taxa produce
equivalent measures of understanding, this study quantified differences in item difficulty
(dependent variable) for Mendelian inheritance problems featuring real and fictitious examples
from different taxa such as animals, plants, and humans (independent variables). The universe of

63
possible situational features to choose from is quite large. Prior research to guided the choice of
situational features (i.e., taxon: plant/animal/human, familiarity: real/fictitious). Many studies in
cognitive developmental psychology have shown that plant/animal/human distinctions are a
fundamental feature of early cognitive frameworks (so-called “naive biology”) and serve to
organize biological reasoning in young children and many adults (reviewed in Opfer et al. 2012).
The plant/animal/human distinctions have also been shown to be highly relevant to how children
and adults think about biological processes such as evolution and genetics (Opfer et al. 2012;
Shea et al. 2015). Thus, much work in psychology and education motivated the choice of taxon
as a situational feature worthy of interest.
Controlling for familiarity using fictitious properties has been a central design feature of
cognitive studies for decades, and has recently emerged as an important consideration in studies
of biological reasoning (Opfer et al. 2012; Ware & Gelman 2014). In both genetics and evolution
education, research has shown that “...reasoning deviates from accepted scientific ideas more so
when considering novel categories” (Ware & Gelman 2014, p. 233). Therefore, fictitious taxa
and traits were developed that would by definition be novel to participants, and real taxa were
used which participants had been exposed to from their curricula. Given that taxa and familiarity
have been shown to have strong influences on biological reasoning, these choices made sense as
a starting point for this experimental work.
Using this framework, a core collection of five multiple-choice item types addressing the
Mendelian inheritance mechanisms of complete dominance and incomplete dominance was
developed. These topics were chosen given their (1) ubiquity in genetics education, and hence
their relevance to educators worldwide (see Sections 4.1.2 and 4.1.3) and (2) presence in the
enacted curriculum, ensuring that the sample had received basic instruction in the topic. This
should help to make sure students have sufficient knowledge to solve the problems successfully
and prevent statistical bottom effects. All items consisted of simple monohybrid crosses,
resembling item types that are common in recent research instruments (cf. Table 4.1), earlier
genetics research (e.g., Gipson, Abraham & Renner 1989; Kinnear 1983; Knippels 2005; Slack
& Stewart 1990; Smith & Good 1984; Tolman 1982) and which continue to be popular in
biology textbooks (Hott et al. 2002) and high-stakes international high school tests such as the
SAT Subject Tests (College Board 2016), Advanced Placement Biology Exam (College Board
2015), and International Baccalaureate Biology Exam (International Baccalaureate Organization
2014). While these do not represent all possible Mendelian inheritance problem types, they are
among the most widely used and form the basis for more complex genetics problems (Collins &
Stewart 1989). In line with the Mendelian inheritance problem types described in Section 4.1.3
the items used represent both types of genetics reasoning described by Stewart (1998), the two
more common types of dominance relationships described by Collins and Stewart (1989), and
include knowledge of both between-generation and within generation reasoning as outlined by
Hickey (2000) and Tsui and Treagust (2010).
Each item stem presented a particular taxon (e.g., pea plant), a particular trait (e.g., seed
shape), and an inheritance pattern for that trait (e.g., round seed is dominant). The items then
described a specific crossing experiment (e.g., homozygous pea plants with round and wrinkled
seed shapes were crossed). Item tasks included predicting the phenotypic distribution of the first
filial generation (F1) given information about the parental (P) genotypes, or predicting parental
(P) genotypes given the phenotypes of first filial offspring (F1). Five multiple-choice options (1
attractor, 4 distractors) were given. An overview of the five types of items are given in Table 4.2.

64
The five item types were used as templates to generate alternate versions that differed only in the
taxon featured (i.e. animal, plant, or human) and its corresponding trait (e.g., body color in fruit
flies, seed shape in peas). To test for the impact of familiarity or prior knowledge, fictitious taxa
and traits (e.g., fur color of “Amalcho” animals) were also included. To ensure participants
correctly identified taxa as plants or animals--especially fictitious examples--item text included
the words such as “plant” in all instances where plants were referred to (e.g., “pea plants” instead
of “peas”). Each item also included a small picture of the “taxon”. By rotating different
situational features among the core of five types of inheritance problems, a total of 81 items was
generated: 35 featuring animals (16 fictitious), 34 featuring plants (16 fictitious), and 12
featuring humans. An example of an item altered to feature different taxa and their respective
traits is shown in Table 4.3. Additional item information can be found in the Appendix.
Evidence of content validity was generated by four experts in biology education (university
degrees in biology and biology education). They reviewed all item stems and answer options,
and rated all items as appropriate to the domain of Mendelian genetics and correctly placed items
within their expected problem categories (i.e. Table 4.2). Further validity evidence is discussed
in Section 4.5.1. As items were initially developed for use with a similar study performed in
Germany (see Schmiemann, Nehm, and Tornabene 2017 for more details), two bilingual
(German/English) biology educators translated the original German items into English, and two
American biology educators gave feedback on item content and checked the translation for
grammatical clarity. The final English version was then reviewed by the bilingual German
educators.
Table 4.2 Five types of Mendelian inheritance problems used in the study
Mendelian inheritance pattern Information given Question posed
Dominant-Recessive Homozygous parental
generation (P)
Distribution of first filial
generation (F1)
Dominant-Recessive Heterozygous parental
generation (P)
Distribution of first filial
generation (F1)
Dominant-Recessive Distribution of first filial
generation (F1)
Parental generation (P)
genotypes
Incomplete dominance Homozygous parental
generation (P)
Distribution of first filial
generation (F1)
Incomplete dominance Heterozygous parental
generation (P)
Distribution of first filial
generation (F1)
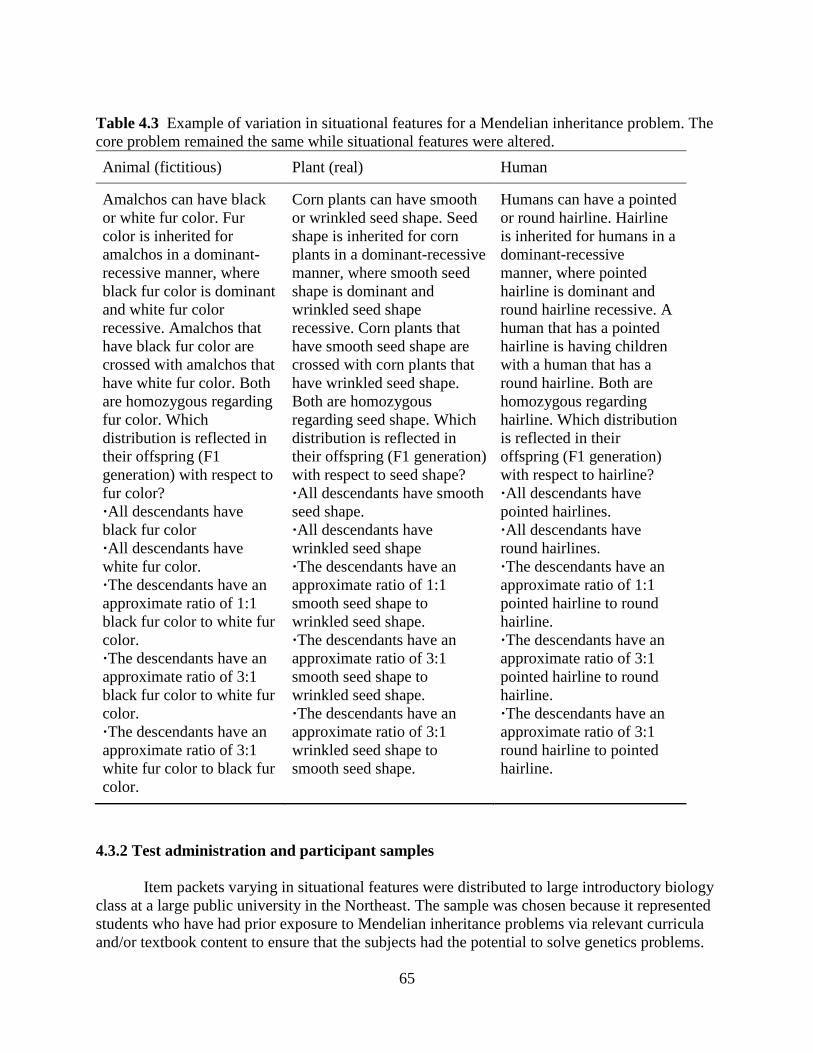
65
Table 4.3 Example of variation in situational features for a Mendelian inheritance problem. The
core problem remained the same while situational features were altered.
Animal (fictitious) Plant (real) Human
Amalchos can have black
or white fur color. Fur
color is inherited for
amalchos in a dominant-
recessive manner, where
black fur color is dominant
and white fur color
recessive. Amalchos that
have black fur color are
crossed with amalchos that
have white fur color. Both
are homozygous regarding
fur color. Which
distribution is reflected in
their offspring (F1
generation) with respect to
fur color?
·All descendants have
black fur color
·All descendants have
white fur color.
·The descendants have an
approximate ratio of 1:1
black fur color to white fur
color.
·The descendants have an
approximate ratio of 3:1
black fur color to white fur
color.
·The descendants have an
approximate ratio of 3:1
white fur color to black fur
color.
Corn plants can have smooth
or wrinkled seed shape. Seed
shape is inherited for corn
plants in a dominant-recessive
manner, where smooth seed
shape is dominant and
wrinkled seed shape
recessive. Corn plants that
have smooth seed shape are
crossed with corn plants that
have wrinkled seed shape.
Both are homozygous
regarding seed shape. Which
distribution is reflected in
their offspring (F1 generation)
with respect to seed shape?
·All descendants have smooth
seed shape.
·All descendants have
wrinkled seed shape
·The descendants have an
approximate ratio of 1:1
smooth seed shape to
wrinkled seed shape.
·The descendants have an
approximate ratio of 3:1
smooth seed shape to
wrinkled seed shape.
·The descendants have an
approximate ratio of 3:1
wrinkled seed shape to
smooth seed shape.
Humans can have a pointed
or round hairline. Hairline
is inherited for humans in a
dominant-recessive
manner, where pointed
hairline is dominant and
round hairline recessive. A
human that has a pointed
hairline is having children
with a human that has a
round hairline. Both are
homozygous regarding
hairline. Which distribution
is reflected in their
offspring (F1 generation)
with respect to hairline?
·All descendants have
pointed hairlines.
·All descendants have
round hairlines.
·The descendants have an
approximate ratio of 1:1
pointed hairline to round
hairline.
·The descendants have an
approximate ratio of 3:1
pointed hairline to round
hairline.
·The descendants have an
approximate ratio of 3:1
round hairline to pointed
hairline.
4.3.2 Test administration and participant samples
Item packets varying in situational features were distributed to large introductory biology
class at a large public university in the Northeast. The sample was chosen because it represented
students who have had prior exposure to Mendelian inheritance problems via relevant curricula
and/or textbook content to ensure that the subjects had the potential to solve genetics problems.

66
An overlapping multi-matrix sampling was used to distribute the items among different test
booklets (cf. Sirotnik & Wellington 1977). This allows for two important features of the study
design: First, items constructed from the same template did not appear next to each other,
ensuring that participants were required to think about each item separately. Second, not every
student had to work on all 81 items, minimizing test fatigue, but maximizing study coverage.
All data collection qualified for IRB exemption status under IRB number 2013-2298-R1.
Extra credit was offered for participation in the study, and participants were aware that their
performance would not be reflected in their course grade. All participants were biology majors
enrolled in the spring semester of an introductory biology course at a research-intensive public
university in the northeastern United States. All participants had received genetics instruction
(including Mendelian genetics) earlier in the semester. Participants differed in the amount of
prior biology preparation, as is typical for American undergraduates. In order to control for
background content preparation, the following categorizations were used: No college-level
biology coursework other than the current course (24.7%), High School Advanced Placement
biology only (10.5%), one college biology course (16.4%), two or more college biology courses
(43%). No information about prior coursework was provided for 5.2% of the participants.
Overall, 444 participants (62.4% female) with an average age of 19.6 years (SD=2.4) took part in
the study. The sample included Asian (38.3%), White (34.0%), Hispanic (7.9%), African
American (5.6%) and other (e.g., mixed background, 8.3%) participants. For 5.9% of the
participants, no race/ethnicity data were available. One hour was provided to participants to
complete the tasks, allowing all 81 items to be used across booklets. Eight test booklets
containing 20-21 items were randomly assigned to these participants via Survey Monkey
software. The software prevented participants from returning to prior questions once answers
were submitted. Each item was worked on by an average of 114 participants (SD=20.5).
4.3.3 Rasch analysis
Conquest (Adams et al. 2016) was used to analyze data according to the Rasch model.
Rasch modeling is ideal for educational measurement because it converts ordinal data into linear
data and provides item and person measures as “logit” scores on the same equal-interval ratio
scale. Generating item and person measures on the same scale makes it possible to determine the
probability that a particular person could solve a particular item. In this analysis, a person had a
fifty percent chance of solving a particular item if that particular item measure is equal to the
person measure (Bond & Fox 2007, p. 38). Rasch modeling can also accommodate “missing”
data, which is essential in multi-matrix designs in which participants are assigned only a subset
of items from the total collection of questions. Such designs allow testing of a wider variety of
items while minimizing participant test fatigue.
Item parameters and person abilities were estimated using the 1PL model. Therefore,
correct answers were coded as one and incorrect answers (including skipped items and items
with more than one option chosen) as zero using the key command of Conquest. Consideration
of how well the empirical data fit the statistical Rasch model is one approach for evaluating the
quality of the test items, the test instrument, and overall evidence in support of validity claims
(Boone, Staver, & Yale 2014). Therefore, item fit statistics were examined (Wright 1984). Fit
statistics indicate how well the empirical data meet the model requirement using a chi-square test
(Bond & Fox 2007, p. 238). Fit is expressed as weighted (“infit”) or unweighted (“outfit”) values
for the mean square parameter (MNSQ). For a standard multiple choice assessment, MNSQ

67
values above 1.3 are considered to be “underfitting”, indicating that the response pattern for that
item is erratic. Values below 0.7 are considered to be “overfitting”, indicating that the response
pattern is overly predictable. Both overfit and underfit suggest that the item is not functioning
properly (i.e. eliciting information consistent with test-taker ability). Cut-off values of 0.7 and
1.3 for the MNSQ parameter were used to ensure an adequate match between the empirical data
and the statistical model (Boone et al. 2014; Bond & Fox 2007). Further indicators of test quality
include item and person reliability measures which can be interpreted similarly to Cronbach’s
alpha in classical test theory (cf. Wright & Stone 1979).
4.3.4 Comparison of item difficulties
To compare item difficulties for the different question types and situational features,
classical statistics and box plots of Rasch scores were used. The Kruskal-Wallis test (Kruskal &
Wallis, 1952) and Mann-Whitney U test (Mann & Whitney, 1947) were used to test for
significant differences in item parameter (dependent variable) for different groups of items
(independent variables: animal vs. plant vs. human; fictitious vs. real). These non-parametric
tests were chosen due to the small number of items in each group. ANOVAs and Pearson
correlation tests of Rasch scores were used to analyze student performance by demographic
group, gender, and associated contextual variables.
4.4 Results
4.4.1 Rasch model fit
Overall, the data showed good fit to the Rasch model. However, the initial analysis
revealed four items with poor fit: three with so-called underfit (wMNSQ >1.3) and one with
overfit (wMNSQ < 0.7). Therefore, those items were removed from further analysis. The final
estimation, and all further analyses, were based on the set of 77 items demonstrating acceptable
fit values (final deviance 7050.55). Appendix A contains a detailed report of all item fit statistics.
An average number of 114 participants (SD=20.5) worked on each item. Warms Likelihood
Estimates (WLE) were used as person measures (Warm 1989). The overall item reliability (WLE
reliability = 0.726, EAP/PV reliability = 0.823) and the separation reliability (0.877) were robust.
Similar to Cronbach’s alpha in classical test theory, item reliability and item separation are
reported on a 0-1 scale and reflect internal consistency of the item set. Acceptable item reliability
and separation reliability indicate that the items functioned together to hierarchically differentiate
the measured trait into sufficient levels in a manner that can be replicated in comparable samples.
This is underpinned by an average item-total correlation of 0.59 for the items. The test variance
was very high (4.280), indicating there is a broad range of answer patterns.
A Wright map, or person-item map, may be used to compare how well-matched item
difficulty is to person ability on the same logit scale (Figure 4.1). Items are represented by their
item number on the right side of the scale (see the Appendix A for item details). Mean item
difficulty is set at 0 logits; higher logit scores indicate more difficult items and lower (negative)
logit scores indicate easier items. Persons are represented by “X’s” on the left side of the scale
and are plotted so that each person has a 50% probability of correctly answering an item with an
equivalent measure.

68
Figure 4.1 A Wright map derived from Rasch analysis of Mendelian inheritance item responses.
The distribution of persons (on the left) and GeDI items (on the right) are illustrated on the same
log interval (-3 to 8) scale Each X=0.6 cases. For detailed information about the items see the
Appendix.
The Wright map in Figure 4.1 displays acceptable item distribution for the university
student sample, as the spread of person ability spans the difficulty of the items. The distribution
of more than half of the persons with logit scores above the most difficult item indicates that the
items were easy for this sample, which is reflected in the average person ability of 2.04 logits
and a percentage of right answers per item between 54.4% and 96.1%. As there is a normal
distribution of item difficulty and no ceiling effect, one can assume that the variance is not
restricted artificially. Hence a further analysis of the item difficulties (Min = -2.29 logits, Max =
+1.68 logits) seems to be reasonable (Section 4.5.2).
4.4.2 Item difficulties
As expected, there were no significant differences in student performance among the
eight test packets (F(7,436)=0.534, p=0.809). Box plots (Figure 4.2) illustrate similar item
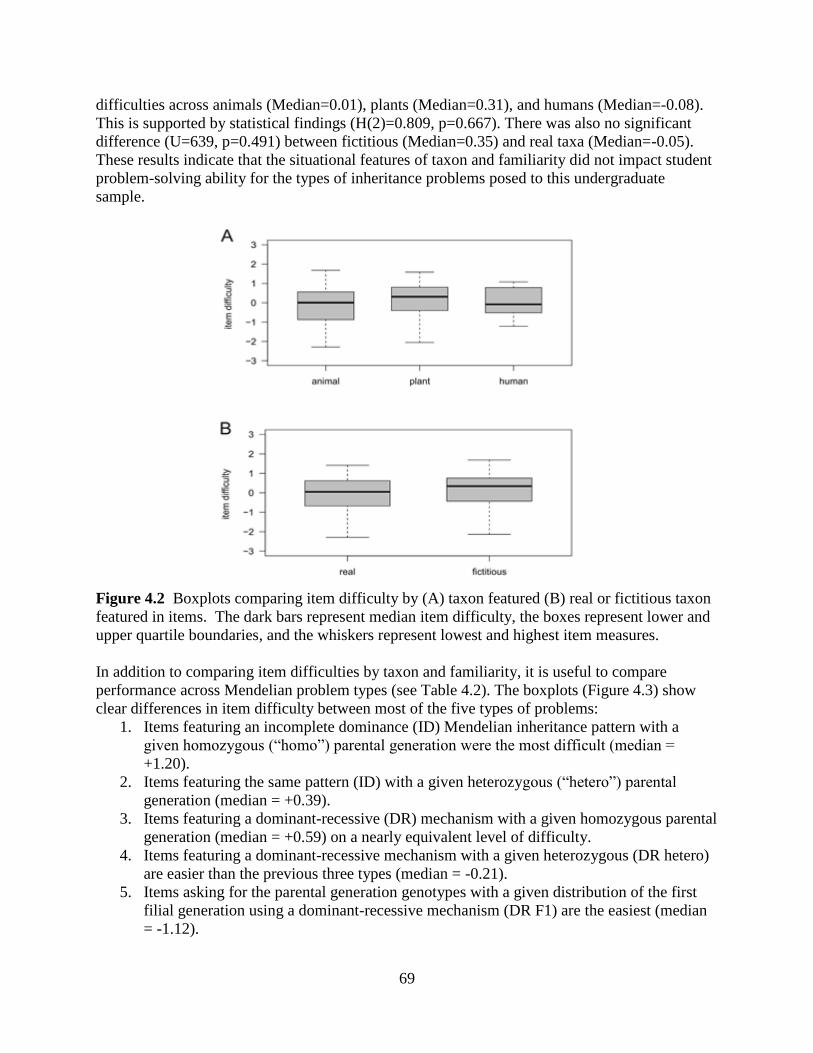
69
difficulties across animals (Median=0.01), plants (Median=0.31), and humans (Median=-0.08).
This is supported by statistical findings (H(2)=0.809, p=0.667). There was also no significant
difference (U=639, p=0.491) between fictitious (Median=0.35) and real taxa (Median=-0.05).
These results indicate that the situational features of taxon and familiarity did not impact student
problem-solving ability for the types of inheritance problems posed to this undergraduate
sample.
Figure 4.2 Boxplots comparing item difficulty by (A) taxon featured (B) real or fictitious taxon
featured in items. The dark bars represent median item difficulty, the boxes represent lower and
upper quartile boundaries, and the whiskers represent lowest and highest item measures.
In addition to comparing item difficulties by taxon and familiarity, it is useful to compare
performance across Mendelian problem types (see Table 4.2). The boxplots (Figure 4.3) show
clear differences in item difficulty between most of the five types of problems:
1. Items featuring an incomplete dominance (ID) Mendelian inheritance pattern with a
given homozygous (“homo”) parental generation were the most difficult (median =
+1.20).
2. Items featuring the same pattern (ID) with a given heterozygous (“hetero”) parental
generation (median = +0.39).
3. Items featuring a dominant-recessive (DR) mechanism with a given homozygous parental
generation (median = +0.59) on a nearly equivalent level of difficulty.
4. Items featuring a dominant-recessive mechanism with a given heterozygous (DR hetero)
are easier than the previous three types (median = -0.21).
5. Items asking for the parental generation genotypes with a given distribution of the first
filial generation using a dominant-recessive mechanism (DR F1) are the easiest (median
= -1.12).
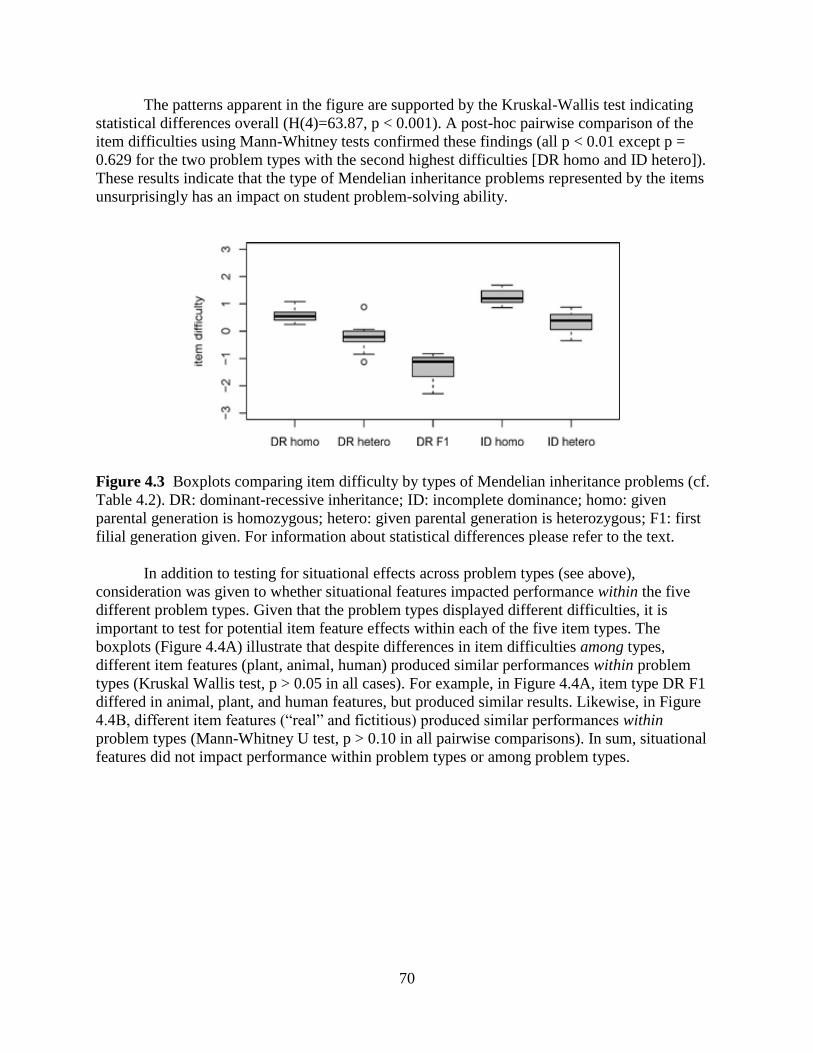
70
The patterns apparent in the figure are supported by the Kruskal-Wallis test indicating
statistical differences overall (H(4)=63.87, p < 0.001). A post-hoc pairwise comparison of the
item difficulties using Mann-Whitney tests confirmed these findings (all p < 0.01 except p =
0.629 for the two problem types with the second highest difficulties [DR homo and ID hetero]).
These results indicate that the type of Mendelian inheritance problems represented by the items
unsurprisingly has an impact on student problem-solving ability.
Figure 4.3 Boxplots comparing item difficulty by types of Mendelian inheritance problems (cf.
Table 4.2). DR: dominant-recessive inheritance; ID: incomplete dominance; homo: given
parental generation is homozygous; hetero: given parental generation is heterozygous; F1: first
filial generation given. For information about statistical differences please refer to the text.
In addition to testing for situational effects across problem types (see above),
consideration was given to whether situational features impacted performance within the five
different problem types. Given that the problem types displayed different difficulties, it is
important to test for potential item feature effects within each of the five item types. The
boxplots (Figure 4.4A) illustrate that despite differences in item difficulties among types,
different item features (plant, animal, human) produced similar performances within problem
types (Kruskal Wallis test, p > 0.05 in all cases). For example, in Figure 4.4A, item type DR F1
differed in animal, plant, and human features, but produced similar results. Likewise, in Figure
4.4B, different item features (“real” and fictitious) produced similar performances within
problem types (Mann-Whitney U test, p > 0.10 in all pairwise comparisons). In sum, situational
features did not impact performance within problem types or among problem types.

71
Figure 4.4 Boxplots comparing item difficulties by problem types and situational features.
A. Item difficulties grouped by problem type, and shaded by taxon (animal, plant, human).
B. Item difficulties grouped by problem type, shaded by real or fictitious feature.
DR: dominant-recessive inheritance; ID: incomplete dominance; homo: given parental
generation is homozygous; hetero: given parental generation is heterozygous; F1: first filial
generation given. For information about statistical differences please refer to the text.
4.4.3 Participant demographics
No significant differences in performance (F(1,416)=1.302, p=0.255) between male
(Mean = 1.63) and female (Mean = 1.84) participants was found. Although an ANOVA revealed
an overall difference in performance among demographic groups (F(5,412)=3.155, p=0.008),
post-hoc tests did not produce any significant pairwise differences (p ≥ 0.094). A very small
negative correlation between performance and age (r=-0.01, p ≤ 0.05) was found. Finally, as one
might expect, there was a significant association between performance and number of completed
biology courses (r=0.27, p < 0.01).
4.5 Discussion
Recent studies in biology education have documented significant and, in some cases,
predictable impacts of situational features or contexts on measurements of student understanding.
In the domain of evolution, for example, Nehm and colleagues have shown that measures of
undergraduates’ understanding are impacted by the taxon included in the item, the scale of
evolutionary differences, the familiarity of the taxa and traits, and the polarity of evolutionary
change (e.g., the gain or loss of a trait) (Nehm & Ha 2011; Nehm & Reilly 2007; Nehm &
Ridgway 2011; Opfer et al. 2012). Similar to these findings in evolution, Clough & Driver
(1986), Kargbo et al. (1980), Freidenreich et al. (2011), Shea et al. (2015), and Ware and Gelman
(2014) found that situational features can play a significant role in genetic reasoning and

72
argumentation. As a result of these findings, Shea, Duncan, and Stephenson (2015) developed a
genetics-reasoning model that explicitly highlights the role of context effects. However, much of
the prior work on genetics reasoning has been based on small samples and has not used an
experimental research design capable of isolating the precise factors responsible for performance
differences (Ware and Gelman’s 2014 design is a notable exception). Therefore, an important
question in genetics education is which situational features impact particular types of problem
solving, and how our understanding of these factors can be leveraged to improve teaching,
learning, and assessment.
4.5.1 Impact of situational features on item difficulty
This study tested whether item difficulty was associated with situational features, which
was expected given extensive prior work in cognitive psychology and a growing body of work in
genetics education (Chi et al. 1981; Kargbo et al. 1980; Mayer 2013; Opfer et al. 2012; Ware &
Gelman 2014). In all of these studies, attending to the situational features was not required for
successful problem solving, but such features nevertheless impacted participants’ scientific
reasoning. Surprisingly, this experimental study failed to find situational effects on Mendelian
genetics problem solving. Similar results were also found in a partner study using a similar item
set and study design in a sample of German high school students (Schmiemann, Nehm, and
Tornabene 2017). Contrary to Nehm and colleagues’ work in the domain of evolution (e.g.,
Opfer, Nehm & Ha 2012), and Ware & Gelman’s (2014) work in the domain of genetics,
different taxa (animal, plant, human) and familiarities (fictional, real) appear to have no
significant impact on students’ genetic problem solving performance. These findings suggest that
providing sets of genetics examples using mixtures of these contextual features will be unlikely
to impact measures of student understanding, although studies of additional populations should
be examined to test the generalizability of this claim.
The present findings raise the question of why no context effects were found given that
(1) widespread work in cognitive psychology suggests that situational features impact human
reasoning--even when such features are irrelevant to successfully solving the problems (Chi et al.
1981) and (2) prior work in genetics reasoning has found such effects (Shea et al. 2015). Several
explanations are possible that could guide future work in this area.
The findings of this study suggest that very well-structured and constrained genetic
problem formats might facilitate the recruitment of algorithmic problem-solving scripts (cf.
Smith 1983), whereas more ill-structured problems (like those posed by Shea et al. 2015) may
require deeper consideration of what the problem is about (e.g., deep structure), greater scrutiny
of the situational features, and subsequent activation of a wider array of knowledge elements and
problem-solving strategies. While such algorithmic problem solving may not advance a
researcher's goal of ascertaining deep knowledge of genetics or other fields, it is nevertheless a
commonly used method to solve widely employed domain-specific problems. Given the goal of
evaluating the extent to which situational features impact problem solving, and the commonality
of problems used in this study, it is worthwhile to know whether even algorithmic genetics
problems are sensitive to feature-specific variation.
The transmission genetics problems that were posed had a consistent linguistic structure
and constrained range of (forced-choice) answer options. It is possible that recognition of, or
familiarity with, the type of problem and activation of a known problem-solving script was the
key feature of the participants’ problem-solving strategy. Thus, familiarity with the problem

73
type could have driven the problem-solving procedure, thereby minimizing the impact of
situational features on performance. This idea is supported by studies in mathematics (eg.
Hinsley, Hayes & Simon 1977; Silver 1979) and genetics (Collins 1986; Krajcik, Simmons &
Lunetta 1988; Slack & Stewart 1990) which have found that low difficulty and/or familiar
problem types quickly trigger an appropriate problem-solving strategy, often before the problem
is fully read. Further, Chi et. al (1981), Nehm and Ridgway (2011) and, in genetics, Smith
(1992), have found that experts categorize problems according to the methods or concepts
required to solve the problem, whereas novices identify problems by their surface details. The
problems employed were familiar to this high-performing university sample, who had received
genetics instruction during the semester and in secondary school. A follow-up to this study could
measure the magnitude of student familiarity with different genetics problem types and examine
the association of this variable with student problem-solving success and situational impacts. As
familiarity with problem type decreases, situational effects might increase. This prediction would
be in line with Clough & Driver’s (1986) and Ware and Gelman’s (2014) studies of inheritance,
and Opfer et al’s (2012) study of natural selection. Indeed, familiarity with problem types clearly
plays some role in the problem-solving process, as indicated by greater performance of the
university students (who had been explicitly taught transmission genetics in both secondary
school and university and hence had more opportunity to become familiar with these types of
problems).
The role of assessment item format on the measurement of domain-specific concepts in
biology is not well understood (Nehm & Schonfeld 2008). It is worth noting that Shea, Duncan,
and Stephenson’s (2015) and Kargbo et al.’s (1980) studies documenting situational effects in
genetics, and Nehm and colleagues’ work documenting situational effects in evolution, both
employed open-ended tasks. It is possible that task format is contributing to present inferences
about situational effects on biological reasoning. Multiple choice questions and answer options,
like the ones used in the current study, may limit the range of cognitive resources elicited and
problem solving strategies employed. However, Ware and Gelman (2014) used a forced-choice
design, and uncovered context effects. An important aspect of their study was that it included
misconception distractors, which makes the design more similar to the open-ended prompts of
Kargbo et al. (1980). More detailed qualitative studies of problem solving strategies across a
greater diversity of genetics problem types and formats (e.g., multiple choice vs. constructed
response; arguments vs. explanations; normative vs. misconception distractors) are clearly in
order. Overall, while the present study design cannot reveal the cause(s) of these findings
showing an absence of situational effects in transmission genetics performance, it clearly
indicates that situational features will not impact all types of genetics problems (Shea et al.
2015).
4.5.2 Impact of problem type on item difficulty
Although this study explored the general topic of Mendelian transmission genetics,
participants were presented with several different inheritance problems (see Table 4.2). The
results indicated that the type of problem impacted item difficulty to a greater extent than
situational features (e.g., Figures 4.2 and 4.3). Prior work has suggested that different inheritance
problems elicit different cognitive demands. For example, Collins & Stewart (1989) considered
incomplete dominance problems to be less demanding than simple dominance problems.
Incomplete dominance features a 1:1 mapping of each genotype to phenotype, whereas in simple

74
dominance both homozygous dominant and heterozygous genotypes are mapped to the dominant
phenotype, which can be confusing for novice learners. Likewise, cause-to-effect problems have
been considered less demanding than effect-to-cause problems (Stewart 1988). Cause-to-effect
problems require 1:1 mapping of the genotype to phenotype whereas effect to cause problems
require considering more than one possible genotypic antecedent for a given phenotypic effect.
Contrary to prior work, this university sample found incomplete dominance problems to
be the most difficult and the effect-to-cause simple dominance problems to be the easiest. One
possible explanation may lie in students’ familiarity with the problem types and subsequent
recognition and activation of known problem-solving scripts. Despite greater putative cognitive
complexity, it is conventional for simple dominance problems to be introduced first by
instructors (and in textbooks) because they illustrate the traditional Mendelian concept of
dominance. Incomplete dominance problems are typically taught later and treated as a more
advanced variation on the basic rule. Simple dominance problems are also more widely taught in
U.S. secondary schools than incomplete dominance problems, so familiarity may once again
partially explain these findings. Familiarity may also afford a perception of this problem type as
“easier” and students may be more committed to persist until an acceptable answer is reached.
Persistence and checking answers were traits identified in expert problem solvers (Collins 1986,
Smith & Good 1984).
Another interesting pattern notes was that items with the homozygous parental generation
provided were more difficult than those with the heterozygous parental generation (irrespective
of dominant-recessive or incomplete dominance). This seems to be contradictory, since problems
with a given purebred homozygous parental generation are expected to be less difficult. The first
filial generation is uniform, the Punnett square is quite simple, and the law of dominance is easy
to understand. In contrast, a problem with a given heterozygous parental generation (which is the
same as asking for an F2 generation for homozygous parents) seems to be more challenging.
One explanation is that teachers could have spent more time and effort on this kind of
problem. In particular, because the idea of segregation - which is so important in all genetics
contexts and is often difficult for students to understand (Browning & Lehman 1988; Moll &
Allen 1987; Stewart & Dale 1989; Tolman 1982) - becomes very obvious in the characteristic
phenotypic pattern. This may lead to students having more experience with this kind of problem
to anticipate a “typical mixed phenotype pattern” (e.g., 3:1 or 1:2:1). This might impact success
with other problem types. Thus, one explanation for this unexpected finding may relate to
instructional focus and consequent problem perception. Further research is clearly necessary in
order to confirm such a speculation.
4.5.3 Interaction of demographic factors and performance
Finally, the present study found no significant influence of gender or ethnicity on
Mendelian problem solving performance. Notably, these findings differ from other American
studies documenting a male advantage in biology at the undergraduate level (Eddy et al. 2014;
Stanger-Hall 2012; Wright et al. 2016), but are similar to Dogru-Atay and Tekkaya’s (2002)
study of middle schoolers, which also showed no gender advantage on multiple choice
inheritance items, and several other studies finding no gender bias (Dimitrov 1999; Huppert et al.
2002; Lauer et al. 2013; Shepardson & Pizzini 1994; Willoughby & Metz 2009). While few
studies have examined racial or ethnic differences in biology achievement, those that have

75
(Creech & Sweeder 2012; Dimitrov 1999) found no impact, which is in alignment with the
findings herein.
In contrast to the lack of gender and ethnicity effects, significant (but small to moderate)
correlations between participants’ performance, number of completed biology courses, and
biology course marks were found. These findings provide some convergent validity evidence for
the assessment items used.
4.6 Limitations and further research
The present findings should be viewed in light of several limitations. Though it does not
impact statistical tests used for group comparisons, the number of items representing each
independent variable group (taxon, real or fictitious) and Mendelian problem type (cf. Table 4.2)
was not balanced. It seemed impossible to generate items representing a fictitious human being
in order to balance items featuring fictitious animals or plants. Implementing fictitious taxa in
items remains an interesting option for future studies as it allows one to control for potential
effects of participant familiarity with taxa or traits (cf. Opfer et al. 2012).
Although large samples (> 400 participants) and many items (81) were used, significant
differences were not found in certain cases that one might have expected. First, there seem to be
no differences in students’ performances between male and female students or ethnic groups.
Second, no context effects were detected. This lack of statistically significant differences does
not guarantee that there are no such differences, as the power of a statistical test is in part reliant
on employing a sample of adequate size to detect even small effect sizes. To get an impression
about the sensitivity of the statistical tests used, a supplemental power analyses was performed
using G*Power (Faul, Erdfelder, Lang & Buchner 2007). To calculate the required effect size
necessary to detect an effect with this sample the following constraints were used: level of
significance α = .05 (a typical cut-off value in educational research), test power (1-β) = 0.8
(following Cohen 1988), and the particular sample size and numbers of groups. For this
university sample, statistical tests would have detected differences between male and female
students with an effect size higher than f ≥ 0.133 (= d ≥ 0.267) and between ethnic groups with
an effect size of f ≥ 0.164 (= d ≥ 0.330). Both effect sizes are considered small effects (Cohen
1988). Therefore, there might be differences in performance within these groups, but one can
assume that the effects will be small at most. To further reduce the possibility of failing to detect
a small effect, additional research is required with much larger groups of participants (to increase
statistical power). Focusing on item feature effects for this sample, the test was sensitive for
effect sizes higher than d ≥ 0.600 differentiating between items with real or fictitious organisms
or for effect sizes higher than d ≥ 0.629 between items with plants or animals. Both effect sizes
are typically interpreted as medium. Thus there might be situational feature effects with small to
lower-medium effect size.
The limitation of statistical power should be viewed in light of two considerations. First,
the effect sizes of the differences found and, second, the data from descriptive statistics. If, for
example, one compares dominant-recessive items with given homozygous or heterozygous
parental generation (DR homo vs. DR hetero; cf. Table 4.2) one finds a very large effect (d =
1.572). This is notable because from a theoretical perspective the two problems seem to be very
similar. One might interpret this to suggest that even small changes in items can have a strong
impact on item difficulty. This circumstance may hold true for item feature effects, too. Thus,
one could reason that a change in item features would cause medium effects at minimum and

76
would consequently be sensed by the tests used; still no significant differences for item features
were detected. Descriptive data reported in the box plots (Figures 4.2, 4.4) support this
interpretation. The overlap in item difficulties for item groups with very different situational
features is very large and remains so even when disaggregated by problem type. This might be
interpreted as a (non-inferential statistical) hint that there are no such item feature effects even
though the test is not sensitive for small effects. To further clarify whether such a small effect of
item features might exist, further research with larger number of items would be beneficial, and
larger participant samples as well.
Although a major goal of educational research is the generalizations of findings, such
generalization is often difficult or impossible in a single study. Indeed, the limits of
generalizability are almost always a concern in empirical research. Even though there is have
strong evidence to support the claim that the types of Mendelian inheritance problems studied are
representative of common genetics problems, strictly speaking, the findings herein are limited to
these five problems. One can assume that they will be valid for other problems in the context of
Mendelian inheritance in which one has to apply a particular heuristic (e.g., problems on
independent assortment) and in comparable participant samples.
Since the research focus was on item function and associated item difficulties rather than
describing a population of subjects, a type of quota sampling was used to obtain participants.
Hence conclusions about subjects cannot claim global generalizability. Nevertheless, one can
assume that these findings will be valid for populations representing similar genetics problem
solving experience and similar cultural contexts.
All in all, these findings would be stronger with a larger sets of items per category. The
five types of Mendelian inheritance problems (cf. Table 4.2) that were developed could serve as
blueprints for the development of larger item sets with a greater diversity of taxa. Moreover, the
item design and situational features could be expanded to cover a greater array of genetics
problems to determine if the findings are restricted to particular types of problems. The addition
of constructed response items to complement the forced-choice items could help elucidate a
possible interaction between context effects and item format. Further investigation is also
needed to understand which kinds of genetics problems students solve heuristically. One might
assume that there may be a continuum from problems which can be solved heuristically (like
those used in this study) to items that require a deeper application of content knowledge.
4.7 References (Chapter 4)
Adams, R., Wu, M., Macaskill, G., Haldane, S. A., & Sun, X. X. (2016). ConQuest [Computer
software]. Melbourne: Australian Council for Educational Research.
Allchin, D. (2005). The dilemma of dominance. Biology and Philosophy, 20(2), 427-451.
Bond, T. G., & Fox, C. M. (2007). Applying the Rasch model: Fundamental measurement in the
human sciences (2nd ed.). Mahwah, NJ: Lawrence Erlbaum Associates.
Boone, W. J., Staver, J. R., & Yale, M. S. (2014). Rasch analysis in the human sciences.
Dordrecht: Springer.
77
Bowling, B. V., Acra, E. E., Wang L., Myers, M. F., Dean, G. E., Markle, G. C., Moskalik, C.
L., & Heuther, C. A. (2008). Development and evaluation of a genetics literacy assessment
instrument for undergraduates. Genetics. 178(1), 15-22.
Browning, M. E., & Lehman, J. D. (1988). Identification of student misconceptions in genetics
problem solving via computer program. Journal of Research in Science Teaching, 25(9), 747-
761.
Castéra, J., & Clément, P. (2014). Teachers’ conceptions about the genetic determinism of
human behaviour: A survey in 23 countries. Science & Education, 23(2), 417-443.
Castéra, J., Clément, P., Abrougui, M., Nisiforou, O., Valanides, N., Turcinaviciene, J., ... &
Carvalho, G. (2008). Genetic Determinism in School Textbooks: A Comparative Study
Conducted among Sixteen Countries. Science Education International, 19(2), 163-184
Cavallo, A. M. (1994). Do females learn biological topics by rote more than males?. The
American Biology Teacher, 56(6), 348-352.
Chi, M.T.H., Feltovich, P.J., & Glaser, R. (1981). Categorization and representation of physics
problems by experts and novices. Cognitive Science, 5(2), 121–152.
Clough, E.E., & Driver, R. (1986). A study of consistency in the use of students’ conceptual
frameworks across different task contexts. Science Education, 70, 473–496.
Cohen, J. (1988). Statistical power analysis for the behavioral science. New York: Erlbaum.
College Board. (2015). AP Biology Course and Exam Description. https://secure-
media.collegeboard.org/digitalServices/pdf/ap/ap-biology-course-and-exam-description.pdf.
Accessed 2 January 2016.
College Board. (2016). The SAT Subject Tests Student Guide.
https://collegereadiness.collegeboard.org/pdf/sat-subject-tests-student-guide.pdf. Accessed 14
May 2017.
Collins, A. (1986). Strategic knowledge required for desired performance in solving
transmission genetics problems. (Unpublished doctoral dissertation). University of Wisconsin-
Madison, WI.
Collins, A., & Stewart, J. H. (1989). The knowledge structure of Mendelian genetics. The
American Biology Teacher, 51(3), 143-149.
Corbett, A., Kauffman, L., Maclaren, B., Wagner, A., & Jones, E. (2010). A Cognitive Tutor for
genetics problem solving: Learning gains and student modeling. Journal of Educational
Computing Research, 42(2), 219-239.

78
Couch, B. A., Wood, W. B., & Knight, J. K. (2015). The Molecular Biology Capstone
Assessment: a concept assessment for upper-division molecular biology students. CBE-Life
Sciences Education, 14(1), ar10.
Creech, L. R., & Sweeder, R. D. (2012). Analysis of student performance in large-enrollment life
science courses. CBE-Life Sciences Education, 11(4), 386-391.
Dimitrov, D. M. (1999). Gender differences in science achievement: Differential effect of ability,
response format, and strands of learning outcomes. School Science and Mathematics, 99(8), 445-
450.
Dogru-Atay, P., & Tekkaya, C. (2008). Promoting participants' learning in genetics with the
learning cycle. The Journal of Experimental Education, 76(3), 259-280.
Dougherty, M. J., Pleasants, C., Solow, L., Wong, A., & Zhang, H. (2011). A comprehensive
analysis of high school genetics standards: are states keeping pace with modern genetics?. CBE-
Life Sciences Education, 10(3), 318-327.
Duncan, R. G., Rogat, A. D., & Yarden, A. (2009). A learning progression for deepening
participants' understandings of modern genetics across the 5th–10th grades. Journal of Research
in Science Teaching, 46(6), 655–674.
Eddy, S. L., & Brownell, S. E. (2016). Beneath the numbers: A review of gender disparities in
undergraduate education across science, technology, engineering, and math disciplines. Physical
Review Physics Education Research, 12(2), 020106.
Eddy, S. L., Brownell, S. E., & Wenderoth, M. P. (2014). Gender gaps in achievement and
participation in multiple introductory biology classrooms. CBE-Life Sciences Education, 13(3),
478-492.
Elrod, S. (2007). Genetics Concept Inventory.
http://bioliteracy.colorado.edu/Readings/papersSubmittedPDF/Elrod.pdf. Accessed 6 March
2015.
ETS. (2015). The Praxis Study Companion- Biology: Content Knowledge.
https://www.ets.org/s/praxis/pdf/5235.pdf. Accessed 2 January 2016.
Faul, F., Erdfelder, E., Lang, A.-G., & Buchner, A. (2007). G*Power 3: A flexible statistical
power analysis program for the social, behavioral, and biomedical sciences. Behavior Research
Methods, 39, 175-191.
Federer, M. R., Nehm, R. H., & Pearl, D. K. (2016). Examining gender differences in written
assessment tasks in biology: A case study of evolutionary explanations. CBE-Life Sciences
Education, 15(1), ar2.

79
Franke, G., & Bogner, F. X. (2011). Conceptual change in participants’ molecular biology
education: tilting at windmills?. The Journal of Educational Research, 104(1), 7-18.
Freidenreich, H. B., Duncan, R. G., & Shea, N. (2011). Exploring middle school students’
understanding of three conceptual models in genetics. International Journal of Science
Education, 33(17), 2323-2349.
Gericke, N. M., Hagberg, M., dos Santos, V. C., Joaquim, L. M., & El-Hani, C. N. (2014).
Conceptual variation or incoherence? Textbook discourse on genes in six countries. Science &
Education, 23(2), 381-416.
Gipson, M. H., Abraham, M. R., & Renner, J. W. (1989). Relationships between formal‐
operational thought and conceptual difficulties in genetics problem solving. Journal of Research
in Science Teaching, 26(9), 811-821.
Ha, M., & Nehm, R. H. (2014). Darwin’s difficulties and students’ struggles with trait loss:
cognitive-historical parallelisms in evolutionary explanation. Science & Education, 23(5), 1051-
1074.
Hartig, J., & Frey, A. (2013). Sind Modelle der Item-Response-Theorie (IRT) das „Mittel der
Wahl“ für die Modellierung von Kompetenzen? [Are models of IRT the “choice” for the
modeling of competencies?] Zeitschrift für Erziehungswissenschaft [Journal of Educational
Science], 16(1), 47-51.
Hickey, D. T., Wolfe, E. W., & Kindfield, A. C. (2000). Assessing learning in a technology-
supported genetics environment: Evidential and systemic validity issues. Educational
Assessment, 6(3), 155-196.
Hinsley, D. A., Hayes, J. R., & Simon, H. A. (1977). From words to equations: Meaning and
representation in algebra word problems. Cognitive Processes in Comprehension, 329.
Hott, A. M., Huether, C. A., McInerney, J. D., Christianson, C., Fowler, R., Bender, H., Jenkins,
J., Wysocki, A., Markle, G. & Karp, R. (2002). Genetics content in introductory biology courses
for non-science majors: Theory and practice. BioScience, 52(11), 1024-1035.
Huppert, J., Lomask, S. M., & Lazarowitz, R. (2002). Computer simulations in the high school:
Students' cognitive stages, science process skills and academic achievement in microbiology.
International Journal of Science Education, 24(8), 803-821.
International Baccalaureate Organization. (2014). Diploma Programme Biology Guide. Cardiff,
Wales: Author.
Jamieson, A., & Radick, G. (2013). Putting Mendel in his place: how curriculum reform in
genetics and counterfactual history of science can work together. In The philosophy of biology
(pp. 577-595). Springer Netherlands.

80
Jamieson, A., & Radick, G. (2017). Genetic determinism in the genetics curriculum. Science &
Education, 26(10), 1261-1290.
Kahle, J. B., and Meece, J. (1994). Research on gender issues in the classroom. In D.E. Gabel
(Ed.). Handbook of research on science teaching and learning (pp. 542-557). New York: Simon
& Schuster Macmillan.
Kampourakis, K. (2015) Distorting the history of evolutionary thought in conceptual
development research. Cognitive Science 39(4), 833-837.
Kampourakis, K. (2017). Making sense of genes. Cambridge: Cambridge University Press.
Kampourakis, K. and Nehm, R.H. (2014). History and philosophy of science and student
explanations and conceptions. In Matthews, M. (Ed.) Handbook of the History and Philosophy of
Science in Science and Mathematics Teaching (pp. 377-400). Springer.
Kargbo, D. B., Hobbs, E. D., & Erickson, G. L. (1980). Children's beliefs about inherited
characteristics. Journal of Biological Education, 14(2), 137-146.
Kinnear, J. (1983). Identification of misconceptions in genetics and the use of computer
simulations in their correction. In H. Helms & J. Novak (Eds.) Proceedings of the International
Seminar on Misconceptions in Science and Mathematics (pp. 84–92). Ithaca, NY: Cornell
University
Klymkowsky, M. W., Underwood, S., & Garvin-Doxas, K. (2010). The Biological Concepts
Instrument (BCI), a diagnostic tool to reveal student thinking. doi: arXiv:1012.4501v1.
Knippels, M. C. P., Waarlo, A. J., & Boersma, K. T. (2005). Design criteria for learning and
teaching genetics. Journal of Biological Education, 39(3), 108-112.
Krajcik, J. S., Simmons, P. E., & Lunetta, V. N. (1988). A research strategy for the dynamic
study of students' concepts and problem solving strategies using science software. Journal of
Research in Science Teaching, 25(2), 147-155.
Kruskal, W. H. & Wallis, W. A. (1952). Use of ranks in one-criterion variance analysis. Journal
of the American Statistical Association. 47(260), 583–621.
Lauer, S., Momsen, J., Offerdahl, E., Kryjevskaia, M., Christensen, W., & Montplaisir, L.
(2013). Stereotyped: investigating gender in introductory science courses. CBE-Life Sciences
Education, 12(1), 30-38.
Lee, O., & Luykx, A. (2007). Science education and student diversity: Race/ethnicity, language,
culture, and socioeconomic status. In S. K. Abell & N. G. Lederman (Eds.), Handbook of
research on science education,1, (pp. 171-197). New York: Routledge.

81
Lewis, J., & Kattmann, U. (2004). Traits, genes, particles and information: re‐visiting students’
understandings of genetics. International Journal of Science Education, 26(2), 195-206.
Linn, M. C., & Hyde, J. S. (1989). Gender, mathematics, and science. Educational Researcher,
18(8), 17-27.
Mann, H. B. & Whitney, D. R. (1947). On a test of whether one of two random variables is
stochastically larger than the other. Annals of Mathematical Statistics, 18(1), 50–60.
Mayer, R. (2013). Problem solving. In D. Reisberg (Ed.), Oxford Handbook of Cognitive
Psychology (pp. 769-778). New York: Oxford.
McElhinny, T. L., Dougherty, M. J., Bowling, B. V., & Libarkin, J. C. (2014). The status of
genetics curriculum in higher education in the United States: goals and assessment. Science &
Education, 23(2), 445-464.
Moll, M. B., & Allen, R. D. (1987). Student difficulties with Mendelian genetics problems. The
American Biology Teacher, 49(4), 229-233
National Research Council. (1996). National science education standards. Washington, DC: The
National Academies Press.
National Research Council. (2012). A framework for K-12 science education: Practices,
crosscutting concepts, and core ideas. Washington, DC: The National Academies Press.
Nehm, R. H., Beggrow, E. P., Opfer, J. E., & Ha, M. (2012). Reasoning about natural selection:
Diagnosing contextual competency using the ACORNS instrument. The American Biology
Teacher, 74(2), 92–98.
Nehm, R. H., & Ha, M. (2011). Item feature effects in evolution assessment. Journal of Research
in Science Teaching, 48(3), 237–256.
Nehm, R. H., & Reilly, L. (2007). Biology majors’ knowledge and misconceptions of natural
selection. BioScience, 57(3), 263–272.
Nehm, R. H., & Ridgway, J. (2011). What do experts and novices “see” in evolutionary
problems? Evolution Education and Outreach. 4(4), 666-679.
Nehm, R. H., & Schonfeld, I. S. (2008). Measuring knowledge of natural selection: a comparison
of the CINS, an open‐response instrument, and an oral interview. Journal of Research in Science
Teaching, 45(10), 1131-1160.
NGSS Lead States. (2013). Next generation science standards: For states, by states. Washington,
DC: The National Academies Press.
82
Opfer, J., Nehm, R. H., & Ha, M. (2012). Cognitive foundations for science assessment design:
Knowing what students know about evolution. Journal of Research in Science Teaching. 49(6),
744–777
Pearsall, N. R., Skipper, J. E. J., & Mintzes, J. J. (1997). Knowledge restructuring in the life
sciences: A longitudinal study of conceptual change in biology. Science Education, 81(2), 193-
215.
Peng, S. S., Wright, D., and Hill, S. T. (1995). Understanding racial-ethnic differences in
secondary school science and mathematics achievement (NCES 95-710). Washington, DC: U. S.
Department of Education.
Rasch, G. (1960). Probabilistic models for some intelligence and attainment tests. Copenhagen:
Nielsen & Lydiche.
Sadler, T. D. (2003). Informal reasoning regarding socioscientific issues: The influence of
morality and content knowledge. (Unpublished Doctoral Dissertation). University of South
Florida, FL.
Sadler, T. D., & Zeidler, D. L. (2005). The significance of content knowledge for informal
reasoning regarding socioscientific issues: Applying genetics knowledge to genetic engineering
issues. Science Education, 89(1), 71-93
Scantlebury, K. (2014). Gender matters. In N. K. Lederman & S. K. Abell (Eds.), Handbook of
research on science education, 2, (pp. 187-203). New York: Routledge.
Scantlebury, K., & Baker, D. (2007). Gender issues in science education: Remembering where
the difference lies. In S. K. Abell & N. G. Lederman (Eds.), Handbook of research on science
education, 1, (pp. 31-56). New York: Routledge.
Schmiemann, P., Nehm, R. H., & Tornabene, R. E. (2017). Assessment of genetics
understanding: Under what conditions do situational features have an impact on measures?
Science & Education, 26(10), 1161-1191.
Settlage, J. (1994). Conceptions of natural selection: a snapshot of the sense‐making process.
Journal of Research in Science Teaching, 31(5), 449-457.
Shea, N. A., Duncan, R. G., & Stephenson, C. (2015). A tri-part model for genetics literacy:
Exploring undergraduate student reasoning about authentic genetics dilemmas. Research in
Science Education, 45(4), 485-507.
Shepardson, D. P., & Pizzini, E. L. (1994). Gender, achievement, and perception toward science
activities. School Science and Mathematics, 94(4), 188-193.
Silver, E. A. (1979). Student perceptions of relatedness among mathematical verbal problems.
Journal for Research in Mathematics Education, 10(3), 195–210.ibo

83
Sirotnik, K., & Wellington, R. (1977). Incidence sampling: An integrated theory for matrix
sampling. Journal of Educational Measurement, 14(4), 343–399.
Simmons, P. E., & Lunetta, V. N. (1993). Problem‐solving behaviors during a genetics computer
simulation: Beyond the expert/novice dichotomy. Journal of Research in Science Teaching,
30(2), 153-173.
Slack, S. J., & Stewart, J. (1990). High school participants' problem‐solving performance on
realistic genetics problems. Journal of Research in Science Teaching, 27(1), 55-67.
Smith, M. K., Wood, W. B., & Knight, J. K. (2008). The genetics concept assessment: a new
concept inventory for gauging student understanding of genetics. CBE-Life Sciences Education,
7(4), 422-430.
Smith, M. U. (1983). A comparative analysis of the performance of experts and novices while
solving selected classical genetics problems. (Unpublished doctoral dissertation). Florida State
University, FL.
Smith, M. U. (1992). Expertise and the organization of knowledge: Unexpected differences
among genetic counselors, faculty, and students on problem categorization tasks. Journal of
Research in Science Teaching, 29(2), 179-205.
Smith, M. U., & Gericke, N. M. (2015). Mendel in the modern classroom. Science & Education,
24(1-2), 151-172.
Smith, M. U., & Good, R. (1984). Problem solving and classical genetics: Successful versus
unsuccessful performance. Journal of Research in Science Teaching, 21(9), 895-912.
Soyibo, K. (1999). Gender differences in Caribbean participants' performance on a test of errors
in biological labelling. Research in Science & Technological Education, 17(1), 75-82.
Stanger-Hall, K. F. (2012). Multiple-choice exams: an obstacle for higher-level thinking in
introductory science classes. CBE-Life Sciences Education, 11(3), 294-306.
Stanley, W. B., & Brickhouse, N. W. (1994). Multiculturalism, universalism, and science
education. Science Education, 78(4), 387-398.
Stewart, J. (1983). Student problem solving in high school genetics. Science Education, 67(4),
523-540.
Stewart, J. (1988). Potential learning outcomes from solving genetics problems: A typology of
problems. Science Education, 72(2), 237-254.
84
Stewart, J., Cartier, J. L., & Passmore, P. M. (2005). Developing understanding through model-
based inquiry. In M. S. Donovan & J. D. Bransford (Eds.), How students learn (pp. 515–565).
Washington D.C: National Research Council.
Stewart, J., & Dale, M. (1989). High school students' understanding of chromosome/gene
behavior during meiosis. Science Education, 73(4), 501-521.
Todd, A. & Romine, W. L. (2016) Validation of the learning progression-based assessment of
modern genetics in a college context. International Journal of Science Education, 38(10), 1673-
1698.
Tolman, R. R. (1982). Difficulties in genetics problem solving. American Biology Teacher,
44(9), 525-27.
Tsui, C. Y., & Treagust D. (2010). Evaluating secondary students’ scientific reasoning in
genetics using a two-tier diagnostic instrument. International Journal of Science Education,
32(8), 1073–1098.
Ware, E. A., & Gelman, S. A. (2014). You get what you need: An examination of purpose‐based
inheritance reasoning in undergraduates, preschoolers, and biological experts. Cognitive Science,
38(2), 197-243.
Warm, T. A. (1989). Weighted likelihood estimation of ability in item response models.
Psychometrika, 54(3), 427-450.
Weinburgh, M. (1995). Gender differences in student attitudes toward science: A meta‐analysis
of the literature from 1970 to 1991. Journal of Research in Science Teaching, 32(4), 387-398.
Willoughby, S. D., & Metz, A. (2009). Exploring gender differences with different gain
calculations in astronomy and biology. American Journal of Physics, 77(7), 651-657.
Wright, B. D. (1984). Despair and hope for educational measurement. Contemporary Education
Review, 3(1), 281-288
Wright, B. D., & Stone, M. (1979). Best Test Design. Rasch Measurement. Chicago: MESA
Press.
Wright, C. D., Eddy, S. L., Wenderoth, M. P., Abshire, E., Blankenbiller, M., & Brownell, S. E.
(2016). Cognitive difficulty and format of exams predicts gender and socioeconomic gaps in
exam performance of students in introductory biology courses. CBE-Life Sciences Education,
15(2), ar23.
Zohar, A., & Nemet, F. (2002). Fostering participants' knowledge and argumentation skills
through dilemmas in human genetics. Journal of Research in Science Teaching, 39(1), 35–62.

85
References
Adams, R., Wu, M., Macaskill, G., Haldane, S. A., & Sun, X. X. (2016). ConQuest [Computer
software]. Melbourne: Australian Council for Educational Research.
Allchin, D. (2005). The dilemma of dominance. Biology and Philosophy, 20(2), 427-451.
American Association for the Advancement of Science (AAAS). (2011). Vision and change in
undergraduate biology education. Washington, DC. http://visionandchange.org/ Accessed 20
February 2018.
American Educational Research Association, American Psychological Association, and National
Council for Measurement in Education (AERA, APA, NCME). (2014). The Standards for
Educational and Psychological Testing. Washington, DC: Author.
Anderson, D. L., Fisher, K. M., & Norman, G. J. (2002). Development and evaluation of the
conceptual inventory of natural selection. Journal of research in science teaching, 39(10), 952-
978.
Andrews, T. M., Price, R. M., Mead, L. S., McElhinny, T. L., Thanukos, A., Perez, K. E., ... &
Lemons, P. P. (2012). Biology undergraduates’ misconceptions about genetic drift. CBE-Life
Sciences Education, 11(3), 248-259.
Andrich, D., Marais, I., & Humphry, S. (2012). Using a theorem by Andersen and the
dichotomous Rasch model to assess the presence of random guessing in multiple choice items.
Journal of educational and behavioral statistics, 37(3), 417-442.
Bahar, M., Johnstone, A. H., & Hansell, M. H. (1999). Revisiting learning difficulties in biology.
Journal of Biological Education, 33(2), 84-86.
Baker, W. P., & Lawson, A. E. (2001). Complex instructional analogies and theoretical concept
acquisition in college genetics. Science Education, 85(6), 665-683.
Banet, E., & Ayuso, E. (2000). Teaching genetics at secondary school: a strategy for teaching
about the location of inheritance information. Science Education, 84(3), 313-351.
Beggrow, E. P., & Nehm, R. H. (2012). Students’ mental models of evolutionary causation:
natural selection and genetic drift. Evolution: Education and Outreach, 5(3), 429-444.
Beurton, P. J., Falk, R., & Rheinberger, H. J. (Eds.). (2000). The concept of the gene in
development and evolution: Historical and epistemological perspectives. Cambridge University
Press.

86
Bishop, B. A., & Anderson, C. W. (1990). Student conceptions of natural selection and its role in
evolution. Journal of research in science teaching, 27(5), 415-427.
Bond, T. G., & Fox, C. M. (2007). Applying the Rasch model: fundamental measurement in the
human sciences (2nd ed.). Mahwah: Lawrence Erlbaum Associates.
Boone, W.J., Staver, J.R., & Yale, M.S. (2014). Rasch analysis in the human sciences.
Dordrecht, the Netherlands: Springer.
Bowling, B. V., Acra, E. E., Wang L., Myers, M. F., Dean, G. E., Markle, G. C., Moskalik, C.
L., & Heuther, C. A. (2008). Development and evaluation of a genetics literacy assessment
instrument for undergraduates. Genetics. 178(1), 15-22.
Browning, M. E., & Lehman, J. D. (1988). Identification of student misconceptions in genetics
problem solving via computer program. Journal of Research in Science Teaching, 25(9), 747-
761.
Burian, R. M., & Kampourakis, K. (2013). Against “Genes For”: Could an Inclusive Concept of
Genetic Material Effectively Replace Gene Concepts?. In The Philosophy of Biology (pp. 597-
628). Springer, Dordrecht.
Campbell, C. E., & Nehm, R. H. (2013). A critical analysis of assessment quality in genomics
and bioinformatics education research. CBE-Life Sciences Education, 12(3), 530-541.
Carver, R. B., Castéra, J., Gericke, N., Evangelista, N. A. M., & El-Hani, C. N. (2017). Young
adults’ belief in genetic determinism, and knowledge and attitudes towards modern genetics and
genomics: the PUGGS questionnaire. PloS one, 12(1), e0169808.
Castéra, J., & Clément, P. (2014). Teachers’ conceptions about the genetic determinism of
human behaviour: A survey in 23 countries. Science & Education, 23(2), 417-443.
Castéra, J., Clément, P., Abrougui, M., Nisiforou, O., Valanides, N., Turcinaviciene, J., ... &
Carvalho, G. (2008). Genetic Determinism in School Textbooks: A Comparative Study
Conducted among Sixteen Countries. Science Education International, 19(2), 163-184
Cavallo, A. M. (1994). Do females learn biological topics by rote more than males?. The
American Biology Teacher, 56(6), 348-352.
Cavallo, A. M. L. (1996). Meaningful learning, reasoning ability, and students' understanding
and problem solving of topics in genetics. Journal of Research in Science Teaching, 33(6), 625-
56.
Cavallo, A. M. L., & Schafer, L. E. (1994). Relationships between students' meaningful learning
orientation and their understanding of genetics topics. Journal of Research in Science Teaching,
31(4), 393-418.

87
Chi, M.T.H., Feltovich, P.J., & Glaser, R. (1981). Categorization and representation of physics
problems by experts and novices. Cognitive Science, 5(2), 121–152.
Chinnici, J., Joyce W. Yue, & Kieron M. Torres. (2004). Students as "Human Chromosomes" in
Role-Playing Mitosis & Meiosis. The American Biology Teacher, 66(1), 35-39.
Chinnici, J., Somalin Zaroh Neth, & Leah R. Sherman. (2006). Using "Chromosomal Socks" to
Demonstrate Ploidy in Mitosis & Meiosis. The American Biology Teacher, 68(2), 106-109.
Cho, H. H., Kahle, J. B., & Nordland, F. H. (1985). An investigation of high school biology
textbooks as sources of misconceptions and difficulties in genetics and some suggestions for
teaching genetics. Science Education, 69(5), 707-719.
Clough, E. E., & Driver, R. (1986). A study of consistency in the use of students' conceptual
frameworks across different task contexts. Science Education, 70(4), 473-496.
Cohen, J. (1988). Statistical power analysis for the behavioral science. New York: Erlbaum.
College Board. (2015). AP Biology Course and Exam Description. https://secure-
media.collegeboard.org/digitalServices/pdf/ap/ap-biology-course-and-exam-description.pdf.
Accessed 2 January 2016.
College Board. (2016). The SAT Subject Tests Student Guide.
https://collegereadiness.collegeboard.org/pdf/sat-subject-tests-student-guide.pdf. Accessed 14
May 2017.
Collins, A. (1986). Strategic knowledge required for desired performance in solving
transmission genetics problems. (Unpublished Doctoral dissertation, University of Wisconsin--
Madison)
Collins, A., & Stewart, J. H. (1989). The knowledge structure of Mendelian genetics. The
American Biology Teacher, 51(3), 143-149.
Corbett, A., Kauffman, L., Maclaren, B., Wagner, A., & Jones, E. (2010). A Cognitive Tutor for
genetics problem solving: Learning gains and student modeling. Journal of Educational
Computing Research, 42(2), 219-239.
Couch, B. A., Wood, W. B., & Knight, J. K. (2015). The Molecular Biology Capstone
Assessment: a concept assessment for upper-division molecular biology students. CBE-Life
Sciences Education, 14(1), ar10.
Creech, L. R., & Sweeder, R. D. (2012). Analysis of student performance in large-enrollment life
science courses. CBE-Life Sciences Education, 11(4), 386-391.

88
de Ayala, R. J. (2009). The theory and practice of item response theory. New York: The Guilford
Press
Dikmenli, M. (2010). Misconceptions of cell division held by student teachers in biology: A
drawing analysis. Scientific Research and Essays, 5(2), 235-247.
Dimitrov, D. M. (1999). Gender differences in science achievement: Differential effect of ability,
response format, and strands of learning outcomes. School science and mathematics, 99(8), 445-
450.
Dogru-Atay, P., & Tekkaya, C. (2008). Promoting participants' learning in genetics with the
learning cycle. The Journal of Experimental Education, 76(3), 259-280.
Dos Santos, V. C., Joaquim, L. M., & El-Hani, C. N. (2012). Hybrid deterministic views about
genes in biology textbooks: A key problem in genetics teaching. Science & Education, 21(4),
543-578.
Dougherty, M. J. (2009). Closing the gap: inverting the genetics curriculum to ensure an
informed public. The American Journal of Human Genetics, 85(1), 6-12.
Dougherty, M. J., Pleasants, C., Solow, L., Wong, A., & Zhang, H. (2011). A comprehensive
analysis of high school genetics standards: are states keeping pace with modern genetics?. CBE-
Life Sciences Education, 10(3), 318-327.
Duncan, R., Castro-Faix, M., & Choi, J. (2016). Informing a learning progression in genetics:
Which should be taught first, Mendelian inheritance or the central dogma of molecular biology?.
International Journal of Science & Mathematics Education, 14(3).
Duncan, R. G., Freidenreich, H. B., Chinn, C. A., & Bausch, A. (2011). Promoting middle school
students’ understandings of molecular genetics. Research in Science Education, 41(2), 147-167.
Duncan, R. G., & Reiser, B. J. (2007). Reasoning across ontologically distinct levels: Students'
understandings of molecular genetics. Journal of research in Science Teaching, 44(7), 938-959.
Duncan, R. G., Rogat, A. D., & Yarden, A. (2009). A learning progression for deepening
participants' understandings of modern genetics across the 5th–10th grades. Journal of Research
in Science Teaching, 46(6), 655–674.
Eddy, S. L., & Brownell, S. E. (2016). Beneath the numbers: A review of gender disparities in
undergraduate education across science, technology, engineering, and math disciplines. Physical
Review Physics Education Research, 12(2), 020106.
Eddy, S. L., Brownell, S. E., & Wenderoth, M. P. (2014). Gender gaps in achievement and
participation in multiple introductory biology classrooms. CBE-Life Sciences Education, 13(3),
478-492.

89
Elrod, S. (2007). Genetics Concept Inventory.
http://bioliteracy.colorado.edu/Readings/papersSubmittedPDF/Elrod.pdf. Accessed 6 March
2015.
ETS. (2015). The Praxis Study Companion- Biology: Content Knowledge.
https://www.ets.org/s/praxis/pdf/5235.pdf. Accessed 2 January 2016.
Evans, J. D. (1976). The treatment of technical vocabulary in textbooks of biology. Journal of
Biological Education, 10(1), 19-30.
Faul, F., Erdfelder, E., Lang, A.-G., & Buchner, A. (2007). G*Power 3: A flexible statistical
power analysis program for the social, behavioral, and biomedical sciences. Behavior Research
Methods, 39, 175-191.
Federer, M. R., Nehm, R. H., Opfer, J. E., & Pearl, D. (2015). Using a constructed-response
instrument to explore the effects of item position and item features on the assessment of
students’ written scientific explanations. Research in Science Education, 45(4), 527-553.
Federer, M. R., Nehm, R. H., & Pearl, D. K. (2016). Examining gender differences in written
assessment tasks in biology: A case study of evolutionary explanations. CBE-Life Sciences
Education, 15(1), ar2.
Finkel, E. A. (1996). Making sense of genetics: Students' knowledge use during problem solving
in a high school genetics class. Journal of Research in Science Teaching: The Official Journal of
the National Association for Research in Science Teaching, 33(4), 345-368.
Franke, G., & Bogner, F. X. (2011). Conceptual change in participants’ molecular biology
education: tilting at windmills?. The Journal of Educational Research, 104(1), 7-18.
Freidenreich, H. B., Duncan, R. G., & Shea, N. (2011). Exploring middle school students’
understanding of three conceptual models in genetics. International Journal of Science
Education, 33(17), 2323-2349.
Furtak, E., Morrison, D., & Kroog, H. (2014). Investigating the link between learning
progressions and classroom assessment. Science Education, 98(4), 640-673.
Gericke, N. M., & Hagberg, M. (2007). Definition of historical models of gene function and their
relation to students’ understanding of genetics. Science & Education, 16(7-8), 849-881.
Gericke, N. M., Hagberg, M., dos Santos, V. C., Joaquim, L. M., & El-Hani, C. N. (2014).
Conceptual variation or incoherence? Textbook discourse on genes in six countries. Science &
Education, 23(2), 381-416.
Gericke, N.M., & Wahlberg, S. (2013). Clusters of concepts in molecular genetics: a study of
Swedish upper secondary science students understanding. Journal of Biological Education,
47(2), 73-83.

90
Gershon, R. 1992. Guessing and Measurement. Rasch Measurement Transactions, 6:2 p. 209-
10.
Gipson, M. H., Abraham, M. R., & Renner, J. W. (1989). Relationships between formal‐
operational thought and conceptual difficulties in genetics problem solving. Journal of Research
in Science Teaching, 26(9), 811-821.
Glynn, S. M., Brickman, P., Armstrong, N., & Taasoobshirazi, G. (2011). Science motivation
questionnaire II: Validation with science majors and nonscience majors. Journal of research in
science teaching, 48(10), 1159-1176.
Ha, M., & Nehm, R. H. (2014). Darwin’s difficulties and students’ struggles with trait loss:
cognitive-historical parallelisms in evolutionary explanation. Science & Education, 23(5), 1051-
1074.
Ha, M., Nehm, R. H., Urban-Lurain, M., & Merrill, J. E. (2011). Applying computerized-scoring
models of written biological explanations across courses and colleges: prospects and limitations.
CBE—Life Sciences Education, 10(4), 379-393.
Hackling, M. W. (1990). The development of expertise in genetic pedigree problem solving
(unpublished Doctoral dissertation, Murdoch University).
Hackling, M. W., & Lawrence, J. A. (1988). Expert and novice solutions of genetic pedigree
problems. Journal of Research in Science Teaching, 25(7), 531-546.
Hackling, M. W., & Treagust, D. (1984). Research data necessary for meaningful review of
grade ten high school genetics curricula. Journal of Research in Science Teaching, 21(2), 197-
209.
Hafner, R., & Stewart, J. (1995). Revising explanatory models to accommodate anomalous
genetic phenomena: Problem solving in the “context of discovery”. Science Education, 79(2),
111-146.
Hartig, J., & Frey, A. (2013). Sind Modelle der Item-Response-Theorie (IRT) das „Mittel der
Wahl“ für die Modellierung von Kompetenzen? [Are models of IRT the “choice” for the
modeling of competencies?] Zeitschrift für Erziehungswissenschaft [Journal of Educational
Science], 16(1), 47-51.
Hickey, D. T., Wolfe, E. W., & Kindfield, A. C. (2000). Assessing learning in a technology-
supported genetics environment: Evidential and systemic validity issues. Educational
Assessment, 6(3), 155-196.
Hildebrand, A. C. (1991). Pictorial representations and understanding genetics: An expert/novice
study of meiosis knowledge. (unpublished Doctoral dissertation, University of California,
Berkeley)

91
Hinsley, D. A., Hayes, J. R., & Simon, H. A. (1977). From words to equations: Meaning and
representation in algebra word problems. Cognitive Processes in Comprehension, 329.
Hmelo-Silver, C. E., Duncan, R. G., & Chinn, C. A. (2007). Scaffolding and achievement in
problem-based and inquiry learning: a response to Kirschner, Sweller, and. Educational
psychologist, 42(2), 99-107.
Horwitz, P., Schwartz, J., Kindfield, A. C., Yessis, L. M., Hickey, D. T., Heidenberg, A. J., &
Wolfe, E. W. (1998). Implementation and evaluation of the GenScope learning environment:
Issues, solutions, and results. In Guzdial, M., Kolodner, J., & Bruckman, A. (Eds.) (1998).
Proceedings of the Third International Conference of the Learning Sciences. Charlottesville,
VA: Association for the Advancement of Computers in Education.
Hott, A. M., Huether, C. A., McInerney, J. D., Christianson, C., Fowler, R., Bender, H., Jenkins,
J., Wysocki, A., Markle, G. & Karp, R. (2002). Genetics content in introductory biology courses
for non-science majors: Theory and practice. BioScience, 52(11), 1024-1035.
Huppert, J., Lomask, S. M., & Lazarowitz, R. (2002). Computer simulations in the high school:
students’ cognitive stages, science process skills and academic achievement in microbiology.
International Journal of Science Education, 24(8), 803–821.
International Baccalaureate Organization. (2014). Diploma Programme Biology Guide. Cardiff,
Wales: Author.
Jamieson, A., & Radick, G. (2013). Putting Mendel in his place: how curriculum reform in
genetics and counterfactual history of science can work together. In The philosophy of biology
(pp. 577-595). Springer Netherlands.
Jamieson, A., & Radick, G. (2017). Genetic determinism in the genetics curriculum. Science &
Education, 26(10), 1261-1290.
Jiménez-Aleixandre, M. P. (2014). Determinism and underdetermination in genetics:
Implications for students’ engagement in argumentation and epistemic practices. Science &
Education, 23(2), 465-484.
Jimenez-Aleixandre, M. P., Rodriguez, A. B., & Duschl, R. A. (2000). " Doing the lesson" or
"doing science": Argument in high school genetics. Science Education, 84(6), 757-792.
Jungck, J. R., & Calley, J. (1988). Genetics construction kit. Quality Undergraduate Education
Simulation Tools. CD-ROM.
Kahle, J. B., and Meece, J. (1994). Research on gender issues in the classroom. In D.E. Gabel
(Ed.). Handbook of research on science teaching and learning (pp. 542-557). New York: Simon
& Schuster Macmillan.

92
Kalinowski, S. T., Leonard, M. J., & Taper, M. L. (2016). Development and validation of the
conceptual assessment of natural selection (CANS). CBE-Life Sciences Education, 15(4), ar64.
Kampourakis, K. (2015) Distorting the history of evolutionary thought in conceptual
development research. Cognitive Science 39(4), 833-837.
Kampourakis, K. (2017). Making sense of genes. Cambridge: Cambridge University Press.
Kampourakis, K. and Nehm, R.H. (2014). History and philosophy of science and student
explanations and conceptions. In Matthews, M. (Ed.) Handbook of the History and Philosophy of
Science in Science and Mathematics Teaching (pp. 377-400). Springer.
Kampourakis, K., Reydon, T. A., Patrinos, G. P., & Strasser, B. J. (2014). Genetics and
Society—Educating Scientifically Literate Citizens: Introduction to the Thematic Issue. Science
& Education, 23(2), 251-258.
Kargbo, D. B., Hobbs, E. D., & Erickson, G. L. (1980). Children's beliefs about inherited
characteristics. Journal of Biological Education, 14(2), 137-146.
Kindfield, A. C. (1991). Confusing chromosome number and structure: a common student error.
Journal of Biological Education, 25(3), 193-200.
Kindfield, A. C. (1994). Understanding a basic biological process: Expert and novice models of
meiosis. Science Education, 78(3), 255-283.
Kinnear, J.F. (1983). Identification of misconceptions in genetics and the use of computer
simulations in their correction. In Proceedings of the international seminar on misconceptions in
science and mathematics (pp. 84-92). Ithaca, NY: Cornell University.
Kinnear, J. F. (1986). Computer Simulation & Problem Solving in Genetics. Paper presented at
the annual meeting of the American Educational Research Association, San Francisco, CA. April
16-20.
Kinnear, J. F., & Simmons, P. E. (1990). " Expert" and" novice" subjects’ approaches to genetic
problem solving in a computer-based setting. Research in Science Education, 20(1), 171-180.
Knippels, M. C. P., Waarlo, A. J., & Boersma, K. T. (2005). Design criteria for learning and
teaching genetics. Journal of Biological Education, 39(3), 108-112.
Krajcik, J. S., Simmons, P. E., & Lunetta, V. N. (1988). A research strategy for the dynamic
study of students' concepts and problem solving strategies using science software. Journal of
Research in Science Teaching, 25(2), 147-155.
Krauskopf, S. (1999). Doing the Meiosis Shuffle. The American Biology Teacher, 61(1), 60-61.

93
Klymkowsky, M. W., Underwood, S., & Garvin-Doxas, K. (2010). The Biological Concepts
Instrument (BCI), a diagnostic tool to reveal student thinking. doi: arXiv:1012.4501v1.
Kruskal, W. H. & Wallis, W. A. (1952). Use of ranks in one-criterion variance analysis. Journal
of the American Statistical Association. 47(260), 583–621.
Lauer, S., Momsen, J., Offerdahl, E., Kryjevskaia, M., Christensen, W., & Montplaisir, L.
(2013). Stereotyped: investigating gender in introductory science courses. CBE-Life Sciences
Education, 12(1), 30-38.
Lawson, A. E., & Renner, J. W. (1975). Relationships of science subject matter and
developmental levels of learners. Journal of Research in Science Teaching, 12(4), 347-358.
Leary, L. F., & Dorans, N. J. (1985). Implications for altering the context in which test items
appear: A historical perspective on an immediate concern. Review of Educational research,
55(3), 387-413.
Lee, O., & Luykx, A. (2007). Science education and student diversity: Race/ethnicity, language,
culture, and socioeconomic status. In S. K. Abell & N. G. Lederman (Eds.), Handbook of
research on science education,1, (pp. 171-197). New York: Routledge.
Lewis, J., Leach, J., & Wood-Robinson, C. (2000). Chromosomes: the missing link—young
people's understanding of mitosis, meiosis, and fertilisation. Journal of Biological Education,
34(4), 189-199.
Lewis, J, & Kattmann, U. (2004). Traits, genes, particles and information: re‐visiting students’
understandings of genetics. International Journal of Science Education, 26(2), 195-206.
Linacre, J. M. (1994). Sample Size and Item Calibration Stability. Rasch Measurement
Transactions, 7(4) p.328
Linacre, J. M. (2017a). Winsteps® Rasch measurement computer program. Beaverton, Oregon:
Winsteps.com
Linacre, J. M. (2017b). Winsteps® Rasch measurement computer program User's Guide.
Beaverton, Oregon: Winsteps.com
Linn, M. C., & Hyde, J. S. (1989). Gender, mathematics, and science. Educational Researcher,
18(8), 17-27.
Longden, B. (1982). Genetics—are there inherent learning difficulties?. Journal of Biological
Education, 16(2), 135-140.
MacNicol, K. (1956). Effects of varying order of item difficulty in an unspeeded verbal test.
Unpublished manuscript, Educational Testing Service, Princeton, NJ.

94
Mann, H. B. & Whitney, D. R. (1947). On a test of whether one of two random variables is
stochastically larger than the other. Annals of Mathematical Statistics, 18(1), 50–60.
Marbach-Ad, G. (2001). Attempting to break the code in student comprehension of genetic
concepts. Journal of Biological Education, 35(4), 183-189.
Marbach-Ad, G., & Stavy, R. (2000). Students' cellular and molecular explanations of genetic
phenomena. Journal of Biological Education, 34(4), 200-205.
Masel, J. (2012). Rethinking Hardy–Weinberg and genetic drift in undergraduate biology.
BioEssays, 34(8), 701-710.
Mayer, R. (2013). Problem solving. In D. Reisberg (Ed.), Oxford Handbook of Cognitive
Psychology (pp. 769-778). New York: Oxford.
McElhinny, T. L., Dougherty, M. J., Bowling, B. V., & Libarkin, J. C. (2014). The status of
genetics curriculum in higher education in the United States: goals and assessment. Science &
Education, 23(2), 445-464.
Messick, S. (1995). Validity of psychological assessment: Validation of inferences from persons'
responses and performances as scientific inquiry into score meaning. American Psychologist,
50(9), 741-749.
Miller, K. & Levine, J. (2017). Miller and Levine Biology. Upper Saddle River (NJ): Pearson
Prentice Hall.
Moharreri, K., Ha, M., & Nehm, R. H. (2014). EvoGrader: an online formative assessment tool
for automatically evaluating written evolutionary explanations. Evolution: Education and
Outreach, 7(1), 15.
Moll, M. B., & Allen, R. D. (1987). Student difficulties with Mendelian genetics problems. The
American Biology Teacher, 49(4), 229-233
Mollenkopf, W. G. (1950). An experimental study of the effects on item-analysis data of
changing item placement and test time limit. Psychometrika, 15(3), 291-315.
Morange, M. (2001). The misunderstood gene. Cambridge, MA: Harvard University Press.
Nadelson, L. S., & Southerland, S. (2012). A more fine-grained measure of students' acceptance
of evolution: development of the Inventory of Student Evolution Acceptance—I-SEA.
International Journal of Science Education, 34(11), 1637-1666.
95
National Research Council. (1996). National science education standards. Washington, DC:
National Academy Press.
National Research Council. (2001). Knowing what students know: The science and design of
educational assessment. Washington, DC: National Academies Press.
National Research Council. (2012). A Framework for K-12 Science Education: Practices,
Crosscutting Concepts, and Core Ideas. Washington, DC: The National Academies Press.
Nehm, R.H. (2018). Evolution (Chapter 14), In: Kampourakis, K., Reiss, M. Teaching Biology In
Schools. Routledge: New York.
Nehm, R. H., Beggrow, E. P., Opfer, J. E., & Ha, M. (2012). Reasoning about natural selection:
Diagnosing contextual competency using the ACORNS instrument. The American Biology
Teacher, 74(2), 92–98.
Nehm, R. H., & Ha, M. (2011). Item feature effects in evolution assessment. Journal of Research
in Science Teaching, 48(3), 237–256.
Nehm, R.H., & Haertig, H. (2012). Human vs. Computer Diagnosis of Students' Natural
Selection Knowledge: Testing the Efficacy of Text Analytic Software. Journal of Science
Education and Technology. 21(1), 56-73.
Nehm, R. H., Ha, M., & Mayfield, E. (2012). Transforming biology assessment with machine
learning: automated scoring of written evolutionary explanations. Journal of Science Education
and Technology, 21(1), 183-196.
Nehm, R. H., & Reilly, L. (2007). Biology majors’ knowledge and misconceptions of natural
selection. BioScience, 57(3), 263–272.
Nehm, R. H., & Ridgway, J. (2011). What do experts and novices “see” in evolutionary
problems? Evolution Education and Outreach. 4(4), 666-679.
Nehm, R. H., & Schonfeld, I. S. (2008). Measuring knowledge of natural selection: a comparison
of the CINS, an open‐response instrument, and an oral interview. Journal of Research in Science
Teaching, 45(10), 1131-1160.
Nehm, R. H., & Schonfeld, I. S. (2010). The future of natural selection knowledge measurement:
a reply to Anderson et al.(2010). Journal of Research in Science Teaching, 47(3), 358-362.
Neumann, I., Neumann, K., & Nehm, R. (2011). Evaluating instrument quality in science
education: Rasch-based analyses of a nature of science test. International Journal of Science
Education, 33(10), 1373–1405.
NGSS Lead States. (2013). Next generation science standards: For states, by states.
Washington, DC: The National Academies Press.
96
Nitko A.J., Brookhart S.M. (2010). Educational Assessment of Students (6th ed.). Upper Saddle
River, NJ: Pearson Prentice Hall.
Novak, J. D. (2002). Meaningful learning: The essential factor for conceptual change in limited
or inappropriate propositional hierarchies leading to empowerment of learners. Science
education, 86(4), 548-571.
Nowicki, S. (2017). HMH Biology 2017. Boston MA: Houghton Mifflin Harcourt Publishing
Company
Opfer, J., Nehm, R. H., Ha, M. (2012). Cognitive Foundations for Science Assessment Design:
Knowing What Students Know about Evolution. Journal of Research in Science Teaching.
49(6), 744–777
Pearson, J. T., & Hughes, W. J. (1988). Problems with the use of terminology in genetics
education: 1, A literature review and classification scheme. Journal of Biological Education,
22(3), 178-182.
Pearsall, N. R., Skipper, J. E. J., & Mintzes, J. J. (1997). Knowledge restructuring in the life
sciences: A longitudinal study of conceptual change in biology. Science Education, 81(2), 193-
215.
Peng, S. S., Wright, D., and Hill, S. T. (1995). Understanding racial-ethnic differences in
secondary school science and mathematics achievement (NCES 95-710). Washington, DC: U. S.
Department of Education.
Perez, K. E., Hiatt, A., Davis, G. K., Trujillo, C., French, D. P., Terry, M., & Price, R. M. (2013).
The EvoDevoCI: A concept inventory for gauging students’ understanding of evolutionary
developmental biology. CBE-Life Sciences Education, 12(4), 665-675.
Portin, P. (2002). Historical development of the concept of the gene. In The Journal of Medicine
and Philosophy: A Forum for Bioethics and Philosophy of Medicine (Vol. 27, No. 3, pp. 257-
286). Journal of Medicine and Philosophy Inc.
Portin, P., & Wilkins, A. (2017). The Evolving Definition of the Term “Gene”. Genetics, 205(4),
1353-1364.
Price, R.M., Andrews T.M., McElhinny T.L., Mead L.S., Abraham J.K., Thanukos A., Perez
K.E. (2014). The Genetic Drift Inventory: A tool for measuring what undergraduates have
mastered about genetic drift. CBE-Life Science Education, 13(1), 65–75.
Price, R. M., & Perez, K. E. (2016). Beyond the adaptationist legacy: Updating our teaching to
include a diversity of evolutionary mechanisms. The American Biology Teacher, 78(2), 101-108.

97
Price, R. M., Pope, D. S., Abraham, J. K., Maruca, S., & Meir, E. (2016). Observing populations
and testing predictions about genetic drift in a computer simulation improves college students’
conceptual understanding. Evolution: Education and Outreach, 9(1), 8.
Radford, A., & Bird-Stewart, J. A. (1982). Teaching genetics in schools. Journal of Biological
Education, 16(3), 177-180.
Raîche, G. (2005). Critical Eigenvalue Sizes (Variances) in Standardized Residual Principal
Components Analysis.Rasch Measurement Transactions. 19(1): 1012
http://www.rasch.org/rmt/rmt221j.htm
Rasch, G. (1960). Probabilistic models for some intelligence and attainment tests. Copenhagen:
Nielsen & Lydiche.
Richards, M. (1996). Lay and professional knowledge of genetics and inheritance. Public
Understanding of Science, 5(3), 217-230.
Romine, W. L., Schaffer, D. L., & Barrow, L. (2015). Development and application of a novel
Rasch-based methodology for evaluating multi-tiered assessment instruments: Validation and
utilization of an undergraduate diagnostic test of the water cycle. International Journal of
Science Education, 37(16), 2740-2768.
Rutledge, M. L., & Warden, M. A. (1999). The development and validation of the measure of
acceptance of the theory of evolution instrument. School Science and Mathematics, 99(1), 13-18.
Sabella, M.S., & Redish, E.F. (2007). Knowledge organization and activation in physics problem
solving. American Journal of Physics, 75, 1017–1029.
Sadler, T. D. (2003). Informal Reasoning Regarding Socioscientific Issues: The Influence of
Morality and Content Knowledge. (Unpublished Doctoral Dissertation). University of South
Florida, FL.
Sadler, T. D., & Donnelly, L. A. (2006). Socioscientific argumentation: The effects of content
knowledge and morality. International Journal of Science Education, 28(12), 1463-1488.
Sadler, T. D., & Fowler, S. R. (2006). A threshold model of content knowledge transfer for
socioscientific argumentation. Science Education, 90(6), 986-1004.
Sadler, T. D., & Zeidler, D. L. (2005). The significance of content knowledge for informal
reasoning regarding socioscientific issues: Applying genetics knowledge to genetic engineering
issues. Science Education, 89(1), 71-93
Scantlebury, K. (2014). Gender matters. In N. K. Lederman & S. K. Abell (Eds.), Handbook of
research on science education, 2, (pp. 187-203). New York: Routledge.

98
Scantlebury, K., & Baker, D. (2007). Gender issues in science education: Remembering where
the difference lies. In S. K. Abell & N. G. Lederman (Eds.), Handbook of research on science
education, 1, (pp. 31-56). New York: Routledge.
Schmiemann, P., Nehm, R. H., & Tornabene, R. E. (2017). Assessment of genetics
understanding: Under what conditions do situational features have an impact on measures?
Science & Education, 26(10), 1161-1191.
Settlage, J. (1994). Conceptions of natural selection: a snapshot of the sense‐making process.
Journal of Research in Science Teaching, 31(5), 449-457.
Shea, N. A., Duncan, R. G., & Stephenson, C. (2015). A tri-part model for genetics literacy:
Exploring undergraduate student reasoning about authentic genetics dilemmas. Research in
Science Education, 45(4), 485-507.
Shepardson, D. P., & Pizzini, E. L. (1994). Gender, achievement, and perception toward science
activities. School Science and Mathematics, 94(4), 188-193.
Silver, E. A. (1979). Student perceptions of relatedness among mathematical verbal problems.
Journal for Research in Mathematics Education, 10(3), 195–210.ibo
Simmons, P. E., & Lunetta, V. N. (1993). Problem‐solving behaviors during a genetics computer
simulation: Beyond the expert/novice dichotomy. Journal of Research in Science Teaching,
30(2), 153-173.
Sirotnik, K., & Wellington, R. (1977). Incidence sampling: an integrated theory for matrix
sampling. Journal of Educational Measurement, 14(4), 343–399.
Slack, S. J., & Stewart, J. (1990). High school students' problem‐solving performance on realistic
genetics problems. Journal of Research in Science Teaching, 27(1), 55-67.
Smith, A. B., Rush, R., Fallowfield, L. J., Velikova, G., & Sharpe, M. (2008). Rasch fit statistics
and sample size considerations for polytomous data. BMC Medical Research Methodology, 8(1),
33.
Smith, M. K., Wood, W. B., & Knight, J. K. (2008). The genetics concept assessment: a new
concept inventory for gauging student understanding of genetics. CBE-Life Sciences Education,
7(4), 422-430.
Smith, M.U. (1983). A comparative analysis of the performance of experts and novices while
solving selected classical genetics problems. (Unpublished doctoral dissertation). Florida State
University, FL.
Smith, M. U. (1988). Successful and unsuccessful problem solving in classical genetic pedigrees.
Journal of Research in Science Teaching, 25(6), 411-433.

99
Smith, M. U., & Adkison, L. R. (2010). Updating the model definition of the gene in the modern
genomic era with implications for instruction. Science & Education, 19(1), 1-20.
Smith, M. U., & Good, R. (1984). Problem solving and classical genetics: Successful versus
unsuccessful performance. Journal of Research in Science Teaching, 21(9), 895-912.
Smith, M. U., & Gericke, N. M. (2015). Mendel in the modern classroom. Science & Education,
24(1-2), 151-172.
Smith, M. U., & Sims, O. S. (1992). Cognitive development, genetics problem solving, and
genetics instruction: A critical review. Journal of Research in Science Teaching, 29(7), 701-713.
Smith, M. U., Snyder, S. W., & Devereaux, R. S. (2016). The GAENE—Generalized acceptance
of evolution evaluation: Development of a new measure of evolution acceptance. Journal of
Research in Science Teaching, 53(9), 1289-1315.
Soyibo, K. (1999). Gender differences in Caribbean participants' performance on a test of errors
in biological labelling. Research in Science & Technological Education, 17(1), 75-82.
Stanger-Hall, K. F. (2012). Multiple-choice exams: an obstacle for higher-level thinking in
introductory science classes. CBE-Life Sciences Education, 11(3), 294-306.
Stanley, W. B., & Brickhouse, N. W. (1994). Multiculturalism, universalism, and science
education. Science education, 78(4), 387-398.
Stencel, J. (1995). A string & paper game of meiosis that promotes thinking. The American
Biology Teacher, 57(1), 42-45.
Stewart, J. (1982). Difficulties experienced by high school students when learning basic
Mendelian genetics. The American Biology Teacher, 44(2), 80-89.
Stewart, J. (1983). Student problem solving in high school genetics. Science Education, 67(4),
523-540.
Stewart, J. (1988). Potential learning outcomes from solving genetics problems: A typology of
problems. Science Education, 72(2), 237-254
Stewart, J., Cartier, J. L., & Passmore, P. M. (2005). Developing understanding through model-
based inquiry. In M. S. Donovan & J. D. Bransford (Eds.), How students learn (pp. 515–565).
Washington D.C: National Research Council.
Stewart, J., & Dale, M. (1981). Solutions to genetics problems: Are they the same as correct
answers. The Australian Science Teacher, 27(3), 59-64.
Stewart, J., & Dale, M. (1989). High school students' understanding of chromosome/gene
behavior during meiosis. Science Education, 73(4), 501-521.
100
Stewart, J., Hafner, B. & Dale, M. (1990). Students' alternate views of meiosis. The American
Biology Teacher, 52(4), 228-232.
Stewart, J., & Van Kirk, J. (1990). Understanding and problem‐solving in classical genetics.
International Journal of Science Education, 12(5), 575-588.
Stony Brook University. (2017). Undergraduate Course Bulletin.
http://sb.cc.stonybrook.edu/bulletin/current/courses/index.pdf Accessed 12 December 2017.
Sweller, J. (1988). Cognitive load during problem solving: Effects on learning. Cognitive
science, 12(2), 257-285.
Thomson, N., & Stewart, J. (1985). Secondary school genetics instruction: making problem
solving explicit and meaningful. Journal of Biological Education, 19(1), 53-62.
Thörne, K., & Gericke, N. (2014). Teaching Genetics in Secondary Classrooms: a Linguistic
Analysis of Teachers' Talk About Proteins. Research in Science Education, 44(1).
Thörne, K., Gericke, N. M., & Hagberg, M. (2013). Linguistic challenges in Mendelian genetics:
Teachers’ talk in action. Science Education, 97(5), 695-722.
Todd, A. & Romine, W. L. (2016) Validation of the learning progression-based assessment of
modern genetics in a college context. International Journal of Science Education, 38(10), 1673-
1698.
Tolman, R. R. (1982). Difficulties in genetics problem solving. American Biology Teacher,
44(9), 525-27.
Tsui, C. Y., & Treagust, D. F. (2003). Genetics reasoning with multiple external representations.
Research in Science Education, 33(1), 111-135.
Tsui, C. Y., & Treagust, D. F. (2007). Understanding genetics: Analysis of secondary students'
conceptual status. Journal of Research in Science Teaching, 44(2), 205-235.
Tsui, C. Y., & Treagust, D. (2010). Evaluating secondary students’ scientific reasoning in
genetics using a two‐tier diagnostic instrument. International Journal of Science Education,
32(8), 1073-1098.
Urry, L.A., Cain, M.L., Wasserman, S.A., Minorsky, P. V., & Reece, J.B. (2017). Campbell
Biology (11th ed.). Boston: Pearson.
Venville, G., & Donovan, J. (2008). How pupils use a model for abstract concepts in genetics.
Journal of Biological Education, 43(1), 6-14.
101
Venville, G., Gribble, S. J., & Donovan, J. (2005). An exploration of young children's
understandings of genetics concepts from ontological and epistemological perspectives. Science
Education, 89(4), 614-633.
Walker, R. A. (1979). Formal operational reasoning patterns and scholastic achievement in
genetics. Journal of College Science Teaching, 8(3), 156-58.
Walker, R. A., Hendrix, J. R., & Mertens, T. R. (1980). Sequenced instruction in genetics and
Piagetian cognitive development. The American Biology Teacher, 42(2), 104-108.
Ware, E. A., & Gelman, S. A. (2014). You get what you need: An examination of purpose‐based
inheritance reasoning in undergraduates, preschoolers, and biological experts. Cognitive science,
38(2), 197-243.
Warm, T. A. (1989). Weighted likelihood estimation of ability in item response models.
Psychometrika, 54(3), 427-450
Weinburgh, M. (1995). Gender differences in student attitudes toward science: A meta‐analysis
of the literature from 1970 to 1991. Journal of Research in Science Teaching, 32(4), 387-398.
Willoughby, S. D., & Metz, A. (2009). Exploring gender differences with different gain
calculations in astronomy and biology. American Journal of Physics, 77(7), 651-657.
Wright, B. D. (1984). Despair and hope for educational measurement. Contemporary Education
Review, 3(1), 281-288
Wright, B. D., & Stone, M. (1979). Best Test Design. Rasch Measurement. Chicago: MESA
Press.
Wright, C. D., Eddy, S. L., Wenderoth, M. P., Abshire, E., Blankenbiller, M., and Brownell, S.
E. (2016). Cognitive Difficulty and Format of Exams Predicts Gender and Socioeconomic Gaps
in Exam Performance of Students in Introductory Biology Courses. CBE-Life Sciences
Education, 15(2), ar23.
Zohar, A., & Nemet, F. (2002). Fostering participants' knowledge and argumentation skills
through dilemmas in human genetics. Journal of Research in Science Teaching, 39(1), 35–62.

102
Appendix A - Overview of items used for study “Testing the impact of surface features on
students’ Mendelian genetics understanding” (Chapter 4)
Table A1. Overview of Mendelian inheritance problems varying in surface features
Type Organism
Taxon
group
Real or
Fictitious Trait Item #
Item
diffic. wMNSQ t-value
Item
Abbreviation
DR
homo amalcho animal fictitious fur color 1 0,538 1,13 1,2 am_fellfaf1
DR
homo amalcho animal fictitious fur texture 2 0,391 0,89 -0,6 am_fellstrf1
DR
homo beringo animal fictitious plumage color 3 0,311 0,89 -0,9 berf1
DR
homo beringo animal fictitious
plumage
pattern 4 0,878 0,84 -1,3 ber_strf1
DR
homo dulvitt-plant plant fictitious seed color 5 0,412 0,86 -1,1 dp_safaf1
DR
homo dulvitt-plant plant fictitious seed shape 6 0,525 0,92 -0,5 dp_safof1
DR
homo
briscinum
plant plant fictitious flower color 7 0,378 0,78 -1,8 bris_flfaf1
DR
homo
briscinum
plant plant fictitious seed length 8 0,548 0,80 -1,5 bris_salaf1
DR
homo pea-plant plant real seed color 9 0,695 0,94 -0,5 ep_safaf1
DR
homo pea-plant plant real seed shape 10 1,020 0,97 -0,2 ep_safof1
DR
homo fruit fly animal real body color 11 0,448 0,81 -1,5 ff_koerfaf1
DR
homo fruit fly animal real wing shape 12 0,598 0,90 -0,8 ff_fluefof1
DR
homo corn-plant plant real seed color 13 0,249 0,92 -0,5 mp_safaf1
DR
homo corn-plant plant real seed shape 14 0,516 0,95 -0,4 mp_safof1
DR
homo guinea pig animal real fur color 15 0,349 0,74 -2,2 ms_fellfaf1
DR
homo guinea pig animal real fur texture 16 0,682 0,83 -1,4 ms_fellstrf1
DR
homo human human real albinism 17 0,789 0,95 -0,3 me_albf1
DR
homo human human real brachydactyly 18 0,646 0,89 -0,9 me_fingf1
DR
homo human human real hairline 19 0,929 0,83 -1,4 me_nbf1
DR
homo human human real night-blindness 20 1,081 0,75 -2,0 me_haarf1
DR
homo dove animal real
plumage
pattern 21 0,594 0,74 -2,2 tauf1
DR
hetero amalcho animal fictitious fur color 22 -0,431 1,05 0,4 am_fellfaf2
DR
hetero amalcho animal fictitious fur texture 23 -0,028 0,94 -0,4 am_fellstrf2

103
DR
hetero beringo animal fictitious plumage color 24 -1.128 1,03 0,2 ber_faf2
DR
hetero beringo animal fictitious
plumage
pattern 25 -0,172 1,24 1,6 ber_strf2
DR
hetero dulvitt-plant plant fictitious seed color 26 -0,141 1,09 0,6 dp_safaf2
DR
hetero dulvitt-plant plant fictitious seed shape 27 0,887 0,92 -0,6 dp_safof2
DR
hetero
briscinum
plant plant fictitious flower color 28 0,007 0,93 -0,5 bris_flfaf2
DR
hetero
briscinum
plant plant fictitious seed length 29 -0,383 1,11 0,7 bris_salaf2
DR
hetero pea-plant plant real seed color 30 -0,419 1,03 0,2 ep_safaf2
DR
hetero pea-plant plant real seed shape 31 -0,212 0,94 -0,4 ep_safof2
DR
hetero fruit fly animal real body color 32 0,065 1,14 1,0 ff_koerfaf2
DR
hetero fruit fly animal real wing shape 33 0,011 1,16 1,1 ff_fluefof2
DR
hetero corn-plant plant real seed color 34 -0,839 0,84 -0,9 mp_safaf2
DR
hetero corn-plant plant real seed shape 35 -0,251 0,92 -0,5 mp_safof2
DR
hetero guinea pig animal real fur color 36 -0,381 0,79 -1,4 ms_fellfaf2
DR
hetero guinea pig animal real fur texture 37 -0,274 0,81 -1,4 ms_fellstrf2
DR
hetero human human real albinism 38 -0,231 0,93 -0,5 me_albf2
DR
hetero human human real brachydactyly 39 -0,208 1,23 1,4 me_fingf2
DR
hetero human human real night-blindness 40 0,050 1,03 0,3 me_nbf2
DR
hetero human human real hairline 41 -0,517 0,88 -0,7 me_haarf2
DR
hetero dove animal real
plumage
pattern 42 0,013 0,90 -0,7 tauf2
DR F1 amalcho animal fictitious fur color 43 -0,879 1,09 0,5 am_fellfaf_iv
DR F1 amalcho animal fictitious fur texture 44 -0,971 1,21 1,0 am_fellstrf_iv
DR F1 beringo animal fictitious plumage color 45 -1.118 0,97 -0,1 berf_fa_iv
DR F1 beringo animal fictitious
plumage
pattern 46 -2.134 0,69 -1,0 ber_str_iv
DR F1 dulvitt plant plant fictitious seed color 47 dp_safaf_iv
DR F1 dulvitt plant plant fictitious seed shape 48 dp_safof_iv
DR F1
briscinum
plant plant fictitious flower color 49 -0,825 1,03 0,2 bris_flfa_iv
DR F1
briscinum
plant plant fictitious seed length 50 -1.573 1,09 0,4 bris_sala_iv
DR F1 pea plant plant real seed color 51 -1.662 1,13 0,5 ep_safaf_iv

104
DR F1 pea plant plant real seed shape 52 -2.052 0,96 -0,1 ep_safof_iv
DR F1 fruit fly animal real body color 53 -0,994 1,13 0,7 ff_koerfaf_iv
DR F1 fruit fly animal real wing shape 54 -1.292 0,80 -1,1 ff_fluefof_iv
DR F1 corn-plant plant real seed color 55 -1.021 0,97 -0,1 mp_safaf_iv
DR F1 corn-plant plant real seed shape 56 -1.702 0,89 -0,3 mp_safof_iv
DR F1 guinea pig animal real fur color 57 -0,903 0,85 -0,8 ms_fellfaf_iv
DR F1 guinea pig animal real fur texture 58 -2.290 0,78 -0,6 ms_fellstrf_iv
DR F1 human human real albinism 59 me_albf_iv
DR F1 human human real brachydactyly 60 -1.216 1,08 0,4 me_fingf_iv
DR F1 human human real night-blindness 61 -0,963 1,09 0,5 me_nbf_iv
DR F1 human human real hairline 62 me_haarf_iv
DR F1 dove animal real
plumage
pattern 63 -0,861 1,06 0,4 tauf_iv
ID
homo klasron plant plant fictitious flower color 64 1,586 1,14 1,1 klpf1
ID
homo
briscinum
plant plant fictitious flower color 65 1.481 0,91 -0,7 brisf1
ID
homo strommler animal fictitious fur color 66 1,061 1,29 2,2 strf1
ID
homo theromosa animal fictitious plumage color 67 1,686 0,97 -0,2 thef1
ID
homo
andalusian
chicken animal real plumage color 68 1,089 1,05 0,4 ahf1
ID
homo
snapdragon
plant plant real flower color 69 1,060 1,07 0,6 glf1
ID
homo rabbit animal real fur color 70 1,412 1,16 1,3 kanf1
ID
homo
primrose
plant plant real flower color 71 1,199 1,14 1,0 prpf1
ID
homo
four o'clock
plant plant real flower color 72 0,864 1,09 1,0 wbf1
ID
hetero klasron plant plant fictitious flower color 73 0,877 1,18 1,4 klpf2
ID
hetero
briscinum
plant plant fictitious flower color 74 0,758 0,83 -1,4 brisf2
ID
hetero strommler animal fictitious fur color 75 -0,089 1,05 0,4 strf2
ID
hetero theromosa animal fictitious plumage color 76 0,619 1,17 1,3 thef2
ID
hetero
andalusian
chicken animal real plumage color 77 0,519 1,02 0,2 ahf2
ID
hetero
snapdragon
plant plant real flower color 78 0,393 0,76 -1,9 glf2
ID
hetero rabbit animal real fur color 79 -0,343 0,92 -0,5 kanf2

105
ID
hetero
primrose
plant plant real flower color 80 0,232 1,19 1,3 prpf2
ID
hetero
four o'clock
plant plant real Flower color 81 0,059 0,96 -0,4 wbf2
Explanation of terms used in Table A1:
● Type: description of five different types of Mendelian inheritance problems used in this
study (cf. Table 4.2)
○ DR: dominant-recessive inheritance
○ ID: incomplete dominance
○ homo: given parental generation is homozygous
○ hetero: given parental generation is heterozygous
○ F1: first filial generation given.
● Organism: name of the organism mentioned in the item
● Taxon group: assignment of living being to the three compared taxon groups (animal,
plant, human)
● Real or Fictitious: indication whether living being does exist in reality (real) or is made
up for this study (fictitious)
● Trait: trait of the living being inhered in the item
● Item #: item number represented in Wright maps (cf. Figure 4.1)
● wMNSQ: item fit measure
● t-value: additional item fit measure
● Item Abbreviation: project specific abbreviation of the item for re-identification
irrespective of item number
Items without statistical values highlighted in grey (# 47, 48, 59, 62) have been excluded for
further analyses after first analyses due to poor fit statistics. For details please refer to the main
text.

106
Appendix B. Example Items Used for Study “Testing the impact of surface features on
students’ Mendelian genetics understanding” (Chapter 4)
On the following pages are tables containing item examples for each of the five types of
Mendelian inheritance problems used in this study. Each header contains information about the
problem type followed by item examples representing all used features regarding taxon (plant,
animal, human) and familiarity (real, fictitious). To match these examples to other information
given (Wright maps, item overview), the item number (#) is included at the beginning of the item
text.

107
Problem Type 1: Dominant-recessive homozygous parental generation (DR homo)
Mendelian inheritance mechanism: Dominant-recessive
Information given: Homozygous parental generation (P)
Question posed: Distribution of first filial generation (F1)
Real Fictitious
Plant (#9) Pea plants can have yellow or green seed color.
Seed color is inherited for pea plants in a dominant-
recessive manner, where yellow seed color is
dominant and green seed color recessive.
Pea plants that have yellow seed color are crossed
with pea plants that have green seed color. Both are
homozygous regarding seed color.
Which distribution is reflected in their offspring (F1
generation) with respect to seed color?
All descendants have yellow seed color.
All descendants have green seed color.
The descendants have an approximate ratio of 1:1
yellow seed color to green seed color.
The descendants have an approximate ratio of 3:1
yellow seed color to green seed color.
The descendants have an approximate ratio of 3:1
green seed color to yellow seed color.
(#5) Dulvitt plants can have blue or grey seeds. Seed
color is inherited for dulvitt plants in a dominant-
recessive manner, where blue seed color is dominant
and grey seed color recessive.
Dulvitt plants that have blue seed color are crossed
with dulvitt plants that have grey seed color. Both are
homozygous regarding seed color.
Which distribution is reflected in their offspring (F1
generation) with respect to seed color?
All descendants have blue seeds.
All descendants have grey seeds.
The descendants have an approximate ratio of 1:1 blue
seeds to grey seeds.
The descendants have an approximate ratio of 3:1 blue
seeds to grey seeds.
The descendants have an approximate ratio of 3:1 grey
seeds to blue seeds.
Animal (#15) Guinea pigs can have black or white fur color.
Fur color is inherited for guinea pigs in a dominant-
recessive manner, where black fur color is dominant
and white fur color recessive.
Guinea pigs that have black fur color are crossed
with guinea pigs that have white fur color. Both are
homozygous regarding fur color.
Which distribution is reflected in their offspring (F1
generation) with respect to fur color?
All descendants have black fur color.
All descendants have white fur color.
The descendants have an approximate ratio of 1:1
black fur color to white fur color.
The descendants have an approximate ratio of 3:1
black fur color to white fur color.
The descendants have an approximate ratio of 3:1
white fur color to black fur color.
(#1) Amalchos can have black or white fur color. Fur
color is inherited for amalchos in a dominant-recessive
manner, where black fur color is dominant and white
fur color recessive.
Amalchos that have back fur color are crossed with
amalchos that have white fur color. Both are
homozygous regarding [trait].
Which distribution is reflected in their offspring (F1
generation) with respect to fur color?
All descendants have black fur color.
All descendants have white fur color.
The descendants have an approximate ratio of 1:1
black fur color to white fur color.
The descendants have an approximate ratio of 3:1
black fur color to white fur color.
The descendants have an approximate ratio of 3:1
white fur color to black fur color.
Human: (#18) Humans can have shortened fingers or normal finger length. Brachydactyly (short fingers and toes) is inherited
for humans in a dominant-recessive manner, where shortened fingers is dominant and normal finger length
recessive. A human that has shortened fingers is having children with a human that has normal finger length. Both
are homozygous regarding brachydactyly.
Which distribution is reflected in their offspring (F1 generation) with respect to brachydactyly?
All descendants have shortened fingers.
All descendants have normal finger length.
The descendants have an approximate ratio of 1:1 shortened fingers to normal finger length.
The descendants have an approximate ratio of 3:1 shortened fingers to normal finger length.
The descendants have an approximate ratio of 3:1 normal finger length to shortened fingers.

108
Type 2: Dominant-recessive heterozygous parental generation (DR hetero)
Mendelian inheritance mechanism: Dominant-recessive
Information given: Heterozygous parental generation (P)
Question posed: Distribution of first filial generation (F1)
Real Fictitious
Plant (#34) Corn plants can have purple or yellow
seed color. Seed color is inherited for corn
plants in a dominant-recessive manner, where
purple seed color is dominant and yellow
seed color recessive.
Two corn plants are crossed, that both have
purple seed color. Both are heterozygous
regarding seed color.
Which distribution is reflected in their
offspring (F1 generation) with respect to seed
color?
All descendants have purple seed color.
All descendants have yellow seed color.
The descendants have an approximate ratio
of 1:1 purple seed color to yellow seed color.
The descendants have an approximate ratio
of 3:1 purple seed color to yellow seed color.
The descendants have an approximate ratio
of 3:1 yellow seed color to purple seed color.
(#24) Beringos can have dark brown or white
plumage color. Plumage color is inherited for
beringos in a dominant-recessive manner, where
dark brown plumage color is dominant and white
plumage color recessive.
Two beringos are crossed, that both have dark
brown plumage color. Both are heterozygous
regarding plumage color.
Which distribution is reflected in their offspring
(F1 generation) with respect to plumage color?
All descendants have dark brown plumage color.
All descendants have white plumage color.
The descendants have an approximate ratio of 1:1
dark brown plumage color to white plumage color.
The descendants have an approximate ratio of 3:1
dark brown plumage color to white plumage color.
The descendants have an approximate ratio of 3:1
white plumage color to dark brown plumage color.
Animal (#32) Fruit flies can have grey or ivory
colored body color. Body color is inherited
for fruit flies in a dominant-recessive
manner, where grey body color is dominant
and ivory colored body color recessive.
Two fruit flies are crossed, that both have
grey body color. Both are heterozygous
regarding body color.
Which distribution is reflected in their
offspring (F1 generation) with respect to
body color?
All descendants have grey body color.
All descendants have ivory colored body
color.
The descendants have an approximate ratio
of 1:1 grey body color to ivory colored body
color.
The descendants have an approximate ratio
of 3:1 grey body color to ivory colored body
color.
The descendants have an approximate ratio
of 3:1 ivory colored body color to grey body
color.
(#28) Briscinum plants can have white or yellow
flowers. Flower color is inherited for briscinum
plants in a dominant-recessive manner, where
white flower color is dominant and yellow flower
color recessive.
Two briscinum plants are crossed, that both have
white flowers. Both are heterozygous regarding
flower color.
Which distribution is reflected in their offspring
(F1 generation) with respect to flower color?
All descendants have white flowers.
All descendants have yellow flowers.
The descendants have an approximate ratio of 1:1
white flowers to yellow flowers.
The descendants have an approximate ratio of 3:1
white flowers to yellow flowers.
The descendants have an approximate ratio of 3:1
yellow flowers to white flowers.

109
Human: (#41) Humans can have a pointed or round hairline. Hairline is inherited for humans in a dominant-recessive
manner, where pointed hairline is dominant and round hairline recessive.
Two humans that both have pointed hairlines are having children. Both are heterozygous regarding hairline.
Which distribution is reflected in their offspring (F1 generation) with respect to hairline?
All descendants have pointed hairlines.
All descendants have round hairlines.
The descendants have an approximate ratio of 1:1 pointed hairline to round hairline.
The descendants have an approximate ratio of 3:1 pointed hairline to round hairline.
The descendants have an approximate ratio of 3:1 round hairline to pointed hairline.

110
Problem Type 3: Dominant-recessive filial generation (DR F1)
Mendelian inheritance mechanism: Dominant-recessive
Information given: Distribution of first filial generation (F1)
Question posed: Parental generation (P) genotypes
Real Fictitious
Plant (#56) The seed shape of corn plants can be
smooth or wrinkled. The seed shape is
inherited in a dominant-recessive manner. The
smooth seed shape is dominant. The offspring
have smooth seed shape.
Which parental combination would be least
likely to produce these offspring?
Homozygous parents, each with wrinkled and
smooth seed shape.
Heterozygous parents with smooth seed shape.
Homozygous parents with wrinkled seed
shape.
Homozygous parents with smooth seed shape.
(#47) The seed color of dulvitt plants can be
blue or grey. The seed color is inherited in a
dominant-recessive manner. The blue seed
color is dominant. The offspring have blue
seed color.
Which parental combination would be least
likely to produce these offspring?
Homozygous parents, each with grey and blue
seed color.
Heterozygous parents with blue seed color.
Homozygous parents with grey seed color.
Homozygous parents with blue seed color.
Animal (#63) The plumage pattern of doves can be
spotted or plain. The plumage pattern is
inherited in a dominant-recessive manner. The
spotted plumage pattern is dominant. The
offspring have spotted plumage pattern.
Which parental combination would be least
likely to produce these offspring?
Homozygous parents, each with plain and
spotted plumage pattern.
Heterozygous parents with spotted plumage
pattern.
Homozygous parents with plain plumage
pattern.
Homozygous parents with spotted plumage
pattern.
(#44) The fur texture of amalchos can be curly
haired or smooth haired. The fur texture is
inherited in a dominant-recessive manner. The
curly haired fur texture is dominant. The
offspring have curly haired fur texture.
Which parental combination would be least
likely to produce these offspring?
Homozygous parents, each with smooth haired
and curly haired fur texture.
Heterozygous parents with curly haired fur
texture.
Homozygous parents with smooth haired fur
texture.
Homozygous parents with curly haired fur
texture.
Human: (#61) Humans can have impaired vision at twilight or normal vision at twilight. The night-blindness is inherited in a
dominant-recessive manner. The impaired vision at twilight is dominant. The offspring have impaired vision at
twilight.
Which parental combination would be least likely to produce these offspring?
Homozygous parents, each with normal vision at twilight and impaired vision at twilight.
Heterozygous parents with impaired vision at twilight.
Homozygous parents with normal vision at twilight.
Homozygous parents with impaired vision at twilight.

111
Problem Type 4: Incomplete dominant-recessive homozygous parental generation (ID
homo)
Mendelian inheritance mechanism: Incomplete dominance
Information given: Homozygous parental generation (P)
Question posed: Distribution of first filial generation (F1)
Real Fictitious
Plant (#69) Snapdragon plants can have red, white
or pink flower color. Flower color is inherited
for snapdragon plants in an incompletely
dominant (intermediate) manner, where pink
flower color is the incompletely dominant
(intermediate) manifestation/characteristic.
A snapdragon plant, which has red flower
color, is crossed with a snapdragon plant
which has white flower color. Both are
homozygous regarding flower color.
Which distribution is reflected in their
offspring (F1 generation) with respect to
flower color?
All descendants have red flower color.
All descendants have white flower color.
All descendants have pink flower color.
The descendants have an approximate ratio of
1:2:1 red flower color to pink flower color to
white flower color.
(#65) Briscinum plants can have red, white or
pink flower color. Flower color is inherited for
briscinum plants in an incompletely dominant
(intermediate) manner, where pink flower color is
the incompletely dominant (intermediate)
manifestation/characteristic.
A briscinum plant, which has red flowers, is
crossed with a briscinum plant which has white
flowers. Both are homozygous regarding flower
color.
Which distribution is reflected in their offspring
(F1 generation) with respect to flower color?
All descendants have red flower color.
All descendants have white flower color.
All descendants have pink flower color.
The descendants have an approximate ratio of
1:2:1 red flower color to pink flower color to
white flower color.
Animal (#70) Rabbits can have dark brown, white or
light brown fur color. Fur color is inherited
for rabbits in an incompletely dominant
(intermediate) manner, where light brown fur
color is the incompletely dominant
(intermediate) manifestation/characteristic.
A rabbit, which has dark brown fur color, is
crossed with a rabbit which has white fur
color. Both are homozygous regarding fur
color.
Which distribution is reflected in their
offspring (F1 generation) with respect to fur
color?
All descendants have dark brown fur color.
All descendants have white fur color.
All descendants have light brown fur color.
The descendants have an approximate ratio of
1:2:1 dark brown fur color to light brown fur
color to white fur color.
(#67) Thermomosas can have dark brown, white
or light brown plumage color. Plumage color is
inherited for thermomosas in an incompletely
dominant (intermediate) manner, where light
brown plumage color is the incompletely
dominant (intermediate)
manifestation/characteristic.
A thermomosa, which has dark brown plumage
color, is crossed with a thermomosa which has
white plumage color. Both are homozygous
regarding plumage color.
Which distribution is reflected in their offspring
(F1 generation) with respect to plumage color?
All descendants have dark brown plumage color.
All descendants have white plumage color.
All descendants have light brown plumage color.
The descendants have an approximate ratio of
1:2:1 dark brown plumage color to light brown
plumage color to white plumage color.

112
Problem Type 5: Incomplete dominant-recessive heterozygous parental generation (ID
hetero)
Mendelian inheritance mechanism: Incomplete dominance
Information given: Heterozygous parental generation (P)
Question posed: Distribution of first filial generation (F1)
Real Fictitious
Plant (#80) Primrose plants can have red, white or
pink flower color. Flower color is inherited for
primrose plants in an incompletely dominant
(intermediate) manner, where pink flower
color is the incompletely dominant
(intermediate) manifestation/characteristic.
A primrose plant, which has pink flower color,
is crossed with a primrose plant which has
pink flower color. Both are heterozygous
regarding flower color.
Which distribution is reflected in their
offspring (F1 generation) with respect to
flower color?
All descendants have red flower color.
All descendants have white flower color.
All descendants have pink flower color.
The descendants have an approximate ratio of
1:2:1 red flower color to pink flower color to
white flower color.
(#73) Klasron plants can have red, yellow or
orange flower color. Flower color is inherited for
klasron plants in an incompletely dominant
(intermediate) manner, where orange flower
color is the incompletely dominant
(intermediate) manifestation/characteristic.
A klasron plant, which has orange flowers, is
crossed with a klasron plant which has orange
flowers. Both are heterozygous regarding flower
color.
Which distribution is reflected in their offspring
(F1 generation) with respect to flower color]?
All descendants have red flower color.
All descendants have yellow flower color.
All descendants have orange flower color.
The descendants have an approximate ratio of
1:2:1 red flower color to orange flower color to
yellow flower color.
Animal (#77) Andalusian chickens can have black,
white or bluish plumage color. Plumage color
is inherited for Andalusian chickens in an
incompletely dominant (intermediate) manner,
where bluish plumage color is the
incompletely dominant (intermediate)
manifestation/characteristic.
An Andalusian chicken, which has bluish
plumage color, is crossed with an Andalusian
chicken which has bluish plumage color. Both
are heterozygous regarding plumage color.
Which distribution is reflected in their
offspring (F1 generation) with respect to
plumage color?
All descendants have black plumage color.
All descendants have white plumage color.
All descendants have bluish plumage color.
The descendants have an approximate ratio of
1:2:1 black plumage color to bluish plumage
color to white plumage color.
(#75) Strommlers can have dark brown, white or
light brown fur color. Fur color is inherited for
strommlers in an incompletely dominant
(intermediate) manner, where light brown fur
color is the incompletely dominant
(intermediate) manifestation/characteristic.
A strommler, which has light brown fur color, is
crossed with a strommler which has light brown
fur color. Both are heterozygous regarding fur
color.
Which distribution is reflected in their offspring
(F1 generation) with respect to fur color?
All descendants have dark brown fur color.
All descendants have white fur color.
All descendants have light brown fur color.
The descendants have an approximate ratio of
1:2:1 dark brown fur color to light brown fur
color to white fur color.