
Measuring Retail Productivity in Indian Contextiimb.ac.in/research/sites/default/files/WP No....
40
1| Page WORKING PAPER NO: 351 Measuring Retail Productivity in Indian Context Ashis Mishra Assistant Professor Marketing Area Indian Institute of Management Bangalore Bannerghatta Road, Bangalore – 560 076 Ph: 080-26993148 [email protected] Year of Publication 2011
Transcript of Measuring Retail Productivity in Indian Contextiimb.ac.in/research/sites/default/files/WP No....

1 | P a g e
WORKING PAPER NO: 351
Measuring Retail Productivity in Indian Context
Ashis MishraAssistant Professor
Marketing AreaIndian Institute of Management BangaloreBannerghatta Road, Bangalore – 560 076
Year of Publication 2011

2 | P a g e
Measuring Retail Productivity in Indian Context
Introduction
In this study, the focus is upon developing a constitutive and operational model of the construct
“Retail Productivity” from a store level application and usage point of view. Retailers over the years have
developed and used various methods for their performance measurement as well as development of
strategy. Obviously, retail productivity is one of them and probably rather significant too. However, lack
of clarity at the conceptual level has made retail productivity a synonym for retail performance and
hence retailers use sales per square feet, employee turnover or return on investment to explain retail
productivity / store productivity. Ingene (1982) highlights twelve different productivity definitions and
their overall measures. As there is complete lack of standardization of the retail productivity score,
productivity scores of two different stores (organizations) become totally non-commensurable for any
comparative purpose. As a result, a superior retail productivity score fails to develop any sustainable
strategy for future and an inferior retail productivity score fails to pinpoint areas of concern. With this
core thought process, in this study, it is intended to define retail productivity conceptually, identify
exhaustively the various constituents and their measures, determine their significance and finally
integrate them all with a model for measuring retail productivity at individual store level. Consequently,
it should help identify some store level issues and help development of strategic input to address those
issues. Apart from that, As per Mishra (2011), the existing retail productivity models fail to provide
satisfactory fit for Indian retail sector. Therefore, such a study would also define how the retail concepts
are applied and validated with changing economic as well as retail landscape with evolving retail sector
such as India.
One can proceed to the next phase of the study with a brief explanation of retail productivity
and the consequent difficulty in developing a standardized measure for it. Productivity as a concept
borrows its existence from the manufacturing sector (early twentieth century onwards) and the
economic necessity to understand the performance of the manufacturing process. As most
manufacturing business deals with conversion of raw materials (input) to finished goods (output) by
machines, productivity of the manufacturing process deals with the relationship (ratio) between output
and input. Hence, the performance of any manufacturing business can be easily determined by
productivity (ratio of output to input). Here, assuming the quality of input to be constant over a period

3 | P a g e
of time, the term productivity refers to the efficacy of the production process (machines, installed
processes, fuel etc.) only.
However, the situation gets complicated when productivity is applied to retail sector. While
conceptually retail productivity would still be the ratio of retail output to retail input, the definition of
both output as well as input are open to interpretation. The output in case of retail business is surely the
physical items (merchandise) that consumers purchase from stores. However, the embedded service
component (time utility, place utility, availability, variety as well as assortment etc.) adds value to the
merchandise. Consequently, the conversion process involves procuring the merchandise and adding
service component to provide the end consumer value added merchandise. Because of the obvious
subjectivity in the whole definition and interpretation of output component, the measurement process
is rather varied and dynamic. The input factors in the retail productivity construct automatically depend
upon the treatment of the output and hence have different dimensions too. They could be single or
multiple (labor, capital etc.); with or without considering the influence of correlates (size of store, type
of store, store level and industry level consideration etc.). Accordingly, researchers use productivity
study for different purposes. Hence for this study, retail productivity can still be defined as the ratio of
retail output to retail input and it does indicate how adequately the raw input has been converted to the
retail output.
As the objective of this study is to determine the significant constituents, their measure and the
integrating model, it would quite appropriate to first look at the literature for the same. Some significant
studies are observed with Arndt and Olsen (1975), Ingene (1982 and 1985), Reardon, Hasty and Coe
(1996). Arndt and Olsen (1975) uses gross profit of 167 grocery and general stores in Norway as output
and labor (number of persons engaged) as well as capital (floor area of the store in square meters) as
input factors and Cobb – Douglas production function with linear regression as the method for
developing their retail productivity model. Ingene (1982) identifies three measures of capital (capital
intensity, average store size and retail space saturation), two measures of labor (labor wage rate and
sales per employee), five measures of demographics (population growth, income, household size,
mobility and congestion) and one measure of competition as input variables. He uses sales in monetary
value as output variable and Ridge regression with Cobb – Douglas production function as the modeling
method for defining retail productivity. Ingene (1985) modifies his previous model of retail productivity
to eliminate the collinearity problem in his earlier model and suggests methodological modifications.
Reardon, Hasty and Coe (1996) use a translog Cobb – Douglas function for development of their retail

4 | P a g e
productivity model. They use a non-probability sample of 871 retailers in U.S. with value added (Sales –
cost of goods sold and other intermediate costs) as output factor and labor (number of employees),
capital (square foot of retail space) and information technology (equipments, computers and systems)
as input variables. They compare the results of the retail productivity model with input variables
measured in numbers (and dummy variables) and value and found support for each of the three input
variables. Analysis of the three studies reveal the necessity of a comprehensive and integrative retail
productivity model that could be standardized, used at store level and help developing operating
strategies in Indian context. The studies discussed above, validate the three input variables (labor,
capital and IT) as significant independent variables for estimating retail productivity. However, these
studies started with labor, capital and IT as input hypotheses and subsequently, proved the hypotheses
empirically. None of the studies tried to determine exhaustively all the input variables and none of them
tried to estimate total factor productivity comprehensively. Hence, these studies have rather limited
applicability in estimating retail productivity at store level and develop sustainable strategies.
Subsequently, application of Cobb – Douglas function with labor, capital and IT as input variables and
sales as output variable (all measured in value) found little support for estimating retail productivity in
emerging retail sectors (Mishra, 2011). As per Mishra (2011), the subsequent experimental study also
validated the lack of usability of the available retail productivity model for estimating retail productivity
at store level.
Therefore, the proposed model contributes to the retail literature in multiple significant ways.
Firstly, it determines exhaustively (based on the study area and associated constraints) all the significant
factors of retail productivity in Indian retail sector and provides their relative importance in retail
decision making. Of course, this is made possible by considering a single vertical in retail business
(Apparel and lifestyle) and a specific target group (SEC B+ and above). Secondly, this model is applicable
at the individual store level (micro level) in contrast to the earlier studies (which are mostly macro level).
Thirdly, it considers two different types of retail formats (small and medium sized) for model building
and hence it provides a scope for intra as well as inter level comparison. Most significantly, it provides a
theoretical framework for an extended and detailed retail performance evaluation where retail
productivity is a necessary component.
The rest of the paper is organized as follows. In the “Conceptual background” section, modeling
of output / dependent variable is highlighted. It also identifies the relevant correlates of the dependent
variable. “Model development” section identifies each of the input as well as output variables for the

5 | P a g e
determination of retail productivity and develops their measurement methods. Subsequently a modified
Cobb-Douglas model is proposed for the determination of total factor productivity. Various hypotheses
are formulated as per the requirement. Because of the involvement of multiple empirical methods in
the validation of the proposed model, there are multiple research methodologies highlighted in the text.
There are separate research methodologies for determination of input variables, determination of
output variables and empirical validation of the total factor productivity model. In the section “Results
and interpretation for medium sized stores”, the model fit for medium sized stores is analyzed and
interpreted. In the sub-section “Discussion” the results of the model is validated with industry input
(qualitative as well as quantitative). The same routine is followed for “Results and interpretation for
small sized stores” with a change of scope. “Conclusion” section highlights the major contributions of
this study and lists down the directions for continuation of the study.
Conceptual background
As per (Mishra, 2011), labor, capital and IT together or individually, fail to explain the retail
productivity variable completely and most of the small as well as medium stores operate with rather
poor efficiency level. Consequently, as suggested by (Mishra, 2011), both independent as well as
dependent variables need to be re-examined and modified based on theoretical as well as field level
inputs.
In this study, based on Achabal et.al (1984), Dubbelar et. al (2002) and Mishra (2011), the
availability of merchandise (with their associated service components) for sales at the retail outlet is
considered as the output variable for retail productivity estimation. Output of retail productivity will be
availability of merchandise for selling (single / multiple). It can be measured as physical units or cost.
The first issue under consideration is the multiplicity of the output variable. The merchandise
categories in any retail store are multiple and they need to be treated differently. All the items in the
retail store do not belong to the same category and all of them do not serve similar purpose in the retail
store. As per Levy, Weitz (2008) and Berman, Evans (2009), the fundamental principle of merchandise
management involves identification of the key categories of merchandise (say yellow, orange and white
goods) for any retail store; ascertain their purpose (say, crowd puller, staple and impulse) and
subsequently develop the procurement as well as the delivery plan along with the planogram of the
stores under consideration. The underlying philosophy here is that every category of item contributes

6 | P a g e
differently to the overall revenue and hence profitability; correspondingly, every category of item incurs
some cost for its procurement, storage and presentation inside the retail store. Over and above all
these, there is consumer preference and supplier availability which also guides the merchandise mix of
the retail store. At the end of these, the numbers must make sense for the retailer to continue his
business. This gets ascertained by the retailer during the merchandise management phase (which is
under consideration here). Obviously, it means there is distinct categorization of the retail merchandise
with the retailer. Based on the discussion above, the hypothesis is formulated and given below.
H1: Each category of merchandise in any retail store constitute a separate output for the
determination of retail productivity and hence commission different resource commitment (input
variables)
Output of retail productivity would also include the embedded service component. As per
Bucklin (1978) classification of services in any distributive business, they are logistical, informational and
product functional respectively. Betancourt and Gautschi (1988, 1993) suggest the following five service
categories. Accessibility of location (saving on time and transport cost for the consumer), level of
product assortment (breadth and depth of any category; saves time and transportation costs of the
consumers due to multiple trips to retail stores), assurance of immediate product delivery in the desired
form, at the desired place and desired time (saves the costs of waiting time, non-availability of items,
associated storage requirements if the product is not available in the desired quantity at the desired
time), information (on price, availability and other characteristics of goods and services) and ambience
(discount stores have it low whereas luxury stores have it high and hence is the associated costs). The
works of Oi (1990), Smith and Hitchens (1985) on services components in retail output are in agreement
with the above classification. However, taking the Betancourt and Gautschi (1988, 1993) classification as
the basis of service component in the retail output, one can easily identify customers as a correlate of
retail productivity. Different segments of consumers attach different levels of significance to these
multiple service factors of the retail output. This is also validated by Ingene (1982) and Mishra (2011).
Therefore, if one can map different consumer groups with the relevant service levels, one would be able
to determine the intangible value component of the merchandise that are available for selling in various
retail stores.
While multiple categories of merchandise and their associated service levels constitute output
variable for specific consumer groups in estimating retail productivity, the relationship between

7 | P a g e
merchandise and the associated service component need to be ascertained. Assuming the same
merchandise categories to be input (which is anyway true for any distributive business too), the strength
of the service component decides the value of output parameter. Say merchandise category is A. The
associated service component is α. For this study, Aα seems to be the most appropriate measure for
retail output. It is ascertained with the following illustration:
Case 1
α = 1
Interpretation: Input is equivalent to output. Retail productivity is 1. The retail store is
equivalent to any other competitor (assuming others to be at 1); it does not add any value.
Case 2
α < 1
Interpretation: Output is poorer than input due to extremely bad service (say items not
available or store pretty dirty etc.). Retail productivity is less than 1. The retail store is poorer in
comparison to its competitors (assuming others to be at 1); it is unlikely to succeed.
Case 3
α > 1
Interpretation: Output much better than the input due to the good services that adds value to
the merchandise. Retail productivity is more than 1. The retail store is doing better than its competitors
(assuming others to be at 1); it might go on to succeed. Therefore, an exponential relationship between
the merchandise and its associated service component is proposed.
Consequently, it is possible to determine the categories of merchandise in retail stores in
numbers / cost and the associated service components too. The store type, store size and the customer
characteristics have already been identified to be the confounding variables by Ingene (1982, 1985),
Reardon et. al (1996) and validated in Indian context by (Mishra, 2011). These extraneous variables
need to be controlled in the model development stage.
8 | P a g e
The multiplicity of the input variables (labor, capital, IT and more) has already been validated by
Mishra (2011). With these conceptual extensions, appropriate retail productivity model could be
developed.
Model Development
For developing an appropriate retail productivity model, some of the relevant studies of
productivity with multiple input variables are highlighted below. Eslava, Haltiwanger, Kugler and Kugler
(2004) used the KLEM production function (modified Cobb-Douglas model) to study the impact of
reforms on productivity in Colombia and Moreno (2008) used a modified Cobb-Douglas model for
studying retail productivity and technical efficiency in Spanish retail sector. Therefore, it seems
appropriate to use standard multiple regression model using Cobb-Douglas production function to
develop the retail productivity model. This would not only help identifying all the input factors of retail
productivity (total factor productivity) and their relative significance to the retail stores at an individual
level, but also would be useful in the real life application with store level assessment, estimation and
industry acceptability in Indian context.
In order to develop a model for retail productivity in Indian context, the output variables need
to be determined and their measure have to be identified. The same process has to be followed for
input variables too. Subsequently, Cobb – Douglas production function can be used with the above
mentioned output and input variables to develop the model for retail productivity.
Determination of Output factors
As discussed earlier in this paper, the output would be “the ability to make sales”. Converting
this constitutional construct into operational definition, one can say, output would be “the availability of
items / merchandise on the shelf” of the retail stores. This could be measured in terms of number of
items available or cost of the number of items that are available depending upon availability of data and
consistency of the model. This output figure would obviously include the following:
i) The products / items / merchandise that are available for selling in retail stores
ii) The service components associated with the merchandise in the retail stores
that provide the customers with value and consequently the reason for them to
choose one store over the other

9 | P a g e
It has already been discussed that each distinct category of merchandise should feature
separately in the retail productivity model. Based on field observation, the available merchandise
categories per store type are presented in table 1.
Table 1
Major Store
Types
Merchandise
Category 1
Merchandise
Category 2
Merchandise
Category 3
Merchandise
Category 4
Food and
Grocery
Staple Destination Luxury Impulse
Apparel &
Lifestyle
Core Fashion Accessories
Specialty Core Seasonal Luxury Accessories
Here apparel and lifestyle segment data is used for model validation and hence there are three possible
constituents (merchandise) of retail productivity output.
Store format and size have already been identified as confounding parameters (Mishra, 2011).
In the study area (India), there are not too many large format stores per city in the apparel and lifestyle
segment. Based on operational feasibility, small (less than 3000 sq.ft.) and medium (between 10,000
sq.ft. and 25000 sq.ft.) stores are being considered for retail productivity modeling. The incumbent
hypothesis statement is given below.
H2: The small and medium stores have different constitution so far as retail productivity modeling is
considered.
The conceptual background highlights the inclusion of an exponential service component in the
output modeling. However, it is needed to differentiate the service parameters that are specific to the
merchandise categories and those which are generically applied to all items or can be treated as
external variables. For determination of this, personal interviews are conducted with store / floor
manager of 20 retail stores and the retailer point of view regarding the service parameters is
ascertained. The internal assessment process of the retailers including store audit are also considered
for identification of appropriate service components. Out of the five service categories of Betancourt
and Gautschi (1988, 1993), level of product assortment, assurance of immediate product delivery in the

10 | P a g e
desired form, at the desired place and desired time and ambience are definitely category specific.
Location seems to be a generic factor for all merchandise categories as the travel and transportation
cost to the consumer cannot be separated for specific items (skus). Even from the operations and supply
chain point of view, the impact of store location cannot be determined specifically for individual product
categories. Apart from that, the information presentation part is a continuous activity that is embedded
with different factors (customer interaction, product demonstration etc.) rather than being a specific
activity. Hence it needs to be considered in a holistic way. Based on the interaction with the retail
executives, the value / service component is divided into the following four categories (along with their
subcategories Table 2). The advantage of this modified service / value parameter is from the data
availability with the retailers’ perspective (periodic audit).
Table 2 (value / service categories for retail productivity)
Serial No Service / Value Category Embedded subcategories
1. Store Presentation External façade (signage, window, drive way)
Ambience (Lighting, Air conditioner, Music, Aroma
Various design elements that communicate store
image)
Ease of shopping (Layout, adjacency, Ease of
circulation, ease of locating the product that you
want, ease of purchasing, Ease of value added
services and facilities)
2. Assortment Plan
3. Stock out percentage
4. Service Capability Staff adequacy, staff grooming and presentability,
Staff knowledge and skills, adherence to standards,
customer interaction, safety
Table 2 can be validated against available secondary data. “Businessworld Marketing Whitebook
(2009 -10)” provides some interesting details in this regard. Indian retail consumers are segmented into
six distinct categories based on their demographic characteristics (viz., age, zone and population index,
income etc.) and psychographic characteristics (consumption habits, behavioral patterns etc.). The
segments are experiential shoppers (24%), status shoppers (17%), pragmatic shoppers (16%),

11 | P a g e
reassurance seekers (12%), dutiful shoppers (18%) and active shoppers (13%). The segmentation is
basically a combination of
The shoppers described above, are surveyed regarding the features of any retail store that they
would find significant. They are administered a multi-item likert type questionnaire with statements
regarding the different features of any / their favorite retail store and it included many service factors
too. The conclusion is drawn based on the percentage of them saying the feature is most important to
them. The conclusion summery (Table 3) gives the number of items in the questionnaire describing
categories in Table 3 and the median of the responses for each category of consumers to the items in
the questionnaire.
Table 3 (Service significance for Indian Shoppers in %)
Service /ValueCategory
Numberof Items
ActiveShoppers
StatusShoppers
DutifulShoppers
ReassuranceShoppers
PragmaticShoppers
ExperimentalShoppers
StorePresentation
5 61 61 56 56 52 57
AssortmentPlan
7 63 62 59 58 67 62
Stock outpercentage
4 64 62.5 59 57.5 55 58.5
ServiceCapability
8 64.5 61.5 60 54.5 55.5 58.5
Analysis of the Table 4 validates the significance of categories in Table 3. Therefore, it is proposed to
formulate the output parameters model of retail productivity estimation in India as follows:= + [ ] + [ ] … . (1)Where
Y = Retail Productivity output
Yf = Fashion category SKU (measured in numbers present in stores)
Yc = Core category SKU (measured in numbers present in stores)
Ya = Accessory category SKU (measured in numbers present in stores)
Vj = Value added to the merchandise SKU for all j (category: Fashion, Core, Accessories);

12 | P a g e
j could vary between 1 to n based on the scores for its constituents
Research methodology for determination of output parameter
As both the retail productivity output and its constituents (value added) are multidimensional in
nature, it is needed to identify each of the dimensions and their relative significance (to arrive at the
output value). Conceptually, it is not much different from “value added” used in the previous studies
(Reardon et.al, 1996). However, in this study, value added is devoid of the influence of demand factor as
it is derived from the store level retailer opinion survey. 73 medium sized stores were identified from
the telephone directory and yellow pages in Bangalore. A telephonic survey was conducted to find out
their willingness to participate in this survey. About 60% positive responses (44 stores) were received.
The criteria for selection of stores were the availability of a SOP manual (Standard operating procedure)
with the store and continuous store audit for the last 3 years based on the SOP. The final sample size is
29. Extensive survey was conducted in these stores and interviews with the store manager (in some
cases senior supervisor level employees) were carried out. The distinct merchandise categories and their
associated service levels were determined. The generic services categories (applicable to the whole
store) and the specific service categories (ascribed to specific merchandise categories) were identified.
Subsequently, observation, depth interview and content analysis were followed to identify each
constituent of the retail productivity output. One of our major focuses is the ability to apply this model
on field. Therefore, instead of creating new data points for data collection, the existing data that is
typically available with the retailers (store audit and SOP manual) were relied upon and the same
measurement method (scale) was followed. The result of the retailer survey is discussed below.
The value function Vj can be defined as follows:= × + × + × + × … . . (2)Vj = Value added for jth category of merchandise
SP = Store presentation measured in a 10 point rating scale
A = Assortment plan measured in a 5 point discrete scale
(Exceeds Expectation; Meets Expectation; Acceptable; Not acceptable; Serious Concern)
SO = Stock out % measured in 5 point discrete scale
(Exceeds Expectation; Meets Expectation; Acceptable; Not acceptable; Serious Concern)

13 | P a g e
SC = Service capability measured in a 10 point rating scale
Wlj = Weight of jth category (Fashion, Core, Accessories etc.) for lth parameter
There are many components of the store presentation parameter which are presented below in table 4.
Each of the components is measured separately using the given scale. Subsequently, a weighted average
method is adopted to arrive at the store presentation score.
Table 4
Serial No. Parameter Items to be measured for each parameter Measurement Scales
1 External Façade Signage 5 point discreteWindow 5 point DiscreteDriveway 5 point Discrete
2. Ambience Lighting 5 point DiscreteAir conditioner 5 point DiscreteMusic 5 point DiscreteAroma 5 point DiscreteDesign elements that communicate brand
image 5 point Discrete3. Ease of shopping Layout 2 point Discrete
Adjacency 2 point DiscreteEase of circulation 5 point DiscreteEase of locating the product that you want 5 point DiscreteEase of purchasing 5 point DiscreteCheckout 5 point DiscreteValue added services (gift wrapping,alteration etc.) 2 point Discrete
Facilities (Rest rooms, drinking water,resting area etc.) 2 point Discrete
There are many components of the service capability parameter which are presented below in table 5.Each of the components is measured separately with a likert type scale. Subsequently, a weightedaverage method is adopted to arrive at the store presentation score.
Table 5
Serial number Parameters1. Staff adequacy2. Staff grooming and presentability3. Staff knowledge and skills4. Adherence to standards (30 minutes for alteration; 3 minutes for check out etc.)5. Customer interaction6. Safety (prevention of terrorist attack, fire, vehicle burglary etc.)

14 | P a g e
Here it would prudent to reiterate the output factor considered for retail productivity: “the
availability of items / merchandise on the shelf” of the retail stores measured in terms of number of
units or cost. The same consideration could also be there for the traditional measures of output in retail
productivity viz., sales, profit or value added etc. as availability of the items on the shelf is a necessary
precondition for either of the factors above (sales, profit or value added etc.) and on occasions the
relationship between them could also be monotonic (Ingene, 1982).
Determination of input factors
Research methodology for determination of input parameters
As per Mishra (2011), the input factors to estimate retail productivity would be multiple and
hence, an empirical survey is needed to identify them in the Indian context. A list of all the potential
input factors was created from the literature (Finne and Sivonen 2009, Porter 1985 etc.) and expert
opinion survey (retail consultants and trainers). After ascertaining content validity, the list was
converted to a likert type questionnaire. The reliability of the questionnaire was duly ensured
(Chronbach alpha .79). The questionnaire was administered to the same 291 retail managers of medium
sized stores. A factor analysis was conducted on the response data and the output revealed the
potential input parameters for the retail productivity model. The result was again discussed with the
experts (retail consultants and trainers) and modified. Table 6 summarizes the final input factors and the
confounding variables.
Table 6
1 These retail stores were identified for study during the discussion on research methodology for determination ofoutput factors
SerialNumber
Input Factors Confounding variables
1. Labor Type of retail store2. Capital (infrastructure) Size of retail store3. Retail merchandise Characteristics of the consumers4. Store interiors Income level of the consumers5. Systems and processes6. IT and point of sales

15 | P a g e
Measures for input factors
After identifying the input factors, it is needed to develop a standardized method for
measurement of these input factors so that they are easy to determine / compute (on-field usability of
the model subsequently), compatible and commensurating with each other as far as possible. It was
decided to treat the items at monetary level (as the retailers use monetary measures most of the time
rather than physical numbers). As per Reardon and Vida (1998), for determination of input parameters
of retail productivity, both monetary measures and physical measures show equivalent results.
Let it be reemphasized here that one of the primary objectives of this study is to apply the retail
productivity model at the field level (individual store level) and help the retailers formulate strategy to
improve their productivity. Therefore, the source of data, in most cases, has been observation and
determination of store operations. For developing measures of input factors of retail productivity, the
systems of the stores were studied and data was collected from the stores regarding their regular
operations. Therefore, for this study the same data depository was used as the retailers and most often
treated the data same way as the retailers. This would eventually help in external validity of the model.
All the subsequent models in this study and input measures are driven by this philosophy.
Labor input
Traditionally labor input is measured with physical units (number per sales / number per sq.ft. etc.) or
cost (wages / wages per sales / wages per man hour etc.). Ingene (1982) provides constituents for
determination of labor productivity. The significant constituents are given below.
Sales = 0.156(Capital intensity) + 0.690(Retail wage rate) + 0.186(average household income) +
0.181(Household size) + 0.222(availability of private transportation)
However, a field survey with 29 managers (and few employees) of medium sized stores (selection
process of the stores has been already described earlier) revealed some differences in the operations on
field. The major differences from the traditional method of treatment of labor input are as follows:
i) There are different types of employees in any store, namely sales, managerial /
supervisory, Support, housekeeping and security.
ii) The salary / wages, job descriptions as well as job specifications are different.
iii) Their demographic as well as psychographic profiles are also different.

16 | P a g e
iv) Consequently, the employees in any retail store require differential amount of
training and experiential (on-the-job) learning to achieve their desired levels of
performance.
v) Therefore, at any point of time every employee of any retail store does not perform
at the optimal level of effectiveness (performance)
Considering all these issues, it was decided to develop a measure for labor input factor as follows. A
survey was carried out in each of 29 stores identified earlier. Each type of employee working in the store
was identified; their demographic details (education, occupation, income, family size, and family life
cycle) were collected along with the store manager’s opinion regarding their effectiveness in the store.
Based on the profile and performance of the employees in the store, an aggregate effectiveness index
was developed for the employees (between 0 to 2) and decided to treat it exponentially with the
employee data of the store. This is based on the simple logic that a well-trained and effective employee
could perform equivalent to more than one man where as an ineffective employee could simply be a
draw on organization resources without being too productive.
During the final data collection stage (details in the sampling plan), each employee data based on cost to
the company (from their store audit data) was collected. Their profile and performance data was also
collected from the internal store audit report and an effectiveness index for the employee was
developed. As cost to the company is used as the identifier of labor, the effectiveness score was made
reverse i.e., better the performance lower is the effectiveness score. Finally, the median of the cost –
effectiveness score for the store was computed. The manager / owner’s opinion regarding the
significance of the quality labor for the store under consideration was also collected in a 5 point scale for
each type of employee. Based on the above, the labor input factor was computed.= + + + … . . (3)Where
LI = Labor input factor
LSS = Contribution of sales staff in the store to labor input factor
LMS = Contribution of managerial and supervisory staff to labor input factor
LST = Contribution of support staff to labor input factor
LHKS = Contribution of housekeeping and security staff to labor input factor

17 | P a g e
= × … . . (4)Where
LSS = Contribution of sales staff in the store to labor input factor
lcss = Cost of sales staff in labor force
e = Effectiveness of labor force (varies between 0 to 2)
SLss = Significance of the sales staff in labor force (varies between 1 to 5)
Capital input
Traditionally capital input is measured with physical units (number of establishments / floor space in
sq.ft. etc.) or cost (sales per sq.ft. etc.). However, a field survey with 29 managers (and few employees)
of medium sized stores revealed some differences in the operations on field. The major differences from
the traditional method of treatment of labor input are as follows:
Location of the store influences the contribution of capital input significantly. Retail being a store based
business (in India) and every store attracts customers from its primary trading area, the locality of the
store influences the turn over and consequently the availability of items on shelves. A superior location
would ensure better clientele, higher turnover and high margin purchases and hence higher return on
investment (for the store rental or lease).
Considering all these issues, it was decided to develop a measure for capital input factor as follows. A
survey in each of 29 stores identified earlier was carried out. The floor area in the stores and the
associated cost (rentals / lease etc.) was identified. Subsequently, a business propensity score of the
location was determined (between 0 to 2) based on local expertise. This is based on the logic that a 500
sq.ft store in a superior location gives 3 times better returns (local expertise) than a 2500 sq.ft store in
an inferior location. Therefore, the effective cost of the superior location store is lesser than the inferior
location store. The location scores were reversed (in the previous case .33) for superior compatibility.
Subsequently, the type of clientele (based on SEC classification of consumers in the trading area) was
identified and a clientele score (score varies between 1 to 5; SEC A+ closer to 5, SEC D closer to 1) was
developed. Based on the above, the capital input is determined as follows:= × … . . (5)Where
KI = Capital input factor

18 | P a g e
Kc = Cost of capitall = Location factor (varies between 0 to 2)Cl = Clientele score (varies between 1 to 5)
Merchandise input
Retail merchandise has not been included in input factors for retail productivity in the earlier studies.
However, retail merchandise is the raw stock which constitutes the backbone of any retail business.
Subsequently, the retailer adds varieties of values to the stock and the resultant merchandise is
available for sales. Intuitively it makes sense and the retailer survey for identification of input variables
(Table 6) also revealed the same. Therefore it was decided to include the raw stock at cost value in the
merchandise input. However, the cost of the stock is not just market driven; it also depends upon the
economies of scale and organizational buying process. There are a series of steps / processes involved in
the procurement function and development of an appropriate process for procurement significantly
reduces the cost of stocks. Some of the steps / processes are highlighted below.
Table 7
Serial No. Buying process Constituents1. Buying policy development Supplier selection, customer analysis, assortment
plan2. Budget allocation Sales growth plan, Sales phasing, stock phasing,
planned margin, achieved margin, markdowns, opento buy
3. Range structure planning Buying cycle, planning process, range structure plan,range profile
4. Sources of supply Supplier policy, vendor selection, supplierrelationship, negotiation, terms and conditions
5. Range planning and productdevelopment
Range needs, Range boards, competitors, Marketinformation, different ranges and product sourcingvs. product development
6. Brand development Input to overall product brand and store brand,managing brand
If any retailer follows these processes, he is more likely to get a good bargain with a lower cost of
merchandise and chances of superior productivity. The pre-sampled 29 stores were studied and their
cost of stock was gathered. Subsequently, their buying process was investigated and compared with the
standard buying process as described in table 7. The score again varies between 0 to 2 and the scores
are reversed as earlier input variables for comparative parity. Personal interviews with the managers of
19 | P a g e
the sampled stored were also carried out to gather Information regarding the supply chain significance
as well as procurement ease. Information was also gathered regarding their warehousing, storage and
transportation facilities. Based on the above, a facilities score (between 1 to 5) was devised. The
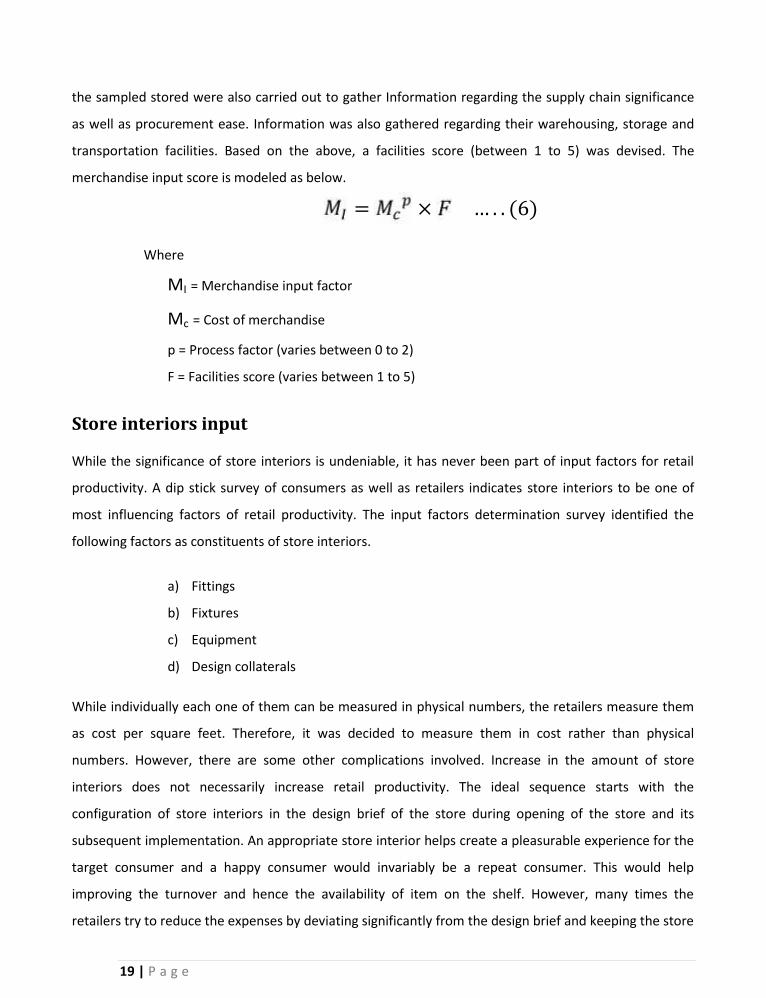
merchandise input score is modeled as below. = × … . . (6)Where
MI = Merchandise input factor
Mc = Cost of merchandise
p = Process factor (varies between 0 to 2)
F = Facilities score (varies between 1 to 5)
Store interiors input
While the significance of store interiors is undeniable, it has never been part of input factors for retail
productivity. A dip stick survey of consumers as well as retailers indicates store interiors to be one of
most influencing factors of retail productivity. The input factors determination survey identified the
following factors as constituents of store interiors.
a) Fittings
b) Fixtures
c) Equipment
d) Design collaterals
While individually each one of them can be measured in physical numbers, the retailers measure them
as cost per square feet. Therefore, it was decided to measure them in cost rather than physical
numbers. However, there are some other complications involved. Increase in the amount of store
interiors does not necessarily increase retail productivity. The ideal sequence starts with the
configuration of store interiors in the design brief of the store during opening of the store and its
subsequent implementation. An appropriate store interior helps create a pleasurable experience for the
target consumer and a happy consumer would invariably be a repeat consumer. This would help
improving the turnover and hence the availability of item on the shelf. However, many times the
retailers try to reduce the expenses by deviating significantly from the design brief and keeping the store

20 | P a g e
interior to a bare minimum. Some other occasions, the retailers again deviate from the design brief by
going overboard with store interiors to create a competitive difference. Both these extremes have
negative repercussions on retail productivity. Therefore an exponential term is introduced to cost of
store interiors in terms of its appropriateness. The design briefs of the retail stores sampled was
checked and mapped with the store interiors. In case 90% or more match the score would be 1. An
inferior match would reduce the score subsequently. In case of inferior match, the number is reversed
with the interpretation that such arrangements are actually a draw on organizational resources without
serving its purpose significantly. The other term in the store interior model is the significance the
retailers assign to the store interior parameter. This is measured in 5 point rating scale as reported by
the store managers. The resultant model is as follows:= × … . . (7)Where
SII = Store Interior input factor
Fc = Cost of fittings, fixtures, equipment and design collaterals
a = Appropriateness factor (varies between 0 to 2)
S = Significance score (varies between 1 to 5)
Systems and Processes input
There are various systems and processes in any retail store that help its smooth functioning. The input
factors identification survey revealed about 11 major processes in any retail store. The processes are
identified below.
1 –Sales Planning Process
2 – Sales Management Process
3 – Inventory Planning Process
4 – Inventory management Process
5 – Security management Process
6 – Cash desk management Process
7 –Customer Interaction
8 - Maintenance and Housekeeping

21 | P a g e
9 – HR Processes
10 – VM Processes
11 – Back office administration
Each of these processes is rather significant and unavoidable for each and every retail store. Therefore,
there are different hardware, software and human ware requirements for carrying out these processes
successfully. The presence of each of these processes in the sampled stores was identified and the cost
commitments for these processes were determined. The implementation of these processes in the
stores was also observed and it was compared against the SOP (standard operating procedures). Based
on the mapping, the appropriateness score (exponential allocation) was assigned between 0 to 2 where
stronger map gives a lower appropriateness score and a weaker maps gives higher score. The system
and processes significance score was determined as opined by the store managers. The resultant
systems and processes model is given below.
= … . . (8)Where
SP = Systems and processes input factor
I = Different systems and processes as described earlier
Pi = Cost of systems and processes
gi = Systems and processes appropriateness factor (0 – 2)
Qi = Significance factor for systems and processes
IT input
Even though information technology has significant usage (Point-of-sales, inventory management,
computer terminals / laptops, fax machines, printers, varieties of software etc.) in the retail business at
the store level, there are not many studies regarding IT in retail productivity. One of the significant
studies involves Reardon et.al. (1996) where IT is considered as an input variable in the determination of
retail productivity. In this study, IT was treated in two different ways viz., physical measure (number of
different devices, dummy variables for software) and monetary measure (total investment for IT). As the
monetary measure gives better results, it was decided to use monetary measures too for our study.

22 | P a g e
However, it was decided to make the IT input value a little more descriptive due to the following
reasons.
a) There are software and hardware involved in IT input and the investment pattern
for each of them is different (fixed and recurring)
b) Like any other input parameter, IT also has necessary and sufficient clauses of
usage. For example, a 500 sq.ft. apparel and lifestyle based store might use 2 POS
systems and 5 computer terminals to improve performance. However, usage of 5
POS and 10 terminals would surely be a draw on the store’s resources; performance
might not increase accordingly. Therefore, the opinion of industry experts was taken
(consultants and owners) and developed into a necessary and sufficient table for a
store (floor space and type). This is called appropriateness parameter, used
exponentially and the value ranged from 0 to 1.
c) Apart from that, different retailers attach differential significance to the IT
dimension. A retailer survey indicated the IT significance which was included in the
model.
The final IT input factor is represented as follows:= ( × ) + ( × ) … . . (9)Where
IT = Information technology input factor
SITc = Cost of Software elements in information technology
HITc = Cost of Hardware elements in information technology
as = Software appropriateness factor (0 – 1)
ah = Hardware appropriateness factor (0 – 1)
Ss = Significance factor for Software
Sh = Significance factor for Hardware
Proposed Model
Finally the proposed model is developed as follows:

23 | P a g e
= ∝ ∅ ∀ , , …… . . (10)Where
Y = Output factor
A = Total factor productivity
L = Labor input to retail productivity
K = Capital input to retail productivity
M = Retail merchandise input to retail productivity
SI = Store Interior input to retail productivity
SP = Systems and processes input to retail productivity
IT = IT input to retail productivity
α = Elasticity of labor
β = Elasticity of capital
γ = Elasticity of retail merchandise
δ = Elasticity of store interiors
θ = Elasticity of Systems and processes
φ = Elasticity of IT
i = Store type
v = Store size
c = Customer characteristics
This leads us to a few hypotheses that can be verified along with the model fit with empiricaldata. The hypotheses are given below.
H3: Labor has a positive and significant effect on the output of retail stores.
H4: Capital has a positive and significant effect on the output of retail stores.
H5: Merchandise has a positive and significant effect on the output of retail stores.
H6: Store interiors have a positive and significant effect on the output of retail stores.
H7: Systems and processes have a positive and significant effect on the output of retailstores.
H8: IT has a positive and significant effect on the output of retail stores.

24 | P a g e
H9: Most of the retailers operate at constant returns to scale.
Research Methodology for model fit
Empirical data were required to validate the proposed retail productivity model. As described
earlier the scope of study was small (less than 3000 sq.ft.) and medium (less than 25,000 sq.ft.) stores in
apparel as well as lifestyle vertical. There was no existing database available in India for retail stores and
hence, it was needed to develop a database before choosing a sample. For ease of accessibility and data
availability, three metros of India were considered for our study (Mumbai, Delhi and Bangalore). The list
and the number of stores were collected from some websites which provide store level data (viz.,
retailangle.com etc.). As the website data did not contain the store size, one had to physically
crosscheck (legwork and interviewing members of regional trading association) the stores to put them in
the said categories. Subsequently, store level data (name, type and telephone number) was also
collected from the regional trading associations. The areas not covered by either of the modes (websites
as well as regional trading associations) were covered physically (to find out the name of the stores that
matches our profile). The names of the said stores were searched in the telephone directory and yellow
pages. The telephone numbered stores were taken as the primary sample frame. The next level of
elimination was based on the type of customers patronizing the store. The target was SEC (Socio
economic classification) B+ and all stores that cater to customers below B+ were removed from our list.
The store managers were contacted over telephone and support for the study was asked for. About 40%
dropped out. This database constituted the secondary sample frame which was used for the research
purpose. It consisted of 682 medium stores and 995 small stores. From the database, systematic
random sample were drawn for each store type. After data collection through telephonic and personal
interview, there were 207 valid responses for medium type stores and 353 for small stores. The model
was applied to the collected data and the results are given below.
Results and Interpretation for medium sized stores
Retailer opinion survey revealed three distinct category of merchandise in apparel and lifestyle
stores (Table 1) that needs differential decision making and resource allocation from their side.
Therefore, it is likely that it would draw differential input variables in terms of their significance. It was
decided to treat the above mentioned three categories separately in the model and therefore there are
three different results for fashion category merchandise, core category merchandise and accessory
category merchandise.

25 | P a g e
Table 8a (Result for medium stores -Fashion)
Model Summary
Model R R2 AdjustedR2
Std.Error ofEstimate
Change Statistics
R2
changeFChange
df1 df2 Sig. FChange
1 .824a .678 .673 .9329875 .678 138.061 6 393 .000a. Predictors: (Constant), Log IT, Log Capital, Log FFED, Log Merchandise, Log SP, Log Labor
Table 8bANOVAb
Model Sum of Squares df Mean Square F Sig.
1 Regression 721.065 6 120.177 138.061 .000a
Residual 342.093 393 .870
Total 1063.158 399
a. Predictors: (Constant), Log IT, Log Capital, Log FFED, Log Merchandise, Log SP, Log Labor
b. Dependent Variable: Log Fashion
Table 8cCoefficientsa
Model
Unstandardized Coefficients
Standardized
Coefficients
t Sig.
Collinearity
Statistics
B Std. Error Beta Tolerance VIF
1 (Constant) 7.028 .459 15.296 .000
Log Labor -.357 .067 -.184 -5.370 .000 .696 1.437
Log Capital .523 .022 .692 24.132 .000 .997 1.003
Log
Merchandise
-.581 .093 -.199 -6.218 .000 .800 1.249
Log FFED .197 .022 .268 8.937 .000 .911 1.098
Log SP -.298 .057 -.173 -5.215 .000 .743 1.345
Log IT .157 .040 .118 3.958 .000 .925 1.082
a. Dependent Variable: Log Fashion
The model shows a good fit (R2 = .678, standard error below 1; Table 8a) for the fashion
category items (output variable) in medium sized apparel and lifestyle based stores with labor, capital,
merchandise, store interiors (FFED – Fittings, Fixtures, Equipment and Design collaterals), systems and

26 | P a g e
processes and IT as predictor variables. Results from table 8b indicates identification all possible input
variables for estimating the output variable (residual not significant). This is according to the concept of
total factor productivity determination in the proposed model. However, table 8c which identifies the
significant predictors for determination of retail productivity of fashion items in medium sized stores
throws quite a few surprises. Capital, store interiors and IT have demonstrated significant and positive
influence on the output variable whereas labor, merchandise, systems and processes have shown
negative influence. Therefore, the results support H4, H6 and H8; however, there is no support for H3, H5
and H7. H9 has not been supported by the model as the results indicate diminishing returns to scale (sum
= .52).
Table 9a (Result for medium stores -Core)
Model Summary
Model R R2 AdjustedR2
Std.Error ofEstimate
Change Statistics
R2
changeFChange
df1 df2 Sig. FChange
1 .810a .656 .651 1.1598508 .656 125.016 6 393 .000a. Predictors: (Constant), Log IT, Log Capital, Log FFED, Log Merchandise, Log SP, Log Labor
Table 9b
ANOVAb
Model Sum of Squares df Mean Square F Sig.
1 Regression 1009.067 6 168.178 125.016 .000a
Residual 528.685 393 1.345
Total 1537.752 399
a. Predictors: (Constant), Log IT, Log Capital, Log FFED, Log Merchandise, Log SP, Log Labor
b. Dependent Variable: Log Core
Table 9c
Coefficientsa
Model Unstandardized
Coefficients
Standardized
Coefficients
t Sig.
Collinearity Statistics
B Std. Error Beta Tolerance VIF
1 (Constant) 10.514 .571 18.407 .000

27 | P a g e
Log Labor -.599 .083 -.257 -7.238 .000 .696 1.437
Log Capital .536 .027 .589 19.882 .000 .997 1.003
Log
Merchandise
-.886 .116 -.252 -7.633 .000 .800 1.249
Log FFED .169 .027 .191 6.174 .000 .911 1.098
Log SP -.510 .071 -.246 -7.169 .000 .743 1.345
Log IT .153 .049 .095 3.094 .002 .925 1.082
a. Dependent Variable: Log Core
The model for core items display characteristics similar to the fashion items discussed earlier.
Table 9a highlights a good fit for the model (R2 = .656; low standard error) and table 9b signifies the
determination of all the significant input variables (labor, capital, merchandise, store interiors, systems
and processes and IT as predictor variables) for the estimation of core value output (residual not
significant). Table 9c helps identifying the direction and significance of predictor variables and the
observations are similar to the observations for fashion variable. Capital, store interiors and IT display
positive significance whereas labor, merchandise and systems and processes display negative
significance. Consequently, H4, H6 and H8 are validated and there is no support for H3, H5, H7 as well as H9
(sum = .12)
Table 10a (Result for medium stores -Accessories)
Model Summary
Model R R2 AdjustedR2
Std.Error ofEstimate
Change Statistics
R2
changeFChange
df1 df2 Sig. FChange
1 .837a .701 .696 .9781523 .701 153.468 6 393 .000a. Predictors: (Constant), Log IT, Log Capital, Log FFED, Log Merchandise, Log SP, Log Labor
Table 10b
ANOVAb
Model Sum of Squares df Mean Square F Sig.
1 Regression 881.013 6 146.835 153.468 .000a
Residual 376.015 393 .957
Total 1257.028 399

28 | P a g e
a. Predictors: (Constant), Log IT, Log Capital, Log FFED, Log Merchandise, Log SP, Log Labor
b. Dependent Variable: Log Acc
Table 10c
Coefficientsa
Model Unstandardized
Coefficients
Standardized
Coefficients
t Sig.
Collinearity
Statistics
B Std. Error Beta Tolerance VIF
1 (Constant) 7.583 .482 15.741 .000
Log Labor -.446 .070 -.211 -6.389 .000 .696 1.437
Log Capital .572 .023 .695 25.166 .000 .997 1.003
Log
Merchandise
-.618 .098 -.195 -6.314 .000 .800 1.249
Log FFED .197 .023 .247 8.553 .000 .911 1.098
Log SP -.364 .060 -.194 -6.061 .000 .743 1.345
Log IT .101 .042 .070 2.428 .016 .925 1.082
a. Dependent Variable: Log Acc
Table 10 (a, b, c) display the model fit for accessories as output variable (dependent variable)
and labor, capital, merchandise, store interiors, systems and processes as well as IT as input (predictor
variables). The result corroborates the findings of the retail productivity model for fashion variables and
core variables as outputs. The model has a good fit (R2 = .701; table 13a) and it identifies all the
significant predictor variables (residual not significant; table 10b). The positively significant input
variables are capital, store interiors and to a small extent IT. The negatively significant variables are
labor, merchandise and systems as well as processes. There is support for H4, H6 and there is not enough
support for H3, H5, H7, H8 and H9 (sum .41). So far as H1 is concerned, there is partial support for it in
midsized store segment. For each category of merchandise (fashion, core and accessories), the selection
of input variables are the same. But, allocation of the variables is not equivalent in all the categories.
Discussion
Analysis of the retail productivity results provides quite interesting results which is quite
different from the earlier studies. As the empirical study was carried out with control for external
(confounding) variables, there are two distinct sets of results. Apart from that, there have been multiple
output variables (fashion, core and accessories; for small stores only fashion and core as accessories are
29 | P a g e
not a separate category in these stores) and they are supposed to show similar pattern as they belong to
the same store. Most often, the fashion, core and accessories do show similarity in trends. The following
section discusses the same results from store implementation point of view along with the possible
reasons for their significance in the model.
In case of medium stores, out of the six input variables, five are quite significant whereas IT is
partially significant. This could be due to relatively lesser importance associated with IT by majority of
the midsized apparel and lifestyle based retailers (and consequently less investment on IT). A further
study of the sample stores indicated only the international brands (franchisee / licensee / JV etc.) such
as NIKE, Reebok, and Levi’s etc. trust IT to be an absolute necessary part of their store and consequently
they believe IT improves store productivity. However, majority of the apparel and lifestyle based stores
(includes Indian wear stores) relay on manual systems and even when they have IT usage, there is the
presence of a manual backup system. Therefore, this empirical part being based on self-reporting
technique (with various store managers), it is quite possible to get a low significance / non – significance
for IT factor in the input variables. From a different point of view, there is huge potential for IT and
related applications for midsized apparel and lifestyle based retail stores in India.
Apart from IT as input variable, all others (labor, capital, merchandise, store interiors and
systems as well as processes) show significant weights as input variable of retail productivity. Out of
them, capital and merchandise are positive whereas labor, merchandise and systems and processes are
negatively related to retail productivity output. Capital (retail space) is the most important input variable
that contributes to output (always more than 50% weight) and this is quite understandable too. In a
place like India where availability of good retail space is at a premium and where retail consumers do
not prefer travelling too long distance for their purchases, retail space could make or break the retail
business. Even the previous studies confirm the significance of capital (may not be the same extent).
However, store interior is a surprise selection for retail productivity input variable. For each category of
merchandise (fashion, core, accessories) store interiors have a significant weight (almost 20%).
Considering the developing Indian retail sector and organized retail at about 6.5% of the total retail
industry only, the extra seriousness (attaching more importance and investing significant resources on
it) of retailers towards the fittings, fixtures, equipment as well as design collaterals etc. needed further
validation.
A survey of 50 random retailers and 100 random consumers from our sample frame was
conducted and group interview was carried out regarding the significance of store interiors. The

30 | P a g e
retailer’s opinion reaffirmed the model finding. Their views highlighted the accessibility of global retail
market (physically or virtually) by the target consumer (SEC B+ and above) and hence, they have become
more conscious of the in store environment and consequently more demanding. Of course price of the
merchandise and its quality still remains the most sought after parameters for the target consumers
while choosing the store. However, other parameters remaining similar, store interior is the most
desirable parameter for the target consumer. As in highly competitive market for apparels and lifestyle
products, most of the retailers follow similar business model (no private brands, middlemen in
procurement), there is very limited opportunity to differentiate the offerings based on price or quality.
Therefore, it makes more business sense to sensitize store interiors to the requirements of the
consumers and consequently, make a case for higher turnover (and improved retail productivity). A dip
stick survey of the consumers validated the opinion of the retailers regarding the significance of store
interiors in estimating retail productivity.
Now one needs to look at negatively significant variables. Labor is probably the most important
negative weight for retail productivity estimation. It shows a constant negative value for all three
estimations viz., fashion, core and accessories categories ranging from 18% to 25%. All of the previous
studies have found labor to be significant positive influence on retail productivity. In order to
understand this phenomenon, a manpower survey in 100 randomly chosen stores from our sample
frame was undertaken. The effort was to find out the desired skill set and level of employees in midsized
retail stores (in apparel and lifestyle vertical) and the time frame needed to achieve the satisfactory
level. This has added significance as academic background / prior experience was not a pre-requisite for
retailers while recruiting employees in three out of four positions (sales, support, housekeeping and
security; sometimes supervisory too); only for managerial level academic background or prior
experience is a pre-requisite. The resultant plot is given below.

31 | P a g e
Figure 1
Here the time period spent in the retail store is the X axis and performance level as rated by the
employer / manager is the Y axis. The figure reveals similar performance pattern for each of the four
categories of employees. This indicates most of the employees join retail business with almost non-
existent skill set and it is their on-the-job training that improves their performance. The peak
performance is reached within 12 to 18 months. However, the survey also revealed the average
turnover period for the employees is within 6 months to 12 months. Therefore, essentially the retail
stores carry some sub-optimal manpower without much significant returns. This phenomenon might be
the reason for the negative weight of labor force in retail productivity estimation.
Merchandise is the second negative variable within the retail productivity input. Merchandise as
an input variable consists of the SKUs (stock keeping units) after being manufactured by the
manufacturer / brand owner. After procurement of the retailer, the service components are added and
it is made available in the retail store for the prospective consumers. Therefore, the contribution of
merchandise parameter to retail productivity output depends upon the following two factors.
a) Ability of the retailer to order the right merchandise
b) Efficacy of the procurement process
In order to determine the above two factors, a survey with 100 random retailers from our
sample frame was conducted. Secondary store level data, personal interview and projective techniques
0
20
40
60
80
100
120
3months 6 months 12 to 18months
24 months
Sales staff
Supervisory / Managerial Staff
Support Staff
HK / Security Staff

32 | P a g e
were used with the store owners, managers and / or employees to generate required database. The
hypotheses under consideration were as below:
H10: Majority of the medium sized retailers in the apparel and lifestyle segment follow an
optimal store development process (while opening the store)
This hypothesis could not be proved from the available data. While most of the retailers follow a
standard store development process while opening the store (probably the same set of professionals are
used), it can hardly be called optimal. The competitor store model and the desired store positioning of
the retail store owner are most often the key drivers for store development process. Therefore, rarely
scientific approach is followed and the investments in the key portfolios become erratic. Therefore in
most cases, the retailers start with sub-optimal store model (procurement and delivery to customers)
H11: Majority of the medium sized retailers in the apparel and lifestyle segment follow a
structured scientific procurement process.
No evidence of the above is found in this study. Even though SOP is available for most of the
activities, 70% of the cases it is not followed. 38% of the employees are not aware of the SOP for their
own stores. There are no designated positions available in the stores for buying, negotiations or supply
chain management. About 58% of the retailers are still reliant on the middlemen for their supply chain.
However, majority (80%) of the medium sized retailers in the apparel and lifestyle segment follow a
structured scientific process for ordering / reordering items. In 30% of the cases, it the desire of the
retailers to stick to the SOP and avoid unnecessary complications propel them to follow the available
process. However, if the initial model itself is flawed (as found in H10), following a structured scientific
process for ordering / reordering items may not be of much avail. Apart from that, this is partially due to
the inability of the retailers to appreciate the dynamic retail scenario and partially due to the unskilled
labor force at their disposal. In many cases, the owner assumer the manager’s role and he may not
possess the necessary skill set to dynamically induct any changes to the existing model.
H12: Majority of the medium sized retailers in the apparel and lifestyle segment have a long
term vision of supply chain efficiency and procurement effectiveness in mind while designing and
implementing the procurement process.

33 | P a g e
There is absolutely no support for this hypothesis and this is the major reason for the
inefficiency of the merchandising as well as procurement process in most of the stores. Retailers are
rather short sighted so far as their strategic planning is concerned and they are rarely interested for long
term relationships with their suppliers / business partners. Sales, profit and current returns are most
important measures for the retailers.
The findings of the hypotheses testing are quite enough to explain the negative contribution of
merchandise parameter to retail productivity. There are inherent deficiencies in the merchandising,
procurement and supply chain process in the mid-sized apparel and life style based retail stores in India
and therefore the turnover of the merchandise in the retail stores are affected. The retailers often find
themselves with over stocking or under stocking; poor turnover or stock out scenario. Consequently, the
contribution of merchandise component as an input variable to retail productivity is rather obvious.
The third significant negative input variable to retail productivity is systems and processes.
Presence of appropriate systems and processes directly affect store operations and ineffective
operations do affect store performance. Therefore, it is no wonder that poor operational efficiency
affects retail productivity. Survey of 100 randomly chosen stores from our sample frame clearly showed
the lack of focus of the retail stores towards systems and processes. While most of the retail store
owners / managers are aware of the systems and processes that go into efficient store operations and
they do carry out store audit from time to time to determine effectiveness of the store operations, they
do precious little to modify / change / develop the same. They cite lack of enough resources /
technology knowhow or competitive parity as the reasons to carry on the business the way they do.
That is the predominant reason for the negative weight for systems and processes in spite of their
significance.
Results and Interpretation for small sized stores
Table 11a (Result for small stores -Fashion)
Model Summary
Model R R2 AdjustedR2
Std.Error ofEstimate
Change Statistics
R2
changeFChange
df1 df2 Sig. FChange

34 | P a g e
1 .882a .779 .777 .5109232 .779 376.878 6 643 .000a. Predictors: (Constant), Log IT, Log Merchandise, Log Capital, Log Labor, Log FFED, Log SP
Table 11b
ANOVAb
Model Sum of Squares df Mean Square F Sig.
1 Regression 590.287 6 98.381 376.878 .000a
Residual 167.850 643 .261
Total 758.137 649
a. Predictors: (Constant), Log IT, Log Merchandise, Log Capital, Log Labor, Log FFED, Log SP
b. Dependent Variable: Log Fashion
Table 11c
Coefficientsa
Model Unstandardized
Coefficients
Standardized
Coefficients
t Sig.
Collinearity Statistics
B Std. Error Beta Tolerance VIF
1 (Constant) 3.444 .145 23.825 .000
Log Labor .089 .031 .062 2.855 .004 .732 1.367
Log Capital .546 .014 .866 39.941 .000 .733 1.364
Log
Merchandise
-.122 .040 -.065 -3.065 .002 .758 1.319
Log FFED .059 .010 .126 5.736 .000 .717 1.396
Log SP -.082 .025 -.078 -3.321 .001 .617 1.619
Log IT -.015 .021 -.016 -.713 .476 .692 1.446
a. Dependent Variable: Log Fashion
The results for small stores differ significantly for their counterparts in medium stores even
though there are some similarities in the retail productivity model. There is a good fit for the model (R2 =
.77; Table 11a) and all the significant input variables have been identified (Table 11b; residual not
significant) for fashion category merchandise. However, the differences are quite remarkable in the
direction and significance of the predictor variables. The only significant predictor variables are capital
and store interiors and hence H4 as well as H6 are validated. However, none of the other predictor
variables (labor, merchandise, systems as well as processes and IT) are significant and consequently,
there is no support for H3, H5, H7 and H8. H9 is almost validated with the sum of coefficients being equal
to .99.

35 | P a g e
Table 12a (Result for small stores -Core)
Model Summary
Model R R2 AdjustedR2
Std.Error ofEstimate
Change Statistics
R2
changeFChange
df1 df2 Sig. FChange
1 .929a .864 .863 .4469841 .864 679.852 6 643 .000a. Predictors: (Constant), Log IT, Log Merchandise, Log Capital, Log Labor, Log FFED, Log SP
Table 12b
ANOVAb
Model Sum of Squares df Mean Square F Sig.
1 Regression 814.985 6 135.831 679.852 .000a
Residual 128.468 643 .200
Total 943.453 649
a. Predictors: (Constant), Log IT, Log Merchandise, Log Capital, Log Labor, Log FFED, Log SP
b. Dependent Variable: Log Core
Table 12c
Coefficientsa
Model Unstandardized
Coefficients
Standardized
Coefficients
t Sig.
Collinearity Statistics
B Std. Error Beta Tolerance VIF
1 (Constant) 2.165 .126 17.121 .000
Log Labor .130 .027 .082 4.798 .000 .732 1.367
Log Capital .570 .012 .810 47.624 .000 .733 1.364
Log
Merchandise
-.039 .035 -.019 -1.131 .258 .758 1.319
Log FFED .069 .009 .132 7.677 .000 .717 1.396
Log SP -.022 .022 -.019 -1.006 .315 .617 1.619
Log IT .106 .018 .010 5.726 .000 .692 1.446
a. Dependent Variable: Log Core
The results for the core variable (as output) show similar trends as the fashion variables. There is
a good fit for the model (R2 = .86) as evident from table 12a. The determination of all significant

36 | P a g e
predictor variables are highlighted in the results of table 12b. Table 12c delivers the significant input
variables which are capital and store interiors. All other input variables are rendered insignificant (labor,
merchandise, systems and processes). Therefore, H4 and H6 are supported by the model and H3, H5, H7 as
well as H8 have found no takers empirically. There is support for H9 with the sum of coefficients being
1.034. So far as H1 is concerned, there is partial support for it in small store segment. For each category
of merchandise (fashion and core), the selection of input variables are the same. But, allocation of the
variables is not equivalent in all the categories. There is complete support for H2 as the selection of input
variables are not the same for small and medium stores.
Discussion
The result of the small stores follows the same trend as the medium stores. However, it does
show some uniqueness of its own. This observation is quite important from Indian retail sector point of
view as majority of the retail stores in India fall into this category. For both fashion as well as core
category of the small stores in the apparel and lifestyle segment the retail productivity model displays
similar pattern: capital and store interiors being positive and important; all other input variables being
insignificant. The reasons for the significance of capital and store interiors are similar to those
highlighted during the discussion for medium sized stores. However, the lack of significance of all other
input variables needed further probing.
Interview with store managers / owners for 100 stores from our sample frame was conducted
and the reasons for the above result were investigated. So far as labor is concerned, the reason is quite
interesting. For most of the small stores, either there are no additional employees or the employees are
from the family only. Therefore, even though the skill level is rather limited, the turnover rate is not
worrisome and resource commitments negligible. Majority of the small sized retailers do not consider
recruiting any additional labor and they do not consider it to be significant. The merchandising and
procurement process in these stores are more based on intuition and experience rather than any
scientific and process driven decision making. However, these stores carry limited stock and most often
they cater to a niche market. These retailers have a fair idea of their customer base and their
requirements and they carry items accordingly in their stores. Most often they do not have any
permanent supply chain. They source the merchandise from the regional wholesale market or factory
seconds market and bargain aggressively for price benefits. As all their competitors also follow the same
model, the small sized stores in apparel and lifestyle segments in the study area have relatively decent

37 | P a g e
turnover. They neither have any significant benefit from the procurement process nor any crippling
disadvantage. Hence, they do not give much importance to the merchandise parameter. Finally, let us
discuss the systems and processes as well as IT parameters of the retail productivity model. Most of
these stores are individual driven (owner / manager / franchisor) and he / she takes all the major
decisions regarding store operations. Rarely there is any SOP and retailers rely on experience or
competitive parity for most of the operations. There is complete absence of any IT systems in store
(other than brand outlets / franchise models) and retailers rely on manual systems and ledger posting
for maintaining their records. In some cases there is use of point of sales systems and desktops / laptops
for merchandising as well as inventory management. But, the retailers use assembled computer systems
and pirated / outdated software to minimize expenses. These systems become unstable and software
unreliable for obvious reasons and cumulatively, it add on the distrust of the retailer on technology in
general. Apart from that, most of the small scale retailers are quite content with running one store and
there no real plan of expansion or scaling up. Therefore, it is really no surprise that systems, processes
and IT carry no significance for these retailers.
Conclusion
The most significant findings of this study are twofold. The first one is to identify all the possible
input variables that contribute to retail productivity in Indian context. The second one is the ability of
the study to visualize the issues from an individual retailer’s point of view (micro focus rather than
macro level), develop a model that can eventually be applied at the field and suggest solutions to
improve productivity at the individual retailer level. Apart from determining the variables in a self-
reporting type personal survey, the input variables have been validated using empirical models. Apart
from that, the determination of output factor has been suitably modified to accommodate the
merchandise component as well as the service component. For the first time, the service component in
retail business has been quantified and measured. Again for the first time, the empirical study controlled
for store size as a confounding variable and two different models were developed for different sizes of
stores. It is quite interesting to find that apparel and lifestyle stores of different sizes in the same area
can have potentially different productivity due to emphasis on different input factors and hence, it could
help taking appropriate corrective measures for the store productivity. Even different categories of
items in the store has been identified and treated separately with different models which also tests the
parity of the models for the same store (and hence creates another level of validation for the model).

38 | P a g e
On a theoretical level, clarity has been provided on different levels of measuring retail
performance and productivity has been methodologically differentiated from efficiency and
effectiveness. It also provides some unique insight into a developing retail sector like India and its major
drivers about which not much study has been done till now. Overall this study provides the unorganized
retail sector with lots of options to look at their performance measurement differently and try to
improve productivity at an individual store level.
Study Limitations and further research
Like any other study, this study also suffers from many limitations. The major limitation is the
lack of availability of credible secondary data for retail stores. Therefore, one had to spend lots of time
trying to develop a database with sufficient number of cases for appropriate model fit. Even while
developing the database, in many cases one had to rely on observations and calculated assumptions as
not enough cooperation is forthcoming from the retailers. Hence, even though internal validity was
achieved by controlling for store size and location (clientele) and external validity was achieved by
randomizing retailer selection for the study (from the sample frame), there is surely a tradeoff between
the two. Ideally, one would have preferred a complete list of all the retailers (in the small and medium
segment) in any city along with their telephone numbers for complete randomization.
The second limitation would involve the scope of the study. While working on the retail
productivity issue, the need for a complete retail performance measurement methodology was realized.
However the productivity issue was discussed in this study and that involves only the operational part of
the performance measurement. Work on the other two significant issues like efficiency and
effectiveness is needed to complete the retail performance measurement framework.
The third limitation would be the inability of the study to include the large format retailers in the
study (even though that was the initial plan). However, lack of enough number of large format stores
(more than 80,000 sq.ft.) led us to drop the idea. Probably, in future, including the data from a few
similar cities (metros / tier 1 / tier 2 etc) could help us to generate a database for large format stores.
Apart from these limitations, there are a couple of things in mind for studies in future. Even
though some of the input parameters have been insignificant / negatively significant for the retail
productivity determination, they are by no means avoidable. These variables have significant impact on
the retail business and its performance. Hence, there is a scope to study each of those input variables

39 | P a g e
separately and try to integrate them in the retail productivity / performance measurement model. The
model of retail productivity is based on current data and data is collected through self-reporting
technique. Therefore, this information cannot be used for long range planning or strategic productivity
development processes. A methodology could be developed using historical data or some independent
third party observation / innovative measurement to bridge this gap.
References
Achabal, Dale D., Heineke John M., and McIntyre Shelby H. (1984). “Issues and perspectives on Retail
Productivity,” Journal of Retailing, 60 (3) fall: 107 – 127.
Arndt, Johan and Olsen Leif (1975). “A research note on economies of scale in retailing,” Swedish Journal
of Economics, 77(2) June: 207 – 221.
Berman Barry, Evans Joel R. (2009) Retail Management, Tenth Edition, Third impression, Pearson
Prentice Hall. 407 – 436.
Betancourt, R.R. and Gautschi D.A. (1988). “The economics of retail firms,” Managerial and Decision
Economics, 9: 133–144.
Betancourt, R.R. and Gautschi D.A. (1993). “The outputs of retail activities: concepts, measurement and
evidence from US census data,” Review of Economics and Statistics, 75: 294–301.
Bucklin, L.P. (1978). Productivity in marketing, Chicago: American Marketing Association.
Businessworld Marketing Whitebook 2009 – 10. (2010). Businessworld publications, 261 – 354.
Dubelaar, Chris, Bhargava Mukesh and Ferrarin David (2002). “Measuring retail productivity What really
matters?” Journal of Business Research, 55 (5) May: 417 – 426.
Eslava, M., Haltiwanger John, Kugler Adriana, and Kugler Maurice. (2004). “The effects of structural
reforms on productivity and profitability enhancing reallocation: evidence from Colombia,” Journal of
Development Economics, 75 (2) December: 333 – 371.
Finne, Sami and Sivonen Hanna (2009). The Retail Value Chain, Kogan page Publication, 137.
Ingene, Charles A. (1982). “Labor Productivity in Retailing,” Journal of Marketing, 46 (4) Fall: 75 – 90.

40 | P a g e
Ingene, Charles A. (1985). “Labor Productivity in Retailing: What do we know and how do we know it?”
Journal of Marketing, 49 (4) Fall: 99 – 106.
Levy Michael, Weitz Barton A. (2008), Retailing Management, Fifth Edition, Fourteenth reprint, Tata
McGraw Hill. 362 – 395.
Mishra, A. (2011). “Retail Productivity: Concept and Analysis for an Emerging Retail Sector,” IIMB
Working paper series, no 336.
Moreno, Justo de Jorge (2008). “Productivity growth, technical progress and efficiency change in Spanish
retail trade (1995 – 2004): a disaggregated sectoral analysis,” The International Review of Retail,
Distribution and Consumer Research, 18 (1) Feb: 87 – 103.
Oi, Walter. (1990). “Productivity in the Distribution Trades: The Shopper and the Economics of Massed
Reserves,” Paper presented to the NBER Conference on Output Measurement in the Service sector,
Charleston, South Carolina.
Porter, Michael E. (1985). Competitive Advantage, New York: Free Press, 37.
Reardon, James and Vida Irena (1998). “Measuring retail productivity: monetary vs physical input
measures,” The International Review of Retail, Distribution and Consumer Research, 8 (4) Oct: 399 –
413.
Reardon, James, Hasty Ron and Coe Barbara (1996). “The effect of Information Technology on
Productivity in Retailing,” Journal of Retailing, 72 (4): 445 – 461.
Smith, A., Hitchens D. (1985). Productivity in the Distributive Trades, Cambridge University Press,
London.