Measuring PV technical potential and financial feasibility ... · Measuring PV technical potential...
34
Measuring PV technical potential and financial feasibility for U.S. educational buildings Nichole Hanus Gabrielle Wong-Parodi, Inês Azevedo, and Alex Davis USAEE 18. Solar PV: Deployment and Impacts 11/13/2017
-
Upload
dinhnguyet -
Category
Documents
-
view
225 -
download
5
Transcript of Measuring PV technical potential and financial feasibility ... · Measuring PV technical potential...

Measuring PV technical potential
and financial feasibility for U.S.
educational buildings
Nichole Hanus
Gabrielle Wong-Parodi, Inês Azevedo, and Alex Davis
USAEE18. Solar PV: Deployment and Impacts
11/13/2017

2
The U.S. relies on fossil fuels.
Coal, 30%
Nuclear, 20%Renewables, 8%
Hydroelectric, 7%
Petroleum, 0.6%
Other, 0.7%
Natural Gas, 34%
Total U.S. Electricity Generation, 2016 [1]

3
Energy services are the largest contributor to
greenhouse gases in the U.S.
0
1000
2000
3000
4000
5000
6000
7000
8000
9000
199
0
199
1
199
2
199
3
199
4
199
5
199
6
199
7
199
8
199
9
200
0
200
1
200
2
200
3
200
4
200
5
200
6
200
7
200
8
200
9
201
0
201
1
201
2
201
3
201
4
201
5
Em
issio
ns
(mill
ion
me
tric
to
ns o
f C
O2
eq
uiv
ale
nts
)
U.S. Greenhouse Gas Emissions by Economic Sector, 1990-2015 [2]
Commercial
Agriculture
Industry
Transportation
Electricity generation
Transportation = 28%
Industry = 22%
Electricity = 30%

4
School budgets could stretch with electricity
savings.
• The Department of Energy’s Better Buildings Challenge includes
higher education facilities in their goal to reduce building
energy consumption by 20% compared to a 2010 baseline [3]
• Annual energy costs: ~ $7.7 billion, or ~225K students’ tuition [4]
Photo 1: DOE, 2016
Photo 2: AASHE, 2017

5
School budgets could stretch with electricity
savings.
• The Department of Energy’s Better Buildings Challenge includes
higher education facilities in their goal to reduce building
energy consumption by 20% compared to a 2010 baseline [3]
• Annual energy costs: ~ $7.7 billion, or ~225K students’ tuition [4]
Purchase
RECs
Install EE
equipment
Retro-
commissioning
On-site
generation
Photo 7: DOE, 2016
Photo 8: AASHE, 2017
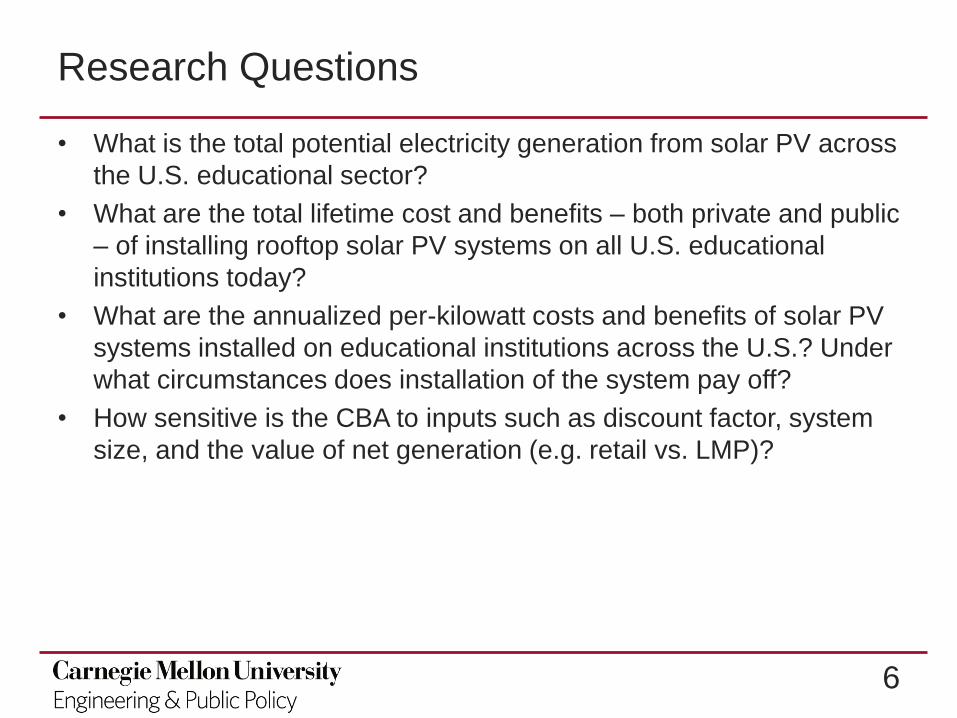
6
Research Questions
• What is the total potential electricity generation from solar PV across
the U.S. educational sector?
• What are the total lifetime cost and benefits – both private and public
– of installing rooftop solar PV systems on all U.S. educational
institutions today?
• What are the annualized per-kilowatt costs and benefits of solar PV
systems installed on educational institutions across the U.S.? Under
what circumstances does installation of the system pay off?
• How sensitive is the CBA to inputs such as discount factor, system
size, and the value of net generation (e.g. retail vs. LMP)?

7
Electricity
Price
($/kWh)
Electricity
Generated
by the PV
Panel,
when
consuming
(kWh/yr)
Electricity
Generated
by the PV
Panel, not
consuming
(kWh/yr)
Value at
which you
sell the
electricity
back to the
grid
($/kWh)
Installation
System
Price
($/kW)
Rebates
($/kW)
System
Size
(kW)
Annual Benefits Upfront Costs
Benefit-Cost Analysis (BCA) at the school level,
to be aggregated at county- or state-level
Using the present value of benefit annuities, where i = 7% or 2% and n = 20 years:
Data and Methods: School net benefits
𝑃1 − 1 + 𝑟 −𝑛
𝑟 Equations modified from Azevedo et al. [5]
8
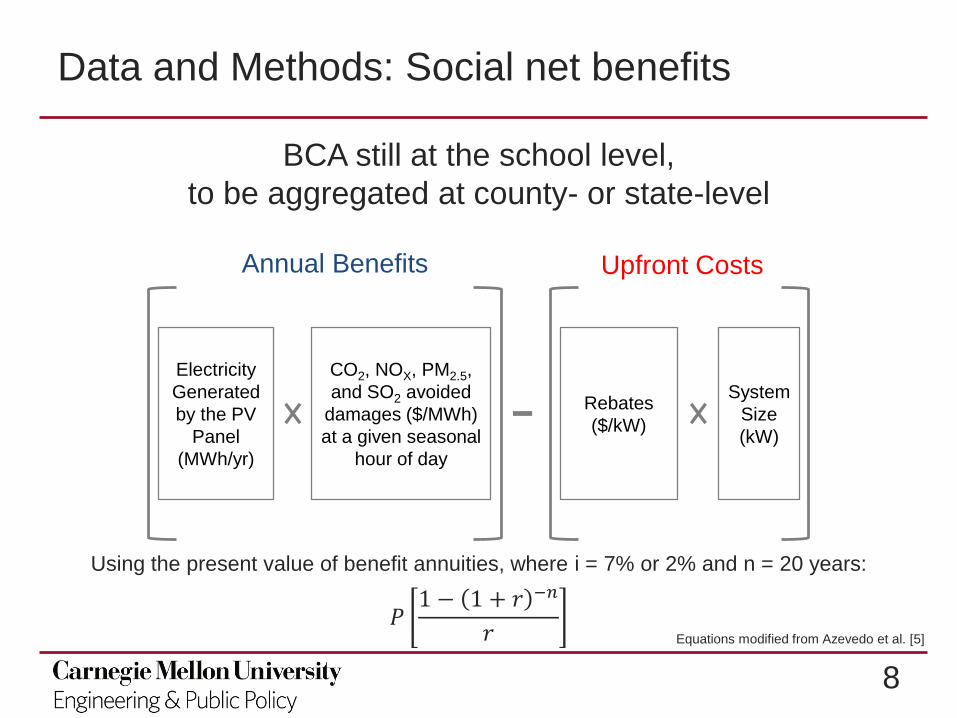
CO2, NOX, PM2.5,
and SO2 avoided
damages ($/MWh)
at a given seasonal
hour of day
Electricity
Generated
by the PV
Panel
(MWh/yr)
Rebates
($/kW)
System
Size
(kW)
Annual Benefits Upfront Costs
BCA still at the school level,
to be aggregated at county- or state-level
Using the present value of benefit annuities, where i = 7% or 2% and n = 20 years:
Data and Methods: Social net benefits
𝑃1 − 1 + 𝑟 −𝑛
𝑟 Equations modified from Azevedo et al. [5]

9
Data and Methods: Building counts
Integrated
Postsecondary
Education Data System
(IPEDS) [6]
Common Core
of Data (CCD) [7]
Private School Universe
Survey (PSS) [8]
Compiler
National Center for
Education Statistics
(NCES) from Department
of Education
NCES NCES
School TypePrivate/Public Higher
EducationK-12 Public K-12 Private
Entries 7,647 102,799 26,983
Year Collected 2015 2015-16 School Year 2011-2012 School Year
Rate of Collection Annually Annually Biennial
After excluding schools with reported latitude and longitude values falling outside of the U.S. boundaries, the combined
dataset includes 134,137 schools.

10
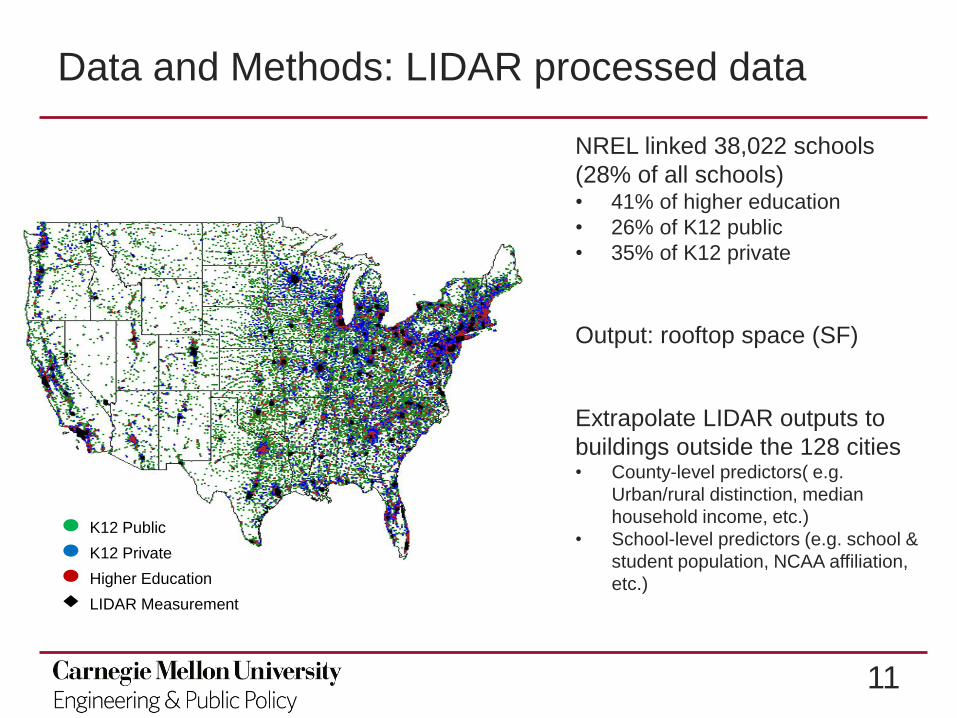
Data and Methods: LIDAR processed data
NREL linked 38,022 schools
(28% of all schools)• 41% of higher education
• 26% of K12 public
• 35% of K12 private
Output: rooftop space (SF)
K12 Public
K12 Private
Higher Education
LIDAR Measurement
11
Data and Methods: LIDAR processed data
NREL linked 38,022 schools
(28% of all schools)• 41% of higher education
• 26% of K12 public
• 35% of K12 private
Output: rooftop space (SF)
Extrapolate LIDAR outputs to
buildings outside the 128 cities• County-level predictors( e.g.
Urban/rural distinction, median
household income, etc.)
• School-level predictors (e.g. school &
student population, NCAA affiliation,
etc.)
K12 Public
K12 Private
Higher Education
LIDAR Measurement
12
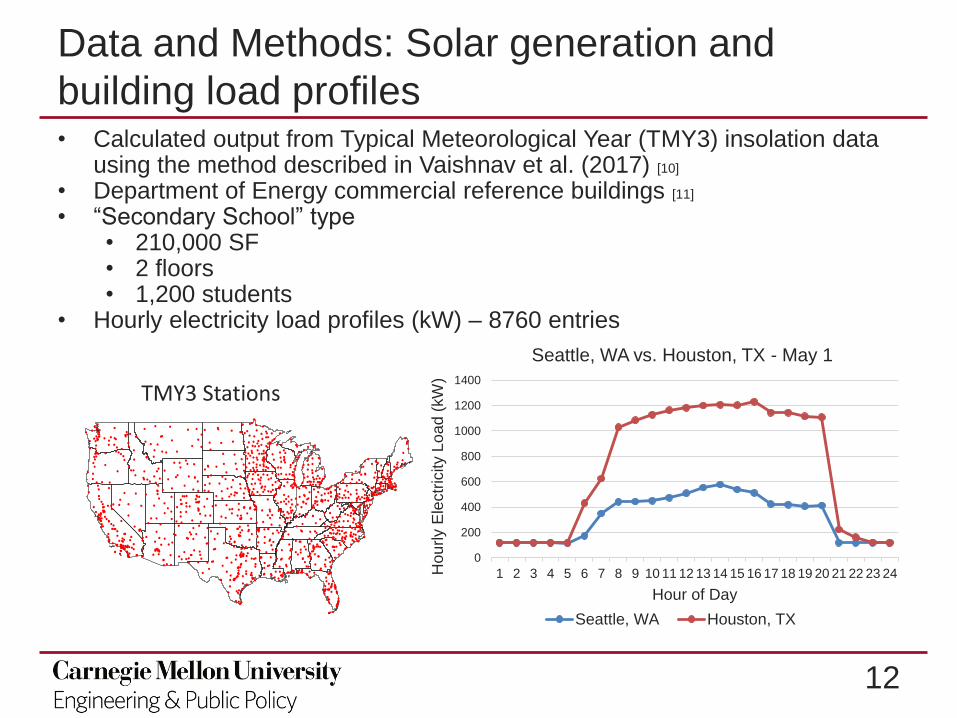
Data and Methods: Solar generation and
building load profiles• Calculated output from Typical Meteorological Year (TMY3) insolation data
using the method described in Vaishnav et al. (2017) [10]
• Department of Energy commercial reference buildings [11]
• “Secondary School” type • 210,000 SF• 2 floors• 1,200 students
• Hourly electricity load profiles (kW) – 8760 entries
TMY3 Stations
0
200
400
600
800
1000
1200
1400
1 2 3 4 5 6 7 8 9 10 11 12 13 14 15 16 17 18 19 20 21 22 23 24Hou
rly E
lectr
icity L
oa
d (
kW
)
Hour of Day
Seattle, WA vs. Houston, TX - May 1
Seattle, WA Houston, TX

13
Data and Methods: Electricity prices and
installation costs• Electricity prices: EIA Annual Average for commercial – can use prices by state
to calculate the value of the portion displaced (or sold back) [12]
• Use the LBNL Tracking the Sun Database (latest project data: 2016) [13]
• Considering school, government, and non-profit projects • 1,046 projects out of 790,000 projects
• 11 states represented
Mean installed price $ in this dataset:
• $3,837/kW
• $559,100 overall

14
Data and Methods: PV Rebates and net-
metering• Referencing the DSIRE database: schools, rebates ($/kW) [14]
• Of the states offering such rebates:• Value ranges from $100/kW to $1,200/kW• Capacity limits range from 5 kW to 1 MW
• Currently, we are assuming that net-metering is available for schools in every state and that excess generation is valued at the LMP.

15
Data and Methods: Estimating environmental &
health benefits• Based on Siler-Evans et al.’s (2013) model in “Regional variations in the health,
environmental, and climate benefits from wind and solar generation” [15,16]
• Azevedo et al. updated model with 2016 emissions for each US fossil fuel power plant > 25 kW [17]
• Estimating Air pollution and Social Impact Using Regression (EASIUR) [18]
• Estimate the dispersion of pollutants and the resulting concentrations in all U.S. counties• Use dose-response function to estimate physical impacts• Monetize impacts (e.g. VSL $6-8.6M, market value of lost commodities, etc.)
Winter Spring Summer Fall
NH
3N
OX
SO
2P
M2.5 500k
100k
50k
10k
5k
1k
500
Ma
rgin
al S
ocia
l C
ost
[$/t
]
Photo 9: EASIUR, 2017

16
Preliminary Results: Positive social net
benefits, negative school net benefits
RQ1. We find a total installed power
electricity generation potential:
• 3,600 GW installed capacity
• 5,500 TWh of annual energy
RQ2. We arrive at the following net
benefits (LMP, 7% discount rate):
• School = -7,700 billion USD
• Social = 2,000 billion USD

17
Preliminary Results: States w/ available space
don’t always have highest energy potential

18
Preliminary Results: School benefits may vary by
retail rates; social benefits driven by energy mix
Some regions may have high
social benefits, but unfavorable
economics for school

19
Next Steps
• Refine regression analysis for available space estimation
• Aggregate results at the county- and state-level to develop
choropleth maps of school and social benefits across the
United States

20
Next Steps
• Refine regression analysis for available space estimation
• Aggregate results at the county- and state-level to develop
choropleth maps of school and social benefits across the
United States
• Further sensitivity analyses for the CBAs
• Discount factor
• Available rebates
• System size
• 20-year emissions/damages levels
• Avoided electricity charges
• Future studies might include interviews with actual decision-
makers to determine if our quantified benefits are valued

21
Thank you :)
22
Acknowledgements
This work was completed with support from the Engineering and Public Policy
Department at Carnegie Mellon. This material is also based upon work supported by
the National Science Foundation Graduate Research Fellowship Program under
Grant No. DGE1252522 and an international travel allowance through the Graduate
Research Opportunities Worldwide (GROW). Any opinions, findings, and conclusions
or recommendations expressed in this material are those of the author(s) and do not
necessarily reflect the views of the National Science Foundation.
My contact:

23
References
Photo links
1. https://betterbuildingssolutioncenter.energy.gov/sites/default/files/attachments/Winter_2016_Progress_Report_0.pdf
2. https://stars.aashe.org/institutions/participants-and-reports/
3. http://barney.ce.cmu.edu/~jinhyok/easiur/
Literature
1. Energy Information Agency (EIA). (2017). Electric Power Monthly (US Energy Information Administration, December 23, 2016). Available from: https://www.eia.gov/electricity/data/browser/
2. Environmental Protection Agency (EPA). (2017). Greenhouse Gas Inventory Data Explorer. Available from:
https://www3.epa.gov/climatechange/ghgemissions/inventoryexplorer/#allsectors/allgas/econsect/current
3. Department of Energy. (2016). Better Buildings Winter 2016 Progress Update. Available from:
https://betterbuildingssolutioncenter.energy.gov/sites/default/files/attachments/Winter_2016_Progress_Report_0.pdf
4. NCES. (2016). Fast Facts. Retrieved from https://nces.ed.gov/fastfacts/display.asp?id=76
5. Azevedo, I., Vaishnav, P., and Horner, N. (2016). Location-specific costs and benefits of rooftop solar photovoltaic. iTeam Presentation at Carnegie Mellon University.
6. NCES. (2015a). Common Core of Data. Retrieved from https://nces.ed.gov/ccd/pubschuniv.asp
7. NCES. (2015b). Integrated Postsecondary Education Data System. Retrieved from https://nces.ed.gov/ipeds/Home/UseTheData
8. NCES. (2015c). Private School Universe Survey. Retrieved from https://nces.ed.gov/surveys/pss/tableswhi.asp
9. Phillips, C., Melius, J., Gagnon, P., Margolis, R., & Elmore, R. (2016). A Data Mining Approach to Estimating Rooftop Photovoltaic Potential in the U . S ., 1–25.
10. Vaishnav, P., Horner, N., & Azevedo, I. L. (2017) Was it worthwhile? Where have the benefits of rooftop solar photovoltaic generation exceeded the cost? Environmental Research Letters.
11. DOE. (2017). Commercial Reference Buildings. Retrieved from https://energy.gov/eere/buildings/commercial-reference-buildings%0A
12. OpenEI. (2017). Utility Rate Database. Retrieved from http://en.openei.org/wiki/Utility_Rate_Database
13. Barbose, G. L., & Darghouth, N. R. Tracking the Sun IX: The Installed Price of Residential and Non-residential Photovalic Systems in the United States (Washington: US Department of
Energy, 2016). available at emp. lbl. gov/publications/trackin.
14. DSIRE database. Available at: http://ncsolarcen-prod.s3.amazonaws.com/wp-content/uploads/2017/03/Renewable-Portfolio-Standards.pdf
15. Siler-Evans, K., Azevedo, I. L., Morgan, M.G, Apt, J. (2013). Regional variations in the health, environmental, and climate benefits from wind and solar generation, Proceedings of the
National Academy of Sciences, 110 (29), 11768-11773
16. Siler-Evans. K., Azevedo, I.L., Morgan, M.G., (2012). Marginal emissions factors for the US electricity system. Environmental Science & Technology, 46 (9): 4742–4748.
17. Azevedo IL, Horner NC, Siler-Evans K, Vaishnav PT (2017). Electricity Marginal Factor Estimates. Center For Climate and Energy Decision Making. Pittsburgh: Carnegie Mellon University.
http://cedmcenter.org
18. Heo, J., Adams, P. J., & Gao, H. O. (2016a). Public Health Costs of Primary PM2.5 and Inorganic PM2.5 Precursor Emissions in the United States. Environmental Science and Technology,
50(11), 6061–6070. https://doi.org/10.1021/acs.est.5b06125

24
What role do schools play? [3]
Office20%
Mercantile17%
Food sales & service
11%
Education11%
Health care9%
Public8%
Other8%
Lodging7%
Warehouse & Storage
7%
Religious worship
2%
U.S. Electricity Consumption, 2012 (kWh)

25
What role do schools play? [3]
Office20%
Mercantile17%
Food sales & service
11%
Education11%
Health care9%
Public8%
Other8%
Lodging7%
Warehouse & Storage
7%
Religious worship
2%
U.S. Electricity Consumption, 2012 (kWh)
Office19%
Mercantile13%
Food sales & service
4%
Education14%
Health care5%
Public8%
Other10%
Lodging7%
Warehouse & Storage
15%
Religious worship
5%
U.S. Floor Space, 2012 (ft2)
26
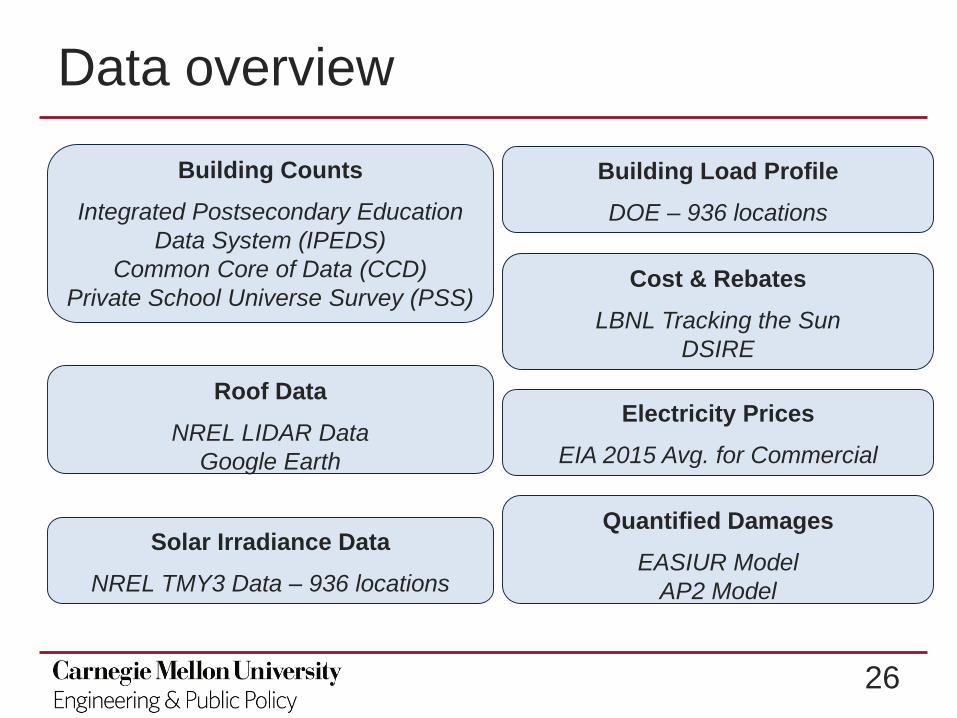
Data overview
Building Counts
Integrated Postsecondary Education
Data System (IPEDS)
Common Core of Data (CCD)
Private School Universe Survey (PSS)
Solar Irradiance Data
NREL TMY3 Data – 936 locations
Building Load Profile
DOE – 936 locations
Cost & Rebates
LBNL Tracking the Sun
DSIRE
Electricity Prices
EIA 2015 Avg. for Commercial
Roof Data
NREL LIDAR Data
Google Earth
Quantified Damages
EASIUR Model
AP2 Model

27
What role does solar play?
• NREL reports that rooftop PV can deliver 39% of the total national electric-sector sales [6]
• 1,118 GW of installed capacity
• 1,432 TWh of annual energy
• In an economic analysis, NREL finds that building types with the highest breakeven price are small offices, warehouses, and schools [7]
• Barbose and Darghouth found that installed prices are higher for tax-exempt customer sites than for for-profit commercial sites [8]
• <= 500 kW: Δ $0.3/W
• > 500 kW: Δ $1.1/W

28
Model
overview
29
Available roof space
• NREL received LIDAR data from the Department
of Homeland Security (DHS) Homeland Security
Infrastructure Program (HSIP) [13]
• Covers 128 cities – representing 23% of U.S.
buildings and 40% of the U.S. population [13]
• Data gathered between 2006 and 2014 using
airplanes and drones [13]

30
LIDAR method
• NREL received LIDAR data from the Department of Homeland Security (DHS) Homeland Security Infrastructure Program (HSIP) [18]
• Covers 128 cities – representing 23% of U.S. buildings and 40% of the U.S. population [18]
• Data gathered between 2006 and 2014 using airplanes and drones [18]
• LIDAR uses light in the form of a pulsed laser to measure variable distances to earth [19]
• NREL uses LIDAR data in combination with GIS methods to characterize suitable rooftop space [11]

31
Electricity Prices - EIA
0
5
10
15
20
25
30
OK
TX ID
WA
VA
AR
LA
WV
NC
UT
ND
OR IL
NE
SD
MO IA
WY
NV
KY
MN IN PA
FL
GA
CO
OH
KS
SC
MT
TN
DE
NM AZ
MI
US
MS
AL
US
WI
MD
DC
NJ
ME
VT
NH
NY
MA
CA RI
CT
AK HI
Ele
ctr
icity P
rice (
cents
/kW
h)
Commercial Retail Electricity Price - 2015
EIA Annual Average for commercial – can use prices by state to calculate the
value of the portion displaced (or sold back) [16]

32
Net Metering - DSIRE• Net metering agreements vary widely across the U.S. [23]
• Could assume two scenarios for the electricity sold back to the grid:• Retail prices• Local marginal price (LMP)
Photo 13: DSIRE

33
Installation costs and rebates
• Use the LBNL Tracking the Sun Database (latest project data: 2015) [13]
• Considering school, government, and non-profit projects • 600 projects out of 800,000 projects
• 10 states represented
Mean installed price $ in this dataset:
• $4,080/kW
• $750,600 overall
Mean rebate or grant $ in this dataset:
• $184/kW
• $8,492 overall

34
Quantified costs and benefits
𝑆𝑐ℎ𝑜𝑜𝑙𝐶𝑜𝑠𝑡𝑠𝑠 = 𝑖𝑠 − 𝑔𝑠
𝑆𝑜𝑐𝑖𝑎𝑙𝐶𝑜𝑠𝑡𝑠𝑠 = 𝑔𝑠
𝑆𝑐ℎ𝑜𝑜𝑙𝐵𝑒𝑛𝑒𝑓𝑖𝑡𝑠𝑠 = 𝑦=2016
𝑦=2036
ℎ=1
ℎ=8760
𝑜𝑠,ℎ × 𝑝𝑠 + ℎ=1
ℎ=8760
𝑛𝑠,ℎ × 𝑙𝑠,ℎ ( 1 + 𝑑 𝑦−2016
𝑆𝑜𝑐𝑖𝑎𝑙𝐵𝑒𝑛𝑒𝑓𝑖𝑡𝑠𝑠 = 𝑦=2016
𝑦=2036
ℎ=1
ℎ=8760
𝑜𝑠,ℎ + 𝑛𝑠,ℎ × 𝑚(2016 𝑠,ℎ /(1 + 𝑑 𝑦−2016
is = total system, s, installation cost
gs = total system, s, rebate
os,h = portion of the output, in kWh, of the electricity generated by a system, s, in hour, h, of a TMY
ps,y = is the state annual-average commercial retail rate of electricity in year y (set to latest available: 2015)
ns,h = output in kWh of the electricity generated by system of a TMY that exceeds consumption and is sold back to the grid
ls,h = average LMP that prevailed in the state in which the system was installed in hour, h, of 2015
m(2016)s,h = marginal health and environmental damage, expressed in 2016 $ per kWh, avoided by offsetting
a kWh of fossil fuel generation in hour h of year y in the eGrid region where the system s is
located
d = annual discount factor (discount rate set to 7%); therefore, factor is set to (1/1.07)
𝑆𝑐ℎ𝑜𝑜𝑙𝑁𝑒𝑡𝐵𝑒𝑛𝑒𝑓𝑖𝑡𝑠 =
𝑠
𝑆𝑐ℎ𝑜𝑜𝑙𝐵𝑒𝑛𝑒𝑓𝑖𝑡𝑠𝑠 − 𝑆𝑐ℎ𝑜𝑜𝑙𝐶𝑜𝑠𝑡𝑠𝑠 ∀ 𝑎𝑔𝑔𝑟𝑒𝑔𝑎𝑡𝑖𝑜𝑛 𝑢𝑛𝑖𝑡
𝑆𝑜𝑐𝑖𝑎𝑙𝑁𝑒𝑡𝐵𝑒𝑛𝑒𝑓𝑖𝑡𝑠 =
𝑠
𝑆𝑜𝑐𝑖𝑎𝑙𝐵𝑒𝑛𝑒𝑓𝑖𝑡𝑠𝑠 − 𝑆𝑜𝑐𝑖𝑎𝑙𝐶𝑜𝑠𝑡𝑠𝑠 ∀ 𝑎𝑔𝑔𝑟𝑒𝑔𝑎𝑡𝑖𝑜𝑛 𝑢𝑛𝑖𝑡