Professor Sludge Guitar Academy Professor Sludge instruction
Upload
rosamond-pittsCategory
view
215download
0
MEASURING OXYGEN TRANSFERIN AN ACTIVATED SLUDGE TANK
IN OPERATION
MEASURING OXYGEN TRANSFERIN AN ACTIVATED SLUDGE TANK
IN OPERATION
UNIVERSITY OF AALBORG, SEPTEMBER 2009“ERASMUS TEACHING STAFF VISIT” - SEMINAR B
Salvatore Nicosia, Assoc. Prof. in Environmental EngineeringDIIAA, Dipartimento di Ingegneria Idraulicaed Applicazioni Ambientali, Università di Palermo Viale delle Scienze, 90128 Palermo, ITALY([email protected])
2
THE PHENOMENA AND REACTIONS GENERALLY MAKING UP THE UNIT OPERATION OF OXYGEN TRANSFER (PICTORIAL)
Waste water in with its DO
Mixed liquor out with the same DO as in the tank
O2 from atmosphere
O2 supplied
Recycle sludge with its DO
Non-utilized O2
O2 transferred to mixed liquor and used up
ACTIVATED SLUDGE TANKACTIVATED SLUDGE TANK
VML
3
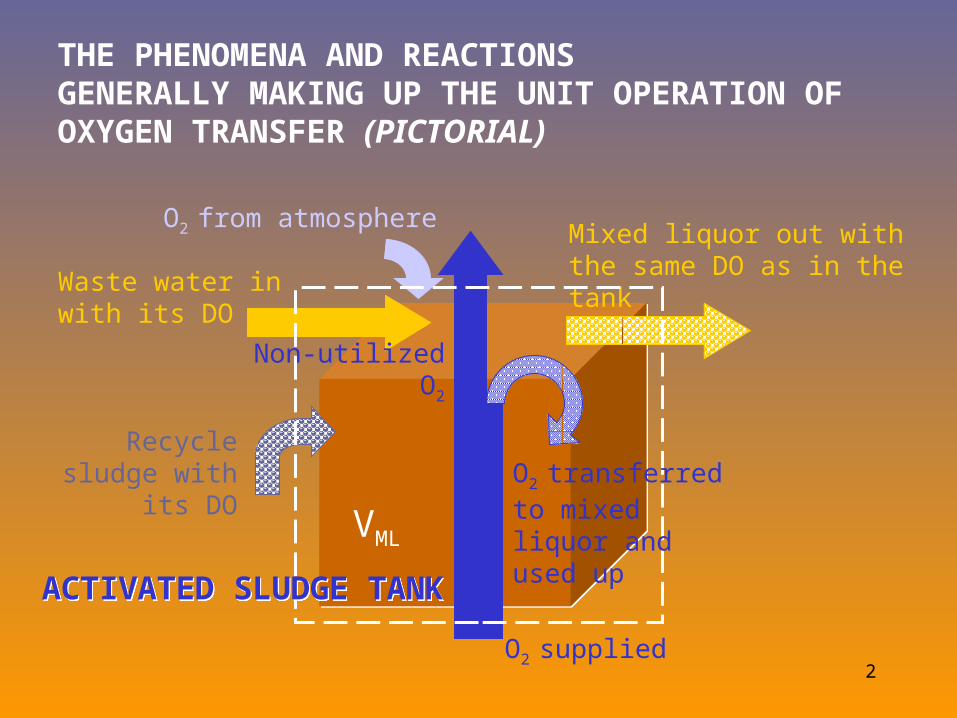
THE FLUXES OF OXYGEN MASS TRANSFER AND USE (QUANTITATIVE; WO as kgO2/h)
ACTIVATED SLUDGE TANKACTIVATED SLUDGE TANK
Win,atm = kLaatm (Ceq – CML) VML
Wtransf = kLaML
(Ceq – CML) VMLWin,rec = Qrec Crec
Wout,ML = (Q + Qrec) CML
Wout,atm
VML
Win,aer
Win,ww = Q Cin
4
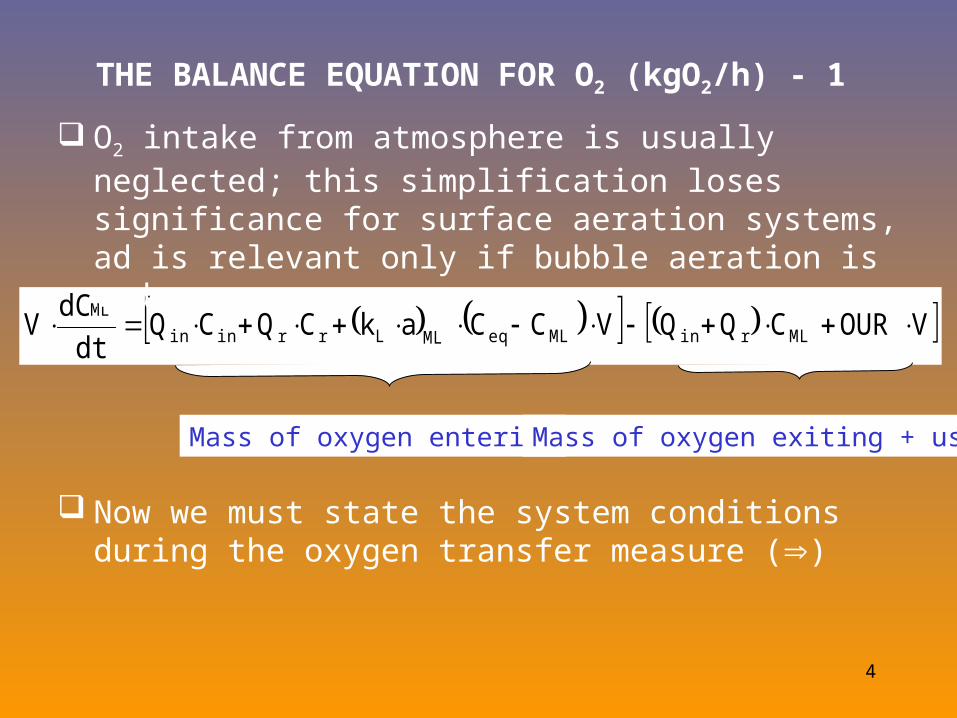
THE BALANCE EQUATION FOR O2 (kgO2/h) - 1
VOURCQQVCCakCQCQdt
dCV MLrinMLeqMLLrrinin
ML
Mass of oxygen entering Mass of oxygen exiting + used
Now we must state the system conditions during the oxygen transfer measure ()
O2 intake from atmosphere is usually neglected; this simplification loses significance for surface aeration systems, ad is relevant only if bubble aeration is made.
5
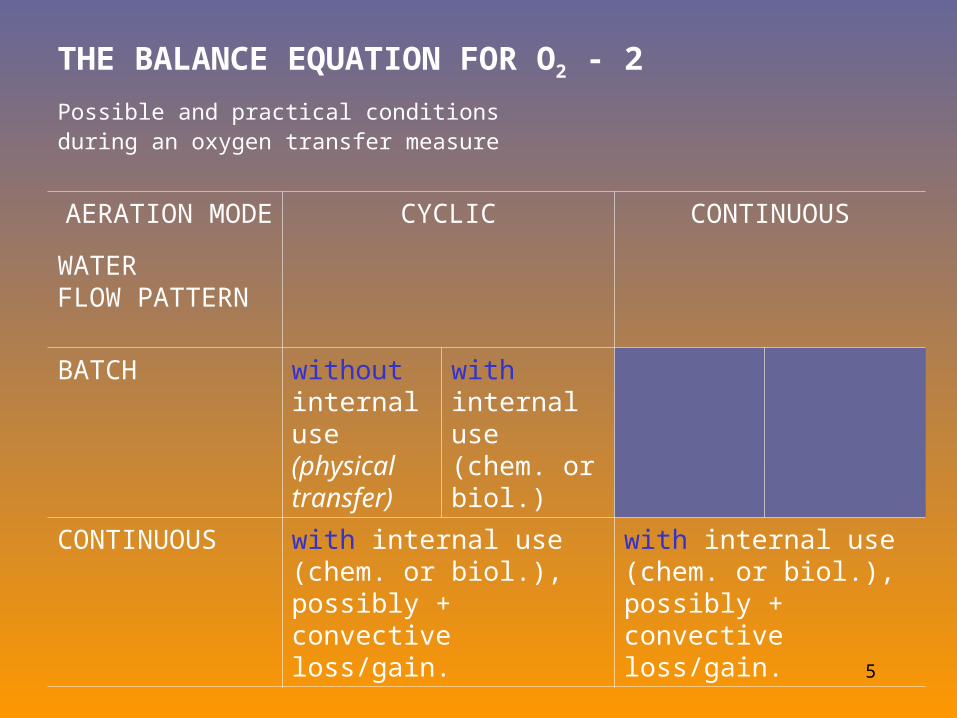
THE BALANCE EQUATION FOR O2 - 2
AERATION MODE
WATER FLOW PATTERN
CYCLIC CONTINUOUS
BATCH without internal use (physical transfer)
with internal use (chem. or biol.)
CONTINUOUS with internal use (chem. or biol.), possibly + convective loss/gain.
with internal use (chem. or biol.), possibly + convective loss/gain.
Possible and practical conditions during an oxygen transfer measure
6
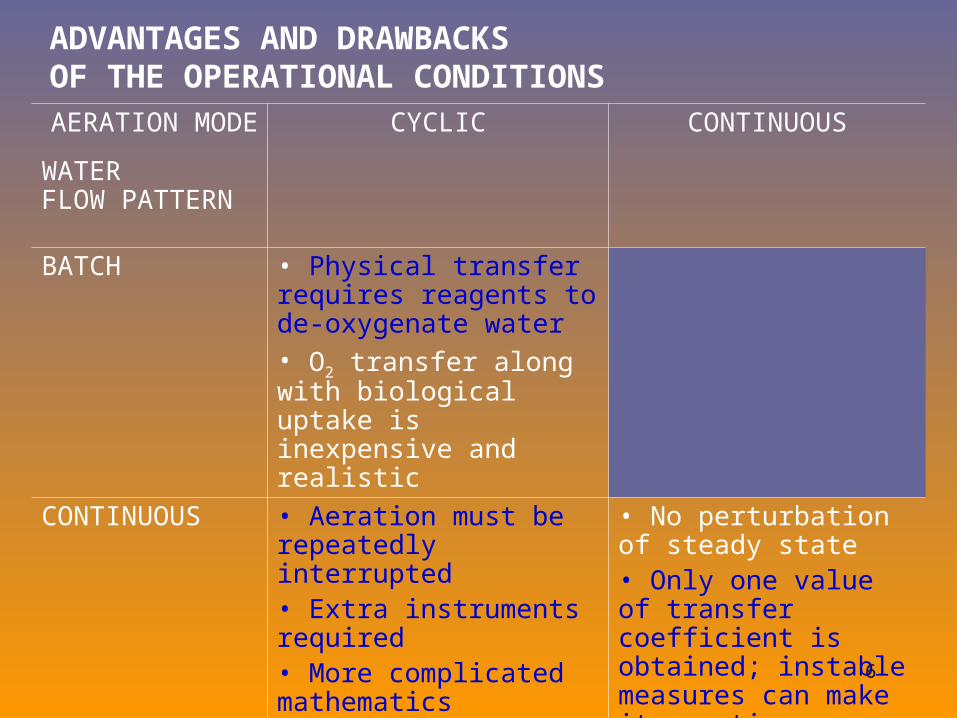
ADVANTAGES AND DRAWBACKS OF THE OPERATIONAL CONDITIONS
AERATION MODE
WATER FLOW PATTERN
CYCLIC CONTINUOUS
BATCH • Physical transfer requires reagents to de-oxygenate water• O2 transfer along with biological uptake is inexpensive and realistic
CONTINUOUS • Aeration must be repeatedly interrupted • Extra instruments required • More complicated mathematics
• No perturbation of steady state • Only one value of transfer coefficient is obtained; instable measures can make it erratic
7
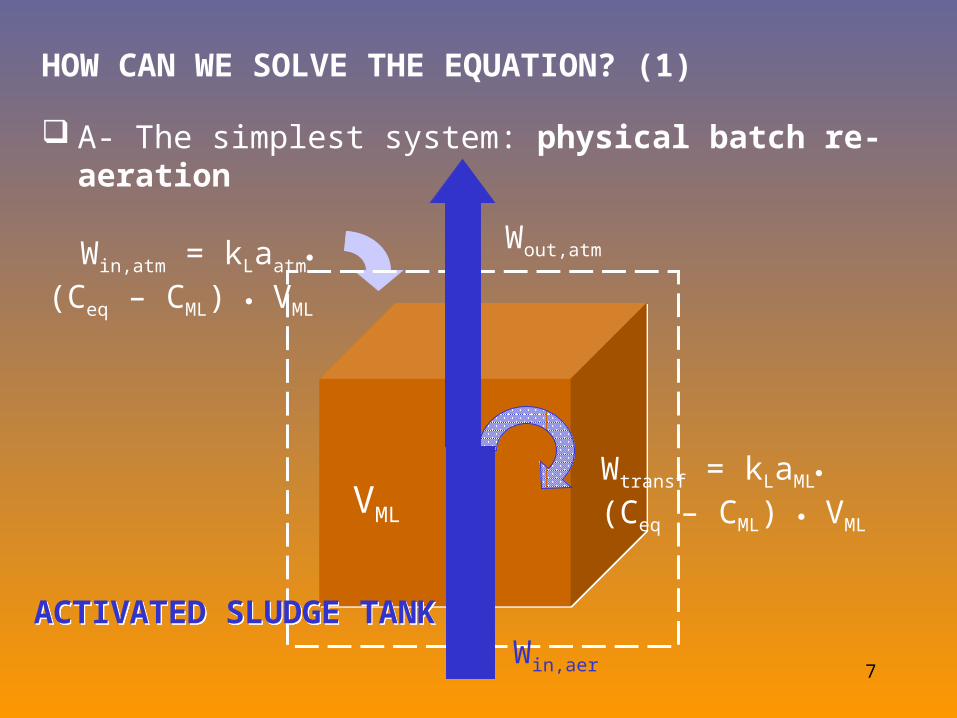
HOW CAN WE SOLVE THE EQUATION? (1)
A- The simplest system: physical batch re-aeration
Wtransf = kLaML
(Ceq – CML) VML
Wout,atm
VML
Win,aer
ACTIVATED SLUDGE TANKACTIVATED SLUDGE TANK
Win,atm = kLaatm (Ceq – CML) VML

8
HOW CAN WE SOLVE THE EQUATION? (2)
Physical batch re-aeration (cont)
VCCakdt
dCV MLeqMLL
ML VCCak
dt
dCV MLeqMLL
ML
MLeqMLLMLeq CCak -
dt
CCd
MLeqMLLMLeq CCak -
dt
CCd
) t-(t a(-k exp CC CC 0L0eqeq ) t-(t a(-k exp CC CC 0L0eqeq
0MLL
ML,0eq
MLeq ttak - CC
CC
0MLLML,0eq
MLeq ttak - CC
CC
By changing the variable CML into (Csat – CML), where Csat is the actual saturation concentration in that basin, not foreseeable theoretically we get:
a 1st order differential equation, linear, homogeneous, which yields
or, as well

9
RATIOS OF DO DIFFERENCES (NAT. LOG)
-2
-1,5
-1
-0,5
0
0 0,2 0,4 0,6 0,8 1t, h
VIEWING IT GRAPHICALLY… (1)
• Graphically, kLa is the slope of the straight line that interpolates the DO concentrations.• In order to draw the line we must assign Csat a value, which is an asymptotic one we can estimate but not measure it.• Ceq is taken as the value that makes best adhere the experimental points to the interpolating line.• It is advisable to make Ceq range between the highest DO value measured during the experiment and the concentration in clean water.
10
PHYSICAL REOXYGENATION (kLa = 2 1/h; Ceq = 4)
0,00
0,50
1,00
1,50
2,00
2,50
3,00
3,50
4,00
0 0,2 0,4 0,6 0,8 1
t,h
C,
(g/c
m)
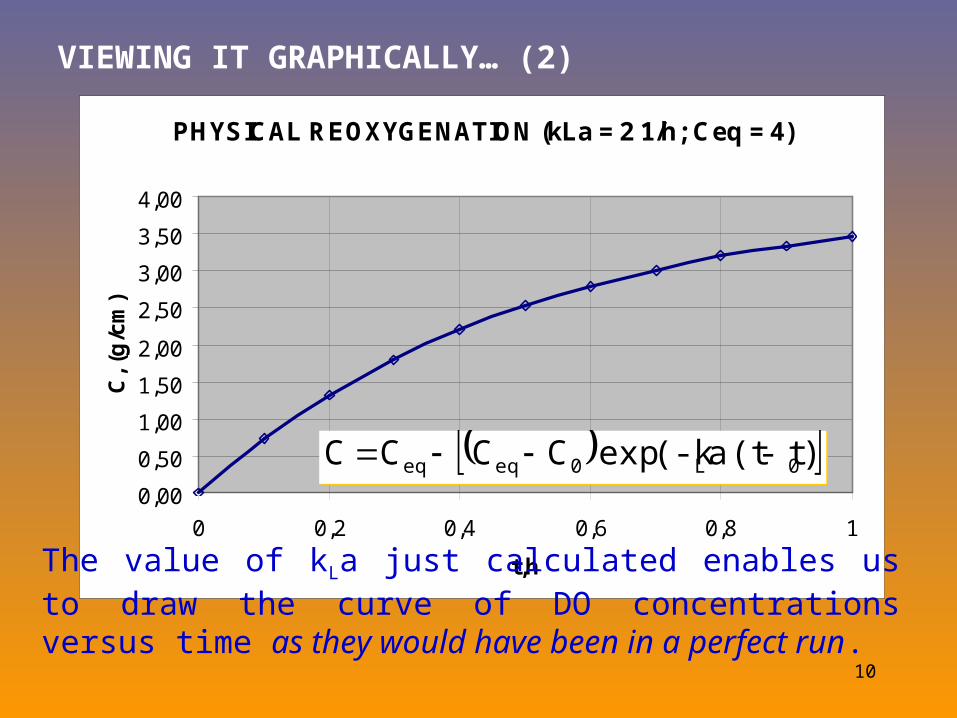
VIEWING IT GRAPHICALLY… (2)
The value of kLa just calculated enables us to draw the curve of DO concentrations versus time as they would have been in a perfect run.
) t-(t a(-k exp CC CC 0L0eqeq ) t-(t a(-k exp CC CC 0L0eqeq
11
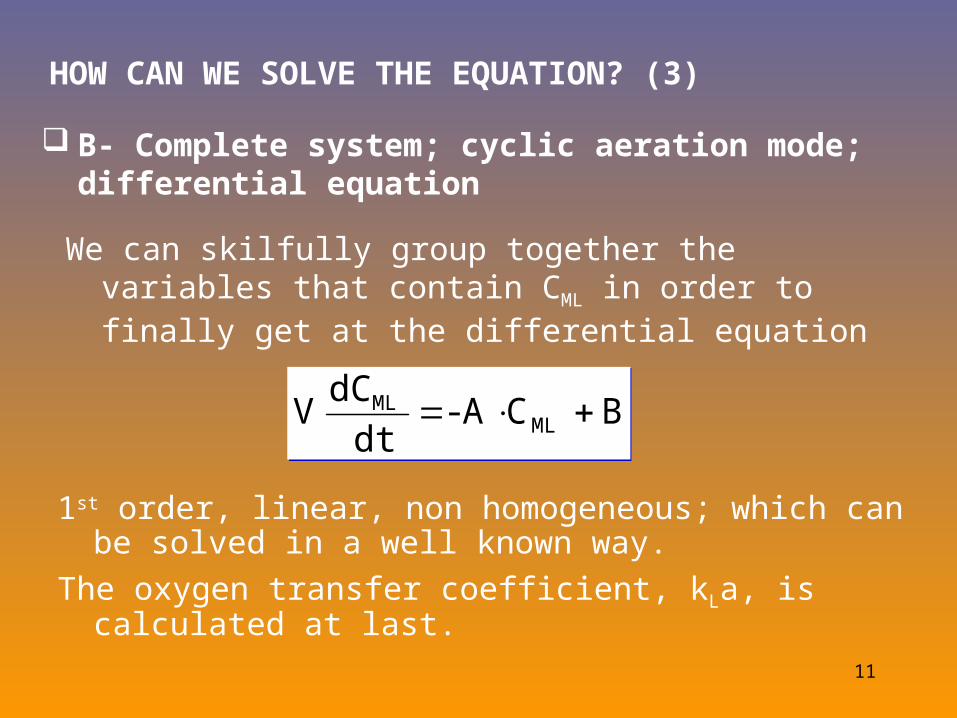
HOW CAN WE SOLVE THE EQUATION? (3)
B- Complete system; cyclic aeration mode; differential equation
B CA - dt
dC V ML
ML B CA - dt
dC V ML
ML
1st order, linear, non homogeneous; which can be solved in a well known way.
The oxygen transfer coefficient, kLa, is calculated at last.
We can skilfully group together the variables that contain CML in order to finally get at the differential equation
12
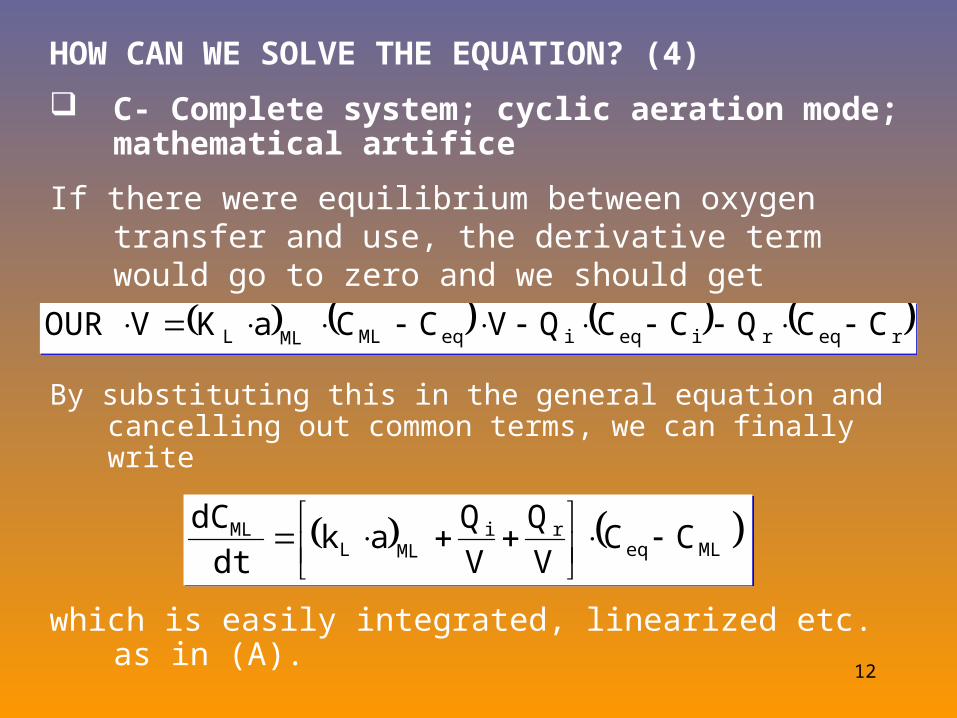
HOW CAN WE SOLVE THE EQUATION? (4)
By substituting this in the general equation and cancelling out common terms, we can finally write
reqrieqieqMLMLL CCQCCQVCCaKVOUR reqrieqieqMLMLL CCQCCQVCCaKVOUR
CCV
Q
V
Qak
dt
dCMLeq
riMLL
ML
CC
V
Q
V
Qak
dt
dCMLeq
riMLL
ML
C- Complete system; cyclic aeration mode; mathematical artifice
If there were equilibrium between oxygen transfer and use, the derivative term would go to zero and we should get
which is easily integrated, linearized etc. as in (A).
13
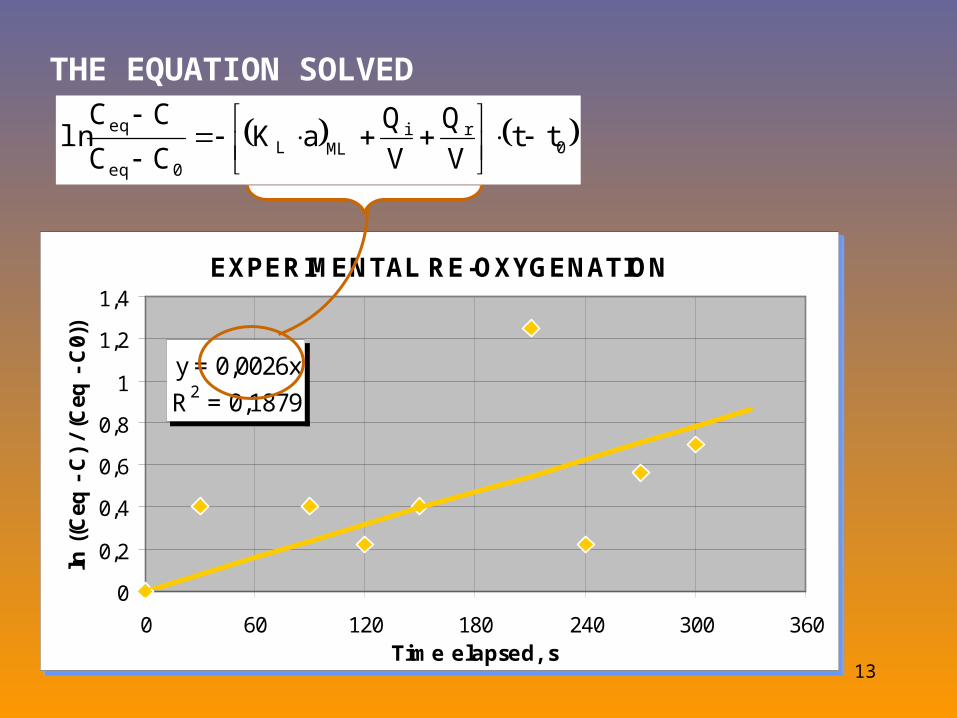
THE EQUATION SOLVED
0ri
MLL0eq
eq ttV
Q
V
QaK
CC
CCln
EXPERIMENTAL RE-OXYGENATION
y = 0,0026x
R2 = 0,1879
0
0,2
0,4
0,6
0,8
1
1,2
1,4
0 60 120 180 240 300 360Time elapsed, s
ln (
(Ceq
- C
) /
(Ceq
- C
0))
EXPERIMENTAL RE-OXYGENATION
y = 0,0026x
R2 = 0,1879
0
0,2
0,4
0,6
0,8
1
1,2
1,4
0 60 120 180 240 300 360Time elapsed, s
ln (
(Ceq
- C
) /
(Ceq
- C
0))
14
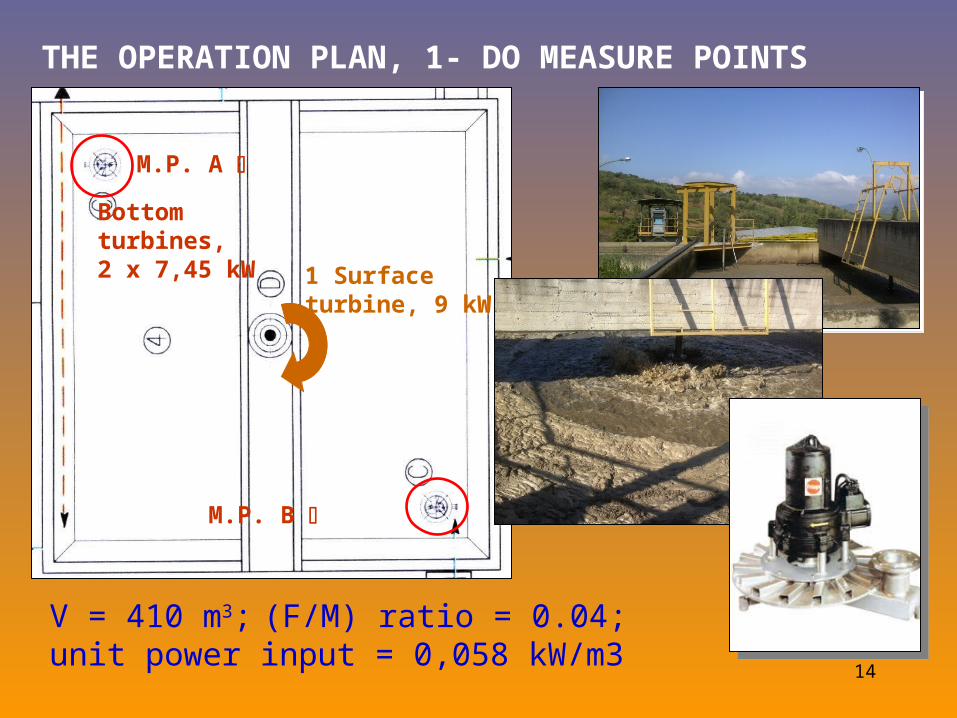
THE OPERATION PLAN, 1- DO MEASURE POINTS
V = 410 m3; (F/M) ratio = 0.04; unit power input = 0,058 kW/m3
Bottom turbines, 2 x 7,45 kW 1 Surface
turbine, 9 kW
M.P. A
M.P. B
15
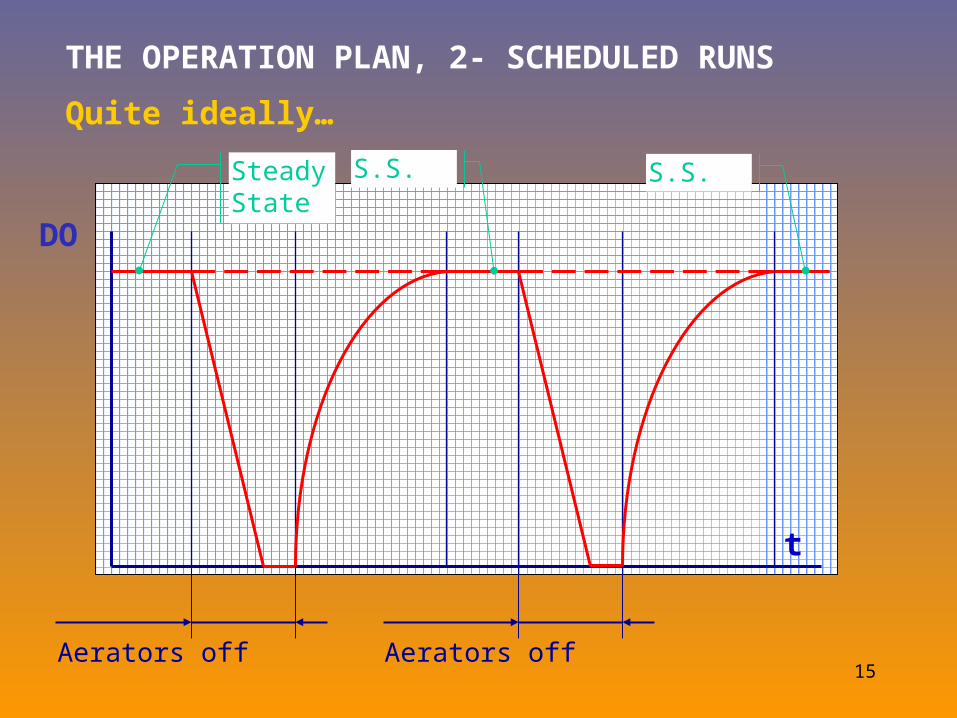
THE OPERATION PLAN, 2- SCHEDULED RUNS
Steady State
S.S. S.S.
Quite ideally…
Aerators off Aerators off
t
DO
16
THE FIGURES OF OUR CASE-STUDY
• The slope of the straight interpolar line is 0,0026 s-1 = 9,36 h-1
• The ratio (Qi + Qr)/V = (8 + 8) / 410 = 0,04 h-1
• Therefore, the coefficient of oxygen transfer of the whole of those aeration machines in that basin is 9,32 (gO2transf/m3) / ((gO2deficit/m3)h).
• As the rated coefficient in clean water of the 2 bottom turbines together is 20;
even neglecting as a first approximation the effect of the small surface turbine;
the efficiency of the aeration system is lower than 50%.
17
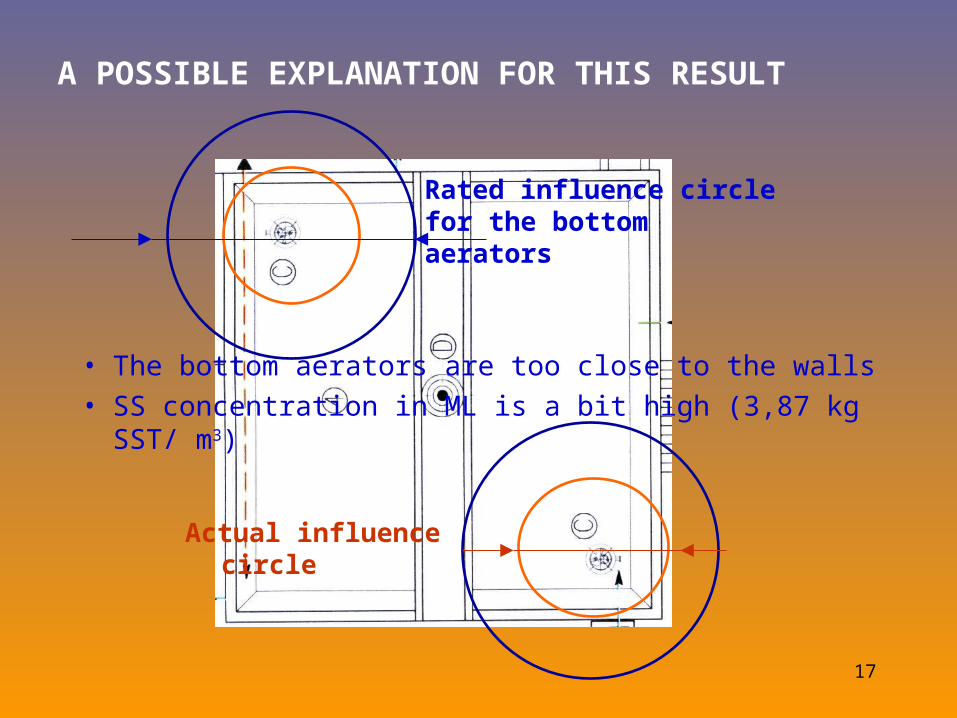
A POSSIBLE EXPLANATION FOR THIS RESULT
• The bottom aerators are too close to the walls• SS concentration in ML is a bit high (3,87 kg SST/
m3)
Rated influence circle for the bottom aerators
Actual influence circle
18
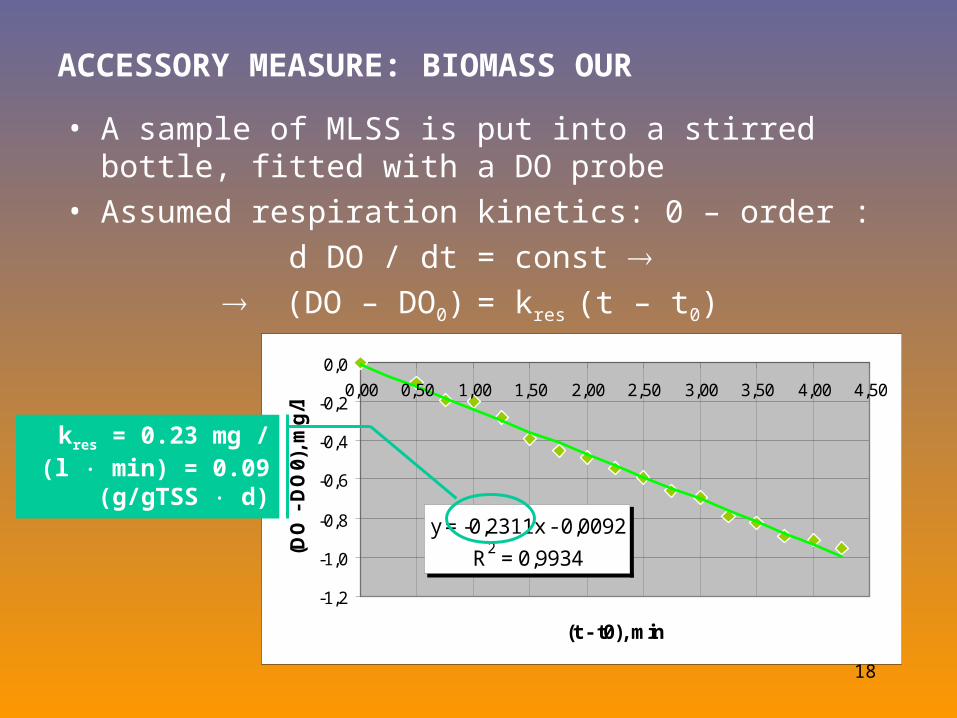
ACCESSORY MEASURE: BIOMASS OUR
y = -0,2311x - 0,0092
R2 = 0,9934
-1,2
-1,0
-0,8
-0,6
-0,4
-0,2
0,0
0,00 0,50 1,00 1,50 2,00 2,50 3,00 3,50 4,00 4,50
(t - t0), min
(DO
- D
O0)
, mg
/l
• A sample of MLSS is put into a stirred bottle, fitted with a DO probe
• Assumed respiration kinetics: 0 – order :d DO / dt = const
(DO – DO0) = kres (t – t0)
kres = 0.23 mg / (l min) = 0.09 (g/gTSS d)
19
APPENDIX

20
L’ÉVOLUTION THÉORIQUE DES CONCENTRATIONS D’O.D. AU COURS DU TEMPSDe l’équation intégrée on peut calculer :
On voit que la concentration en oxygène à saturation dans les conditions de travail, C* n’est rattrapée que après un temps théoriquement infini.
On obtient aussi la vitesse instantanée de réoxygénation de l’eau :
0L0L tt ak exp C *C. ak dt
dC
et le flux unitaire d’oxygène transféré qui est :
)) t-(t a(-k exp C *C. ak)V/ (W 0L0LRO2
où VR est le volume du bassin d‘aération.On obtient ainsi le diagramme suivant qui reconstruit l’essai expérimental.
) t-(t a(-k exp CC CC 0L0eqeq ) t-(t a(-k exp CC CC 0L0eqeq