MEASURING LONG-RUN DEMAND ELASTICITIES FOR PETROLEUM PRODUCTS IN OPEC 1 Carol A. Dahl, Professor,...
23
MEASURING LONG-RUN DEMAND ELASTICITIES FOR PETROLEUM PRODUCTS IN OPEC 1 Carol A. Dahl, Professor, Mineral and Energy Economics Program, Colorado School of Mines, Golden Colorado, USA and Visiting Professor, Department of Economics, King Saud University and Afaf A. Abaalkhail, Lecturer, Department of Economics, College of Business Administration, King Saud University, Riyadh, Saudi Arabia,
-
Upload
emma-sabina-carpenter -
Category
Documents
-
view
214 -
download
0
Transcript of MEASURING LONG-RUN DEMAND ELASTICITIES FOR PETROLEUM PRODUCTS IN OPEC 1 Carol A. Dahl, Professor,...

1
MEASURING LONG-RUN DEMAND ELASTICITIES FOR PETROLEUM
PRODUCTS IN OPEC
Carol A. Dahl, Professor, Mineral and Energy Economics Program, Colorado School of Mines, Golden Colorado, USA and Visiting Professor,
Department of Economics, King Saud University and
Afaf A. Abaalkhail, Lecturer, Department of Economics, College of Business Administration, King
Saud University, Riyadh, Saudi Arabia,

2
Coming Attractions:
Global Growth in Oil Products compared to OPEC
Only Asia Pacific has grown faster
Compare model types
Talk about scope of project
time periods
products
countries
Issues from initial analysis
Some observations on Saudi Arabia

3Global Growth in Oil Products compared to
OPEC

4Models
Charemza and Deadman (1997)
Where O = the consumption of the oil product
P =the price of the energy productY = some measure of economic activity such as GDPt = an indice for the observation, which is time in a time series estimatet – 1 = the variable last period

5
Scope of Project
1980-2009Gasoline, Kerosene, Diesel, Residual Total Oil ProductsCountries
Algeria, Angola, Ecuador, Indonesia, Iran, Kuwait,Libya, Nigeria, Qatar, UAE, Venezuela
Today talk about project in context of Saudi Arabia

6Saudi Arabia Battling Russia for the Lead
(Source: BP Statistics)

7Oil's Importance to Saudi Arabia (2009)
(Source: Saudia Arabian Monetary Authority)
>80% of merchandise exports >80% of government revenues >15% of gross fixed capital formation ~1/4 Gross Domestic Product (GDP)

8
Issues to Consider
Measure of income?GDP erratic from oil cycles
permanent incomenon oil income
Population composition?women joining labor forceguest workers
What price?What currency?
local PPP better than exchange rates

9
Which Income?

10
Saudi Product Consumption

11
Domestic and Guest Workers

12
Oil and Product Prices

13
0.00
20.00
40.00
60.00
80.00
100.00
120.00
140.00 Real GDP Per Capita (1000 Riyals)

14
Which Price

15Gasoline 1980-2009
1. LnQ/Pop = β1 + β2LnP + β3LnY/Pop2. LnQ = β1 + β2LnP + β3LnY
1. Dep=ln(G/Pop) Coefficient t-Statistic C -0.657 -0.715Pg -0.199 -3.654Y/Pop -0.704 -4.043R2 = 0.39
2. Dep=ln(G) Coefficient t-Statistic C -6.947 -7.678Pg 0.173 2.690Y 1.486 9.639R2 = 0.810

16
Gasoline 1981-2009 (LE)
3. LnQ = β1 + β2LnP + β3LnY + β4LnE-13. Dep = Ln(G) Coefficient t Statistic LR
C -1.050 -3.051 Pg -0.045 -2.820 -0.33Y 0.240 3.507 1.84G-1 0.887 19.557R2 = 0.996
17
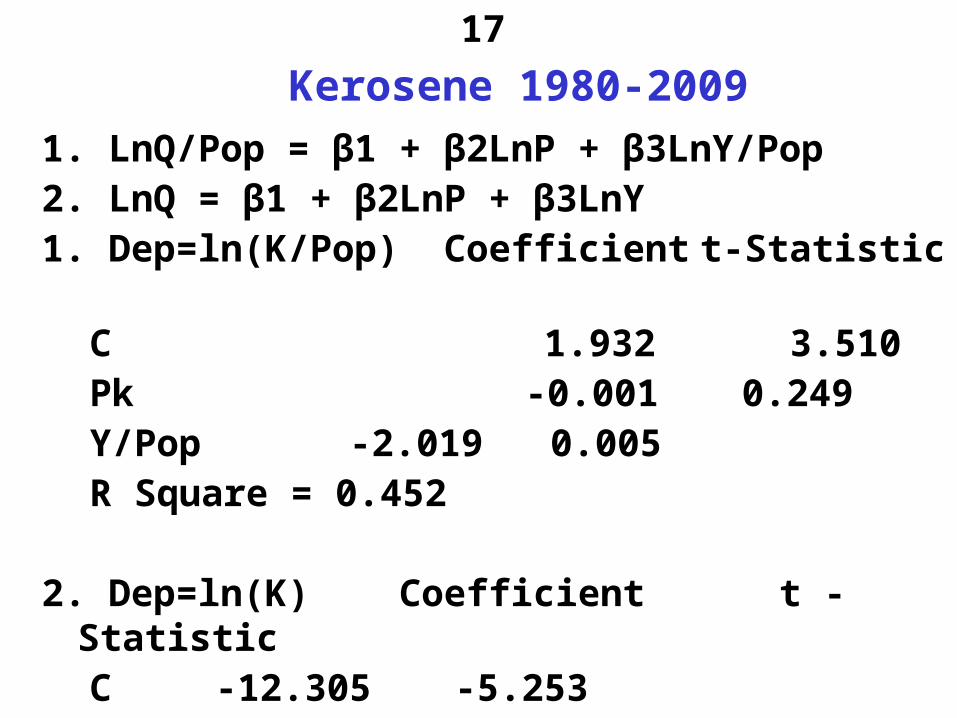
Kerosene 1980-2009
1. LnQ/Pop = β1 + β2LnP + β3LnY/Pop2. LnQ = β1 + β2LnP + β3LnY 1. Dep=ln(K/Pop) Coefficient t-Statistic
C 1.932 3.510Pk -0.001 0.249Y/Pop -2.019 0.005R Square = 0.452
2. Dep=ln(K) Coefficient t -Statistic C -12.305 -5.253Pk 0.667 3.234Y 2.108 5.157R Square = 0.671

18Kerosene LE 1981-2009
~3/4 domestic jet, ~1/4 residential
3. LnK = β1 + β2LnP + β3LnY + β4LnK-13. Dep = Ln(K) Coefficient t Statistic LR
C -0.586 -0.333Pk -0.068 -0.542 -0.56Y 0.155 0.512 1.27K-1 0.878 8.543

19Diesel/Gasoil (1980-2009)
~ 50% Electricity and Industry, Transport 50%1. LnQ/Pop = β1 + β2LnP + β3LnY/Pop2. LnQ = β1 + β2LnP + β3LnY1. Dep=ln(D/Pop) Coefficient t-Statistic
C -0.719 -2.459Pd -0.151 -3.951Y/Pop -0.423 -3.083R Square = 0.605
2. Dep=ln(D) Coefficient t -StatisticC 4.785 -5.31Pd 0.126 2.183Y 1.185 7.617R Square = 0.761

20Diesel/Gasoil (1981-2009)
3. LnQ = β1 + β2LnP + β3LnY + β4LnE-13. Dep = Ln(D) Coefficient t Statistic LRC -1.323 -3.462Pd -0.038 -1.951 -0.176Y 0.327 3.908 1.498D-1 0.782 12.505

21
Residual (Heavy) Fuel Oil (1981-2006)
1. LnQ/Pop = β1 + β2LnP + β3LnY/Pop2. LnQ = β1 + β2LnP + β3LnY1. Dep=ln(R/Pop) Coefficient t-Statistic
C -8.361 -1.954P r -0.178 -0.546Y/Pop 1.076 1.333R-squared 0.326

22
Heavy Fuel Oil (1981-2006)
3. LnR = β1 + β2LnP + β3LnY + β4LnR-13. Dep = Ln(R) Coefficient t Statistic LR
C -0.788 -0.707Pr -0.126 -1.399 -1.07Y 0.210 1.166 1.78R-1 0.882 8.908

23
Sum Up
Preliminary Work Suggest Some Interesting IssuesAt least in GulfOil GDP is erraticComposition of population should be investigatedWhich price
may not matter at very low prices