Measuring Iranian Petroleum Downstream Supply Chain ...647086/FULLTEXT01.pdf · i Measuring Iranian...
64
i Measuring Iranian Petroleum Downstream Supply Chain Management Performance; A Combination of Analytical Hierarchy Process and Balance Score Card A Thesis Submitted to The School of Industrial Engineering and Management of KTH Royal Institute of Technology MASTER OF SCIENCE In Production Engineering and Management By Saba Norouzi Supervised By: Ove Bayard March 2013 Stockholm
Transcript of Measuring Iranian Petroleum Downstream Supply Chain ...647086/FULLTEXT01.pdf · i Measuring Iranian...
i
Measuring Iranian Petroleum Downstream
Supply Chain Management Performance;
A Combination of Analytical Hierarchy Process and
Balance Score Card
A Thesis Submitted to
The School of Industrial Engineering and Management of
KTH Royal Institute of Technology
MASTER OF SCIENCE
In Production Engineering and Management
By
Saba Norouzi
Supervised By:
Ove Bayard
March 2013
Stockholm
ii
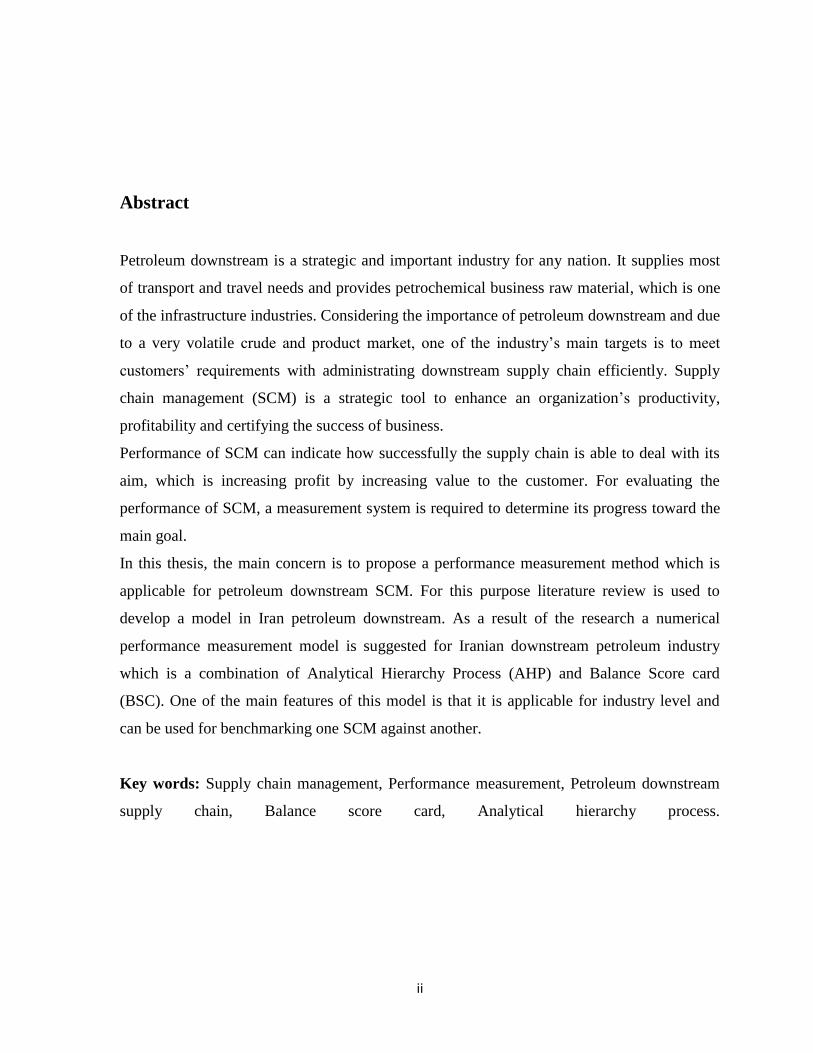
Abstract
Petroleum downstream is a strategic and important industry for any nation. It supplies most
of transport and travel needs and provides petrochemical business raw material, which is one
of the infrastructure industries. Considering the importance of petroleum downstream and due
to a very volatile crude and product market, one of the industry’s main targets is to meet
customers’ requirements with administrating downstream supply chain efficiently. Supply
chain management (SCM) is a strategic tool to enhance an organization’s productivity,
profitability and certifying the success of business.
Performance of SCM can indicate how successfully the supply chain is able to deal with its
aim, which is increasing profit by increasing value to the customer. For evaluating the
performance of SCM, a measurement system is required to determine its progress toward the
main goal.
In this thesis, the main concern is to propose a performance measurement method which is
applicable for petroleum downstream SCM. For this purpose literature review is used to
develop a model in Iran petroleum downstream. As a result of the research a numerical
performance measurement model is suggested for Iranian downstream petroleum industry
which is a combination of Analytical Hierarchy Process (AHP) and Balance Score card
(BSC). One of the main features of this model is that it is applicable for industry level and
can be used for benchmarking one SCM against another.
Key words: Supply chain management, Performance measurement, Petroleum downstream
supply chain, Balance score card, Analytical hierarchy process.

iii
“Dedication”
I lovingly dedicate this thesis to my parents for their love, endless support and
encouragement and to my husband who stood by me and supported me each step of the way.
I also dedicate this thesis and give special thanks to Ghiasi family who have supported me
throughout the process. I will always appreciate all they have done for me.

iv
“Acknowledgment”
I would like to express my gratitude to my supervisor Mr. Ove Bayard for his support and
guidance throughout the whole thesis. I also appreciate all those who helped me to complete
this thesis as well as the Department of Production Engineering (School of Industrial
Engineering and Management, Royal Institute of Technology (KTH), Stockholm, Sweden).
Saba Norouzi
March 7, 2013

5
Table of Contents
List of Tables …………………………………………………………………………… 7
List of Figures …………………………………………………………………..………. 8
1. Introduction .………………………………………………………………………… 9
1.1. Definition of Concept ……………………………………………………….… 9
1.2. Problem Statement ……………………………………………………………. 10
1.3. Project Objective ……………………………………………………………… 11
1.4. Methodology ………………………………………………………………….. 11
2. Literature Review ……………………………………………………………………. 13
2.1. Supply Chain Management ……………………………………………………... 13
2.2. Performance Measurement ……………………………………………………… 17
3. Industry Overview …………………………………………………………………… 22
3.1. Petroleum Industry …………………………………………………………….. 22
3.2. Oil and Gas Chain ………………………………………………………………. 24
3.3. Iran Refinery Industry ………………………………………………………..... 25
4. Balance Score Card and Analytical Hierarchy Process …………………………………. 28
4.1. Combination of BSC and AHP ………………………………………………... 28
4.2. Implementing Balance Scorecard Hierarchy …………………………………… 30
4.3. Data Collection …………………………………………………………………. 36
4.4. Design Questionnaire ………………………………………………………….... 36

6
5. Data Analysis …………………………………………………………………………. 39
5.1. Statistical Analysis ….……………………………………………………….….. 39
5.2. AHP Analysis ………….………………………………………………………... 43
5.3. Calculating Relative Weights …….……………………………………………... 45
5.4. Result Analysis …………………….……………………………………………. 48
5.5. Implementing The Model ………….…………………………………………….. 51
6. Conclusion ……………………………….……………………………………………. 52
References ………………………………….…………………………………………….. 54
APPENDICES …………………………….…………………….………………………. 58
APPENDIX A …………………………..…………………………………………… 59
APPENDIX B …..………………………...…………………………….……………. 60
APPENDIX C ……..………………………..…………………………….………..... 62
7
List of Tables
Page #
Table.2.1. A comparison between traditional and …………………………………. 18
Non-traditional performance measures
Table.4.1. Deriving Strategic Objectives of the Petroleum Supply Chain …………….. 32
Table.4.2. Mapping strategic objective to BSC Perspective …………………………… 33
Table.4.3 Deriving BSC criteria from strategic objective ……………………………… 34
Table.5.1.Scores measuring relevance of criteria in ……………………………………. 40
petroleum supply chain performance
Table.5.2. Percentage of votes in each BSC criteria …………………………….. 41
Table.5.3.Relative weights of four perspectives ………………………………… 45
Table.5.4.Relative weights of criteria under each perspective …………………………. 46

8
List of Figures
Page #
Fig.2.1. New and Payne definition of supply chain …………………………… 14
Fig.2.2. SCOR supply chain model ……………………………………………….. 15
Fig.2.3.The balance score card frame work …………………………………… 20
Fig.2.4.The Analytical hierarchy process frame work ………………………… 21
Fig.3.1.World oil flows ………………………………………………………… 23
Fig.3.2.Basic flow of Petroleum supply chain ……………………………………... 23
Fig.3.3.An animation of oil and gas underground .……………………………………. 24
Fig.4.1. Balance Scorecard Hierarchy Structure ……………………………………… 35
Fig.5.1.Bar chart which shows percentage of votes in BSC each criterion…...…... 42
Fig.5.2. Oil industry: supply-push, demand-pull supply chain ………………………... 49
Fig.5.3. Evaluation of supply chain –related IT in petroleum industry ………………… 50
9
1. Introduction
1.1. Definition of Concept
Performance measurement is a necessary task for the growth and improvement of any
business. Organizations need to measure their performance to evaluate their progress
towards their defined goal and receive feedback. As old age says “you can’t improve what
you can’t measure” or “Anything measured improves”.
According to parker 2000 “Organizations may need to carry out performance measurement
for various kinds of reasons: identifying success, identifying whether they are meeting
customer requirements, helping them understand their processes, identifying where problems
bottlenecks, waste, etc., exist and where improvements are necessary, ensuring decisions are
based on facts, not on supposition, emotion or intuition; and showing if improvement planned
actually happened”.
On the other hand the success of any business depends on the success of its supply chain
management. According to Farris and Hutchison (2002) “supply chain management is being
heralded as a value driver because it has such wide ranging effect on business success or
failure”. By SCM, firms are able to compete in a local scale or globally and this can be an
advantage for a company, because nowadays the business environment is entirely
competitive.
10
Petroleum industry is not an exception from this rule and according to increasing demand for
oil and its derivation (projections express the demand for oil and its derivation will grow by
50% from 2005 to 2030), an effective supply chain management can maximize profitability
and efficiency of the industry.
As it is mentioned before SCM is an important part of each company, improving its
performance in turn increases the company’s efficiency. It is a critical topic for suppliers,
manufacturers and retailers to gain and stay competitive especially in a new business
environment. This purpose is not possible unless a performance measurement system that
meets the changing requirements of the business is implemented for the supply chain
management.
1.2. Problem Statement
Measurement systems that mostly consider the financial area could not be convenient for
supply chain performance measurement systems, because there are always different criteria
for supply chain which have a non-financial essence and would affect SCM performance. All
these criteria should be scored while measuring supply chain performance.
In addition to what is mentioned above performance measurement is more complicated when
it is addressed to Petroleum downstream supply chain. Petroleum supply chain is a kind of
process industry supply chai and is completely in a different position compared to a
discrete industry supply chain; moreover it has characteristics which distinguish it even
between other kinds of process industries. Petroleum downstream SCM can be named highly
dynamic, for instance the shipping type varies widely (pipeline, tanker, truck, rail or barge) or
a huge queue of supplies should be moved locally or globally each day.
1: In discrete manufacturing, the manufacturing floor works off orders to build something. Examples
include toys, medical equipment, computers and cars. The resulting products are easily identifiable.
In process manufacturing, the products are undifferentiated, for example oil, natural gas and salt
(Wikipedia)

11
1.3. Project Objective
Choosing an appropriate method for evaluating Iranian’s petroleum downstream SCM which
considers its entire special characteristics, is significantly important and one of the main
objectives of this thesis.
Due to Iran’s plan for privatizing petroleum downstream, this will lead to an increase in the
competitive environment in this business. Another area of focus during this thesis lies on
finding a performance measurement system which is not only useful for organization level or
individual level but also is applicable for Benchmarking with competitors or industry groups
in Iranian downstream Petroleum industry and would compare performance of one company
supply chain against another one.
1.4. Methodology
The project methodology is defined in 5 steps:
1- Pre study and literature review
2- Project methodology
3- Design
4- Data collection
5- Data analysis

12
1.4.1. Pre study and Literature review
The research began with literature review about supply chain management, petroleum
downstream industry, performance measurement, supply chain performance management,
balance score card and analytical hierarchy process.
This phase has been done for defining the project objectives and scope of the research.
1.4.2. Project Methodology
After accomplishing some research the method (A combination of balance score card and
analytical hierarchy process) which is aligned with the objective of the project has been
finalized.
1.4.3. Design
In this phase according to the project scope and research method, a questionnaire has been
designed for validating the criteria under each BSC perspective and also pairwise comparison
matrices has been designed for performing Analytical Hierarchy process.
1.4.4. Data Collection
Data analysis
Data collection
Design Project methodology
Pre study and literature review

13
Experts in Iranian petroleum downstream SCM have been asked to fill the questionnaire and
matrices.
1.4.5. Data Analysis
After gathering all matrices and questionnaires from experts, the first step was to perform
statistical calculations for the questionnaires and the next step, Expert Choice software has
been used for performing AHP model (analyzing pairwise matrix) and calculating relevant
weights for each criteria.
In all steps, information was based on different literature and interactions with industry
practitioners and consultants.

14
2. Literature Review
2.1. Supply Chain Management
Attention to Supply chain management has been increased since 1980, at that time companies
figured out that their organization benefit exist in an integrated correlation inside and outside
of their firm and companies cannot compete effectively within an isolated environment in the
supply chain.
Supply chain management has been defined with various concepts over the past decade and
these definitions defer according to their definer point of view. New and Payne (1995)
defined supply chain as a chain that link manufacturing and supply process from the
beginning (raw material) to the final customer. Fig 2.1 illustrates processes and organizations
in a chain that New and Payne delineated. According to their definition, a proper supply
chain management includes recycling of products and material into the chain. Also supply
chain management involve all activities like designing products, planning, manufacturing,
sourcing, transportation ,inventory handling, warehousing.

15
Fig.2.1. New and Payne definition of supply chain which include recycling into the chain
. Source: New and Payne (1995).
According to Kaufman (1997), by harmonizing and controlling all processes in the chain,
supply chain management can “…remove communication obstacle and eliminate
redundancies”. Also it tries sharing information along the chain, increasing trust and creating
new products.
Monczka and Morgan (1997) state that “integrated supply chain management is about going
from the external customer and then managing all the processes that are needed to provide the
customer with value in a horizontal way”. According to their idea, supply chains compete
together not firms and the organization that is better in competition is the one that “can
provide management and leadership to the fully integrated supply chain including external
customer as well as prime suppliers, their suppliers, and their suppliers’ suppliers”.
In (2001) Mentzer et al. described supply chain as “a set of three or more organizations
directly linked by one or more of the upstream and downstream flows of products, services,
finances, and information from a source to a customer."
Based on literature review a definition for supply chain can be stated as: every activity that
exists for delivering the final products from, raw material up to customer, consisting of
demand and supply planning, sourcing, producing, fabricating, assembly, testing, packaging,

16
Ordering, warehousing, transporting, distributing, delivery to customer, returning raw
materials and receiving returns of finished goods and information flow for monitoring,
controlling and coordinating all of these processes.
In 1997 SCOR (supply chain operation reference) developed a hierarchical model (Fig2.2)
for better understanding of supply chain management that breaks it into an organizational
structure. According to SCOR model, an organizational structure consists of five unified
processes: plan, source, make, deliver and return.
Fig.2.2. SCOR supply chain model which consist of five unified processes: plan, source, make,
deliver and return
Source: http://www.supply-chain.org, SCOR model, Supply Chain Council Inc, Copyright#2010

17
2.1.1. SCM in Petroleum Downstream Industry
According to the international energy agency annual outlook, the oil and gas reserves are
enough for a significant period of time to meet world demand. With regard to this point the
main challenge for petroleum downstream industry is manufacturing and delivering products
to customers through the most efficient way, with the lowest cost.
Supply chain management in downstream industry is complex and challenging because of
increasing global demand of oil and its derivation along with inflexibility of petroleum
supply chain and easiness of international commerce. Also petroleum downstream SCM has
specific characteristics that individuate it from other supply chains (Varma et al., 2008):
Petroleum is a process industry which is different from discrete industry. A simple
definition for process industry: when products are produced in this industry there is no
chance to return them into the basic material "once you put it together, you cannot
take it apart".
Products in this industry are flammable and this characteristic increases the risk of
manufacturing and handling.
Products are manufactured and handled in mass volume that causes high inventory
carrying cost. In other words, the flexibility in terms of volume does not exist.
Transportation cost is high compared to discrete industry. Crude oil must be
transferred from the production sites to refineries and from refineries to consumers.
These transportations have different modes like pipelines, trucks, trains, barges, etc.
“Despite the importance of supply chain management and its growing complexity, the
petroleum industry is still in the development stage of efficiently managing their supply
chains “(RAED HUSSAIN,2006). Oil and gas industry benefit from optimizing its supply
chain more than any other companies.
Chima (2007) stated “oil and gas industry is involved in a global supply-chain that includes
domestic and international transportation, ordering and inventory visibility and control,
materials handling, import/export facilitation and information technology”.

18
On the contrary to the increasing demand in petroleum industry and importance of oil and its
derivation in our life as well as the complexity of its supply chain, petroleum SCM has
received insignificant consideration in literature.
2.2. Performance Measurement
All over the history, companies applied performance measurement to assess the success of
their business and improve their processes. It also has been used to compare different
businesses, departments, industries, teams and individuals.
According to literature review performance measurement can be divided into two eras. The
first era began from 1880s till 1980s and was nominated as the traditional performance
measurement. In that period of time the emphasis was on financial criteria such as return on
investment, revenue and earnings per share but these criteria had some shortcomings, for
instance this system just reported how was the company performance in the past and the
knowledge about how it will perform in the future was minimal. Financial era represents
performance of an organization activity and information about the procedures of achieving
that performance and the possibilities of improving it is little.
Late 1980s was the start of the second era. Organizations lost market share in international
market against their foreign competitors who had ability to create high quality products with
lower cost and high variety. With the purpose of overcoming weak points and regaining the
international market, companies changed their strategic preferences and moved it from
producing products with low cost to producing with high quality, flexibility, short lead time
and reliable delivery system. Based on new strategic preferences, the traditional performance
measurement system which was implementing financial performance measurement had
limitations and did not respond to the new requirements and new performance measurement
systems were essential. In Bryant et al., (2004), point of view “It is not enough to measure
how much a firm has improved. It is also necessary to find out why the firm has not achieved
its targets one hundred percent. Firms need to measure not only the final output but also the
processes involved to identify the causes of variance from target specification. To understand

19
value drivers, managers must have in place, a performance measurement system designed to
capture information on all aspects of business not just the final results.”
Some of new performance measurement systems are: SMART system, Performance
Measurement Questionnaire (PMQ), Balance Score Card, etc.
Alaa M et al. (1996) summarized the differences between traditional and non-traditional
performance measurement according to the Table.2.1.
Table.2.1. A comparison between traditional and non-traditional performance measures
Source: (Alaa M et al. 1996)
Traditional performance measures Non-traditional performance measures
Based on outdated traditional accounting
system
Mainly financial measures
Intended for middle and high manager
Lagging metrics (weekly or monthly)
Difficult, confusing and misleading
Lead to employee frustration
Neglected at the shop floor
Have a fixed format
Do not vary between locations
Do not change over time
Intended mainly for monitoring performance
Not applicable for JIT, TQM, CIM, FMS, RPR,
OPT, etc.
Hinders continuous improvement
Based on company strategy
Mainly non-financial measures
Intended for all employees
On-time metrics (hourly or daily)
Simple, accurate and easy to use
Lead to employee satisfaction
Frequently used at the shop floor
Have no fixed format (depends on needs)
Vary between locations
Change over time as the need change
Intended to improve performance
Applicable
Help in achieving continuous improvement
2.2.1. Balance Score Card (BSC)
Balance score card was one of the new performance measurement systems which were trying
to compensate the shortcomings of traditional system. Robert Kaplan and David Norton
(1992-1996) developed balance score card as a method which is a mix of financial and three
non-financial perspective: customer, learning and growth and internal business processes.

20
Financial: will indicate the company’s profitability and its performance from
shareholders point of view.
Customer: will measure if the company is capable to produce products with
acceptable quality in the right time with the best cost.
Internal business processes: will present the ability of the company to translate
customer requirements into what the company has to do inside the company to satisfy
customers.
Learning and growth: will measure the company’s ability to create new products,
increase values for customers, innovation, increase efficiency and company
improvement.
As it is shown in Fig.2.3 all perspectives are linked with arrows which means that objectives
and measures in all perspectives are connected and are necessary for fulfillment of the
company’s strategy.
Kaplan and Norton describe the innovation of the balanced scorecard as:
"The balanced scorecard retains traditional financial measures. But financial measures tell the
story of past events, an adequate story for industrial age companies for which investments in
long-term capabilities and customer relationships were not critical for success. These
financial measures are inadequate, however, for guiding and evaluating the journey that
information age companies must make to create future value through investment in
customers, suppliers, employees, processes, technology, and innovation."
For developing balance scorecard first of all managers need to achieve consensus about
company’s mission and strategy. The mission and strategy should be translated into
objectives and measurable parameters which will be a guideline for lower level managers.
Next, lower level employees will understand company’s strategy and managers can ensure
that all employees are aware about strategic goals. Actually when company includes all
employees in developing BSC, it will motivate them to suggest operational solution for
achieving company targets.

21
Fig.2.3.The balance score card frame work
Source: Kaplan and Norton, 1992
2.2.2. Analytical Hierarchy process (AHP)
AHP can be named between other new performance measurement systems. From 1977 till
1995 Thoma L Satty developed AHP as a technique for decision making and solving complex
problems in all fields. One of the main advantages of this method is, although it is based on
complex matrix, is applicable for people with low knowledge of optimization theory. Even
managers would not use a method which is complicated and unfortunately most precise and
functional methods are complicated. AHP is exempt from this role; it has a simple structure
which is flexible for any situation and applicable in groups or individuals.
Vision and
Strategy

22
Satty.L.T (2008) stated: for making a decision in a systematic approach the decision should
be broken down into the following steps:
1. The problem should be defined in a clear way.
2. Designing the hierarchy with top level which is the decision goal and going through
objectives and intermediate levels.
3. Design pairwise comparison for all levels. Each factor in upper level should be
evaluated with the factors in one level below.
4. Priorities that have been reached from pairwise comparison will be used to
give weight to the criteria in the level below and continue this to the final
priorities of the alternatives in the bottom level and choosing the alternatives
with highest weight. Fig.2.4
Fig.2.4.The Analytical hierarchy process frame work
According to Forman and Gass (2001) "Any situation that requires structuring, measurement,
and/or synthesis is a good candidate for application of the AHP. Broad areas in which the
AHP has been successfully employed include: selection of one alternative from many,
resource allocation, forecasting, total quality management, business process re-engineering,
quality function deployment, and the balanced scorecard".
Alternatives
Criteria
Goal Goal
criteria1
alternative1 alternative2
criteria2
alternative3
23
3. Industry Overview
3.1. Petroleum Industry
Petroleum is known as the largest initial products in international trade in terms of volume
and value and will remain the undisputed superiority in the global trade in the foreseeable
future. The industry is strategic in terms of economy and a critical issue for many nations.
According to IEA (international energy agency) top 10 countries produced over 63 % of the
world oil production in 2011 and Iran was in the fourth place (Wikipedia).
Note the importance of the petroleum industry in the world and considering that Iran has one
of the world’s largest reservoir , the efficient use of this source is significantly important.
As it is shown in Fig.3.1 the main flow of crude oil (the raw material for a verity of finished
products), comes from the Middle East.

24
Fig.3.1.World oil flows
(Source: McGraw Hill 2002)
The industry is divided into three major sectors (Fig.3.2) including, upstream, midstream and
downstream. Midstream is usually included in the downstream category. In this thesis the
main focus is on measuring the performance of downstream supply chain.
Fig.3.2.Basic flow of Petroleum supply chain
Source: albertaisenergy.ca

25
3.2. Oil and Gas Chain
For the purpose of this research the chain of gas and oil will be defined as follow:
3.2.1. Upstream
Upstream includes exploration for potential underground (offshore) or underwater (onshore).
A brief description of the onshore source is given below:
Oil and gas are generated from a source rock, organic matter buried in the depth of the earth.
Once formed, they climb back towards the surface on their way. Cap rocks can impede their
progress and they accumulate in reservoir rocks (Fig.3.3). There they constitute hydrocarbon
fields, which can be identified by interpreting seismic data (a sort of echography).
The data can be obtained with the help of a seismic ship. To confirm the interpretations of
seismic data, two types of drilling gear exist. Each is adapted to a range of depth of water
(down to more than 2500 meters).
Fig.3.3.An animation of oil and gas under ground
Source: Total.com

26
Platforms at sea can be used not only for drilling but also for the production of hydrocarbons.
This production consists of the separation of oil, gas and water, before the oil and gas is taken
by pipelines toward a main land terminal.
Where it is impossible or too expensive to link the field to the coast by a pipeline, an FPSO
ship (Floating Production Storage and Offloading barge) can be used. On board, the
hydrocarbons and water are separate. The oil is stored prior to being loaded on tankers and
gas is rejected into the reservoir rocks.
3.2.2. Downstream
Gas from a field is taken to land through an underground gas pipeline to a processing plant.
In case the gas is to be transported by sea, it is converted into liquid state which is obtained
by cooling it down to 163C. When it arrives at the plant terminal, the liquid natural gas
(LNG) is returned to its gaseous state in a re-gasification plant, before being introduced into
the local gas pipeline network.
The crude oil is transported in a petroleum tanker, the capacity of which can attain 200000
tons. It is commonly called a supper tanker. The terminals capable of receiving such giants
are few and far between. The ships used to transport the crude oil produced on an FPSO ship
are of a much smaller capacity. The crude oil, before being refined, is stored in the port in the
large capacity takers.
Crude oil is transported by oil pipeline to the refinery. There it undergoes a number of
transportations and blending. A variety of finished products are obtained like: LPG, Petrol,
Kerosene, diesel, asphalt, tar, paraffin wax, lubricating or naphtha which are used as the basis
for the composition of plastic products.
3.3. Iran Refinery Industry
Iran’s refineries have been operated by the National Iranian Oil Refining and Distribution
Company for more than one decade ago and started to implement a major economic plan to
privatize its oil refineries in line with its privatization scheme since 2011. Over 80% of
27
refineries have been ceded to the private sector (Nine refineries have been ceded to the
private sector).
With respect to ceding refineries to the private sector as well as some refineries which have
been established privately from the beginning, competition in this industry is increasing day
by day. Due to the competitive environment and considering the importance of supply chain
management for the industry, SCM performance measurement is a key factor to evaluate the
company progress toward the defined goal and provide feedback for growth and
improvement.
Iranian downstream supply can be categorized as below:
Crude oil sourcing
Manufacturing process
Distribution and marketing
3.3.1. Crude Oil Sourcing
Raw material Procurement is a key issue in downstream supply chain for the refinery process.
The market price of crude oil can be based on two characters: gravity and Sulfur content.
Gravity: crude oil can be classified into two groups: heavy crude oil and light crude oil.
Light crude oils are considered of better quality because they consist of a greater amount of
high value final products.
Sulfur Content: Is an important character of crude oil because it can cause some difficulties
such as, corrosion of metals. In processing the oil, air pollution results from the burning of
high sulfur fuels achieved from crude oil having high sulfur content. Crude oil which contain
small amount of sulfur is called Sweet and the one with higher level of sulfur is called Sour.
28
3.3.2. Manufacturing (Refining)
Refining process has large industrial complexities that involves many different processing
units and can be separated into five areas:
Fractionation
Conversion processes
Treatment processes
Formulating and blending
3.3.3. Distribution and Marketing
This phase of the supply chain consists of transporting the finished products from the refinery
to the customers in bulk or small size. Transportation can be made by pipelines, tankers,
trucks, rails or barges. Two types of customers can be categorized:
Wholesale customers which can be petrochemical plants, fuel consumers like
shipping companies, power plants or some other industrial customers.
Retail customers that use fuel for vehicles or heating systems.

29
4. Balance Score Card and Analytical Hierarchy Process
4.1. Combination of BSC and AHP
Why measure the Supply chain performance with balance score card and analytical hierarchy
process?
Supply chain management (SCM) can be defined as coordinating and continuous improving
the flow of material, information, capital, labor, technology, financial assets and other
resources through to the end user. Evaluating a supply chain is not a simple task because it
considers all aspects of the processes required to create a company’s product in the most
efficient and cost effective way. Companies need to measure all of the processes that help to
produce the final product not only the output because this can help them find out the cause of
variation between the desired product and the specification of the final product.
Supply chain Performance measurement should consider the following:
It should reflect the inter-company collaboration because a successful supply chain
works synergic.
Supply chain needs a collaborative environment and since the performance
measurement system affects organizational behavior “you get what you measure”, it
must be designed to encourage synergic behavior.
The main purpose in a supply chain is to deliver final products according to customer desired
parameters in lowest cost and with increased speed to the market.
Different methods can be named for evaluating a firm’s supply chain management like:

30
The Supply Chain Council’s SCOR Model
The Logistics Scoreboard
The Activity-Based Costing (ABC)
The Balance Score Card
The method which was selected for this research is BSC, because it has some characteristics
which are in line with the objectives of this research:
“Traditional logistics measures neither adequately assess supply chain performance
nor embody measures to motivate employees to behave with a supply chain
orientation” (Brewer and Speh 2000), but BSC overcomes this obstacle.
“Implementing BSC starts by applying it at a high level and letting the strategic
objectives and themes cascade down to lower levels. Thus, decentralized units
become aligned with each other and to the corporate strategy” (Kaplan 2005)
In this measurement approach after defining the strategic objective and vision, will
translate them into measurable parameters.
By translating strategic objective employees will understand organization strategy and
find them in their daily work.
Feedbacks in this approach are from both; the external customer and internal business
process.
It considers the financial and non-financial perspective of a company and actually it
measures parameters under four perspectives: customer, financial, internal business
process and innovation and learning.
On the contrary of drivers’ advantages that have been discussed above, implementing BSC is
associated with a problem. It does not have the ability to weigh the relative importance of

31
criteria and perspectives. For overcoming this problem an Analytical Hierarchy Process has
been used to quantify the importance of each perspective and criteria under it.
AHP also can deal with some other matters:
AHP can show how the change of a higher level priority affects the lower level of
priority.
AHP provides a framework to cope with multiple criteria situations involving
intuitive, rational, quantitative and qualitative aspects (Alberto, 2000).
AHP mechanism is like breaking the main problem into small parts and using
pairwise comparison which decision makers can represent relative importance of
criteria in the hierarchy.
One of the main advantages of AHP is quantifying criteria which are not easy to
be quantified, especially in performance measurement always such criteria can be
found.
Both Stability and flexibility can be found in AHP. It is stable because small
changes have no significant affect in it and also flexibility because if a hierarchy is
structured well, adding to it does not interrupt its main performance.
4.2. Implementing Balance Scorecard Hierarchy
The steps which should be taken for performing BSC Hierarchy are summarized below:
1. Deriving Criteria from Petroleum Strategic Objective
2. Establish Balance Scorecard Hierarchy Structure
3. Questionnaire
4. Data analysis
32
4.2.1. Deriving BSC Criteria from Petroleum Strategic Objective
One of the main problems that typically occur with implementing BSC is the inability to
benchmark with competitors or industry groups, because usually it has been implemented for
individual level or organization level and does not allow comparisons with other companies.
This problem happens when BSC users defines criteria under four perspectives which are
unique for a specific organization and cannot be used to compare two different companies
even in the same industry.
The solution for solving this problem is to define criteria which are general for the whole
industry and by identifying general criteria it makes the BSC model applicable for
benchmarking. For this purpose criteria that are general in petroleum industry should be
identified.
Varma (2007) defined the characteristic which represent generic issues of petroleum industry;
afterward strategic objective relevant to these generic issues has been defined. It is shown in
Table.4.1

33
Table.4.1. Deriving Strategic Objectives of the Petroleum Supply Chain from its characteristic
Source: Varma et al.2009
Characteristic of Petroleum Industry (Indicate Generic Issue in the Supply Chain)
Strategic objective of the Petroleum Supply Chain
Raw material prices: Unstable & affected by fluctuating international prices
Have stable raw material prices
Stability and predictability of raw material supplies: Low due to international pressures
Have steady flow of raw material
Transportation costs: High Manage transportation efficiently
Inventory carrying costs: High Manage inventories efficiently
Postponement: Extremely difficult Introduce postponement if possible
Level of integration of supply chain partners: Low Enhance integration with supply chain partners
Risk of contamination/adulteration: High Maintain purity of product
Length of supply chain: Long Try to reduce length of supply chain
Flexibility: Very difficult to achieve Improve volume flexibility
IT usage: Laggard in usage Enhance use of IT
Physical risks (fire etc): High Manage risks effectively
Type of supply chain required: Adaptive supply chain (ASC) due to dynamic environment
Optimize the enterprise using software
Critically of supply: High Maintain steady supply of finish product
Switching costs for customer: Low Try to retain customers and increase market share

34
After defining the strategic objectives it’s time to determine each of these objectives belongs
to which perspective of BSC .Table.4.2. Shows this mapping
Table.4.2. Mapping strategic objective to BSC Perspective
Source: Varma et al.2009
Strategic objective of the Petroleum Supply Chain
Relevance BSC Perspective
Have stable raw material prices Financial
Have steady flow of raw material Internal business process
Manage transportation efficiently Internal business process
Manage inventories efficiently Internal business process
Introduce postponement if possible Innovation and learning
Enhance integration with supply chain partners Internal business process
Maintain purity of product Customer
Try to reduce length of supply chain Internal business process
Improve volume flexibility Internal business process
Enhance use of IT Innovation and learning
Manage risks effectively Financial
Optimize the enterprise using software Internal business process
Maintain steady supply of finish product Customer
Try to retain customers and increase market share
Financial

35
At the end BSC criteria can be derived from the strategic objectives as it is shown in
Table.4.3
Table.4.3 Deriving BSC criteria from strategic objective
Source: Varma et al.2009
Strategic objective of the Petroleum Supply
Chain BSC criteria related to the objective
Have stable raw material prices Stability in raw material prices
Have steady flow of raw material Steady supply of raw material
Manage transportation efficiently Transportation management
Manage inventories efficiently Inventory management
Introduce postponement if possible Postponement
Enhance integration with supply chain partners Integration with supply chain partners
Maintain purity of product Purity of product
Try to reduce length of supply chain Length of supply chain
Improve volume flexibility Volume flexibility
Enhance use of IT Use of IT
Manage risks effectively Physical risks
Optimize the enterprise using software Optimization of enterprise
Maintain steady supply of finished product Steady supply of finished product
Try to retain customers and increase market share
Market share

36
4.2.2. Establish Balance Scorecard Hierarchy Structure
Once the BSC criteria were derived from petroleum strategic objective, a Balance Scorecard
Hierarchy can be generated.
First level of hierarchy model contains four balance score card perspectives and second level
contains criteria which have been defined to measure performance of each perspective.
Fig.4.1 schematically shows the AHP model of BSC. This figure has been taken from Expert
choice software.

37
Fig.4.1. Balance Scorecard Hierarchy Structure. First level of hierarchy contains four BSC
perspectives and second level contains criteria under BSC perspectives
4.3. Data Collection
When it comes to data collection the most important things are where and who will be
involved to fill in the questionnaire. For the purpose of this thesis, three Iranian refinery
plants in the private sector have been chosen. These refineries are approximately the same in
size and have the same capacity. Due to the importance of the research results which will be
applicable in petroleum downstream industry, subject matter experts in the industry have
been asked to fill in the questionnaire and matrices. Experts who have adequate knowledge of
the downstream supply chain and its challenges have been chosen.
Considering the highly specialized subject and also the process of selecting responses which
are consistence (will be explained furthermore in AHP analysis), total responses which have
been received and selected are limited to 31.
Note: This research was performed before the impact of sanction on Iranian petroleum
industry (The European Union, agreed to an oil embargo on Iran, and to freeze the assets of
Iran's central bank in response to Iran’s nuclear activities. Sanctions have reduced Iran's
access to products needed for the oil and energy sectors, have prompted many oil companies
to withdraw from Iran, and have also caused a decline in oil production due to reduced access
to technologies needed to improve their efficiency (Wikipedia) ).
4.4. Design Questionnaire
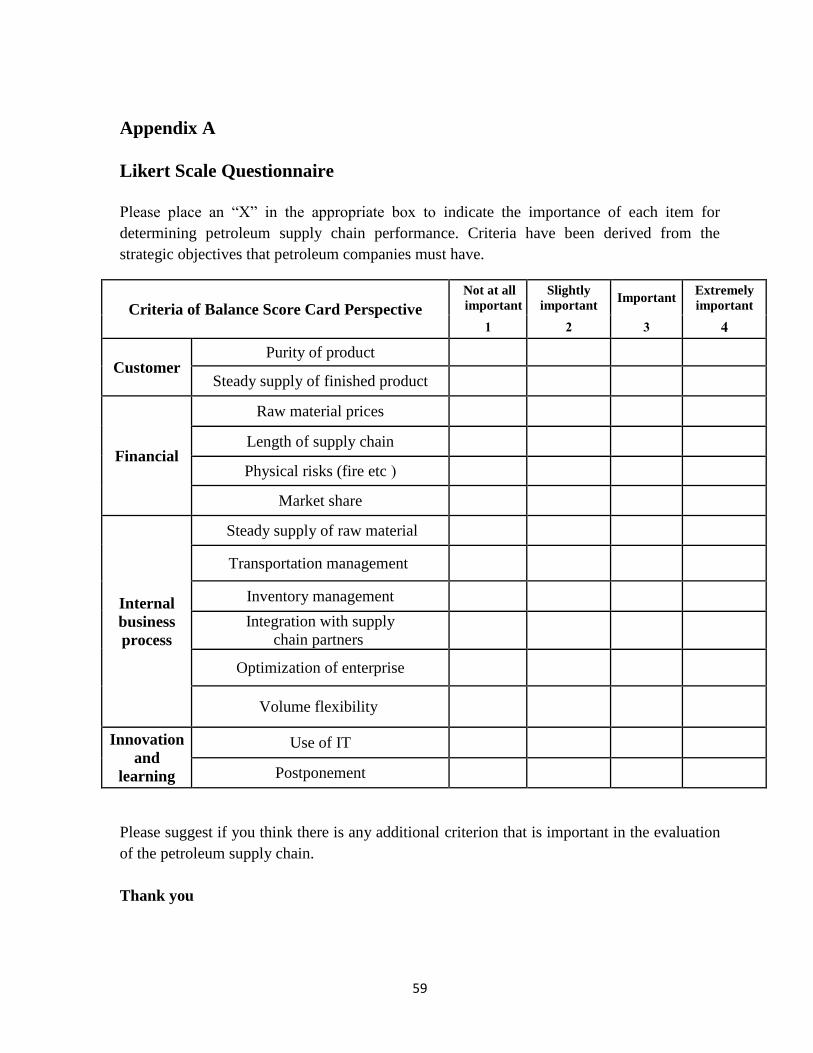
4.4.1. Likert Scale Questionnaire
There are some studies about the same subject in Indian petroleum industry (Varma et al.,
2008) and this study has been done for Iranian petroleum companies.
The criteria which have been derived from the strategic objectives of the petroleum industry
have been put in a questionnaire to determine if they are valuable for the Iranian petroleum
38
industry. According to this method first questionnaire have been made with Likert scale 4
which is ranked as following:
1. Not at all important
2. Moderately important,
3. Important
4. Extremely important.
(The Likert scale questionnaire is as shown in Appendix A)
4.4.2. Pairwise Comparison Matrices
Second questionnaire is a pairwise comparison for performing AHP model and calculating
each criterion’s weight to select important perspective and criteria for measuring the
company’s performance.
The scale for this pairwise comparison is a nine point scale which Thomas Saaty developed:
1=EQUAL (the categories are of equal importance in the scorecard)
3=MODERATE (one of the categories is slightly more important that the other)
5=STRONG (one of the categories is strongly favored over the other)
7=VERY STRONG (one of the categories is strongly favored over the other, and its
dominance is demonstrated in practice)
9=EXTREME (the difference in importance between the two categories is so extreme that the
categories are on the verge of not being comparable)
In the first level of this pairwise comparison, the importance of the four BSC perspectives has
been evaluated.

39
As it is shown in the example below, in each row of this pairwise comparison, two different
BSC perspectives have been compared and each perspective which is more important should
be given the number that corresponds to the importance of that factor otherwise, “1” should
be marked which means both of the factors have the same significance.
An Example of Level One:
Innovation & learning 9 7 5 3
1 3 5 7 9 Internal business process
customer 9 7 5 3
1 3 5 7 9 Financial
In this example innovation and learning has been assessed to be slightly more important than
internal business process.
In the second level, the criteria under each BSC are assessed with a separate pairwise
comparison and the rating system is the same as the first level.
An Example of Level Two:
Financial perspective
Raw material prices 9 7 5 3
1 3 5 7 9 Length of supply chain
Raw material prices 9 7 5 3
1 3 5 7 9 Physical risks (fire etc)
Raw material prices 9 7 5 3
1 3 5 7 9 Market share
Length of supply chain 9 7 5 3
1 3 5 7 9 Physical risks (fire etc)
Length of supply chain 9 7 5 3
1 3 5 7 9 Market share
Physical risks (fire etc) 9 7 5 3
1 3 5 7 9 Market share
(The whole pairwise comparison is shown in Appendix B)

40
5. Data Analysis
5.1. Statistical Analysis
The first questionnaire has been designed for analyzing the data with statistical elements to
validate the importance of criteria. Statistical elements such as mean, median, mode, standard
deviation and percentage have been used in this part.
After performing the statistical analysis which is shown in Table.5.1, the decision was made
that all the factors which received a mean more than 2.50 out of 4 will stay in evaluation.
With regards to this decision the criterion which had the lowest mean is physical risks,
marked in the table with the mean of 2.61 and which we will keep in our model. The value of
the median and mode for all factors were 3 or 4 that shows the importance of all of the
criteria.

41
Table.5.1.Scores measuring relevance of criteria in petroleum supply chain performance
BSC
Perspectives
Criteria of perspectives
Mean
score
on 1-4
scale
Median
value
of
score
Mode SD of score
Customer Purity of product 3.87 4.00 4.00 43.0
Steady supply of finished
product
3.58 4.00 4.00 4300
Financial Raw material prices 3.52 4.00 4.00 43.0
Length of supply chain 3.10 3.00 3.00 4300
Physical risks (fire etc ) 2.61 3.00 3.00 43.4
Market share 3.16 3.00 4.00 43..
Internal
business
process
Steady supply of raw material 3.23 3.00 3.00 4300
Transportation management 3.03 3.00 3.00 43.0
Inventory management 3.13 3.00 4.00 43..
Integration with supply chain
partners
3.10 3.00 3.00 4300
Optimization of enterprise 3.29 3.00 4.00 43..
Volume flexibility 3.32 4.00 4.00 43..
Innovation
and
learning
Use of IT 3.48 4.00 4.00 43.0
Postponement 3.03 3.00 3.00 43.0
According to statistical calculations another limitation which was considered for keeping
criteria in evaluation was assessing them according to the percentage of votes they get in each
Likert scale. Based on this limitation a factor which gets more than 50% of votes in
“important (3)” and “extremely important (4)” of rating scale can be concluded as a valuable
factor and would remain in the evaluation system.
42
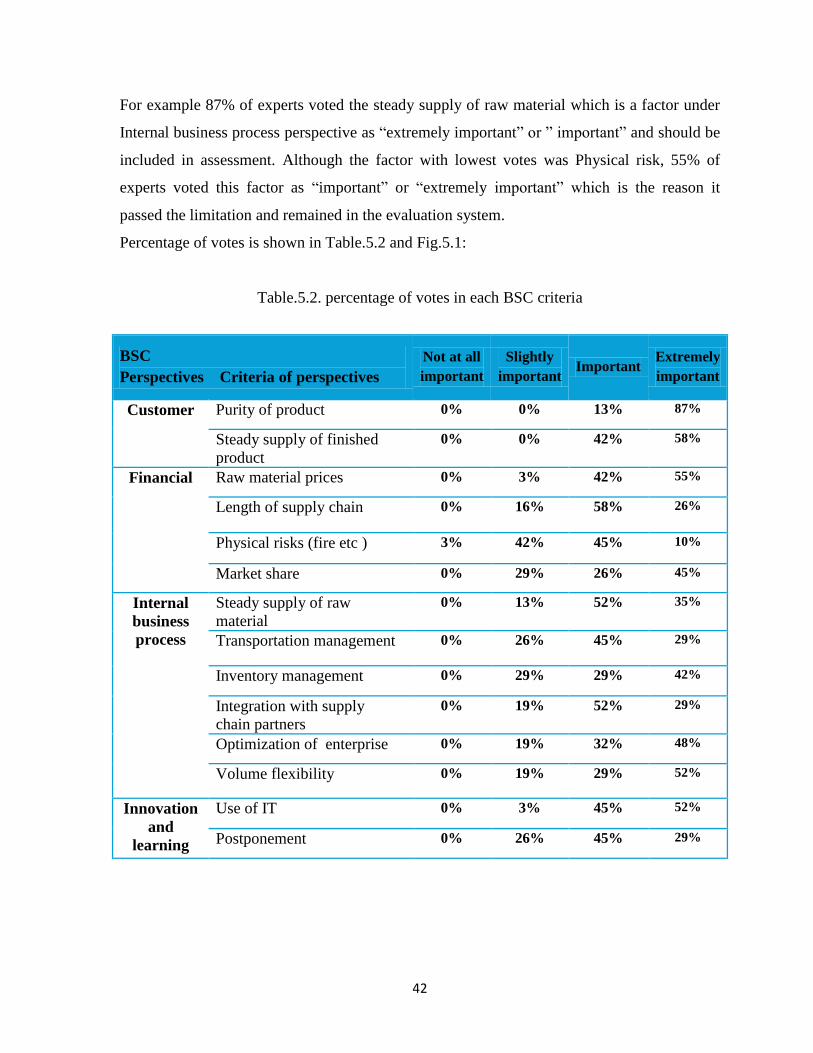
For example 87% of experts voted the steady supply of raw material which is a factor under
Internal business process perspective as “extremely important” or ” important” and should be
included in assessment. Although the factor with lowest votes was Physical risk, 55% of
experts voted this factor as “important” or “extremely important” which is the reason it
passed the limitation and remained in the evaluation system.
Percentage of votes is shown in Table.5.2 and Fig.5.1:
Table.5.2. percentage of votes in each BSC criteria
BSC
Perspectives Criteria of perspectives
Not at all
important
Slightly
important Important
Extremely
important
Customer Purity of product 0% 0% 13% 87%
Steady supply of finished
product
0% 0% 42% 58%
Financial Raw material prices 0% 3% 42% 55%
Length of supply chain 0% 16% 58% 26%
Physical risks (fire etc ) 3% 42% 45% 10%
Market share 0% 29% 26% 45%
Internal
business
process
Steady supply of raw
material
0% 13% 52% 35%
Transportation management 0% 26% 45% 29%
Inventory management 0% 29% 29% 42%
Integration with supply
chain partners
0% 19% 52% 29%
Optimization of enterprise 0% 19% 32% 48%
Volume flexibility 0% 19% 29% 52%
Innovation
and
learning
Use of IT 0% 3% 45% 52%
Postponement 0% 26% 45% 29%

43
Fig.5.1.Bar chart which shows percentage of votes in each BSC criteria

44
5.2. AHP Analysis
For generating priorities with AHP and calculating relative weights for balance score card
perspectives and criteria, the following steps should be taken:
1. Establishing the pair wise comparison matrix.
2. Checking consistency ratio (CR).
3. Aggregating responses.
4. Calculating relative weights.
5.2.1. Establishing Pair Wise Comparison Matrix
The key factor for designing comparison matrix is reciprocity. It means when raw material
prices is 5 times more important than market share, the reciprocity says that market share is
1/5 times more important than raw material price. An example of comparison matrix is as
shown below:
Raw material prices 9 7 5 3
1 3 5 7 9 Length of supply chain
Length of supply chain 9 7 5 3
1 3 5 7 9 Market share
Raw material prices 9 7 5 3
1 3 5 7 9 Market share
Raw material
prices
Length of supply chain
Market share
Raw material prices 1 7 5
Length of supply chain 1/7 1 1/3
Market share 1/5 3 1
45
5.2.2. Consistency Ratio (CR)
“The AHP deals with consistency explicitly because in making paired comparisons, just as in
thinking, people do not have the intrinsic logical ability to always be consistent”(Saaty, 1994)
When a matrix is consistent?
A, B and C are consistent when, if A is prior to B and B is prior to C, then A is prior to C.
In other word: Aij Ajk = Aik i, j, k = 1, 2…, n.
A consistency ratio less than 0.1 (CR<0.1) was acceptable
All the responses have been checked for consistency ratio. For performing consistency check
Expert Choice software have been used.
.
5.2.3. Aggregating Responses
When it comes to using AHP in group, an important issue should be considered: how
aggregate responses take a single judgment from all individual judgments which represent the
entire group judgment. According to Hsiang et al. (2008) three methods can apply for
aggregating responses:
First Method: Calculate AHP weight of every expert and then calculate overall
weight through arithmetic mean.
Second Method: Aggregate all expert responses for each criterion by arithmetic
mean, and then calculate AHP weight.
Third Method: Aggregate all expert responses for each criterion by geometric mean,
and then calculate AHP weight.
The method which has been applied for this research is the third one because according to
Hsiang et al. (2008), the first method is inefficient. Also “since pairwise comparisons in the

46
AHP are based on a ratio scale, judgment averages should be calculated using a geometric
mean” (Saaty 1980)
Comparison matrix by using geometric mean:
The number of experts (k) =1, 2, 3... m
The number of criteria =1, 2, 3… n
5.3. Calculating Relative Weights
In this step the weights for BSC perspectives and the weights for criteria under each
perspective have been calculated.
(Whole AHP calculation is shown in Appendix C.)
The first level of hierarchy is relative weights of BSC perspectives which are shown in
Table.5.3 below:
Table.5.3. Relative weights of the four perspectives (first level of hierarchy)
BSC Perspective relative weight
Customer 0.515
Financial 0.199
Internal business process 0.156
Innovation and learning 0.130

47
The second level of hierarchy is relative weights of criteria under BSC perspectives which are
shown in Table.5.4:
Table.5.4.Relative weights of criteria under each perspective (second level of hierarchy)
BSC
Perspectives Criteria of perspectives Relative weights
Customer Purity of product 0.714
Steady supply of finished product 0.286
Financial Raw material prices 0.413
Length of supply chain 0.250
Physical risks (fire etc ) 0.092
Market share 0.245
Internal business
process
Steady supply of raw material 0.172
Transportation management 0.127
Inventory management 0.171
Integration with supply chain
partners
0.173
Optimization of enterprise 0.184
Volume flexibility 0.173
Innovation and
learning
Use of IT 0.651
Postponement 0.349
At last for calculating the overall weights, relative weights of first level have been multiplied
by the relative weights of second level.

48
Example:
Perspectives and criteria first level*second level overall weights
Customer
Purity of products 0.515*0.714 0.367
Steady supply of finished products 0.515*0.286 0.147
The Final result of this step has been sorted from the largest weight (most important criterion)
to the smallest weight (least important criterion).
Perspectives and criteria overall weights
1. Purity of products 0.368
2. Steady supply of finished product 0.147
3. Use of IT 0.085
4. Raw material prices 0.082
5. Length of supply chain 0.050
6. Market share 0.049
7. Postponement 0.046
8. Optimization of enterprise 0.029
9. Volume flexibility 0.027
10. Integration with supply chain partners 0.027
11. Steady supply of raw material 0.027
12. Inventory costs 0.027
13. Transportation costs 0.027
14. Physical risks 0.018

49
5.4. Result Analysis
According to the overall weights, four of the most important criteria will be described briefly:
5.4.1. Purity of products
Based on the overall weights, purity of products has the highest weight which means this is
the most important and effective criterion in the whole chain. The first reason which makes
this criterion the most important one can be:
The purity of products is critical in business and helps to guarantee customer satisfaction and
also provide a strong competitive advantage. But if we look deeper into this issue, what is
mentioned before is just an overall view of the importance of refinery’s products purity and
the main reason which makes this criterion significantly important is the problem that Iran’s
refineries plants are being faced with.
Iran is the second largest oil consuming country in the Middle East and its domestic oil
demand is mainly for diesel and gasoline. Iran imported a sizable share of its gasoline supply
and finally decided to increase refining capacity with the aim to become self-sufficient for
gasoline. Iran has had some difficulties by being self-sufficient as its refineries produce low
quality gasoline which does not meet national standards and causes significant air pollution
crisis.
As it seems purity of products must be the main concern of the industry and making progress
towards this criterion can positively affect the industry.
5.4.2. Steady supply of finished product
Steady supply of finished products is in second grade of importance. In order to meet and
improve the performance of a supply chain in this criterion, downstream plants need to make
supply decisions accurately and fast.
“The oil industry supply chain differs from traditional supply chains in that there are
intermediate markets where crude and / or products can be bought or sold between Upstream
crude oil production and final Retail delivery at service station and other end users. These
50
intermediate markets create liquidity within the supply chain that allows arbitration of normal
demand signal” (Nexant’s Chem Systems).
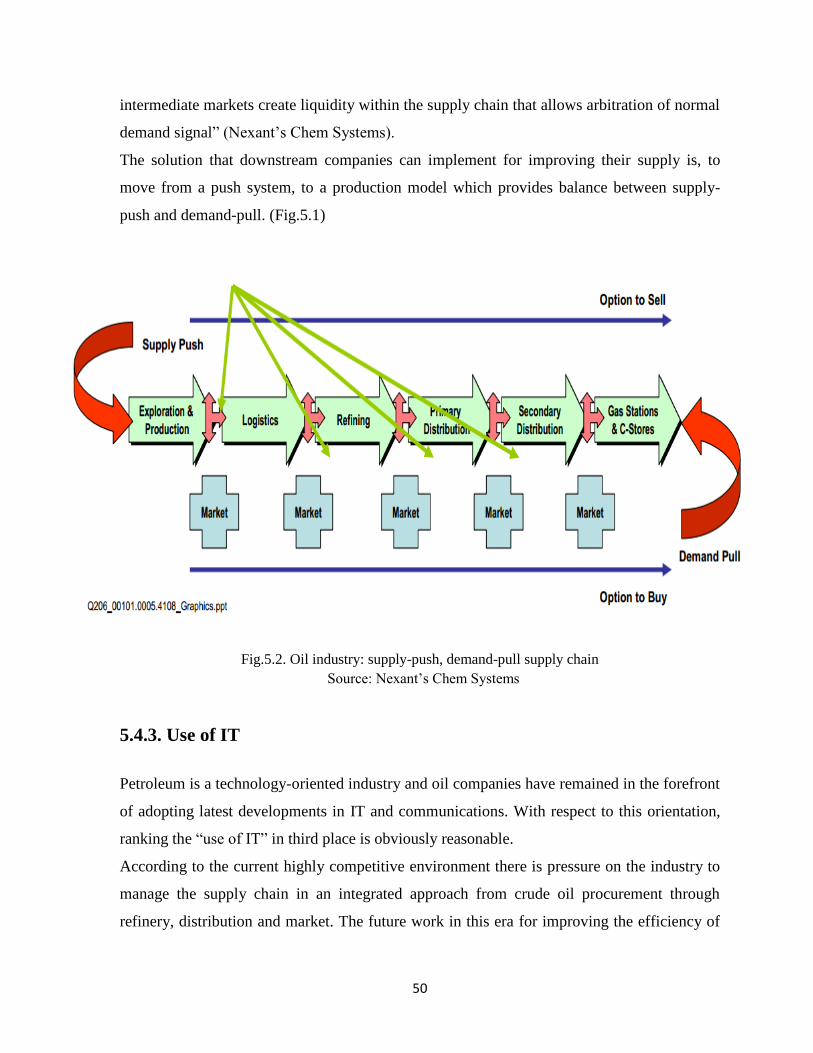
The solution that downstream companies can implement for improving their supply is, to
move from a push system, to a production model which provides balance between supply-
push and demand-pull. (Fig.5.1)
Fig.5.2. Oil industry: supply-push, demand-pull supply chain
Source: Nexant’s Chem Systems
5.4.3. Use of IT
Petroleum is a technology-oriented industry and oil companies have remained in the forefront
of adopting latest developments in IT and communications. With respect to this orientation,
ranking the “use of IT” in third place is obviously reasonable.
According to the current highly competitive environment there is pressure on the industry to
manage the supply chain in an integrated approach from crude oil procurement through
refinery, distribution and market. The future work in this era for improving the efficiency of
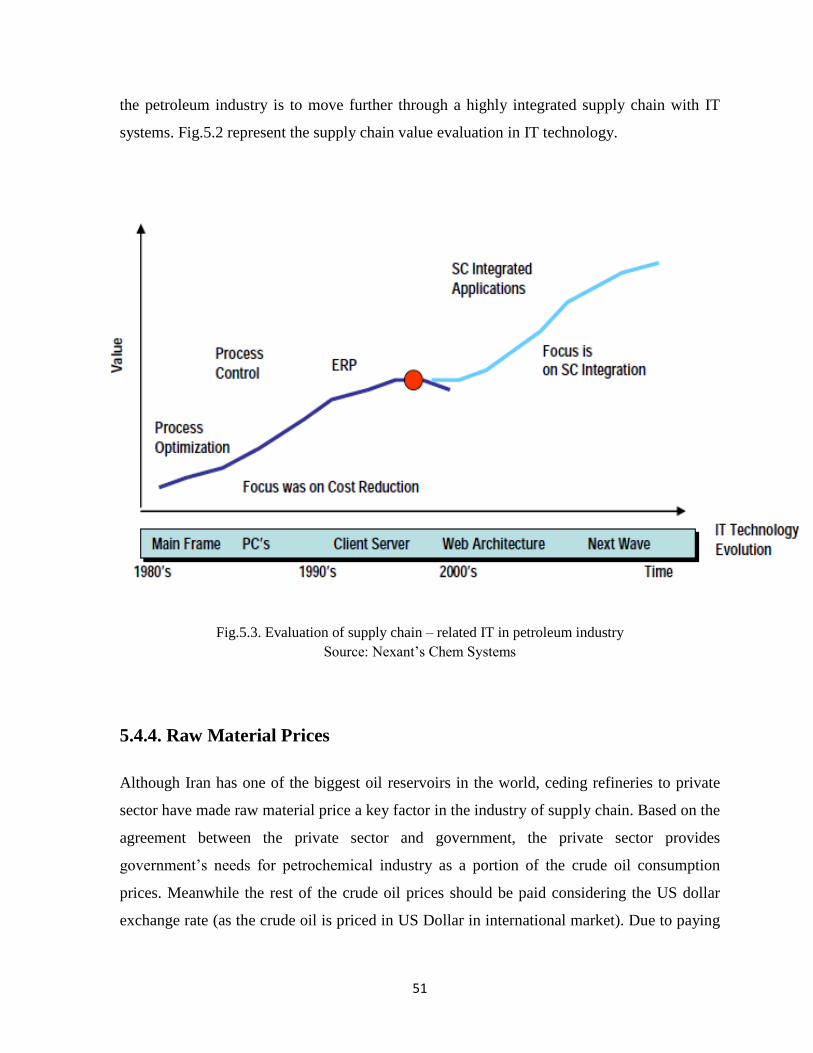
51
the petroleum industry is to move further through a highly integrated supply chain with IT
systems. Fig.5.2 represent the supply chain value evaluation in IT technology.
Fig.5.3. Evaluation of supply chain – related IT in petroleum industry
Source: Nexant’s Chem Systems
5.4.4. Raw Material Prices
Although Iran has one of the biggest oil reservoirs in the world, ceding refineries to private
sector have made raw material price a key factor in the industry of supply chain. Based on the
agreement between the private sector and government, the private sector provides
government’s needs for petrochemical industry as a portion of the crude oil consumption
prices. Meanwhile the rest of the crude oil prices should be paid considering the US dollar
exchange rate (as the crude oil is priced in US Dollar in international market). Due to paying
52
the crude oil price per US Dollar while the refinery’s products are priced in local currencies
(Rial) an improvement in crude oil prices will increase refinery’s margin.
Note: Iran’s currency is not stable and could collapse compared to the US Dollar and this
makes the payment process more complicated for refineries.
Another factor which can be considered in this criterion is the type of crude oil (Sour or
Sweet). Complex refineries can benefit from choosing lower price crude oil. This happens
because Gasoline prices (the main portion of refineries products) rise or fall with crude oil
prices and complex refineries can manufacture cheaper crude oil which leads to improve their
margin during the rise oil prices. The greater complexity of the refinery the greater
profitability.
5.5. Implementing the Model
For implementing the model some steps should be taken as follows:
1. The value of each criterion should be determined. Source of information can be
chosen according to the organization structure.
2. The unit of each criterion value which is obtained in the first step is not uniform as
the criteria from different departments are with different units. In this phase the
values can be uniformed with Likert Scale. With the help of Likert Scale a common
measurement system will be provided for all the criteria.
3. Multiply the Likert Scale value of each criterion by the overall weights of the
criterion and obtain the numerical value for the criterion.
∑
53
6. Conclusion
In this study, a numerical model is presented using the Balance score card (BSC) and
Analytical Hierarchy Process (AHP). The developed model is able to measure the Iranian
petroleum downstream supply chain performance toward the organization strategic
objectives.
In the first step, a questionnaire was designed and distributed between Iranian petroleum
downstream experts. The questionnaire validated criteria under four BSC perspectives.
Furthermore in order to determine a relative weight of criteria, expert’s opinions were
collected in the form of pair wise comparison.
In the next step, the study was focused on analyzing and quantifying the data which was
collected from the industry experts. As the result of these analyses and quantifying the
importance of criteria under the four BSC perspectives with respect to the Iranian petroleum
downstream SCM performance can be concluded as:
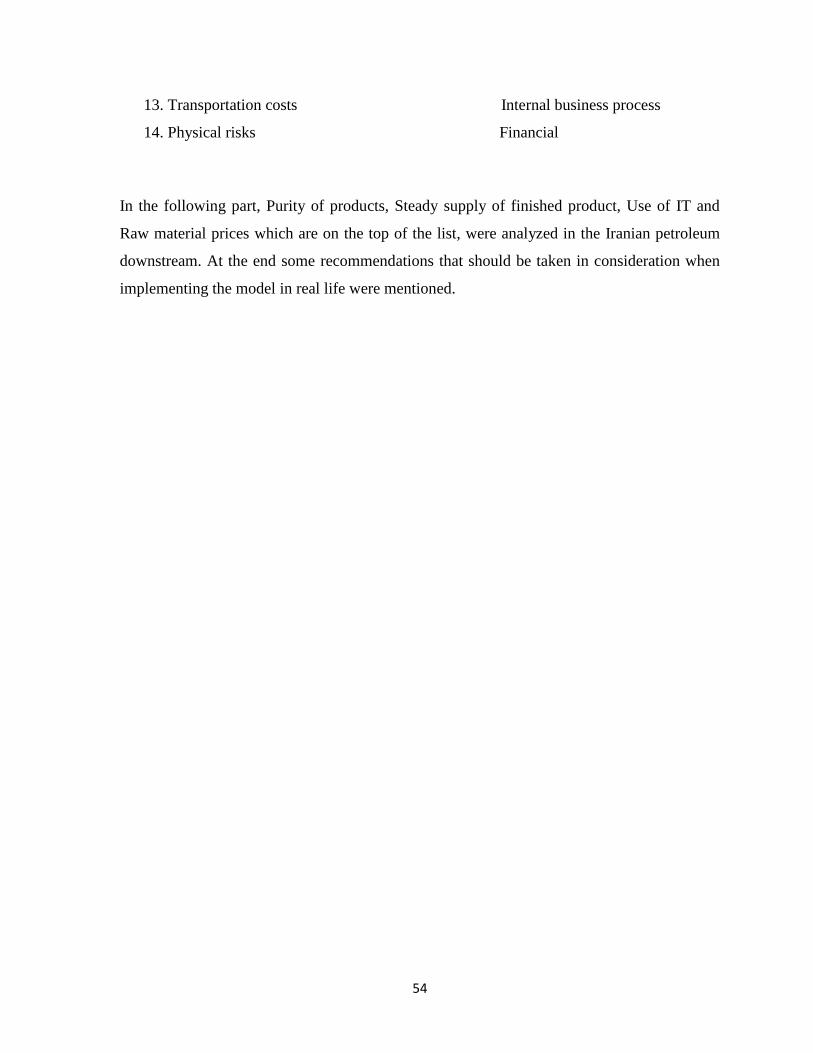
1. Purity of products Customer
2. Steady supply of finished product Customer
3. Use of IT Innovation and learning
4. Raw material prices Financial
5. Length of supply chain Financial
6. Market share Financial
7. Postponement Innovation and learning
8. Optimization of enterprise Internal business process
9. Volume flexibility Internal business process
10. Integration with supply chain partners Internal business process
11. Steady supply of raw material Internal business process
12. Inventory costs Internal business process
54
13. Transportation costs Internal business process
14. Physical risks Financial
In the following part, Purity of products, Steady supply of finished product, Use of IT and
Raw material prices which are on the top of the list, were analyzed in the Iranian petroleum
downstream. At the end some recommendations that should be taken in consideration when
implementing the model in real life were mentioned.
55
References
1. Alaa M. Ghalayini, James S. Noble, (1996)"The changing basis of performance
measurement”, International Journal of Operations & Production Management.
2. Alberto, P. (2000), ‘‘The logistics of industrial location decision: an application of the
analytical hierarchy process methodology’’, International Journal of Logistics:
Research and Application, Vol. 3 No. 3, pp. 273-89.
3. Brewer P. C. and Speh T. W. (2000) Using the Balanced Scorecard to Measure
Supply Chain Performance. Journal of Business Logistics, 21(l):75-94.
4. Brewer Peter C and Speh Thomas W (2001) Adapting the Balanced Scorecard to
Supply Chain Management, Supply Chain Management Review, 5(2):48-55.
5. Bryant Lisa, Jones, Denise A, Widener and Sally K (2004) Managing Value Creation
with the Firm: An Examination of Multiple Performance Measures, Journal of
Management Accounting Research, 16:107-131.
6. Chima,C.M., (2007)."Supply-Chain Management Issues In The Oil And Gas
Industry", Journal of Business & Economics Research, Vol.5, No. 6.
7. Choon Tan,K.,(2001),"A framework of supply chain management literature”, Volume
7, Issue 1.
8. Christopher D. Ittner,David F. Larcker, Marshall W.
Meyer,(1997),"PERFORMANCE, COMPENSATION, AND THE BALANCED
SCORECARD”, The Wharton School, The University of Pennsylvania.
9. Clinton,D.,Webber,S.,Hassell,J.,(2002),"Implementing the Balanced Scorecard Using
the Analytic Hierarchy Process”, Management Accounting Quarterly ,Vol . 3, No. 3.
10. Dewaynel.Searcy, C M A, C P A, C I A, (2004)"Aligning the Balanced Scorecard and
a Firm’s Strategy Using the”, Management Accounting Quarterly, Vol. 5, No. 4.
11. ERNEST H. FORMAN , Robert H. Smith,(2001)"THE ANALYTIC HIERARCHY
PROCESS—AN EXPOSITION”, Operations Research
Vol. 49, No. 4, pp. 469–486.

56
12. Farris II M Theodore and Hutchison Paul D (2002) Cash to Cash: The New Supply
Chain Management Metric, International Journal of Physical Distribution & Logistics
Management, 32(4):288-296.
13. http://www.total.com
14. Hussain, R., Assavapokee, T., Khumawala,B.,(2006)."Supply Chain Management in
the Petroleum Industry: Challenges and Opportunities”, International Journal of
Global Logistics & Supply Chain Management
15. Independent statistic & analysis U.S Energy Information Administration
(www.eia.gov).
16. Kaplan Robert S (2005) How the Balanced Scorecard Complements the McKinsey 7-
S Model, Strategy & Leadership, 33(3):41-46.
17. Kaufman, R. (1997), "Nobody wins until the consumer says, 'I'll take it"', Apparel
Industry Magazine, Vol. 58 No.3, pp. 1 4- 1 6.
18. Manzano,F.S.,(2005)."Supply Chain Practices in the Petroleum Downstream”, Master
thesis, Massachusetts Institute of Technology.
19. Mentzer, J.T., DeWitt, W., Keebler, J.S., Min, S., Nix, N.W., Smith, C.D., et
al,(2001),"Defining supply chain management"JOURNALOF BUSINESS
LOGISTICS.Voi22.No.2.
20. Monczka, R.M. and Morgan, J. (1997), “What’s wrong with supply chain
management?”
Vol. 122 No. 1, pp. 69-73.
21. New, S.J., Payne, P., (1995)." Research frameworks in logistics: three models, seven
dinners and a survey", International Journal of Physical Distribution and Logistics
Management 25 (10), 60}77.
22. Nexant's chem systems (2006)"impact of supply chain IT Application on the refining
industry ".
23. Parker, C. (2000), ‘‘Performance measurement’’, Work Study, Vol. 49 No. 2, pp. 63-
6.
24. Rhonda R. Lummus, Robert J. Vokurka, (1999),"Defining supply chain management:
a historical perspective and practical guidelines", Industrial Management & Data
Systems, Vol. 99 Iss: 1 pp. 11 – 17.

57
25. Robert S.Kaplan, David P.Norton, (1992)"The balance scorecard measures that drive
performance”, Harvard business review.
26. SAATY, T.L. 1980. The analytic hierarchy process. McGraw-Hill: New York.
27. Saaty, T.L., (1994), Fundamentals of Decision Making and Priority Theory with The
Analytic Hierarchy Process, Vol. VI, RWS Publications, Pittsburgh.
28. Saaty,T.L.,(2008),"Decision making with the analytic hierarchy process",Int. J.
Services Sciences, Vol. 1, No. 1.
29. Scott,C., Lundgren,H., Thompson,P.,(2011). "Guide to Supply Chain Management".
30. Sowmya, A., Chaudhary,A. , Jasuja,A., Kanade,S.,Panda,S.,(2009)."SUPPLY CHAIN
IN THE PETROLEUM INDUSTRY", [online] available: www.slideshare.net.
31. Varma, S.,Wadhwa, S. and Deshmukh, S.G. (2006), ‘‘Measuring productivity in the
supply chain: use of the balanced scorecard’’, Productivity, Vol. 46 No. 2-3, pp. 330-
8.
32. Varma,S., S.G. Deshmukh,(2009),"Evaluating Petroleum Supply Chain Performance:
Overcoming Shortcomings of Balanced Scorecard”, Global Journal of Flexible
Systems Management , Vol. 10, No. 4, pp 11-22.
33. Varma,S., Wadhwa,S., S.G. Deshmukh,(2008)"Evaluating petroleum supply chain
performance: Application of analytical hierarchy process to balanced scorecard”, Asia
Pacific Journal of Marketing and Logistics,Vol. 20 No. 3.
34. Wen-Hsiang Wu .Chang-tzu Chiang . Chin-tsai Lin,(2008),"Comparing the
aggregation methods in the analytic hierarchy process when uniform
distribution",WSEAS TRANSACTIONS on BUSINESS and ECONOMICS, Issue 3,
Volume 5.

58
APPENDIX
59
Appendix A
Likert Scale Questionnaire
Please place an “X” in the appropriate box to indicate the importance of each item for
determining petroleum supply chain performance. Criteria have been derived from the
strategic objectives that petroleum companies must have.
Criteria of Balance Score Card Perspective
Not at all
important
Slightly
important Important
Extremely
important
1 2 . 0
Customer Purity of product
Steady supply of finished product
Financial
Raw material prices
Length of supply chain
(Physical risks (fire etc
Market share
Internal
business
process
Steady supply of raw material
Transportation management
Inventory management
Integration with supply
chain partners
Optimization of enterprise
Volume flexibility
Innovation
and
learning
Use of IT
Postponement
Please suggest if you think there is any additional criterion that is important in the evaluation
of the petroleum supply chain.
Thank you

60
Appendix B
AHP Pairwise Comparison
Please place an “X” in the appropriate box to indicate which item in each pair, if any, is more important than the other for the company to succeed.
1=EQUAL (the categories are of equal importance in the scorecard)
3=MODERATE (one of the categories is slightly more important that the other)
5=STRONG (one of the categories is strongly favored over the other)
7=VERY STRONG (one of the categories is strongly favored over the other, and its dominance is demonstrated in practice)
9=EXTREME (the difference in importance between the two categories is so extreme that the categories are on the verge of not being comparable)
Consider the following example:
customer 9 7 5 3
1 3 5 7 9 Financial
In this example, the customer category is judged to be strongly more important than the
financial category.
Job title: Academic degree:
Level One (Scorecard Category):
Innovation & learning 9 7 5 3 1 3 5 7 9 Financial
Innovation & learning 9 7 5 3 1 3 5 7 9 customer
Innovation & learning 9 7 5 3 1 3 5 7 9 Internal business process
Internal business process 9 7 5 3 1 3 5 7 9 Financial
Internal business process 9 7 5 3 1 3 5 7 9 customer
customer 9 7 5 3
1 3 5 7 9 Financial

61
Appendix B
AHP Pairwise Comparison (continued)
Level Two (Metrics to Use in Each Scorecard Category):
Internal Business Process
Steady supply of raw material 9 7 5 3
1 3 5 7 9 Transportation management
Steady supply of raw material 9 7 5 3
1 3 5 7 9 Inventory management
Steady supply of raw material 9 7 5 3
1 3 5 7 9 Integration with supply chain partners
Steady supply of raw material 9 7 5 3
1 3 5 7 9 Optimization of enterprise
Steady supply of raw material 9 7 5 3
1 3 5 7 9 Volume flexibility
Transportation management 9 7 5 3
1 3 5 7 9 Inventory management
Transportation management 9 7 5 3
1 3 5 7 9 Integration with supply chain partners
Transportation management 9 7 5 3
1 3 5 7 9 Optimization of enterprise
Transportation management 9 7 5 3
1 3 5 7 9 Volume flexibility
Inventory management 9 7 5 3
1 3 5 7 9 Integration with supply chain partners
Inventory management 9 7 5 3
1 3 5 7 9 Optimization of enterprise
Inventory management 9 7 5 3
1 3 5 7 9 Volume flexibility
Integration with supply chain partners 9 7 5 3
1 3 5 7 9 Optimization of enterprise
Integration with supply chain partners 9 7 5 3
1 3 5 7 9 Volume flexibility
Optimization of enterprise 9 7 5 3
1 3 5 7 9 Volume flexibility
Customer
customer 9 7 5 3
1 3 5 7 9 Financial

62
Appendix B
AHP Pairwise Comparison (continued)
Financial perspective
Raw material prices 9 7 5 3
1 3 5 7 9 Length of supply chain
Raw material prices 9 7 5 3
1 3 5 7 9 Physical risks (fire etc)
Raw material prices 9 7 5 3
1 3 5 7 9 Market share
Length of supply chain 9 7 5 3
1 3 5 7 9 Physical risks (fire etc)
Length of supply chain 9 7 5 3
1 3 5 7 9 Market share
Physical risks (fire etc) 9 7 5 3
1 3 5 7 9 Market share
Innovation and Learning
Use of IT 9 7 5 3
1 3 5 7 9 Postponement
Thank you
63
Appendix C
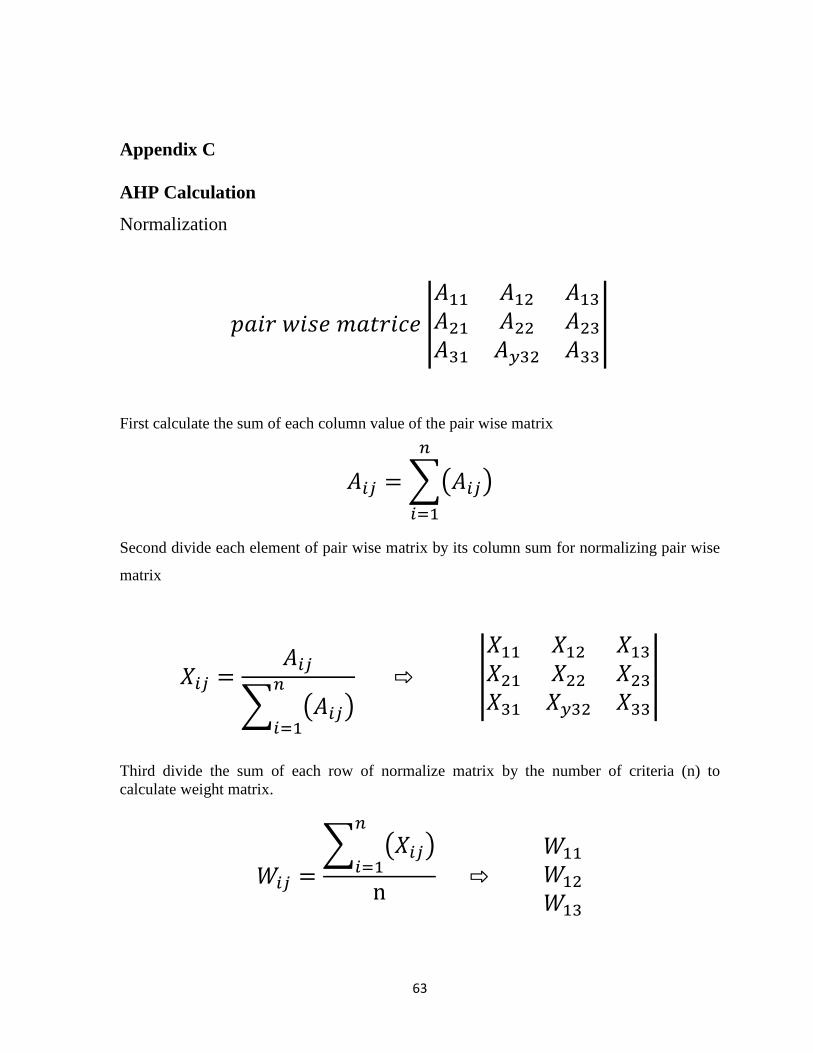
AHP Calculation
Normalization
|
|
First calculate the sum of each column value of the pair wise matrix
∑( )
Second divide each element of pair wise matrix by its column sum for normalizing pair wise
matrix
∑ ( )
|
|
Third divide the sum of each row of normalize matrix by the number of criteria (n) to
calculate weight matrix.
∑ ( )

64
Appendix C
AHP Calculation (continued)
Consistency ratio check
For checking consistency ratio first we should multiply the pair wise matrix by the weights
|
|*
= |
|
Afterwards each element of the new matrix should be divided by the criteria weight to
calculate the consistency vector
λ is calculated by averaging the value of the consistency vector
∑