Measuring graduate students’ teaching and research skills … · · 2013-08-02researchers;...
32
Measuring graduate students’ teaching and research skills through self-report: Descriptive findings and validity evidence Joanna Gilmore, M.Ed. Educational Studies, University of South Carolina [email protected] David Feldon, Ph.D. STEM Education, University of Virginia [email protected] Paper presented at the Annual Meeting of the American Educational Research Association, Denver, CO, April 30-May 4, 2010.
-
Upload
trannguyet -
Category
Documents
-
view
221 -
download
3
Transcript of Measuring graduate students’ teaching and research skills … · · 2013-08-02researchers;...

Measuring graduate students’ teaching and research skills through self-report:
Descriptive findings and validity evidence
Joanna Gilmore, M.Ed.
Educational Studies, University of South Carolina
David Feldon, Ph.D.
STEM Education, University of Virginia
Paper presented at the Annual Meeting of the American Educational Research Association,
Denver, CO, April 30-May 4, 2010.

Abstract
This study extends research on graduate student development by examining descriptive findings
and validity of a self-report survey designed to capture graduate students’ assessments of their
teaching and research skills. Descriptive findings provide some information about areas of
growth among graduate students’ in the first years of their graduate studies. Validity is
examined using a retrospective think-aloud method and by exploring the relationship between
responses to the self-report survey and other measures of participants’ teaching and research
skills. Findings indicate that several factors contribute to graduate students’ perceptions of their
research and teaching skills such as their personal values and research and teaching practices.
Additionally, participants’ self-reported teaching and research skills were inconsistent with the
perceptions of their students and researchers, respectively. These findings support previous
research indicating that the interpretation of personal efficacy instruments may be problematic
(Tshannen-Moran et al., 1998).
Introduction
Given that a primary purpose of graduate school is to prepare graduate students to assume
professorial responsibilities, it is of utmost importance that they develop both teaching skills and
research skills. The activity of teaching is critical in the development of teaching skills.
Conducting research is also important in the development of research skills. However, recent
investigations into the relationship between teaching and research among graduate students
suggest that teaching experiences may also impact graduate students’ research skills while
involvement in research has the potential to influence teaching skill development.
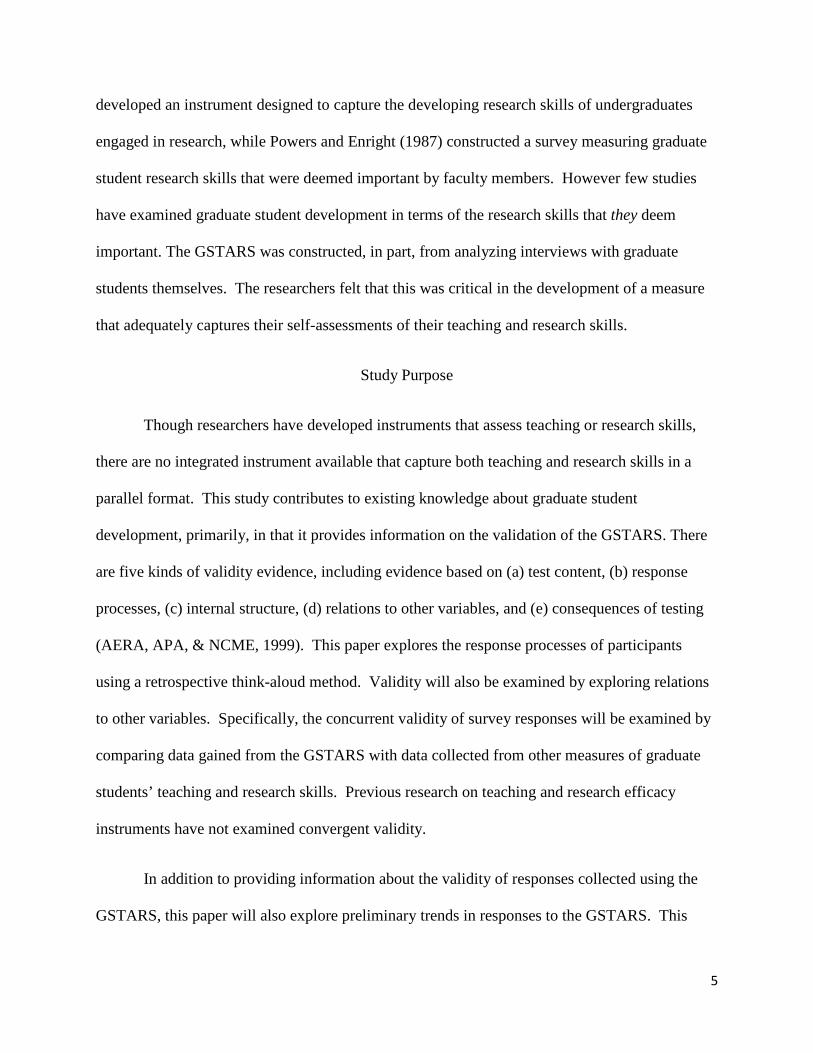
Lyons, Fisher & Thompson (2005) found that graduate students reported improvement in
their research skills as a result of participation in their graduate teaching fellowship programs.
The graduate students in their study participated in teaching experiences specifically designed for
graduate students to develop inquiry-based teaching skills (skills that allow teachers to better
facilitate students’ ability to ask questions, develop hypothesis, and identify methods that allow
them to investigate their questions). As Steigelmeyer and Feldon (2009) explained, inquiry-
based teaching methods and research share cognitive processes as “researchers-in-training must
reflect carefully on their own experiences and knowledge to refine their understandings of events
in a similar way that teachers using inquiry-based methods must carefully analyze knowledge to
scaffold students‘ learning effectively” (p. 2).
Researchers have gained interest in further exploring the relationship between teaching
and research and how each of these activities (as well as the integration of these activities)
impact the development of graduate students’ teaching and research skills (Deen & Lucas, 2006;
Maher, Timmerman, Hurst, & Gilmore, 2009; Robertson & Blackler, 2006; Steigelmeyer &

4
Feldon, 2009). However, one barrier to examining these relationships stems from the lack of
validated instruments designed to capture each of these areas in tandem (teaching skills and
research skills). The use of a parallel format will allow researchers to compare graduate
students’ perceptions of their teaching skills with their research skills. There are several existing
instruments that capture either skills of effective teachers or researchers and these instruments
will be described in the literature review. This information informed the development of a survey
designed to capture graduate students teaching and research skills (GSTARS).
Literature Review
Measures of Teaching and Research Skills
Several instruments measure teaching skills, some of which are completed by an external
observer (e.g., Peterson, Kromrey, & Borg, 1990). Other instruments require students to
evaluate their teachers’ competencies. For example, college students often complete summative
evaluations of their instructors’ effectiveness (Costin, Grenough, & Menges, 1971). When
teachers self-report the effectiveness of their teaching, the construct measured is referred to as
teacher efficacy (Tschannen-Moran, Hoy, & Hoy, 1998). Teaching efficacy instruments (e.g.,
Gibson & Dembo, 1984) measure similar teaching skills as instruments completed by external
observers. However, they often include measures of factors that are external to the teacher, such
as the extent to which students’ socio-economic status predicts learning outcomes. The
GSTARS was designed to only capture the factors that are internal to the teacher, such as
knowledge of their content area.
Fewer studies have been conducted examining important research skills of developing
researchers; however, some work in this area is available. For example, Kardash (2000)
5
developed an instrument designed to capture the developing research skills of undergraduates
engaged in research, while Powers and Enright (1987) constructed a survey measuring graduate
student research skills that were deemed important by faculty members. However few studies
have examined graduate student development in terms of the research skills that they deem
important. The GSTARS was constructed, in part, from analyzing interviews with graduate
students themselves. The researchers felt that this was critical in the development of a measure
that adequately captures their self-assessments of their teaching and research skills.
Study Purpose
Though researchers have developed instruments that assess teaching or research skills,
there are no integrated instrument available that capture both teaching and research skills in a
parallel format. This study contributes to existing knowledge about graduate student
development, primarily, in that it provides information on the validation of the GSTARS. There
are five kinds of validity evidence, including evidence based on (a) test content, (b) response
processes, (c) internal structure, (d) relations to other variables, and (e) consequences of testing
(AERA, APA, & NCME, 1999). This paper explores the response processes of participants
using a retrospective think-aloud method. Validity will also be examined by exploring relations
to other variables. Specifically, the concurrent validity of survey responses will be examined by
comparing data gained from the GSTARS with data collected from other measures of graduate
students’ teaching and research skills. Previous research on teaching and research efficacy
instruments have not examined convergent validity.
In addition to providing information about the validity of responses collected using the
GSTARS, this paper will also explore preliminary trends in responses to the GSTARS. This

6
information may be useful as a point of comparison if researchers, faculty, or administrators,
administer the GSTARS to graduate students at their institutions.
This study also informs a larger NSF project investigating how graduate students’
teaching and research skills develop. After the first year of the NSF project, the research group
identified the need for an additional measure of participants’ teaching and research skills that
were obtained from the perspective of the participant. Though interviews provided some
information about participants’ views of their skills, the quality of such data varied greatly. For
example, when asked to identify their strengths as teacher and researcher, many participants
identified only one skill and many noted that they were not aware of the range of skills necessary
for teaching and research. The GSTARS was initially developed to meet this need.
Method
Participants
All data used in this study were obtained from graduate students in sciences, technology,
engineering, and mathematics (STEM) fields. Participants were typically enrolled in their first
years of graduate study. Specifically, 30 (66.0%) were enrolled in their first year of graduate
study, 10 (21.3%) were in their second year, 3 (6.4%) were in their third year, and 3 (6.4%) were
in their fourth year or beyond of their current degree programs. Participants were recruited from
two universities. University 1 is located in the Southeastern United States and is a research-
extensive university (Carnegie Foundation for the Advancement of Teaching, 2010). University
2 is a larger master’s-granting university and is located in the Northeastern United States
(Carnegie Foundation for the Advancement of Teaching, 2010). Almost half of the participants
(n=21, 44.7%) spoke English as a second language.

7
Table 1 shows the number of participants who completed the GSTARS in Fall 2008
(n=47) and Spring 2009 (n=34), the degrees that these participants are pursuing, and the
condition to which they have been assigned for the larger NSF study (including participants who
are only teaching, only conducting research, or teaching and conducting research during 2008-
2009).
Table 1
Number of Participants Completing Survey at Each Administration
Semester of Administration Student Demographic
Number of Participants Fall 2008 47 Degree Pursuit:
Ph.D. 22 Master’s
25 Condition: Teaching Only
4 Research Only
24 Teaching and Research
17 Unclassifieda
2 Spring 2009 34 Degree Pursuit:
Ph.D. 18 Master’s
16 Condition: Teaching Only
4 Research Only
19 Teaching and Research
10 Unclassifieda
1 aThese participants did not complete an interview thus not enough information was available on these individuals in order to evaluate their teaching and research activities as a graduate student.
Instruments and Data Collection
The GSTARS (Appendix A) was developed, in part, from previous research that explores
the skills of effective teachers and researchers (e.g., Dharmadasa, 1999; Irish Universities
Association, 2008). The instrument was also informed by preliminary findings from semi-
structured interviews with graduate students during the first year of the larger NSF project (see
Gilmore, Maher, & Hurst, 2009; Hurst, Maher, & Gilmore, 2009). Cronbach’s alpha indicated
that the GSTARS has good reliability (.840 for fall administration and .905 for spring).

8
The Reformed Teaching Observation Protocol (RTOP; MacIsaac & Falconer, 2002)
provided an empirical measure of participants’ teaching skills. The RTOP was used to reliably
score participants’ inquiry-based teaching practices. The RTOP contains 25 items which were
developed from the principles of effective inquiry teaching put forth by the American
Association for the Advancement of Science (Adamson, Banks, Burtch, Cox, Judson, Turley,
Benford, & Lawson, 2003) and the National Council of Teachers of Mathematics and the
National Association of Science Teachers (MacIsaac & Falconer, 2002). Video recordings of the
participants were scored by two independent raters and final scores were tabulated by averaging
the two ratings. All raters were trained by MacIssac and Falconer and interrater reliability was
assessed at α=.771.
The Learning Environment Inventory (LEI; Fraser, 2002) was also used to measure
participants’ teaching practices. It evaluates teachers’ ability to create a productive learning
environment. It is a combination of two previously validated instruments: (1) The Constructivist
Learning Environment Survey (CLES; Taylor, P.C., Fraser, & Fisher, 1997) and (2) What is
Happening in this Class? (WIHIC; Aldridge, Fraser & Huang, 1999). It includes 34 items and 5
subscales including (1) Personal Relevance—connections between classroom topics and the
“real world,” (2) Student Negotiation—development of social discourse in the classroom, (3)
Uncertainty—tentative nature of science, (4) Involvement—social discourse and (5)
Investigation—science process skills. Each item is ranked along a five point scale (almost never,
seldom, sometimes, often, almost always). The LEI was administered to the students that the
participants taught during 2008-2009. The average response to each item among all of the
participants’ students was used for this study.

9
Both RTOP and LEI data were gathered in the early fall and late spring, close to the times
at which the GSTARS data were gathered. LEI and RTOP data were available for 9 participants
for the Fall and 7 participants for the Spring.
An empirical measure of graduate students’ research skills was also collected from 18
participants in Fall 2008 and 26 in Spring 2009. In early Fall 2008, participants received detailed
directions to develop research proposals in their field of study. Section headings (Introduction,
Methods, Results, Discussion, Literature Cited), descriptions, and criteria were explicitly
delineated. Participants were strongly encouraged to use resources and citations styles typical
for their field. The proposal was framed as an effort that could be directly applicable to NSF
Graduate Fellowship applications and/or grant proposals. Participants submitted their research
proposal in mid to late September and revised and resubmitted their proposals in early May.
Proposals were evaluated using a modified version of the Universal Lab Rubric (ULR) that
assesses the quality of scientific writing (Timmerman, 2008; Timmerman, et al., in press). To
ensure that rubric ratings were valid (i.e., they accurately reflected each student’s academic
writing skills), each research proposal was submitted to SafeAssign™ plagiarism detection
software (for results see Gilmore, Strickland, Timmerman, Maher, & Feldon, in press).
Descriptive Analyses
This study will first present descriptive findings for the GSTARS beginning with general
trends. The data will then be disaggregated by participants’ degree level (master’s vs. Ph.D.) and
involvement in teaching and research activities. Analysis of data with respect to these variables
may be useful in identifying any unique patterns among specific subcultures of graduate
students. For example, degree level may be an important factor in understanding how graduate

10
students’ perceive their teaching and research skills as there are differing expectations for
master’s and doctoral students. For example, in the United States, the distinguishing feature of a
Master’s degree is the shorter degree duration and more constrained scope of the thesis, the
culminating research project. Doctoral degrees are typically longer and involve a broader scope
of research investigation. Thus doctoral students may be expected to acquire more sophisticated
research skills.
Examination of Validity
Concurrent validity of the GSTARS was examined using two measures of teaching skills
and one measure of research skill. First, a content analysis was conducted to compare constructs
measured in the GSTARS, the LEI, the RTOP, and the URL. The researchers identified 11
constructs that were measured in both the GSTARS and either the LEI, the RTOP, or the URL
(see table 2). Researchers considered the construct measured in each of these items to be
congruent. Spearman’s rho correlations coefficients were computed between congruent items
and subscales and total scale scores.
Table 2 Items Measuring Congruent Constructs Across Measures Construct Item Letter
on GSTARS Item
Number(s) on RTOP
Item Number(s)
on LEI
Criteria on URL
Structuring a productive learning environment.
Tb 14,15,18, & 20
Engaging students in learning. Tc 2 Connections with real-world
Tf 1,2,3,4,5,&
Facilitating student investigations. Tg 3 & 24 Encouraging multiple problem-solving approaches.
Th 4

11
Adjusting instruction to meet students’ needs.
Tk 19,20,22,& 23
Locating scholarly literature Rc Primary Literature
Writing skills Rd Writing Quality Quantitative skills Rf Data
Presentation & Data Analysis
Formulating Research Questions Rh Research Question
Understanding the Impact of Research Rj Introduction & Broader Impacts
Retrospective think-aloud procedures involved participants sharing their thoughts about
how they responded to a given task in the past (Collins, 2003). Think-alouds were conducted
with participants regarding their GSTARS responses. These interviews generally occurred
within the two weeks following the final administration of the GSTARS. Identifying gains in
teaching and research skills was the primary purpose of the GSTARS within the larger NSF
study. The think-aloud provided information about the extent to which changes in graduate
students’ responses on the GSTARS from fall to spring reflected real changes in graduate
students’ skills, providing evidence of participants’ response processes.
Results
Comparison of tables 3 and 4 shows that, overall, participants rated their research skills
higher than their teaching skills. Generally, participants made slightly larger gains in teaching
skills as compared to research skills. As a whole, participants reported improvements in all
research and teaching skills except time management which showed a slight decline in mean
12
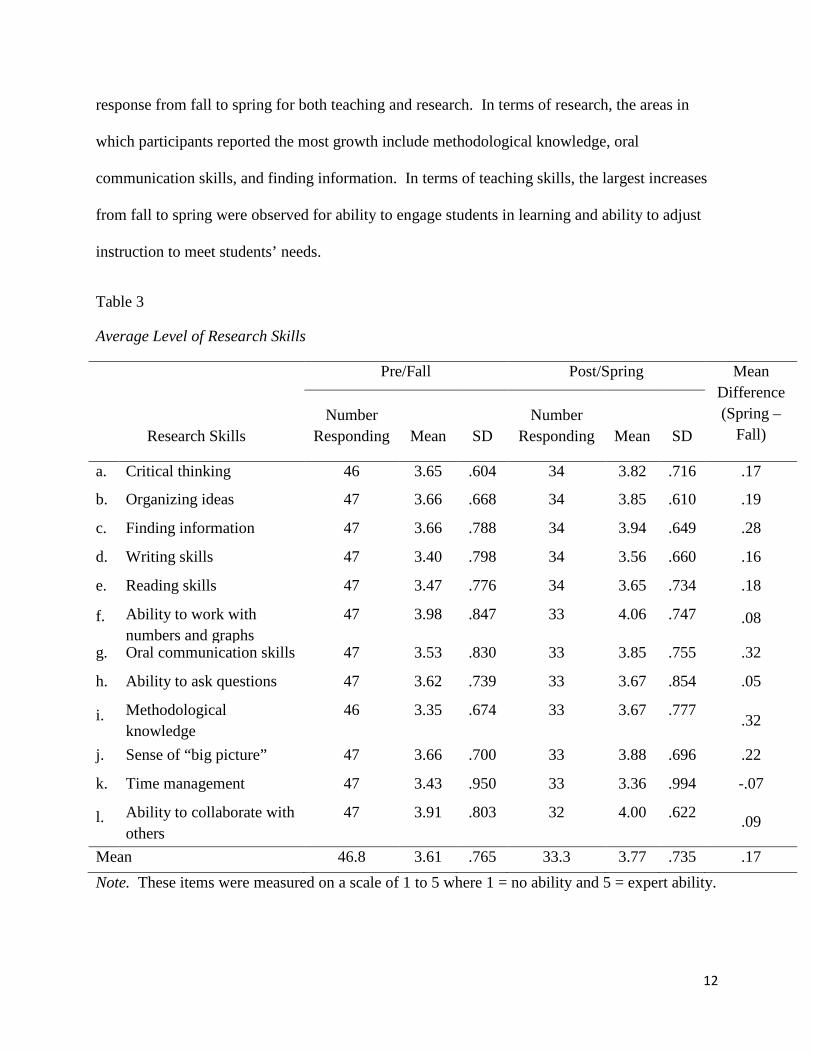
response from fall to spring for both teaching and research. In terms of research, the areas in
which participants reported the most growth include methodological knowledge, oral
communication skills, and finding information. In terms of teaching skills, the largest increases
from fall to spring were observed for ability to engage students in learning and ability to adjust
instruction to meet students’ needs.
Table 3
Average Level of Research Skills
Pre/Fall Post/Spring Mean Difference (Spring –
Fall)
Research Skills Number
Responding Mean SD Number
Responding Mean SD
a. Critical thinking 46 3.65 .604 34 3.82 .716 .17
b. Organizing ideas 47 3.66 .668 34 3.85 .610 .19
c. Finding information 47 3.66 .788 34 3.94 .649 .28
d. Writing skills 47 3.40 .798 34 3.56 .660 .16
e. Reading skills 47 3.47 .776 34 3.65 .734 .18
f. Ability to work with numbers and graphs
47 3.98 .847 33 4.06 .747 .08
g. Oral communication skills 47 3.53 .830 33 3.85 .755 .32
h. Ability to ask questions
47 3.62 .739 33 3.67 .854 .05
i. Methodological knowledge
46 3.35 .674 33 3.67 .777 .32
j. Sense of “big picture” 47 3.66 .700 33 3.88 .696 .22
k. Time management 47 3.43 .950 33 3.36 .994 -.07
l. Ability to collaborate with others
47 3.91 .803 32 4.00 .622 .09
Mean 46.8 3.61 .765 33.3 3.77 .735 .17 Note. These items were measured on a scale of 1 to 5 where 1 = no ability and 5 = expert ability.

13
Table 4
Average Level of Teaching Skills
Pre/Fall Post/Spring Mean Difference (Spring –
Fall)
Teaching Skills
Number Responding Mean SD
Number Responding Mean SD
a. Ability to plan for instruction
35 3.51 .781 31 3.68 .748 .17
b. Ability to structure a productive learning environment
34 3.15 .657 32 3.44 .716 .29
c. Ability to engage students in learning
37 3.11 .658 32 3.69 .693 .58
d. Ability to develop relationships with students
39 3.46 .756 32 3.84 .808 .38
e. Ability to provide clear explanations and examples
41 3.41 .670 32 3.78 .706 .37
f. Ability to make connections with other disciplines or real world phenomenon
40 3.60 .900 32 3.81 .693 .21
g. Ability to facilitate student investigation
34 3.15 .610 32 3.41 .798 .26
h. Ability to encourage multiple problem solving approaches
37 3.14 .822 31 3.48 .962 .34
i. Ability to promote strong conceptual understanding
38 3.39 .718 32 3.59 .756 .20
j. Ability to identify student misconceptions
38 3.34 .847 32 3.59 .712 .25
k. Ability to adjust instruction to meet students’ needs
37 3.30 .777 32 3.72 .772 .42
l. Ability to evaluate the effectiveness of instruction
34 3.03 .758 32 3.41 .665 .38
m
Time management 40 3.50 1.062 32 3.47 .842 -.03

14
n. Knowledge of subject area
40 3.85 .622 32 3.94 .669 .09
Mean 37.4 3.35 .759 31.8 3.63 .753 .28
Note. These items were measured on a scale of 1 to 5 where 1 = no ability and 5 = expert ability.
Tables 5-9 present descriptive statistics for the GSTARS by participants’ degree level
(Master’s vs. Ph.D.) and involvement in teaching and research (teaching only, research only,
teaching and research). Tables 5 and 6 show that, overall, master’s level students reported higher
levels of both teaching and research skills as compared with doctoral students. Tables 7 and 8
show that participants who engaged in teaching and research activities reported slightly higher
levels of research skills in the fall and made larger gains by spring as compared with graduate
students who only conducted research or taught. In terms of teaching skills, the teaching only
group had the highest level of teaching skills in the fall. By spring, however, the teaching and
research group reported higher levels of teaching skills.
Table 5
Differences between Master’s Level and Ph.D. Level Participants in Terms of Research Skills
Ph.D. Level Participants Master’s Level Participants
Research Skills Fall Mean Spring Mean Fall Mean Spring Mean
a. Critical thinking 3.77 3.76 3.54 3.88
b. Organizing ideas 3.68 3.76 3.64 3.94
c. Finding information 3.50 3.71 3.80 4.18
d. Writing skills 3.36 3.47 3.44 3.65
e. Reading skills 3.41 3.41 3.52 3.88
f. Ability to work with numbers and graphs
4.32 4.06 3.68 4.06

15
g. Oral communication skills 3.23 3.69 3.80 4.00
h. Ability to ask questions 3.41 3.44 3.80 3.88
i. Methodological knowledge
3.41 3.69 3.29 3.65
j. Sense of “big picture” 3.55 3.75 3.76 4.00
k. Time management 3.14 3.31 3.68 3.41
l. Ability to collaborate with others
3.68 3.93 4.12 4.06
Mean 3.54 3.67 3.67 3.88 Note. These items were measured on a scale of 1 to 5 where 1 = no ability and 5 = expert ability.
Table 6
Differences between Master’s Level and Ph.D. Level Participants in Terms of Teaching Skills
Ph.D. Level Participants Master’s Level
Participants
Teaching Skills Fall Mean Spring Mean Fall Mean Spring Mean
a. Ability to plan for instruction
3.47 3.64 3.55 3.71
b. Ability to structure a productive learning environment
3.07 3.33 3.21 3.53
c. Ability to engage students in learning
2.82 3.53 3.35 3.82
d. Ability to develop relationships with students
3.11 3.67 3.80 4.00
e. Ability to provide clear explanations and
3.32 3.93 3.50 3.65
f. Ability to make connections with other
3.39 3.60 3.77 4.00
g. Ability to facilitate student investigation
3.06 3.27 3.22 3.53
h. Ability to encourage multiple problem solving
3.19 3.36 3.10 3.59
i. Ability to promote strong conceptual understanding
3.29 3.47 3.48 3.71

16
j. Ability to identify student misconceptions
3.39 3.60 3.30 3.59
k. Ability to adjust instruction to meet
3.28 3.80 3.32 3.65
l. Ability to evaluate the effectiveness of
2.93 3.33 3.11 3.47
m. Time management 3.22 3.47 3.73 3.47
n. Knowledge of subject area
3.95 3.93 3.76 3.94
Mean 3.25 3.57 3.44 3.69
Note. These items were measured on a scale of 1 to 5 where 1 = no ability and 5 = expert ability.
Table 7
Mean Level of Research Skills Among Participants who Only Teach, Only do Research, or do Both Teaching and Research
Teaching Only
Research Only Teaching and
Research
Research Skill Fall
Mean Spring Mean
Fall Mean
Spring Mean
Fall Mean
Spring Mean
a. Critical thinking 3.75 4.00 3.61 3.89 3.71 3.70
b. Organizing ideas 3.75 3.50 3.58 3.95 3.82 3.80
c. Finding information 3.25 3.75 3.79 4.00 3.65 3.90
d. Writing skills 3.25 3.75 3.46 3.42 3.41 3.80 e. Reading skills 3.25 3.25 3.58 3.68 3.41 3.80
f. Ability to work with numbers and graphs
4.50 4.75 3.88 4.00 4.00 3.90
g. Oral communication skills 3.50 3.50 3.63 3.83 3.41 4.00 h. Ability to ask questions 3.50 3.75 3.54 3.56 3.76 3.80 i. Methodological knowledge 3.25 3.75 3.22 3.39 3.53 4.10 j. Sense of “big picture” 3.50 3.75 3.63 3.89 3.71 3.90
k. Time management 3.00 3.00 3.29 3.28 3.65 3.60
l. Ability to collaborate with others
3.75 3.75 4.04 4.06 3.76 4.00
Mean 3.52 3.60 3.60 3.65 3.65 3.86

17
Note. These items were measured on a scale of 1 to 5 where 1 = no ability and 5 = expert ability.
Table 8
Mean Level of Teaching Skills Among Participants who Only Teach, Only do Research, or do Both Teaching and Research
Teaching Only
Research Only Teaching and
Research
Teaching Skills Fall
Mean Spring Mean
Fall Mean
Spring Mean
Fall Mean
Spring Mean
a. Ability to plan for instruction
3.50 3.67 3.57 3.47 3.44 4.00
b. Ability to structure a productive learning environment
3.50 3.75 3.15 3.18 3.06 3.80
c. Ability to engage students in learning
3.25 3.50 3.00 3.65 3.18 3.90
d. Ability to develop relationships with students
3.50 3.00 3.65 4.00 3.24 3.90
e. Ability to provide clear explanations and examples
4.00 4.00 3.33 3.53 3.29 4.10
f. Ability to make connections with other disciplines or real world phenomenon
3.25 3.00 3.65 3.88 3.59 4.00
g. Ability to facilitate student investigation
2.75 3.00 2.92 3.35 3.38 3.60
h. Ability to encourage multiple problem solving approaches
3.25 3.33 3.29 3.41 3.00 3.60
i. Ability to promote strong conceptual understanding
3.50 3.75 3.53 3.76 3.24 3.30
j. Ability to identify student misconceptions
4.00 3.50 3.38 3.53 3.18 3.70
k. Ability to adjust instruction to meet students’ needs
3.50 3.50 3.13 3.71 3.35 3.80
l. Ability to evaluate the effectiveness of instruction
3.50 3.50 3.00 3.35 2.94 3.50

18
m. Time management 3.00 3.00 3.41 3.47 3.65 3.70
n. Knowledge of subject area 4.25 4.50 3.76 3.88 3.82 3.80
Mean 3.48 3.41 3.34 3.34 3.31 3.76
Note. These items were measured on a scale of 1 to 5 where 1 = no ability and 5 = expert ability.
Tables 9 and 10 present correlations between responses to the GSTARS and congruent
constructs on the LEI, the RTOP, and the URL. Results indicate that the correlation between
congruent constructs was usually quite low and frequently negative. The only significant
correlation occurred for the fall between the items which measured participants’ quantitative
research skills (Rho= .318, p=.046; Table 9). There were no significant correlations between
total scores on the GSTARS and the RTOP, the LEI, or the URL.
Table 9
Correlations between Items that are Congruent across Measures
Construct Item Letter on GSTARS
Item Number(s) on RTOP
Item Number(s)
on LEI
Criteria on URL
Spearman Correlation
Coefficient
Level of Significance
Structuring a productive learning environment.
Tb 14,15,18, & 20
13,14, 15, 16, 17,& 18
Fall = .296
Spring = .000
Fall = -.401
Spring = -.289
.439
1.000
.373
.530
Engaging students in learning.
Tc 2 Fall = -.280
Spring = .605
.466
.150
Connections with real-world phenomenon
Tf 1,2,3,4,5,& 6
Fall = .581
Spring = .722
.101
.067
Facilitating student investigations.
Tg 3 & 24 Fall = .383
Spring = .638
.308
.123

19
Encouraging multiple problem-solving approaches.
Th 4 Fall = -.259
Spring = .509
.501
.303
Adjusting instruction to meet students’ needs.
Tk 19,20,22,& 23
Fall = .105
Spring = .378
.788
.403
Locating scholarly literature
Rc Primary Literature
Fall = -.212
Spring = -.219
.173
.245
Writing skills Rd Writing Quality
Fall = .251
Spring = .138
.105
.468
Quantitative skills
Rf Data Presentation
& Data Analysis
Fall = .318
Spring =.197
.046*
.316
Formulating Research Questions
Rh Research Question
Fall = .043
Spring =-.202
.785
.292
Understanding the Impact of Research
Rj Introduction & Broader
Impacts
Fall = -.113
Spring=-.255
.470
.181
Note. When several items are included from one instrument that measure only one construct, this indicates that these items were aggregated when calculating correlations with congruent constructs on the GSTARS. *p ≤ .05.

20
Table 10
Correlations between Total Scores Across Measures
GSTARS Subscale Concurrent Measure Spearman Correlation Coefficient
Level of Significance
Total Score for Teaching Skills Subscale
Total Score for RTOP Fall = -.251
Spring = .406
.515
.425
Total Score Teaching Skills Subscale
Total Score for LEI Fall = -.301
Spring = .406
.431
.425
Total Score for Research Skills Subscale
Total Score for Research Proposal Fall = -.232
Spring =-.309
.161
.103
In total, major changes (change ≥2 on a 5-point Likert scale) were observed in the skills
of 20 survey respondents, 16 of whom participated in a think-aloud. Table 11 shows that, of the
participants who participated in the think-aloud process, 9 reported that at least some of the
observed changes reflected real changes in their skills. For example, one participant who
showed gains in ability to see the big picture of research reported that “It’s a real change
because [participant’s advisor] is very big on the big picture. He feels that everything needs to
tell a story. You need to get people interested and why do they care, what is your overall goal?...
I used to hate seminars because they are so detail-oriented and [my advisor] was like, ‘don’t get
bogged down in the details, just keep a broad overview: what is the purpose, the goal of the
experiment or the seminar.’”
Table 11 Reason Reported During Think-Aloud Procedures for Any Changes Observed Across an Academic Year in Responses to the Teaching and Research Skills Assessment Reason Reported for Observed Change Number of Participants Change reflects real change in skills 9

21
Underestimated skill in fall due to lack of experience
5
Overestimated skill in fall 2 Change reflects change in values rather than skill development
2
Change reflects change in instructional practice or research practices rather than skill development
2
Underestimated skills in spring 1 Note. The total number of responses exceeds the number of participants who engaged in the think-aloud because participants often cited different explanations for changes in different skill areas.
Participants also commonly reported during the think-aloud that they had made errors in
their self-report including underestimating or overestimating their skills. For example, 1
participant initially underestimated her teaching skills in terms of developing relationships with
students. As she noted, “Ok, ability to develop relationships with students. I was scared about
that too because how do I relate to someone that is 11 or 12 years old? I was scared about that
but being in the classroom I have been fine—the [partner] teacher is actually, I think, jealous of
my relationship with them…” Similarly, two participants identified that observed changes were
due to overestimating their initial skill level. Both of these participants discussed how graduate
school constitutes a “humbling” experience that has prompted reconsideration of their level of
expertise. One of these participants noted, “Before I didn’t have experience of either weak or
strong ability—I didn’t know how I was going to do at it. Now that I’ve been forced into it I feel
as though most of my students are learning—at the end of teaching 101 I feel they are really
grasping many of the topics and learn it pretty well and that led me to feel I was really providing
a productive learning environment for them.” A participant who reported initially
overestimating his skills noted, “I actually moved down on lesson preparation because when I
prepared the lecture it took me way more time than I thought. I appreciate now how much time
goes into preparing lectures.” One participant who underestimated his ability to ask research
22
questions at the time spring administration noted, “I am not sure why I said my ability to
question has declined, I am pretty sure it was a mistake, if anything now I am more confident in
asking questions and better prepared while asking questions.”
Participants also provided explanations which indicate that their self-assessments were
not exclusively based on their skill development. For example, participants’ values were
reflected in their responses. One participant noted that he rated himself low in the fall on
developing relationships with students because he did not think that it was important at that time.
As he stated, “I went in thinking that I could harden myself against them, that somehow what
happened in that classroom wouldn’t bother me, but my wife can even tell you, every day I come
home and after teaching I am completely exhausted and usually a little frustrated that they didn’t
learn everything that I wanted them to gain…[Now] I worry about certain students.” Two
participants provided responses during the think-aloud which indicated that the changes observed
in their self-reported skills reflect a change in their teaching or research practices rather than
their skill development. For example, one participant who showed a decline in his ability to
connect instruction to real-world phenomenon noted, “I think it is not a change in the ability but
a change in the willingness to make it in the classroom. And maybe I shouldn’t have put that,
but like I was telling you, I make weird analogies and some students have asked me to tone it
down and little bit – not go so out of civil engineering, kind of ground it a little more. So while
the ability might still be there, I try to [use analogies less frequently].” Another participant who
showed a decline in his self-reported ability to collaborate with others regarding research noted
that, “[Now] if I get a chance to choose between doing the research on my own, or collaborating
with others and doing it, I would go for doing it on my own.”

23
Conclusions and Discussion
On average, graduate student participants showed growth in most teaching and research
skills over an academic year. In support of the hypothesis of the larger project, engaging in both
teaching and research roles was associated with the largest gains in skill development. This
finding is consistent with previous research. Specifically, engaging in teaching has been found
to promote research skill development while engaging in research may improve teaching skills
(Deen & Lucas, 2006; Maher, Timmerman, Hurst, & Gilmore, 2009; Robertson & Blackler,
2006; Steigelmeyer & Feldon, 2009). Thus, a focus one only one of these activities may restrict
the development of graduate students’ skills in each of these areas. These findings may also
reflect a self-selection bias whereby graduate students who choose to do both teaching and
research invest more time and/or effort in these activities. Future research should examine the
synergistic relationship between teaching and research skill development while controlling for
the amount of time/effort that graduate students invest in these activities.
Overall, masters-level graduate students rated their teaching and research skills more
highly than Ph.D. students. This result maybe explained, in part, by Marsh’s “big fish, little
pond” effect (Marsh & Hau, 2003; i.e., that one’s self-concept is negatively related to the ability
of the individuals with whom they regularly interact) as the research group has observed that
Master’s level students often do not report as many opportunities to interact with other talented
graduate students and faculty members regarding their teaching and research. Future research
should explore the differences between master’s and Ph.D. students’ professional networks and
the influence of these interactions, though some research in this area has been conducted
(Sweitzer, 2009). Future research should also connect graduate students’ skill development with

24
their expectations and goals. Such an analysis may explain differences in Master’s and Ph.D.
students’ self-ratings as these groups may hold different standards for their development.
Specific research skills that graduate students reported the most growth in across an
academic year include oral communication skills, finding information, and methodological
knowledge. Gains in oral communication skills may reflect, in part, the nature of the sample
used in this study which included a large percentage of students who spoke English as a Second
Language. These students likely made substantial gains in their oral English skills as they were
engaged in their first years of graduate study. This high percentage of international students,
however, is not atypical in STEM graduate education (Bound, Turner, & Walsh, 2009).
Substantial growth was also reported in the ability to find information. This finding may
also be typical among STEM graduate students who are enrolled in the first years of their
graduate studies. Using graduate students’ research proposals, Timmerman, Feldon, Maher,
Strickland, and Gilmore (in review), found that students ability to locate and use primary
literature serves as a “threshold concept” which causes a “sudden transformative intellectual
leap” regarding the research process (p.1). Acquisition of threshold concepts influence the
development of other key competencies. Finding primary literature has been connected to the
ability to establish an effective argument and identify a conceptual framework.
Reasons for why graduate students’ in this study reported larger gains in methodological
knowledge, the ability to engage students in learning, and the ability to adjust instruction to meet
students’ needs as compared with other areas of skill development are unknown. Although this
study provided some information about the development of graduate students’ teaching and
research skills, additional studies are needed in order to make more robust conclusions about

25
graduate students’ developmental trajectory. Such information will be valuable in better
designing graduate education programs that support the emerging skills of graduate students.
This study also showed that graduate students self-reported skills were inconsistent with
the perceptions of their students and grant researchers, which supports previous research
indicating that the interpretation of personal efficacy instruments is problematic (Tshannen-
Moran et al., 1998). This study showed that a variety of factors contribute to graduate students’
perceptions of their research and teaching skills, such as their personal values and research and
teaching practices.

References
AERA, APA, & NCME (1999). Standards for Psychological Testing. Washington, DC: American Psychological Association.
Austin, A.E. (2002). Preparing the next generation of faculty: Graduate school as socialization to the academic career. The Journal of Higher Education, 73(1), 94-122.
Bound, J. Turner, S., & Walsh, P. (2009). Internationalization of U.S. Doctorate Education. NBER Chapters, in: Science and Engineering Careers in the United States: An Analysis of Markets and Employment, National Bureau of Economic Research, Inc., 59-97. Retrieved online from http://papers.nber.org/papers/w14792
Carnegie Foundation for the Advancement of Teaching. (2010) The Carnegie Classification of Institutions of Higher Education. Retrieved on February 22, 2010 from http://classifications.carnegiefoundation.org/
Collins, D. (2003). Pretesting survey instruments: An overview of cognitive methods. Quality of Life Research, 12, 229-238.
Costin, F., Grenough, W.T., Menges, R.J. (1971). Student ratings of college teaching: Reliability, validity, and usefulness. Review of Educational Research, 41, 511-535.
Deen, R. & Lucas, L. (2006). Learning about research: Exploring the teaching/research relationship amongst educational practitioners studying in higher education. Teaching in Higher Education, 11(1), 1 – 18.
Dharmadasa, I. (1999). Preservice and inservice teachers perceptions of skills in science teaching for primary grades. Paper presented at the Mid-South Educational Research Association, Pt. Clear, Alabama. (ERIC Document Reproduction Service No. ED 436 499). Retrieved from http://www.eric.ed.gov/
Fraser, B. J. (2002). Learning environments research: Yesterday, today and tomorrow. In S. C. Goh & M. S. Khine (Eds.), Studies in educational learning environments: Aninternational perspective. Singapore: World Scientific Publishing.
French, D., & Russell, C. (2002). Do graduate teaching assistants benefit from teaching inquiry-based laboratories? BioScience, 52(11), 1036-1041.
Gibson, S. & Dembo, M.H. (1984). Teacher efficacy: A construct validation. Journal of Educational Psychology, 76(4), 569-582.
Hattie, J. & Marsh, H. (1996). The relationship between research and teaching: A meta-analysis. Review of Educational Research, 66, 507 – 542.
Irish Universities Association. (2008). Irish universities graduate student skills statement. Retrieved from http://www.iua.ie/iua-activities/documents/SkillsStatementiteration28-05- 2008.doc in July, 2009.
27
Jenkins, A., Blackman, T., Lindsay, R., & Paton-Saltzberg, R. (1998). Teaching and research: Student perspectives and policy implications. Studies in Higher Education, 23, 127 – 141.
Kardash, C.A. (2000). Evaluation of an undergraduate research experience: Perceptions of undergraduate interns and their faculty mentors. Journal of Educational Psychology, 92(1), 191-201.
Lyons, J., Fisher, S., & Thompson, S. (2005). Effects of participating in a GK-12 program on the graduate students' programs of study. Paper presented at the American Society for Engineering Education Annual Conference & Exposition, Portland, Oregon, June 12-15.
Maher, M, Timmerman, B, Hurst, M, & Gilmore, J. (2009). Graduate Students' Descriptions of Research-Teaching Relationships across Academic Disciplines: Separating, Balancing, or Integrating Identities? Paper presented at the annual meeting of American Educational Research Association, San Diego, CA.
Marsh, H.W. & Hau, K.T. (2003). Big-fish-little-pond effect on academic self-concept: A cross-cultural (26 country) test of negative effects of academically selective schools. American Psychologist, 58, 364-376.
MacIsaac, D., & Falconer, K. (2002). Reforming physics instruction via RTOP. The PhysicsTeacher, 40, 479-485.
Peterson, D., Kromrey, J., & Borg, J. (1990). Defining and establishing relationships between essential and higher order teaching skills. Journal of Educational Research, 84(1), 5-12.
Powers, D.E. & Enright, M.K. (1987). Analytical reasoning skills in graduate study: Perception of faculty in six fields. Journal of Higher Education, 58(6), 658-682.
Robertson, J.& Bond, C. (2001). Experiences of the relation between teaching and research: What do academics value? Higher Education Research and Development, 20(1), 5 - 19.
Sweitzer, V.B. (2009). Towards a theory of doctoral student professional identity development. The Journal of Higher Education, 80(1), 1-33.
Timmerman, B.E. (2008) Peer review in an undergraduate biology curriculum : effects on students’ scientific reasoning, writing and attitudes. (Doctoral dissertation, Curtin University of Technology, 2008). Australasian Digital Thesis, PID 18880
Timmerman, B., Feldon, D., Maher, M., Strickland, D., and Gilmore, J. (in review). Evidence for threshold concepts in STEM graduate student research skill development: An independent test using performance data. Submitted to Higher Education Research and Development
Trautmann, N. M., & Krasny, M. E. (2006). Integrating teaching and research: A new model for graduate education? BioScience, 56(2), 159-165.
Tshannen-Moran, M., Hoy, A.W., & Hoy, W.K. (1998). Teacher efficacy: Its meaning and measure. Review of Education Research, 68(2), 202-248.

28
Zamorski, B. (2002). Research-led teaching and learning in higher education: A case. Teaching in Higher Education, 7(4), 411 – 427.

Appendix A: Research and Teaching Skills Assessment
REESE
Research and Teaching Skills Assessment In order for us to gain a better understanding of your CURRENT skills we would like you to assess your research and teaching skills. Your answers are confidential and will only be viewed by grant researchers.
Name: _____________________________________________
Date: _____________________________________________
Degree: _________
Program: ______________

30
Research Skills Assessment
Instructions: Please rate your level of research skills in the following areas by selecting the response option from No ability to Expert Ability that most closely reflects your skill level. Choose Not Applicable if you are unable to rate your skill in a given area or if that skill is not used in your field. Please place an “X” in the column which best represents your answer.
Rate your research skill level in the following areas…
Not Applicable
No Ability
Weak Ability
Moderate Ability
Strong Ability
Expert Ability
a. Critical thinking
b. Organizing ideas
c. Finding information
d. Writing skills
e. Reading skills
f. Ability to work with numbers and graphs
g. Oral communication skills
h. Ability to ask questions
i. Methodological knowledge
j. Sense of “big picture”
k. Time management
l. Ability to collaborate with others

Teaching Skills Assessment
Instructions: Please rate your level of teaching skills in the following areas by selecting the response option from No ability to Expert Ability that most closely reflects your skill level. Choose Not Applicable if you are unable to rate your skill in a given area or if that skill is not used in your field. Please place an “X” in the column which best represents your answer.
Rate your teaching skill level in the following areas…
Not Applicable
No Ability
Weak Ability
Moderate Ability
Strong Ability
Expert Ability
a. Ability to plan for instruction
b. Ability to structure a productive learning
c. Ability to engage students in learning
d. Ability to develop relationships with students
e. Ability to provide clear explanations and examples
f. Ability to make connections with other disciplines or real world phenomenon
g. Ability to facilitate student investigation
h. Ability to encourage multiple problem solving approaches
i. Ability to promote strong conceptual understanding
j. Ability to identify student misconceptions
k. Ability to adjust instruction to meet students’ needs
l. Ability to evaluate the effectiveness of instruction
m. Time management
n. Knowledge of subject are

32