
MEASURING GDP IN THE BALKANS - OECD. · PDF fileMEASURING GDP IN THE BALKANS EXPERIENCES AND...
37
MEASURING GDP IN THE BALKANS EXPERIENCES AND LESSONS LEARNED NADIM AHMAD, STATISTICS DIRECTORATE, OECD The views and opinions expressed in this paper are those of the authors and not necessarily those of the OECD.
Transcript of MEASURING GDP IN THE BALKANS - OECD. · PDF fileMEASURING GDP IN THE BALKANS EXPERIENCES AND...
MEASURING GDP IN THE BALKANS
EXPERIENCES AND LESSONS LEARNED
NADIM AHMAD, STATISTICS DIRECTORATE, OECD
The views and opinions expressed in this paper are those of the authors and not necessarily those of the OECD.
MEASURING GDP IN THE BALKANS
EXPERIENCES AND LESSONS LEARNED
1. Introduction..............................................................................................................................................3 2. Background - The Non-Observed Economy............................................................................................5
2.1 The Production Boundary ..................................................................................................................5 2.2 Non-Observed but not (necessarily )non-measured ...........................................................................7 2.3 Understanding International Comparisons of the NOE......................................................................7
3. Eurostat’s Tabular Approach to Exhaustiveness .....................................................................................8 4. International Comparisons of Exhaustiveness Types ............................................................................11 5. The OECD WBC Exhaustiveness Study ...............................................................................................13
5.1 Albania .............................................................................................................................................18 5.1.1 Albania - Underground Production (N1 and N6) ......................................................................18 5.1.2 Albania- Producer not obliged to register (N3) .........................................................................20 5.1.3 Albania - Other Statistical Adjustments (N7)............................................................................20
5.2 Bosnia and Herzegovina...................................................................................................................20 5.3 Croatia ..............................................................................................................................................20
5.3.1 Croatia - Underground production (N1 and N6) .......................................................................20 5.3.2 Croatia - Producer not obliged to register (N3) .........................................................................21 5.3.3 Croatia- Registered enterprises not included on the business register (N4, N5) .......................22 5.3.4 Croatia - Other Statistical Adjustments (N7).............................................................................22
5.4 FYR of Macedonia ...........................................................................................................................22 5.4.1 FYROM - Underground production (N1 and N6) .....................................................................22 5.4.2 FYROM - Producer not obliged to register (N3).......................................................................22 5.4.3 FYROM - Registered enterprises not included on the business register (N4, N5)....................23 5.4.4 FYROM - Other Statistical Adjustments (N7) ..........................................................................23
5.5 Montenegro ......................................................................................................................................23 5.5.1 Montenegro - Underground production (N1 and N6)................................................................23 5.5.2 Montenegro- Producer not obliged to register (N3) ..................................................................24 5.5.3 Montenegro- Registered enterprises not included on the business register (N4, N5)................24
5.6 Serbia................................................................................................................................................24 5.6.1 Serbia - Underground production (N1 and N6) .........................................................................24 5.6.2 Serbia - Producer not obliged to register (N3)...........................................................................24 5.6.3 Serbia - Registered enterprises not included on the business register (N4, N5)........................24 5.6.4 Serbia - Other Statistical Adjustments (N7) ..............................................................................25
6. Illegal Activities (N2) ............................................................................................................................25 6.1 Narcotics...........................................................................................................................................25 6.2 Prostitution .......................................................................................................................................25 6.3 People Smuggling ............................................................................................................................26 6.4 Copyright Infringement....................................................................................................................26 6.5 Corruption ........................................................................................................................................26
7. Owner Occupied Dwellings...................................................................................................................26 8. Conclusions............................................................................................................................................29
ANNEX A : THE USER COST APPROACH TO ESTIMATING IMPUTRE RENT FOR OWNER OCCUPIED DWELLINGS: – GUIDANCE NOTES PROVIDED TO THE WBC .....................30
2

MEASURING GDP IN THE BALKANS
EXPERIENCES AND LESSONS LEARNED
Nadim Ahmad, OECD
1. Introduction
1. The OECD’s regional programme in national accounts for Western Balkan Countries (WBC)1 was started in 2001. Workshops on various aspects of national accounts were held in Paris in December 2001, July 2002 and April 2003. At these workshops it became clear that the exhaustive estimation of GDP in WBC was a significant problem and that their statistical agencies needed to tackle it in a more focused and methodical way. After discussions with Eurostat in Paris in August 2003, it was agreed that the OECD would concentrate its efforts in WBC on measuring and improving the exhaustiveness of their GDP estimates. This initiative was supported by the heads of WBC statistical agencies when they attended the CARDS Policy Group on Statistical Co-operation in Sarajevo in October 2003.
2. The Eurostat-OECD GDP Exhaustiveness Project for WBC, on which this paper reports, was established during the first half of 2004. It is important to note from the outset however that this project is still in many ways a work-in-progress and, so, the commentary and description of country practices embodied in this paper should be seen in the light of this general drive towards improved GDP exhaustiveness.
3. This report is therefore, in some ways, premature but despite the experimental nature of some of the country estimates and methodologies shown below, as well as the tentative findings, it is arguably an opportune moment, all the same, to share the experiences and lessons learned so far during this project as they may be able to assist other transition economies and, indeed, because the questions raised may find solutions in the experiences of statisticians in other countries that have faced similar challenges.
4. Another key motivation for the paper is to encourage other countries to take-up and adopt the Eurostat Tabular approach to measuring exhaustiveness, as this will hasten improvements, not only in those countries that adopt it, but also to provide spill-over benefits for other countries, including those who already use the approach.
5. The second phase of this project has only recently begun, and, so, the commentary here is largely restricted to the findings/results of Phase I, whose key focus was on production based, as opposed to expenditure or income, estimates of GDP and gross value added (GVA). Phase II is an opportunity to continue to refine the methodologies and estimates developed in Phase I and also involves investigations of expenditure based approaches to GDP estimation, including general government consumption of fixed capital and own-account production of intangible assets which were not covered in Phase I.
6. Given the experimental nature of the estimates shown here readers should not quote them as being official. Indeed, in many cases, statistical offices have deliberately held back from
1 Albania, Bosnia and Herzegovina, Croatia, Kosovo, FYR of Macedonia, and Serbia and Montenegro.
3

incorporating these estimates into their official GDP series for the very reason that the estimates are at this stage experimental and require testing and refinement.
7. In summary, however, the tentative findings suggest the following:
• All countries are encouraged to develop labour-input type approaches to NOE estimation. These can be based on dedicated labour force surveys or proxies such as Living Standard’s surveys or Census information (to provide benchmarks).
• A significant issue in the use of the labour-input method, particularly, for small countries where the sample size in LFSs is also likely to be small, concerns sectoral (activity) breakdowns over time. The small sample sizes can mean relatively large standard deviations in sectoral estimates of employment which can be magnified when calculating the residual of these estimates and those based on business data and then compared over time. The time series produced can be erratic and countries are encouraged to consider using the labour input method to calculate (perhaps, moving) averages of sectoral coefficients and use these averages to provide for stability over time.
• Expert based approaches generally err on the side of caution and tend to underestimate the size of the NOE (although not always). An issue with expert based approaches concerns their generally static nature. If they are to be used, countries should ensure that they adopt a methodology that allows them to be more dynamic such that they result in estimates of GDP that respond to economic developments, such as policy measures that try to formalise ‘informal/underground’ activity for example.
• Countries need to think carefully about how they present their estimates of the NOE. Typically estimates are shown as a percentage of GDP but this paper encourages countries to go beyond ensuring GDP exhaustiveness and to also consider the policy drivers related to activities such as underground production and the need to provide estimates of these phenomena. Moreover it explicitly states that international comparisons of the total NOE (which reflects statistical and economic non-observed activities) are not particularly insightful nor comparable, and that, instead, countries should focus on producing comparable estimates of comparable phenomena, such as underground production, and not always using total GDP as a denominator.
• WBC have begun to develop user-cost approaches to estimating imputed rent. These estimates are still experimental but a number of issues have arisen and will need to be tackled – key amongst these are the valuation of land and estimates-of/method-used-to-measure intermediate consumption, which show considerable differences, across countries and time.
• An area that provoked considerable discussion at the January 2006 Workshop to mark the end of Phase I concerned payments made to government employees, such as doctors and teachers, by households. Although not of considerable importance in most OECD countries, this is a common occurrence in the Western Balkans. The Workshop came to the view that, for the most part, these payments were for a productive service and not bribes or extortion. However the Workshop could not agree on whether the payments should also be recorded under the output of government, as an institutional sector, or the household sector. An analogy was made with tips, which the 1993 System of National Accounts (SNA) recommends as being part of the output of the employing enterprise, but the analogy is, of course, not perfect. Moreover there was some concern that by treating payments in this way government output, value-added and revenue would rise, and on the revenue side, at
4
least, there was no obvious category of revenue, described in the IMF’s Government Finance Statistics Manual, where the revenue fell. The Workshop agreed that the matter should be passed for deliberation to the SNA review team and, in particular, to the Task Force on the Harmonisation of Public Sector Accounting.
2. Background - The Non-Observed Economy
8. Several terms are commonly used to define what is generally called the informal economy: shadow economy, black economy, underground economy, informal economy. The use of this wide variety of terms, often with different conceptual underpinnings, has often resulted in difficulties in interpretation and sometimes misleading comparisons.
9. The OECD Handbook “Measuring the Non-Observed Economy” (2002)2 provides a comprehensive description of what it refers to as the Non-Observed Economy and fully articulates the types of economic activities which should be included under the OECD’s definition. The Handbook was primarily designed to ensure the exhaustiveness of gross domestic product (GDP) estimates, providing a breakdown into five overlapping themes described below.
• Underground production, defined as those activities that are productive and legal but are deliberately concealed from public authorities to avoid payment of taxes or compliance with regulations.
• Illegal production, defined as those productive activities that generate goods and services forbidden by law or that are unlawful when carried out by unauthorised procedures.
• Informal sector production, defined as those productive activities conducted by unincorporated enterprises in the household sector or other units that are unregistered and/or less than a specified size in terms of employment, and that have some market production.
• Production of households for own-final use, defined as those productive activities that result in goods or services consumed or capitalised by the households that produced them.
• Statistical underground, defined as all productive activities that should be accounted for in basic data collection programmes but are missed due to deficiencies in the statistical system.
2.1 The Production Boundary
10. An important point is the fact that the 5 themes relate to activities that are productive; productive in a national accounting sense, i.e. they contribute to GDP. This matters because not all economic activities associated with the ‘black’ economy for example are considered productive. Extortion payments or bribes, for example do not contribute to GDP, since they in effect amount to transfers.
11. The rules that have been developed to determine the scope of what should be included or excluded (referred to as the production boundary) determine the scope of most current and
2 Measuring the Non-Observed Economy - A Handbook, OECD, IMF, ILO and CISSTAT, Paris, 2002. The handbook was put together by a team drawn from national and international statistical organisations which, besides OECD, IMF, ILO and CISSTAT, included EUROSTAT, Italian National Statistical Institute, the Russian Federation State Statistical Committee and Statistics Netherlands.
5
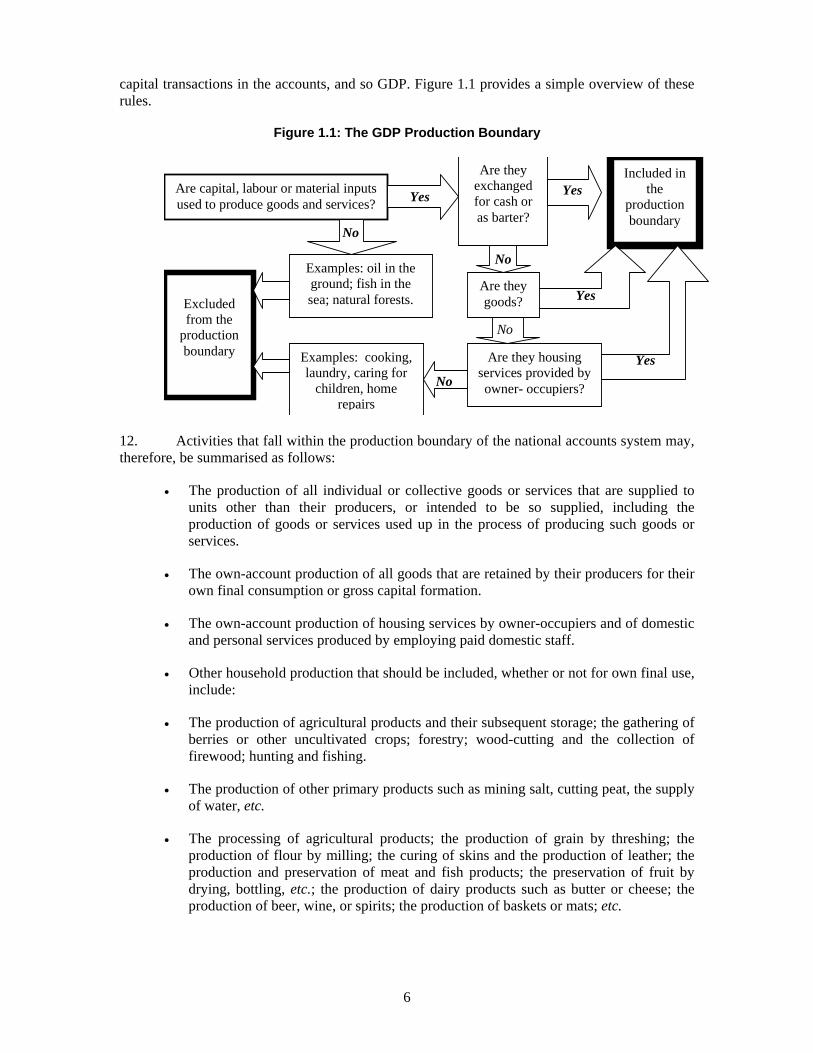
capital transactions in the accounts, and so GDP. Figure 1.1 provides a simple overview of these rules.
Figure 1.1: The GDP Production Boundary
Are capital, labour or material inputsused to produce goods and services? Yes
Are theyexchangedfor cash oras barter?
YesIncluded in
theproductionboundary
No
Examples: oil in theground; fish in thesea; natural forests.
No
Are theygoods?
No
Are they housingservices provided byowner- occupiers?
Yes
No
Examples: cooking,laundry, caring for
children, homerepairs
Yes
Excludedfrom the
productionboundary
12. Activities that fall within the production boundary of the national accounts system may, therefore, be summarised as follows:
• The production of all individual or collective goods or services that are supplied to units other than their producers, or intended to be so supplied, including the production of goods or services used up in the process of producing such goods or services.
• The own-account production of all goods that are retained by their producers for their own final consumption or gross capital formation.
• The own-account production of housing services by owner-occupiers and of domestic and personal services produced by employing paid domestic staff.
• Other household production that should be included, whether or not for own final use, include:
• The production of agricultural products and their subsequent storage; the gathering of berries or other uncultivated crops; forestry; wood-cutting and the collection of firewood; hunting and fishing.
• The production of other primary products such as mining salt, cutting peat, the supply of water, etc.
• The processing of agricultural products; the production of grain by threshing; the production of flour by milling; the curing of skins and the production of leather; the production and preservation of meat and fish products; the preservation of fruit by drying, bottling, etc.; the production of dairy products such as butter or cheese; the production of beer, wine, or spirits; the production of baskets or mats; etc.
6
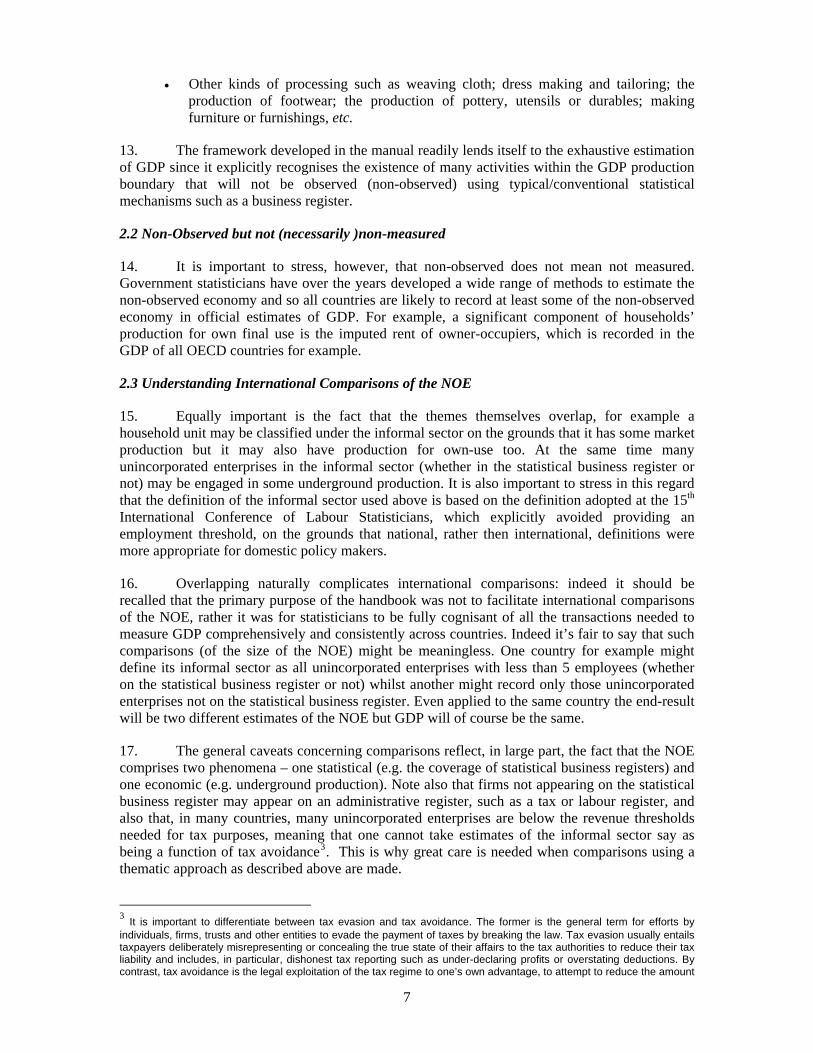
• Other kinds of processing such as weaving cloth; dress making and tailoring; the production of footwear; the production of pottery, utensils or durables; making furniture or furnishings, etc.
13. The framework developed in the manual readily lends itself to the exhaustive estimation of GDP since it explicitly recognises the existence of many activities within the GDP production boundary that will not be observed (non-observed) using typical/conventional statistical mechanisms such as a business register.
2.2 Non-Observed but not (necessarily )non-measured
14. It is important to stress, however, that non-observed does not mean not measured. Government statisticians have over the years developed a wide range of methods to estimate the non-observed economy and so all countries are likely to record at least some of the non-observed economy in official estimates of GDP. For example, a significant component of households’ production for own final use is the imputed rent of owner-occupiers, which is recorded in the GDP of all OECD countries for example.
2.3 Understanding International Comparisons of the NOE
15. Equally important is the fact that the themes themselves overlap, for example a household unit may be classified under the informal sector on the grounds that it has some market production but it may also have production for own-use too. At the same time many unincorporated enterprises in the informal sector (whether in the statistical business register or not) may be engaged in some underground production. It is also important to stress in this regard that the definition of the informal sector used above is based on the definition adopted at the 15th International Conference of Labour Statisticians, which explicitly avoided providing an employment threshold, on the grounds that national, rather then international, definitions were more appropriate for domestic policy makers.
16. Overlapping naturally complicates international comparisons: indeed it should be recalled that the primary purpose of the handbook was not to facilitate international comparisons of the NOE, rather it was for statisticians to be fully cognisant of all the transactions needed to measure GDP comprehensively and consistently across countries. Indeed it’s fair to say that such comparisons (of the size of the NOE) might be meaningless. One country for example might define its informal sector as all unincorporated enterprises with less than 5 employees (whether on the statistical business register or not) whilst another might record only those unincorporated enterprises not on the statistical business register. Even applied to the same country the end-result will be two different estimates of the NOE but GDP will of course be the same.
17. The general caveats concerning comparisons reflect, in large part, the fact that the NOE comprises two phenomena – one statistical (e.g. the coverage of statistical business registers) and one economic (e.g. underground production). Note also that firms not appearing on the statistical business register may appear on an administrative register, such as a tax or labour register, and also that, in many countries, many unincorporated enterprises are below the revenue thresholds needed for tax purposes, meaning that one cannot take estimates of the informal sector say as being a function of tax avoidance3. This is why great care is needed when comparisons using a thematic approach as described above are made.
3 It is important to differentiate between tax evasion and tax avoidance. The former is the general term for efforts by individuals, firms, trusts and other entities to evade the payment of taxes by breaking the law. Tax evasion usually entails taxpayers deliberately misrepresenting or concealing the true state of their affairs to the tax authorities to reduce their tax liability and includes, in particular, dishonest tax reporting such as under-declaring profits or overstating deductions. By contrast, tax avoidance is the legal exploitation of the tax regime to one’s own advantage, to attempt to reduce the amount
7
3. Eurostat’s Tabular Approach to Exhaustiveness
18. Since 1996 Eurostat has worked intensively via projects with the European Union Candidate Countries (CCs) to improve the consistency, reliability and exhaustiveness of their national accounts and GDP in particular. This led to the development in 1998 of a methodology that has come to be known as the “Tabular Approach” (which the CCs used for the 1st project). In the proceeding years the approach was modified and this revised version, which was used for the 2nd project in 2003, forms the basis of the commentary in this section.
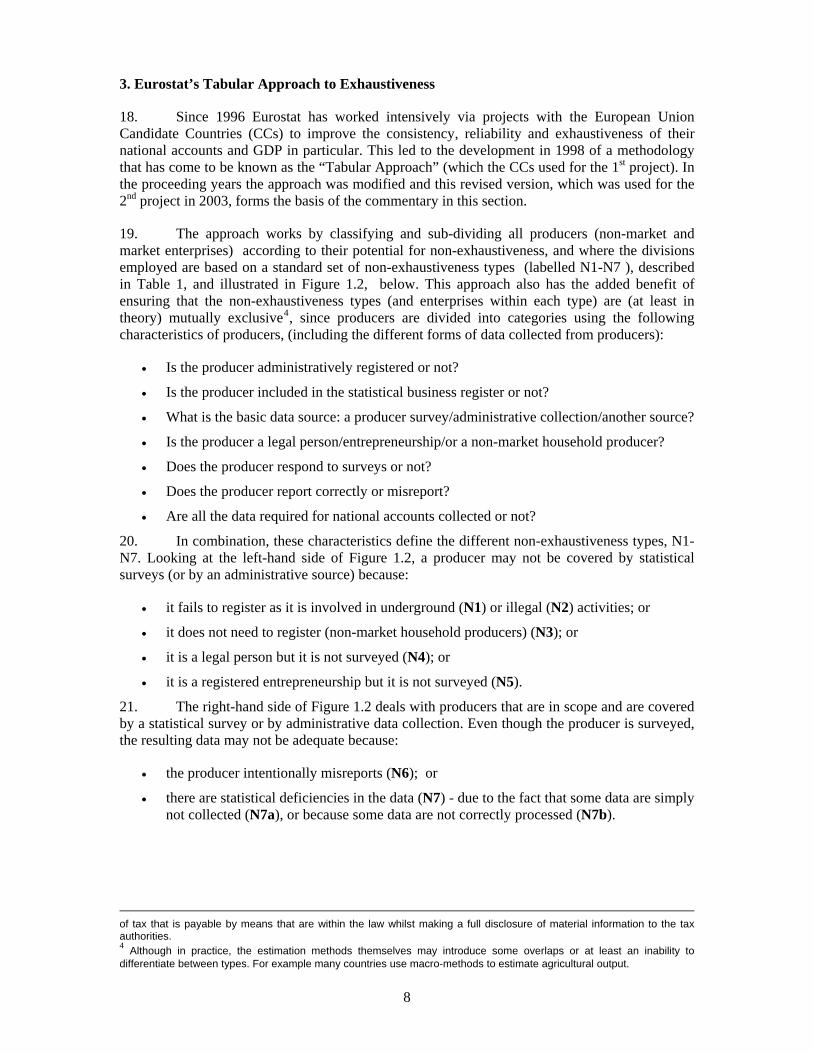
19. The approach works by classifying and sub-dividing all producers (non-market and market enterprises) according to their potential for non-exhaustiveness, and where the divisions employed are based on a standard set of non-exhaustiveness types (labelled N1-N7 ), described in Table 1, and illustrated in Figure 1.2, below. This approach also has the added benefit of ensuring that the non-exhaustiveness types (and enterprises within each type) are (at least in theory) mutually exclusive4, since producers are divided into categories using the following characteristics of producers, (including the different forms of data collected from producers):
• Is the producer administratively registered or not?
• Is the producer included in the statistical business register or not?
• What is the basic data source: a producer survey/administrative collection/another source?
• Is the producer a legal person/entrepreneurship/or a non-market household producer?
• Does the producer respond to surveys or not?
• Does the producer report correctly or misreport?
• Are all the data required for national accounts collected or not?
20. In combination, these characteristics define the different non-exhaustiveness types, N1-N7. Looking at the left-hand side of Figure 1.2, a producer may not be covered by statistical surveys (or by an administrative source) because:
• it fails to register as it is involved in underground (N1) or illegal (N2) activities; or
• it does not need to register (non-market household producers) (N3); or
• it is a legal person but it is not surveyed (N4); or
• it is a registered entrepreneurship but it is not surveyed (N5).
21. The right-hand side of Figure 1.2 deals with producers that are in scope and are covered by a statistical survey or by administrative data collection. Even though the producer is surveyed, the resulting data may not be adequate because:
• the producer intentionally misreports (N6); or
• there are statistical deficiencies in the data (N7) - due to the fact that some data are simply not collected (N7a), or because some data are not correctly processed (N7b).
of tax that is payable by means that are within the law whilst making a full disclosure of material information to the tax authorities. 4 Although in practice, the estimation methods themselves may introduce some overlaps or at least an inability to differentiate between types. For example many countries use macro-methods to estimate agricultural output.
8
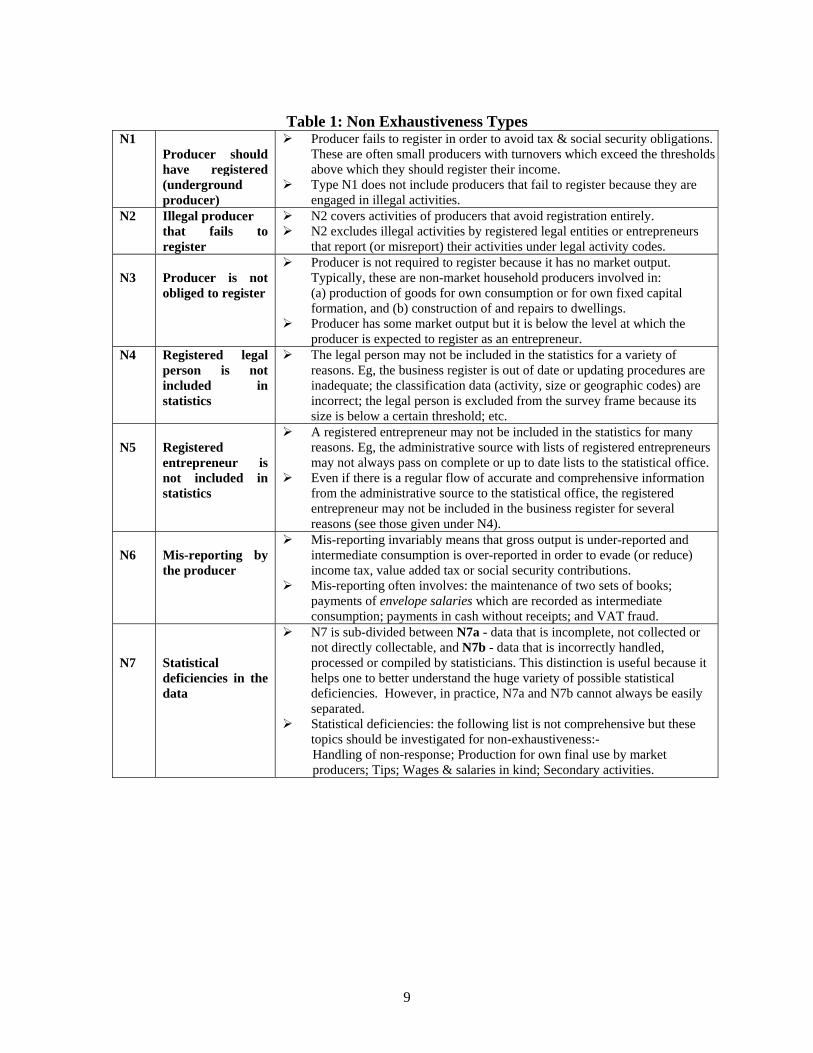
Table 1: Non Exhaustiveness Types N1
Producer should have registered (underground producer)
Producer fails to register in order to avoid tax & social security obligations. These are often small producers with turnovers which exceed the thresholds above which they should register their income.
Type N1 does not include producers that fail to register because they are engaged in illegal activities.
N2 Illegal producer that fails to register
N2 covers activities of producers that avoid registration entirely. N2 excludes illegal activities by registered legal entities or entrepreneurs
that report (or misreport) their activities under legal activity codes. N3
Producer is not obliged to register
Producer is not required to register because it has no market output. Typically, these are non-market household producers involved in: (a) production of goods for own consumption or for own fixed capital formation, and (b) construction of and repairs to dwellings.
Producer has some market output but it is below the level at which the producer is expected to register as an entrepreneur.
N4 Registered legal person is not included in statistics
The legal person may not be included in the statistics for a variety of reasons. Eg, the business register is out of date or updating procedures are inadequate; the classification data (activity, size or geographic codes) are incorrect; the legal person is excluded from the survey frame because its size is below a certain threshold; etc.
N5
Registered entrepreneur is not included in statistics
A registered entrepreneur may not be included in the statistics for many reasons. Eg, the administrative source with lists of registered entrepreneurs may not always pass on complete or up to date lists to the statistical office.
Even if there is a regular flow of accurate and comprehensive information from the administrative source to the statistical office, the registered entrepreneur may not be included in the business register for several reasons (see those given under N4).
N6
Mis-reporting by the producer
Mis-reporting invariably means that gross output is under-reported and intermediate consumption is over-reported in order to evade (or reduce) income tax, value added tax or social security contributions.
Mis-reporting often involves: the maintenance of two sets of books; payments of envelope salaries which are recorded as intermediate consumption; payments in cash without receipts; and VAT fraud.
N7
Statistical deficiencies in the data
N7 is sub-divided between N7a - data that is incomplete, not collected or not directly collectable, and N7b - data that is incorrectly handled, processed or compiled by statisticians. This distinction is useful because it helps one to better understand the huge variety of possible statistical deficiencies. However, in practice, N7a and N7b cannot always be easily separated.
Statistical deficiencies: the following list is not comprehensive but these topics should be investigated for non-exhaustiveness:- Handling of non-response; Production for own final use by market producers; Tips; Wages & salaries in kind; Secondary activities.
9
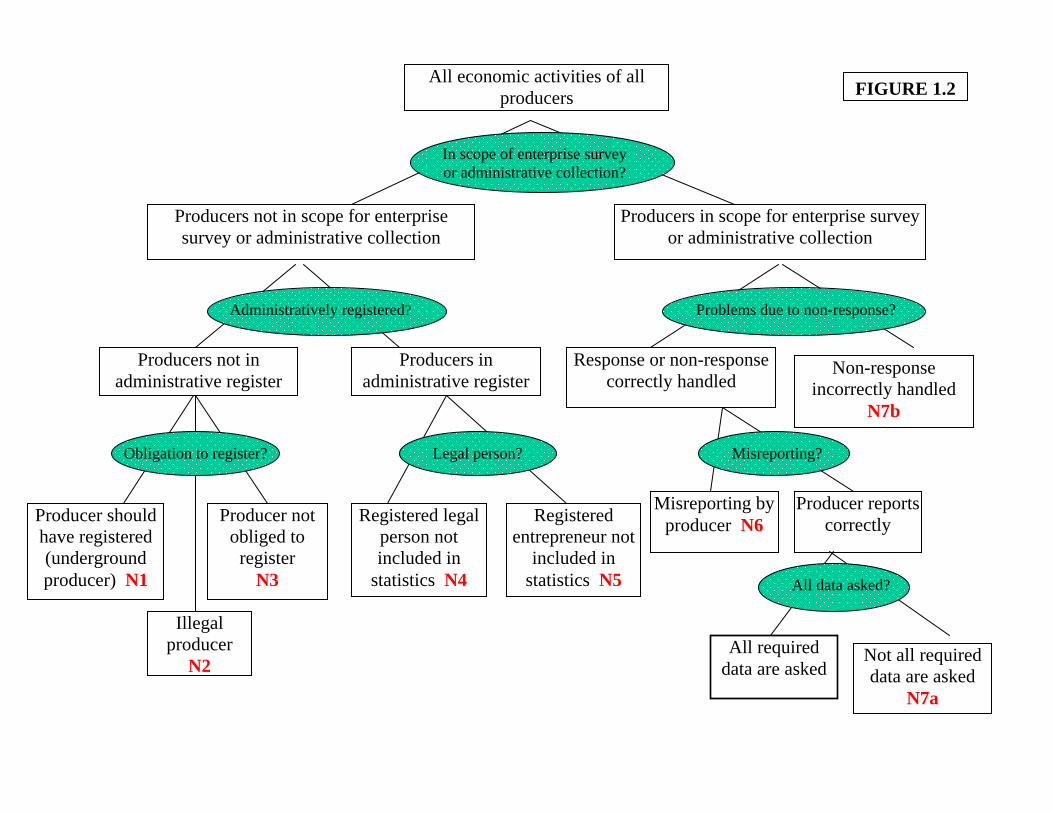
FIGURE 1.2All economic activities of all
producers
In scope of enterprise survey or administrative collection?
Producers in scope for enterprise survey or administrative collection
Producers not in scope for enterprise survey or administrative collection
Illegal producer
N2
Producer should have registered (underground producer) N1
Producer not obliged to
register N3
Registered legal person not included in
statistics N4
Registered entrepreneur not
included in statistics N5
All required data are asked
Not all required data are asked
N7a
Misreporting by producer N6
Producer reports correctly
Problems due to non-response?
Producers in administrative register
Producers not in administrative register
Response or non-response correctly handled
Non-response incorrectly handled
N7b
Administratively registered?
Misreporting? Obligation to register? Legal person?
All data asked?
22. Partly because EU candidate countries had already been involved in two Tabular exercises and partly because the OECD took the view that the Tabular Approach afforded greater international comparability of issues and methods used to measure GDP by Exhaustiveness Type than the Thematic approach described in the NOE handbook, the OECD decided that the Tabular approach should be applied in the WBC project.
23. That is not to say however that all problems regarding international comparability, particularly international comparisons of the size of Exhaustiveness Types, can be resolved using this approach, since, like the thematic approach of the handbook, the Tabular approach necessarily mixes economic and statistical phenomena.. This can impact on comparisons of sizes across countries but also within a country over time. For example a country might decide to wait to fully integrate producers in administrative registers (Types N4 and N5) into their statistical business registers for a number of reasons. At the point when they are integrated, the size of N4 and N5 will reduce but little else will have changed. For example, until 2006, entrepreneurs (unincorporated self employed) in Montenegro were not included in the statistical business register and, so, statistical surveys, but they were included in an administrative register. Since 2006 however they have been included in the statistical business register; meaning, all other things equal, that the size of N5 will fall.
24. And, so, it is important that estimates of N1 to N7 are assessed and interpreted separately, by country and over time. Countries that record zero in these categories may for example be unable to measure these enterprises (producers) or they may all be in the statistical business register: meaning that the same number (zero) can paint two diametrically opposed pictures of the comprehensiveness of the statistical information system. The same holds for non-response errors (N7a). It is unlikely for example that the same type of non-response error, identified and corrected in one year, will be repeated the next.
4. International Comparisons of Exhaustiveness Types
25. Before moving on to presenting the results of the OECD project in the WBC it is perhaps instructive to take a digression. The preceding sections demonstrated that care is needed when comparing estimates of the NOE Themes or Exhaustiveness Types across countries and time, at least in the context of interpretation. This section attempts to provide some suggestions on ways in which estimates can be more confidently compared.
26. An important feature of both the NOE Thematic and Exhaustiveness Type approach is the identification of underground production. This matters because, typically, when commentators refer to the grey or shadow economy they usually mean that part of the economy that is tax evasive in nature. Certainly this is an important component for policy makers since its size has a direct impact on government finances. It is important to note however that underground production does not cover all types of tax evasion, or revenue (illegally) foregone by government, since it strictly refers to evasion related to the production of goods and services and, so, will not for example reflect tax evasion related to capital gains, which is not related to production. The definition also excludes criminal activities (e.g. smuggling, trafficking, etc.) and marginal non taxed activities (such as domestic labour and subsistence farming).
27. For the Exhaustiveness Types, underground production, (under-declaration of revenue/labour for evasive purposes) is largely covered by Types N1 and N6; although it is possible that some underground production occurs in types N4 and N5, (and in practice N3 too). And, so, comparisons of the sum of these two Types across countries, as a percentage of GDP, are relatively sound, since they are little affected by differences in the coverage of statistical business registers for example. Indeed what differentiates these Types from others is that they allow policy makers to investigate the mechanisms or incentives that encourage enterprises to operate in this way.
11
28. The interpretation of international comparisons of N4 and N5 are more complicated however, as described earlier, since they say more about the comprehensiveness of the statistical business register across countries and time.
29. Comparisons of illegal activities (N2) can however be made with considerable confidence. As can comparisons of N3, at least, in theory, since the activities relate primarily to household production for own use. In practice however comparisons can be affected, especially, as is the case in some WBC countries (e.g. Albania), and many others, if agricultural output is estimated using a macro-based method, for example, that calculates output on the basis of land used for agricultural output multiplied by estimated yields and prices by crop type.
30. But improving international comparability is not just about defining the numerator. The denominator, typically GDP, is also crucial. If one uses, for example, GDP before the inclusion of exhaustiveness adjustments as the denominator, international comparability can be distorted. For example imputed rents which contribute considerably to GDP in all countries, and which is discussed in more detail later in this paper, are measured differently in all WBC countries. Indeed at the start of the OECD WBC project some countries did not include estimates for it at all. Implausibly low estimates therefore will magnify the size of the exhaustiveness types as a per cent of GDP.
31. But it’s important perhaps to go beyond just GDP. The results from the WBC project, and indeed in the earlier Eurostat CC exercises, illustrate that underground production, for example, typically only occurs in some sectors – usually the non-agricultural5, non-energy non-financial producing private sector. Countries with large public sectors, where the potential for underground production is limited, and this is particularly important for transition economies, are likely, all other things equal, to have smaller estimates of underground production, as a share of GDP, than in countries with smaller public sectors. For this former group of countries these low shares are often met with incredulity by commentators, who postulate much higher estimates of underground production. One relatively simple way of overcoming these distortions however is to use, as a denominator, GDP (at basic prices) minus the value-added of the agricultural, energy producing, financial and public sectors and imputed rent, or to encourage a focus on the size of underground production at a sectoral level
32. A good example of how the different presentation of these statistics can impact on the public perception of estimates of the size of underground production can be found in a recent OECD study6 that investigated the policy measures needed to formalise the ‘informal’ sector (where informal in this context refers to enterprises engaged in evasive activities, in other words, underground production). At the time of the Study the Albanian Statistics Office (INSTAT) estimated the size of underground production at between 24-28% of GDP in the early 2000s, far lower than the estimates of 30-60% used in many unofficial studies and which reflected public perception.
33. But this was really a misperception partly caused by the use of GDP as a denominator. Instead of focusing therefore on the share of underground production in GDP the study provided two alternative statistics. The first looked at underground production as a share of the value-added in those sectors where underground production typically occurred: manufacturing, trade, transport, construction, retailing and other business services; activities dominated by private firms, mostly small and micro. The Study showed that, focusing only on these sectors, underground production was actually 40% bigger than formal production in 2002.
5 Although the agricultural sector is usually also a large contributor to the NOE more generally; particularly in
developing economies where subsistence farming can be significant. 6 “The Informal Economy in Albania: Analysis and Policy Recommendations” OECD Investment Compact 2004, see
http://www.investmentcompact.org/dataoecd/55/11/35559558.pdf
12

34. A complementary presentation, important from the perspective of fiscal policy considerations, was to consider the share of underground production as a percent of the value-added in those sectors subject to some form of profit (or business) taxation. This showed that underground production contributed just over half (51%) of value-added generated in these sectors.
35. Presenting the statistics in this way went a long way to convincing critics that the estimates produced by INSTAT and that were included in their GDP estimates were credible. In the sections that follow the analysis and presentation does not follow this approach in its entirety, although it is relatively easy to construct these estimates from the information provided, rather it focuses on the contribution of the NOE at the sectoral level. It is hoped that estimates on this basis will be finalised by the end of Phase II.
5. The OECD WBC Exhaustiveness Study
36. The first phase of the OECD study on the NOE in the WBC focused on getting the statistical agencies of the WBC to: (i) apply the Eurostat tabular approach; (ii) to estimate rentals of dwelling services by the user cost approach; and (iii) to organise and carry out ad hoc surveys that would improve their estimation of output and value added for selected activities. The results of these endeavours are summarised in the Tables below and in more detail in the discussion that follows. The summarised results are shown by country – Albania, Bosnia and Herzegovina, Croatia, FYR of Macedonia, Montenegro and Serbia – and, in the case of Bosnia and Herzegovina, by entity – the Republic of Srpska and the Federation of Bosnia Herzegovina. During this phase Serbia and Montenegro were still one country, but for national accounting purposes it was considered to be two countries since each republic had its own currency and the purchasing power parity between the two currencies has not yet been established. 11. Table 2 shows the non-observed economy as a percentage of Gross Value Added according to the seven types of non-exhaustiveness. Table 3 shows the non-observed economy as a percentage of Gross Value Added according to kinds of activity. In addition to the Western Balkan “countries”, the tables also show average percentages for nine7 of the ten Member States that joined the European Union in 2004. As shown below, to obtain these percentages, many WBC have relied mainly on the “expert method” which involves consulting tax inspectors, accountants and other persons with relevant knowledge but increasing use is being made of labour force surveys or derivatives (using the so called “Italian method”), as countries begin to develop and run these surveys. Ad hoc surveys have also been used as well as supply/use methods in which the available information on the supply of particular goods and services is compared with information on final and intermediate uses of these goods and services in order to detect possible under-reporting. 37. Without invoking too much interpretation at this stage and recalling the caveats mentioned above, the tables show that in the Western Balkans:
• Total NOE ranges from 31.4 per cent in Albania to 7.8 per cent in Montenegro. The low percentages recorded for Montenegro and also for Bosnia and Herzegovina suggest that the NOE is still being underestimated and that further investigations are required.
• Only Croatia, FYR of Macedonia and Serbia have attempted to estimate value added in illegal activities. The other countries intend to attempt such estimates in the next phase of the project. The percentages recorded by both Croatia and Serbia (around one per cent) are similar to that found by the new EU Member States.
• N6 (under-reporting of income) is the most important source of non-exhaustiveness followed, usually, by N3 (producers not required to register because they are non-market producers or have
7 Czech Republic, Estonia, Hungary, Latvia, Lithuania, Malta, Poland, Slovak Republic and Slovenia.
13
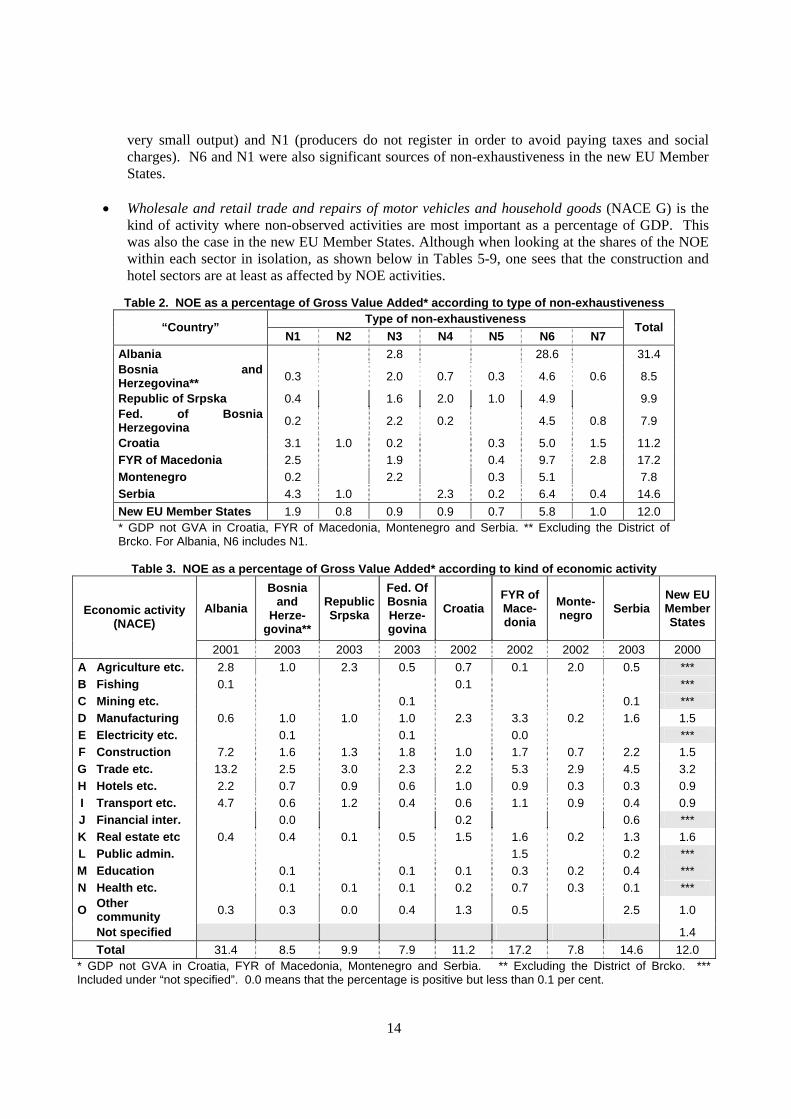
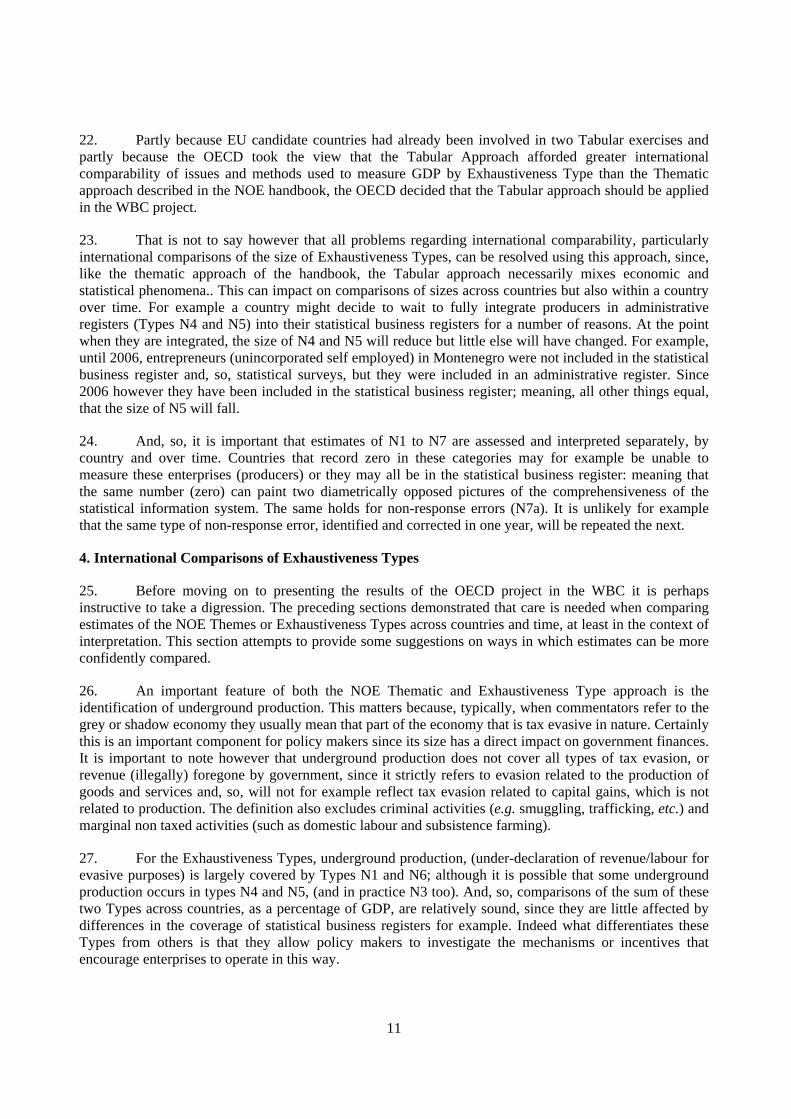
very small output) and N1 (producers do not register in order to avoid paying taxes and social charges). N6 and N1 were also significant sources of non-exhaustiveness in the new EU Member States.
• Wholesale and retail trade and repairs of motor vehicles and household goods (NACE G) is the
kind of activity where non-observed activities are most important as a percentage of GDP. This was also the case in the new EU Member States. Although when looking at the shares of the NOE within each sector in isolation, as shown below in Tables 5-9, one sees that the construction and hotel sectors are at least as affected by NOE activities.
Table 2. NOE as a percentage of Gross Value Added* according to type of non-exhaustiveness
Type of non-exhaustiveness “Country”
N1 N2 N3 N4 N5 N6 N7 Total
Albania 2.8 28.6 31.4 Bosnia and Herzegovina** 0.3 2.0 0.7 0.3 4.6 0.6 8.5
Republic of Srpska 0.4 1.6 2.0 1.0 4.9 9.9 Fed. of Bosnia Herzegovina 0.2 2.2 0.2 4.5 0.8 7.9
Croatia 3.1 1.0 0.2 0.3 5.0 1.5 11.2 FYR of Macedonia 2.5 1.9 0.4 9.7 2.8 17.2 Montenegro 0.2 2.2 0.3 5.1 7.8 Serbia 4.3 1.0 2.3 0.2 6.4 0.4 14.6 New EU Member States 1.9 0.8 0.9 0.9 0.7 5.8 1.0 12.0 * GDP not GVA in Croatia, FYR of Macedonia, Montenegro and Serbia. ** Excluding the District of Brcko. For Albania, N6 includes N1.
Table 3. NOE as a percentage of Gross Value Added* according to kind of economic activity
Albania Bosnia
and Herze-
govina**
Republic Srpska
Fed. Of Bosnia Herze-govina
Croatia FYR ofMace-donia
Monte- negro Serbia
New EU Member States
Economic activity (NACE)
2001 2003 2003 2003 2002 2002 2002 2003 2000 A Agriculture etc. 2.8 1.0 2.3 0.5 0.7 0.1 2.0 0.5 *** B Fishing 0.1 0.1 *** C Mining etc. 0.1 0.1 *** D Manufacturing 0.6 1.0 1.0 1.0 2.3 3.3 0.2 1.6 1.5 E Electricity etc. 0.1 0.1 0.0 *** F Construction 7.2 1.6 1.3 1.8 1.0 1.7 0.7 2.2 1.5 G Trade etc. 13.2 2.5 3.0 2.3 2.2 5.3 2.9 4.5 3.2 H Hotels etc. 2.2 0.7 0.9 0.6 1.0 0.9 0.3 0.3 0.9 I Transport etc. 4.7 0.6 1.2 0.4 0.6 1.1 0.9 0.4 0.9 J Financial inter. 0.0 0.2 0.6 *** K Real estate etc 0.4 0.4 0.1 0.5 1.5 1.6 0.2 1.3 1.6 L Public admin. 1.5 0.2 *** M Education 0.1 0.1 0.1 0.3 0.2 0.4 *** N Health etc. 0.1 0.1 0.1 0.2 0.7 0.3 0.1 ***
O Other community 0.3 0.3 0.0 0.4 1.3 0.5 2.5 1.0
Not specified 1.4 Total 31.4 8.5 9.9 7.9 11.2 17.2 7.8 14.6 12.0 * GDP not GVA in Croatia, FYR of Macedonia, Montenegro and Serbia. ** Excluding the District of Brcko. *** Included under “not specified”. 0.0 means that the percentage is positive but less than 0.1 per cent.
14
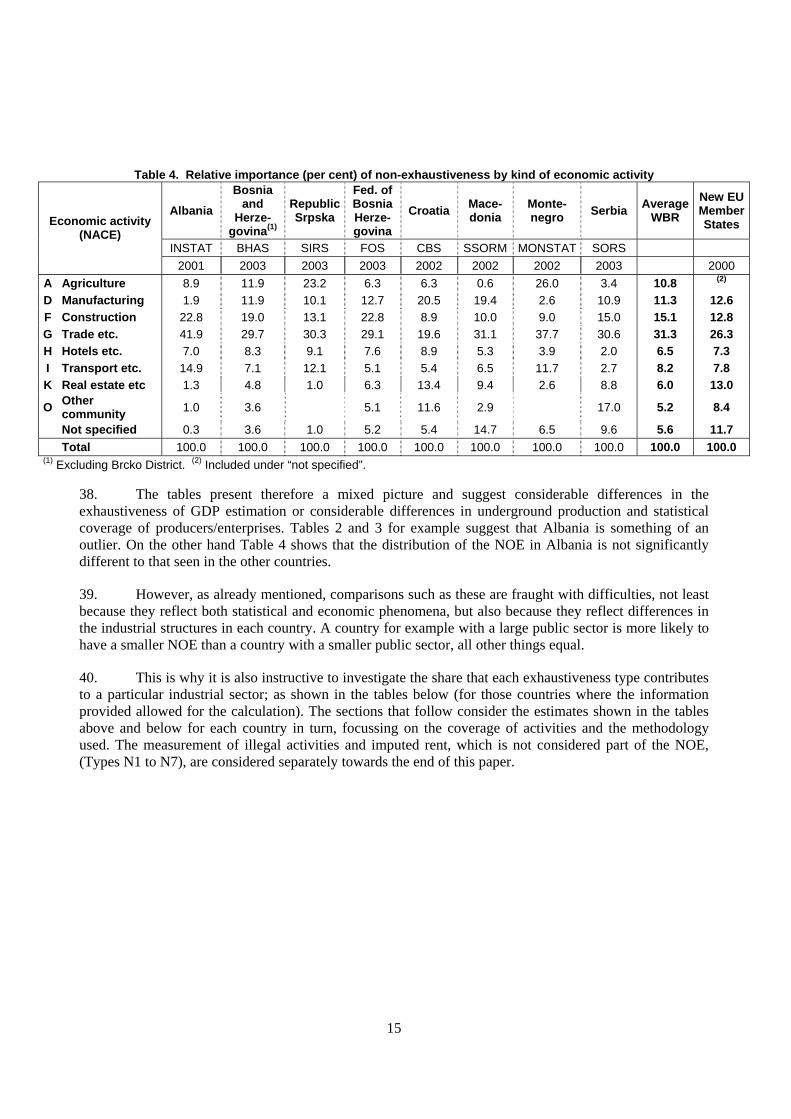
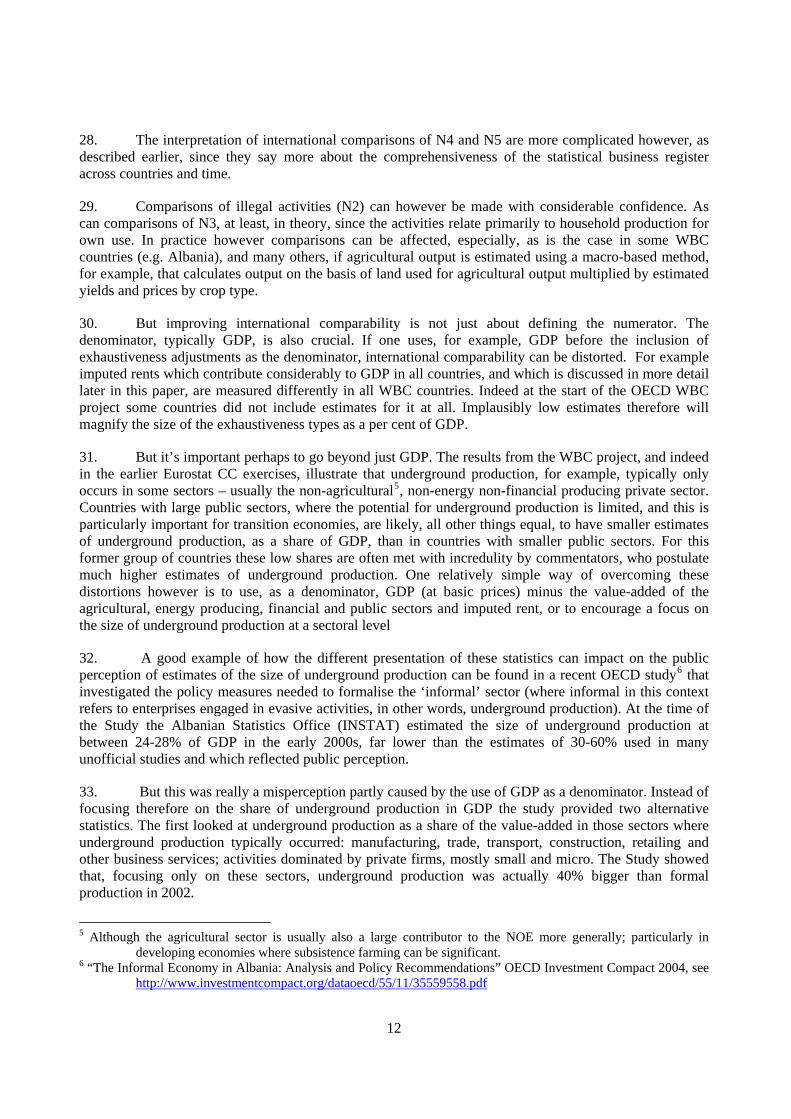
Table 4. Relative importance (per cent) of non-exhaustiveness by kind of economic activity
Albania Bosnia
and Herze-
govina(1)
Republic Srpska
Fed. of Bosnia Herze-govina
Croatia Mace-donia
Monte- negro Serbia Average
WBR New EU Member States
INSTAT BHAS SIRS FOS CBS SSORM MONSTAT SORS
Economic activity (NACE)
2001 2003 2003 2003 2002 2002 2002 2003 2000 A Agriculture 8.9 11.9 23.2 6.3 6.3 0.6 26.0 3.4 10.8 (2)
D Manufacturing 1.9 11.9 10.1 12.7 20.5 19.4 2.6 10.9 11.3 12.6 F Construction 22.8 19.0 13.1 22.8 8.9 10.0 9.0 15.0 15.1 12.8 G Trade etc. 41.9 29.7 30.3 29.1 19.6 31.1 37.7 30.6 31.3 26.3 H Hotels etc. 7.0 8.3 9.1 7.6 8.9 5.3 3.9 2.0 6.5 7.3 I Transport etc. 14.9 7.1 12.1 5.1 5.4 6.5 11.7 2.7 8.2 7.8 K Real estate etc 1.3 4.8 1.0 6.3 13.4 9.4 2.6 8.8 6.0 13.0
O Other community 1.0 3.6 5.1 11.6 2.9 17.0 5.2 8.4
Not specified 0.3 3.6 1.0 5.2 5.4 14.7 6.5 9.6 5.6 11.7 Total 100.0 100.0 100.0 100.0 100.0 100.0 100.0 100.0 100.0 100.0 (1) Excluding Brcko District. (2) Included under “not specified”.
38. The tables present therefore a mixed picture and suggest considerable differences in the exhaustiveness of GDP estimation or considerable differences in underground production and statistical coverage of producers/enterprises. Tables 2 and 3 for example suggest that Albania is something of an outlier. On the other hand Table 4 shows that the distribution of the NOE in Albania is not significantly different to that seen in the other countries.
39. However, as already mentioned, comparisons such as these are fraught with difficulties, not least because they reflect both statistical and economic phenomena, but also because they reflect differences in the industrial structures in each country. A country for example with a large public sector is more likely to have a smaller NOE than a country with a smaller public sector, all other things equal.
40. This is why it is also instructive to investigate the share that each exhaustiveness type contributes to a particular industrial sector; as shown in the tables below (for those countries where the information provided allowed for the calculation). The sections that follow consider the estimates shown in the tables above and below for each country in turn, focussing on the coverage of activities and the methodology used. The measurement of illegal activities and imputed rent, which is not considered part of the NOE, (Types N1 to N7), are considered separately towards the end of this paper.
15

16
Table 5. N1+N6 NOE Types as a percentage of Gross Value Added in each Activity
Albania Bosnia
and Herze-
govina** Croatia
FYR ofMace-donia
Monte- negro Economic activity
(NACE)
2001 2003 2002 2002 2002 A Agriculture etc. 3.3 1.5 1.0 B Fishing 6.0 26.4 6.0 C Mining etc. 8.5 0.6 2.6 4.7 D Manufacturing 20.5 5.1 13.5 20.2 1.6 E Electricity etc. 0.2 1.6 1.0 F Construction 77.0 4.8 18.0 7.6 15.1 G Trade etc. 50.6 11.5 18.8 47.1 23.4 H Hotels etc. 57.4 17.1 20.1 52.9 13.3 I Transport etc. 41.8 3.5 6.3 9.9 7.7 J Financial inter. 4.5 K Real estate etc 42.1 9.0 22.9 32.8 L Public admin. M Education 0.3 1.4 0.3 4.4 N Health etc. 2.2 4.5 0.7 7.8
O Other community 29.9 7.5 10.1 15.3
Table 6. N3 NOE Types as a percentage of Gross Value Added in each Activity
Albania Bosnia
and Herze-
govina** Croatia
FYR ofMace-donia
Monte- negro Economic activity
(NACE)
2001 2003 2002 2002 2002 A Agriculture etc. 11.0 3.9 15.1 B Fishing 16.6 2.9 C Mining etc. D Manufacturing 0.3 1.3 E Electricity etc. F Construction 17.3 3.4 26.1 3.8 G Trade etc. 1.5 0.2 H Hotels etc. 1.1 3.1 I Transport etc. 0.1 2.6 J Financial inter. 4.5 K Real estate etc 0.0 0.3 L Public admin. M Education 1.1 N Health etc. 0.1
O Other community 0.0 3.2
17
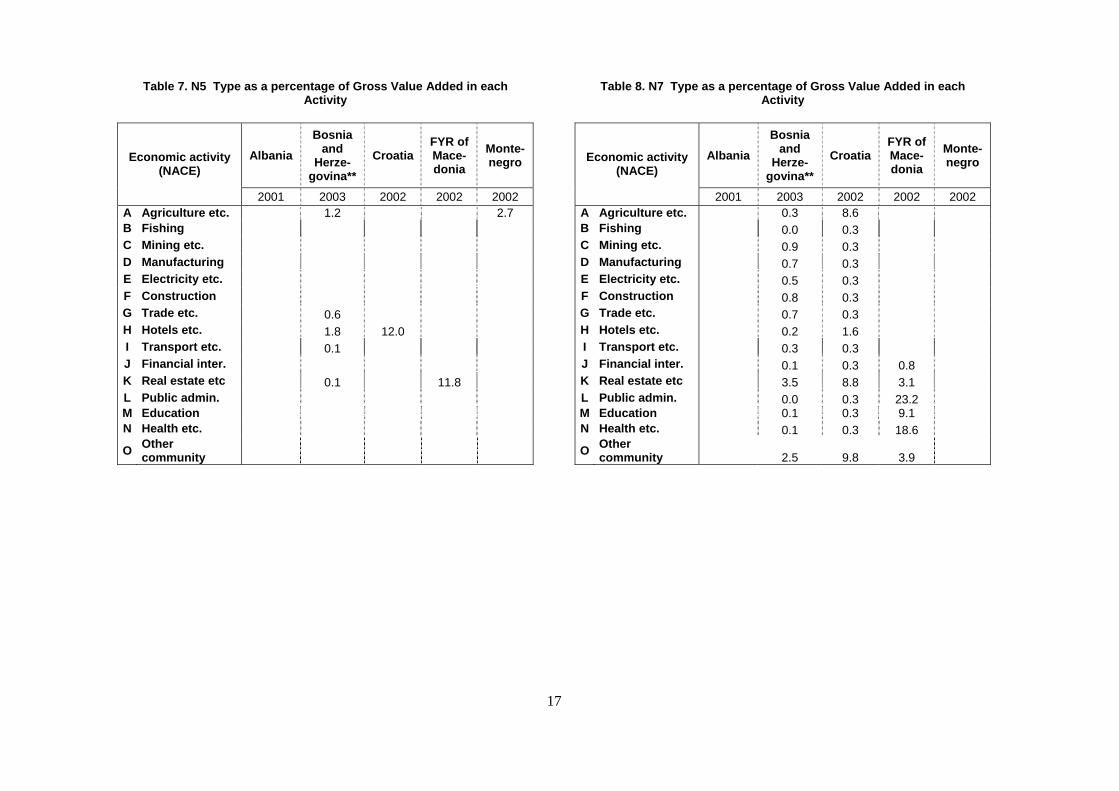
Table 7. N5 Type as a percentage of Gross Value Added in each Activity
Albania Bosnia
and Herze-
govina** Croatia
FYR ofMace-donia
Monte- negro Economic activity
(NACE)
2001 2003 2002 2002 2002 A Agriculture etc. 1.2 2.7 B Fishing C Mining etc. D Manufacturing E Electricity etc. F Construction G Trade etc. 0.6 H Hotels etc. 1.8 12.0 I Transport etc. 0.1 J Financial inter. K Real estate etc 0.1 11.8 L Public admin. M Education N Health etc.
O Other community
Table 8. N7 Type as a percentage of Gross Value Added in each Activity
Albania Bosnia
and Herze-
govina** Croatia
FYR ofMace-donia
Monte- negro Economic activity
(NACE)
2001 2003 2002 2002 2002 A Agriculture etc. 0.3 8.6 B Fishing 0.0 0.3 C Mining etc. 0.9 0.3 D Manufacturing 0.7 0.3 E Electricity etc. 0.5 0.3 F Construction 0.8 0.3 G Trade etc. 0.7 0.3 H Hotels etc. 0.2 1.6 I Transport etc. 0.3 0.3 J Financial inter. 0.1 0.3 0.8 K Real estate etc 3.5 8.8 3.1 L Public admin. 0.0 0.3 23.2 M Education 0.1 0.3 9.1 N Health etc. 0.1 0.3 18.6
O Other community 2.5 9.8 3.9
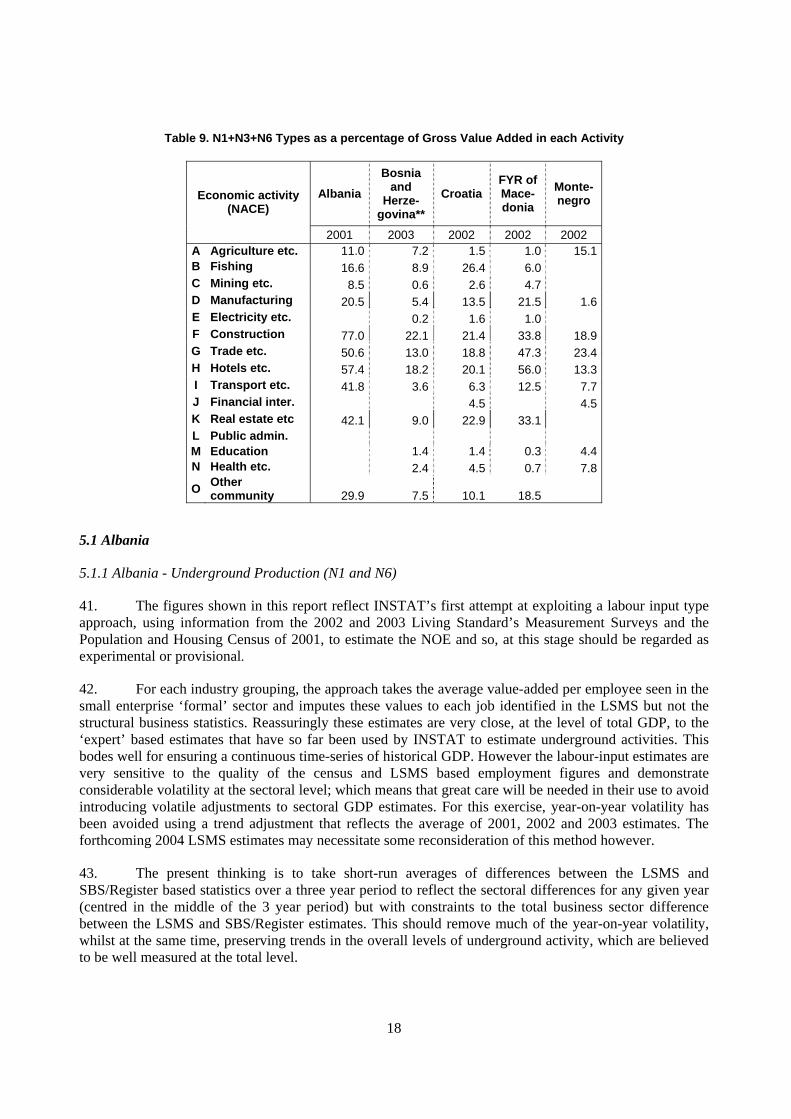
Table 9. N1+N3+N6 Types as a percentage of Gross Value Added in each Activity
Albania Bosnia
and Herze-
govina** Croatia
FYR ofMace-donia
Monte- negro Economic activity
(NACE)
2001 2003 2002 2002 2002 A Agriculture etc. 11.0 7.2 1.5 1.0 15.1 B Fishing 16.6 8.9 26.4 6.0 C Mining etc. 8.5 0.6 2.6 4.7 D Manufacturing 20.5 5.4 13.5 21.5 1.6 E Electricity etc. 0.2 1.6 1.0 F Construction 77.0 22.1 21.4 33.8 18.9 G Trade etc. 50.6 13.0 18.8 47.3 23.4 H Hotels etc. 57.4 18.2 20.1 56.0 13.3 I Transport etc. 41.8 3.6 6.3 12.5 7.7 J Financial inter. 4.5 4.5 K Real estate etc 42.1 9.0 22.9 33.1 L Public admin. M Education 1.4 1.4 0.3 4.4 N Health etc. 2.4 4.5 0.7 7.8
O Other community 29.9 7.5 10.1 18.5
5.1 Albania
5.1.1 Albania - Underground Production (N1 and N6)
41. The figures shown in this report reflect INSTAT’s first attempt at exploiting a labour input type approach, using information from the 2002 and 2003 Living Standard’s Measurement Surveys and the Population and Housing Census of 2001, to estimate the NOE and so, at this stage should be regarded as experimental or provisional.
42. For each industry grouping, the approach takes the average value-added per employee seen in the small enterprise ‘formal’ sector and imputes these values to each job identified in the LSMS but not the structural business statistics. Reassuringly these estimates are very close, at the level of total GDP, to the ‘expert’ based estimates that have so far been used by INSTAT to estimate underground activities. This bodes well for ensuring a continuous time-series of historical GDP. However the labour-input estimates are very sensitive to the quality of the census and LSMS based employment figures and demonstrate considerable volatility at the sectoral level; which means that great care will be needed in their use to avoid introducing volatile adjustments to sectoral GDP estimates. For this exercise, year-on-year volatility has been avoided using a trend adjustment that reflects the average of 2001, 2002 and 2003 estimates. The forthcoming 2004 LSMS estimates may necessitate some reconsideration of this method however.
43. The present thinking is to take short-run averages of differences between the LSMS and SBS/Register based statistics over a three year period to reflect the sectoral differences for any given year (centred in the middle of the 3 year period) but with constraints to the total business sector difference between the LSMS and SBS/Register estimates. This should remove much of the year-on-year volatility, whilst at the same time, preserving trends in the overall levels of underground activity, which are believed to be well measured at the total level.
18
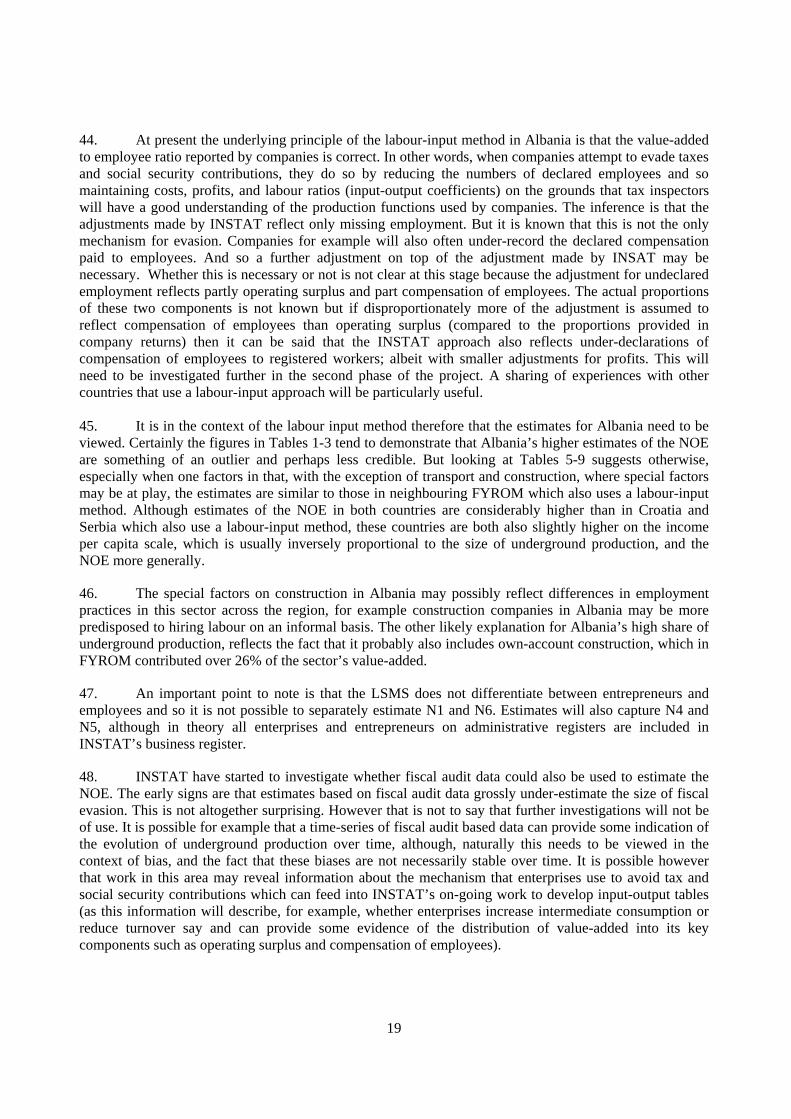
44. At present the underlying principle of the labour-input method in Albania is that the value-added to employee ratio reported by companies is correct. In other words, when companies attempt to evade taxes and social security contributions, they do so by reducing the numbers of declared employees and so maintaining costs, profits, and labour ratios (input-output coefficients) on the grounds that tax inspectors will have a good understanding of the production functions used by companies. The inference is that the adjustments made by INSTAT reflect only missing employment. But it is known that this is not the only mechanism for evasion. Companies for example will also often under-record the declared compensation paid to employees. And so a further adjustment on top of the adjustment made by INSAT may be necessary. Whether this is necessary or not is not clear at this stage because the adjustment for undeclared employment reflects partly operating surplus and part compensation of employees. The actual proportions of these two components is not known but if disproportionately more of the adjustment is assumed to reflect compensation of employees than operating surplus (compared to the proportions provided in company returns) then it can be said that the INSTAT approach also reflects under-declarations of compensation of employees to registered workers; albeit with smaller adjustments for profits. This will need to be investigated further in the second phase of the project. A sharing of experiences with other countries that use a labour-input approach will be particularly useful. 45. It is in the context of the labour input method therefore that the estimates for Albania need to be viewed. Certainly the figures in Tables 1-3 tend to demonstrate that Albania’s higher estimates of the NOE are something of an outlier and perhaps less credible. But looking at Tables 5-9 suggests otherwise, especially when one factors in that, with the exception of transport and construction, where special factors may be at play, the estimates are similar to those in neighbouring FYROM which also uses a labour-input method. Although estimates of the NOE in both countries are considerably higher than in Croatia and Serbia which also use a labour-input method, these countries are both also slightly higher on the income per capita scale, which is usually inversely proportional to the size of underground production, and the NOE more generally.
46. The special factors on construction in Albania may possibly reflect differences in employment practices in this sector across the region, for example construction companies in Albania may be more predisposed to hiring labour on an informal basis. The other likely explanation for Albania’s high share of underground production, reflects the fact that it probably also includes own-account construction, which in FYROM contributed over 26% of the sector’s value-added.
47. An important point to note is that the LSMS does not differentiate between entrepreneurs and employees and so it is not possible to separately estimate N1 and N6. Estimates will also capture N4 and N5, although in theory all enterprises and entrepreneurs on administrative registers are included in INSTAT’s business register.
48. INSTAT have started to investigate whether fiscal audit data could also be used to estimate the NOE. The early signs are that estimates based on fiscal audit data grossly under-estimate the size of fiscal evasion. This is not altogether surprising. However that is not to say that further investigations will not be of use. It is possible for example that a time-series of fiscal audit based data can provide some indication of the evolution of underground production over time, although, naturally this needs to be viewed in the context of bias, and the fact that these biases are not necessarily stable over time. It is possible however that work in this area may reveal information about the mechanism that enterprises use to avoid tax and social security contributions which can feed into INSTAT’s on-going work to develop input-output tables (as this information will describe, for example, whether enterprises increase intermediate consumption or reduce turnover say and can provide some evidence of the distribution of value-added into its key components such as operating surplus and compensation of employees).
19
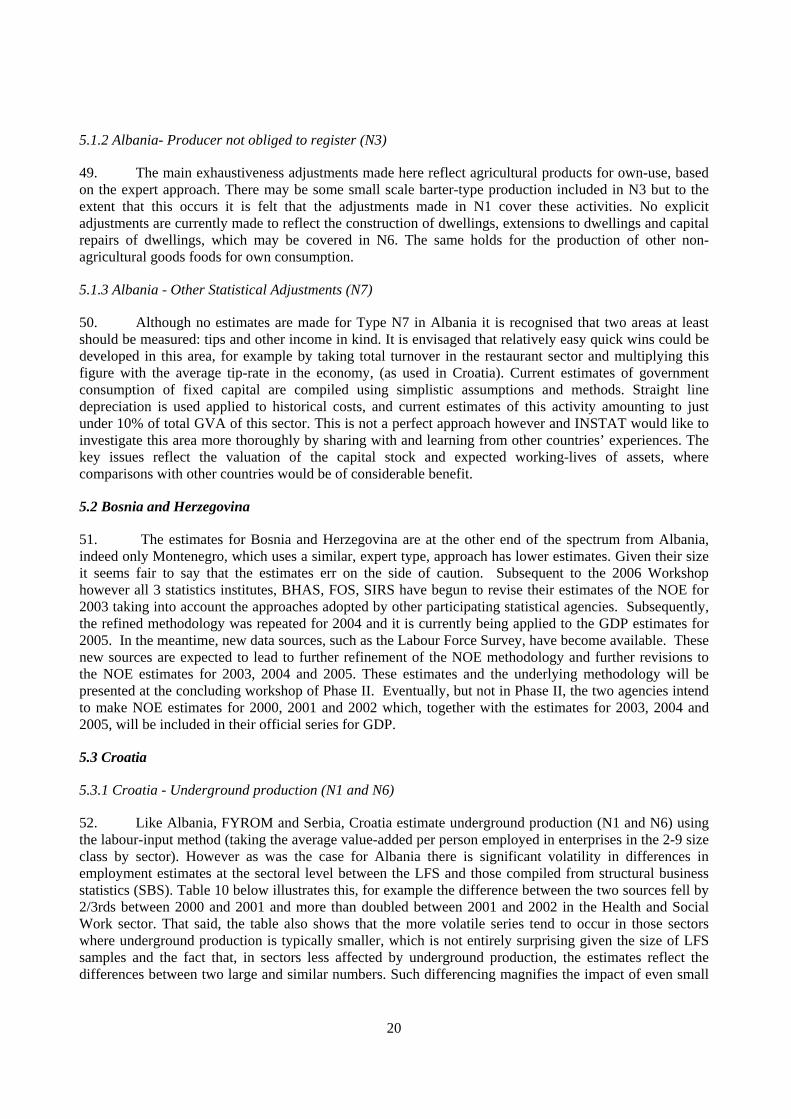
5.1.2 Albania- Producer not obliged to register (N3)
49. The main exhaustiveness adjustments made here reflect agricultural products for own-use, based on the expert approach. There may be some small scale barter-type production included in N3 but to the extent that this occurs it is felt that the adjustments made in N1 cover these activities. No explicit adjustments are currently made to reflect the construction of dwellings, extensions to dwellings and capital repairs of dwellings, which may be covered in N6. The same holds for the production of other non-agricultural goods foods for own consumption.
5.1.3 Albania - Other Statistical Adjustments (N7)
50. Although no estimates are made for Type N7 in Albania it is recognised that two areas at least should be measured: tips and other income in kind. It is envisaged that relatively easy quick wins could be developed in this area, for example by taking total turnover in the restaurant sector and multiplying this figure with the average tip-rate in the economy, (as used in Croatia). Current estimates of government consumption of fixed capital are compiled using simplistic assumptions and methods. Straight line depreciation is used applied to historical costs, and current estimates of this activity amounting to just under 10% of total GVA of this sector. This is not a perfect approach however and INSTAT would like to investigate this area more thoroughly by sharing with and learning from other countries’ experiences. The key issues reflect the valuation of the capital stock and expected working-lives of assets, where comparisons with other countries would be of considerable benefit.
5.2 Bosnia and Herzegovina
51. The estimates for Bosnia and Herzegovina are at the other end of the spectrum from Albania, indeed only Montenegro, which uses a similar, expert type, approach has lower estimates. Given their size it seems fair to say that the estimates err on the side of caution. Subsequent to the 2006 Workshop however all 3 statistics institutes, BHAS, FOS, SIRS have begun to revise their estimates of the NOE for 2003 taking into account the approaches adopted by other participating statistical agencies. Subsequently, the refined methodology was repeated for 2004 and it is currently being applied to the GDP estimates for 2005. In the meantime, new data sources, such as the Labour Force Survey, have become available. These new sources are expected to lead to further refinement of the NOE methodology and further revisions to the NOE estimates for 2003, 2004 and 2005. These estimates and the underlying methodology will be presented at the concluding workshop of Phase II. Eventually, but not in Phase II, the two agencies intend to make NOE estimates for 2000, 2001 and 2002 which, together with the estimates for 2003, 2004 and 2005, will be included in their official series for GDP.
5.3 Croatia
5.3.1 Croatia - Underground production (N1 and N6)
52. Like Albania, FYROM and Serbia, Croatia estimate underground production (N1 and N6) using the labour-input method (taking the average value-added per person employed in enterprises in the 2-9 size class by sector). However as was the case for Albania there is significant volatility in differences in employment estimates at the sectoral level between the LFS and those compiled from structural business statistics (SBS). Table 10 below illustrates this, for example the difference between the two sources fell by 2/3rds between 2000 and 2001 and more than doubled between 2001 and 2002 in the Health and Social Work sector. That said, the table also shows that the more volatile series tend to occur in those sectors where underground production is typically smaller, which is not entirely surprising given the size of LFS samples and the fact that, in sectors less affected by underground production, the estimates reflect the differences between two large and similar numbers. Such differencing magnifies the impact of even small
20

random errors in the two sources. Another important point to note is that the approach used does not differentiate between self-employed and employees and so, in practice, the estimates for N1 will also include part of N6.
Table 10: Differences in LFS and SBS employee estimates (LFS minus SBS)
Activities according to NACE 1998 1999 2000 2001 2002 A Agriculture, hunting and forestry* B Fishing 0 0 0 0 0 C Mining and quarrying 100 211 245 218 217 D Manufacturing 12.984 26.726 28.336 22.975 25.103 E Electricity, gas and water supply 224 532 466 413 432 F Construction 11.349 10.296 5.945 7.564 6.027 G Wholesale and retail trade, Repair of motor 32.668 24.694 16.895 19.499 7.292 H Hotels and restaurants 10.268 6.390 5.297 6.921 5.356 I Transport, storage and communication 11.672 6.594 2.952 3.747 2.611 J Financial intermediation 1.046 1.488 411 0 599 K Real estate, renting and business activities 5.966 1.083 0 0 0 L Public administration 0 0 0 0 0 M Education 3.846 5.041 1.368 183 1.537 N Health and social work 14.017 13.439 7.522 2.454 5.808 O Other community, social and personal 9.377 4.730 2.091 0 167 TOTAL 113.516 101.223 71.528 63.973 55.148
* Agriculture is excluded from the calculation due to differences in the source data.
53. The nature of the LFS estimation method means that part of N6 is included in N1. The remaining component of N6 reflects the under-declaration of income by incorporated enterprises and unincorporated enterprises with employees (based on the further assumption that only such enterprises with less than 10 employees, engage in underground production). Estimates of value-added in these enterprises are calculated using the average (full time equivalent) labour productivity figures in larger enterprises (calculated at the sector level), and are supplemented using anecdotal tax-audit information. The method has been applied to all activities apart from those, where economies of scale, or technology etc, play a role, (e.g. oil extraction, telecommunications and electricity generation). As was the case for the labour-input approach however, the method creates some volatility in sectoral N6 estimates, which will require further investigation but, like the labour input methods, the most volatile series are typically the smallest.
54. Estimates for the unincorporated self-employed use a similar approach: except that the average labour productivity figures are derived from enterprises with less than 10 employees. Indeed the approach used for this group of individuals is to take the weighted average of their reported value added per employee (weight 60%) and the value added per employee of small enterprises (40%). Again this approach tends to produce volatile NOE estimates at the sectoral level, when the adjustments are small.
5.3.2 Croatia - Producer not obliged to register (N3)
55. Croatia uses a macro approach to estimate agricultural output, but an adjustment is made to reflect the fact that own-account production and production sold by households is calculated using wholesale prices. The adjustment moves the price value closer to a market price by taking the average of wholesale and market prices but this is viewed as a statistical adjustment and so is included in Type N7.
21
Indeed the only activity recorded in N3 is own-account construction which is estimated at 10% of declared values of households on construction activities.
5.3.3 Croatia- Registered enterprises not included on the business register (N4, N5)
56. No estimate is considered necessary for N4 as the business register is comprehensive in this regard. An adjustment is made for N5 however for income from renting, dwellings rooms and spaces, based on data for this activity that are reported to the tax authorities but are not included in register (allocated to the hotels and restaurants sector). Given the scope for evasion in this activity it seems probable that this is an underestimate, since it presupposes that the declared revenues are correct; although much depends on how much of this activity is also captured using the labour-input method.
5.3.4 Croatia - Other Statistical Adjustments (N7)
57. Statistical adjustments are made to reflect agricultural prices, (see N3 above); secondary activities, using information from household surveys, and tips, which are calculated using average tip rates as a proportion of turnover in restaurant/bar establishments that typically receive tips. Currently, general government consumption of fixed capital is valued on the basis of 4 per cent of compensation of employees, but improving these estimates and approach is one of the key Phase II objectives.
5.4 FYR of Macedonia
5.4.1 FYROM - Underground production (N1 and N6)
58. Like Croatia and Albania, FYROM use a labour-input method to estimate underground production. The approach is a staged one that first corrects estimates of value-added per employee declared by registered enterprises by making adjustments for: underreported wages and salaries (using information from the Labour Ministry; over-reported intermediate consumption (investigating trends and comparing across businesses and sectors); and for the trade sector, underreported turnover and so production and value-added are corrected using supply-use tables and trade margins. The final stage is then to adopt the labour-input method, in its conventional way, using adjusted labour productivity figures in small enterprises as proxies.
5.4.2 FYROM - Producer not obliged to register (N3)
59. Estimates are made for the following activities:
• Construction of dwellings, extensions to dwellings, capital repairs; using information from the Department of Construction which shows the value of work on dwellings, extensions to dwellings, capital repairs of dwellings produced by households (this may however also reflect part N1).
• Tourism: catering and accommodation services; using information from the Tourist Bureau on the total number of registered tourists and nights spent in private rooms, including estimates of any additional catering services provided. Gross output is taken as the product of the total numbers of nights and the average costs per night. Intermediate consumption is estimated on the basis of information from the normal statistical surveys of corporations and unincorporated enterprises and other national accounts information. Included in this category, although in theory it should be reflected in N5, is the provision of rooms for let provided by small unincorporated catering enterprises. Note that in Croatia this activity is allocated to N5 reflecting in part the different legal requirements in place in each country.
22
• Unincorporated household enterprises that have very small-scale market output; obtained from the Tax Office, reflecting producers with very small-scale output but who are still obliged to pay a fixed tax. This group is included here although in theory they should be allocated to N5. Additionally, using data from the LFS and the labour input method, adjustments are made for individuals that perform services (such as child-minding, cleaning) for friends/neighbours and take remunerations in cash or in kind.
60. Estimates of agricultural output for own final consumption are not estimated separately but they are included in the value of total agriculture output, which is estimated using a macro based method similar to those used in other countries, such as Albania, described above.
5.4.3 FYROM - Registered enterprises not included on the business register (N4, N5)
61. In FYROM the sole entry here reflects author’s fees, using tax information provided by the Ministry of Finance to calculate turnover, with adjustments of 20% and 10% to reflect intermediate consumption and consumption of fixed capital respectively.
5.4.4 FYROM - Other Statistical Adjustments (N7)
62. FYROM include an adjustment under N7 for the consumption of general government fixed assets. This adjustment is a good example of why international comparisons of the NOE should be made with maximum care and interpretation. Other countries, including non-transition economies, estimate this activity. Few however would view the correction of estimates of CFC (depreciation) for budgetary purposes to CFC for national accounts purposes as being part of the NOE, despite the fact that in most counties this correction will be routinely made. As part of the second phase of this project the OECD has begun to investigate the methods used by all WBC to estimate CFC (looking at the depreciation rates by asset type, expected service lives and coverage of assets) to gauge their comparability. For information the following (straight line) CFC (depreciation) rates are used in FYROM. (Note that intangible assets, such as software, purchased and own-account are not shown and will be investigated in Phase II).
• Machinery and equipment 20%;
• Cultivated assets 20%;
• Livestock for breeding, dairy, draught etc 10%;
• Other fixed assets 20%;
• Buildings, road and other structures 1% except Road Fund 3%.
5.5 Montenegro
5.5.1 Montenegro - Underground production (N1 and N6)
63. Estimates of Type N1 and N6 are made using the expert approach. For Type N1 an adjustment is made explicitly to reflect tourism services provided by hotels and restaurants. This adjustment, adding 0.3% to GDP and bringing total value-added in this sector up to 2.5% of GDP, is recognised as very conservative however. For example research by the World Travel & Tourism Council in co-operation with the Ministry of Tourism concluded that the share of hotels and restaurants in GDP was 14 per cent in 2004. Comparing this adjustment to equivalent adjustments in other countries it is interesting to note that in Croatia this adjustment is included in N5 and in FYROM it is included in N3. All other adjustments for underground production are allocated to Type N6.
23
5.5.2 Montenegro- Producer not obliged to register (N3)
64. MONSTAT makes adjustments for the following activities: own-account agricultural production; own-account construction and real estate, renting and business activities. In all 3 cases expert methods are used (with coefficients of 18% for agriculture, 5% for construction and 5% for real estate renting and business activities). In fact because, in theory, at least part of this latter activity is taxable and should be declared, this activity should be included in N1.
5.5.3 Montenegro- Registered enterprises not included on the business register (N4, N5)
65. The self-employed are not included in MONSTAT’s statistical register but they are registered on an administrative register (Central Register of the Commercial Court and reported by the Municipal Secretaries (Departments) for Economy). There are however plans to include them in the Administrative Register during 2006. At present the only adjustments made reflect the self-employed working in the agriculture sector, which is recognised as being very conservative, certainly when set against the adjustments made in other countries.
5.6 Serbia
5.6.1 Serbia - Underground production (N1 and N6)
13. The approach to estimation is similar to that adopted in FYROM. The starting approach is to estimate underground production of Type N6, using supplementary information provided by the survey on entrepreneurship which provided the basis for an analysis of value-added, and intermediate consumption to output ratios and, indeed, output more generally. This analysis provided the benchmark labour productivity estimates used in calculating Type N1 on the basis of the labour-input approach. It should be recognised though, as is the case in some other countries, that the labour-input method is still a relatively new development and so the results based on it are still at this stage considered preliminary. Indeed Serbia are still investigating FTE based methods, where early results point to increases in the adjustment from 6.4 to 7.5% of GDP.
5.6.2 Serbia - Producer not obliged to register (N3)
66. No adjustments are included under Type N3. Own production of agricultural outputs, which usually features here, is estimated, as in other countries, using a macro-based approach. Own-account construction is not thought to be a problem, as the procedure for obtaining building permits has been simplified in recent years, and penalties for illegal construction are now stipulated in law, and, so, no adjustments are deemed necessary for this activity – although the experience of other countries suggest that some adjustment may still be necessary.
5.6.3 Serbia - Registered enterprises not included on the business register (N4, N5)
67. Adjustments here reflect the fact that companies and legal persons are required to submit returns to the tax authorities at the end of a financial year. Businesses that become inactive before that reporting period therefore do not submit such returns (in Serbia this amounts to about 10% of enterprises). For VAT paying businesses, Serbia estimate this activity using VAT data, since VAT will still have been paid even by failed business. For businesses below the VAT threshold the assumption is that each failed businesses was, on average, active for four months. Perhaps the most interesting feature of this adjustment is that arguably it should not be part of the NOE at all, or possibly just part of N7, since it is little different from the types of approaches, for example grossing up to the entire population, used to estimate GDP more generally.
24

5.6.4 Serbia - Other Statistical Adjustments (N7)
68. As part of Phase I of the project Serbia undertook an ad hoc statistical survey, piggy-backing onto the regular household budget survey, to measure the following activities: health services, in particular payments to public sector workers for access to free services, broken down by type of service (operation); private teaching (teaching hours); and tips in, the more general sense, to taxi drivers, waiters, hairdressers etc. Currently, general government consumption of fixed capital is valued on the basis of 4 per cent of output (as oppose to compensation of employees in Croatia), but improving these estimates and approach is one of the key Phase II objectives.
6. Illegal Activities (N2)
69. Only 3 countries (Croatia, FYROM and Serbia) have so far been able to provide estimates of illegal activities, using, in the main, similar approaches depending on the activity. For Macedonia however the approach has been experimental and so it has been decided to exclude estimates from Type N2 for the present.
6.1 Narcotics
70. For narcotics, Croatia adopts a supply based approach, whereas FYROM uses a demand approach and Serbia adopts a supply-demand approach. The experience of Croatia illustrates well why supply based approaches based on seizure rates need to be developed cautiously. The starting point in Croatia is drug seizures (quantities) to which are applied seizure rates (25% effective), prices (by drug type) and intermediate consumption estimates. This is the method applied in many other countries that have attempted to measure value-added related to drugs supply (recalling that in WBC countries in general drugs are imported). The problem, especially for WBC countries, who find themselves on one of the key drug transit routes into Western Europe, is that the quantity of seizures from one year to the next can be significantly different. This can produce very volatile series. As such it is prudent to either (a) smooth drug seizures over a period of 4 or 5 years and assume that value-added is relatively stable over this period, or adopt a demand based approach, as used in FYROM and also Serbia
71. Neither country has however adopted a household based survey approach to estimation, fully aware that respondents are unlikely to be entirely open about consumption. Instead the approach has been to attempt to estimate the number of drugs users (by drug type) in each country multiplied by the street price (with adjustments made to reflect intermediate consumption in the case of value-added and imports in the case of GDP). In both Croatia and Serbia narcotics contribute 0.3% of gross value-added.
6.2 Prostitution
72. Both Serbia and Croatia have adopted supply side approaches to estimate prostitution based on: official government estimates of prostitutes in Croatia and unofficial research sources in Serbia; the estimated number of services provided; and the average prices for these services. In Croatia the number of prostitutes is estimated at 800, the average number of clients seen is 5 per day, the average days worked per year is 205, and the average price per client is 68.6 Euros. In Serbia on the other hand, with a population twice as large (but with a smaller tourism sector), the number of prostitutes has been estimated at 7000 (significantly higher than the estimates provided by the Ministry of the Interior, 800), with an average monthly income of 2000 Euros per month for 10 months of the year. The average monthly incomes over the course of a year for prostitutes in Croatia and Serbia respectively are 5860 and 1667 Euros respectively; which may further help to explain the large differences in the numbers of prostitutes per capita in both countries, since they may imply that the figure of 7000 includes many prostitutes who are only engaged on an occasional basis, whereas in Croatia the figure of 205 days is explicitly a weighted
25
average of prostitutes working 100 days a year (30%) and 250 days a year (70%). The bottom line of these estimations is that, in Serbia, prostitution is estimated at 0.7% of GDP and in Croatia 0.19%; suggesting that the estimates for Croatia are on the conservative side.
6.3 People Smuggling
73. Estimates of the smuggling of people through FYROM have been made using statistics provided by the Ministry of Interior Affairs, based on extrapolations of the number of foreigners discovered illegally crossing national borders and estimates of the prices these individuals paid for transportation through the country. At present, it is assumed that the revenue paid to domestic operatives for facilitating transit through the country are equal to value added; although future estimates may embody some adjustment based, for example on the margins that might be found in the transportation sector.
74. The approach used in Croatia is similar, based on foreigners caught crossing the border illegally and a 50% capture/detection rate, and an average price paid by these illegal immigrants of about 475 Euros for the part of the journey through Croatia (although this figure may include, in part, bribes, which should be excluded from the calculation). This activity is estimated to contribute 0.04% to Croatia’s GDP.
6.4 Copyright Infringement
75. Croatia has also begun to develop estimates of counterfeit production of media goods (CDs/DVDs/videos/Audio-cassettes), using quantities detected, seizure rates and market prices (including estimates for intermediate consumption.
6.5 Corruption
76. Finally Croatia has also embarked on an ambitious exercise to evaluate the size of corruption that is productive. This is a thorny issue. Typically bribes should not be included in GDP as they merely reflect transfers, like extortion, but in some cases it is difficult to differentiate a bribe from a payment for a service. For example, throughout the WBC it is common practice for individuals to pay doctors and teachers a ‘tip’ say for services provided. In some cases the tip may be just that, in the sense that is paid after services have been provided but in other cases the ‘tip’ is made in the knowledge that without it the services that will be eventually provided may not be of the same quality (for example the payment might involve jumping a queue).It is in this spirit that Croatia embarked on estimating corruption, which, using information onfcriminal offences related to this activity, have been estimated at 0.5% of GDP. However one should note that most, if not all, of this activity is not productive in a national accounts sense and so should not be included in N2 and GDP.
7. Owner Occupied Dwellings
77. Rents for dwellings are not part of the NOE. However, correct estimates of rents for dwellings – especially imputed rents for owner-occupied dwellings – are important to ensure that GDP estimates are exhaustive. The user cost approach, described in Annex A, is recommended for use by countries where the rental market for dwellings is small and rented dwellings are not typical of the total stock of dwellings. All WBC fit the criteria for using the user cost approach and all but Montenegro did so.
78. Table 3 lists WBC that have made estimates of dwelling services with the user cost approach and shows their estimates as percentages of GDP. For European countries, expenditure on dwelling services as a share of GDP is usually between 8 per cent and 12 per cent and it tends to increase as GDP per capita rises. The percentage shares of Bosnia and Herzegovina seem rather high given its relatively low level of per capita income. The explanation may well be that their GDP is still underestimated because the NOE is not fully covered, as certainly seems to be the case on the basis of the tables and discussion above. One
26
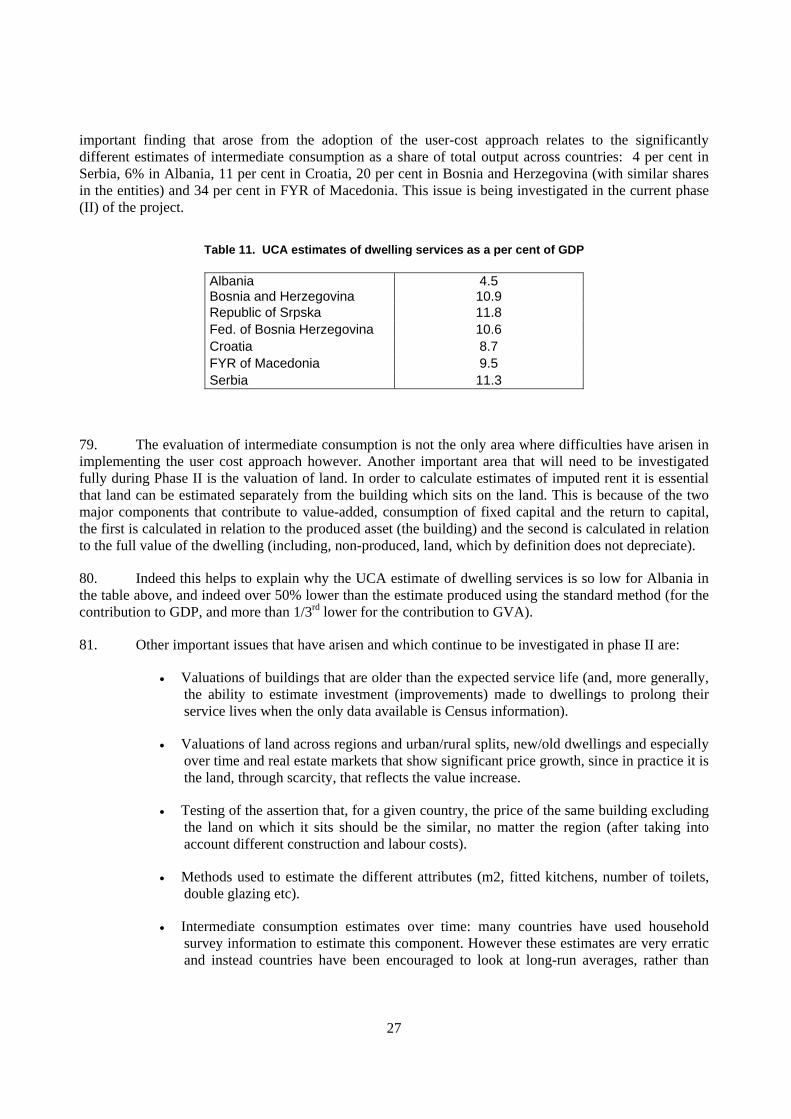
important finding that arose from the adoption of the user-cost approach relates to the significantly different estimates of intermediate consumption as a share of total output across countries: 4 per cent in Serbia, 6% in Albania, 11 per cent in Croatia, 20 per cent in Bosnia and Herzegovina (with similar shares in the entities) and 34 per cent in FYR of Macedonia. This issue is being investigated in the current phase (II) of the project.
Table 11. UCA estimates of dwelling services as a per cent of GDP
Albania Bosnia and Herzegovina
4.5 10.9
Republic of Srpska 11.8 Fed. of Bosnia Herzegovina 10.6 Croatia 8.7 FYR of Macedonia 9.5 Serbia 11.3
79. The evaluation of intermediate consumption is not the only area where difficulties have arisen in implementing the user cost approach however. Another important area that will need to be investigated fully during Phase II is the valuation of land. In order to calculate estimates of imputed rent it is essential that land can be estimated separately from the building which sits on the land. This is because of the two major components that contribute to value-added, consumption of fixed capital and the return to capital, the first is calculated in relation to the produced asset (the building) and the second is calculated in relation to the full value of the dwelling (including, non-produced, land, which by definition does not depreciate).
80. Indeed this helps to explain why the UCA estimate of dwelling services is so low for Albania in the table above, and indeed over 50% lower than the estimate produced using the standard method (for the contribution to GDP, and more than 1/3rd lower for the contribution to GVA).
81. Other important issues that have arisen and which continue to be investigated in phase II are:
• Valuations of buildings that are older than the expected service life (and, more generally, the ability to estimate investment (improvements) made to dwellings to prolong their service lives when the only data available is Census information).
• Valuations of land across regions and urban/rural splits, new/old dwellings and especially over time and real estate markets that show significant price growth, since in practice it is the land, through scarcity, that reflects the value increase.
• Testing of the assertion that, for a given country, the price of the same building excluding the land on which it sits should be the similar, no matter the region (after taking into account different construction and labour costs).
• Methods used to estimate the different attributes (m2, fitted kitchens, number of toilets, double glazing etc).
• Intermediate consumption estimates over time: many countries have used household survey information to estimate this component. However these estimates are very erratic and instead countries have been encouraged to look at long-run averages, rather than
27

single year statistics. Further work during Phase II will try to steer countries towards comparable and similar estimates of intermediate consumption.
82. The following paragraphs provide a summary of the position on UCA in each of the WBC.
• INSTAT’s UCA estimates of dwelling reflect a considerable change to the official estimates, but have not yet been incorporated in official GDP. This is because there are some concerns about the quality of information, and perhaps the approach, used by INSTAT. The UCA estimates amount to just over 4 per cent of gross value added compared to 6 per cent in the official estimates of GVA. A number of factors need to be investigated further. These include the breakdown of census data by age and dwelling type, the average prices used, land valuations, depreciation profiles and the estimates for intermediate consumption. INSTAT will investigate these and other factors in Phase II.
• BHAS, FOS, SIRS: Following the concluding workshop of Phase I, the UCA estimates of dwelling services for 2003 were revised by BHAS. CFC was calculated on the current value of the dwelling stock excluding land, previously it was not, explaining the relatively high figures in Table 11 above. Subsequently, UCA estimates of dwelling services were calculated for the period 2000 to 2005. These were included in the official GDP estimates published in 2006. This is an important development because previously official estimates did not include imputed rents of owner-occupiers at all. In the original estimates of dwelling services made for 2003 in Phase I and shown above, the share of intermediate consumption was 20 per cent, the second highest share among participating countries.8 The principal source of data on expenditure on regular repair and maintenance was the Household Budget Survey. BHAS considered the expenditure reported was too low. It suspected that the concept had not been fully understood by respondents and that some expenditure on regular repair and maintenance had been incorrectly recorded as gross fixed capital formation and it adjusted accordingly. The revised estimates for 2000 to 2005 show intermediate consumption contributing around 15 per cent to the output dwelling services at both current and constant prices.
• CBS: UCA estimates of dwelling services made in Phase I reflect a considerable change to official estimates but they have still to be incorporated in official GDP. There remain some serious concerns relating to the valuations given to dwelling stocks, especially the split between land and buildings. As is the case for other countries estimates of intermediate consumption based on household budget surveys are erratic, although the CBS has started to smooth the profile. A recent detailed assessment of the current approach resulted in considerable changes made to estimates. The chief cause of concern was the adjustments made by CBS to move from an “average” price for an “average” dwelling to an average price for all types of dwellings. This was considered necessary because the definition of an “average” dwelling did not appear to be correct. This has now been modified. There are still unresolved issues, especially the valuation of land. These will be tackled by CBS during Phase II.
• SSORM: The UCA estimates of dwelling services made in Phase I were a vast improvement on earlier quasi-UCA estimates. Even so, improvements continue. A present the UCA estimates do not fully comply with Eurostat recommendations. They are based on 1.8 per
8 Interestingly, it was noted that the share of intermediate consumption in UCA benchmark estimates for Norway in 2000 was 19 per cent in the 1995 revision, 22 per cent in the 2002 revision and 18 per cent in the 2006 revision.
28

cent rate of return (instead of 2.5 per cent) and do not include valuations of land in their calculation. In Phase II, SSORM will seek to improve the estimates so that they better conform to Eurostat recommendations.
• MONSTAT did not make estimates of imputed rentals with the user cost approach in Phase I. But it has now made estimates for 2003, 2004 and 2005. The UCA estimates increases the share of dwelling services in GDP from 8 per cent to 12 per cent. The share of intermediate consumption in the output of dwelling services is around 4 per cent. This is similar to the figure for Serbia and justified by the same argument – that, under current economic conditions, house-owners are carrying out only essential repair and maintenance. MONSTAT has introduced the UCA estimates into the official national accounts estimates for 2003, 2004 and 2005. The official series, however, goes back to 2000 and MONSTAT plans to make UCA estimates for 2000, 2001 and 2002 during Phase II.
• SORS estimated dwelling services for 2003 using the user cost approach in Phase I. The value of land was included when estimating the CFC of owner-occupiers, but this was offset by the rate of return on owner-occupied dwellings being 1.75 per cent instead of the 2.5 per cent recommended by Eurostat. Intermediate consumption was 4 per cent of imputed rents, the second lowest share among participating countries (including Kosovo, see below). SORS maintains that its estimate reflects reality, explaining that economic conditions during the 1990s and the subsequent ongoing period of transition has caused owner-occupiers to neglect regular repair and maintenance with only essential repairs and maintenance being carried out. Moreover, it has been rigorous in its interpretation of what constitutes regular repair and maintenance, correctly excluding all expenditures that are final expenditures. Since Phase I, SORS has calculated UCA dwelling service estimates for the period 2000 to 2005 and included them in the official estimates of GDP. These UCA estimates will need to be corrected during Phase II because the value of land was included when calculating CFC. The published figures will not change however. The decrease in CFC that results from the exclusion of land will be compensated for by a corresponding increase in net operating surplus. In other words, there will be an increase in the rate of return on owner occupied dwellings, which, at around 2.1 per cent, will still be lower than the recommended 2.5 per cent.
• SOK (Kosovo) made an estimate of imputed rentals for 2004 with the user cost approach in Phase I. The calculation was made on the “back of an envelope” using the limited sources available. Intermediate consumption contributed one per cent to total output – the lowest share among participating countries. Clearly, expenditure on regular repair and maintenance was underestimated. SOK plans to repeat the exercise for 2004 and 2005 in Phase II using data from municipality property tax registers on the number of houses and square metres. Special attention will be paid to the coverage of regular repair and maintenance. The resulting UCA estimates will be compared to the official series that is currently derived by a simplified stratification procedure which is not appropriate to Kosovo circumstances.
8. Conclusions
83. The project has shown that considerable improvements can be delivered using the Eurostat Tabular approach. That said the experiences in the WBC also demonstrate that countries should not rush to introduce adjustments that are not robust and are reproducible over a long period of time. The work continues and the OECD hopes to have a more comprehensive report in the middle of 2008 with a series of recommendations on specific areas that allow countries to develop sustainable realistic action plans to measure and present the NOE.
29
ANNEX A
THE USER COST APPROACH TO ESTIMATING IMPUTRE RENT FOR OWNER OCCUPIED DWELLINGS: – GUIDANCE NOTES PROVIDED TO THE WBC
Introduction 1. The standard procedure recommended in the SNA for owner-occupied dwellings is to assume that the rents that would be paid are the same as the rents actually paid for similar dwellings. But the standard procedure cannot always be applied. This is the case where so few dwellings are rented that rents actually paid cannot be regarded as typical. For example, in some countries, most of the dwellings available for rent are occupied by foreigners or by employees of government or large public enterprises at rents which cannot be regarded as representative, while in other countries, dwellings may only be available for rent in the capital city or other principal urban areas. 2. The following rules are recommended for deciding when the standard approach should not be used:
• less than 25 per cent of all dwellings in the country are actually rented; • more than half of the rented dwellings are occupied by foreigners paying high rents or by
government or other employees paying low rents; and • rented dwellings are not evenly distributed over all parts of the country.
3. When the standard procedure cannot be used, expenditure on dwellings is estimated by the user cost approach. The user cost approach consists of estimating each of the costs that owners of dwellings would need to take into account in fixing a market rent if they decided to rent their dwellings to other people rather than to live in them themselves. These costs (with 1993 SNA codes in brackets) are:
• Intermediate consumption (P2). • Other taxes on production (D29). • Consumption of fixed capital (K1). • Net operating surplus (B2).
4. The sum of consumption of fixed capital and the net operating surplus can be described as the capital service provided by the dwelling and the net operating surplus is sometimes referred to as the cost of capital. Here, however, the terms used are those that are used in a national accounts context. 5. Table 1 is in the form of a worksheet and lists the various data items that are required to impute expenditure on owner occupied dwelling services by the user cost approach.
30
6. The Table is completed for each type of owner-occupied dwelling that can be separately distinguished in the housing statistics available in each country. At a very minimum it would be desirable to distinguish:
• Single-family dwellings (houses or villas). • Apartments below a certain floor space (such as below 30 m²). • Apartments above a certain floor space (such as 30m² or more).
7. The main difficulties in applying the user cost approach as outlined in Table 1 are:
• estimating the stock of owner-occupied dwellings, which is required to calculate both consumption of fixed capital (UC 09) and the net operating surplus (UC 14);
• calculating consumption of fixed capital (UC 09) once the stock has been estimated; and • choosing the rate of return (UC 13) to be applied to the current value of the stock of owner-
occupied dwellings (UC 12) to calculate the net operating surplus (UC 14). 8. Each of these problems is now considered in turn. Stock of owner-occupied dwellings 9. The standard procedure for estimating the stock of a capital asset is the perpetual inventory method (PIM). The PIM requires long time series on gross fixed capital formation (GFCF) and on prices of capital assets as well as assumptions about the average service lives of assets and about how retirements of assets are distributed around this average. Most countries, however, do not have capital stock estimates or the means to derive them by the PIM so it is necessary to consider an alternative method. 10. Table 2 is a worksheet that can be used to estimate the value at current market prices of the stock of each type of owner-occupied dwelling. It is designed for countries that only have information from a recent population census on the number of owner-occupied dwellings classified by a few broad types of dwellings. 11. The first step is to draw up a classification of dwellings which distinguishes between the main types of owner-occupied dwellings in the country. The stocks of owner-occupied dwellings will then be estimated separately for each type. A simple three-way classification – single family dwellings (houses or villas) and two size classes of apartments - was suggested above. Consumption of Fixed Capital 12. Countries that estimate stocks of dwellings using the PIM will already have estimates of consumption of fixed capital. For countries that do not do so, some other method must be used and one alternative method is described here. 13. When the PIM is used, the commonest way of calculating consumption of fixed capital is to assume straight-line depreciation – equal fall in value of the asset each year of its service life – and to assume that retirements of assets are distributed around the average service life according to a bell-shaped mortality function9. This method of calculating consumption of fixed capital can be described as “straight-line depreciation with a bell-shaped mortality function”. 9 The mortality function determines what percentage of assets installed in a given year are retired in each of the years prior to the average, in the year when they reach their average service life, and in each year following the average service life. Several different functions are used for this purpose including Weibull, Winfrey and the log-normal distributions. For details see Measuring Capital: Measurement of Capital Stocks, Consumption of Fixed Capital and Capital Services, OECD, Paris, 2001.
31

14. This method can be approximated by a simpler procedure in which annual consumption of fixed capital is calculated as a constant fraction of the value of the stock of dwellings at current market prices. This method of calculating consumption of fixed capital is described as “geometric depreciation with no mortality function”. 15. Although it is only an approximation to straight-line depreciation with a bell shaped mortality function, geometric depreciation with no mortality function offers the important advantage that it does not require countries to have a long time-series of gross fixed capital formation in order to apply the mortality function. 16. For countries that have used the approach described in Table 2 to estimate the stock of owner-occupied dwellings, geometric depreciation with no mortality function is the only feasible method. Consumption of fixed capital (CFC) is obtained by multiplying the mid-year value of the net capital stock by the depreciation rate. 17. The depreciation rate used for geometric depreciation is usually written as D/L, where D is the “declining balance rate” and L is the average service life of the assets. D is usually assumed to lie between 1 and 3 and it has been found that for dwellings in Europe and North America, a value of 1.6 produces estimates of consumption of fixed capital that are similar to those that are obtained using straight-line depreciation with a bell-shaped mortality function. In the absence of information to the contrary, it is here recommended that D be set at 1.6. Thus, for example, if the mid-year net value of the stock of a particular type of owner-occupied dwelling is 4000, and if the average service life for that type of dwelling is 70 years, CFC is obtained as 4000*(1.6/70) = 91. 18. Table 3 is a worksheet for calculating CFC. As was explained above with regard to the stock of owner-occupied dwellings, the calculations are made separately for each type of dwelling for which separate information is available. Note that for calculating consumption of fixed capital, the capital stock must exclude the value of land underlying dwellings. More information on this is given below. Rate of return used to estimate net operating surplus 19. Economists assume that people acquire capital assets because the net operating surplus that they expect to earn is at least as high as the interest that they could earn by investing in a financial asset. This reasoning applies whether the capital asset is a factory building, a machine, a truck or, as here, a dwelling. 20. In practice, there are many interest rates that could reasonably be used as the rate of return to estimate the net operating surplus. In countries where there is a well established and widely used system of housing loans, the rate charged on these loans is the best one to use. Where there is no such system in place, the rate on long term (8 years or more) corporate or government bonds could be used. Note that all rates should be on newly issued debt and not the average rate paid on outstanding debt, which reflects rates existing in prior years. 21. In countries where financial markets are less developed, none of these alternatives may be feasible. In this case it is recommended that a standard annual rate of return of 2.5% should be used. This means that the net operating surplus will be calculated as 0.025 times the current market value of the stock of owner-occupied dwellings.
32
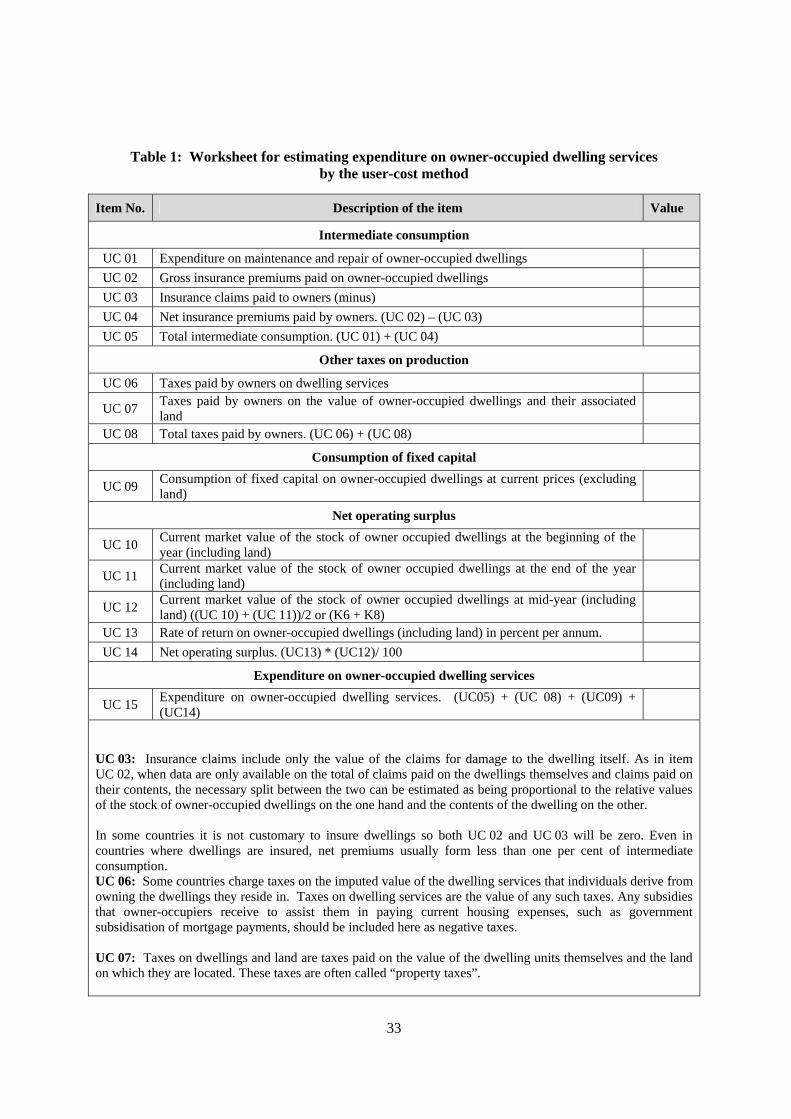
Table 1: Worksheet for estimating expenditure on owner-occupied dwelling services
by the user-cost method
Item No. Description of the item Value
Intermediate consumption
UC 01 Expenditure on maintenance and repair of owner-occupied dwellings UC 02 Gross insurance premiums paid on owner-occupied dwellings UC 03 Insurance claims paid to owners (minus) UC 04 Net insurance premiums paid by owners. (UC 02) – (UC 03) UC 05 Total intermediate consumption. (UC 01) + (UC 04)
Other taxes on production
UC 06 Taxes paid by owners on dwelling services
UC 07 Taxes paid by owners on the value of owner-occupied dwellings and their associated land
UC 08 Total taxes paid by owners. (UC 06) + (UC 08)
Consumption of fixed capital
UC 09 Consumption of fixed capital on owner-occupied dwellings at current prices (excluding land)
Net operating surplus
UC 10 Current market value of the stock of owner occupied dwellings at the beginning of the year (including land)
UC 11 Current market value of the stock of owner occupied dwellings at the end of the year (including land)
UC 12 Current market value of the stock of owner occupied dwellings at mid-year (including land) ((UC 10) + (UC 11))/2 or (K6 + K8)
UC 13 Rate of return on owner-occupied dwellings (including land) in percent per annum. UC 14 Net operating surplus. (UC13) * (UC12)/ 100
Expenditure on owner-occupied dwelling services
UC 15 Expenditure on owner-occupied dwelling services. (UC05) + (UC 08) + (UC09) + (UC14)
UC 03: Insurance claims include only the value of the claims for damage to the dwelling itself. As in item UC 02, when data are only available on the total of claims paid on the dwellings themselves and claims paid on their contents, the necessary split between the two can be estimated as being proportional to the relative values of the stock of owner-occupied dwellings on the one hand and the contents of the dwelling on the other. In some countries it is not customary to insure dwellings so both UC 02 and UC 03 will be zero. Even in countries where dwellings are insured, net premiums usually form less than one per cent of intermediate consumption. UC 06: Some countries charge taxes on the imputed value of the dwelling services that individuals derive from owning the dwellings they reside in. Taxes on dwelling services are the value of any such taxes. Any subsidies that owner-occupiers receive to assist them in paying current housing expenses, such as government subsidisation of mortgage payments, should be included here as negative taxes. UC 07: Taxes on dwellings and land are taxes paid on the value of the dwelling units themselves and the land on which they are located. These taxes are often called “property taxes”.
33
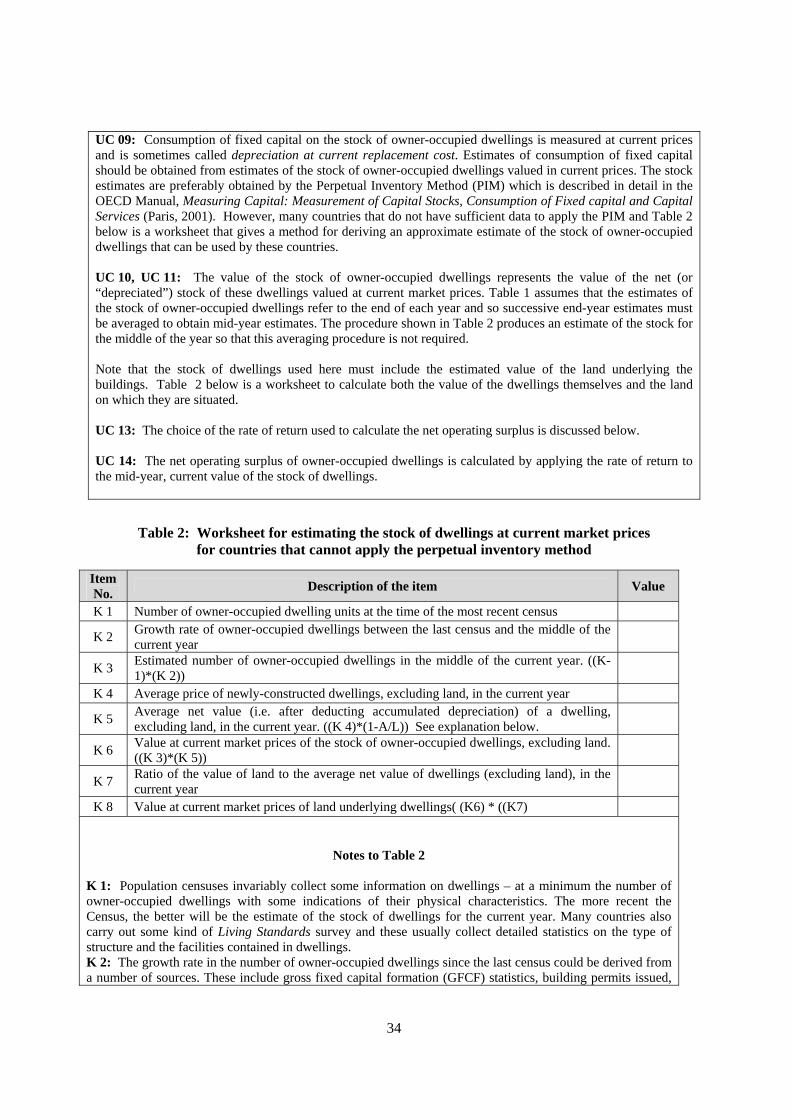
UC 09: Consumption of fixed capital on the stock of owner-occupied dwellings is measured at current prices and is sometimes called depreciation at current replacement cost. Estimates of consumption of fixed capital should be obtained from estimates of the stock of owner-occupied dwellings valued in current prices. The stock estimates are preferably obtained by the Perpetual Inventory Method (PIM) which is described in detail in the OECD Manual, Measuring Capital: Measurement of Capital Stocks, Consumption of Fixed capital and Capital Services (Paris, 2001). However, many countries that do not have sufficient data to apply the PIM and Table 2 below is a worksheet that gives a method for deriving an approximate estimate of the stock of owner-occupied dwellings that can be used by these countries. UC 10, UC 11: The value of the stock of owner-occupied dwellings represents the value of the net (or “depreciated”) stock of these dwellings valued at current market prices. Table 1 assumes that the estimates of the stock of owner-occupied dwellings refer to the end of each year and so successive end-year estimates must be averaged to obtain mid-year estimates. The procedure shown in Table 2 produces an estimate of the stock for the middle of the year so that this averaging procedure is not required. Note that the stock of dwellings used here must include the estimated value of the land underlying the buildings. Table 2 below is a worksheet to calculate both the value of the dwellings themselves and the land on which they are situated. UC 13: The choice of the rate of return used to calculate the net operating surplus is discussed below. UC 14: The net operating surplus of owner-occupied dwellings is calculated by applying the rate of return to the mid-year, current value of the stock of dwellings.
Table 2: Worksheet for estimating the stock of dwellings at current market prices for countries that cannot apply the perpetual inventory method
Item No. Description of the item Value
K 1 Number of owner-occupied dwelling units at the time of the most recent census
K 2 Growth rate of owner-occupied dwellings between the last census and the middle of the current year
K 3 Estimated number of owner-occupied dwellings in the middle of the current year. ((K-1)*(K 2))
K 4 Average price of newly-constructed dwellings, excluding land, in the current year
K 5 Average net value (i.e. after deducting accumulated depreciation) of a dwelling, excluding land, in the current year. ((K 4)*(1-A/L)) See explanation below.
K 6 Value at current market prices of the stock of owner-occupied dwellings, excluding land. ((K 3)*(K 5))
K 7 Ratio of the value of land to the average net value of dwellings (excluding land), in the current year
K 8 Value at current market prices of land underlying dwellings( (K6) * ((K7)
Notes to Table 2
K 1: Population censuses invariably collect some information on dwellings – at a minimum the number of owner-occupied dwellings with some indications of their physical characteristics. The more recent the Census, the better will be the estimate of the stock of dwellings for the current year. Many countries also carry out some kind of Living Standards survey and these usually collect detailed statistics on the type of structure and the facilities contained in dwellings. K 2: The growth rate in the number of owner-occupied dwellings since the last census could be derived from a number of sources. These include gross fixed capital formation (GFCF) statistics, building permits issued,
34

and administrative data on completion and destruction of buildings. In the absence of any information of this kind, it is reasonable to assume that the stock of owner-occupied dwellings grows at the same rate as the population. K 4: Information on prices can be obtained from various sources including real estate agents, property developers, and advertisements in journals and magazines that specialise in sales of dwellings. If these sources are used it will be necessary to adjust the prices downwards by subtracting the value of the land underlying the buildings, since the prices must refer only to the physical structure An alternative is to obtain information on the costs of new buildings from construction companies or from “public works” departments that in some countries build dwellings for government employees. If a cost approach is used, the cost figure will need to be adjusted to market prices by adding the estimated profit margins. The advantage, however, is that the cost estimates will refer only to the physical structure and will exclude the cost of the underlying land. K 5: Since K 4 refers to the price of a newly constructed dwelling, this price needs to be adjusted downwards so that it approximates the price of a dwelling of average age. To do this it is necessary to make an assumption about how the prices of dwellings decline as they grow older. The simplest assumption, and the one recommended here, is to assume that the prices of dwellings decline by the same amount each year reaching a zero price in the last year of their life. With this assumption, the price of a dwelling of average age (P ) will equal the new price (P ) times the ratio of the remaining years that the dwelling of average age average new(A) will continue to exist to the expected service life (L)), that is.
( )( )LAor
LALPP newaverage −⎟⎠⎞
⎜⎝⎛ −
= 1 [1]
Intuitively, one would expect that if the stock of dwellings is constant because the number of new dwellings constructed each year is the same as the number of old dwellings demolished each year, the average age will be half of the average service life – i.e. (P ) will be half of (P ). In the usual case, however, stocks of average newdwellings are not constant. When stocks are growing or falling, the average age of the dwellings in a stock (A) can be written as:
( )
( )∑
∑−
−
+
+= L
i
iL
L
i
iL
r
riA
1
1 [2]
where:
L is the average service life of dwellings, r is the annual rate of growth in the stock of dwellings, and i is the age of dwellings constructed in a given year and takes the values of 1,2,3,…..,L
35
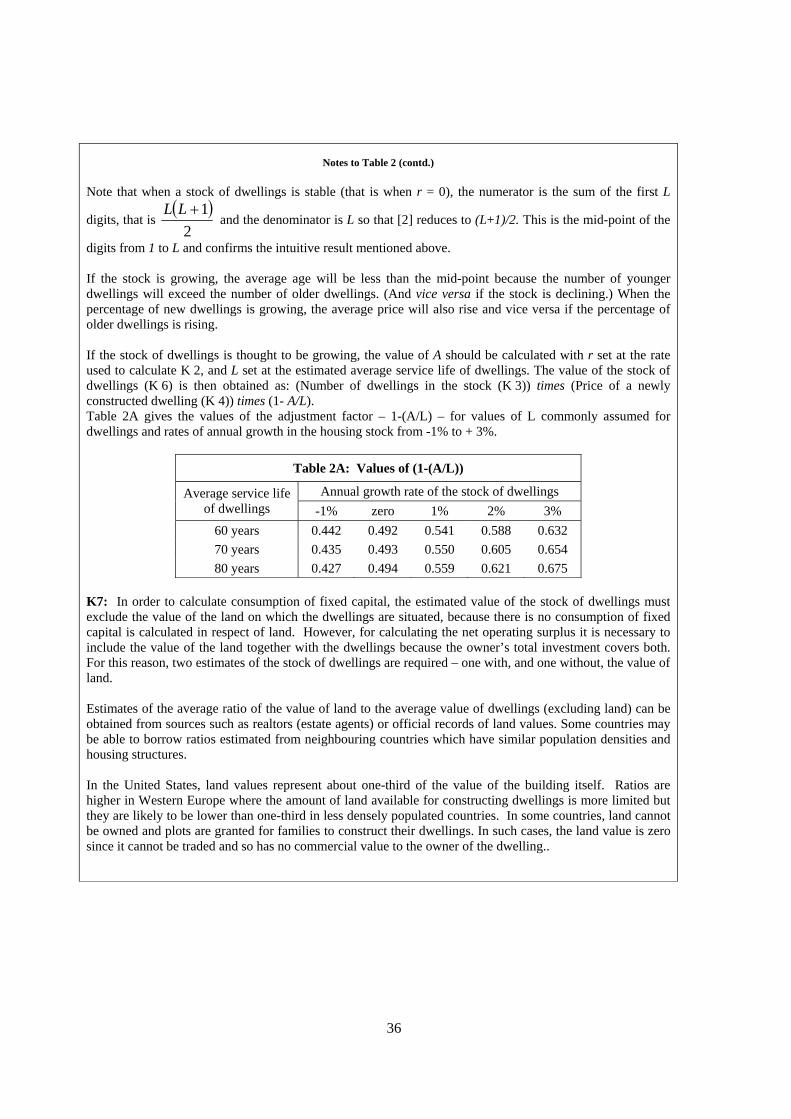
Notes to Table 2 (contd.) Note that when a stock of dwellings is stable (that is when r = 0), the numerator is the sum of the first L
digits, that is ( )
21+LL
and the denominator is L so that [2] reduces to (L+1)/2. This is the mid-point of the
digits from 1 to L and confirms the intuitive result mentioned above. If the stock is growing, the average age will be less than the mid-point because the number of younger dwellings will exceed the number of older dwellings. (And vice versa if the stock is declining.) When the percentage of new dwellings is growing, the average price will also rise and vice versa if the percentage of older dwellings is rising. If the stock of dwellings is thought to be growing, the value of A should be calculated with r set at the rate used to calculate K 2, and L set at the estimated average service life of dwellings. The value of the stock of dwellings (K 6) is then obtained as: (Number of dwellings in the stock (K 3)) times (Price of a newly constructed dwelling (K 4)) times (1- A/L). Table 2A gives the values of the adjustment factor – 1-(A/L) – for values of L commonly assumed for dwellings and rates of annual growth in the housing stock from -1% to + 3%.
Table 2A: Values of (1-(A/L))
Annual growth rate of the stock of dwellings Average service life of dwellings -1% zero 1% 2% 3%
60 years 0.442 0.492 0.541 0.588 0.632 70 years 0.435 0.493 0.550 0.605 0.654 80 years 0.427 0.494 0.559 0.621 0.675
K7: In order to calculate consumption of fixed capital, the estimated value of the stock of dwellings must exclude the value of the land on which the dwellings are situated, because there is no consumption of fixed capital is calculated in respect of land. However, for calculating the net operating surplus it is necessary to include the value of the land together with the dwellings because the owner’s total investment covers both. For this reason, two estimates of the stock of dwellings are required – one with, and one without, the value of land. Estimates of the average ratio of the value of land to the average value of dwellings (excluding land) can be obtained from sources such as realtors (estate agents) or official records of land values. Some countries may be able to borrow ratios estimated from neighbouring countries which have similar population densities and housing structures. In the United States, land values represent about one-third of the value of the building itself. Ratios are higher in Western Europe where the amount of land available for constructing dwellings is more limited but they are likely to be lower than one-third in less densely populated countries. In some countries, land cannot be owned and plots are granted for families to construct their dwellings. In such cases, the land value is zero since it cannot be traded and so has no commercial value to the owner of the dwelling..
36
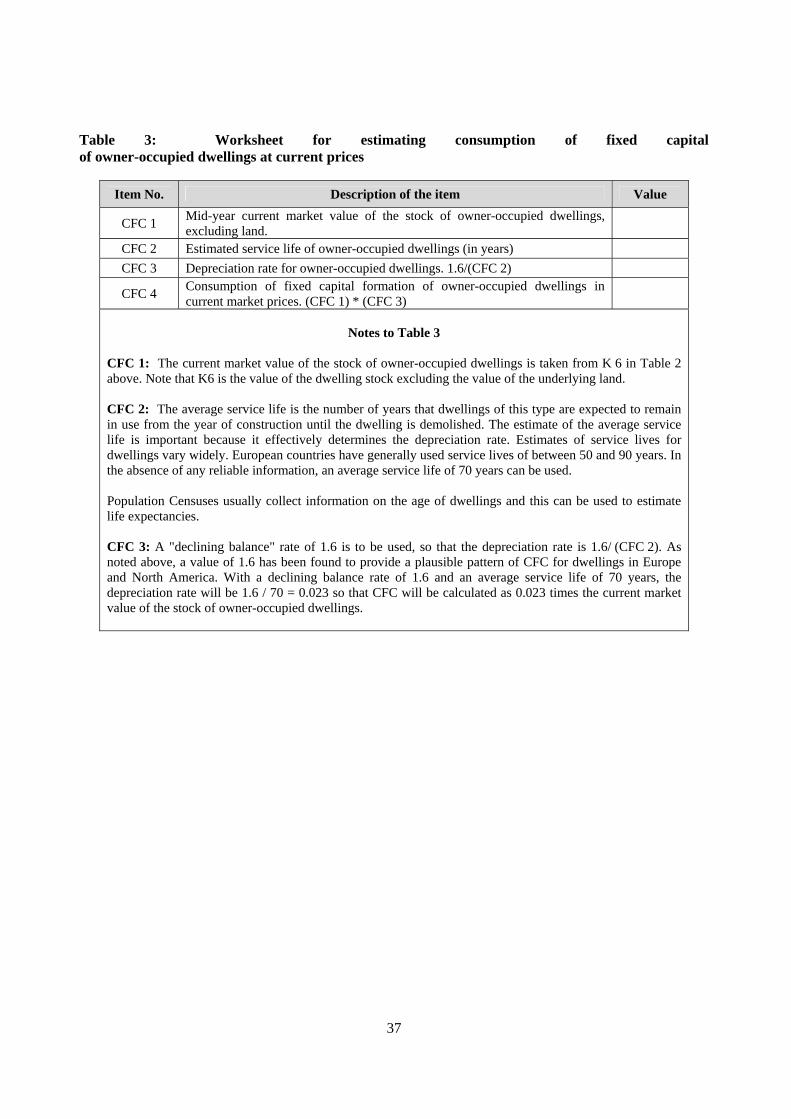
Table 3: Worksheet for estimating consumption of fixed capital of owner-occupied dwellings at current prices
Item No. Description of the item Value
CFC 1 Mid-year current market value of the stock of owner-occupied dwellings, excluding land.
CFC 2 Estimated service life of owner-occupied dwellings (in years) CFC 3 Depreciation rate for owner-occupied dwellings. 1.6/(CFC 2)
CFC 4 Consumption of fixed capital formation of owner-occupied dwellings in current market prices. (CFC 1) * (CFC 3)
Notes to Table 3
CFC 1: The current market value of the stock of owner-occupied dwellings is taken from K 6 in Table 2 above. Note that K6 is the value of the dwelling stock excluding the value of the underlying land. CFC 2: The average service life is the number of years that dwellings of this type are expected to remain in use from the year of construction until the dwelling is demolished. The estimate of the average service life is important because it effectively determines the depreciation rate. Estimates of service lives for dwellings vary widely. European countries have generally used service lives of between 50 and 90 years. In the absence of any reliable information, an average service life of 70 years can be used. Population Censuses usually collect information on the age of dwellings and this can be used to estimate life expectancies. CFC 3: A "declining balance" rate of 1.6 is to be used, so that the depreciation rate is 1.6/ (CFC 2). As noted above, a value of 1.6 has been found to provide a plausible pattern of CFC for dwellings in Europe and North America. With a declining balance rate of 1.6 and an average service life of 70 years, the depreciation rate will be 1.6 / 70 = 0.023 so that CFC will be calculated as 0.023 times the current market value of the stock of owner-occupied dwellings.
37