Measuring Ethnic Voting: Does Proportional …jdh39/Site/Research_files/ethnic_voting.pdf ·...
38
Measuring ethnic voting: Does proportional representation politicize ethnicity? * John D. Huber † March 24, 2010 Abstract This paper develops a measure that can be used to compare ethnic voting levels across coun- tries. The measure examines the relationship between ethnicity and vote choice: as it becomes easier to predict voting behavior in a country by knowing only voters’ ethnicity, the ethnic voting measure increases. The paper then uses data from 71 surveys to estimate ethnic voting levels in 45 countries, and to examine the validity of the widely held assumption that propor- tional electoral laws lead to higher levels of ethnic voting. The central finding is that all else equal, proportional representation leads to less rather than more politicization of ethnicity. By examining patterns of vote support across ethnic groups, the paper suggests explanations for why PR often leads to less ethnic voting than is generally assumed. * I am grateful for research assistance from Tom Ogorzalek, for research support from the National Science Foun- dation, and for helpful comments from Kate Baldwin and Dawn Brancati. I am also grateful to the Russell Sage Foundation, where I was a visiting research scholar while writing this paper. † Professor, Department of Political Science, Columbia University, and Visiting Scholar, Russell Sage Foundation, New York.
Transcript of Measuring Ethnic Voting: Does Proportional …jdh39/Site/Research_files/ethnic_voting.pdf ·...
Measuring ethnic voting:Does proportional representation politicize ethnicity?!
John D. Huber†
March 24, 2010
Abstract
This paper develops a measure that can be used to compare ethnic voting levels across coun-tries. The measure examines the relationship between ethnicity and vote choice: as it becomeseasier to predict voting behavior in a country by knowing only voters’ ethnicity, the ethnicvoting measure increases. The paper then uses data from 71 surveys to estimate ethnic votinglevels in 45 countries, and to examine the validity of the widely held assumption that propor-tional electoral laws lead to higher levels of ethnic voting. The central finding is that all elseequal, proportional representation leads to less rather than more politicization of ethnicity. Byexamining patterns of vote support across ethnic groups, the paper suggests explanations forwhy PR often leads to less ethnic voting than is generally assumed.
!I am grateful for research assistance from Tom Ogorzalek, for research support from the National Science Foun-dation, and for helpful comments from Kate Baldwin and Dawn Brancati. I am also grateful to the Russell SageFoundation, where I was a visiting research scholar while writing this paper.
†Professor, Department of Political Science, Columbia University, and Visiting Scholar, Russell Sage Foundation,New York.
1 Introduction
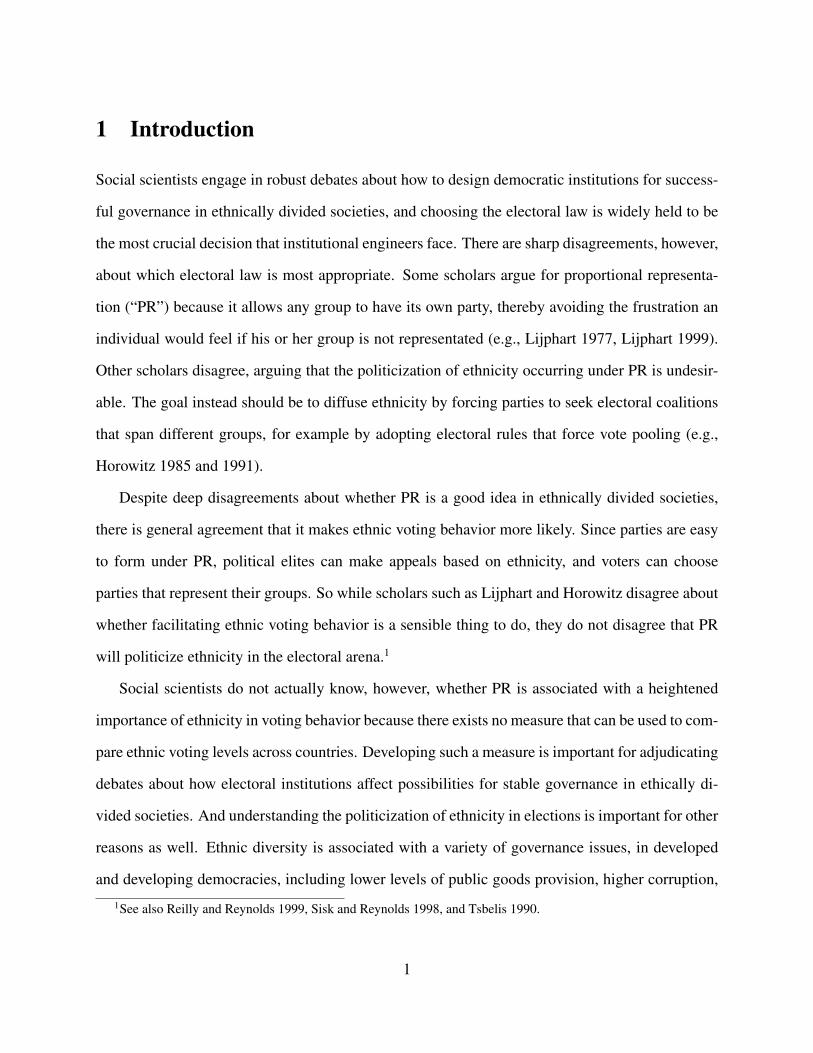
Social scientists engage in robust debates about how to design democratic institutions for success-
ful governance in ethnically divided societies, and choosing the electoral law is widely held to be
the most crucial decision that institutional engineers face. There are sharp disagreements, however,
about which electoral law is most appropriate. Some scholars argue for proportional representa-
tion (“PR”) because it allows any group to have its own party, thereby avoiding the frustration an
individual would feel if his or her group is not representated (e.g., Lijphart 1977, Lijphart 1999).
Other scholars disagree, arguing that the politicization of ethnicity occurring under PR is undesir-
able. The goal instead should be to diffuse ethnicity by forcing parties to seek electoral coalitions
that span different groups, for example by adopting electoral rules that force vote pooling (e.g.,
Horowitz 1985 and 1991).
Despite deep disagreements about whether PR is a good idea in ethnically divided societies,
there is general agreement that it makes ethnic voting behavior more likely. Since parties are easy
to form under PR, political elites can make appeals based on ethnicity, and voters can choose
parties that represent their groups. So while scholars such as Lijphart and Horowitz disagree about
whether facilitating ethnic voting behavior is a sensible thing to do, they do not disagree that PR
will politicize ethnicity in the electoral arena.1
Social scientists do not actually know, however, whether PR is associated with a heightened
importance of ethnicity in voting behavior because there exists no measure that can be used to com-
pare ethnic voting levels across countries. Developing such a measure is important for adjudicating
debates about how electoral institutions affect possibilities for stable governance in ethically di-
vided societies. And understanding the politicization of ethnicity in elections is important for other
reasons as well. Ethnic diversity is associated with a variety of governance issues, in developed
and developing democracies, including lower levels of public goods provision, higher corruption,1See also Reilly and Reynolds 1999, Sisk and Reynolds 1998, and Tsbelis 1990.
1
and slower economic growth. Understanding the factors leading to the politicization of ethnic-
ity can therefore shed light on the circumstances under which ethnic diversity causes governance
problems in democracies.
This paper does not seek to adjudicate disputes about whether PR is a good choice in ethni-
cally divided societies. Instead, the goal is to understand the degree to which ethnicity becomes
politicized under different electoral laws, which seems a crucial first step toward recommending
particular institutional arrangements. Specifically, the paper has two objectives. The first is to
develop a measure of ethnic voting. There are a variety of ways one could conceptualize ethnic
voting, including levels of support for ethnic parties, the incidence of ethnic appeals by parties,
the propensity of ethnic group members to vote in the same way, and the propensity of voters to
support candidates from their own group, to name several. The measure developed here does not
focus on ethnic parties, candidates, or appeals. Instead, it focuses on the relationship between eth-
nicity and vote choice. As it becomes easier to predict voting behavior in a country by knowing
only voters’ ethnicity, the ethnic voting measure increases.
Focusing on the relationship between ethnicity and voting behavior is a sensible place to start
in efforts to measure ethnic voting. If ethnic appeals are strong, or ethnic parties are present, but
voters do not let their ethnicity guide their vote, it is doubtful that the politicization of ethnicity in
the electoral arena exists to any meaningful extent. And even if we do not observe explicit ethnic
appeals by ethnic parties, it is hard to deny the politicization of ethnicity if an individual’s vote is
accurately predicted by the individual’s ethnicity.
While it is possible to measure ethnic voting at the group or party level, the focus here is
on measuring ethnic voting at the country level. Without a country-level measure, it is difficult
to study empirically the relationship between system-level factors – like the electoral law – and
the politicization of ethnicity. And by focusing on a country-level measure, it is possible to take
account of group size in measuring the politicization of ethnicity. We should expect, for example,
that if everyone from a particular ethnic group supported the same party (and no one outside this
2
group supported the party), then the degree to which this politicization of ethnicity is a problem
in society should depend on the size of the group. As a small group becomes larger, the overall
politicization of ethnicity in electoral politics should be said to increase. Holding all else equal,
the measure proposed here increases as the size of groups becomes more equal. The theoretical
range of the measure is from 0 (which occurs when the proportion of voters supporting each party
is the same across groups) to 1 (which occurs when each group is represented by one party, each
group’s party receives no support from outside the party, and all groups are of equal size).
The second goal of the paper is to quantify the relationship between electoral laws and ethnic
voting. To this end, the paper uses 71 surveys from 45 countries to identify the ethnicity and
party preference of respondents, and thereby to calculate ethnic voting scores. The empirical
analysis shows that the central assumption about ethnic voting that undergirds arguments by both
proponents and critics of PR is not supported by the data. In PR systems, members of ethnic groups
are less cohesive in their voting patterns than is typically assumed, and in majoritarian systems,
ethnic groups often receive representation by voting cohesively for larger catch-all parties, or, when
groups are geographically concentrated, by supporting parties that receive minimal support outside
their group.
The paper is organized as follows. The next section describes the ethnic voting measure. Sec-
tion 3 then describes the data used to measure ethnic voting, and presents information on ethnic
voting levels in 45 countries. The empirical analysis describing the relationship between electoral
laws and ethnic voting follows in section 4. The analysis also explores the relationship between
other factors and ethnic voting, including the level of political and economic development, the ge-
ographic isolation of groups, and political decentralization. The paper then discusses why it should
be unsurprising that the politicization of ethnicity is stronger in majoritarian than in PR systems.
3
2 A measure of ethnic voting
The measure of ethnic voting described here conveys how well one can predict which party a
randomly-chosen individual will support by simply knowing the individual’s “ethnic” group (where
“ethnic” refers to any meaningful descent group, see below). In a study of a specific country, one
could measure ethnic voting by including indicator variables for ethnicity in a standard regression
framework, such as a multinomial logit. In this approach, however, the number of ethnic indicator
coefficients would equal the number of groups times the number of parties, and there is no obvious
way to aggregate such coefficients into an overall score of ethnic voting by a group, or to aggre-
gate group ethnic voting scores into a country-level measure. And even if such problems could
be overcome, it would be highly dubious to compare such scores across countries with different
numbers of groups or parties. The challenge is to develop a measure of ethnic voting at the national
level that is comparable across political systems that have different numbers of groups and levels
of ethnic diversity.
The measure described here is based only on information about the level of support that each
group in a country provides to each party. Consider the example at the top of Table 1, which
examines voting patterns by group in two countries that are relatively simple to depict because
they have low levels of ethnic diversity, Hungary and Finland.2 In Hungary, the Roma constitute
the main minority group. The data in the table, which shows the proportion of the vote by each
group for each party, indicates that the Hungarians and Roma distribute their vote in roughly the
same way. The Roma are somewhat less supportive than the Hungarians of the Socialists (.36 vs.
.47), and the Hungarians are somewhat less supportive of Fidesz than are the Roma (.41 vs .54), but
the differences are relatively small. In Finland, the two main groups are the Finns and Swedes, and
the Finns distribute their vote across all parties, whereas 83 percent of Swedes support the Swedish
People’s Party (SPP). Thus, for each party (that is non-trivial in size), the difference between the2The data in the table come from the Comparative Study of Electoral Systems survey.
4
proportion of Finns that support the party and the proportion of Swedes that support the party is
quite large. The objective is to use information like that in Table 1 to create a measure of ethnic
voting by country. The measure should obviously have a higher score in Finland than Sweden
because there is a tighter link between group and vote in Finland.
The measure proposed here has three properties that it seems reasonable to expect from a
measure of ethnic voting. First, to make possible meaningful comparisons across countries, the
measure should have a theoretical maximum and minimum that is independent of the number of
ethnic groups. The measure developed here will range from 0 to 1.
Second, the theoretical minimum should be reached when the support for each party is the
same across all groups. Hungary approaches this, and ethnic voting there should be considered
to be 0 if the Roma and Hungarians had exactly the same proportions of respondents supporting
each party. This implies that the measure should decrease if the distribution of voting support by
a group becomes more similar to the distribution of voting support in the population as a whole.
Ethnic voting in Finland would therefore decrease if there were marginal shifts by Swedes away
from the SPP and toward any other party (because the proportion of Swedes who support any other
party is less than the proportion of the total population that supports those parties), or if there were
marginal shifts by the Finns toward the SPP.
Third, the theoretical maximum of 1 should be reached when two conditions are satisfied: (a)
each group votes for its own party (and no other group supports that party) and (b) each group is the
same size. Condition (a) ensures that simply knowing an individual’s group will reveal the party
that the individual supports. It also implies that the ethnic voting measure will take higher values if
a particular group supports one party (that receives no support outside the group) than if that group
splits its support between two parties (that receive no support from outside the group). Condition
(b) represents a sensible way to think about how group size (or ethnic fractionalization) should
affect ethnic voting measures. In a country with two groups, even if the groups support different
parties, it would be hard to argue that the country’s level of ethnic voting is high if one group is
5
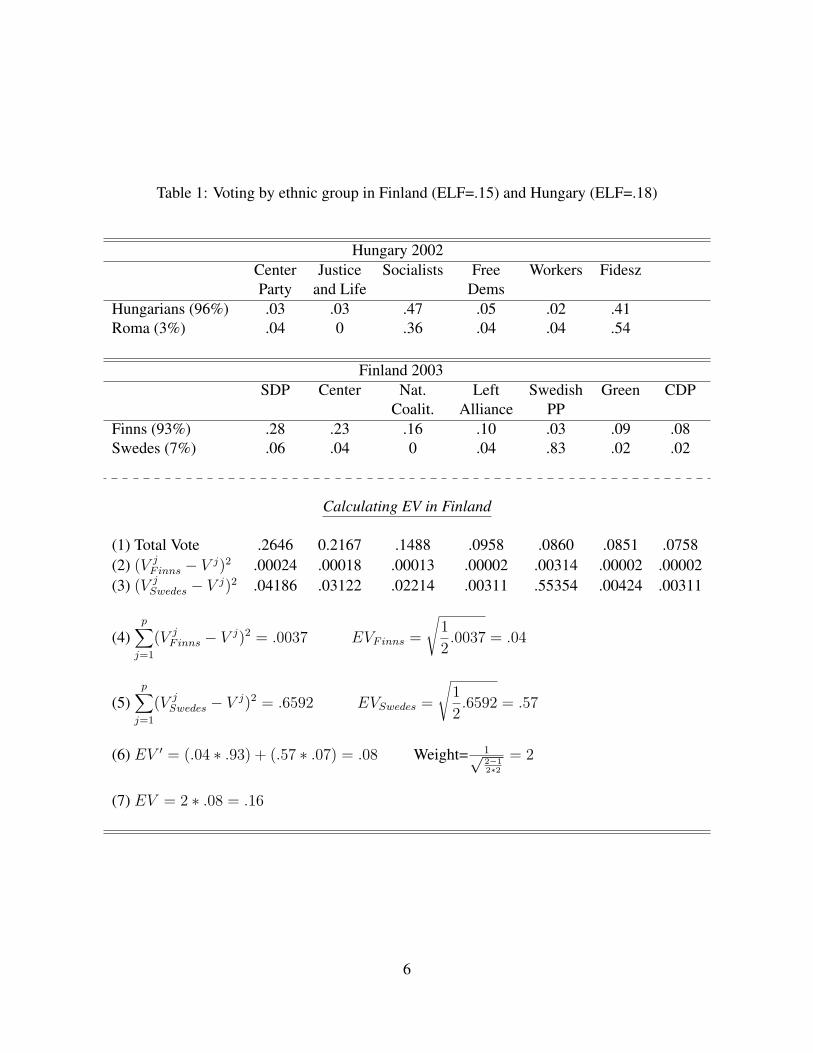
Table 1: Voting by ethnic group in Finland (ELF=.15) and Hungary (ELF=.18)
Hungary 2002Center Justice Socialists Free Workers FideszParty and Life Dems
Hungarians (96%) .03 .03 .47 .05 .02 .41Roma (3%) .04 0 .36 .04 .04 .54
Finland 2003SDP Center Nat. Left Swedish Green CDP
Coalit. Alliance PPFinns (93%) .28 .23 .16 .10 .03 .09 .08Swedes (7%) .06 .04 0 .04 .83 .02 .02
Calculating EV in Finland
(1) Total Vote .2646 0.2167 .1488 .0958 .0860 .0851 .0758(2) (V j
F inns " V j)2 .00024 .00018 .00013 .00002 .00314 .00002 .00002(3) (V j
Swedes " V j)2 .04186 .03122 .02214 .00311 .55354 .00424 .00311
(4)p!
j=1
(V jF inns " V j)2 = .0037 EVFinns =
"1
2.0037 = .04
(5)p!
j=1
(V jSwedes " V j)2 = .6592 EVSwedes =
"1
2.6592 = .57
(6) EV ! = (.04 ! .93) + (.57 ! .07) = .08 Weight= 1#2!12"2
= 2
(7) EV = 2 ! .08 = .16
6
either extremely large (because the group is electorally isolated from a trivially small group) or
extremely small (because the group is itself trivially small). But as the two groups approach each
other in size, the aggregate level of ethnic voting should increase, reaching its maximum when
the two groups are exactly equal in size. In Finland, for example, if we hold the proportion of
votes across parties constant for each group, then the ethnic voting measure should increase if the
Swedes increased in group size (until, of course, the Swedes became a majority). In general, the
measure should reveal maximum ethnic voting when, for any number of groups, the groups are of
equal size, and each group supports a party that receives no support from outside the group.
It is possible to create a measure of ethnic voting satisfying these three properties by drawing
on indices of proportionality that have been used to study electoral systems. These indices measure
the relationships between seats and votes in a party system, and perfect proportionality is achieved
when the percent of seats that each party receives is the same as the percent of votes that the party
receives. A number of proportionality indices exist but the Gallagher index of disproportionality
(Gallagher 1991) has become the most widely accepted in political science.3 The Gallagher index
is given by:
GI =
#$$%1
2
n!
i=1
(Vi " Si)2, (1)
where Vi is the vote share for party i and Si is the seat share for party i. The index takes the value
0 if for all parties, the vote share exactly equals the seat share. The index moves toward 1 as the
disjunction between seats and votes increases. In a two party system, for example, if one party
received no votes and all the seats, and the other party received all the votes and no seats, GI
would equal 1.
The disproportionality index can be used to describe how vote support for each party by a par-
ticular group compares to vote support for each party in the population as a whole. If the proportion3See Taagepera and Grofman (2003) for a useful analysis of why it makes sense to embrace this index.
7
of a group that supports each party is very similar to the proportion of the entire population that
supports each group, then disproportionality would be low. The disproportionality scores for each
group can then be aggregated to create a country-level measure of ethnic voting.
For the group-level component of the aggregate measure, let
EVg =
#$$%1
2
p!
j=1
(V jg " V j)2, (2)
where V jg is the proportion of individuals in group g who support party j, V j is the proportion of
individuals in society that support j, and p is the number of parties. EVg therefore is a variant of
GI , but instead of calculating differences between votes and seats for all parties, it calculates, for a
given group and for each party, the difference between in-group support for the party and support
for that party in the entire population of voters (V jg " V j).
To create a measure of ethnic voting in a country, one possibility would be to sum each EVg,
weighting by the size of each group. Let EV ! =G!
g=1
(EVg ! sg), where G is the total number of
groups in the country and sg is the proportion of group g in the country’s voting population. EV !
is not, however, an adequate measure of ethnic voting because its theoretical maximum can never
equal 1, and because it is sensitive to the number of groups. The hypothetical maximum should
occur when each group is the same size and each group supports a different party than other groups.
With two groups, EV ! has a maximum of .5 (where there are two equal sized groups, and each
group supports one party that is not supported by the other group). If there are three equal-sized
groups, each supporting different parties, EV ! = 13 .
One can address this issue by weighting EV ! by a function of the number of groups. To solve
for this function, note that if all groups are of equal size and each group supports a different party
than other groups, then for each group,
EVg =
#$$$%1
2
&
'(1" 1
G
)2
+G"1!
j=1
(0" 1
G
)2*
+
8
=
"G" 1
2G.
Thus, in this case of equal-sized groups, (EVg ! sg) =,
1G !
-G"12G
., and
G!
g=1
(EVg ! sg) =
"G" 1
2G.
Consequently, if we weight EV ! by the reciprocal of-
G"12G , the measure of ethnic voting will equal
1 when ethnic voting is at its maximum, independent of the number of groups:
EV =1
-G"12G
G!
g=1
(EVg ! sg) . (3)
By construction of the weight, EV takes the value 1 when groups are of equal size and each
group supports its own party. Since EV is a function of (V jg " V j), it will equal 0 for any number
and size of groups if the proportion of each group that supports each party is the same. Basing
EV on a proportionality score also ensures that as vote proportions become more equal across
groups, EV will decline. And since each EVg is based on the comparison of vote proportions by
the group with vote proportion in the population, as the size of groups becomes more equal, EV
will increase.
The bottom of Table 1 uses Finland to walk through an example of how EV is computed using
real data. The first step is to calculate the (squared) difference between the vote in the group for
each party and the vote in the population for each party. Line (1) provides the total support for
each party, and line (2) depicts the squared difference between the proportion of Finns supporting
a party and the population proportion supporting this party (e.g., the entry in line 2 under SDP
is (.28 " .2646)2 = .00024). Line (3) depicts the same squared differences for the Swedes. To
calculate EVFinns, first sum the entries in line 2, which yields .0037 (see line (4)). Dividing this
number by 2 and taking the square root yields EVFinns = .04 (also line (4)). Line (5) depicts the
same calculation for the Swedes. To calculate EV , we must calculate EV ! (which is .08, as shown
on line (6)), and the weight (which is 2 when the number of groups is 2, also show on line (6)).
9
0.2 0.4 0.6 0.8 1.0
0.2
0.4
0.6
0.8
1.0
!
"#$%!&'!()&*+!,!
-.!
()&*+/!,!012!3!4&56!/*++&)5!&71!+0)58!
()&*+!,!93:!/*++&)5!'&)!;0)58!,<!=3!9=>:!
()&*+!,!93:!/*++&)5!'&)!;0)58!,<!=?!9=@:!
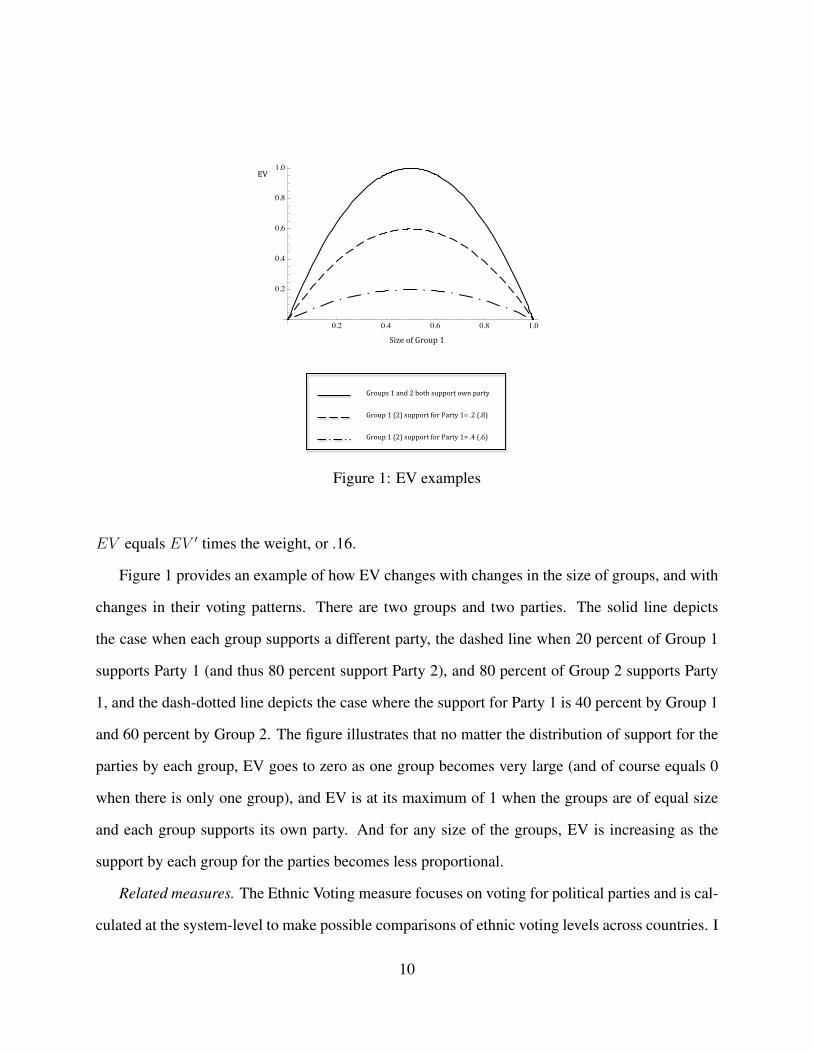
Figure 1: EV examples
EV equals EV ! times the weight, or .16.
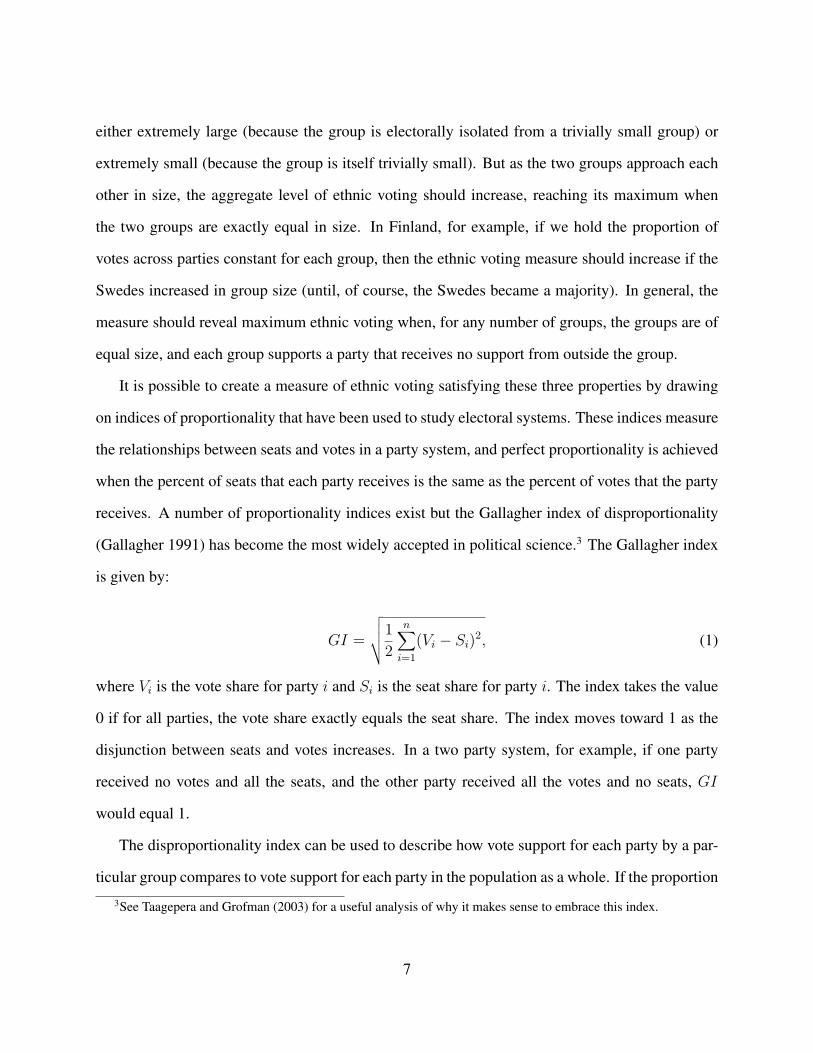
Figure 1 provides an example of how EV changes with changes in the size of groups, and with
changes in their voting patterns. There are two groups and two parties. The solid line depicts
the case when each group supports a different party, the dashed line when 20 percent of Group 1
supports Party 1 (and thus 80 percent support Party 2), and 80 percent of Group 2 supports Party
1, and the dash-dotted line depicts the case where the support for Party 1 is 40 percent by Group 1
and 60 percent by Group 2. The figure illustrates that no matter the distribution of support for the
parties by each group, EV goes to zero as one group becomes very large (and of course equals 0
when there is only one group), and EV is at its maximum of 1 when the groups are of equal size
and each group supports its own party. And for any size of the groups, EV is increasing as the
support by each group for the parties becomes less proportional.
Related measures. The Ethnic Voting measure focuses on voting for political parties and is cal-
culated at the system-level to make possible comparisons of ethnic voting levels across countries. I
10
am aware of only one other measure that seeks to create a party-based measure that can be used for
cross-national research – Birnir’s (2007) measure of volatility in the electoral support for political
parties. The measure is based on the assumption that the aggregate level of electoral volatility will
be low when ethnicity is a driving force in voting behavior. The variable’s main advantage is that
it can be measured across a wide range of countries. But its main weakness is that it does not
actually measure ethnic voting. While it is plausible that ethnic voting will be high when electoral
volatility is low, there are many factors other than ethnic voting that affect electoral volatility. It
is therefore not surprising that for the 23 observations that exist both in the Birnir data set and the
data set presented below, the correlation between Ethnic Voting and the measure of volatility is
very weak: it is in the expected negative direction, but is only -.12.4 Thus, the validity of volatility
as a measure of ethnic voting is unclear.
Brancati (2008 and 2009) also offers a measure that could be relevant to cross-national studies
of ethnic voting. She focuses on the level of support in a country for regional parties, which
are often ethnically based. But Brancati is not specifically interested in ethnic voting, and she
emphasizes that not all regional parties are ethnic (e.g., the Basque National Party in Spain) and
that not all ethnic parties are regional (e.g., the BJP in India). It is not surprising, then, that
the ethnic voting variable presented below is very weakly correlated with Brancati’s measure of
regional party support.5
It is important to recognize, however, that there are other ways to conceptualize ethnic voting
besides the focus here on patterns of support across groups for political parties. Chandra’s (2004)
analysis of India also focuses on political parties, but focuses on “ethnic parties” – parties that
make an explicit appeal to specific ethnic groups and that advocate excluding other groups (see
also Chandra 2005). The ethnic voting measure proposed here does not take account of the nature4The correlation is based on the measure of volatility that excludes independents. I am grateful to Johanna Birnir
for sharing her data.5The correlation is -.06 using Brancati’s measure of voting support for regional parties. There are only 19 obser-
vations that are common to both data sets. I am grateful to Dawn Brancati for sharing her data.
11
of appeals, and could thus take high values even without concerted efforts by party elites to to make
ethnic appeals. The implications of party systems where voters sort themselves by ethnic group
even when elites do not make explicit ethnic appeals might be quite different than the implications
of party systems where explicit ethnic appeals motivate group sorting.
Posner (2005, see also 2004a), in his study of which ethnic divisions become politically salient
in Zambia, does not focus on the role of parties. Instead, he considers the extent to which voters
support candidates from their own tribe (in single-party elections) or their own language group
(in multiparty ones). His study reminds us that the politicization of ethnicity can be high even in
one-party states if this politicization operates through candidate choice rather than party choice.
Although the measures used by Posner and Chandra would be difficult to calculate in large-
n cross-national research, their studies raise important conceptual issues that one should bear in
mind when drawing conclusions about the ethnic voting scores presented here. There may be
cases, for example, where the measure proposed here understates ethnic voting behavior because
such behavior operates through candidates rather than parties. But in competitive democracies,
political parties are typically the main vehicle through which ethnic representation occurs, and the
politicization of ethnicity can be approximated using voting patterns –without the difficult and at
times subjective process of classifying the extent to which parties make explicit ethnic appeals, and
without coding parties themselves as “ethnic” or not. Much can therefore be gained by utilizing a
measure of ethnic voting that is based on voting support for parties across groups, and that can be
used across a range of democratic systems.
3 Ethnic group voting behavior in 45 countries
Implementing the measure of ethnic voting requires the identification of individual ethnicity and
party preference. To this end, this study draws on three existing cross-national surveys – the World
Values Survey (“WVS”, wave 4), the Afrobarometer (rounds 2 and 3) and the Comparative Study
12
of Electoral Systems (“CSES”, all available waves). These surveys contain questions that make it
possible to categorize respondents according to their ‘ethnic’ group, as well as their vote intention.
And including surveys from all three studies ensures that the data set includes democratic systems
that vary in their ethnic diversity, political and economic development, and electoral institutions.
Considerable research now accepts that ethnicity is not primordial, but rather is “constructed”
– it is endogenous to the social context, can change, and is often multidimensional (e.g., Horowitz
1985, Laitin 1998, Chandra 2004 and Posner 2005). Group identities in some contexts are very
salient politically, while the same group identities may not be salient in other contexts (Posner
2005). The challenge therefore is to identify individual group attachments in a way that makes
sense in the particular context in which the individual finds him or herself. This inevitably entails
a degree of subjectivity, but without a willingness to engage in such subjectivity, it is impossible to
conceive of a broadly cross-national empirical study of ethnic voting.
To identify the relevant ethnic categories in the countries for which surveys exist, this study
follows the ethnic categories identified in Fearon (2003). Fearon takes seriously the constructivist
critique of primordialism, and the problems it creates for creating a clear list of groups in a country.
But he also underlines that much research requires such a list, and argues that any list of groups in a
country should be based on the “the idea that members and non-members recognize the distinction
[on which group identity is based] and anticipate that significant actions are or could be conditioned
on it” (p. 198). He lists seven features that a “prototypical” ethnic group should have, based in
large part on whether groups can be understood as “descent groups” (to which individuals are born
into), and whether groups are locally viewed as socially or politically consequential.6 Groups are6The seven prototypical features are: “1. Membership in the group is reckoned primarily by descent by both
members and non-members. 2. Members are conscious of group membership and view it as normatively and psy-chologically important to them. 3. Members share some distinguishing cultural features, such as common language,religion, and customs. 4. These cultural features are held to be valuable by a large majority of members of the group.5. The group has a homeland, or at least ‘remembers’ one. 6. The group has a shared and collectively representedhistory as a group. Further, this history is not wholly manufactured, but has some basis in fact. 7. The group ispotentially “stand alone” in a conceptual sense that is, it is not a caste or caste-like group (e.g., European nobility orcommoners)” (p. 201).
13
therefore based on range of characteristics, including religion, ethnicity, language, tribe and race.
While it is possible to debate Fearon’s list of groups in particular countries, Fearon (2003) is an
attractive source of information about groups because of the care he takes in using reasonable
criteria consistently across a wide range of countries. The measure proposed here does not, of
course, depend on any specific definition of groups, and it would be possible to substitute another
list in place of Fearon’s to calculate ethnic voting scores.
Fearon’s list of groups is of little use for purposes here if the surveys do not make it possible to
identify the relevant groups. The rule followed here is to include surveys in the data set only if the
percentage of the population (per Fearon’s data) that cannot be assigned to any of Fearon’s groups
is less than 10 percent. For example, if the ”purple” group is one of Fearon’s groups and this group
cannot be identified in a survey, then the survey is discarded if the purple group has more than
10 percent of the population in Fearon’s data. If there are multiple Fearon groups that cannot be
identified, then the survey is excluded if these groups together represent more than 10 percent of
the population. This rule assures that surveys are included in the study only if the group data from
them can be used to reasonably approximate the groups identified by Fearon.
Since the focus here is on voting, surveys are included only from countries that are at least
nominally democratic (Polity2>0). This low bar for inclusion makes it possible to explore whether
the quality of democratic institutions affects ethnic voting. This Polity2 inclusion rule, along with
the “10 percent” selection rule for keeping surveys based on Fearon groups, results in the use of 71
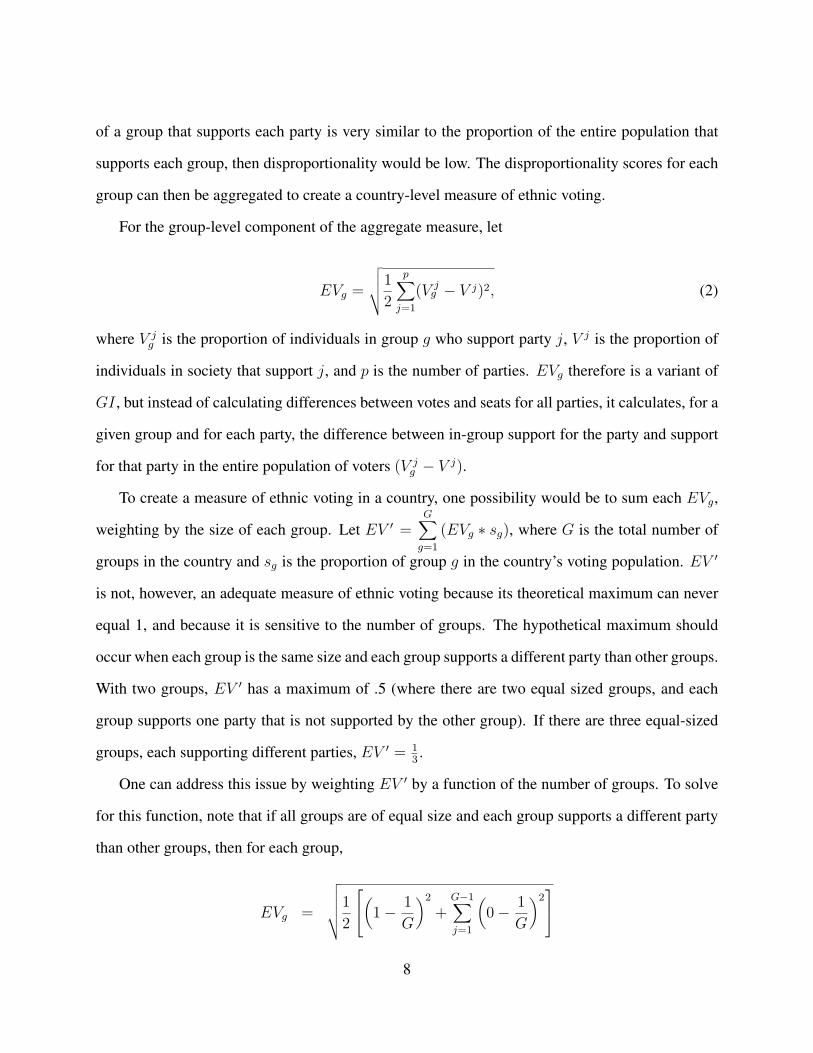
surveys from 45 countries. Importantly, one can be confident that the surveys adequately represent
the groups in the Fearon data because the surveys generate ethnic diversity scores that mirror quite
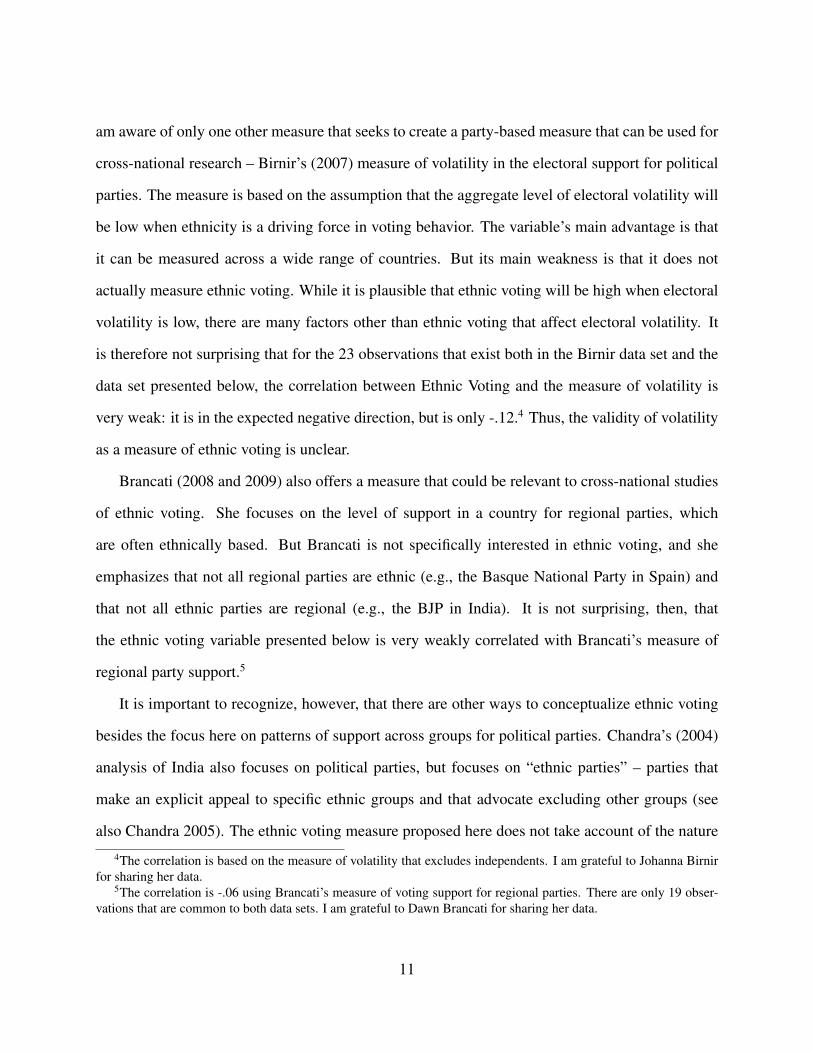
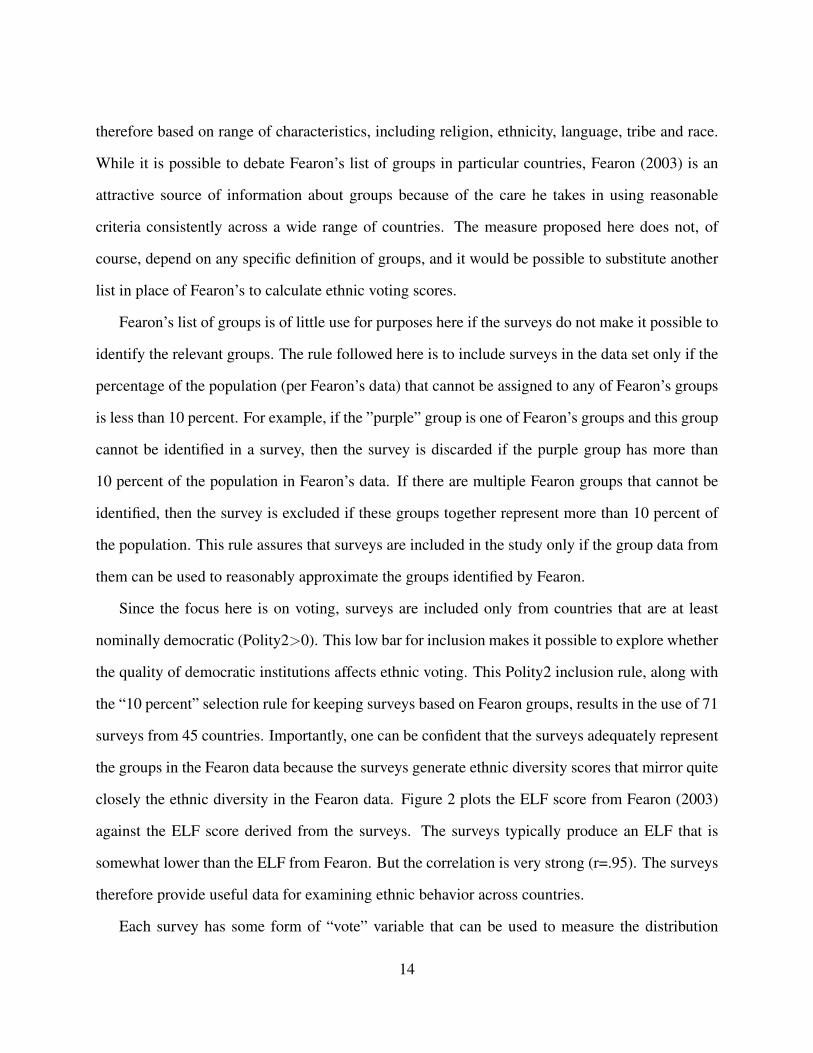
closely the ethnic diversity in the Fearon data. Figure 2 plots the ELF score from Fearon (2003)
against the ELF score derived from the surveys. The surveys typically produce an ELF that is
somewhat lower than the ELF from Fearon. But the correlation is very strong (r=.95). The surveys
therefore provide useful data for examining ethnic behavior across countries.
Each survey has some form of “vote” variable that can be used to measure the distribution
14
AUS96AUS99AUS04
BGD99
BEL99
BWA03BWA05
BRA99 BRA02
BGR01
CAN97CAN99
CZE96
BEN05
DOM99
EST99
FIN03
FRA02
GEO99
DEU99
HUN02
IND99
IRL99
KEN03KEN05
LVA99
LTU97
MDG05
MWI03 MWI05
MLI02MLI05
MEX97MEX00MEX03
MDA99
MOZ02 MOZ05
NAM03NAM06
NLD99
NZL96 NZL99NZL02
NGA03NGA05
ROU96
RUS99RUS00
SEN02SEN05
SVN96
ZAF02ZAF06
ESP96ESP99ESP00ESP04
CHE99
UKR98
MKD99
TZA05
USA96USA99USA04
URY99
VEN99
ZMB03ZMB05
0.2
.4.6
.81
EL
F (
Fe
aro
n d
ata
)
0 .2 .4 .6 .8 1
ELF (surveys)
Figure 2: ELF using Fearon and survey data
15
of support for each party. The CSES is a post-election survey, so it contains a question asking
individuals which party they supported in the last election. I use the vote for a lower house election
if it exists, and use the presidential election vote otherwise. The Afrobarometer (Round 3) and
the WVS surveys, which are not conducted post-election, ask what party the respondent would
support if there were an election tomorrow. The Afrobarometer (Round 2) asks the respondent
not about vote intent, but rather whether the respondent feels close to a particular political party.
I use the these various survey instruments to measure the proportion of respondents in each group
that support each party, as was done in Table 1 for Sweden and Hungary. The differing nature
of the wording of the “vote” questions – and of the timing of the surveys vis-a-vis elections –
could create biases. Voters may not actually pull the level for the party they say they feel closest
to, for example, or they may be more inclined to say they support (or oppose) the incumbent
between elections than right after the election. But since it is possible to explore the incidence of
systematic bias by controlling for survey type in the empirical analysis, this study uses the range of
different surveys in order to bring as much data as possible to bear on the question of how electoral
institutions affect ethnic voting.
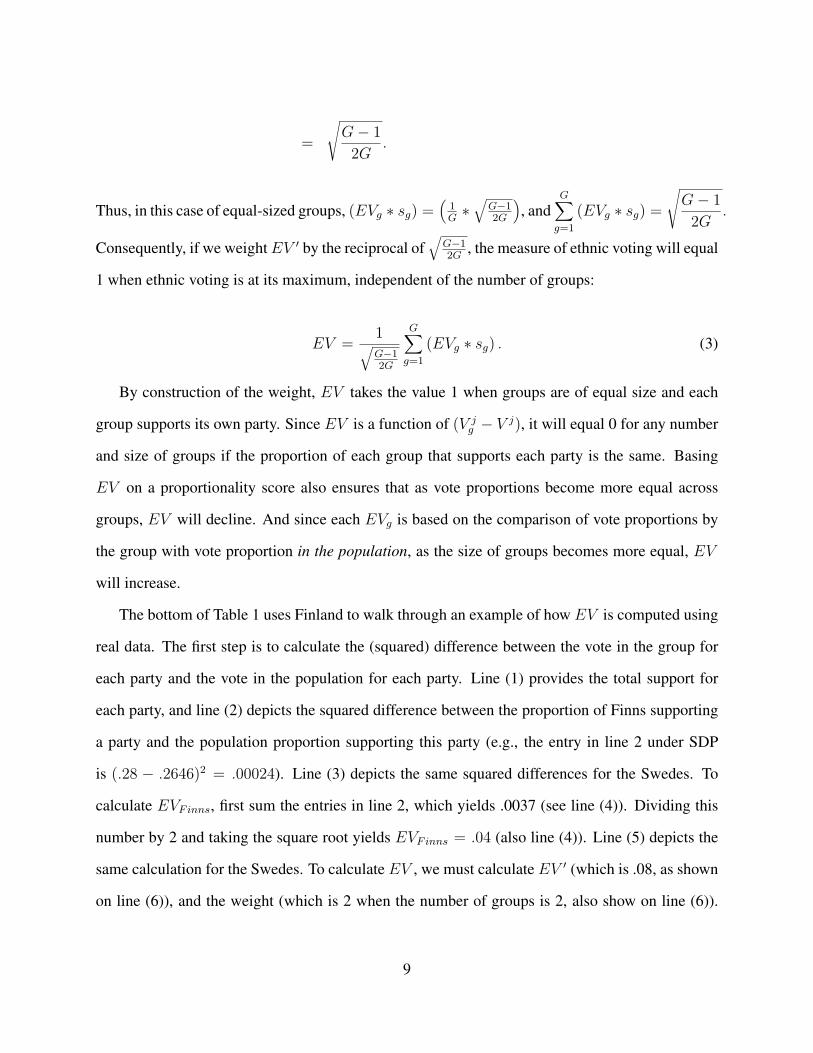
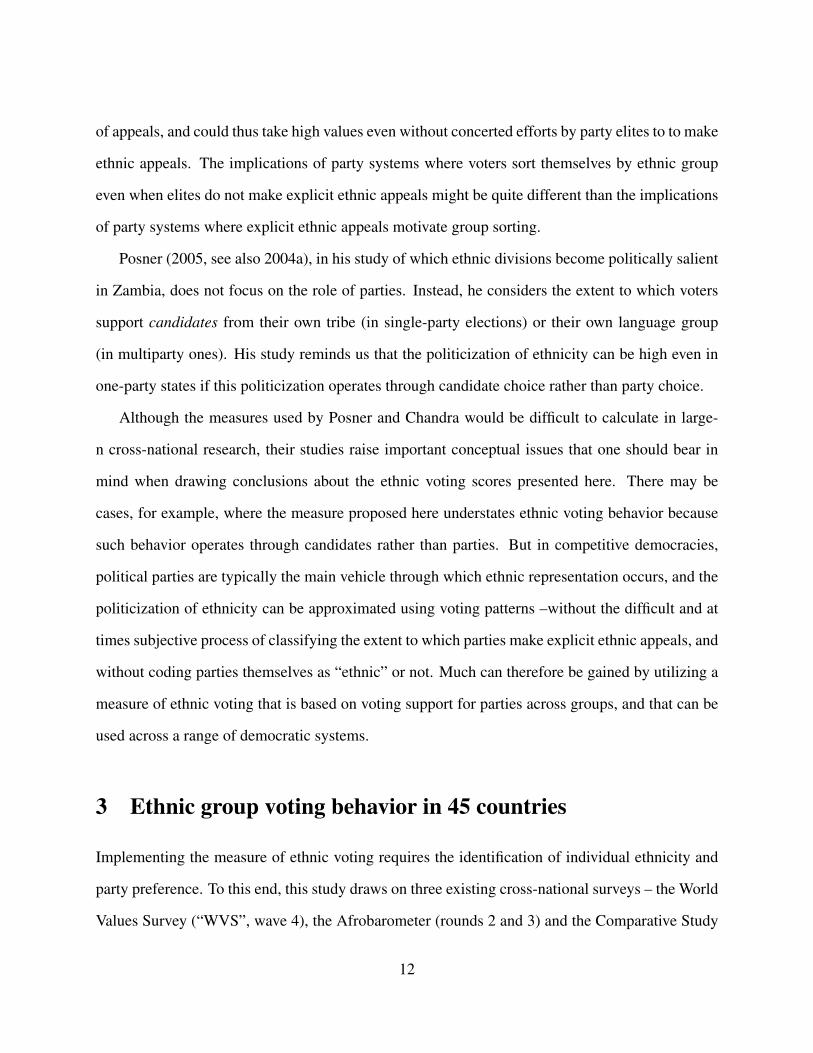
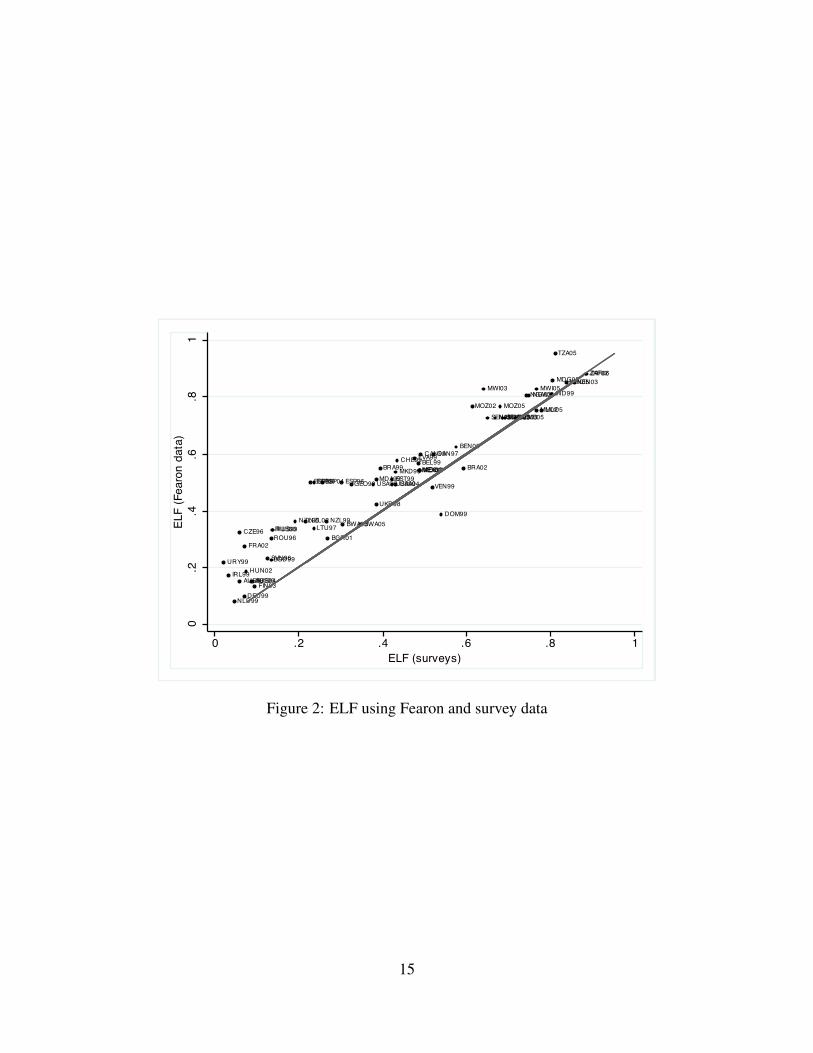
The measures of ethnic voting from these surveys ranges from .01 to .41 with a mean of .14 and
a standard deviation of .11. The level of ethnic voting in any country will obviously be affected
by the level of ethnic diversity, so to compare the levels of ethnic voting across countries, it is
important to control for overall level of ethnic fractionalization. Figure 3 plots ethnic voting levels
along with a simple bivariate regression line describing the relationship between ELF and ethnic
voting. At just about any level of ethnic fractionalization, there is variation in ethnic voting. Among
the low ELF countries, for example, Finland has high ethnic voting and Hungary has a low level,
as would be expected given the data presented in Table 1. Among countries with a middling level
of ethnic fractionalization, Macedonia and Belgium have very high levels of ethnic voting and
Mexico and Brazil have relatively low levels. It is therefore clear that ethnic voting cannot be
explained exclusively by underlying levels of ethnic diversity.
16
AUS96AUS99
AUS04
BGD99
BEL99
BWA03
BWA05BRA99
BRA02
BGR01
CAN97CAN99
CZE96
BEN05
DOM99
EST99
FIN03
FRA02
GEO99
DEU99HUN02
IND99
IRL99
KEN03
KEN05
LVA99
LTU97
MDG05
MWI03
MWI05
MLI02
MLI05
MEX97
MEX99
MEX00
MEX03
MDA99
MOZ02
MOZ05
NAM03NAM06
NLD99
NZL96
NZL99
NZL02
NGA03
NGA05
ROU96
RUS99RUS00
SEN02
SEN05
SVN96
ZAF02
ZAF06
ESP96
ESP99
ESP00
ESP04
CHE99
UKR98
MKD99
TZA05USA96
USA99
USA04
URY99
VEN99
ZMB03
ZMB05
0.1
.2.3
.4
Eth
nic
vo
tin
g
0 .2 .4 .6 .8 1
ELF
Figure 3: Ethnic voting and ELF
17
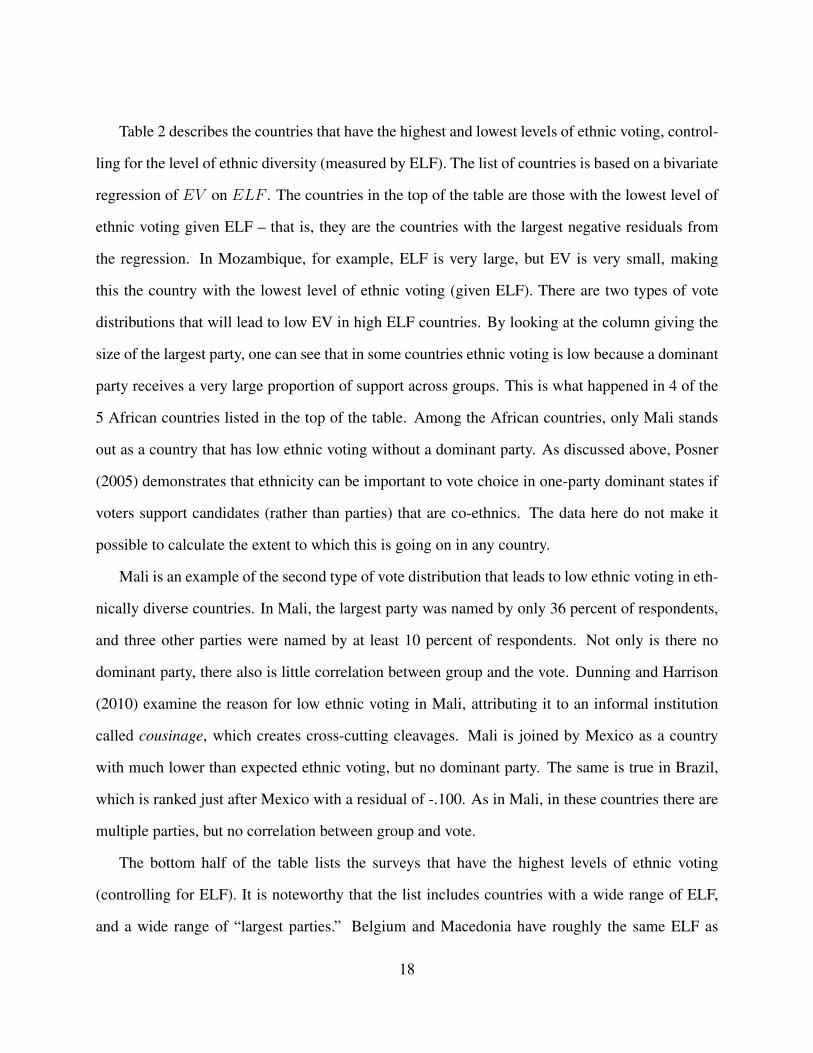
Table 2 describes the countries that have the highest and lowest levels of ethnic voting, control-
ling for the level of ethnic diversity (measured by ELF). The list of countries is based on a bivariate
regression of EV on ELF . The countries in the top of the table are those with the lowest level of
ethnic voting given ELF – that is, they are the countries with the largest negative residuals from
the regression. In Mozambique, for example, ELF is very large, but EV is very small, making
this the country with the lowest level of ethnic voting (given ELF). There are two types of vote
distributions that will lead to low EV in high ELF countries. By looking at the column giving the
size of the largest party, one can see that in some countries ethnic voting is low because a dominant
party receives a very large proportion of support across groups. This is what happened in 4 of the
5 African countries listed in the top of the table. Among the African countries, only Mali stands
out as a country that has low ethnic voting without a dominant party. As discussed above, Posner
(2005) demonstrates that ethnicity can be important to vote choice in one-party dominant states if
voters support candidates (rather than parties) that are co-ethnics. The data here do not make it
possible to calculate the extent to which this is going on in any country.
Mali is an example of the second type of vote distribution that leads to low ethnic voting in eth-
nically diverse countries. In Mali, the largest party was named by only 36 percent of respondents,
and three other parties were named by at least 10 percent of respondents. Not only is there no
dominant party, there also is little correlation between group and the vote. Dunning and Harrison
(2010) examine the reason for low ethnic voting in Mali, attributing it to an informal institution
called cousinage, which creates cross-cutting cleavages. Mali is joined by Mexico as a country
with much lower than expected ethnic voting, but no dominant party. The same is true in Brazil,
which is ranked just after Mexico with a residual of -.100. As in Mali, in these countries there are
multiple parties, but no correlation between group and vote.
The bottom half of the table lists the surveys that have the highest levels of ethnic voting
(controlling for ELF). It is noteworthy that the list includes countries with a wide range of ELF,
and a wide range of “largest parties.” Belgium and Macedonia have roughly the same ELF as
18
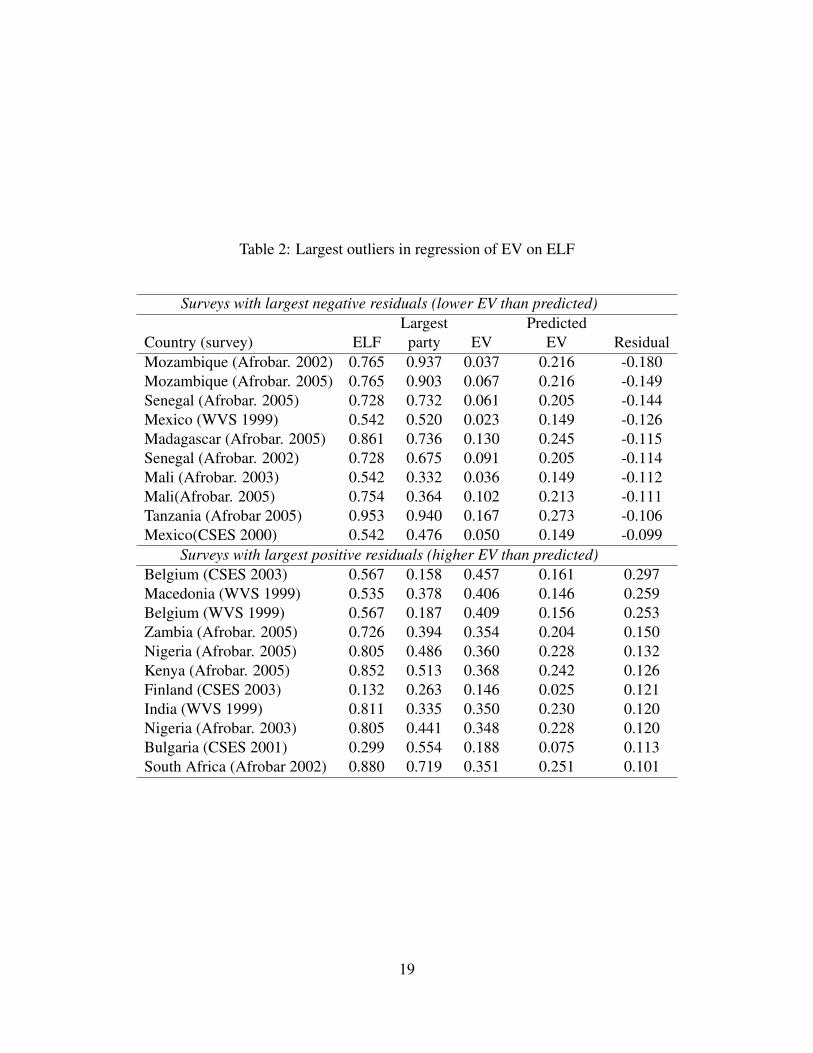
Table 2: Largest outliers in regression of EV on ELF
Surveys with largest negative residuals (lower EV than predicted)Largest Predicted
Country (survey) ELF party EV EV ResidualMozambique (Afrobar. 2002) 0.765 0.937 0.037 0.216 -0.180Mozambique (Afrobar. 2005) 0.765 0.903 0.067 0.216 -0.149Senegal (Afrobar. 2005) 0.728 0.732 0.061 0.205 -0.144Mexico (WVS 1999) 0.542 0.520 0.023 0.149 -0.126Madagascar (Afrobar. 2005) 0.861 0.736 0.130 0.245 -0.115Senegal (Afrobar. 2002) 0.728 0.675 0.091 0.205 -0.114Mali (Afrobar. 2003) 0.542 0.332 0.036 0.149 -0.112Mali(Afrobar. 2005) 0.754 0.364 0.102 0.213 -0.111Tanzania (Afrobar 2005) 0.953 0.940 0.167 0.273 -0.106Mexico(CSES 2000) 0.542 0.476 0.050 0.149 -0.099
Surveys with largest positive residuals (higher EV than predicted)Belgium (CSES 2003) 0.567 0.158 0.457 0.161 0.297Macedonia (WVS 1999) 0.535 0.378 0.406 0.146 0.259Belgium (WVS 1999) 0.567 0.187 0.409 0.156 0.253Zambia (Afrobar. 2005) 0.726 0.394 0.354 0.204 0.150Nigeria (Afrobar. 2005) 0.805 0.486 0.360 0.228 0.132Kenya (Afrobar. 2005) 0.852 0.513 0.368 0.242 0.126Finland (CSES 2003) 0.132 0.263 0.146 0.025 0.121India (WVS 1999) 0.811 0.335 0.350 0.230 0.120Nigeria (Afrobar. 2003) 0.805 0.441 0.348 0.228 0.120Bulgaria (CSES 2001) 0.299 0.554 0.188 0.075 0.113South Africa (Afrobar 2002) 0.880 0.719 0.351 0.251 0.101
19
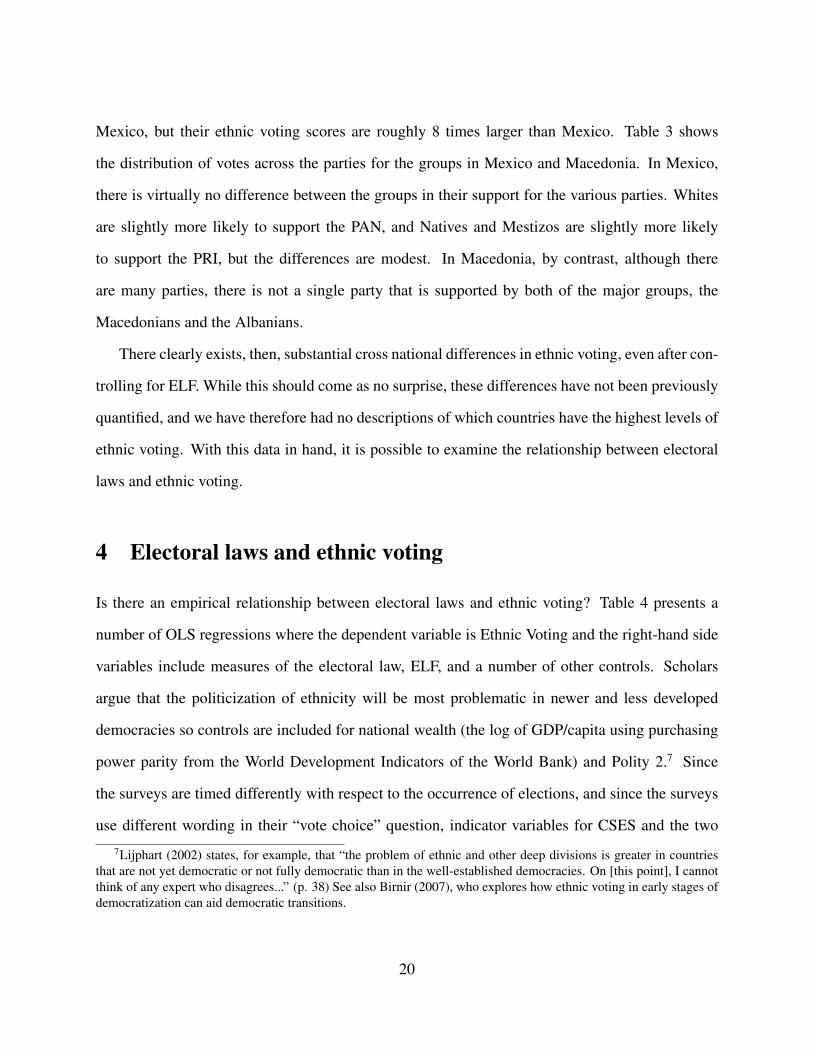
Mexico, but their ethnic voting scores are roughly 8 times larger than Mexico. Table 3 shows
the distribution of votes across the parties for the groups in Mexico and Macedonia. In Mexico,
there is virtually no difference between the groups in their support for the various parties. Whites
are slightly more likely to support the PAN, and Natives and Mestizos are slightly more likely
to support the PRI, but the differences are modest. In Macedonia, by contrast, although there
are many parties, there is not a single party that is supported by both of the major groups, the
Macedonians and the Albanians.
There clearly exists, then, substantial cross national differences in ethnic voting, even after con-
trolling for ELF. While this should come as no surprise, these differences have not been previously
quantified, and we have therefore had no descriptions of which countries have the highest levels of
ethnic voting. With this data in hand, it is possible to examine the relationship between electoral
laws and ethnic voting.
4 Electoral laws and ethnic voting
Is there an empirical relationship between electoral laws and ethnic voting? Table 4 presents a
number of OLS regressions where the dependent variable is Ethnic Voting and the right-hand side
variables include measures of the electoral law, ELF, and a number of other controls. Scholars
argue that the politicization of ethnicity will be most problematic in newer and less developed
democracies so controls are included for national wealth (the log of GDP/capita using purchasing
power parity from the World Development Indicators of the World Bank) and Polity 2.7 Since
the surveys are timed differently with respect to the occurrence of elections, and since the surveys
use different wording in their “vote choice” question, indicator variables for CSES and the two7Lijphart (2002) states, for example, that “the problem of ethnic and other deep divisions is greater in countries
that are not yet democratic or not fully democratic than in the well-established democracies. On [this point], I cannotthink of any expert who disagrees...” (p. 38) See also Birnir (2007), who explores how ethnic voting in early stages ofdemocratization can aid democratic transitions.
20
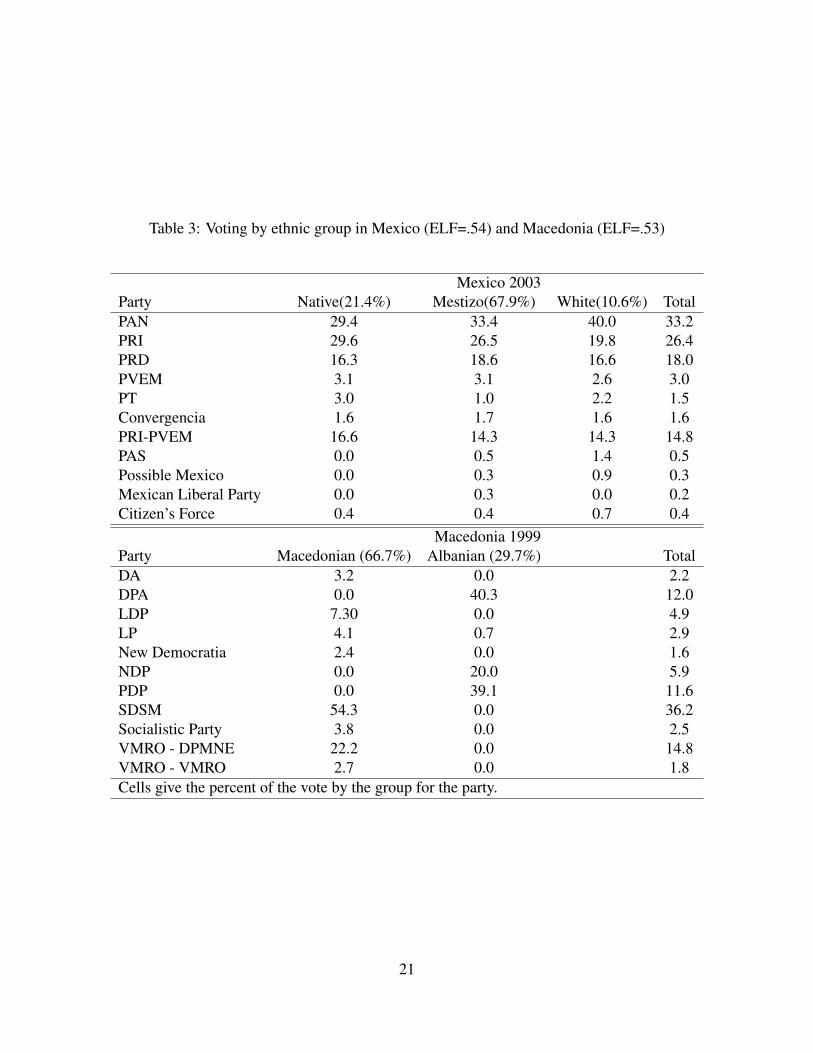
Table 3: Voting by ethnic group in Mexico (ELF=.54) and Macedonia (ELF=.53)
Mexico 2003Party Native(21.4%) Mestizo(67.9%) White(10.6%) TotalPAN 29.4 33.4 40.0 33.2PRI 29.6 26.5 19.8 26.4PRD 16.3 18.6 16.6 18.0PVEM 3.1 3.1 2.6 3.0PT 3.0 1.0 2.2 1.5Convergencia 1.6 1.7 1.6 1.6PRI-PVEM 16.6 14.3 14.3 14.8PAS 0.0 0.5 1.4 0.5Possible Mexico 0.0 0.3 0.9 0.3Mexican Liberal Party 0.0 0.3 0.0 0.2Citizen’s Force 0.4 0.4 0.7 0.4
Macedonia 1999Party Macedonian (66.7%) Albanian (29.7%) TotalDA 3.2 0.0 2.2DPA 0.0 40.3 12.0LDP 7.30 0.0 4.9LP 4.1 0.7 2.9New Democratia 2.4 0.0 1.6NDP 0.0 20.0 5.9PDP 0.0 39.1 11.6SDSM 54.3 0.0 36.2Socialistic Party 3.8 0.0 2.5VMRO - DPMNE 22.2 0.0 14.8VMRO - VMRO 2.7 0.0 1.8Cells give the percent of the vote by the group for the party.
21
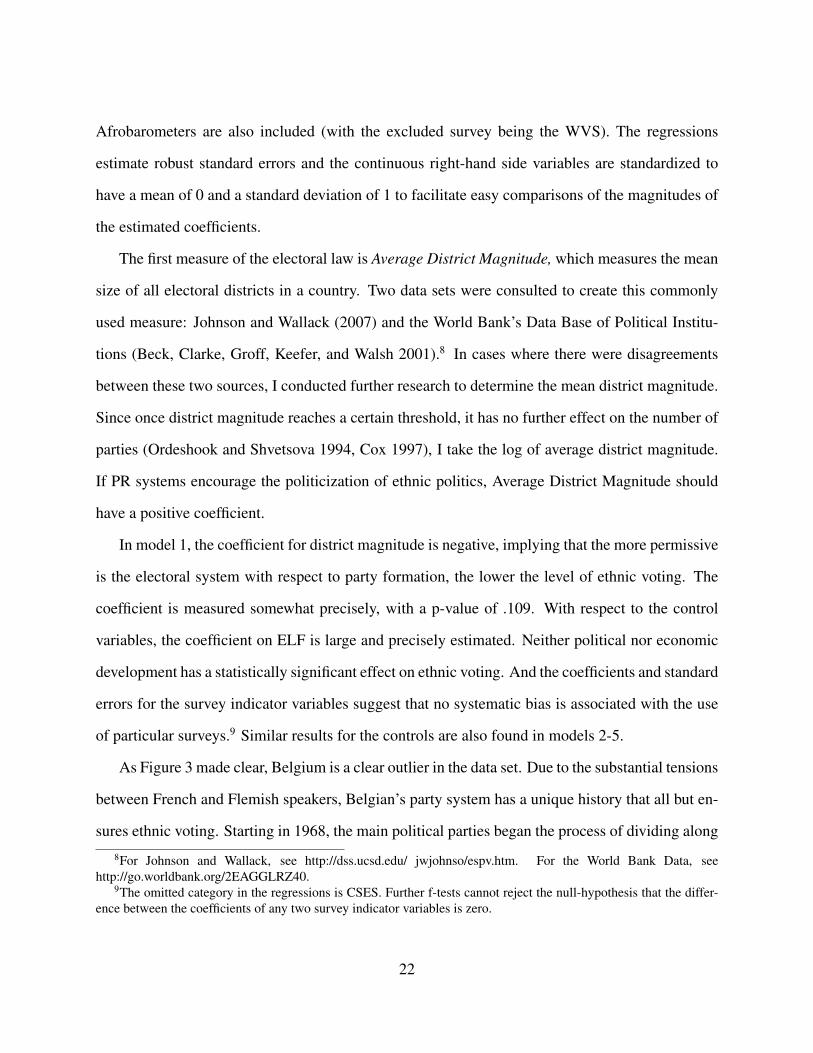
Afrobarometers are also included (with the excluded survey being the WVS). The regressions
estimate robust standard errors and the continuous right-hand side variables are standardized to
have a mean of 0 and a standard deviation of 1 to facilitate easy comparisons of the magnitudes of
the estimated coefficients.
The first measure of the electoral law is Average District Magnitude, which measures the mean
size of all electoral districts in a country. Two data sets were consulted to create this commonly
used measure: Johnson and Wallack (2007) and the World Bank’s Data Base of Political Institu-
tions (Beck, Clarke, Groff, Keefer, and Walsh 2001).8 In cases where there were disagreements
between these two sources, I conducted further research to determine the mean district magnitude.
Since once district magnitude reaches a certain threshold, it has no further effect on the number of
parties (Ordeshook and Shvetsova 1994, Cox 1997), I take the log of average district magnitude.
If PR systems encourage the politicization of ethnic politics, Average District Magnitude should
have a positive coefficient.
In model 1, the coefficient for district magnitude is negative, implying that the more permissive
is the electoral system with respect to party formation, the lower the level of ethnic voting. The
coefficient is measured somewhat precisely, with a p-value of .109. With respect to the control
variables, the coefficient on ELF is large and precisely estimated. Neither political nor economic
development has a statistically significant effect on ethnic voting. And the coefficients and standard
errors for the survey indicator variables suggest that no systematic bias is associated with the use
of particular surveys.9 Similar results for the controls are also found in models 2-5.
As Figure 3 made clear, Belgium is a clear outlier in the data set. Due to the substantial tensions
between French and Flemish speakers, Belgian’s party system has a unique history that all but en-
sures ethnic voting. Starting in 1968, the main political parties began the process of dividing along8For Johnson and Wallack, see http://dss.ucsd.edu/ jwjohnso/espv.htm. For the World Bank Data, see
http://go.worldbank.org/2EAGGLRZ40.9The omitted category in the regressions is CSES. Further f-tests cannot reject the null-hypothesis that the differ-
ence between the coefficients of any two survey indicator variables is zero.
22
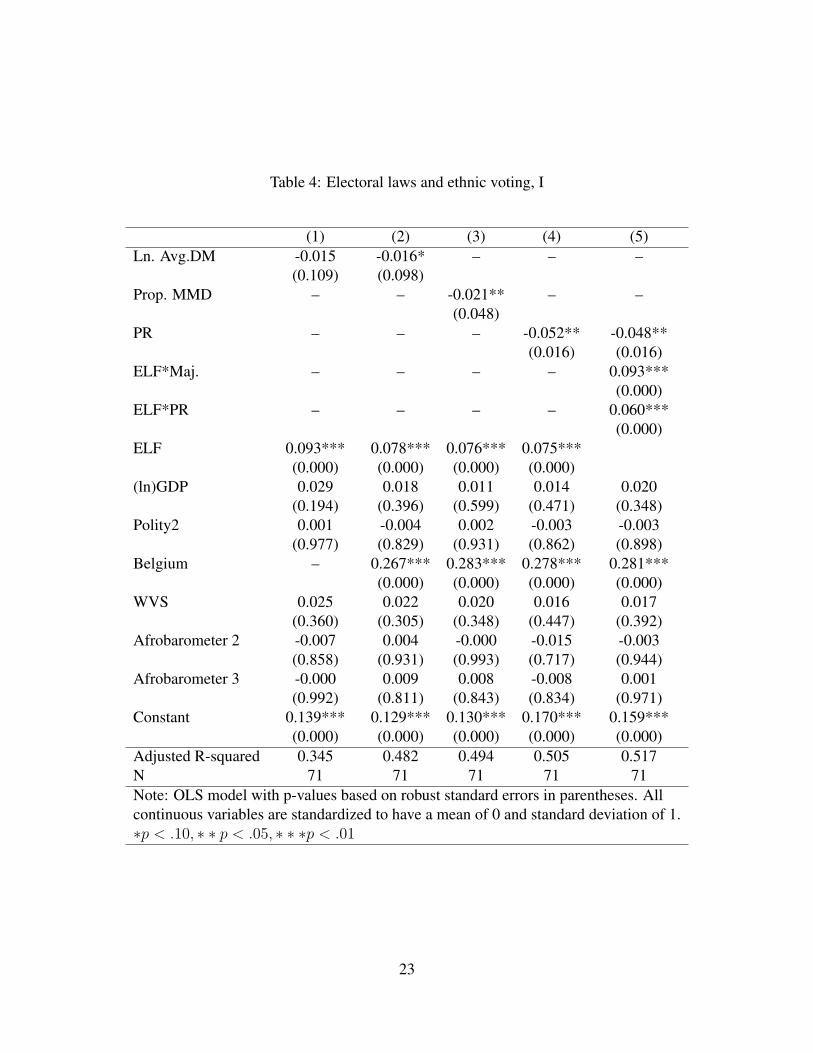
Table 4: Electoral laws and ethnic voting, I
(1) (2) (3) (4) (5)Ln. Avg.DM -0.015 -0.016* – – –
(0.109) (0.098)Prop. MMD – – -0.021** – –
(0.048)PR – – – -0.052** -0.048**
(0.016) (0.016)ELF*Maj. – – – – 0.093***
(0.000)ELF*PR – – – – 0.060***
(0.000)ELF 0.093*** 0.078*** 0.076*** 0.075***
(0.000) (0.000) (0.000) (0.000)(ln)GDP 0.029 0.018 0.011 0.014 0.020
(0.194) (0.396) (0.599) (0.471) (0.348)Polity2 0.001 -0.004 0.002 -0.003 -0.003
(0.977) (0.829) (0.931) (0.862) (0.898)Belgium – 0.267*** 0.283*** 0.278*** 0.281***
(0.000) (0.000) (0.000) (0.000)WVS 0.025 0.022 0.020 0.016 0.017
(0.360) (0.305) (0.348) (0.447) (0.392)Afrobarometer 2 -0.007 0.004 -0.000 -0.015 -0.003
(0.858) (0.931) (0.993) (0.717) (0.944)Afrobarometer 3 -0.000 0.009 0.008 -0.008 0.001
(0.992) (0.811) (0.843) (0.834) (0.971)Constant 0.139*** 0.129*** 0.130*** 0.170*** 0.159***
(0.000) (0.000) (0.000) (0.000) (0.000)Adjusted R-squared 0.345 0.482 0.494 0.505 0.517N 71 71 71 71 71Note: OLS model with p-values based on robust standard errors in parentheses. Allcontinuous variables are standardized to have a mean of 0 and standard deviation of 1.!p < .10, ! ! p < .05, ! ! !p < .01
23
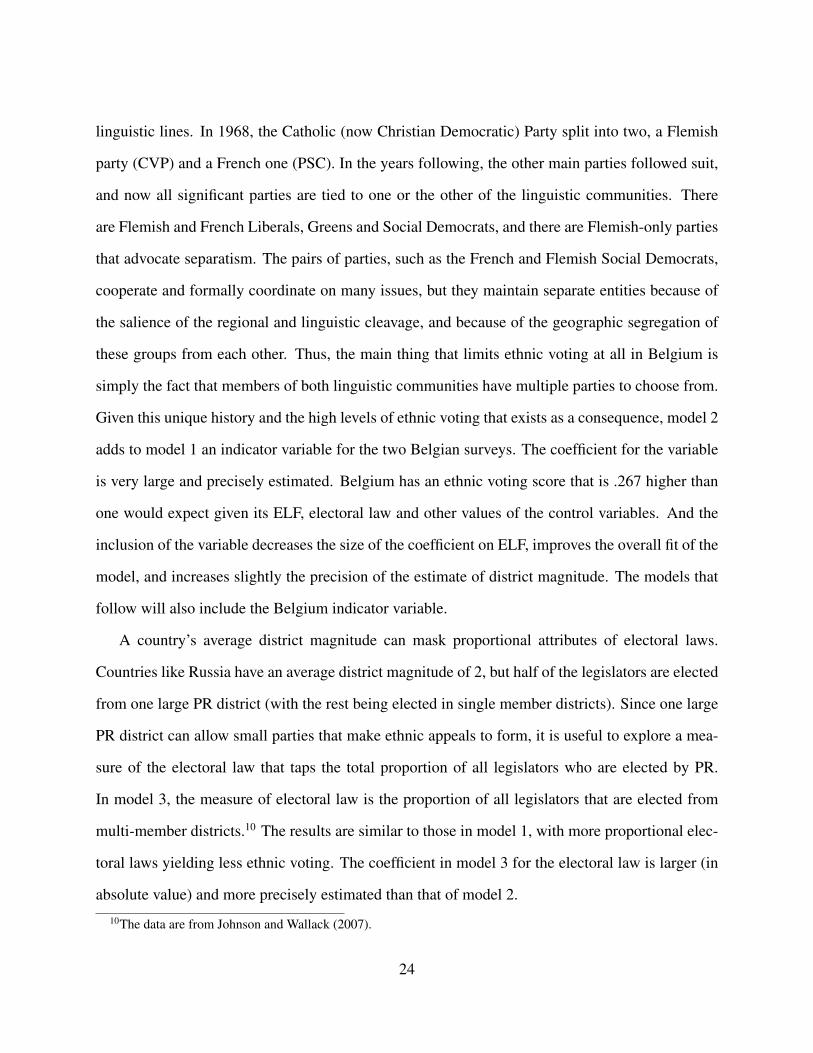
linguistic lines. In 1968, the Catholic (now Christian Democratic) Party split into two, a Flemish
party (CVP) and a French one (PSC). In the years following, the other main parties followed suit,
and now all significant parties are tied to one or the other of the linguistic communities. There
are Flemish and French Liberals, Greens and Social Democrats, and there are Flemish-only parties
that advocate separatism. The pairs of parties, such as the French and Flemish Social Democrats,
cooperate and formally coordinate on many issues, but they maintain separate entities because of
the salience of the regional and linguistic cleavage, and because of the geographic segregation of
these groups from each other. Thus, the main thing that limits ethnic voting at all in Belgium is
simply the fact that members of both linguistic communities have multiple parties to choose from.
Given this unique history and the high levels of ethnic voting that exists as a consequence, model 2
adds to model 1 an indicator variable for the two Belgian surveys. The coefficient for the variable
is very large and precisely estimated. Belgium has an ethnic voting score that is .267 higher than
one would expect given its ELF, electoral law and other values of the control variables. And the
inclusion of the variable decreases the size of the coefficient on ELF, improves the overall fit of the
model, and increases slightly the precision of the estimate of district magnitude. The models that
follow will also include the Belgium indicator variable.
A country’s average district magnitude can mask proportional attributes of electoral laws.
Countries like Russia have an average district magnitude of 2, but half of the legislators are elected
from one large PR district (with the rest being elected in single member districts). Since one large
PR district can allow small parties that make ethnic appeals to form, it is useful to explore a mea-
sure of the electoral law that taps the total proportion of all legislators who are elected by PR.
In model 3, the measure of electoral law is the proportion of all legislators that are elected from
multi-member districts.10 The results are similar to those in model 1, with more proportional elec-
toral laws yielding less ethnic voting. The coefficient in model 3 for the electoral law is larger (in
absolute value) and more precisely estimated than that of model 2.10The data are from Johnson and Wallack (2007).
24
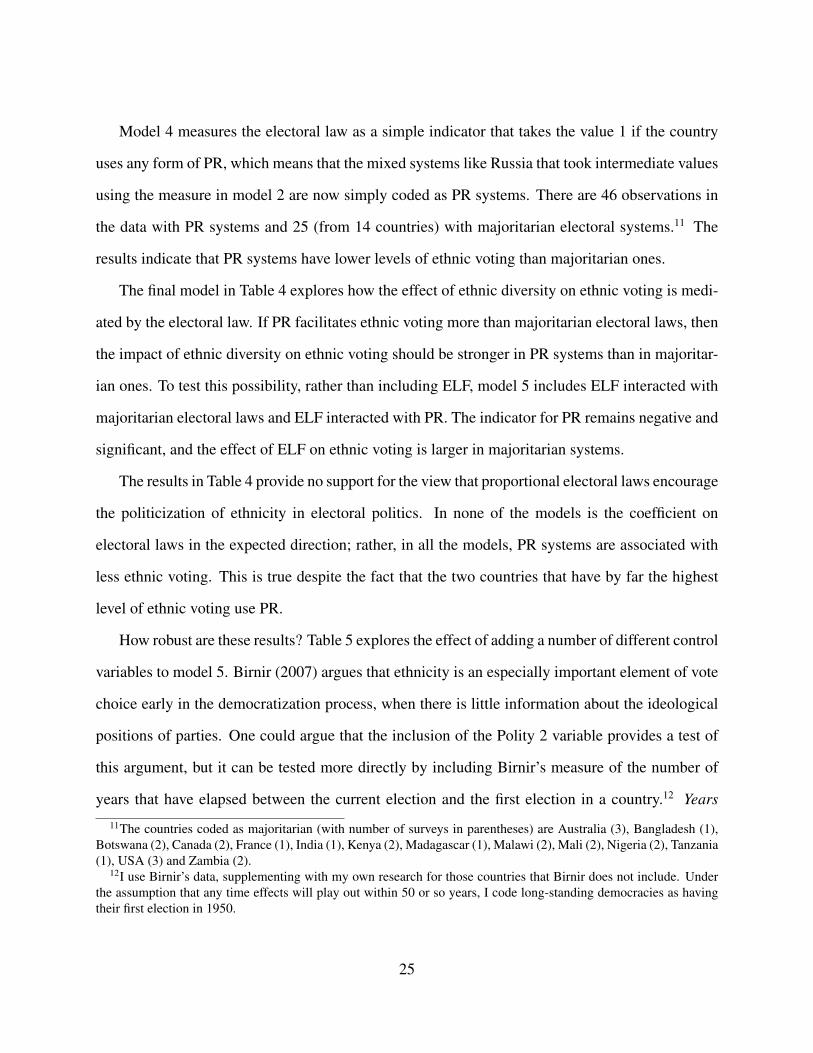
Model 4 measures the electoral law as a simple indicator that takes the value 1 if the country
uses any form of PR, which means that the mixed systems like Russia that took intermediate values
using the measure in model 2 are now simply coded as PR systems. There are 46 observations in
the data with PR systems and 25 (from 14 countries) with majoritarian electoral systems.11 The
results indicate that PR systems have lower levels of ethnic voting than majoritarian ones.
The final model in Table 4 explores how the effect of ethnic diversity on ethnic voting is medi-
ated by the electoral law. If PR facilitates ethnic voting more than majoritarian electoral laws, then
the impact of ethnic diversity on ethnic voting should be stronger in PR systems than in majoritar-
ian ones. To test this possibility, rather than including ELF, model 5 includes ELF interacted with
majoritarian electoral laws and ELF interacted with PR. The indicator for PR remains negative and
significant, and the effect of ELF on ethnic voting is larger in majoritarian systems.
The results in Table 4 provide no support for the view that proportional electoral laws encourage
the politicization of ethnicity in electoral politics. In none of the models is the coefficient on
electoral laws in the expected direction; rather, in all the models, PR systems are associated with
less ethnic voting. This is true despite the fact that the two countries that have by far the highest
level of ethnic voting use PR.
How robust are these results? Table 5 explores the effect of adding a number of different control
variables to model 5. Birnir (2007) argues that ethnicity is an especially important element of vote
choice early in the democratization process, when there is little information about the ideological
positions of parties. One could argue that the inclusion of the Polity 2 variable provides a test of
this argument, but it can be tested more directly by including Birnir’s measure of the number of
years that have elapsed between the current election and the first election in a country.12 Years11The countries coded as majoritarian (with number of surveys in parentheses) are Australia (3), Bangladesh (1),
Botswana (2), Canada (2), France (1), India (1), Kenya (2), Madagascar (1), Malawi (2), Mali (2), Nigeria (2), Tanzania(1), USA (3) and Zambia (2).
12I use Birnir’s data, supplementing with my own research for those countries that Birnir does not include. Underthe assumption that any time effects will play out within 50 or so years, I code long-standing democracies as havingtheir first election in 1950.
25
democratic therefore measures the number of (logged) years between the survey date and the first
election in a country. Model 6 simply adds Years Democratic (logged) to model 5. The variable is
negative, but measured with considerable error. Its inclusion does not affect the results regarding
electoral laws. Model 7 includes the interaction of Years Democratic and ELF, a specification
advocated in Birnir (2007). Again, there is no evidence that the number of years democratic is
associated with diminished ethnic voting, and the results regarding PR are robust.
Next consider the geographic concentration of groups. If individuals from the same group
tend to live together, and to be exposed mostly to members of their own group with little expo-
sure to members of other groups, then it should be more likely that they will form group-specific
viewpoints and interests, and thus that they vote together with their own ethnic group. And geo-
graphically concentrated groups should make it more likely that ethnic voting will be strong under
majoritarian electoral laws because such concentration should make it possible for ethnic appeals
to succeed.
I draw on work by scholars of residential segregation to measure the geographic isolation of
groups from each other. Geographic Isolation (“I”) measures “the extent to which minority mem-
bers are exposed only to one another.” (Massey and Denton 1988, p. 288) The measure of isolation
of group g is given by
Ig =n!
i=1
/pi
g
Pg·pi
g
Ti
0
, (4)
where i is a region, n is the total number of regions, pig is the population of group g in region i, Pg
is the total population of group g in the country, and Ti is the total population in region i.
Ig will increase as a group becomes more concentrated in the same region (holding the size and
distribution of other groups constant). It will also increase as a group becomes larger (holding its
distribution across regions constant, as well as the size and distribution of other groups). It has a
theoretical maximum of 1 (which occurs when all members of a group live in a region (or regions)
that have no members of other groups). And it has a theoretical minimum of 0 (which occurs when
26
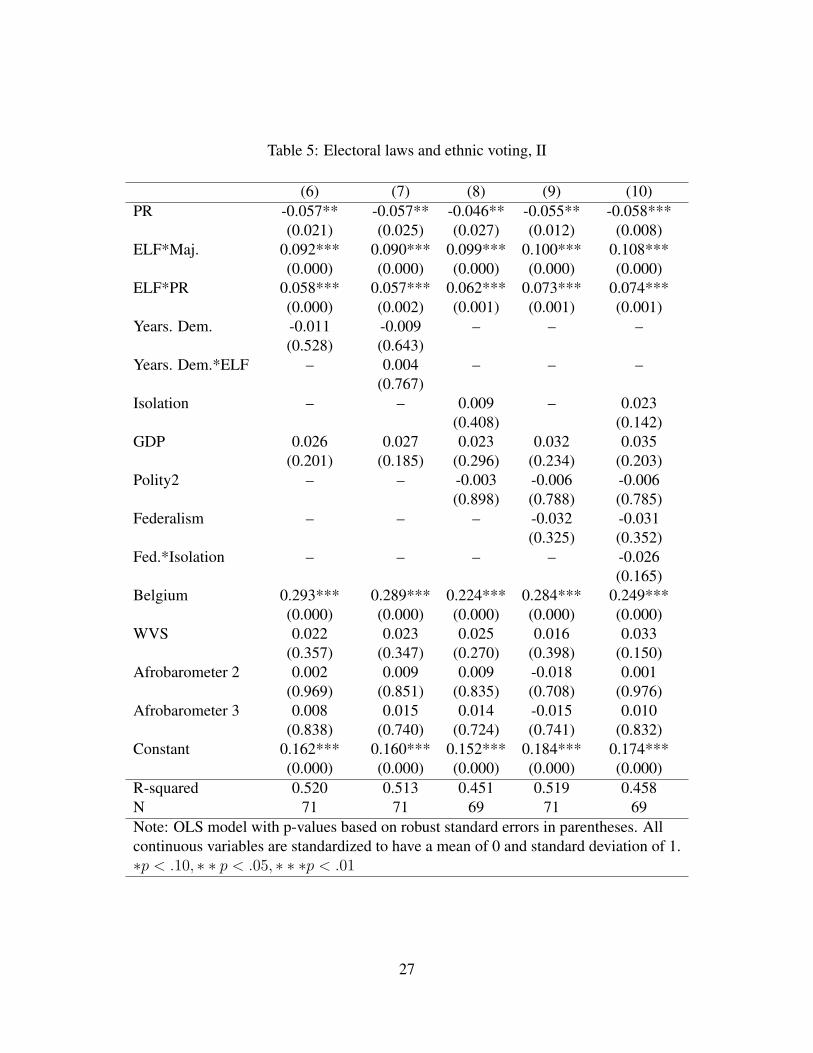
Table 5: Electoral laws and ethnic voting, II
(6) (7) (8) (9) (10)PR -0.057** -0.057** -0.046** -0.055** -0.058***
(0.021) (0.025) (0.027) (0.012) (0.008)ELF*Maj. 0.092*** 0.090*** 0.099*** 0.100*** 0.108***
(0.000) (0.000) (0.000) (0.000) (0.000)ELF*PR 0.058*** 0.057*** 0.062*** 0.073*** 0.074***
(0.000) (0.002) (0.001) (0.001) (0.001)Years. Dem. -0.011 -0.009 – – –
(0.528) (0.643)Years. Dem.*ELF – 0.004 – – –
(0.767)Isolation – – 0.009 – 0.023
(0.408) (0.142)GDP 0.026 0.027 0.023 0.032 0.035
(0.201) (0.185) (0.296) (0.234) (0.203)Polity2 – – -0.003 -0.006 -0.006
(0.898) (0.788) (0.785)Federalism – – – -0.032 -0.031
(0.325) (0.352)Fed.*Isolation – – – – -0.026
(0.165)Belgium 0.293*** 0.289*** 0.224*** 0.284*** 0.249***
(0.000) (0.000) (0.000) (0.000) (0.000)WVS 0.022 0.023 0.025 0.016 0.033
(0.357) (0.347) (0.270) (0.398) (0.150)Afrobarometer 2 0.002 0.009 0.009 -0.018 0.001
(0.969) (0.851) (0.835) (0.708) (0.976)Afrobarometer 3 0.008 0.015 0.014 -0.015 0.010
(0.838) (0.740) (0.724) (0.741) (0.832)Constant 0.162*** 0.160*** 0.152*** 0.184*** 0.174***
(0.000) (0.000) (0.000) (0.000) (0.000)R-squared 0.520 0.513 0.451 0.519 0.458N 71 71 69 71 69Note: OLS model with p-values based on robust standard errors in parentheses. Allcontinuous variables are standardized to have a mean of 0 and standard deviation of 1.!p < .10, ! ! p < .05, ! ! !p < .01
27
each member of a group is the only member from that group in his or her region).
To describe the aggregate isolation of all ethnic groups in a country, I take the weighted sum of
the isolation scores for each group:
Ik =G!
g=1
(Ig · Pg
T
), (5)
where k is a country, G is the total number of groups in country k and T is the population of country
k. To calculate this variable, I use the region variable that exists in each of the surveys.13 Isolation
should have a positive coefficient if ethnic voting increases when groups are more geographically
isolated from each other.
Model 8 adds Isolation to model 5. The coefficient is positive, but is not statistically significant
at standard levels (p=.149). Its inclusion, however, does not affect the results regarding electoral
laws, with PR continuing to have a negative and statistically significant coefficient, and with the
effect of ELF on ethnic voting being stronger in majoritarian systems.
Models 9 and 10 consider the impact of decentralization. As Brancati (2009) nicely sum-
marizes, there is general agreement that decentralization reinforces ethnic identity and its role in
individual behavior, though there is disagreement about whether this is a good thing. Ethnic voting
should therefore be more prevalent in more decentralized systems. I test whether the results regard-
ing electoral laws are robust when controlling for decentralization by adding an indicator variable
to Model 5 that takes the value 1 in federal systems.14 Contrary to expectations, the federalism
variable in model 9 has a negative sign, though the coefficient is measured with considerable error.
The findings for electoral laws, however, are robust to the inclusion of the federalism variable. If
decentralization only leads to more ethnic voting when groups are territorially concentrated, then it
is appropriate to consider the interaction of federalism and isolation. The results from this interac-
tion are given in model 10. The coefficient for Isolation is measured more precisely (p=.142), but13There is no region variable in the WVS survey for Ireland.14The data are from Treisman (2002), supplemented by my own research for missing cases.
28
Federalism continues to be measured with substantial error, as is the interaction of federalism with
isolation, suggesting that decentralization does not increase the impact of territorial segregation on
ethnic voting.
Table 6 explores the robustness of the results regarding PR by estimating models using two
subsets of the data. Africa is a unique continent– it has the highest level of ethnic diversity found
anywhere in the world, and it has rather limited experience with democracy. To explore whether
the results in Table 4 are driven by the inclusion of the African countries, models 11 and 12 re-
estimate models 4 and 5 using only the non-African countries. The results regarding PR are robust:
the PR variable is negative in both models, and the effect of ELF on ethnic voting is stronger in
majoritarian than in PR systems. Do the results for PR hold using only the African countries?
Models 13 and 14 address this question by re-estimating models 4 and 5 using only the 23 surveys
(of which 9 use PR) from the 13 African countries. In model 13, PR is still associated with less
ethnic voting, though the coefficient is not statistically significant (p=.172). In model 14, the
results have much the same flavor as the results presented in table 4. PR is associated with less
ethnic voting (and the coefficient is estimated rather precisely), and the relationship between ethnic
diversity and ethnic voting is much stronger in SMD systems than in PR systems. Thus, the results
presented above are not driven by the inclusion of Africa and they hold using only the small number
of African countries.
5 Why does PR have lower levels of ethnic voting?
The empirical analysis reveals two robust results about the relationship between electoral laws
and ethnic voting. First, all else equal, ethnic voting is lower on average in PR systems than in
majoritarian ones. Second, the level of ethnic diversity in a country has a weaker association with
the level of ethnic voting in PR systems than in majoritarian ones. The results from model 4 imply
that if ELF is at the mean level in the data set, ethnic voting is .044 greater in majoritarian systems
29
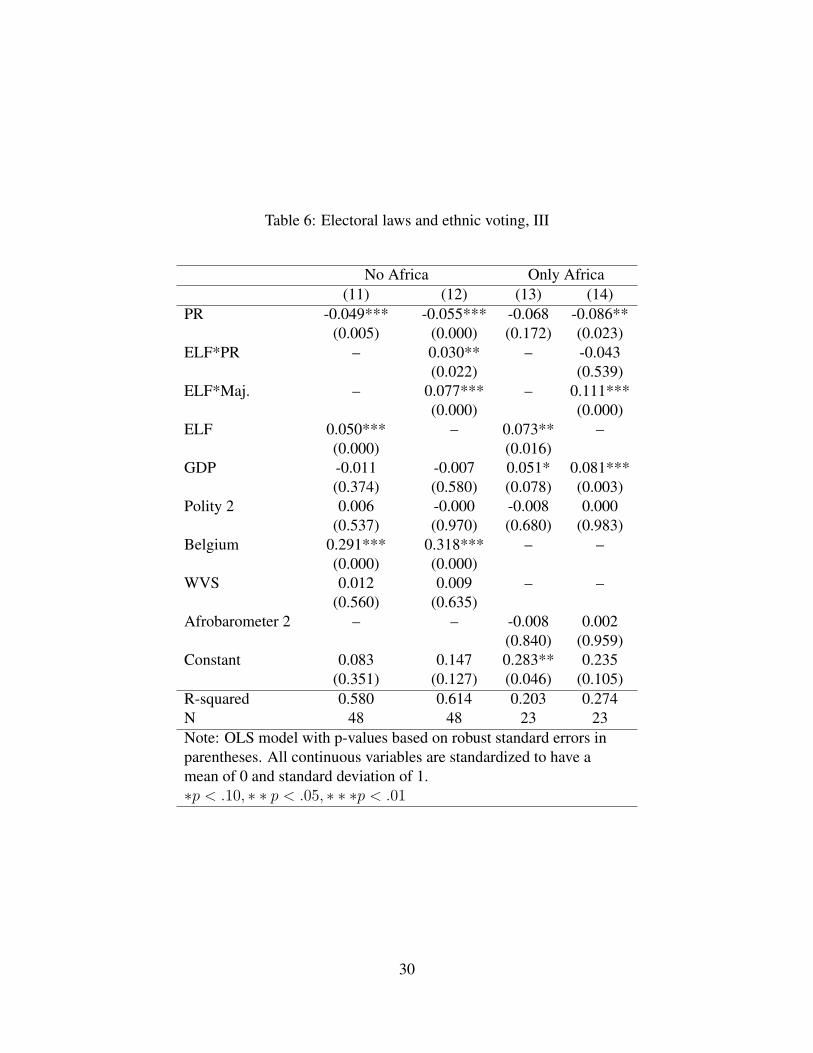
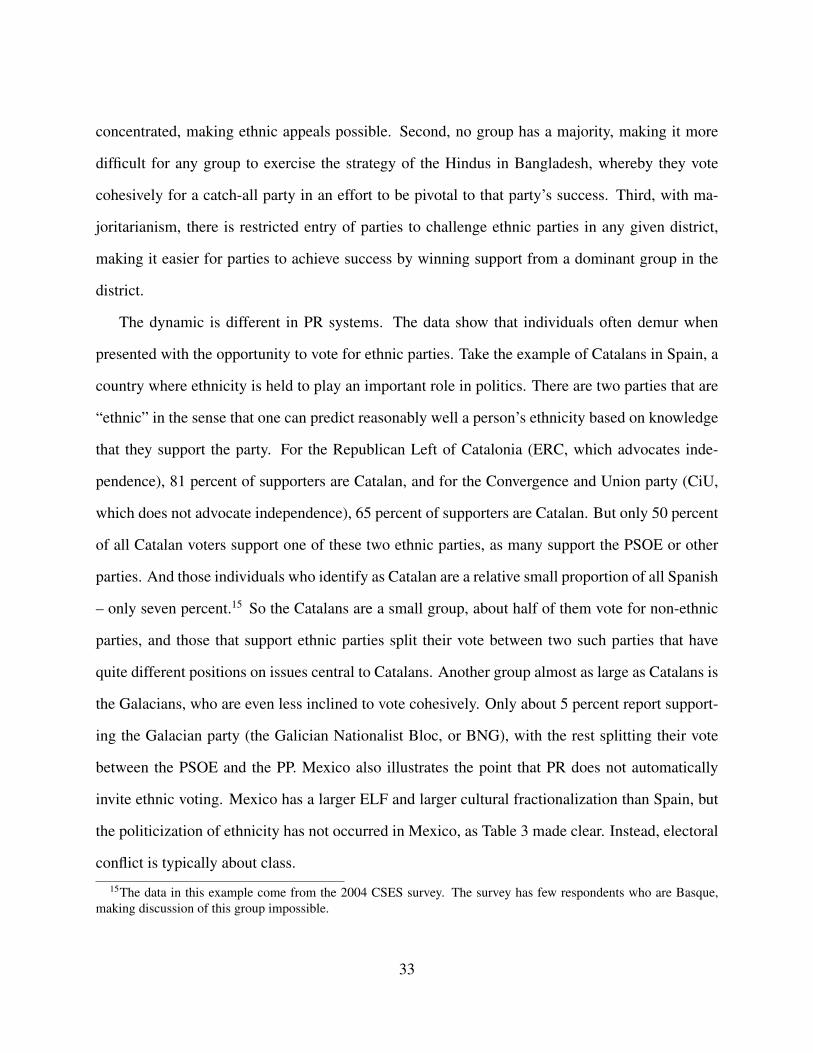
Table 6: Electoral laws and ethnic voting, III
No Africa Only Africa(11) (12) (13) (14)
PR -0.049*** -0.055*** -0.068 -0.086**(0.005) (0.000) (0.172) (0.023)
ELF*PR – 0.030** – -0.043(0.022) (0.539)
ELF*Maj. – 0.077*** – 0.111***(0.000) (0.000)
ELF 0.050*** – 0.073** –(0.000) (0.016)
GDP -0.011 -0.007 0.051* 0.081***(0.374) (0.580) (0.078) (0.003)
Polity 2 0.006 -0.000 -0.008 0.000(0.537) (0.970) (0.680) (0.983)
Belgium 0.291*** 0.318*** – –(0.000) (0.000)
WVS 0.012 0.009 – –(0.560) (0.635)
Afrobarometer 2 – – -0.008 0.002(0.840) (0.959)
Constant 0.083 0.147 0.283** 0.235(0.351) (0.127) (0.046) (0.105)
R-squared 0.580 0.614 0.203 0.274N 48 48 23 23Note: OLS model with p-values based on robust standard errors inparentheses. All continuous variables are standardized to have amean of 0 and standard deviation of 1.!p < .10, ! ! p < .05, ! ! !p < .01
30
than in PR ones; if ELF is one standard deviation above the mean, ethnic voting is .077 higher;
and if ELF is two standard deviations above the mean, the ethnic voting level is .11 higher in
majoritarian systems, which is the standard deviation of the Ethnic Voting variable.
The standard assumption is that by making party formation low cost, PR should yield more
ethnic voting because elites can appeal to even small groups based on ethnicity. Why might it be
true that the standard assumption is wrong? We can gain some insight by looking more closely at
some voting patterns in majoritarian and PR systems.
In majoritarian systems, where party entry is difficult in a given district, there are two different
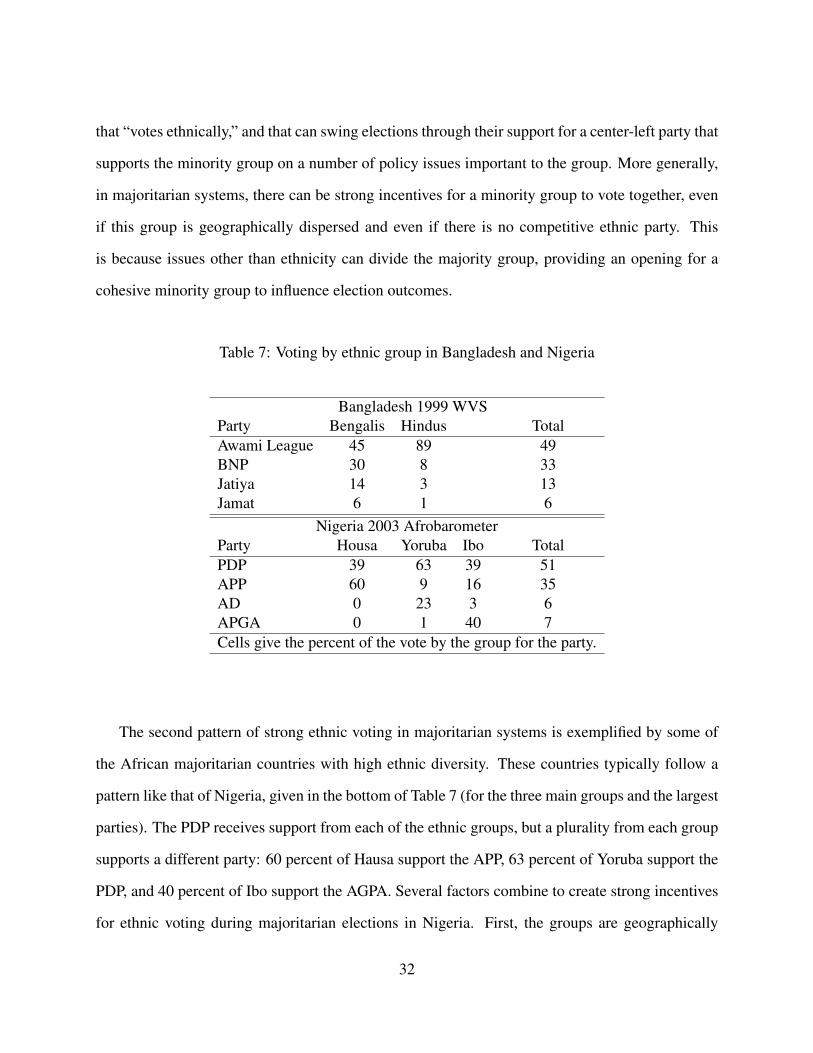
patterns that result in high ethnic voting. The first pattern is exemplified by Bangladesh and the
US, where there is a large majority group and a relatively small (but non-trival) minority group
that is geographically dispersed. In Bangladesh, a country that has struggled to establish free and
fair elections, the Muslim Bengals (93 percent of respondents in the WVS 1999) are the large
group and the Hindus (7 percent) are the small minority group. The top of Table 7 provides the
party preference for the four main parties by these two groups. There is no ethnic party in the
sense that the Awami League, a center-left party that supports the rights of minorities, receives a
plurality of support from both groups. But the Hindus overwhelmingly support this party whereas
the Bengalis show substantial levels of support for the other parties, particularly the Bangladesh
Nationalist Party, a center right party that is not friendly to minority rights. Given the division of
Bengals between the center-left and center-right, the cohesive support of the Hindus for the Awami
League can be pivotal in making it the plurality party. Indeed, in recent elections the Awami Party
won a clear majority with Hindu support. The story in the US is similar in that the white majority
leans toward the Republicans, but heavily supports both parties. This puts the minority blacks in
a potentially pivotal situation. The blacks overwhelmingly support the Democrats (in the 1996
CSES survey, 84 percent of blacks said they voted Democratic), and it is virtually impossible to
imagine the Democrats winning national elections without this black support.
In both the US and Bangladesh, there are no ethnic parties, but there is a minority ethnic group
31
that “votes ethnically,” and that can swing elections through their support for a center-left party that
supports the minority group on a number of policy issues important to the group. More generally,
in majoritarian systems, there can be strong incentives for a minority group to vote together, even
if this group is geographically dispersed and even if there is no competitive ethnic party. This
is because issues other than ethnicity can divide the majority group, providing an opening for a
cohesive minority group to influence election outcomes.
Table 7: Voting by ethnic group in Bangladesh and Nigeria
Bangladesh 1999 WVSParty Bengalis Hindus TotalAwami League 45 89 49BNP 30 8 33Jatiya 14 3 13Jamat 6 1 6
Nigeria 2003 AfrobarometerParty Housa Yoruba Ibo TotalPDP 39 63 39 51APP 60 9 16 35AD 0 23 3 6APGA 0 1 40 7Cells give the percent of the vote by the group for the party.
The second pattern of strong ethnic voting in majoritarian systems is exemplified by some of
the African majoritarian countries with high ethnic diversity. These countries typically follow a
pattern like that of Nigeria, given in the bottom of Table 7 (for the three main groups and the largest
parties). The PDP receives support from each of the ethnic groups, but a plurality from each group
supports a different party: 60 percent of Hausa support the APP, 63 percent of Yoruba support the
PDP, and 40 percent of Ibo support the AGPA. Several factors combine to create strong incentives
for ethnic voting during majoritarian elections in Nigeria. First, the groups are geographically
32
concentrated, making ethnic appeals possible. Second, no group has a majority, making it more
difficult for any group to exercise the strategy of the Hindus in Bangladesh, whereby they vote
cohesively for a catch-all party in an effort to be pivotal to that party’s success. Third, with ma-
joritarianism, there is restricted entry of parties to challenge ethnic parties in any given district,
making it easier for parties to achieve success by winning support from a dominant group in the
district.
The dynamic is different in PR systems. The data show that individuals often demur when
presented with the opportunity to vote for ethnic parties. Take the example of Catalans in Spain, a
country where ethnicity is held to play an important role in politics. There are two parties that are
“ethnic” in the sense that one can predict reasonably well a person’s ethnicity based on knowledge
that they support the party. For the Republican Left of Catalonia (ERC, which advocates inde-
pendence), 81 percent of supporters are Catalan, and for the Convergence and Union party (CiU,
which does not advocate independence), 65 percent of supporters are Catalan. But only 50 percent
of all Catalan voters support one of these two ethnic parties, as many support the PSOE or other
parties. And those individuals who identify as Catalan are a relative small proportion of all Spanish
– only seven percent.15 So the Catalans are a small group, about half of them vote for non-ethnic
parties, and those that support ethnic parties split their vote between two such parties that have
quite different positions on issues central to Catalans. Another group almost as large as Catalans is
the Galacians, who are even less inclined to vote cohesively. Only about 5 percent report support-
ing the Galacian party (the Galician Nationalist Bloc, or BNG), with the rest splitting their vote
between the PSOE and the PP. Mexico also illustrates the point that PR does not automatically
invite ethnic voting. Mexico has a larger ELF and larger cultural fractionalization than Spain, but
the politicization of ethnicity has not occurred in Mexico, as Table 3 made clear. Instead, electoral
conflict is typically about class.15The data in this example come from the 2004 CSES survey. The survey has few respondents who are Basque,
making discussion of this group impossible.
33
The politicization of ethnicity can obviously be large in PR systems, as the cases of Belgium
and Macedonia make clear. But perhaps the electoral politicization of ethnicity occurs less, on
average, in PR systems precisely because it is so easy to make electoral appeals of any sort. If one
party attempts to exploit ethnic identity with strong ethnically-based appeals under a permissive
PR system, then this very electoral pemissiveness also allows other parties to make appeals that
attract voters on issues other than ethnicity. Given that members of an ethnic group typically have
heterogenous preferences, in PR systems they should often conclude that supporting ethnically
oriented parties is not the most effective way of advancing their own interest because they should
have attractive options among non-ethnic parties. In Spain, for example, the Catalans can support
either a moderate ethnic party as opposed to a secessionist one, or they can support the PSOE,
which has traditionally defended regional autonomy. Such choice diffuses the cohesiveness of
group voting behavior, depoliticizing ethnicity when compared with, say, the blacks in the US, the
Hindus in Bangladesh, or the Yoruba in Nigeria.
6 Conclusion
Claims by social scientists about how factors like electoral laws or decentralization affect the politi-
cization of ethnicity have gone untested because there has existed no direct measure of ethnic vot-
ing across political systems. A central goal of this paper has been to develop and implement such
a measure. The measure does not consider support for ethnic parties or ethnic candidates, or the
nature of electoral appeals. Rather, captures the degree to which voting behavior in a country can
be predicted by knowing only individuals’ ethnic identity.
The empirical analysis of ethnic voting reveals some interesting and unexpected findings. At
any level of ethnic diversity, there is considerable variation in ethnic voting levels. At low levels
of diversity, Hungary has little ethnic voting compared with Finland. At middle levels of diversity,
Mexico and Brazil have little ethnic voting compared with Macedonia and Belgium. And at high
34
level of diversity, Mali has little ethnic voting compared with Zambia.
This variation, however, is not explained by traditional arguments about the politicization of
ethnicity. Levels of political and economic development are not correlated with ethnic voting lev-
els, nor is decentralization or its interaction with the territorial segregation of groups. There is,
however, a strong and robust effect of the electoral system, but the negative relationship between
PR and ethnic voting is the opposite of what has been typically assumed. There are reasons this
result for PR should be unsurprising. Majoritarian systems provide clear incentives and opportuni-
ties for ethnic voting to occur, even by small groups and even when groups are not geographically
concentrated. In fact, the risk of majoritarianism is not that it alienates groups by excluding them,
but rather that it encourages the politicization of ethnicity. By contrast, PR systems create am-
ple opportunities for parties to divide the vote of members from the same group, depoliticizing
ethnicity.
Two related avenues for future research research seem particularly important given the results
presented here. The first is to explore the relationship between ethnic voting and governance
outcomes that are central to the study of ethnic diversity. Does ethnic voting influence things like
the survival of democracy, inter-group conflict, or the quality of public goods provision? And does
the impact of ethnic voting on governance depend on the institutional context from which ethnic
voting occurs? The second is to explore other measures of ethnic voting. If it is the behavior
of specific groups, for example, that determine outcomes, rather than aggregate behavior of all
groups, it would be crucial to develop measures at the group level. Or if ethnic voting behavior
has a particularly strong effect on governance when that behavior focuses on parties that make
exclusionary appeals, it would be crucial to incorporate information about appeals. Developing
multiple measures would therefore allow a deeper understanding of how electoral institutions and
other factors influence ethnic voting levels, and how these in turn affect governance. Hopefully,
the framework presented here represents a useful first step in that direction.
35
7 References
Baldwin, Kate and John D. Huber. 2010. “Economic versus cultural differences: Forms of ethnicdiversity and public goods provision.” Typescript, Columbia University.
Beck, Thorsten, George Clarke, Alberto Groff, Philip Keefer, and Patrick Walsh. 2001. “Newtools in comparative political economy: The Database of Political Institutions.” World BankEconomic Review 15(1): 165-176.
Birnir, Johanna Kristın. 2007. Ethnicity and Electoral Politics. New York: Cambridge UniversityPress.
Brancati, Dawn. 2008. “The Origins and Strength of Regional Parties.” British Journal of Politi-cal Science 38(1): 135-159.
Brancati, Dawn. 2009. Peace by Design: Managing Ethnic Conict through Decentralization.New York: Oxford University Press.
Chandra, Kanchan. 2004. Why Ethnic Parties Succeed: Patronage and Ethnic Headcounts inIndia. Cambridge: Cambridge University Press.
Chandra, Kanchan. 2005. Ethnic Parties and Democratic Stability. Perspectives on Politics 3(2):235-252.
Cox, Gary M. 1997. Making votes count: strategic coordination in the world’s electoral systems.New York: Cambridge University Press.
Dunning,Thad and Lauren Harrison. 2010. “Cross-cutting cleavages and ethnic voting: An ex-perimental study of cousinage in Mali.” Forthcoming, American Political Science Review.
Fearon, James. 2003. “Ethnic and Cultural Diversity by Country.” Journal of Economic Growth8 (2): 195" 222.
Gallagher, Michael. 1991. “Proportionality, Disproportionality and Electoral Systems.” ElectoralStudies 10: 3351.
Horowitz, Donald. 1985. Ethnic Groups in Conflict. Berkeley, California: University of Califor-nia Press.
Horowitz, Donald. 1991. A Democratic South Africa? Constitutional Engineering in a DividedSociety. Berkeley, CA: University of California Press.
Johnson, Joel W. and Jessica S. Wallack. “New Electoral Systems Dataset: Electoral Systems andthe Personal Vote.” Typescript, UCSD.
36
Laitin, David D. Identity in formation: The Russian-speaking populations in the new abroad.Ithaca, NY: Cornell University Press.
Lijphart, Arend. 1977. Democracy in Plural Societies. New Haven: Yale University Press.
Lijphart, Arend. 1999. Patterns of Democracy: Government forms and performance in 35 coun-tries. New Haven: Yale University Press.
Lijphart, Arend. 2002. “The wave of power-sharing democracy.” In Andrew Reynolds (ed.), TheArchitecture of Democray: Constitutional Design, Conflict Management, and Democracy.Oxford: Oxford University Press.
Lijphart, Arend. 2004. “Constitutional Design for Divided Societies.” Journal of Democracy 15(2): 96-109.
Massey, Douglas S. and Nancy A. Denton. 1988. “The Dimensions of Residential Segregation.”Social Forces 67(2): 281-315.
Ordeshook, Peter C. and Olga V. Shvetsova. 1994. “Ethnic Heterogeneity, District Magnitudeand the Number of Parties.” American Journal of Political Science 38(1):100-23.
Posner, Daniel N. 2004a. “The Political Salience of Cultural Difference: Why Chewas abndTumbukas are Allies in Zambia and Adversaries in Malawi.” American Political ScienceReview 98(4): 529-545.
Posner, Daniel N. 2004b. “Measuring Ethnic Fractionalization in Africa.” American Journal ofPolitical Science 48 (4): 849-863.
Posner, Daniel N. 2005. Institutions and Ethnic Politics in Africa. New York: Cambridge Uni-versity Press.
Reilly, Ben and Andrew Reynolds. 1999. Electoral Systems and Conflict in Divided Societies.Washington, DC: National Academy Press.
Sisk, Timothy D. and Andrew Reynolds. 1998. Electoral Systems and Conflict Management inAfrica. Washington, DC: US Institute of Peace Press.
Taagepera, Rein and Bernard Grofman. 2003. “Mapping the indices of seat-votes disproportion-ality and inter-election volatility.” Party Politics 9(6): 659-77.
Treisman, Daniel. 2002. “Defining and Measuring Decentralization: A Global Perspective.”Typescript: UCLA.
Tsebelis, George. 1990. “Elite Interaction and Coalition Building in Consociational Democra-cies.” Journal of Theoretical Politics 2: 5-29.
37