Measuring Environmental Volatile Organic … Environmental Volatile Organic Compounds by U.S ......
12
Introduction U.S. Environmental Protection Agency (EPA) Method 8260B 1 is an environmental method for analy- sis, identification and quantifica- tion of volatile organic compounds (VOCs) that have boiling points below 200 °C. The method speci- fies gas chromatography/mass spectrometry (GC/MS) analysis and is widely used in the U.S. and internationally for a variety of sample matrices. These matri- ces are covered in the U.S. by the Resource Conservation and Recovery Act (RCRA) program and may include ground and surface water, sludge, waste solvents, oily wastes, soils and sediments. It is a challenging method with rigorous quality- control requirements. It also covers a wide concentration range and accommodates both clean and complex matrices. This application note demonstrates the use of a new sample-introduc- tion technology (incorporated in the PerkinElmer ® TurboMatrix ™ HS-110 Trap) for U.S. EPA Method 8260B. The TurboMatrix HS-110 Trap is an enhanced static head- space system with a built-in trap that pre-concentrates and focuses VOCs prior to injection into the GC. The TurboMatrix headspace trap system was used in conjunction with a PerkinElmer Clarus ® 500 GC/MS. Results demonstrating compliance with U.S. EPA Method 8260B (henceforth referred to as ‘8260B’) are presented here. A summary of the method is available on Page 11. Measuring Environmental Volatile Organic Compounds by U.S. EPA Method 8260B with Headspace Trap GC/MS A P P L I C A T I O N N O T E GAS CHROMATOGRAPHY www.perkinelmer.com Author Heidi Griffith PerkinElmer Life and Analytical Sciences 710 Bridgeport Avenue Shelton, CT 06484 USA
Transcript of Measuring Environmental Volatile Organic … Environmental Volatile Organic Compounds by U.S ......

Introduction
U.S. Environmental ProtectionAgency (EPA) Method 8260B1 isan environmental method for analy-sis, identification and quantifica-tion of volatile organic compounds(VOCs) that have boiling pointsbelow 200 °C. The method speci-fies gas chromatography/massspectrometry (GC/MS) analysisand is widely used in the U.S.and internationally for a varietyof sample matrices. These matri-ces are covered in the U.S. by the Resource Conservation andRecovery Act (RCRA) programand may include ground andsurface water, sludge, wastesolvents, oily wastes, soils andsediments. It is a challengingmethod with rigorous quality-control requirements. It alsocovers a wide concentration
range and accommodates bothclean and complex matrices.
This application note demonstratesthe use of a new sample-introduc-tion technology (incorporated inthe PerkinElmer® TurboMatrix™
HS-110 Trap) for U.S. EPA Method8260B. The TurboMatrix HS-110Trap is an enhanced static head-space system with a built-in trapthat pre-concentrates and focusesVOCs prior to injection into the GC.
The TurboMatrix headspace trapsystem was used in conjunctionwith a PerkinElmer Clarus® 500GC/MS. Results demonstratingcompliance with U.S. EPA Method8260B (henceforth referred to as‘8260B’) are presented here.
A summary of the method isavailable on Page 11.
Measuring Environmental Volatile Organic Compounds by U.S. EPA Method 8260B with Headspace Trap GC/MS
AP
PL
IC
AT
IO
N
NO
TE
GA
S C
HR
OM
AT
OG
RA
PH
Y
www.perkinelmer.com
Author Heidi Griffith
PerkinElmer Life andAnalytical Sciences 710 Bridgeport AvenueShelton, CT 06484 USA
Experimental
System setup and conditioning
Method 8260B requires GC/MS fordata acquisition, so all sampleanalyses were performed using thePerkinElmer Clarus 500 GC/MSsystem. The most common sample-preparation technique for 8260B isprovided by U.S. EPA Method 5030,which recommends purge and trap.The TurboMatrix HS-110 Trap wasused here as an alternative sample-preparation technique to purge andtrap. All instrument parameters andmethod conditions for the integratedsystem are presented in Table 1.
Before beginning 8260B analysis, theGC/MS system should be conditionedand prepared for use. The GC columnshould be baked out (with heliumflow) overnight at 250 °C. Duringbakeout, the column should not be connected to the MS, to avoidunnecessary contamination of theMS ion source. Similarly, the MSshould be conditioned by residingat high vacuum for several hours(preferably overnight) to removeresidual water from the system.
After conditioning, the MS systemshould be vented with dry nitrogen,in order to accept the newly condi-tioned column. While the MS isvented, the GC should also beconnected to the headspace trap.The heated headspace transfer lineis connected to the GC injector portwith an injector adapter. The head-space-trap fused-silica transfer lineshould be fed completely throughthe injector port so approximately20 cm resides in the oven and shouldthen be connected to the GC columnby using a universal capillary-columnconnector. Table 7 (Page 10) providesa list of PerkinElmer parts requiredfor connecting the headspace trap to the GC/MS.
2
Table 1. Instrument Parameters.
Sample Introduction PerkinElmer TurboMatrix HS-110 Trap
Needle Temperature 90 °C
Transfer Line Temperature 120 °C
Oven Temperature 80 °C
Trap Low Temperature 40 °C
Trap High Temperature 280 °C
Dry Purge (Helium) 5 min
Trap Hold Time 6 min
Desorb Time 0.5 min
Thermostatting Time 10 min
Pressurization Time 1 min
Decay Time 2 min
Outlet Split 20 mL/min
Column Pressure 25 psi
Vial Pressure 35 psi
Desorb Pressure 10 psi
Transfer Line Deactivated Fused Silica 20 m x 320 µm
Gas Chromatograph PerkinElmer Clarus 500 GC
Headspace Connector Universal Connector
Oven Program Initial Temperature 40 °C
Hold Time 1 2 min
Ramp 1 10 °C/min to 100 °C
Hold Time 2 0 min
Ramp 2 30 °C/min to 240 °C
Hold Time 3 5 min
Equilibration Time 0.5 min
Vacuum Compensation On
Headspace Control On
Column Elite Volatiles – 30 m x 250 µm x 1.4 µ film
Carrier Gas Helium
Mass Spectrometer PerkinElmer Clarus 500 MS
Mass Range 35-300 u
Solvent Delay Time 0 min
Scan Time 0.10 sec
InterScan Delay Time 0.10 sec
Transfer Line Temperature 200 °C
Source Temperature 200 °C
Multiplier 350 V
Trap Emission 75 µA
Threshold 0
Software TurboMass 5.0 with Reporting

A 20:1 split ratio was chosen andprovided by the outlet split of theheadspace-trap system. Alternativegas-flow options are to close theoutlet split on the headspace trapand to run in splitless mode or toconnect the headspace transfer lineinside of the injector port and usethe GC injector split.
Initial MS tuning and optimization
The MS was set up for electron im-pact (EI) ionization at the 8260B-specified 70 eV and a full AutoTunewas performed and saved. SeeFigure 1 for the AutoTune generatedparameters. After AutoTune, themultiplier was decreased to 350 Vand the emission current decreasedto 75 µA because the headspace trapprovided so much sensitivity thatthe MS sensitivity could be reducedto prolong filament life, increasestability and extend linearity forhigher concentrations.
Using the standard AutoTune param-eters without modification shouldproduce acceptable results, as long asthe multiplier voltage is not set toohigh. The correct multiplier voltagecan by determined by checking thelinearity of a calibration curve. Ifthe calibration curve begins to exhibitnon-linear behavior at the highestconcentration standard(s), then thedetector may be saturating. If thisoccurs, the multiplier voltage shouldbe lowered in 50 V increments andthe calibration standards re-run.
Instrument EPA tuning
Method 8260B requires the analysisof a 5 to 50 ng 4-bromofluorobenzene(BFB) standard in methanol to checkfor specified ion ratios (Figure 2).This EPA tuning spectrum is calcu-lated using, at a minimum, an average
3www.perkinelmer.com
Figure 1. Instrument tuning parameters after full AutoTune.
Figure 3. 4-Bromofluorobenzene (BFB) injection – 25 µg/L, with spectral results.
Figure 2. BFB tuning criteria for U.S. EPA 8260B.
of the three-peak-apex spectra andthen subtracting out the background(Figure 3). This EPA instrument-tuning check must be done onceevery 12 hours. After a BFB tune issuccessfully completed, instrumentparameters must remain unchangedfor all subsequent analyses until thenext BFB tune is performed. Con-sequently, any change to the inte-grated system requires this BFB testto be passed before data acquisitioncan resume.
Figure 3 shows a BFB injection at a 25-µg/L concentration acquiredunder identical conditions as thoseused for the 8260B analyses. TheBFB standard was prepared byspiking 5 µL of a 2500-µg/L BFBstandard into 10 mL of organic-freewater (in a standard 22-mL head-space vial) and injected using theheadspace trap. Figure 2 demon-strates the ability of the integratedsystem to pass the BFB test.
4
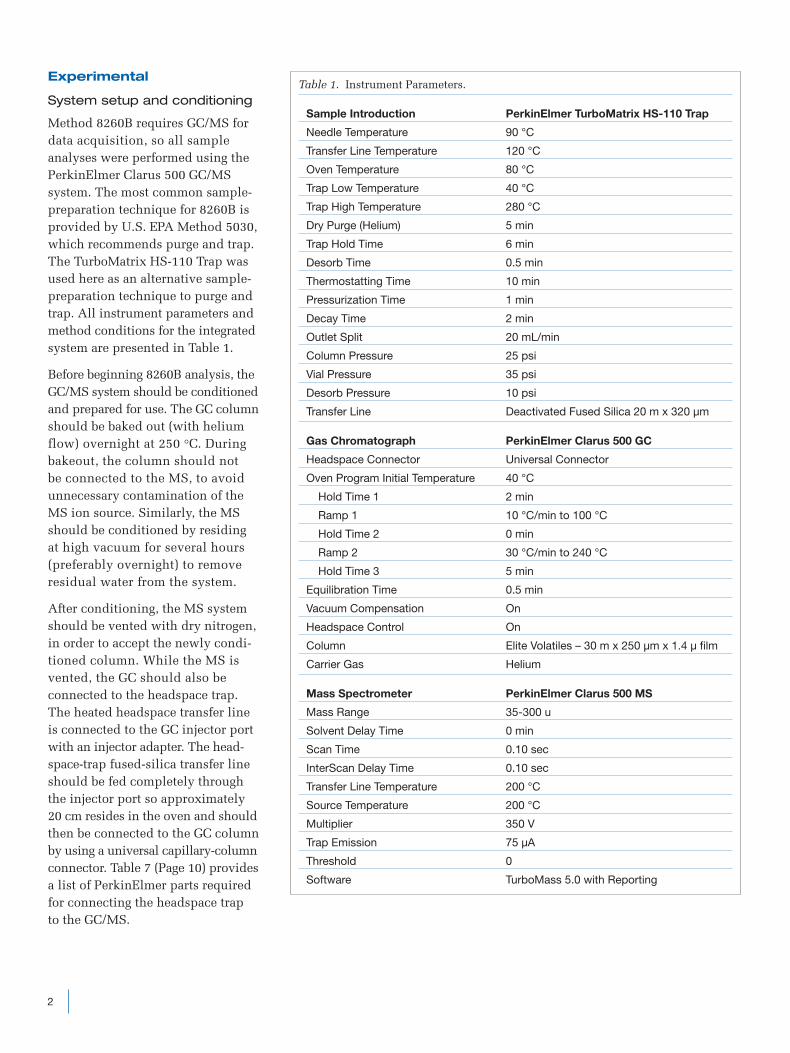
Table 2. Calibration Amount to be Added to 100-mL Volumetric Flasks.
Calibration Water-standard Secondary Standard-stockStandard Concentration Level Solution Added
1 5 µg/L 20 µL
2 20 µg/L 80 µL
3 50 µg/L 200 µL
4 100 µg/L 400 µL
5 200 µg/L 800 µL
Table 3. Example Response Factor Table from Initial Calibration.
RRF RRF RRF RRF RRF Average %Compound Level 1 Level 2 Level 3 Level 4 Level 5 RRF RSD
Bromochloromethane 0.082 0.063 0.067 0.063 0.066 0.068 11.71
Chloroform 0.253 0.252 0.252 0.235 0.269 0.252 4.70
Carbon Tetrachloride 0.223 0.233 0.242 0.230 0.261 0.238 6.10
Methyl Acrylate 0.070 0.066 0.069 0.066 0.079 0.070 7.61
Tetrahydrofuran 0.059 0.052 0.050 0.051 0.062 0.055 9.39
Dibromofluoromethane 0.172 0.174 0.162 0.148 0.137 0.159 10.09
Calibration standardspreparation
Good laboratory practice must be followed at all times
All glassware and syringes must beproperly cleaned for trace analysis.All methanol used must be of pesti-cide quality or equivalent and mustbe kept away from all other solvents.All water used must be organic-free reagent water. This is describedin detail in Chapter One of the EPASW-846 methods.
Quantification according to 8260Bis accomplished by processing afive-concentration-level calibrationcurve that encompasses the pre-dicted typical sample concentration.Each level of this curve compares thetarget ion of each compound with itscorresponding internal standardtarget ion. Typical environmentallaboratories run a 5-200 µg/L curveand this is demonstrated here.
Preparation of secondarystandard-stock solution
A standard-stock solution containingall target analytes was prepared fromtwo primary certified calibrationmixes. 125 µL of a 2000-µg/mLVOC standard (Restek Corporation,Bellefonte, PA) was added to slightlyless than 10 mL of methanol in a10-mL volumetric flask. An addi-tional 125 µL of a ‘gas’ calibrationmix (Restek) was added to the flaskand then the flask was filled to the10-mL line with methanol. Thisstandard-stock mix was kept in a freezer until the final water stan-dards were prepared. Standardswere prepared fresh on a weeklybasis (especially important if theyinclude the gas calibration mix). If the standards are to be preparedindividually (not purchased from acertified standard company), refer to 8260B for instructions. Table 7(Page 10) provides a list of standardsavailable from Restek that were usedin this experiment.
Preparation of internal standardand surrogate solution
All samples and calibration standardswere spiked with both internalstandards and surrogates. Both theinternal standard solution and thesurrogates (Restek) were preparedby adding 200 µL of each 2500-µg/mL

mix to 9 mL of methanol in a 10-mLvolumetric flask. Then the balancewas filled with methanol. Thisyielded a final concentration of 50 µg/mL.
Preparation of working concen-trations of water standards
Five 100-mL volumetric flasks werefilled with approximately 95 mL ofwater. Each flask was labeled withits concentration level and thenspiked with the correct amount ofsecondary stock standard, then thebalance filled with water to 100 mL.See Table 2 for the stock solutionrequired for each water-standardcalibration level.
Preparation of headspace-vialcalibration standards
10 mL of each prepared water-stand-ard calibration level was transferredto a separate headspace-trap vial.Each vial was spiked with 10 µL ofthe internal standard/surrogate mix,resulting in a final concentration of50 µg/L for each internal standardand surrogate in the water solution.All vials were sealed immediatelyafter adding the internal standardand surrogate mix.
All five levels of working water-standards vials were labeled andtransferred to the headspace-trapanalyzer in preparation for analysis.In addition, a water-blank samplewas added both before and after thewater-standards sample queue tocheck for potential carryover.
Results
A minimum of five calibration levelsis required for 8260B. All calibrationsamples must be above the minimumdetection limits, yet bracket theexpected concentrations of the realsamples. All standards must containthe analytes of interest.
5www.perkinelmer.com
Method 8260B requires that eachsample be processed using an internalstandard method. This calculationis a response factor (RF) based onthe target ion in the compound ofinterest and the internal standardtarget ion (Equation 1). Each com-pound at each level will have an RFthat is dependent on its respectiveinternal standard. There are threeinternal standards analyzed in this application (fluorobenzene,chlorobenzene-d5 and 1,4-dichloro-benzene-d4). The internal standardclosest in retention time to thetarget analyte is used in the RFcalculation for each compound.
Equation 1. Calculation of Response Factor.
RF = (Area of analyte x Concentration ofinternal standard) / (Area of internalstandard x Concentration ofstandard)
Once all RFs are generated, thepercent relative standard deviation(%RSD) is calculated for all fivelevels. An example of this calcula-tion is presented in Table 3. Eachcompound must be below a 15%RSD threshold to continue with the
method. If the compound does notpass the 15% limit, then it shouldbe processed using alternate curvemethods that are outlined in U.S.EPA Method 8000B2, or the initialcalibration must be re-run.
This application note provides datafor 77 volatile compounds listed inTable 4. These 77 compounds aretypical of a full 8260B analysis.Figure 4 is an example chromatogramof a 50-µg/L standard injection,including all compounds of interest,three internal standards and threesurrogates. In addition, six of thecompounds of interest are calibrationcheck compounds (CCCs) and fiveare system performance checkcompounds (SPCCs). The SPCCs aremonitored because they are knownto degrade if there are any active sitesin the sample path or other instru-ment contamination. The CCCs aremonitored for stability of the calibra-tion curve during sample analysis.See Table 4 to identify which com-pounds are SPCCs and CCCs.
0.34 1.34 2.34 3.34 4.34 5.34 6.34 7.34 8.34 9.34 10.34 11.34 12.34 13.34 14.34Time0
100
%
Scan EI+TIC
2.56e8
8.70
8.53
6.682.23
1.44
1.83
4.96
4.54
3.302.80 4.20
3.77
5.12
5.665.93
8.477.11
7.417.69
10.48
10.179.53
9.18
10.8111.22
12.72
11.35
13.22
50 ppb Standard with Internal Standards and Surrogates
826050ppb0022
Figure 4. Mid-point level calibration standard chromatogram – 50 µg/L per target analyte.

MDL results
The method detection limits (MDLs)for this method were calculated(Equation 2) using the procedureoutlined in Chapter One of SW-846analytical methods. Water blankswere analyzed to determine thebaseline and nine samples wereprepared at 0.5 µg/L. This concen-tration was determined to be approxi-mately 2.5 to 5 times the potentialdetection limit.
Each individual analyte’s MDL wasobtained by multiplying the standarddeviation by the appropriate one-sided 99% t-statistic. The standarddeviation of the determined concen-tration was calculated from the ninesample analyses and then, using thet-statistic, the MDL was calculated.This gives a 99% confidence levelusing a standard-deviation estimatewith n-1 degrees of freedom. In addi-tion, each compound was manuallyverified for correct response. SeeTable 4 for the complete list of MDLs.
Equation 2. Method Detection Limit(MDL) calculation.
MDL = t(n-1, a = .99)(s)
The MDLs calculated for these analy-ses were very low and the precisionwas excellent. They were wellwithin the requirements of 8260B.
It is possible to achieve even lowerMDLs by modifying or optimizinginstrument parameters. For exam-ple, modifying MS instrumentsettings (i.e., higher multipliervoltage or emission current) orusing a lower split ratio can resultin improved MDL numbers thanthose presented here.
Table 4. Calibration Table for all 77 VOCs.
% RSD SPCCSample Retention Primary Avg. % Required Corr. Check MDLType Compound Name Time1 Ion RF RSD to Pass Coeff. 2 (Minimum)3 (ppb)
Target Dichlorodifluoromethane 1.27 85 0.50 14.37 15% 0.99988 – 0.03
SPCC Chloromethane 1.40 50 0.38 12.80 15% 0.99461 0.39 (0.10) 0.04
CCC Vinyl Chloride 1.45 62 0.52 7.61 30% 0.99895 – 0.18
Target Bromomethane 1.66 94 0.19 9.21 15% 0.99666 – 0.22
Target Chloroethane 1.74 64 0.03 13.36 15% 0.97185 – 0.50
Target Trichlorofluoromethane 1.83 101 0.44 11.59 15% 0.99260 – 0.05
Target Diethylether 2.07 74 0.08 7.71 15% 0.99917 – 1.10
CCC 1,1-Dichloroethene 2.22 96 0.34 5.80 30% 0.99989 – 0.11
Target Carbon Disulfide 2.59 76 0.11 10.13 15% 0.99980 – 0.14
Target Allyl Chloride 2.59 76 0.34 10.94 15% 0.99959 – 0.07
Target Methylene Chloride 2.68 84 0.18 5.22 15% 0.99989 – 0.15
Target trans-1,2-Dichloroethene 2.81 96 0.30 6.50 15% 0.99979 – 0.13
SPCC 1,1-Dichloroethane 3.32 63 0.44 3.28 15% 1.00000 0.45 (0.10) 0.06
Target Chloroprene 3.29 88 0.23 8.40 15% 0.99965 – 0.10
Target Acrylonitrile 3.30 53 0.35 10.08 15% 0.99985 – 0.07
Target cis-1,2-Dichloroethene 3.79 96 0.21 5.04 15% 0.99992 – 0.12
Target 2,2-Dichloropropane 3.88 77 0.28 10.34 15% 0.99933 – 0.42
Target Bromochloromethane 3.96 128 0.06 3.87 15% 0.99986 – 0.81
CCC Chloroform 4.04 83 0.28 3.34 30% 0.99999 – 0.07
Target Carbon Tetrachloride 4.14 117 0.22 10.79 15% 0.99950 – 0.11
Target Methyl Acrylate 4.17 55 0.07 9.92 15% 0.99977 – 0.21
Target Tetrahydrofuran 4.18 42 0.04 11.87 15% 0.99929 – 0.70
Surrogate Dibromofluoromethane 4.12 111 0.16 3.29 NA NA – NA
Target 1,1,1-Trichloroethane 4.22 97 0.41 9.18 15% 0.99976 – 0.10
Target 1,1-Dichloropropene 4.34 75 0.40 9.05 15% 0.99922 – 0.40
Target Benzene 4.56 78 0.96 6.32 15% 0.99988 – 0.07
Target Propionitrile 4.61 54 0.01 7.54 15% 0.99968 – 0.58
Target Methacrylonitrile 4.63 67 0.03 10.67 15% 0.99938 – 0.60
Target 1,2-Dichloroethane 4.76 62 0.11 3.56 15% 0.99995 – 0.18
Int. Std. Fluorobenzene 4.97 96 NA NA NA NA – NA
Target Trichloroethylene 5.14 95 0.29 5.86 15% 0.99959 – 0.10
Target Dibromomethane 5.56 93 0.04 10.10 15% 0.99960 – 1.00
CCC 1,2-Dichloropropane 5.68 63 0.16 2.74 30% 0.99999 – 0.40
Target Bromodichloromethane 5.76 83 0.13 5.14 15% 0.99979 – 0.10
Target Methyl Methacrylate 5.95 69 0.08 14.69 15% 0.99885 – 0.78
Target cis-1,3-Dichloropropene 6.44 75 0.10 8.34 15% 0.99623 – 0.22
Surrogate Toluene-d8 6.64 98 0.99 2.82 NA NA – NA
CCC Toluene 6.70 91 1.08 5.05 30% 0.99988 – 0.06
1 Using Elite Volatiles Column – 30 m x 250 µm x 1.4 µ film.2 Linear regression using internal standard (5-200 µg/L).3 SPCC response factor (min. pass value).
(cont. next page)
6

Table 4. Calibration Table for all 77 VOCs (continued).
% RSD SPCCSample Retention Primary Avg. % Required Corr. Check MDLType Compound Name Time1 Ion RF RSD to Pass Coeff. 2 (Minimum)3 (ppb)
Target Tetrachloroethylene 7.12 164 0.67 10.30 15% 0.99547 – 0.12
Target trans-1,3-Dichloropropene 7.20 75 0.16 10.11 15% 0.99908 – 0.26
Target 1,1,2-Trichloroethane 7.38 97 0.17 9.05 15% 0.99989 – 0.26
Target Ethyl Methacrylate 7.43 69 0.19 11.83 15% 0.99907 – 0.25
Target Dibromochloromethane 7.58 129 0.16 10.38 15% 0.99952 – 0.14
Target 1,3-Dichloropropane 7.71 76 0.23 8.73 15% 0.99992 – 0.16
Target 1,2-Dibromoethane 7.84 107 0.12 13.50 15% 0.98877 – 1.00
Int. Std. Chlorobenzene-d5 8.47 117 NA NA NA NA – NA
CCC Ethylbenzene 8.54 91 2.27 5.53 30% 0.99996 – 0.03
SPCC 1,1,1,2-Tetrachloroethane 8.57 131 0.32 2.29 15% 0.99979 0.32 (0.30) 0.16
SPCC Chlorobenzene 8.49 112 0.99 1.25 15% 0.99998 1.00 (0.30) 0.08
Target p,m-Xylene 8.54 106 0.76 7.60 15% 0.99990 – 0.09
Target o-Xylene 8.72 106 1.74 9.45 15% 0.99998 – 0.07
SPCC Bromoform 9.25 173 0.12 3.09 15% 0.99988 0.11 (0.10) 0.50
Target Styrene 9.25 104 0.80 10.25 15% 0.99997 – 0.07
Target Isopropylbenzene 9.53 105 2.42 12.11 15% 0.99989 – 0.06
Surrogate Bromoflurorobenzene 9.81 95 0.90 0.67 NA NA – NA
Target Bromobenzene 9.90 156 0.73 3.45 15% 0.99981 – 0.38
Target n-Propylbenzene 9.97 91 6.83 7.17 15% 0.99990 – 0.06
Target 1,1,2,2-Tetrachloroethane 10.05 83 0.46 7.56 15% 0.99694 – 0.24
Target 2-Chlorotoluene 10.11 91 2.62 4.71 15% 0.99998 – 0.12
Target 1,2,3-Trichloropropane 10.23 75 0.13 3.65 15% 0.99909 – 0.44
Target 1,3,5-Trimethylbenzene 10.18 105 4.34 8.71 15% 0.99995 – 0.06
Target 4-Chlorotoluene 10.28 91 2.62 2.93 15% 0.99998 – 0.09
Target Pentachloroethane 10.50 167 0.38 13.63 15% 0.97725 – 0.50
Target tert-Butylbenzene 10.49 119 4.50 11.28 15% 0.99996 – 0.05
Target 1,2,4-Trimethylbenzene 10.56 105 3.64 8.06 15% 0.99993 – 0.04
Target sec-Butylbenzene 10.67 105 69.96 10.95 15% 0.99979 – 0.07
Target p-Isopropyltoluene 10.82 119 5.40 11.36 15% 0.99982 – 0.07
Target 1,3-Dichlorobenzene 10.86 146 1.56 0.78 15% 0.99998 – 0.52
Int. Std. 1,4-Dichlorobenzene-d4 10.94 152 NA NA NA NA – NA
Target 1,4-Dichlorobenzene 10.95 146 1.40 1.45 15% 0.99988 – 0.13
Target n-Butylbenzene 11.23 91 5.31 8.82 15% 0.99945 – 0.07
Target 1,2-Dichlorobenzene 11.36 146 1.19 3.82 15% 0.99967 – 0.04
Target 1,2-Dibromo- 3-chloropropane 12.13 75 0.06 10.56 15% 0.99940 – 0.91
Target 1,2,4-Trichlorobenzene 12.76 182 1.46 8.25 15% 0.99630 – 0.02
Target Hexachlorobutadiene 12.73 225 1.46 7.26 15% 0.99812 – 0.08
Target Naphthalene 13.06 128 1.31 7.01 15% 0.99897 – 0.01
Target 1,2,3-Trichlorobenzene 13.23 180 0.89 8.32 15% 0.99854 – 0.02
1 Using Elite Volatiles Column – 30 m x 250 µm x 1.4 µ film.2 Linear regression using internal standard (5-200 µg/L).3 SPCC response factor (min. pass value).
7www.perkinelmer.com

Surrogate recovery results
Surrogates are measured periodicallyduring 8260B analyses to monitor the% recovery of samples (Equation 3).When a known quantity is injectedand an area response is obtained, a similar response is expected for a repeat injection at a later time.Three of the standard surrogateslisted in 8260B are listed in Table 5,along with their actual % recover-ies. In all cases, throughout thecourse of the analyses, the surro-gates were well within the limits of 8260B requirements.
Stability
There are multiple ways to checkfor system stability and repro-ducibility, while performing 8260Banalyses. During this experiment,two different checks were performed.The first check was for stability ofthe internal standards. This is vitalto the response factor calculations.If the internal standard’s signalfluctuates, the continuing calibrationsample %RSDs will exceed 20%.
Equation 3. Surrogate recovery calculation.
Recovery (%) = (Concentration found /Concentration added) x 100
If this occurs, the system will needto be re-tuned and the full calibra-tion re-run. Therefore, the longerthe internal standard area countsremain stable, the longer samplescan be injected and pass the methodrequirements for reporting purposes.
Using the 77-compound mix, theinternal standard areas were moni-tored for 24 hours. Chlorobenzene-d5exhibited a standard deviation of4.3, demonstrating very high stabilityfor the integrated system (Figure 5).All other internal standards showedsimilar results.
The second stability check was per-formed on the surrogate compounds.The surrogates must fall within per-centages outlined by the U.S. EPA(Table 5). The data in Figure 6demonstrates that the system passedthis test easily over a 24-hour periodof time.
System performance checkcompounds (SPCCs)
During 8260B analysis, the SPCCsmust be monitored with every calibra-tion curve and every 12 hours. SixSPCCs are monitored and they must meet or exceed the requiredminimum response factors. If theSPCCs do not meet the responsefactor requirements, the systemneeds to be evaluated and correctiveaction taken. Possible problemsmight be injector contamination,column contamination or activesites in the sample path.1
Table 6 lists the minimum responsefactors for the SPCCs along with theactual values determined (Table 4).The TurboMatrix HS Trap systempassed these checks easily, demon-strating no contamination or activesites in the sample path. At justover 0.1 RF, the closest compoundto the limit was bromoform.
8
Table 5. Surrogate Recovery Data.
8260B Restriction Surrogate ActualSurrogate Compound Limits in Water (%) Injection Recovery (%)
4-Bromofluorobenzene 86-115 1 104
2 102
3 100
4 102
5 97
Toluene-d8 88-110 1 98
2 98
3 99
4 100
5 100
Dibromofluoromethane 86-118 1 108
2 101
3 96
4 92
5 88
Table 6. Minimum Response Factors for the SPCCs.
System Performance Minimum ActualCheck Compounds Response Response(SPCCs) Factor Factor
Chloromethane 0.10 0.39
1,1-Dichloroethane 0.10 0.45
Bromoform 0.10 0.11
Chlorobenzene 0.30 1.00
1,1,1,2-Tetrachloroethane 0.30 0.32

However, over the 24-hour testingtime, it still met 8260B requirementsand remained stable.
Discussion
The headspace trap utilizes analternative sample-handling tech-nology to that used in purge-and-trap systems. Purge-and-trap systemsare constrained by their purgingefficiencies. For example, chloro-methane is likely to be lost if thepurge flow is too fast, yet bromo-form is a compound that has verypoor purging efficiency. A typical%RSD for bromoform is usuallyvery close to 15% and can be muchhigher. The headspace trap typicallyhas a bromoform %RSD of less than5% because of the good partitioncoefficient bromoform has at highertemperatures. A calibration curvefor bromoform is shown in Figure 7.
The headspace trap uses heat toextract (partition) the compoundsout of the water (into the headspace)instead of purging. For this applica-tion, the TurboMatrix HS Trap offersthe following advantages:
• Easy and convenient samplepreparation
• Reduced levels of water extracted from the sample
• Increased sample throughput byoverlapping the thermostatting
• No need to clean delicate glassware between injections
• No need to purge the lines toremove residual contamination
• No risk of sample foam contami-nating the purge-and-trap device
• No cross-contamination ofsamples from using the same purge vessel
Overlapped thermostatting of theheadspace samples is achieved byheating multiple samples at a time.
9www.perkinelmer.com
Surrogate RecoveriesToluene-d8
30
50
70
90
110
130
150
1 2 3 4 5 6 7 8 9 10 11 12 13 14 15 16 17 18 19 20 21
110% Limit
88% Limit
Figure 6. Surrogate recovery for toluene-d8 (50-µg/L injection).
Internal Standard StabilityChlorobenzene-d5
150000
170000
190000
210000
230000
250000
270000
290000
310000
330000
1 2 3 4 5 6 7 8 9 10 11 12 13 14 15 16 17 18 19 20 21
Standard Deviation = 4.3
Figure 5. Internal standard stability for chlorobenzene-d5 (50-µg/L injection).
0.0 20.0 40.0 60.0 80.0 100.0 120.0 140.0 160.0 180.0 200.0
BromoformCoefficient of Determination =0.999729Response Type: Internal StandardCurve Type: Linear
Figure 7. Calibration curve for bromoform (5-200 µg/L).
Res
pon
se
µg/L
Injection Number
% R
ecov
ery
Are
a C
ount
s
Injection Number

By overlapping the thermostattingstep with the headspace trap, theGC now becomes the rate-limitingstep in the overall analysis, not thesampling device. When using apurge-and-trap sample-introductionsystem, each sample must be ther-mostatted and purged separately,making this the rate-limiting step.
Headspace-trap technology is basedon two well established techniques:equilibrium headspace samplingand thermal desorption. These twotechniques are combined in thisinstrument to provide the opera-tional convenience of headspace,but achieve the detection limitsobserved using thermal desorptionsystems. The headspace technologyperforms the initial extraction of theanalytes from the aqueous sample.The migration of each analyte intothe headspace vapor from theaqueous sample is dictated by itspartition coefficient.3 Fortunately,in the case of many 8260B targetanalytes, the partition coefficientsare very favorable at the elevatedtemperatures used in headspacemethods. The system is thereforeable to sweep a significant and
reproducible fraction of the analytesfrom the sample and into the thermal-desorption trap, where they areretained and focused on an opti-mized adsorbent packing.
For analytes with less favorablepartition coefficients, the extractionefficiency can be improved with atechnique called salting. The additionof inorganic salts into the aqueoussample favors the partition towardsthe headspace and significantlyimproves the extraction efficiency.
Once the analytes have been extract-ed and transferred, the trap is thendry-purged to eliminate most of themoisture, which would otherwiseinterfere with the chromatographicanalysis. Finally, the trap is heated at2400 °C/min with carrier gas passingthrough it to carry the desorbedanalytes as a narrow band into theGC/MS system for analysis.
An example of a U.S. EPA-approvedmethod utilizing headspace technol-ogy is Method 5021 (Volatile OrganicCompounds in Soil and Other SolidMatrices Using Equilibrium Head-space Analysis).
Conclusions
U.S. EPA 8260B is a challengingmethod used in a majority of U.S.and many international environ-mental laboratories for the analysisof VOCs. It is a complex method thatrequires multiple quality criteria bepassed throughout the analysis. Asdemonstrated here, the PerkinElmerClarus 500 GC/MS system config-ured with a TurboMatrix HS-110Trap meets all the 8260B methodrequirements. This includes, but isnot limited to: instrument tuning,minimum detection limits, initialcalibration, surrogate recovery and system-performance checks.
This application note demonstratesthe successful use of headspace-traptechnology to perform the samplehandling required for 8260B. Allcompounds determined passed the8260B %RSD requirements, and allSPCCs met their minimum RF values(Table 6). Correlation coefficients(using linear regression) are alsoincluded in the calibration table toprovide additional information onindividual compound performance.
This application note providesdetails and suggestions on how to usea new sample-handling technologyto comply with U.S. EPA Method8260B. In addition to method compli-ance, this technology providessignificant advantages over purgeand trap to recover compounds withpoor purging efficiencies. Systemcleanup is easier because theheadspace vials are disposable andnot reused, reducing the chance ofcarryover and the need for cleaning.In addition to 8260B, other VOCmethods may also be run using thisconfiguration. For example, U.S.EPA Method 524.2 for VOCs indrinking water is a similar methodwith lower detection limits, thatwould benefit from this technology.
10
Table 7. Parts and Standards Used for U.S. EPA Method 8260B.
PerkinElmer Part Numbers Description
B0505266 HS Injector Adapter
N9301357 Deactivated Fused Silica 5 m x 320 µm
N9316388 Elite Volatiles – 30 m x 250 µm x 1.4 µ film
N9302149 Universal Connector
Restek Part Numbers Description
30475 2000 µg/mL VOC standard
30042 Gas Standard (2000 µg/mL)
30241 Internal Standards (2500 µg/mL)
30240 Surrogates (2500 µg/mL)

11www.perkinelmer.com
Summary of method
1. Set up instruments (Headspace Trap and GC/MS), per PerkinElmer service specifications.
2. Attach instruments and set up methods as described in the instrument-parameters section of this application note.
3. Run a blank water sample to look for impurities in the water or contamination in the system.
4. Perform a bromofluorobenzene (BFB) test as outlined in the tuning section of this application note.
5. When the BFB test passes, run five levels of calibration standards that are in the range of expectedsample-compound concentrations. The typical U.S. EPA 8260B calibration curve is from 5 to 200 µg/L.
6. Calculate the response factor (RF) for all compounds at all levels and the %RSD for the complete five levels. If all %RSDs are lower than 15% (30% for some compounds), proceed; if not, check the instrument and re-run the initial calibration curve. Possible modifications include: lowering the detector voltage, checking for leaks or changing the split ratio.
7. Run a water blank to check for interferences.
8. Run a matrix spike, then a matrix-spike duplicate and verify results. See U.S. EPA Method 8260B for instructions.1 These standards should be representative of the compounds being monitored. At a minimum, the spike is required to contain: 1,1-dichloroethene, trichloroethene, chlorobenzene, toluene and benzene.
9. Check system stability through surrogate recovery (see the section on surrogate recovery; Table 5 and Figure 6) and internal standard retention times . See U.S. EPA Method 8260B for instructions.1
10. Run samples.
11. In each work group of samples (you can define this as you wish), or every 20 samples, or at leastonce per day, a laboratory control sample (LCS) must be run. This sample must consist of a clean matrix similar to the sample matrix and be of the same weight and volume. This LCS should then be spiked with the same analytes as the matrix spike. The LCS results are used to verify that the laboratory can perform the analysis in a clean matrix.1
12. Every 12 hours, three instrument calibration checks must be performed:
• A BFB injection must be repeated and the ion ratios checked. The BFB peak must pass the U.S. EPA parameters (see the section on tuning).
• The system performance check compounds (SPCCs) should be monitored for a minimum RF (Table 6).
• Calibration check compounds (CCCs) should be injected and checked against the initial calibration curve. The %RSD of the CCC should be within 20% drift of the initial calibration %RSD number. See Table 4 for the list of CCCs.
If any of these checks fail, the instrument may need to be cleaned or re-tuned and the initial calibration run again.
Establish method performance
• Check for method detection limits (MDLs) on the system as described in the MDL section of thisapplication note.
• Check for precision by running standards and monitoring the percent recoveries, the standarddeviation of these recoveries and the %RSD.

References
1. “Volatile Organic Compounds byGas Chromatography/MassSpectrometry (GC/MS)”, U.S.Environmental ProtectionAgency, Office of Solid Waste,SW-846 Method 8260B, revision 2,December 1996.
2. “Determinative ChromatographicSeparations”, U.S. EnvironmentalProtection Agency, Office of SolidWaste, SW-846 Method 8260B,revision 2, December 1996.
3. L. S. Ettre and B. Kolb “StaticHeadspace-Gas Chromatography”,Wiley, New York, 1997.
For a complete listing of our global offices, visit www.perkinelmer.com/lasoffices
©2004 PerkinElmer, Inc. All rights reserved. The PerkinElmer logo and design are registered trademarks of PerkinElmer, Inc. TurboMatrix is a trademark and Clarus and PerkinElmer are registered trademarks of PerkinElmer, Inc. or its subsidiaries, in the United States and other countries. All other trademarks not owned by PerkinElmer, Inc. or its subsidiaries that are depicted herein are the property of their respective owners. PerkinElmer reserves the right to change this document at any time without notice and disclaims liability for editorial,pictorial or typographical errors.
006810_03 KG100405 Printed in USA
PerkinElmer Life and Analytical Sciences710 Bridgeport AvenueShelton, CT 06484-4794 USAPhone: (800) 762-4000 or (+1) 203-925-4602www.perkinelmer.com