Entrepreneurial Science Project Curriculum - BIO-1: TALENT ...

1
Measuring Entrepreneurial Talent
Technical Manual
Gorkan AhmetogluTomas Chamorro-Premuzic
Copyright © 2013 by Metaprofiling Ltd. All rights reserved.
No part of this manual may be reproduced in any form of printing or by any other means, electronic or mechanical, including, but not limited
to, photocopying, audiovisual recording and transmission, and portrayal or duplication in any information storage and retrieval system, without
permission in writing from Metaprofiling Ltd.
2
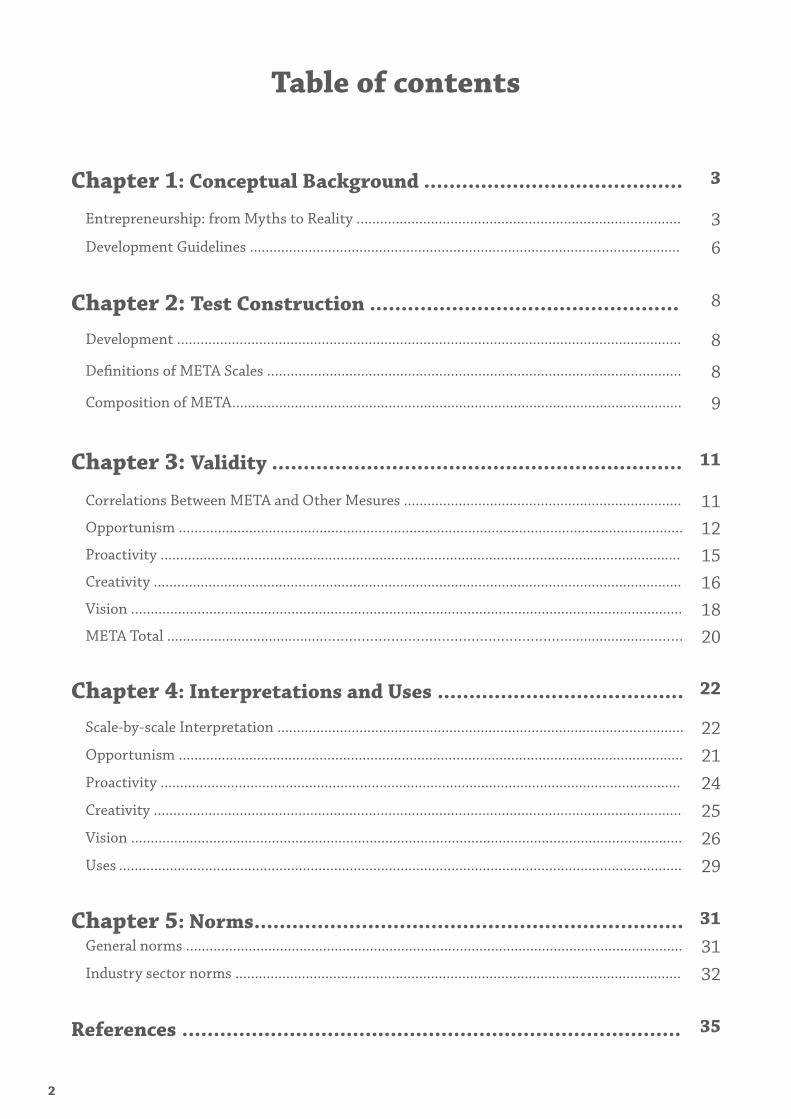
Table of contents
Chapter 1: Conceptual Background ......................................... 3
Entrepreneurship: from Myths to Reality ................................................................................... 3Development Guidelines .............................................................................................................. 6
Chapter 2: Test Construction ................................................. 8
Development ................................................................................................................................. 8
Definitions of META Scales .......................................................................................................... 8
Composition of META................................................................................................................... 9
Chapter 3: Validity ................................................................. 11
Correlations Between META and Other Mesures ....................................................................... 11Opportunism ................................................................................................................................. 12Proactivity ..................................................................................................................................... 15Creativity ....................................................................................................................................... 16Vision ............................................................................................................................................. 18META Total ........................................…………………………………………………........................…… 20
Chapter 4: Interpretations and Uses ....................................... 22
Scale-by-scale Interpretation ........................................................................................................ 22Opportunism ................................................................................................................................. 21Proactivity ..................................................................................................................................... 24Creativity ....................................................................................................................................... 25Vision ............................................................................................................................................. 26Uses ................................................................................................................................................ 29
Chapter 5: Norms.................................................................... 31General norms ............................................................................................................................... 31Industry sector norms .................................................................................................................. 32
References ............................................................................... 35

3
CHAPTER
1Conceptual Background
Entrepreneurship: from Myths to Reality
• People think of entrepreneurs as eccentric billionaires who made their fortunes by coming up with a world-changing idea. However, these flamboyant super-stars could not be more different from the average entrepreneur. Indeed, the profile of the typical entrepreneur is far from exciting.
• The only attributes most entrepreneurs have in common is that they are male, white, mid-dle class, and middle-aged. Furthermore, most entrepreneurs start businesses only to avoid working for someone else; they have little or no interest in innovation and they rarely end up employing other people. As a consequence, over half of new businesses go bankrupt within 5 years of starting1.
• Most innovative start-ups are the results of ideas that originated in existing businesses. Indeed, most business founders were once employed by other people and decided to set up new businesses only because their bosses did not value their ideas. So, instead of contrib-uting value and growth to their employers, they ended up quitting the job.2
• The key challenge for organisations today is to identify, nurture and retain entrepreneurial talent – people with the ability to contribute to business innovation and growth. This is the fundamental issue underlying the war for talent and the most central task in creative tal-ent management. Some people are much more capable of generating innovative business ideas than others, and businesses that fail to identify, engage or retain these entrepreneur-ial individuals will be less likely to grow.
• META is an online tool designed to help businesses detect and develop entrepreneurial potential.
1 Shane (2008). The Illusions of Entrepreneurship. Yale University
2 Chamorro-Premuzic, T. (2012). How bad leadership spurs entrepreneurship. Harvard Business Review, 10th September.

4
What is META?
META is the Measure of Entrepreneurial Talent developed by scientists from the Univer-sity of London. It is an online profiling tool validated using the most rigorous psychomet-ric standards and in collaboration with Harvard’s Entrepreneurial Finance Lab, University College London, and Goldsmiths (as part of a three-year research programme funded by the UK’s Economic and Social Research Council). META was designed to assess individuals’ entrepreneurial potential, that is, their likelihood to contribute to entrepreneurial success, which is defined as innovation-based business growth.
What is Entrepreneurship?
“Entrepreneurs create value and stimulate economic progress by finding new and better ways of doing things. They shift economic resources out of an area of lower and into an area of higher productivity and greater yield. They see and exploit opportuni-ties.”
Jean Baptiste Say & Schumpeter
Entrepreneurship is the genesis of innovation and growth in businesses and societies. It is the very reason why certain organisations grow and make a bigger economic and social contribution to a nation than others do. Entrepreneurial talent is the creative process that contributes to innovation and value in organisations. This process is a function of the ac-tions of organisational members, and some individuals contribute much more to it than others.
Most people think of entrepreneurship as a trait that applies only to individuals who are self-employed or business founders. However, working for yourself or setting up a busi-ness is neither necessary nor sufficient for entrepreneurship. Indeed, most new businesses fail to offer any new products or services and go bust within a few years of being founded. Thus, just like there are managers with no leadership skills (even though their formal role or official job may be to be in charge of others) there are too many self-designated “entre-preneurs” (self-employed people or business owners) with little or no capacity for innova-tion. As a matter of fact, while over 40% of the adult workforce in the UK and the US is self-employed at some point in their lives, only 30% of businesses are still alive 10 years after launching, and only 10% ever grow (Shane, 2008).
The question, then, is not why people choose to be self-employed or create a business - most people do this because they have problems with authority or incompetent bosses.3 The relevant question in entrepreneurship research and practice is why some people are
3 Year after year, Gallup data reveals that at least 70% of employees are not engaged at work, and the most common reason for that is employees’ boss or direct line manager (www.gallup.com, 2013)
5
better at creating growth and innovation for businesses. And the answer to this question is that they are more creative, alert to new opportunities, proactive, and have a better vision for the future.
Why is Entrepreneurship important?
People’s ability and tendency to engage in entrepreneurial behaviours within organisations is what causes businesses to innovate and grow. A crucial element of the war of creative talent is therefore to identify, engage, and retain entrepreneurial people. Consider the fol-lowing: most people start their own businesses because they were not deemed valuable by their employers. Most start-ups are the product of ideas that incubated in other people’s businesses, including large organisations (who fail to value or invest in these ideas). In line, large companies that employ entrepreneurial individuals tend to gain and retain a competi-tive advantage in their respective markets.
Why should businesses care?
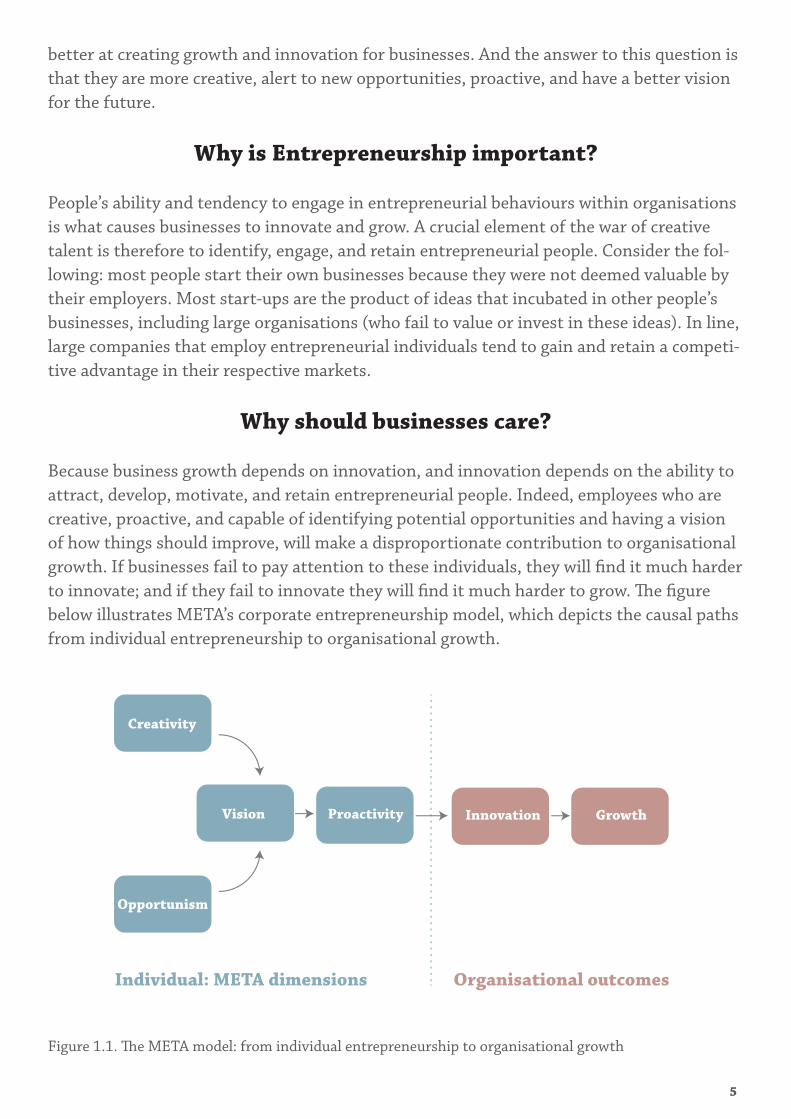
Because business growth depends on innovation, and innovation depends on the ability to attract, develop, motivate, and retain entrepreneurial people. Indeed, employees who are creative, proactive, and capable of identifying potential opportunities and having a vision of how things should improve, will make a disproportionate contribution to organisational growth. If businesses fail to pay attention to these individuals, they will find it much harder to innovate; and if they fail to innovate they will find it much harder to grow. The figure below illustrates META’s corporate entrepreneurship model, which depicts the causal paths from individual entrepreneurship to organisational growth.
Figure 1.1. The META model: from individual entrepreneurship to organisational growth
Individual: META dimensions Organisational outcomes
Creativity
InnovationVision Proactivity
Opportunism
Growth

6
Development Guidelines
In developing META, we were guided by four considerations. The first concerns what to measure.
Experts often suggest that the literature on entrepreneurship is vast and varied, such that synthesising different approaches and views on entrepreneurship into a unified theory may be somewhat unrealistic. However, our own research, which involved a comprehensive lit-erature review of the historical roots of the concept and a thorough content analysis of over 100 years of entrepreneurship research, including recent definitions, indicates that entre-preneurship can be conceptualised according to four major themes.
Specifically, our research suggests that the combination of creative, opportunity-based and value-generating behaviours and activities best reflect and encompass the phenomenon of entrepreneurship.
In addition, as the etymological origin of the term “entrepreneurship” (from the Latin intraprendere to the French entreprendre) indicates that entrepreneurship should essentially be viewed as an activity or set of activities undertaken by an individual – to entreprendre means to begin or undertake something. The first goal of our research was therefore to discover what that “something” or set of activities are; in other words, what makes entre-preneurship or entrepreneurial activity different from other types of activities or human behaviors. To this end, our content analysis of the comprehensive literature on entrepre-neurship found in Economics, Sociology, Management, Politics, and indeed Psychology, was undertaken. The prominent themes identified were creativity, opportunity-identification, proactive exploitation of opportunity and the adding of value by having a long-term vision or plan.
Naturally, the literature review also revealed a plethora of traits that had been discussed, to a greater or lesser extent, by scholars in the field. Our view is that these traits are best conceptualised as more narrow aspects or “sub-facets” of entrepreneurship. Examples of such sub-facets are: Risk-taking/Assume risks/Uncertainty; New combination of resources/Marshal resources/Efficient resource-combination; Dynamic/Change; Creating business/Initiate business/Venture creation; Profit/Growth; Arbitrageur.
The main reason to conceptualise the above attributes as sub-facets rather than central elements of entrepreneurships is that they are not consistently correlated with entrepre-neurial success, but, rather, factors that attenuate or enhance the relationship between entrepreneurial potential and success. Take, for example, the notions of risk-taking and ambition. If a person is risk-averse, they may never fulfil their entrepreneurial potential. However, being a natural risk-taker is more likely to lead to health and relationship prob-lems than entrepreneurial success. On the other hand, unambitious people may be unlikely to succeed in their entrepreneurial ventures, however that is also true for any other aspect

7
of job performance or career success. Furthermore, a person may be highly ambitious and still have no interest or talent for entrepreneurial ventures. In other words, although sev-eral traits such as ambition and risk-taking may be relevant to entrepreneurship, they are not an essential component of the entrepreneurial “DNA” and they are not specifically asso-ciated with entrepreneurial talent, but more generic markers of an individual’s personality.

8
CHAPTER
2Test Construction
Development
The development of META was based on two key assumptions. First, that, as reflected in the conceptualization of entrepreneurship discussed in chapter 1, the creation of any new product, method, service or business requires innovation, opportunity recognition, oppor-tunity exploitation, and a vision capable of contributing value, in order for it to be referred to as “entrepreneurial”. In other words, if a venture or enterprise does not contribute added-value, innovation, or is not the result of effectively ceasing an opportunity in the market, it should hardly be interpreted as an entrepreneurial venture. In line, our second assumption is that there are measurable individual differences in entrepreneurial talent, such that some individuals are more successful in entrepreneurial ventures than others.
We therefore concluded that in order to measure how much entrepreneurial talent a per-son has, we must measure their tendency and ability to innovate, recognise and pursue opportunities, and to be a positive force of change and progress – these are the attributes assessed by META.
Definitions of META Scales
The 4 META scales or dimensions are defined as follows:
1. Entrepreneurial creativity: the ability to generate innovative business ideas (relates to non-conformity, originality and preference for novel experiences)
2. Opportunism: the tendency to spot new business opportunities (relates to being alert, informed, and detecting future trends)
3. Proactivity: the tendency to be proactive about projects and get stuff done (relates to energy, confidence and self-determination)
4. Vision: the ability to see the bigger picture, the motivation to bring change and create progress (relates to values and having a higher sense of purpose)

9
Composition of META
META comprises 40 statements or “items”, which respondents endorse on a 5-point scale, ranging from “strongly agree” to “strongly disagree”. Each item contributes to the scoring of only one scale. Items were screened for content that might seem offensive or intrusive to respondents. In line, there are no items concerning sexual preferences, religious beliefs, criminal or illegal behaviour, racial/ethnic attitudes, or attitudes about disabled individuals. In addition to the items used to compute each of the META scales, there are five items to assess “social desirability” or respondents’ tendency to distort answers in order to convey a favourable impression to others.
Table 2.1 presents descriptive statistics and reliabilities for each of the META scales. Mean scale scores in the table have been standardised to a range between 1 and 10. Items are scored so that higher scores represent higher entrepreneurial potential. The data in Table 2.1 is based on a sample of 3,022 adults, most of whom were job applicants or employees. As shown, the highest mean scale score is for the Vision scale, whereas the lowest mean scale is for the Opportunism scale, which is also the most variable (with a standard devia-tion of .69). Internal consistency (Cronbach, 1951) vary between .76 (Vision) and .86 (Op-portunism) with an average alpha of .83.
Table 2.1
Descriptive Statistics and Reliabilities for META
Number of Items Mean Standard deviation Cronbach α
Opportunism 10 7.00 1.38 .86Proactivity 10 7.02 1.38 .84Creativity 10 7.74 1.14 .83Vision 10 7.84 1.02 .76META Total 40 7.48 .88 .91
Note: N = 3022
Table 2.2 presents the inter-correlations between the META scales based on a sample of 3,022 respondents. As seen, the highest correlation in the matrix is between the Opportun-ism scale and the Proactivity scale (r = .59). The lowest correlation in the matrix is between the Creativity scale and the Vision scale (.29). Thus, most scales are fairly independent of each other.

10
Table 2.2
META Scale Inter-correlations
1 2 3 4 5OpportunismProactivity .59**Creativity .47** .37**Vision .48** .32** .29**META Total .86** .76** .71** .66**
Note: *: p < .05; **: p < .01; one-tailed test. N = 3022
11
CHAPTER
3Validity
As shown in Chapter 2, individual and overall META scales exhibit good internal reliabili-ties and a coherent factor structure. This chapter examines the convergent and predictive validity of META, that is, its relationship with other individual difference constructs as well as relevant individual and organisational performance outcomes. Convergent validity is key to understanding how META relates to established predictors of work-related behaviours (e.g., emotional intelligence, the five factors of personality, and IQ). Predictive validity is key to interpreting the meaning of META scales. That is, replicable empirical associations between a test and related outcomes are needed to understand what a test is actually meas-uring (cf. Kline, 2000).
Correlations Between META and Other Measures
The next sections present the main behavioural patterns and competencies associated with each of the META scales. These data derive from six independent sources. First, we review correlations between META and the Big Five Personality Factor Markers (Goldberg, 1992), a 50-item self-report scale assessing the major personality traits, based on the Five-Factor Model (Wiggins, 1996). Second, we present correlations between META and the O*NET Interest Profiler Short Form (Rounds, Su, Lewis, & Rivkin, 2010), which measures John Holland´s vocational interest types. Third, we review correlations between META scales and two well-established personality tests, the Trait Emotional Intelligence Question-naire (TEIQue-SF; Petrides & Furnham, 2006) and the Core Self-evaluation Scale (CSES; Judge, Erez, Bono, & Thoreson, 2003). The TEIQue assesses a person’s ability to identify and regulate one’s own and other people’s emotions, whereas the CSES is a generic measure of self-esteem, adjustment and self-belief. Fourth, we present correlations between META scales and the most widely-used measure of non-clinical psychopathy, namely Levenson’s Self-Report of Psychopathy scale (LSRP; Levenson, Kiehl, Fitzpatrick, 1995). This inventory assesses primary psychopathy (i.e. being manipulative, narcissistic, callous, and lacking empathy or guilt) and secondary psychopathy (i.e. impulsivity, stimulation seeking, crimi-nal versatility, and delinquency). Fifth, we present correlations between META scales and a measure of fluid cognitive ability, the Numerical Reasoning Test (NRT-20, Chamorro-Pre-muzic, 2008), which assesses a person’s ability to learn new things and solve logical reason-ing problems. Finally, we present correlations between scores on each META scale and job performance, career performance, and entrepreneurial achievements.
All correlations are presented in Table 3.1, and described in the text on a scale-by-scale basis.

12
Opportunism. The Opportunism scale is designed to assess a person’s awareness of busi-ness opportunities or the degree to which s/he is alert to new commercial openings, busi-ness trends, and profitable ventures. People with high scores tend to always be on the lookout for new openings and do not like missing out on opportunities when they present themselves. These individuals are capable of seeing potential in a crisis, and see possibilities where others see problems. At the same time, this sheer enthusiasm about potential ven-tures may make them overestimate the value of prospective projects.
As shown in Table 3.1, Opportunism correlates significantly with all Big Five personality scales, except Agreeableness (for a more detailed description of the Big Five see Chamorro-Premuzic, 2011). The strongest five-factor correlate of Opportunism is Openness (.36), followed by Extraversion (.22). Individuals who are high on Openness are curious and re-ceptive to unconventional ideas; they enjoy trying new things and are naturally curious and open-minded. Extraverted individuals tend to be optimistic and somewhat impulsive; they enjoy variety and are confident and socially skilled. It therefore makes sense that Extra-version and Openness are positively associated with Opportunism – people who are more confident, receptive to change, and positive in their outlook, will tend to interpret events as opportunities and will be less likely to ignore clear opportunities when they present themselves. In addition, Opportunism is also correlated with Neuroticism and Conscien-tiousness, albeit more modestly. The correlation between Neuroticism and Opportunism is negative, indicating that people who are more highly adjusted and emotionally balanced will tend to be more opportunistic. As for Conscientiousness, higher levels of this trait are associated with achievement striving, ambition, self-discipline, and a strong work ethic – it therefore makes sense that more conscientious individuals are more alert to potential busi-ness openings. It should be noted that when all five factors are analysed (in a regression model), Openness (12,6%), Extraversion (2,9%) and Emotional Stability (0,5%) remain the only significant Big Five predictors of Opportunism, meaning that when scores on these traits are taken into account, the remaining two do explain any further variability in Op-portunism scores. Together the three of the Big Five traits explain 16% of the variability in Opportunism scores. The results suggests that one cannot reliably extract Opportunism from the Big Five dimensions.
Table 3.1 also displays the correlations between Opportunism and the scales from John Holland’s vocational types test (the RIASEC inventory). As shown, Opportunism was strongly correlated with Enterprising interests (.54), and modestly – but still significantly – correlated with Realistic (.14), Investigative (.11), and Artistic (.13) interests. The strong correlation between Opportunism and Enterprising is not surprising, given that Enterpris-ing interests relate to the exploitation of commercial opportunities and pursuit of business ventures – this scale represents Holland’s attempt to define entrepreneurial interests as a main type of vocational interests. In addition, opportunistic people are interested in Artis-tic (creative), Investigative (science, research, and facts) and Realistic (dealing with concrete things) vocations. However, when the RIASEC dimensions are analysed together (in a re-

13
gression model) Enterprising (29,4%) remains the only significant predictor of Opportun-ism, meaning that when this trait is taken into account, the other five traits do not predict any further variability in Opportunism scores.
Table 3.1 shows that the Opportunism scale is positively correlated with Core Self-Evalua-tions (.34) which indicates that opportunistic people tend to be more secure, emotionally stable, and confident in their abilities. Opportunism is also positively correlated (.28) with Emotional Intelligence, which indicates that opportunistic individuals are better able to identify and regulate their own and others’ emotions. The Core-Self Evaluation (11,4%) and Emotional Intelligence scales (1,4%) – combined – explain 12,8% of the variability in Op-portunism scores4.
The correlation between the Opportunism scale and the Primary Psychopathy scale (.46) suggests that opportunistic individuals are somewhat manipulative, superficial, and nar-cissistic. Opportunism is also positively (though more weakly) correlated with Secondary Psychopathy (.15), which relates to impulsivity, antisocial tendencies, and lower empathy levels. It is important to note, however, that these measures of psychopathy are designed to assess non-clinical (or normal) levels of the trait – hence the results do not have clinical implications. When both Psychopathy dimensions are taken into account Primary Psychop-athy is the only significant predictor of Opportunism explaining 21,2% of the variability in Opportunism scores.
As shown in Table 3.1, there is also a significant negative correlation between Opportunism and Cognitive Ability, suggesting that opportunistic individuals tend to have lower levels of numerical and logical reasoning (the measure of Cognitive Ability employed). Although this correlation is minor, it is possible to suggest that individuals may compensate for their lower levels of Cognitive Ability by being more receptive and open to novel opportunities – this is in line with past studies highlighting a small but negative association between IQ and Conscientiousness (Chamorro-Premuzic, 2005, 2011).
Table 3.1 also shows the validity of the Opportunism scale in relation to work and career related achievements. As can be seen, the Opportunism scale positively predicts income (.17), intrapreneurship (.34), that is, innovation output levels within an organisation (e.g., bringing in new business to the organisation, introducing new products and services, being a force of change, etc.), entrepreneurship (.34), measured in terms of number of businesses started, and employee engagement (.13), which refers to overall job satisfaction.
Thus, high levels of Opportunism are typical of open-minded, sociable, and confident indi-viduals who are commercially minded, have good people-skills, are secure and calm under pressure, but somewhat superficial and manipulative (and not particularly smart in an IQ-sense). These people are equally prone to innovating when employed by others (intrapre-neurs) than via their own business (entrepreneurs), and they tend to have slightly higher
4 Research shows that there is a substantial overlap between the Big Five traits and the scales reported here, namely, Core Self-Evalua-tions, Emotional Intelligence, RIASEC, and Primary and Secondary Psychopathy (Chamorro-Premuzic, 2013). Thus, the latter scales may often not explain much more of the variability in META scores beyond the Big Five personality traits.
14
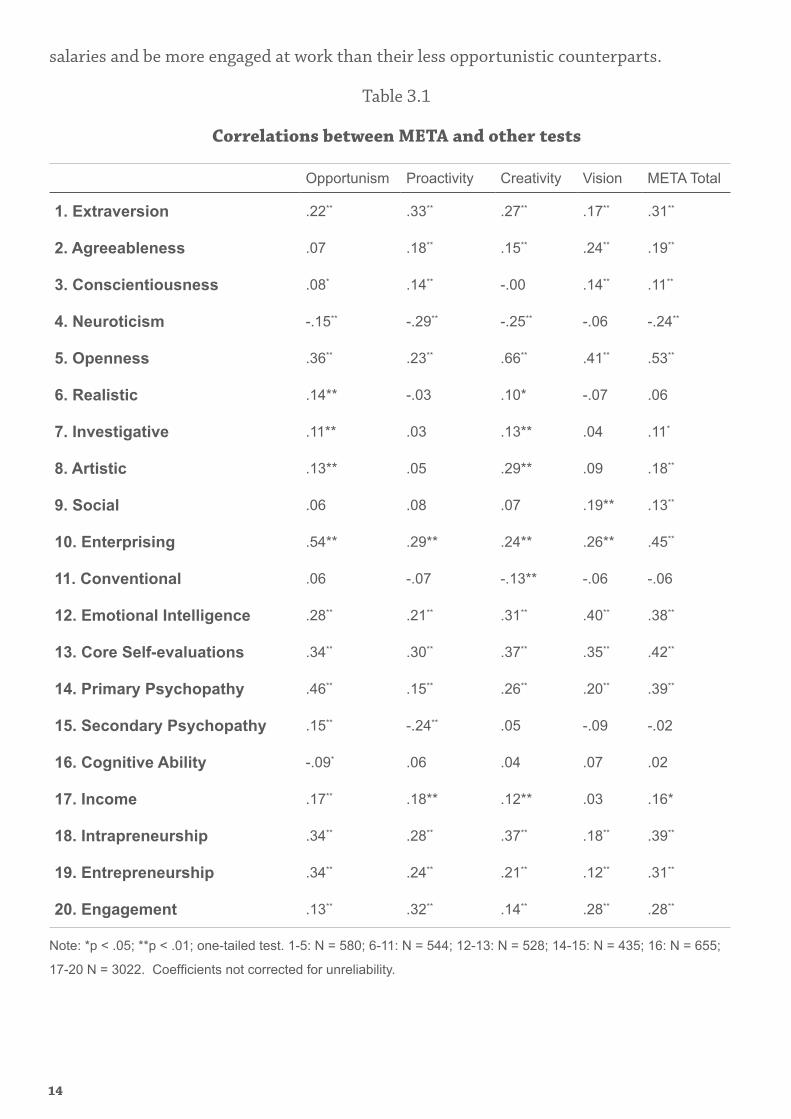
salaries and be more engaged at work than their less opportunistic counterparts.
Table 3.1
Correlations between META and other tests
Opportunism Proactivity Creativity Vision META Total
1. Extraversion .22** .33** .27** .17** .31**
2. Agreeableness .07 .18** .15** .24** .19**
3. Conscientiousness .08* .14** -.00 .14** .11**
4. Neuroticism -.15** -.29** -.25** -.06 -.24**
5. Openness .36** .23** .66** .41** .53**
6. Realistic .14** -.03 .10* -.07 .06
7. Investigative .11** .03 .13** .04 .11*
8. Artistic .13** .05 .29** .09 .18**
9. Social .06 .08 .07 .19** .13**
10. Enterprising .54** .29** .24** .26** .45**
11. Conventional .06 -.07 -.13** -.06 -.06
12. Emotional Intelligence .28** .21** .31** .40** .38**
13. Core Self-evaluations .34** .30** .37** .35** .42**
14. Primary Psychopathy .46** .15** .26** .20** .39**
15. Secondary Psychopathy .15** -.24** .05 -.09 -.02
16. Cognitive Ability -.09* .06 .04 .07 .02
17. Income .17** .18** .12** .03 .16*
18. Intrapreneurship .34** .28** .37** .18** .39**
19. Entrepreneurship .34** .24** .21** .12** .31**
20. Engagement .13** .32** .14** .28** .28**
Note: *p < .05; **p < .01; one-tailed test. 1-5: N = 580; 6-11: N = 544; 12-13: N = 528; 14-15: N = 435; 16: N = 655;
17-20 N = 3022. Coefficients not corrected for unreliability.

15
Proactivity. The Proactivity scale is designed to assess a person’s drive, action-orientation, and ability to get stuff done. Proactive people have high levels of energy, a hands-on ap-proach to work, and do not like to leave projects unfinished. They are extremely goal-ori-ented and competitive at everything they do. They will persist in the face of adversity and are not afraid of failure or uncertainty; they are confident and willing to take risks. Indeed, they will become frustrated where bureaucracy, lack of support, or sluggishness, impedes things.
Proactive people are likely to seek dominant positions and will always want to take the lead. They often have the courage to make difficult decisions where others may hesitate.
Table 3.1 shows that Proactivity is significantly correlated with all Big Five scales. The strongest Big Five correlates of Proactivity are Extraversion (.33) and Neuroticism (-.29). Highly Extraverted individuals are assertive, energetic, and determined; people who are emotionally stable (low Neuroticism) are calm under pressure, even-tempered and resilient in stressful situations. The moderate correlations between these Big Five scales and Proac-tivity makes sense – people who are energetic and assertive will be more able to get projects off the ground; given their determination and resilience under stress they will also be bet-ter equipped to see them through to completion. In addition to the correlations with Ex-traversion and Neuroticism, Proactive individuals tend to also be more Open to Experience (.23), more Agreeable (.18), and somewhat more Conscientious (.14). These correlations are also logical as optimism and versatility (Openness), organisational skills (Conscientious-ness) and interpersonal skills (Agreeableness), are useful for starting and executing projects successfully. It should be noted that Extraversion (10,8%), Neuroticism (3,7%), Openness (3,4%) and Conscientiousness (0,9%) remain the only significant Big Five predictors of Proactivity, meaning that when these traits are taken into account, Agreeableness does not predict any further variability in Proactivity scores. Together the four traits explain 18,8% of the variability in Proactivity scores.
Table 3.1 also shows that the Proactivity scale is significantly related only to the Enterpris-ing dimension (.29) of John Holland’s vocational interests types. This indicates that proac-tive individuals are primarily interested in business activities, and tend to focus on achiev-ing organisational and economic goals. They enjoy busy and demanding projects and are easily bored when they are not busy. The Enterprising scale accounts for 8,2% of variability in Proactivity scores.
As can be seen in Table 3.1, the Proactivity scale correlates positively with the Core Self-Evaluations scale (.30), which reiterates that self-confidence and stability are important aspects of Proactivity. This scale is also modestly related to Emotional Intelligence (.21), demonstrating that proactive individuals are somewhat better at regulating their own and others peoples’ feelings. Therefore, the correlations between Proactivity, Core Self-Evalua-tions and Emotional Intelligence, make sense, as a confident, stable, and an emotionally in-telligent disposition would enable Proactive individuals to keep going in tough times. When

16
both the Core-Self Evaluation and the Emotional Intelligence scales are analysed together (in a regression model), however, only the former remains a significant predictor of Proac-tivity and explains 8,6% of the variability in Proactivity scores.
Table 3.1 shows that the Proactivity scale is correlated positively, albeit modestly, with the Primary Psychopathy scale (.15) and negatively related to secondary psychopathy scale (-.24). These correlations indicate that Proactive individuals are more manipulative, nar-cissistic, and callous than the average person, but less impulsive and antisocial. Research shows that impulsive and antisocial tendencies may have a negative influence on perfor-mance (Hogan, 2007), whereas manipulative and callous behaviour may not have the same effect (in fact some evidence suggest a positive correlation between the manipulative be-haviour and career success; Babiak, Neumann, and Hare, 2010). Thus, the correlations be-tween Proactivity and the two Psychopathy scales make sense. The two Psychopathy scales account for 12% of variability in Proactivity scores (Primary Psychopathy accounting for 6,8% and the Secondary Psychopathy for 5,6%).
Table 3.1 shows that the Proactivity scale is uncorrelated with numerical and logical rea-soning (the measure of Cognitive Ability employed).
As shown in Table 3.1, organisational members with high Proactivity scores tend to have a higher income (.18), higher innovation output levels within an organisation (i.e. be more intrapreneurial .28), and are more likely to start new ventures (.24) than those with low scores on this scale. Proactivity is also the META dimension with the highest correlation with work engagement (.32), suggesting that proactive individuals are more satisfied and immersed at work than their non-proactive counterparts.
Thus, high levels of Proactivity are typical of confident, sociable, open-minded, and well-organised individuals who are commercially minded, have good people-skills, and are secure and calm under pressure. These individuals are somewhat superficial and manipulative, but less impulsive and antisocial than others. They are equally prone to innovating when em-ployed by others (intrapreneurs) than via their own business (entrepreneurs), tend to have slightly higher salaries and be far more engaged at work than their less proactive counter-parts.
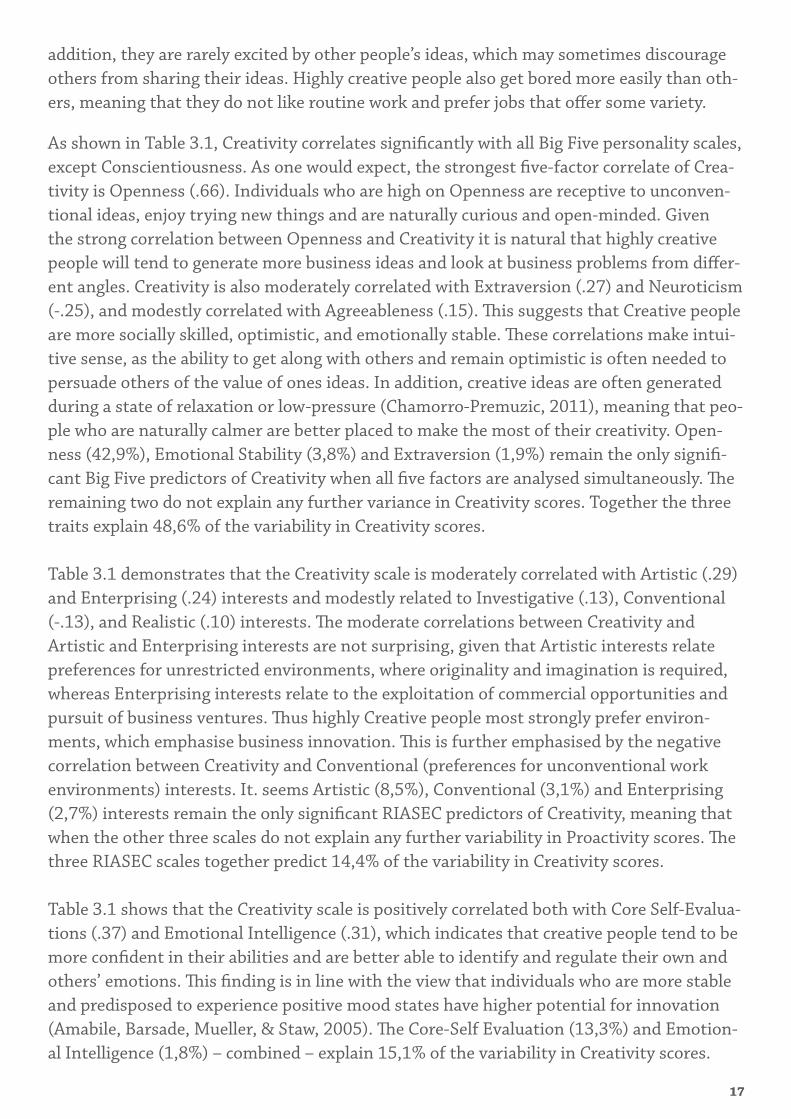
Creativity. The Creativity scale is designed to assess a person’s potential for generating innovative ideas. It also assesses a person’s tendency to look at business matters in novel ways and find original solutions to problems.
Highly creative people are divergent thinkers capable of generating imaginative, surprising and inspiring ideas. These people prefer to focus on the bigger picture and have the ability to bring an original perspective to long-standing business issues. They are also excited and energised by new business challenges, even if it means putting in extra work or discretion-ary effort. Given their preferences, creative people often fail to pay attention to detail. In
17
addition, they are rarely excited by other people’s ideas, which may sometimes discourage others from sharing their ideas. Highly creative people also get bored more easily than oth-ers, meaning that they do not like routine work and prefer jobs that offer some variety.
As shown in Table 3.1, Creativity correlates significantly with all Big Five personality scales, except Conscientiousness. As one would expect, the strongest five-factor correlate of Crea-tivity is Openness (.66). Individuals who are high on Openness are receptive to unconven-tional ideas, enjoy trying new things and are naturally curious and open-minded. Given the strong correlation between Openness and Creativity it is natural that highly creative people will tend to generate more business ideas and look at business problems from differ-ent angles. Creativity is also moderately correlated with Extraversion (.27) and Neuroticism (-.25), and modestly correlated with Agreeableness (.15). This suggests that Creative people are more socially skilled, optimistic, and emotionally stable. These correlations make intui-tive sense, as the ability to get along with others and remain optimistic is often needed to persuade others of the value of ones ideas. In addition, creative ideas are often generated during a state of relaxation or low-pressure (Chamorro-Premuzic, 2011), meaning that peo-ple who are naturally calmer are better placed to make the most of their creativity. Open-ness (42,9%), Emotional Stability (3,8%) and Extraversion (1,9%) remain the only signifi-cant Big Five predictors of Creativity when all five factors are analysed simultaneously. The remaining two do not explain any further variance in Creativity scores. Together the three traits explain 48,6% of the variability in Creativity scores.
Table 3.1 demonstrates that the Creativity scale is moderately correlated with Artistic (.29) and Enterprising (.24) interests and modestly related to Investigative (.13), Conventional (-.13), and Realistic (.10) interests. The moderate correlations between Creativity and Artistic and Enterprising interests are not surprising, given that Artistic interests relate preferences for unrestricted environments, where originality and imagination is required, whereas Enterprising interests relate to the exploitation of commercial opportunities and pursuit of business ventures. Thus highly Creative people most strongly prefer environ-ments, which emphasise business innovation. This is further emphasised by the negative correlation between Creativity and Conventional (preferences for unconventional work environments) interests. It. seems Artistic (8,5%), Conventional (3,1%) and Enterprising (2,7%) interests remain the only significant RIASEC predictors of Creativity, meaning that when the other three scales do not explain any further variability in Proactivity scores. The three RIASEC scales together predict 14,4% of the variability in Creativity scores.
Table 3.1 shows that the Creativity scale is positively correlated both with Core Self-Evalua-tions (.37) and Emotional Intelligence (.31), which indicates that creative people tend to be more confident in their abilities and are better able to identify and regulate their own and others’ emotions. This finding is in line with the view that individuals who are more stable and predisposed to experience positive mood states have higher potential for innovation (Amabile, Barsade, Mueller, & Staw, 2005). The Core-Self Evaluation (13,3%) and Emotion-al Intelligence (1,8%) – combined – explain 15,1% of the variability in Creativity scores.
18
Although conventional wisdom suggests that there is a link between psychopathy and Creativity (Chamorro-Premuzic, 2011), Table 3.1 shows that the Creativity scale of META is only modestly correlated with primary psychopathy (.26) and uncorrelated with second-ary psychopathy (.05). That is, highly creative individuals are no different in impulsivity, antisocial tendencies, and empathy, and are only somewhat more manipulative, superficial, and narcissistic to those low in creativity. The Primary Psychopathy scale accounts for 7% of variability in Proactivity scores. Table 3.1 also shows that Entrepreneurial Creativity is also uncorrelated with cognitive ability (.04).
Finally, Table 3.1 shows that the Creativity scale of META is the best predictor of “intrapre-neurial” activity within the organisation (.37); that is, highly creative individuals are more likely to have introduced new products or services within the organisation, implemented new and better methods to accomplish tasks or functions, or solved a longstanding organi-sational problem than those lower in creativity. Highly creative individuals also tend to have higher incomes (.12), are more likely to start new ventures (.21), and are somewhat more engaged (.14) than those lower in creativity.
Thus, high levels of Creativity are typical of open-minded, sociable, and confident indi-viduals who are focused on innovation, have good people-skills, are secure and calm under pressure, but somewhat superficial and manipulative. These people are prone to innovating when employed by others (intrapreneurs), they tend to have slightly higher salaries, start more businesses, and be more engaged at work than their less opportunistic counterparts.
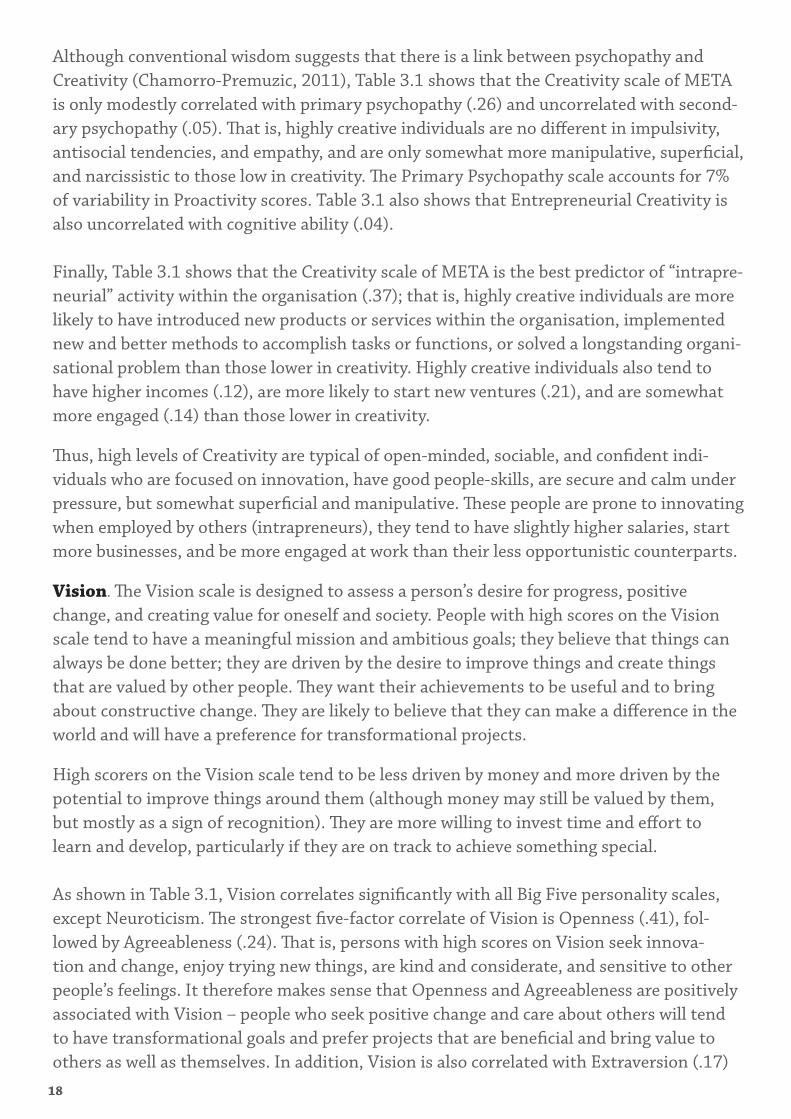
Vision. The Vision scale is designed to assess a person’s desire for progress, positive change, and creating value for oneself and society. People with high scores on the Vision scale tend to have a meaningful mission and ambitious goals; they believe that things can always be done better; they are driven by the desire to improve things and create things that are valued by other people. They want their achievements to be useful and to bring about constructive change. They are likely to believe that they can make a difference in the world and will have a preference for transformational projects.
High scorers on the Vision scale tend to be less driven by money and more driven by the potential to improve things around them (although money may still be valued by them, but mostly as a sign of recognition). They are more willing to invest time and effort to learn and develop, particularly if they are on track to achieve something special.
As shown in Table 3.1, Vision correlates significantly with all Big Five personality scales, except Neuroticism. The strongest five-factor correlate of Vision is Openness (.41), fol-lowed by Agreeableness (.24). That is, persons with high scores on Vision seek innova-tion and change, enjoy trying new things, are kind and considerate, and sensitive to other people’s feelings. It therefore makes sense that Openness and Agreeableness are positively associated with Vision – people who seek positive change and care about others will tend to have transformational goals and prefer projects that are beneficial and bring value to others as well as themselves. In addition, Vision is also correlated with Extraversion (.17)

19
and Conscientiousness (.14), albeit more modestly. These correlations indicate that people who are higher on Vision are also somewhat more sociable, achievement striving, and self-disciplined than those lower on Vision. Openness (16,4%) Agreeableness (4,2%), Conscien-tiousness (1,1%) and Extraversion (0,3%) together explain 22% of the variability in Vision scores.
Table 3.1 demonstrates that Vision correlates significantly only with three of the six voca-tional interests scales. Correlations suggest that persons with high Vision are somewhat more Enterprising (.26) and Social (.19) than those with low Vision. That is, individuals with high Vision scores tend to be business focused and have a sociable and interpersonal nature. There is also a significant, albeit small correlation between Vision and Artistic inter-ests, suggesting that high Vision scorers also prefer innovative environments. These cor-relations make sense given that meaningful social change requires a commercial mind and concern and liking for others. When the three scales are analysed together (in a regression model) however, Enterprising (6,5%), and Social (1,1%) remain the only significant RIASEC predictors of Opportunism, meaning that Artistic interests do not explain any further vari-ability in Proactivity scores. The two traits predict 7,5% of the variability in Vision scores.Table 3.1 shows that the Vision scale is positively correlated with Core Self-Evaluations (.35) which indicates that people with high Vision tend to be more secure, emotionally stable, and confident in their abilities. Vision is also positively and strongly correlated (.40) with Emotional Intelligence, which indicates that visionary individuals are better able to identify and manage their own and others’ emotions. These correlations make sense – to maintain and execute grandiose visions individuals need to have a confidence in the future and be sensitive to others emotions. The Core Self-Evaluations (16,1%) and Emotional In-telligence (2,5%) scales – combined – account for 19% of the variability in Vision scores. Table 3.1 also shows that there is a modest correlation between the Vision scale and pri-mary psychopathy (.20) and no correlation between the Vision scale and secondary psy-chopathy (-.09). This suggests that people with high Vision are somewhat more narcissistic and callous – a finding consistent with the notion that narcissistic individuals, as visionary individuals, tend to have grandiose views about their impact on others. Vision is not corre-lated with cognitive ability. The Primary Psychopathy scale accounts for 4% of variability in Vision scores.
Table 3.1 shows that high scores on the Vision scale have higher innovation output within organisations (.18), are somewhat more likely to start new ventures (.12), and are far more absorbed at work (.28) than individuals with low Vision scores. Interestingly the correla-tion with income suggests that these individuals tend to have similar salaries to those who are lower on this scale (.03), perhaps reflecting the more social and less selfish orientation of high Vision individuals.
20
Thus, high levels of Vision are typical of open-minded, agreeable, and well-organised in-dividuals who are commercially minded, as well as people-oriented, more secure and calm under pressure, but somewhat superficial and narcissistic (which would explain their gran-diose plans). These people tend to be innovative when employed by others (intrapreneurs), be somewhat more likely to start their own business (entrepreneurs), and be far more engaged at work than their less visionary counterparts.
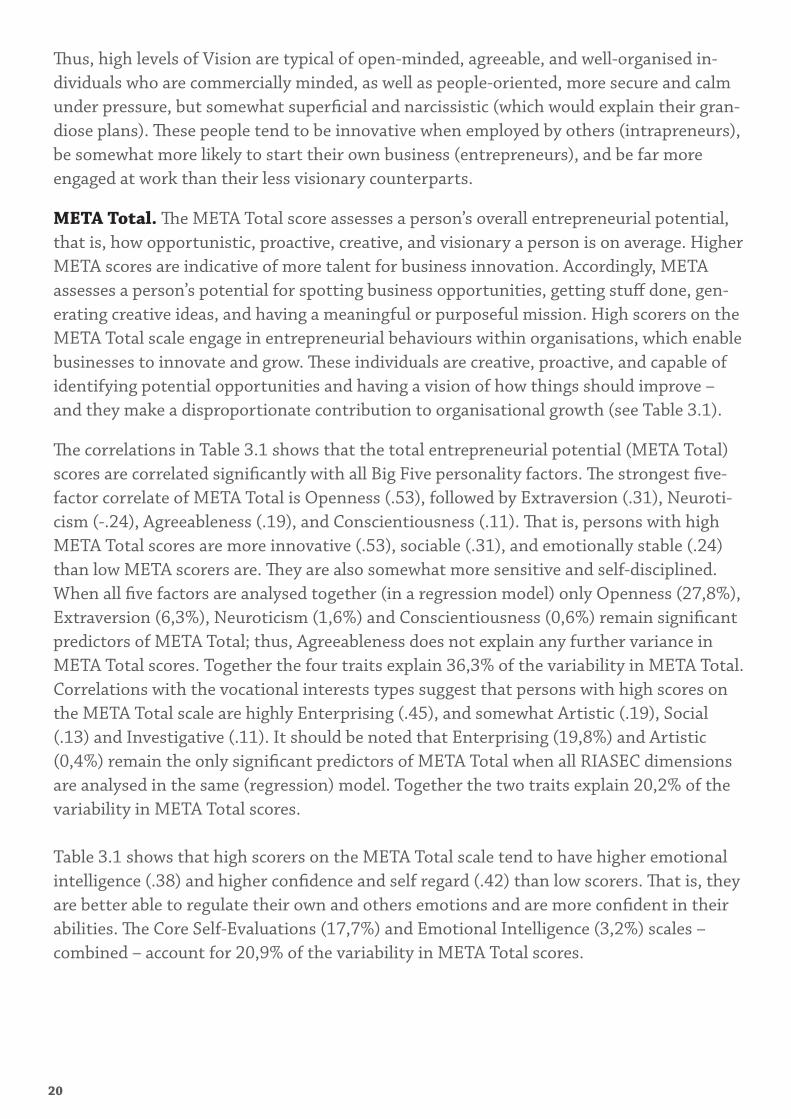
META Total. The META Total score assesses a person’s overall entrepreneurial potential, that is, how opportunistic, proactive, creative, and visionary a person is on average. Higher META scores are indicative of more talent for business innovation. Accordingly, META assesses a person’s potential for spotting business opportunities, getting stuff done, gen-erating creative ideas, and having a meaningful or purposeful mission. High scorers on the META Total scale engage in entrepreneurial behaviours within organisations, which enable businesses to innovate and grow. These individuals are creative, proactive, and capable of identifying potential opportunities and having a vision of how things should improve – and they make a disproportionate contribution to organisational growth (see Table 3.1).
The correlations in Table 3.1 shows that the total entrepreneurial potential (META Total) scores are correlated significantly with all Big Five personality factors. The strongest five-factor correlate of META Total is Openness (.53), followed by Extraversion (.31), Neuroti-cism (-.24), Agreeableness (.19), and Conscientiousness (.11). That is, persons with high META Total scores are more innovative (.53), sociable (.31), and emotionally stable (.24) than low META scorers are. They are also somewhat more sensitive and self-disciplined. When all five factors are analysed together (in a regression model) only Openness (27,8%), Extraversion (6,3%), Neuroticism (1,6%) and Conscientiousness (0,6%) remain significant predictors of META Total; thus, Agreeableness does not explain any further variance in META Total scores. Together the four traits explain 36,3% of the variability in META Total.Correlations with the vocational interests types suggest that persons with high scores on the META Total scale are highly Enterprising (.45), and somewhat Artistic (.19), Social (.13) and Investigative (.11). It should be noted that Enterprising (19,8%) and Artistic (0,4%) remain the only significant predictors of META Total when all RIASEC dimensions are analysed in the same (regression) model. Together the two traits explain 20,2% of the variability in META Total scores.
Table 3.1 shows that high scorers on the META Total scale tend to have higher emotional intelligence (.38) and higher confidence and self regard (.42) than low scorers. That is, they are better able to regulate their own and others emotions and are more confident in their abilities. The Core Self-Evaluations (17,7%) and Emotional Intelligence (3,2%) scales – combined – account for 20,9% of the variability in META Total scores.

21
The table also shows that high scorers on this scale have somewhat higher manipulative and narcissistic tendencies (.39), albeit not impulsive or delinquent ones (-.02). META Total is not correlated with Cognitive Ability. The Primary Psychopathy scale accounts for 15% of variability in META Total scores.
Table 3.1 demonstrates that organisational members with high scores on the META Total scale are likely to have higher salaries than their peers (.16), and much higher innovation output within the organisation (.39). They are also more likely to start new businesses (.31) and be satisfied and engaged at work (.28) than people with lower META Total scores.
Overall, people with high total entrepreneurial potential (META Total) are open-minded, sociable, confident, and self-disciplined. They are commercially minded and creative, have good social-skills, and remain calm and focused in stressful times. They are somewhat ma-nipulative and superficial but no more antisocial. These people tend to be highly innovative and engaged when employed by others (intrapreneurs), and are more likely to start their own business (entrepreneurs). They also tend to have slightly higher salaries than people with lower entrepreneurial potential.

22
CHAPTER
4Interpretation and Uses
Scale-by-scale Interpretation
This chapter provides some suggestions and examples of how to interpret META profiles. There are four points to remember when interpreting profiles. First, our research shows that persons with higher scores on META tend to have more success at work. Second, eve-ryone can improve some aspect of his/her entrepreneurial performance, and scores on the META scales will indicate where improvements may be needed. Third, people often don’t realise that entrepreneurial behaviours are desirable at work, meaning that they do not always know that or when they need to develop this potential. Finally, organisational mem-bers with high META scores may be more likely to seek new ventures and opportunities to start a business. If they are not managed properly, they may be more likely to leave an organisation than less entrepreneurial incumbents. META provides an efficient and reliable way to highlight these issues so that one can learn to manage them.
For interpretation, we suggest the following percentile ranges:
Low scores = 0% to 33%
Average scores = 34% to 65%
High scores = 66% to 100%
Opportunism. This scale concerns the tendency to see business opportunities in one’s surroundings, which other people may often miss or not perceive as opportunities. Persons with high scores tend to look for business openings and be highly alert to economic trends; they may also differ in the way they perceive and evaluate information, having a more op-timistic outlook in regards to business ventures than others. Others may find persons with high scores on this scale savvy and intelligent but also over-optimistic and even unrealistic.

23
Low scorers:
• Are able to focus entirely on one project
• Identify the problems of a project before it begins
• Have a critical spirit
• Are good at picking the easy option when it is also the correct one
• Are often overly cautious about new projects
• Are better at spotting problems than opportunities
• Are rarely enthusiastic about new business ventures
• Pay insufficient attention to other people’s businesses
• Will often be offline or “switch off” for too long
Average scorers:
• Can spot salient trends and opportunities
• Are open to new ideas from others
• Will occasionally look for new business avenues
• Are able to assess obvious problems with new ventures
• Can change paths if better business ideas emerge
• Are rarely alert to less obvious, but profitable opportunities
• May ‘disconnect’ for too long and miss trends in markets
• Are more likely to wait for something to happen than to make it happen
• Could dismiss good opportunities before fully examining them
• Will not have a natural appetite for new business
High scorers:
• Can easily spot trends and new opportunities
• Keep up-to-date with technology and information about various market trends
• Connect seemingly unrelated events
• Pay close attention to other people’s businesses
• Have good potential for multi-tasking

24
• Are easily distracted by new projects
• Find it hard to focus on a single task
• May over-estimate the value of new opportunities
• Can be too excited by novelty
• Often assume things are simpler than they really are
Proactivity. This scale concerns the tendency to get stuff done efficiently, be productive, have courage and influence, and willingness to lead people and projects. Proactive people are dominant and fearless, and like to get things done right away. They have a hands-on approach to things and may dislike people that have a slower pace and prefer enjoying life to the fast pace at work. Others may find them hard to work with because they can come across as pushy, overconfident, and patronising.
Low scorers:
• Are good team-players and followers
• Take the necessary time to solve problems
• Don’t embark on risky projects without prior reflection
• Maintain a good work-life balance: they are not always online, and not always working
• Hesitate to make quick decisions without consulting others
• May be perceived as passive and risk averse
• May lack the necessary energy to follow-up on plans
• Are prone to procrastinate
• Rarely take the initiative
Average scorers:
• Are able to get a lot of stuff done, especially when intrinsically motivated
• Are good at both leading and following
• Can take risks when necessary
• Are generally assertive and confident
• Maintain a good work-life balance
• Can periodically lack follow-through in projects
25
• Don’t always take the initiative
• Can sometimes prioritise fun over important work
• Prefer not to take the lead
• May refrain from taking on extra work
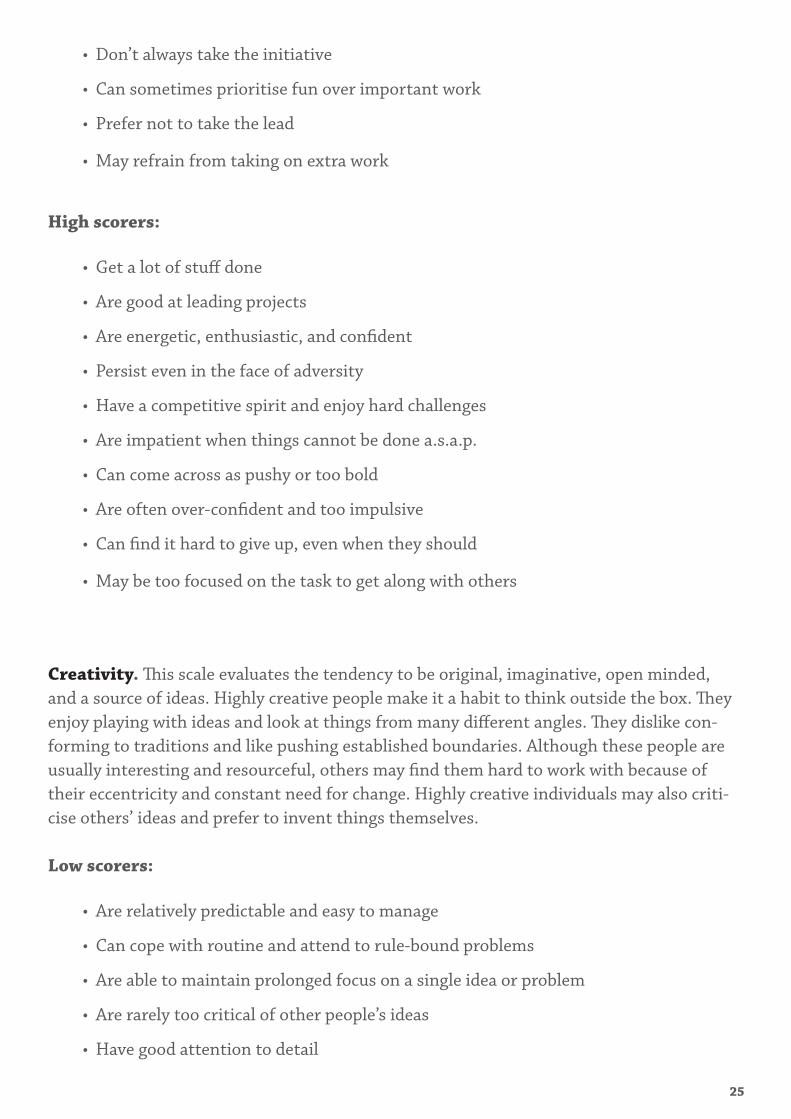
High scorers:
• Get a lot of stuff done
• Are good at leading projects
• Are energetic, enthusiastic, and confident
• Persist even in the face of adversity
• Have a competitive spirit and enjoy hard challenges
• Are impatient when things cannot be done a.s.a.p.
• Can come across as pushy or too bold
• Are often over-confident and too impulsive
• Can find it hard to give up, even when they should
• May be too focused on the task to get along with others
Creativity. This scale evaluates the tendency to be original, imaginative, open minded, and a source of ideas. Highly creative people make it a habit to think outside the box. They enjoy playing with ideas and look at things from many different angles. They dislike con-forming to traditions and like pushing established boundaries. Although these people are usually interesting and resourceful, others may find them hard to work with because of their eccentricity and constant need for change. Highly creative individuals may also criti-cise others’ ideas and prefer to invent things themselves.
Low scorers:
• Are relatively predictable and easy to manage
• Can cope with routine and attend to rule-bound problems
• Are able to maintain prolonged focus on a single idea or problem
• Are rarely too critical of other people’s ideas
• Have good attention to detail
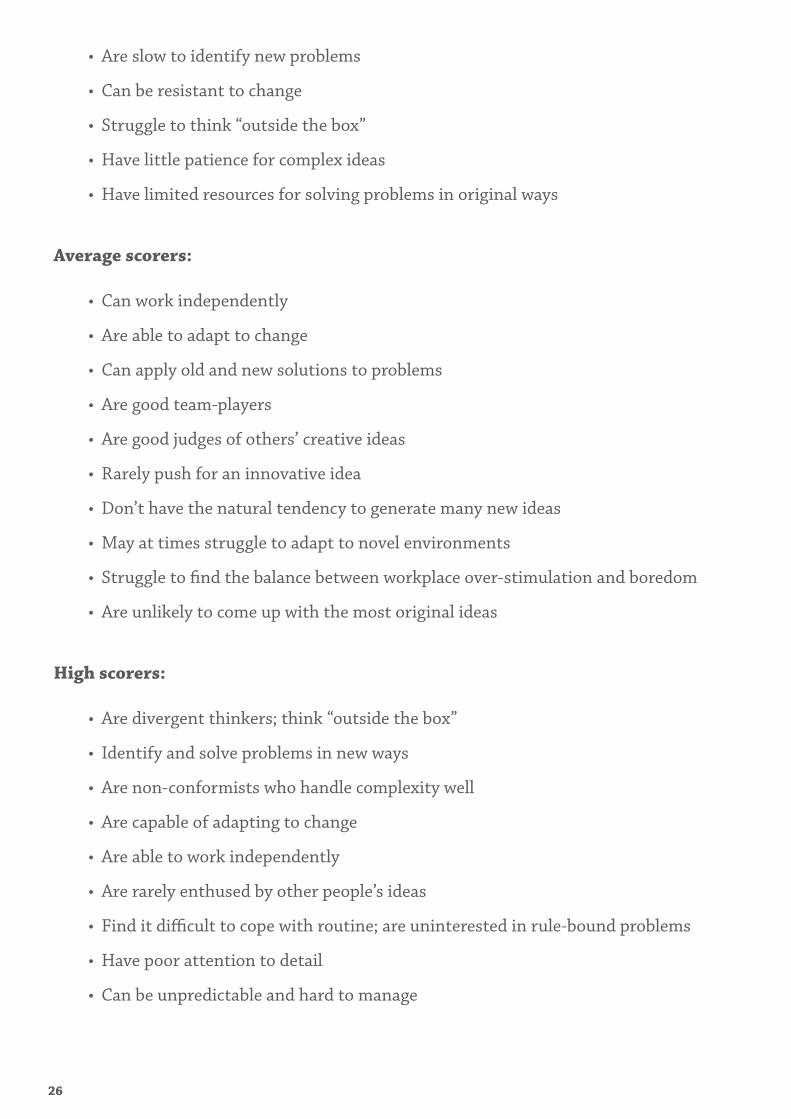
26
• Are slow to identify new problems
• Can be resistant to change
• Struggle to think “outside the box”
• Have little patience for complex ideas
• Have limited resources for solving problems in original ways
Average scorers:
• Can work independently
• Are able to adapt to change
• Can apply old and new solutions to problems
• Are good team-players
• Are good judges of others’ creative ideas
• Rarely push for an innovative idea
• Don’t have the natural tendency to generate many new ideas
• May at times struggle to adapt to novel environments
• Struggle to find the balance between workplace over-stimulation and boredom
• Are unlikely to come up with the most original ideas
High scorers:
• Are divergent thinkers; think “outside the box”
• Identify and solve problems in new ways
• Are non-conformists who handle complexity well
• Are capable of adapting to change
• Are able to work independently
• Are rarely enthused by other people’s ideas
• Find it difficult to cope with routine; are uninterested in rule-bound problems
• Have poor attention to detail
• Can be unpredictable and hard to manage
27
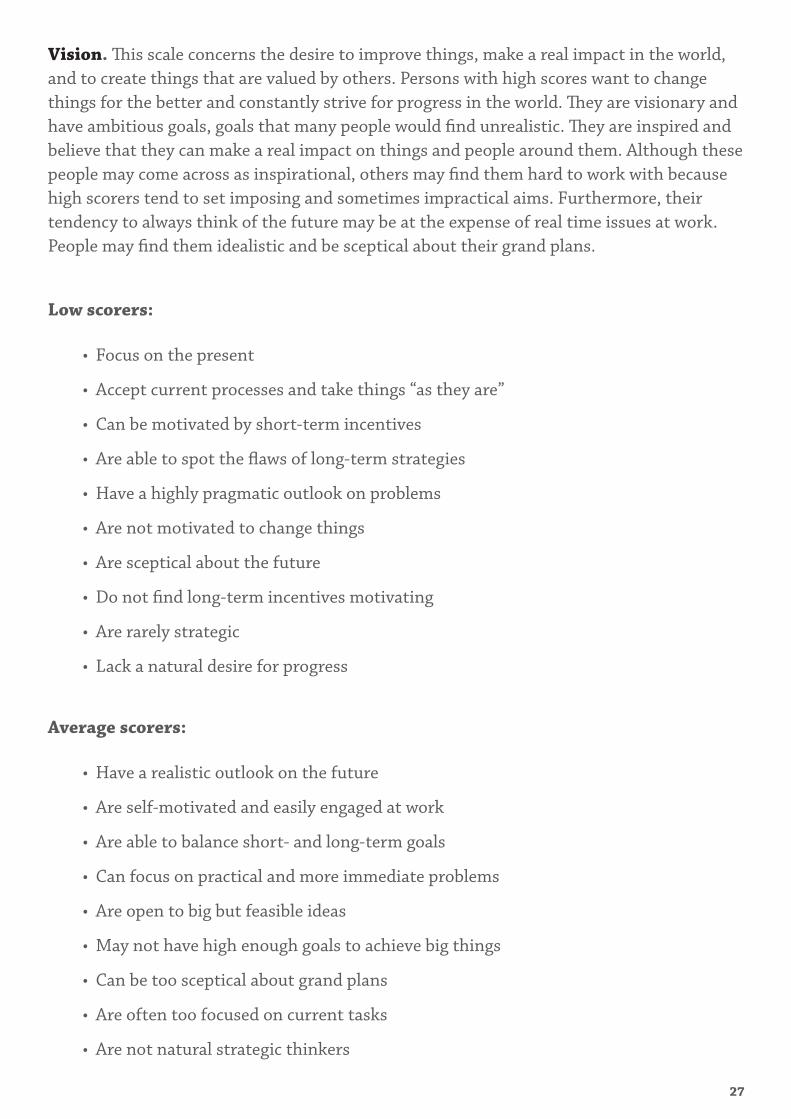
Vision. This scale concerns the desire to improve things, make a real impact in the world, and to create things that are valued by others. Persons with high scores want to change things for the better and constantly strive for progress in the world. They are visionary and have ambitious goals, goals that many people would find unrealistic. They are inspired and believe that they can make a real impact on things and people around them. Although these people may come across as inspirational, others may find them hard to work with because high scorers tend to set imposing and sometimes impractical aims. Furthermore, their tendency to always think of the future may be at the expense of real time issues at work. People may find them idealistic and be sceptical about their grand plans.
Low scorers:
• Focus on the present
• Accept current processes and take things “as they are”
• Can be motivated by short-term incentives
• Are able to spot the flaws of long-term strategies
• Have a highly pragmatic outlook on problems
• Are not motivated to change things
• Are sceptical about the future
• Do not find long-term incentives motivating
• Are rarely strategic
• Lack a natural desire for progress
Average scorers:
• Have a realistic outlook on the future
• Are self-motivated and easily engaged at work
• Are able to balance short- and long-term goals
• Can focus on practical and more immediate problems
• Are open to big but feasible ideas
• May not have high enough goals to achieve big things
• Can be too sceptical about grand plans
• Are often too focused on current tasks
• Are not natural strategic thinkers

28
• Can often put too much focus on details or themselves at the expense of the bigger picture
High scorers:
• Are motivated to change things for the better
• Are strategic and enjoy thinking big
• Have an optimistic outlook on their future plans
• Are easily self-motivated and are likely to be excited by new projects
• Can sacrifice small short-term incentives for stronger long-term benefits
• Can have views that are often too utopian and unrealistic
• Get carried away with over-ambitious projects
• Are disappointed if others do not share their vision
• Do not respond much to external rewards or threats
• Are unwilling to follow orders unless they align with their own vision
Sample META Profile Interpretations
This section presents some examples of how to interpret the META scales. Figure 4.1 is a simplified interpretive guide to understanding this section. As a general principle, it is always useful to have other assessment data available against which to check inferences based on META. In particular, we would recommend checking META scores with scores on well-validated measures such as the HPI, or NEO. As a second general principle, we recom-mend interpreting each scale by always having a reference to other META scales, because scales’ meaning will be dependent upon the context of other scales. And as a third inter-pretive guideline, we consider scores from 0th to the 33th percentile as low; 34th to 66th percentile as average; and scores from the 64th to the 99th percentile as high.
Table 4.1
A quick guide for interpreting META scales
Scale Low scores High scores
Opportunism Predictable, realistic, not curious Venturesome, knowledgeable, optimistic
Proactivity Cautious, unassertive, reserved Enthusiastic, confident, go-getterCreativity Traditional, practical, focused Imaginative, inquisitive, originalVision Pragmatic, detail oriented,
pessimisticStrategic, idealistic, inspirational
29
Uses
In our experience there are four major uses for META, although other applications may be-come apparent as time goes by. The first and by far the most frequent use for META is in se-lection contexts where interviews or self-report (personality) measures such as the Hogan Personality Inventory, 16PF, or NEO are normally used. META has several advantages over other methods in identifying entrepreneurial potential. First, entrepreneurial talent is not observable in interview settings where single observations are made. Instead, it is recog-nised in specific stable behavioural tendencies, which can be accurately captured by META. Second, a persons entrepreneurial talent may not be observable at work or as performance, because many organisational contexts, or roles, do not allow individuals to express (or manifest) their entrepreneurial potential (e.g. because of lack of resources or autonomy, or simply because of the job specification). Finally, because traditional personality tests are developed to assess very broad habits and behavioural patterns, they are unsuitable for identifying entrepreneurial tendencies.
META is the only scientific tool specifically designed to identify entrepreneurial talent and empirically proven to predict entrepreneurial success. It has been validated against several key indices of entrepreneurial achievement and shown to predict entrepreneurial perfor-mance across sectors, job types, and levels of seniority. In principle, then, META should be more useful than other personality measures in employment contexts, when the focus is on increasing entrepreneurship. META is a quick tool for recruiting and selecting people with entrepreneurial potential; to identify the hidden talent in organisations; and to benchmark organisational members.
The second major use for the META is for talent management, in other words, for manag-ing Entrepreneurial Talent. Entrepreneurial individuals are more curious, proactive, and forward-looking than others. They can also be independent and defiant. Unless they are properly managed, they will be more likely than other employees to dislike their jobs and leave the organisation. In fact, our research shows that highly entrepreneurial individuals are more engaged and more proactive at work than other employees; yet they are far more likely to quit an organisation and start their own business when there is lack of appropriate leadership. Thus, it is not surprising to find that 70% of successful start-ups are funded by people who were once employed by someone else and poorly managed.
Generally speaking, any talent management effort must begin with an assessment of tal-ent, and that is certainly true in the case of entrepreneurial talent. META provides clear and explicit information regarding those aspects of a person’s entrepreneurial potential that need extra attention. It can be used to identify the strength and the weaknesses of the

30
entrepreneurial people in the organisation and to guide the right strategies for managing and rewarding those people.
The third use for the META is for mapping and creating Entrepreneurial Culture. Organisa-tions differ in terms of how entrepreneurial they are. This can be the result of different lev-els of entrepreneurial activity throughout the organisation or specific parts of the organisa-tion. Large companies that employ individuals that act entrepreneurially, tend to gain and retain competitive advantage in their respective markets. META can be used to evaluate and map the entrepreneurial orientation of organisations. Promoting entrepreneurship, however, means not only identifying entrepreneurial talent, but also creating a working en-vironment that inspires people to think outside the box and be adventurous, take healthy risks, and innovate. Indeed, an entrepreneurial culture drives people to unleash their crea-tive potential. META can be used to reshape the culture of organisations and inject a real appetite for creativity and innovation.
Finally, the scales on the META provide reasonable clues as to how a person will perform as a member of a team. The value of every business depends on its people, and people always work in teams. Although some teams are more innovative than others, it is not easy to cre-ate balanced and high-performing teams – for example, a team full of creatives will rarely produce good results (e.g., they will be disorganised, self-centred, and unwilling to com-promise on individual ideas). META can be used to build high-performing teams, ensuring that the best possible combination of people are brought together to produce a synergy and maximise creative output.

31
CHAPTER
5Norms
Chapter 4 highlights the behavioural tendencies associated with each META dimension and describes how to interpret META scores. While an individual’s META scores on its own is useful, it can however be made more meaningful by being compared with the relevant norm group. This is what we elaborate on in this chapter.
Norms are part of the measurement process: they provide a basis for evaluating an individ-ual’s score in relation to the scores of other individuals who took the same test. Norms are typically constructed from the scores of a large sample of individuals who took a test; and the composition and characteristics of this sample are critical in determining the useful-ness of those norms. Therefore, when using norm tables to interpret individual’s test scores it is important to examine specific industry and occupational characteristics of a norm group. The most appropriate norm group is one that is representative of the individuals taking the test. For example, we would compare the META score of someone who applied for the role of manager with norms derived from the scores of others in management posi-tions.
The META norms were derived from data collected during several studies among approxi-mately 3000 adults from a variety of industry sectors. In the following sections, we provide further details about the different norm groups. They are split into general and industry sector norms.
General norms
The general norms shown in table 2.1 are based on a sample of 3022 individuals, with a fairly normal gender distribution. About 41% are male and 59% are female. The mean age was 31 years with a range of 16 and to 86 years. Around 40% of the individuals in the sam-ple were in full-time employment, about 9% are part-time, about 11% are self-employed (though some of the self-employed are also part-time employed), about 30% are students and about 10% are unemployed. They come from a variety of industry sectors, with the ma-jority being from Business/Professional Services. Most of them are from the UK although we have representatives from a variety of nations both in Europe and outside. The mean income is £20,000-£30,000.

32
The mean and standard deviation (SD) of each META facet, as well as, the total META score for the general norms are given in Table 5.1. The mean or average is calculated by summing the raw scores and dividing the sum by the sample size (N). The standard devia-tion is indicative of the amount of variance in the scores.
Industry sector norms
META norms are also available for different samples within a number of specialised indus-try sectors, ranging from business and technology to health and education. More details about each sector are given below and in Table 5.2.
Business. These norms are based on a sample of 343 individuals, with various occupa-tions within the business sector. About 49% are male and 51% are female. The mean age is 31 years with the range being between 16 and 65 years. Around 39% of the individuals in the sample are in full-time employment, about 11% are part-time, about 15% are self-employed (though some of the self-employed are also part-time employed), about 29% are students, and about 6% are unemployed. Most of them are from the UK although we have representatives from a variety of nations both in Europe and outside. The mean income is about £30,000-£40,000.
Technology. The sample of 362 individuals working within the technology industry is approximately 73% male and 27% female. The mean age is 32 years with the range being between 17 and 72 years. Around 51% of the individuals in the sample are in full-time employment, about 6% are part-time, about 15% are self-employed (though some of the self-employed are also part-time employed), about 23% are students and about 5% are un-employed. Most of them are from the UK although we have representatives from a variety of nations both in Europe and outside. The mean income is about £40,000-£50,000.
Accounting, Banking and Law. These norms are based on a sample of 167 individu-als, with various occupations within accounting, banking and law sectors. About 47% are male and 53% are female. The mean age is 32 years with the range being between 17 and 86 years. Around 61% of the individuals in the sample are in full-time employment, about 6% are part-time, about 8% are self-employed (though some of the self-employed are also part-time employed), about 18% are students and about 7% are unemployed. Most of them are from the UK although we have representatives from a variety of nations both in Europe and outside. The mean income is about £40,000-£50,000.
Education and Research. These norms are based on a sample of 418 individuals, with various occupations in education and research. About 30% are male and 70% are female. The mean age is 33 years with the range being between 16 and 84 years. Around 49% of the individuals in the sample are in full-time employment, about 11% are part-time, about 6% are self-employed (though some of the self-employed are also part-time employed),

33
about 28% are students and about 6% are unemployed. Most of them are from the UK although we have representatives from a variety of nations both in Europe and outside. The mean income is about £20,000-£30,000.
Health and Community Services. The sample of 353 individuals working within health and community services is approximately 27% male and 73% female. The mean age is 35 years with the range being between 16 and 67 years. Around 43% of the individuals in the sample are in full-time employment, about 12% are part-time, about 10% are self-employed (though some of the self-employed are also part-time employed), about 27% are students and about 8% are unemployed. Most of them are from the UK and Europe although we have representatives from a variety of other nations. The mean income is about £30,000-£40,000.
Creative and Art. These norms are based on a sample of 207 individuals, with various occupations in the creative and art sectors. About 42% are male and 58% are female. The mean age is 32 years with the range being between 17 and 68 years. Around 25% of the individuals in the sample are in full-time employment, about 6% are part-time, about 27% are self-employed (though some of the self-employed are also part-time employed), about 27% are students and about 15% are unemployed. Most of them are from the UK although we have representatives from a variety of nations both in Europe and outside. The mean income is about £20,000-£30,000.
Manufacturing, Construction, Architecture, Design and others. These norms are based on a sample of 851 individuals, with various occupations within the manufacturing, construction, architecture, design and a number of other industries, including agriculture and hospitality. About 39% are male and 61% are female. The mean age is 30 years with the range being between 16 and 77 years. Around 41% of the individuals in the sample are in full-time employment, about 12% are part-time, about 10% are self-employed (though some of the self-employed are also part-time employed), about 30% are students and about 7% are unemployed. Most of them are from the UK although we have representatives from a variety of nations both in Europe and outside. The mean income is about £20,000-£30,000.
Number of Items Mean Standard deviation Cronbach α
Opportunism 10 7.00 1.38 .86Proactivity 10 7.02 1.38 .84Creativity 10 7.74 1.14 .83Vision 10 7.84 1.02 .76META Total 40 7.48 .88 .91

34
Table 5.1Industry sector norms
Sector Mean SDBusiness (N=343) Opportunism 7.7 1.35
Proactivity 7.2 1.4Creativity 8.0 1.2Vision 8.0 1.3META Total 7.8 0.9
Technology (N=362) Opportunism 7.5 1.5Proactivity 7.1 1.5Creativity 8.1 1.3Vision 7.9 1.3META Total 7.7 1.0
Creative & Art (N=207) Opportunism 6.4 1.7Proactivity 7.1 1.3Creativity 8.6 1.1Vision 7.9 1.2META Total 7.7 0.8
Accounting, Banking & Law (N=167) OpportunismProactivity
7.46.9
1.61.4
Creativity 7.6 1.5Vision 7.8 1.3META Total 7.5 0.9
Manufacturing, Construction, Architec-ture, Design & others (N=851)
OpportunismProactivity
6.87.0
1.71.3
Creativity 7.6 1.3Vision 7.8 1.7META Total 7.4 0.9
Education & Research (N=418) OpportunismProactivity
6.56.9
1.61.4
Creativity 6.5 1.3Vision 7.7 1.3META Total 7.2 0.8
Health & Community Services (N=353) OpportunismProactivity
6.26.8
1.61.2
Creativity 7.6 1.3Vision 7.8 1.3META Total 7.1 0.8
35
Aldrich, H.E., & Kim, P. H. (2007). Small Worlds, Infinite Possibilities? Strategic Entrepreneurship Journal, 1, 147–165.
Baron, B.& Tang, J. (in press). Positive Affect, Creativity, and Innovations in New Ventures: A Moderated Mediation Model. Journal of Business Venturing.
Baum, J.R., & Locke, E.A. (2004). The relationship of entrepreneurial traits, skill, and motivation to new venture growth. Journal of Applied Psychology, 89, 587–598.
Bausch, A., Rosenbusch, N. (2005). Does innovation really matter? A meta-analysis on the relationship between innovation and business performance. Paper presented at the 25th Babson Kauffman Entrepre-neurship Research Conference, Wellesley, USA.
Branson, R. (2007). Losing My Virginity: Richard Branson, The Autobiography. London: Virgin Books.
Carroll, G., & Mosakowski, E. (1987). The career dynamics of self-employment.Administrative Science Quarterly, 32, 570–589.
Chamorro-Premuzic, T. (2005). Personality and intellectual competence. Mahwah, NJ: Lawrence Erlbaum Associates.
Chamorro-Premuzic, T. (2011). Personality and individual differences (2nd edition). Oxford: Wiley.
Chen, C., Greene. P., & Crick, A. (1998). Does entrepreneurial sell-efficacy distinguishentrepreneurs from managers? Journal of Business Venturing, 13, 295–316.
Cooper, A., Woo, C., & Dunkelberg, W. (1988). Entrepreneurs’ perceived chances for success. Journal of Business Venturing, 3, 97–108.
Dunne, T., Roberts, M., & Samuelson, L. (1988). Patterns of firm entry and exit in U.S.manufacturing industries. Rand journal of Economics, 9, 495–515.
Frese, M., Krauss, S., Keith, N., Escher, S., Grabarkiewicz, R., Luneng, S. T., et al. (2007). Business Owners’ Action Planning and Its Relationship to Business Success in Three African Countries. Journal of Applied Psychology, 92, 1481–1498.
Grant, A. M., & Ashford, S. J. (2008). The dynamics of proactivity at work. Research in Organizational Behavior, 28, 3–34.
Hogan, R. (2007). Personality and the fate of organizations. XXX
Larwood, L., Falbe, C. M., Kriger, M., & Miesing, P. (1995) Structure and Meaning of Organizational Vi-sion. Academy of Management Journal, 38, 740–769.
Ozgen, E. & Baron, B. (2007). Social Sources of Information in Opportunity Recognition: Effects of Mentors, Industry Networks, and Professional Forums. Journal of Business Venturing, 22, 174–192.
Palich, L., & Bagby, R. (1995). Using cognitive theory to explain entrepreneurial risk-taking: Challenging conventional wisdom. Journal of Business Venturing, l0, 425–438.
Parker, S. K., Williams, H., & Turner, N. (2006). Modeling the antecedents of proactive behavior at work. Journal of Applied Psychology, 91, 636–652.
36
Rauch, A., & Frese, M. (2007). Let’s put the person back into entrepreneurship research: A meta-analysis on the relationship between business owners’ personality traits, business creation, and success. European Journal of Work and Organizational Psychology, 16, 353–385.
Sarasvathy, D., Simon, H. A., & Lave, L. (1998). Perceiving and managing business risks:Differences between entrepreneurs and bankers. Journal of Economic Behavior andOrganization, 33, 207–226.
Schmookler, J. (1966). Invention and economic growth. Cambridge, MA: Harvard University press.
Schumpeter, J. (1935). The analysis of economic change. Review of Economic Statistics, 17, 4, 2–10.
Shane, S. (2000). Prior knowledge and the discovery of entrepreneurial opportunities.Organization Science, 11, 448–469.
Shane, S. (2003). A general theory of entrepreneurship: The individual–opportunity nexus. Aldershot, England: Elgar.
Shane, S. & Venkataraman, S. (2000). The promise of entrepreneurship as a field of research. Academy of Management Review, 25, 217–226.
Sternberg, R. J. (2004). Successful intelligence as a basis for entrepreneurship. Journal ofBusiness Venturing, 19, 189–201.
Utterback, J. (1994). Mastering the dynamics of innovation. Cambridge, MA: Harvard Business School press.
Venkataraman, S. (1997). The distinctive domain of entrepreneurship research: An editor’s perspective. In J. Katz & R. Brockhaus (Eds.), Advances in entrepreneurship, firm emergence and growth (Vol. 3, pp. 119–138). Greenwich, CT: JAI Press.