Measuring driver fatigue based on eyelid opening level · Measuring driver fatigue based on eyelid...
18
Measuring driver fatigue based on eyelid opening level DDI 2017 – 20.03.2017 Barbara Metz Volker Hargutt, Andreas Landau Alexandra Neukum
Transcript of Measuring driver fatigue based on eyelid opening level · Measuring driver fatigue based on eyelid...

Measuring driver fatigue based on eyelid
opening level
DDI 2017 – 20.03.2017
Barbara Metz
Volker Hargutt,
Andreas Landau
Alexandra Neukum

• In house development of algorithm for measuring
driver fatigue in the 90‘s (Drowsiness index).– Focus on detection of early fatigue
• Due to instable camera based eye tracking at that
time, development of own sensor solution.
2
Background

Application in various research projects in the field of driving:
3
Previous Applications
Fatigue in drivers withParkinson‘s disease
Impact of drugs on driver state
Validation of algorithmusing lateral drivingbehaviour to assess
driver‘s stateImpact of telephoning
on driver‘s state
Impact of automation anddistraction on driver‘s state

1. Identification of blinks in the eyelid-opening level.
2. Extraction of parameters for every blink.
3. Evaluation of every blink based on these parameters.– Individual baseline information is needed for evaluation.
– This information is collected in 5 minutes of alert driving.
4
Drowsiness index – basic approach

5
Drowsiness index- Classification of blinks

Growing need for online assessment of driver‘s state in
the vehicle.Continuous driver monitoring during highly automated driving
Distraction
Fatigue
Serial application requires different sensor technique:– Sensors can no longer be attached to driver‘s lid.
– Contactless measurement of eye-lid opening level is needed.
Does the Drowsiness index work on data provided by a
state-of-the-art camera-based eye tracking system?
6
Potential for new applications

Moving-based driving simulator
Nighttime simulation
Course:Start in urban environment2 h of monotonous nighttime drivingEnd in urban environment
Repeated rating of driver stateKarolinska Sleepiness ScaleRating by driver every 10 minExpert rating every 5 min
Sample N=30
7
Experimental set-up

8
Data logging
Driving simulatorEye tracking – SmartEye Pro 6.1
Annotation ofsymptoms offatigue Expert-rating of
driver state with KSS
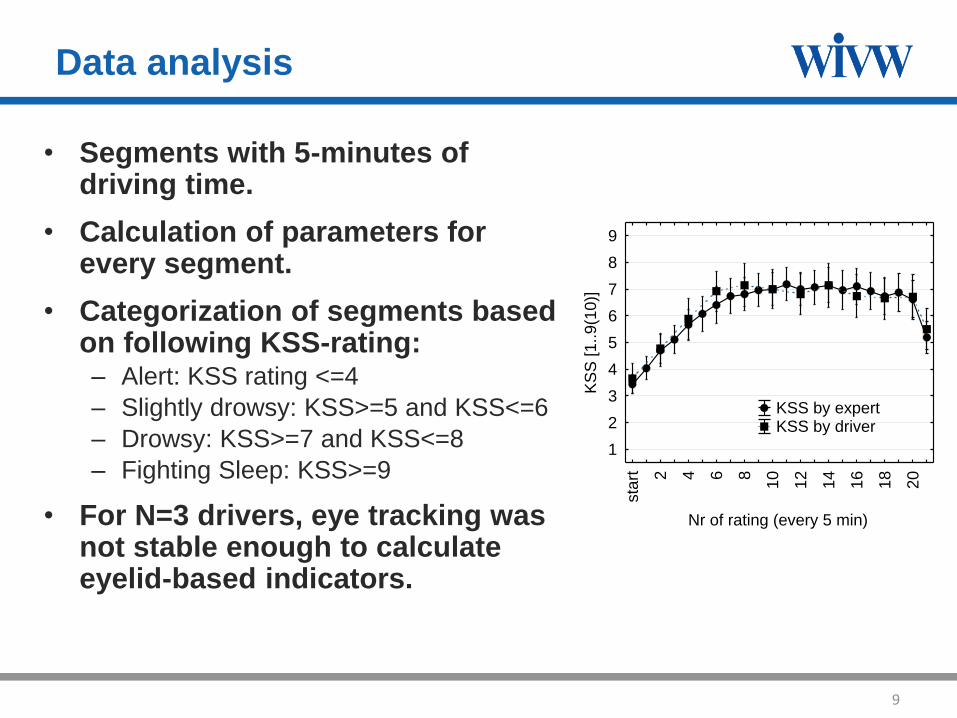
• Segments with 5-minutes of driving time.
• Calculation of parameters for every segment.
• Categorization of segments based on following KSS-rating:– Alert: KSS rating <=4
– Slightly drowsy: KSS>=5 and KSS<=6
– Drowsy: KSS>=7 and KSS<=8
– Fighting Sleep: KSS>=9
• For N=3 drivers, eye tracking was not stable enough to calculate eyelid-based indicators.
9
Data analysis
sta
rt 2 4 6 8
10
12
14
16
18
20
Nr of rating (every 5 min)
1
2
3
4
5
6
7
8
9
KS
S [1..9(1
0)]
KSS by expert KSS by driver

10
Results – Induced change of state
ale
rt
slig
htly d
row
sy
dro
wsy
fig
htin
g s
lee
p
02468
10121416182022
N(S
ym
pto
ms)/
5 m
in
Evaluation of Fatigue - Driver
Be
fore
Sta
rt
Ma
x
En
d
1
2
3
4
5
6
7
8
9
10
KS
S[1
..9
(10
)]
mean mean+95%conf
Growing fatigue during the drive.Entering urban environment results in reduced fatigue.
With growing fatigue, number of symptoms rises continuously (F(3, 587)=78.098, p<0.001).

11
Results – PERCLOS
ale
rt
slig
htly d
row
sy
dro
wsy
fig
htin
g s
leep
4%
6%
8%
10%
12%
14%
16%
18%
PE
RC
LO
S[%
]
PERCLOS detects growing fatigue (F(3, 534)=43.228, p<0.001).
‘Alert’ & ‘slightly drowsy’ can’t be differentiated.
alertslightly drowsy
drowsyfighting
sleep
alert 1.0000 0.0003 0.0000
slightly drowsy 1.0000 0.0001 0.0000
drowsy 0.0003 0.0001 0.0000
fighting sleep 0.0000 0.0000 0.0000
Post-Hoc-Tests
12
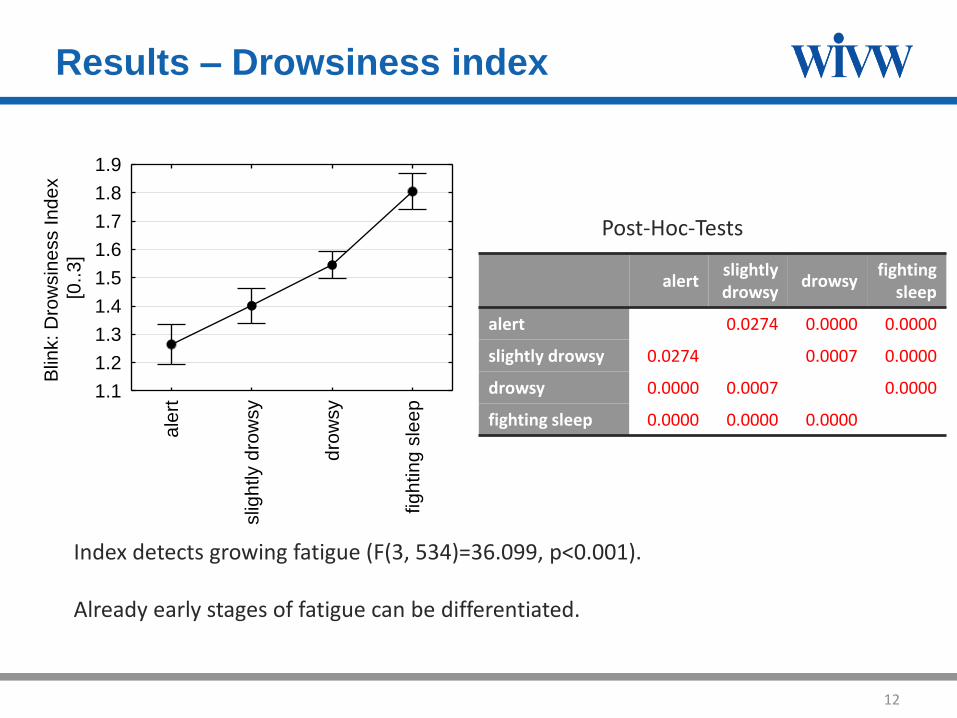
Results – Drowsiness index
Index detects growing fatigue (F(3, 534)=36.099, p<0.001).
Already early stages of fatigue can be differentiated.
alertslightly drowsy
drowsyfighting
sleep
alert 0.0274 0.0000 0.0000
slightly drowsy 0.0274 0.0007 0.0000
drowsy 0.0000 0.0007 0.0000
fighting sleep 0.0000 0.0000 0.0000
Post-Hoc-Tests
ale
rt
slig
htly d
row
sy
dro
wsy
fig
htin
g s
lee
p1.1
1.2
1.3
1.4
1.5
1.6
1.7
1.8
1.9
Blin
k:
Dro
wsin
ess I
nd
ex
[0..
3]

13
Results – Change over driving time
Driver Nr 17
1 3 5 7 9 11 13 15 17 19
Nr Rating during drive [every 5 min]
2
4
6
8
10
KS
S e
xp
ert
ra
tin
g [
1..
10
]
0.8
1.0
1.2
1.4
1.6
1.8
2.0
Blin
k:
Dro
wsin
ess I
nde
x [
0..
3]
KSS Index
On individual level, there is a good correlation between KSS-rating and Drowsiness index.
Driver Nr 31
0 2 4 6 8 10 12 14 16 18 20 22
Nr Rating during drive [every 5 min]
2
4
6
8
10
KS
S E
xpert
rating [1..10]
0.6
0.8
1.0
1.2
1.4
1.6
1.8
2.0
2.2
2.4
Blin
k: D
row
sin
ess Index [0..3]
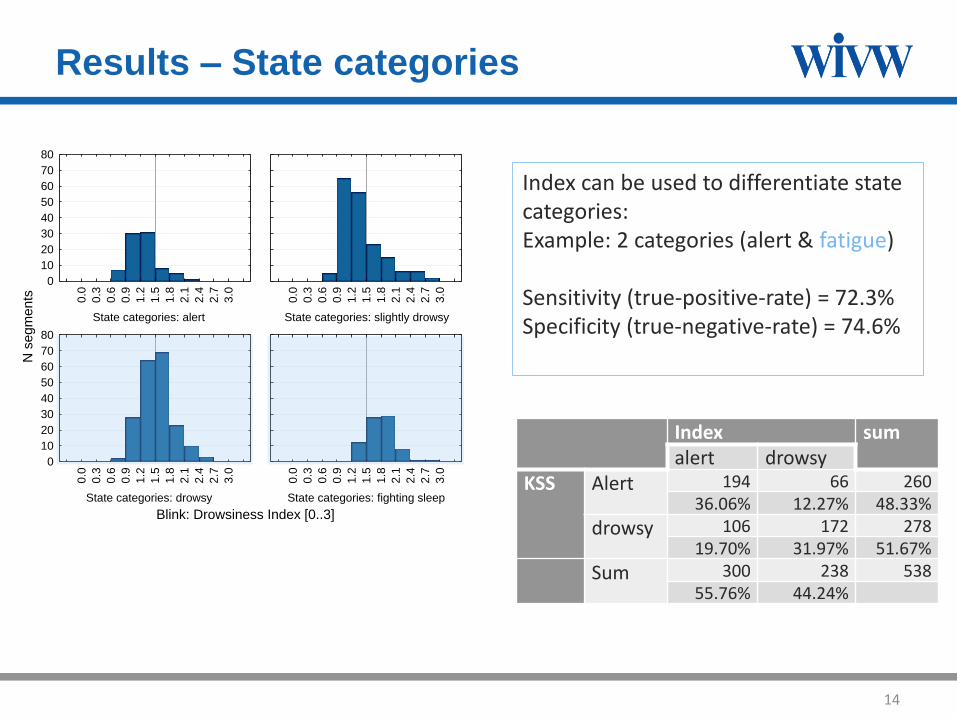
Index sumalert drowsy
KSS Alert 194 66 26036.06% 12.27% 48.33%
drowsy 106 172 27819.70% 31.97% 51.67%
Sum 300 238 53855.76% 44.24%
14
Results – State categories
Blink: Drowsiness Index [0..3]
N s
eg
me
nts
State categories: alert
0.0
0.3
0.6
0.9
1.2
1.5
1.8
2.1
2.4
2.7
3.0
0
10
20
30
40
50
60
70
80
State categories: slightly drowsy
0.0
0.3
0.6
0.9
1.2
1.5
1.8
2.1
2.4
2.7
3.0
State categories: drowsy
0.0
0.3
0.6
0.9
1.2
1.5
1.8
2.1
2.4
2.7
3.0
0
10
20
30
40
50
60
70
80
State categories: fighting sleep
0.0
0.3
0.6
0.9
1.2
1.5
1.8
2.1
2.4
2.7
3.0
Index can be used to differentiate state categories:Example: 2 categories (alert & fatigue)
Sensitivity (true-positive-rate) = 72.3% Specificity (true-negative-rate) = 74.6%

• Drowsiness index works on camera based eye
tracking signal.
• With used hardware, eye tracking was too instable to
calculate drowsiness index for about 10% of drivers.
• Drowsiness index measures fatigue in manual
driving.
• Focus on detection of beginning fatigue.
• Here, it differentiates better than PERCLOS.
15
Summary

Drowsiness index will be adapted to new challenges
resulting from automation:– Highly automated driving changes gaze behavior fundamentally:
Attention is not necessarily focused primarily on the road.
Drivers may want to use automation to relax (and close their eyes).
– These changes presumably affect indicators assessing driver‘s
fatigue based on eyelid opening level.
16
Next steps

Thank youWürzburger Institut für Verkehrswissenschaften GmbH (WIVW)
Robert-Bosch-Straße 4
97209 Veitshöchheim
Tel.: +49-(0)931-78009102
Fax: +49-(0)931-78009150
e-mail: [email protected]

Annotated symptoms are based on ORD Behavior & Mannerism
Checklist (Wiegand, McClafferty, McDonald & Hanowski, 2009)
18
Annotation of symptoms