Beyond ROI: Measuring Digital Health Content's Full Economic Benefits
Upload
eri-abdala-hassanCategory
view
460download
0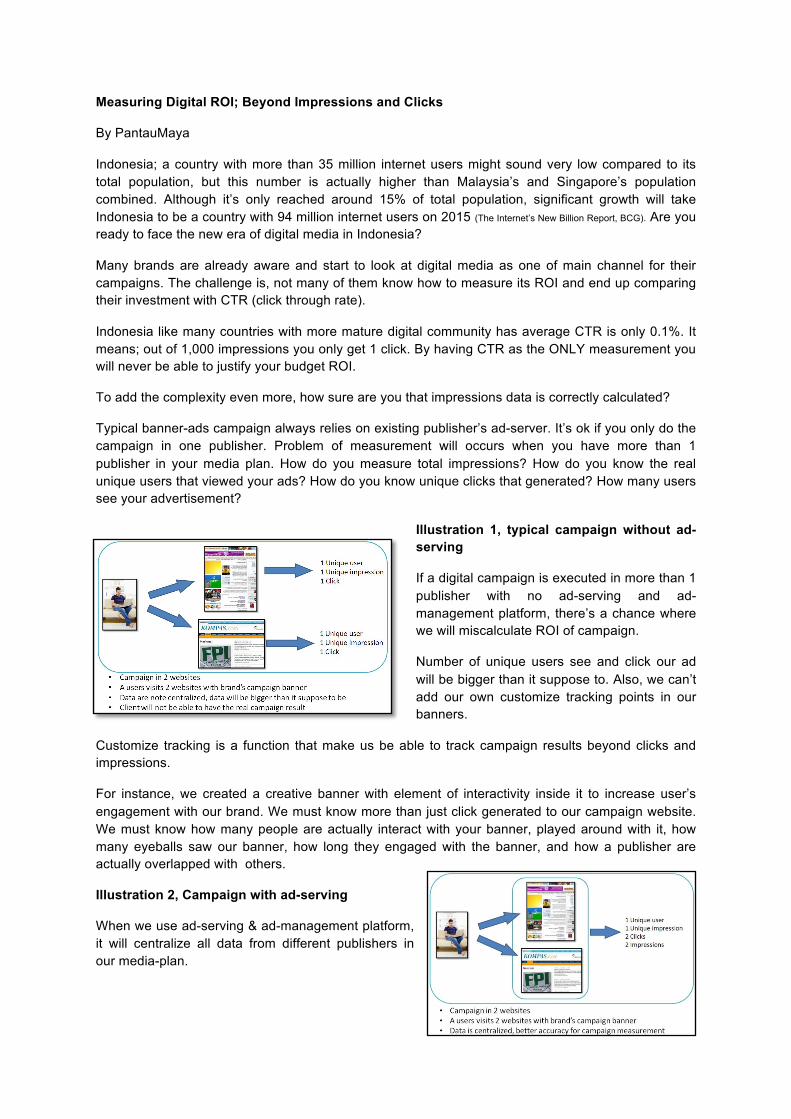
Measuring Digital ROI; Beyond Impressions and Clicks
By PantauMaya
Indonesia; a country with more than 35 million internet users might sound very low compared to its total population, but this number is actually higher than Malaysia’s and Singapore’s population combined. Although it’s only reached around 15% of total population, significant growth will take Indonesia to be a country with 94 million internet users on 2015 (The Internet’s New Billion Report, BCG). Are you ready to face the new era of digital media in Indonesia?
Many brands are already aware and start to look at digital media as one of main channel for their campaigns. The challenge is, not many of them know how to measure its ROI and end up comparing their investment with CTR (click through rate).
Indonesia like many countries with more mature digital community has average CTR is only 0.1%. It means; out of 1,000 impressions you only get 1 click. By having CTR as the ONLY measurement you will never be able to justify your budget ROI.
To add the complexity even more, how sure are you that impressions data is correctly calculated?
Typical banner-ads campaign always relies on existing publisher’s ad-server. It’s ok if you only do the campaign in one publisher. Problem of measurement will occurs when you have more than 1 publisher in your media plan. How do you measure total impressions? How do you know the real unique users that viewed your ads? How do you know unique clicks that generated? How many users see your advertisement?
Illustration 1, typical campaign without ad-serving
If a digital campaign is executed in more than 1 publisher with no ad-serving and ad-management platform, there’s a chance where we will miscalculate ROI of campaign.
Number of unique users see and click our ad will be bigger than it suppose to. Also, we can’t add our own customize tracking points in our banners.
Customize tracking is a function that make us be able to track campaign results beyond clicks and impressions.
For instance, we created a creative banner with element of interactivity inside it to increase user’s engagement with our brand. We must know more than just click generated to our campaign website. We must know how many people are actually interact with your banner, played around with it, how many eyeballs saw our banner, how long they engaged with the banner, and how a publisher are actually overlapped with others.
Illustration 2, Campaign with ad-serving
When we use ad-serving & ad-management platform, it will centralize all data from different publishers in our media-plan.
Centralized data will support us to have a visibility to overall campaign performance and accuracy of data.
Off course in order to keep the independency of data, we should have a 3rd party independent ad-serving & ad-management platform.
Ad-serving and ad-management platform will also enable us to have more than just impressions and clicks as the measurement of our campaign. It can calculate time of engagement, indicative eyeballs, overlapping among publishers, how many people play around with your banner, frequency of your banner being exposed to a particular user, and many other ad-management functions like frequency cap, rotating 2 banners at 1 space, generate leads from rich media banner, etc.
PantauMaya’s Case Studies
• TRI- MU Campaign – Generating Leads
Period: 1 week, number of publisher: 1, Total Budget: est. IDR 10Mn. Result: 17,000 ‘warm’ leads that can be followed up with real name, phone numbers, and email.
Calculated from spent budget and leads generated; IDR 588/leads is significantly low compare to traditional way for generates leads. Beside calculate clicks, impressions, and interactions, Ad-Serving/Ad-Management platform provide database hosting for leads.
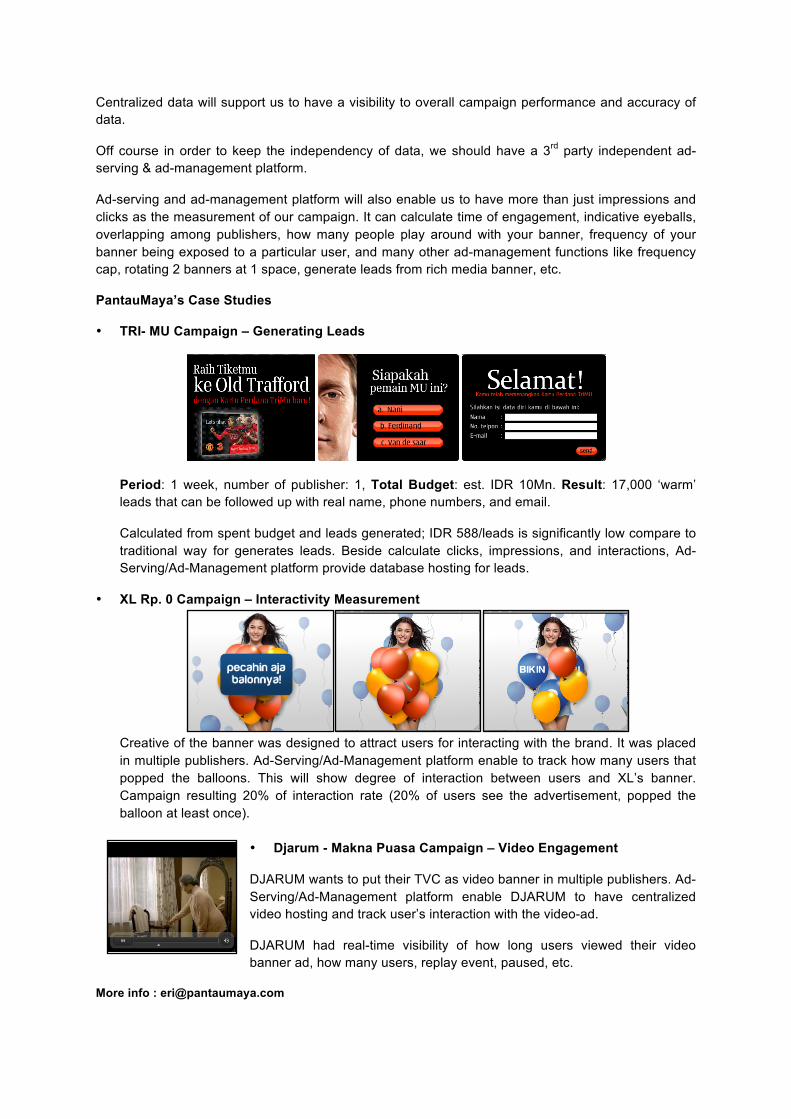
• XL Rp. 0 Campaign – Interactivity Measurement
Creative of the banner was designed to attract users for interacting with the brand. It was placed in multiple publishers. Ad-Serving/Ad-Management platform enable to track how many users that popped the balloons. This will show degree of interaction between users and XL’s banner. Campaign resulting 20% of interaction rate (20% of users see the advertisement, popped the balloon at least once).
• Djarum - Makna Puasa Campaign – Video Engagement
DJARUM wants to put their TVC as video banner in multiple publishers. Ad-Serving/Ad-Management platform enable DJARUM to have centralized video hosting and track user’s interaction with the video-ad.
DJARUM had real-time visibility of how long users viewed their video banner ad, how many users, replay event, paused, etc.
More info : [email protected]