Measuring Culture and Cultural Change James Melton Abstract ...
32
Measuring Culture and Cultural Change James Melton Abstract Mary Douglas’s grid/group analysis has been a very influ- ential theory for many culture theorists in all fields of the social sci- ences. There are two good reasons for importance of this theory. It allows for an interaction between the individual and the culture, and it can explain cultural change. There has been some theoriz- ing about the implications of these innovations; however, little empirical work has been done to test these implications. The rea- son for this, at least partly, is the lack of an indicator capable of easily measuring culture on a wide-scale basis. This paper attempts to solve this problem by using questions chosen from the World Values Survey as an indicator of grid and group. To test the validity of these indicators, a survey was administered to five groups on Illinois Wesleyan University’s campus, and these results were compared to results given by the Gross and Rayner method of measuring grid/group. If the World Values Survey indicators are valid, there should be a strong correlation between the grid and group scores for members of the same group. Additionally, there should be less than ten-percent variance between the World Values Survey indicators of grid and group and the pre-established indi- cators of grid and group. Finally, there should be little or no cor- relation between grid and group. Based on the data gathered, all these hypotheses seem to be valid, and therefore, the data suggests the indicators chosen from the World Values survey are a valid wide-scale indicator of an individual’s typology. Measuring Culture and Cultural Change Grid/Group analysis, which has formed the base of culture theory in political science, was first established by Mary Douglas in Cultural Bias (1978). Since Cultural Bias, Grid/Group analysis has been applied throughout all the fields of the social sciences and has been used to explain ideas in political science like social
Transcript of Measuring Culture and Cultural Change James Melton Abstract ...
Measuring Culture and Cultural Change
James Melton
Abstract
Mary Douglas’s grid/group analysis has been a very influ-ential theory for many culture theorists in all fields of the social sci-ences. There are two good reasons for importance of this theory. Itallows for an interaction between the individual and the culture,and it can explain cultural change. There has been some theoriz-ing about the implications of these innovations; however, littleempirical work has been done to test these implications. The rea-son for this, at least partly, is the lack of an indicator capable ofeasily measuring culture on a wide-scale basis. This paperattempts to solve this problem by using questions chosen from theWorld Values Survey as an indicator of grid and group. To test thevalidity of these indicators, a survey was administered to fivegroups on Illinois Wesleyan University’s campus, and these resultswere compared to results given by the Gross and Rayner method ofmeasuring grid/group. If the World Values Survey indicators arevalid, there should be a strong correlation between the grid andgroup scores for members of the same group. Additionally, thereshould be less than ten-percent variance between the World ValuesSurvey indicators of grid and group and the pre-established indi-cators of grid and group. Finally, there should be little or no cor-relation between grid and group. Based on the data gathered, allthese hypotheses seem to be valid, and therefore, the data suggeststhe indicators chosen from the World Values survey are a validwide-scale indicator of an individual’s typology.
Measuring Culture and Cultural Change
Grid/Group analysis, which has formed the base of culturetheory in political science, was first established by Mary Douglasin Cultural Bias (1978). Since Cultural Bias, Grid/Group analysishas been applied throughout all the fields of the social sciences andhas been used to explain ideas in political science like social

120 Culturepolicy decisions (Douglas and Ney 1998), risk aversion (Douglasand Wildavsky 1983), and environmental activism (Ellis andThompson 1997). However, when Mary Douglas first formulatedgrid/group analysis, she believed its greatest strength was that itallowed for an interaction between the individual and the group andthis interaction gave the individual a choice in determining his cul-ture. It was this interaction that set grid/group analysis apart fromprevious culture theories, because it was neither deterministic norsaw culture as autonomous (Douglas 1978). In addition, this inter-action makes Douglas’s theory excellent for measuring culturalchange, because it allows a degree of agency in the cultural deci-sion. Unfortunately, there has been little work done in this regard.There has been some theorizing about a process for cultural changeusing grid/group analysis, for example Lockhart (1999) andThompson, Ellis, and Wildavsky (1990). However, there has beenvirtually no empirical work done in an effort to demonstrate andpossibly predict cultural change using grid/group analysis. Thisleads to my original research question: how does culture changeover time?
Before finding a theory of culture that can explain culturalchange, it is imperative to find a theory that allows culture be oper-ationalized to see if change is occurring. This is where Douglas’stheory runs into problems. It is clear Douglas’s theory can be oper-ationalized, as shown in Jonathan Gross and Steve Rayner’s bookentitled Measuring Culture (1985). They explain exactly how theywould operationalize grid and group to measure the culture of thevarious groups within a hypothetical community. However, theGross and Rayner indicators were designed to test the culture ofindividual groups using a case study methodology. This poses aproblem for large-scale studies, like the one proposed here.Therefore, a new set of indicators needs to be chosen for grid andgroup that use Douglas’s theory to test wide-scale cultural change.Since a new set of indicators must be established before culturalchange can be tested, the aim of this paper is to establish these indi-cators.
The World Values Survey seems like an ideal data sourcefor a wide-scale time-series study of culture and cultural change,because it asks a wide variety of questions to a cross-national sam-ple of counties over time. As described in the first line of the WorldValues Survey Code Book, "this data collection is designed toenable cross-national comparison of values and norms in a widevarieties of areas and to monitor changes in values and attitudes of

Res Publica 121mass publics in 45 societies around the world" (World Values StudyGroup 1999: iii). However, the World Values Survey has neverbeen used as an indicator of grid and group in the past, and this isa problem because there are no established, confirmed indicators ofgrid and group for this data source. This leads to a second researchquestion being tested here: can the World Values Survey be used asan indicator of grid and group?
This question is very important for much more than juststudying cultural change; if the World Values Survey proves to bea valid measure grid and group, all branches of the social scienceswould have an empirically demonstrated method of quantifyingculture for years to come. My three hypotheses are: 1) if the indi-cators chosen from the World Values Survey truly measure grid andgroup, then there will be a variance of less than 0.10 between theWorld Values Survey indicators and the Gross and Rayner indica-tors; 2) if the indicators chosen from the World Values Survey area valid measure of grid/group analysis, then there will be a rela-tively strong correlation between individuals within the same groupfor the WVS indicators; 3) if the World Values Survey indicators ofgrid and group are valid, there should be little or no correlationbetween the indicators for grid and the indicators for group. Thepaper will proceed as follows: first, an example of the importanceof grid/group analysis and an explanation of Douglas’s theory, fol-lowed by an explanation of the Gross and Rayner indicators of gridand group, then a description of the research design, next an analy-sis of the data, and finally, the conclusion of whether or not theWVS indicators appear to be valid and steps for further research inthis area.
The Importance of Grid/Group Analysis
An example may help clarify why it is important to consid-er culture when trying to explain individual decisions. Let us con-sider why Palestinian suicide bombers almost daily decide to killthemselves as well as innocent Israeli civilians. There is no self-interested rational explanation, like rational choice theory wouldpredict, why a Muslim individual from Palestine decides to strap ona bomb and blow themselves as well as all the people around themto pieces.1
1 Rational choice theorists posit that individuals choose the most efficient means tomaximize their utility to achieve there desired ends.

122 CultureIn addition, the only institution in place that could possibly
be influencing people to perform these acts is the Islamic religion;however, there is nothing in institutionalist theory to explain theseindividuals’ deadly strong allegiance to their religion.2 The prob-lem here with both rational choice theory and institutionalist theo-ry is that they are trying to explain individual decisions with grouplevel ideas and beliefs. A culture theory that allows for individualchoice, like Douglas’s theory, can better explain this action. Usinggrid/group analysis, the suicide bomber would probably be classi-fied as an egalitarian3 , or sectarians, because of their extremelystrong group allegiance with few rules governing members, littlestructure, and not readily definable leadership (Douglas 1978).This classification not only explains their strong reliance on therules and beliefs of the Islamic religion, but in Douglas’s theory,egalitarians are in a state of constant fear and anxiety that theirgroup will be penetrated and destroyed by outsiders. Therefore,using grid/group analysis, we can explain the Palestinian suicidebombers intense fear and hatred of the Israeli outsiders that drivesthem to sacrifice their own lives to kill the Jewish intruders. The above example clearly shows why culturist theory can some-times explain the decisions and actions of individuals more ade-quately than either rational choice or institutionalist theories.However, one objection that has continually arisen from rationalchoice and institutionalist theorists is that culture theories cannotexplain cultural change. Consequently, before a culturist theorycan be consistently used as one of the factors in people’s decision-making process, it needs to be able to empirically show and explaincultural change.
Using culturist theories that involve individual choice, therehave been several explanations of cultural change over time. HarryEckstein formulated one such theory for cultural change in hisessay "A Culturist Theory of Political Change." Eckstein’s theoryuses culture as a way to "‘economize’ in decisions to act and toachieve predictability in social interactions" (Eckstein 1988: 792).Yet, in "novel", or unfamiliar, situations, people’s cultural disposi-tions are not equipped to give them clear decisions. These novelsituations arise from internal "development," socially internal dis-continuities (economic and political crises), or externally 2 Institutionalist theory predicts that the institutions set up in society limit and some-times manipulate individual’s actions.
3 More on egalitarians how the egalitarian sub-culture is formed and what it meansis described in the next section.

Res Publica 123imposed changes (Eckstein 1988). Eckstein believes that peopleencounter novel situations frequently, and these situations caneither cause cultural patterns to remain the same, change slightly toallow more flexibility in dealing with the unusual situations, orchange culture completely. Due to Eckstein’s view of culture as"economizing" decisions, it becomes extremely costly to changecultures, because changing cultures is followed by a period ofanomie due to lack of or loose internal guidelines to action.Therefore, people opt to keep culture constant if possible; howev-er, there are times of very rapid social and structural reorganizationwhere it is impossible to keep culture constant, and in these times,it must either change entirely or, preferably, change slightly towardflexibility to deal with the unfamiliar situation.
Although Eckstein’s economizing view of culture and cul-tural change is very convincing, it runs into problems from itsdeterministic nature. Eckstein’s theory has an individual element inthe choice of culture, but he believes that the reason culture existsis to allow for predictability in decisions, as stated above. As aresult, his theory becomes deterministic in the long-run, becauseonce a culture is in place, it is nearly impossible for an individualor group to change cultures without bringing anomie into theirlives, due to the great cost of changing decision making processes.Mary Douglas solves this problem by allowing for individualchoice in deciding culture and also allowing interaction betweenthe individual and their culture, which Eckstein does not.
Consequently, where Eckstein saw anomie as the result ofcultural change, Mary Douglas’s theory allows individuals and cul-ture to interact in a way that allows individuals to manage culturalchange without social chaos. Douglas says, "Grid/group analysistreats the experiencing subject as a subject choosing…The methodallows for the cumulative effect of individual choices on the socialsituation itself: both can interact, the individual and the environ-ment, and either can move…" (Douglas 1978: 13). In this state-ment, Douglas is saying first that the individual has a choice ofwhat subculture they belong to, and since every subculture hasadvantages and disadvantages, an individual can change their sub-culture if the advantages of being a part of that subculture change.Second, she is saying the environment, or subculture, as well as theindividual interact together and shape each other, and the environ-ment can remove the individual if it sees the need. Although, it isless clear how a subculture can ostracize an individual, but as MaryDouglas states in Essays in the Sociology of Perception, "…four

124 Culturedistinctive types [of subculture] are continually present, inexorablydrawing individuals into their ambit, delivering to their recruits thechoice of thinking alike or suffering the penalties of failure andostracism" (1982: 5). This statement solidifies the idea that a sub-culture can recruit as well as ostracize or incur penalties on indi-viduals for failure or differences of opinion.
Grid/Group Analysis
In order to completely understand grid/group analysis, onefirst has to understand Douglas’s view of the negotiating individual.She says, "…the cognitive activity of the real live individual islargely devoted to building the culture, patching it here and trim-ming it there, according to the exigencies of the day. In his verynegotiating activity, each is forcing culture down the throats of hisfellow men. When individuals interact, their medium of exchangeis culture" (Douglas 1978: 6). In this quote, Mary Douglas isexplaining her view of the negotiating individual as one who is con-stantly interacting with other people in a cultural context. Everyaction and decision a person makes has a cultural element to it, andas a person makes decisions, they are attempting to coerce andinfluence other individuals to become members of their culturewith their decision making pattern. In addition, every individual isshaping their culture based on their particular needs of the day, butas she explains later, individuals are also being shaped by their cul-ture as well.
Douglas’s idea of the individual is crucial to understandingher theory for grid/group analysis, because it is the interactionamongst individuals and between individuals and the group thatmakes her theory so unique. It is due to these interactions that aperson chooses a particular culture, or typology. To understandhow this works, it is imperative to understand how a typology isformed. There are two sides to each typology: a "social context"and a "cosmology". The social context referred to here is "a con-text conceived in strictly social terms, selected for its permittingand constraining effects upon the individual’s choices. It consistsof social action, a deposit of myriads of individual decisions madein the past, creating a cost-structure and the distribution of advan-tages which are the context of present day decisions" (Douglas1978: 6). In other words, the social context is the rules or guide-lines and individual uses to make their decisions. Consequently, anindividual’s choice about whether or not to join a particular groupwith a particular typology and associated social context will be

Res Publica 125determined by the distribution of advantages that person receivesfrom being a member of that particular typology, or environment,based on their past decisions.
Once a person has chosen to be a member of a group, theenvironment begins to shape the individual by providing a cost-structure to influence decisions. In order for an individual to makesense of his environment, he needs a set of guiding principles orideas to guide him. This is provided by the cosmology that is asso-ciated with each of the typologies. By cosmology, Douglas means"the ultimate justifying ideas which tend to be invoked as if part ofthe natural order and yet which, since we distinguish four kinds ofcosmology, are evidently not at all natural but strictly a product ofsocial interaction" (Douglas 1982: 5). Based on this definition, wecan conclude that each cosmology is the set of ideas developed bya person for interpreting their environment and justifying theiractions, or in other words, a cosmology is what a person uses toperceive events that happen in their environment, like a cultural fil-ter.
Therefore, typologies are a direct measure of the "socialcontext" of a group, and each of the social contexts has an implicit"cosmology". A person’s grid and group scores determine whattypology they have placed themselves. Grid and group measure thesocial context of each typology4. As stated by Mary Douglas inCultural Bias, "the term grid suggests a cross-hatch of rules towhich individuals are subject in the course of their interaction. Asa dimension, it shows a progressive change in the mode of socialcontrol" (1978: 8). Under this view, grid refers to the level and typeof control that members of a group are subject to in their everydayinteraction with other members of the group and society, wheremaximum freedom from control represents a low grid conditionand maximum control represents a high grid condition.5 On theother hand, group refers to the strength of attachment to a group.Mary Douglas says, "the strongest effects of group are to be foundwhere it incorporates a person with the rest by implicating themtogether in common residence, shared work, shared resources andrecreation, and by exerting control over marriage and kinship"
4 The social context for each typology is most clearly laid out on pages 19-21 ofCultural Bias.
5 Control can be exerted internally by the leadership of the group or in the case of thefatalists control can be exerted eternally from members of other groups.

126 Culture(Douglas 1978: 14). Therefore, a strong group score would bewhere the group infiltrates every aspect of a person’s life, and a lowgroup score would be one where a person is free to come and go ashe pleases with little or no time or allegiance given to the group.Based on how a particular group scores for these two measures, itis assigned one of four typologies, or subcultures, as shown below.
At low grid, low group, a person is in the individualisttypology. A person in this typology is free to negotiate amongst fel-low members, choose his allies and enemies, and move up or downin the social ladder. At low grid, high group, a person is in the egal-itarian typology. This is the typology of the suicide bomber in theexample on page two. Here there is a strong external group bound-ary, but little or no segregation or division of roles within the group.Each member has the potential to play every role; however, fear ofoutsiders infiltrating the group is constant and can become over-whelming to members of this typology. At high grid, high group, aperson is in the hierarchical typology. This typology has stronginternal and external boundaries. Roles are predetermined andfixed, and everyone knows their place and duty in the group.Finally, at low group, high grid, a person is in the fatalist typology.People are sent here by members of the other typologies to do asthey are told. Individuals in this typology do not receive the pro-tection and privileges of group membership, but they are still notfree to do as they please because they are subject to the rules setdown by their high grid environment. There are people here in allsocieties, and this is sometimes referred to as the forgotten typolo-gy.6 (Douglas 1982)
It is important to note that Douglas does not think typologycan be measured solely by cosmology. She states, "Given these
6In any given society, there is the possibility of individuals falling into all fourtypologies depending on which group they belong.

four distinctive contexts…the next stage is to elucidate elements ofcosmology which are not circularly implied in the definition ofsocial context and to show that a distinctive cosmological bias isgenerated by the character of explanations and justifications thatare plausible in each social context" (Douglas 1978: 22). Thismeans that there may tend to be a particular cosmological bias asso-ciated with each social context, but even though each typology hasan implicit cosmology, it is not guaranteed that every person in atypology has the same cosmological bias.7 Therefore, it is impos-sible to correctly measure typology based solely on cosmology,because cosmology could be slightly different for every member ofa group. Consequently, one needs to measure a combination ofsocial context and cosmology or only measure social context tocorrectly determine an individual’s typology. This is extremelyimportant to this study, because the questions chosen from theWorld Values Survey as indicators of grid and group must try toascertain social context, rather than cosmology. MeasuringCulture
The first step for testing the validity of the World ValuesSurvey as an indicator of grid and group is finding a set of pre-established indicators of grid and group to test the new indicatorsfrom the World Values Survey against. As explained in the litera-ture review above, Jonathan Gross and Steve Rayner developed thefirst empirical model for measuring grid and group. Their work,Measuring Culture (1985), has been used as a model for measuringculture in works by Wildavsky (1987), Thompson, Ellis, andWildavsky (1990), Douglas and Ney (1998), and Ney andMolenaars (1999). In addition, Caulkins did a factor analysischoosing indicators of grid and group from the Gross and Raynermodel to see if their indicators were truly measuring differentthings, as they claim.8 Although there were some factors thatloaded in unexpected patterns, Caulkins found that the correlationsfrom the factor analysis generally support Gross and Rayners’7This idea is furthered by Mary Douglas’s belief that the typologies are type of poly-thetic classification. By polythetic classification, she means a classification that"identifies classes by a combination of characteristics, not requiring any one of thedefining features to be present in all members of a class" (Douglas 1978: 15).Therefore, not all of the characteristics of a typology must be displayed by eachmember, but all members should display a majority of the characteristics of a typol-ogy.
8They say, "There are superficial reasons why two of our predicates scores mightappear to be measuring the same thing. However, whatever correlations are discov-ered empirically are aspects of culture and organization, not of our mathematicalmodel (Gross and Rayner 1985: 84).
Res Publica 127

claim that their indicators measure different aspects of grid andgroup. Therefore, due to the widespread use of the Gross andRayner indicators among scholars in the social sciences and at leastone study testing the validity of measures themselves, this seemslike an excellent set of indicators to test the validity of WorldValues Survey indicators against.
Measuring Culture begins with a hypothetical communitywhere a new nuclear power plant is being built near-by (Gross andRayner 1985).9 In the community, there are five different groupsthat could be analyzed using grid/group analysis, and all five havedifferent views on the new nuclear power plant. To assess the cul-tural bias of the different groups, a set of researchers is assigned toeach group, and each group is observed over the course of a three-month period of time to ascertain the structure of the groups. Forthe group measure, there are five indicators: proximity, transitivi-ty, frequency, scope, and impermeability, and for the grid measure,there are four indicators: specialization, asymmetry, entitlement,and accountability. All of these indicators give an ordinal measurefrom zero to one. Each person from a group receives a score foreach of the grid and group indicators. Then, all the individualscores for the group are aggregated to give a group score for eachindicator. Finally, the five group measures are averaged and thefour grid measures are averaged to give an average grid and groupscore for each group. Since the average score for grid and group isbetween zero and one, a group score from 0.00-0.50 is low group,and group score from 0.51-1.00 is high group, and likewise, a gridscore from 0.00-0.50 is low grid and a grid score from 0.51-1.00 ishigh grid.
It is important to note that Gross and Rayner intended thismodel to only be a guide for future research in this field. As theysay, "We describe methods of observation, the principles of exper-imental design, and the techniques of recording data that are appro-priate to our paradigm. It is possible to modify them to meet thespecial needs of a study" (Gross and Rayner 1985: 87). Therefore,the model they lay out in Measuring Culture may be adapted to fitany particular research design. For example, in the factor analysismentioned above, Caulkins considered impermeability the bestindicator of group and asymmetry as the best indicator of grid forhis study, because these two indicators seemed the most closelyrelated to what Douglas meant when describing grid and group.
9Since this was a hypothetical example, none of the activities really happened and allthe data is hypothetical as well.
128 Culture

Res Publica 129Further, Gross and Rayner do more than just allow for adaptabilityin their model of grid/group measurement, they also give sugges-tions for future researchers to use. These suggestions as well as thepossible adaptability of the Gross and Rayner model were veryimportant parts in preparing the research design below.Research Design
Now that the Gross and Rayner model has been explainedand established as a valid indicator of grid/group analysis, it has tobe molded to fit the time and resource constraints as well as thenature of this project. The only significant modification beingmade here is that not all of the indicators of grid and group will beused.10 The group indicators that will be used here are frequency,scope, and impermeability,11 and the grid indicators that will beused are specialization and entitlement.12 These indicators werechosen based on their availability in the groups being studied, andtheir ability to most validly measure Douglas’s idea of grid andgroup. The scope and frequency scores were be obtained by themembers of each group being surveyed filling out a time allocationtable,13 the entitlement score is determined by a question on the10 Gross and Rayner make some suggestions and identify some problems withmeasuring their indicators using a survey, and these were taken into account whendesigning the survey given here.
11 When explaining the difference between high and low group, Douglas mostlygives reference to the amount of time and number of activities done with the group,but in addition, she does mention boundedness or inability to penetrate a group asimportant when measuring high group (Douglas 1978). These traits seem to be meas-ured much better by the chosen indicators, rather than scope or transitivity, which tosome extent both measure the level of interaction between members in the a group.
12 Douglas believes the most important component of the grid dimension is "insu-lation…which corresponds to strong social classification" (Douglas 1978: 16). Inher view, high levels of insulation, or a highly classified individual with little roomfor personal choice, guarantee a high grid condition, but with low levels of insula-tion, a group can be considered high or low grid depending on the levels of autono-my, control, or competition within the group. Therefore, it is essential to measure thelevel of insulation in a group to determine its grid score, and all the Gross and Raynerindicators do this to some extent. However, specialization and entitlement seem toget at Douglas’s idea of insulation best, and due to a major time and resource con-straint, the researcher here was unable to perform the in-depth needed to adequatelymeasure asymmetry or accountability.
13 An uncompleted coded survey with the formula used for determining frequency
and scope is given in appendix one.

130 Culturesurvey and information gained from an interview with the presidentof each group14, and the two remaining indicators were obtainedthrough an interview with the president of each of the groups beingstudied15. The scores for the grid indicators and the group indica-tors were aggregated separately to give a total grid score and totalgroup score for each group using the Gross and Rayner indicators.The assumption being made with these scores is that they are theaverage of each member’s grid and group scores for the Gross andRayner indicators. This assumption does follow, provided thisstudy is an accurate representation of the original Gross and Raynermodel.
The next step is choosing a set of questions from the WorldValues Survey to act as indicators of grid and group. The questionsfrom World Values Survey (World Values Study Group 1999) werecarefully chosen to be an accurate measure social context and notthe cosmology of the group. As explicitly stated above, the typolo-gies are based on the social context, or structure of the group, andconsequently, typology cannot be measured by cosmology alone.This is particularly important here, because if the indicators chosenmeasure cosmology rather than social context, they may be shownvalid in this study, but when applied in future studies, they may notcorrectly measure grid and group and could possibly leadresearchers to false conclusions. Therefore, it is extremely impor-tant that each question chosen is measuring social context.16
The survey was given to five groups on Illinois Wesleyan’sCampus: WESN, Kappa Kappa Gamma, Circle K, Tri-Beta, andSigma Alpha Iota. It was administered by the president of each ofthe groups at one of their meetings. The presidents of the groupswere simply instructed to hand out the surveys and not say anythingin the way of instructions. The first four groups were chosen in an
14 One-third of the entitlement score is based on the average of the individualanswers to question seven on the survey in appendix one, and the remaining two-thirds is ascertained from the interview with the president. The formula for calculat-ing the entitlement score is given in appendix two.
15 A copy of the questions asked and the answers given by the president of eachgroup as well as the equation used to determine specialization, impermeability, andthe Gross and Rayner grid and group scores is given in appendix two.
16 A coded copy of the survey as well as how grid and group were scored is provid-ed in appendix one, so the reader can try to determine for himself or herself whetherthese questions adequately measure the social context.
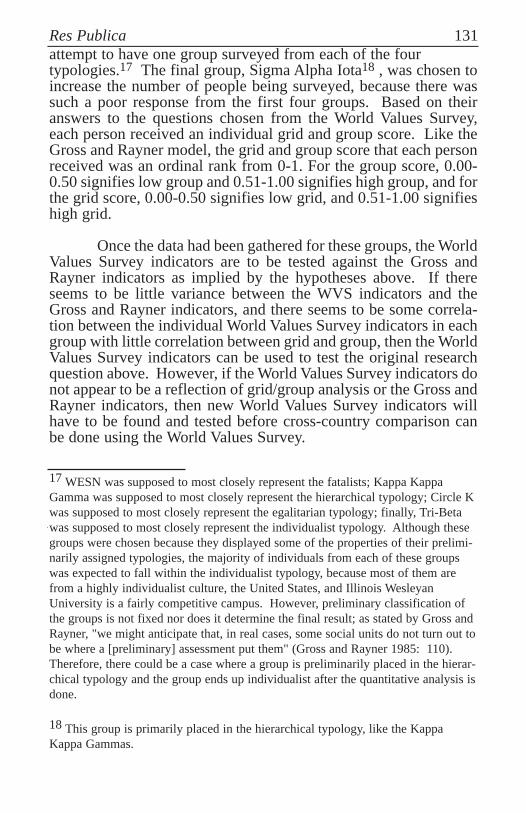
Res Publica 131attempt to have one group surveyed from each of the four typologies.17 The final group, Sigma Alpha Iota18 , was chosen toincrease the number of people being surveyed, because there wassuch a poor response from the first four groups. Based on theiranswers to the questions chosen from the World Values Survey,each person received an individual grid and group score. Like theGross and Rayner model, the grid and group score that each personreceived was an ordinal rank from 0-1. For the group score, 0.00-0.50 signifies low group and 0.51-1.00 signifies high group, and forthe grid score, 0.00-0.50 signifies low grid, and 0.51-1.00 signifieshigh grid.
Once the data had been gathered for these groups, the WorldValues Survey indicators are to be tested against the Gross andRayner indicators as implied by the hypotheses above. If thereseems to be little variance between the WVS indicators and theGross and Rayner indicators, and there seems to be some correla-tion between the individual World Values Survey indicators in eachgroup with little correlation between grid and group, then the WorldValues Survey indicators can be used to test the original researchquestion above. However, if the World Values Survey indicators donot appear to be a reflection of grid/group analysis or the Gross andRayner indicators, then new World Values Survey indicators willhave to be found and tested before cross-country comparison canbe done using the World Values Survey.
17 WESN was supposed to most closely represent the fatalists; Kappa KappaGamma was supposed to most closely represent the hierarchical typology; Circle Kwas supposed to most closely represent the egalitarian typology; finally, Tri-Betawas supposed to most closely represent the individualist typology. Although thesegroups were chosen because they displayed some of the properties of their prelimi-narily assigned typologies, the majority of individuals from each of these groupswas expected to fall within the individualist typology, because most of them arefrom a highly individualist culture, the United States, and Illinois WesleyanUniversity is a fairly competitive campus. However, preliminary classification ofthe groups is not fixed nor does it determine the final result; as stated by Gross andRayner, "we might anticipate that, in real cases, some social units do not turn out tobe where a [preliminary] assessment put them" (Gross and Rayner 1985: 110).Therefore, there could be a case where a group is preliminarily placed in the hierar-chical typology and the group ends up individualist after the quantitative analysis isdone.
18 This group is primarily placed in the hierarchical typology, like the KappaKappa Gammas.

Data Analysis
Based on the length and the survey, the way it was imple-mented, and the size of the groups surveyed, I should have gottenapproximately a fifty-percent response rate, or slightly less than150 respondents. However, two problems were encountered duringthe administration of the survey, as shown in the table below.
First, there were fewer respondents than expected, and this poses aproblem because there is a very large confidence interval for asmall number of respondents and, consequently, it will be hard toverify the data supplied is valid even if it is significant. This prob-lem was partly solved by increasing the number of groups to five,so the total number of respondents was ninety-four giving a confi-dence interval of just under ten-percent. In addition, rather thanchoosing to show a strong correlation or significance between theWorld Values Survey indicators and the Gross and Rayner indica-tors, the variance between the two indicators was measured,because no matter what significance or correlation was given, itwould not matter much due to the low number of respondents. Thesecond problem was a varying number of respondents from each ofthe groups did not indicate the number of members from the groupthey performed each activity with, and this poses a problembecause frequency and scope scores cannot be determined for theserespondents. Therefore, these respondents were only used to deter-mine the correlation between the groups and their grid and groupscores; they were not used in determining the variance between theWorld Values Survey indicators and the Gross and Rayner indica-tors, because their responses did not take part in figuring thegroup’s Gross and Rayner scores.
132 Culture

The first hypothesis is that there should be less than 0.119
variance between the Gross and Rayner scores20 and the WorldValues Survey scores. The variance is determined by subtractingthe Gross and Rayner score for each group from the World ValuesSurvey score for each individual.21 These individual varianceswere then averaged to give an average variance for each group’sgrid and group score. The average variance for each group is givenin the table below:
Based on this data, there is only one group that has a grid varianceless than 0.10 and two groups that have a group variance22 less than0.10. Therefore, at first glance, the first hypothesis seems false,because a majority of the groups’ grid and group variances do notfall below the 0.10 level. However, there are two groups that a gridvariance close to the 0.10 level and one group that have a groupvariance close to the 0.10. In addition, the WESN group appears tobe an outlier, because they have a grid variance of -0.38 and a groupvariance of 0.23, which are both much higher than any other groupsvariances. Therefore, if we eliminate the outlier, there is only onegroup that does not fall below or come close the 0.10 level for gridvariance and one group that does not fall below or come close tothe 0.10 level for group variance. Furthermore, if we take the aver-age of the absolute value of the variances, not including the outlier,
Res Publica 133
19 This number is based on a 5% margin of error in both the World Values SurveyIndicators and the Gross and Rayner indicators to give a total of 10% margin of error,or 0.10, in both measures together. In addition, the confidence interval for 95 respon-dents is about 10%.
20 The scores for all the Gross and Rayner indicators as well as the Gross and Raynerscore for grid and group is given in appendix 2.
21 The formula used for determining the variance is given in appendix 3.
22 WESN is probably an outlier due the small number of respondents being used todetermine this variance. There were only five usable respondents, and this meansonly 7.9% of the group is represented by these numbers.

134 Culturewe get an average grid variance of 0.12 and an average group vari-ance of 0.11. Both of these numbers are very close to the thresholdlevel of 0.10 percent. From this data, it can be determined groupseems to be a slightly more valid measure than grid, because it hastwo rather than just one group that falls below the threshold leveland its average variance is lower than grid’s average variance. Inaddition, both indicators seem to be measuring what they are sup-posed to or something very close. Therefore, since the thresholdlevel was chosen ambiguously based on an assumed margin of errorand the indicators seem to be measuring something closely resem-bling what they are supposed to and the confidence interval isslightly higher than expected, this data does not negate hypothesisone or the World Values Survey indicators.
The second hypothesis says that there should be a relative-ly strong correlation between the grid scores for members of thesame group and the group scores for members of the same group.Based on this hypothesis, we would expect high group correlationsfor "group/grid score" and "group/group score" below, and wewould expect the correlation for primary member23 to be strongerthan non-primary members. In the table below, the correlationcoefficients Eta and Cramer’s V are used to show correlation.
23 Primary group members are those that answered "yes" to question number eightin appendix 1.

Res Publica 135The correlation coefficient Eta shows the correlation
between nominal and interval data24 , so for the variables used todetermine Eta were the individual grid and group scores for theWorld Values Survey and the group the individual belonged to. Thedata pattern suggested by the hypothesis is supported by Eta. Thecorrelation between the grid score and members of the same groupis 0.547, which is pretty strong, and this increases to 0.709 for pri-mary members and 0.562 for non primary members. The correla-tion between group score and members of the same group is 0.446,which is strong but not as strong as grid, and this increases to 0.633for primary members and 0.457 for non primary members.Therefore, the correlations given with Eta support the secondhypothesis.
The correlation coefficient Cramer’s V show the correlationtwo sets of nominal data, so for this measure, the grid and groupscores for the World Values Survey Indicators were broken downinto high and low categories.25 Consequently, for this measure, thedata looses some of its preciseness, but the bonus is that the signif-icance of the measure can be determined. The data pattern sug-gested by the hypothesis is supported by Cramer’s V, but it is muchmore ambiguous. The correlation between grid scores of membersof the same group is 0.568 and the correlation between groupscores of members of the same group is 0.353; however, the groupscores correlation is significant and the grid scores correlation isnot. In addition, the correlation for grid scores for primary mem-bers is 0.731 and non primary members is 0.783, and the correla-tion for group scores for primary members is 0.564 and for non pri-mary members is 0.192; further, the only significant score is thegroup scores for primary members. Therefore, according toCramer’s V, the group indicators support hypothesis two, becausethe correlations for group scores for all members and primarymembers are significant and strong, as is implied by the hypothe-sis. However, the grid indicators give ambiguous results, becausealthough the correlations are strong, the non primary membersshow a stronger correlation than primary members and none ofthem are significant. Overall, for both the Eta and Cramer’s V, thedata for the group indicators strongly supports hypothesis two, andthe data for the grid indicators, although somewhat more ambigu-ous, supports hypothesis two as well.
24 Even though the World Values Survey indicators provide ordinal data, the natureof the data allows Eta to be used as a correlation coefficient.
25 High grid and group are all values between 0.51 and 1.00. Low grid and groupare all values between 0.00 and 0.50.

136 CultureThe third hypothesis is that there should not be a strong cor-
relation between the grid and group indicators. Spearman’s Rhowas used to test this correlation, because it tests the correlationbetween two ordinal measures. The Rho value for the World ValuesSurvey indicators for grid and group was -0.254 and it was signifi-cant at the 0.01 level. The hypothesis implies that there should notbe a significant correlation, but if there is one, it should be small.A Rho of -0.254 is relatively small, but a little higher than would beexpected. However, this does not negate the third hypothesis,because since the correlation is so small, it is probably a result ofthe limited size and location of the population tested. Therefore,hypothesis is not disproved.
Conclusion
Based on the results above, none of the hypotheses arerebutted by the data provided. There are problems and ambiguitiesin the data for all the hypotheses. However, since none of themwere shown false and the general data trend supports the fact thatthese indicators are valid, the World Values Survey indicatorsshould be able to be validly used as indicators of grid and group infuture research with grid/group analysis. These indicators willundoubtedly be shown as quite useful in doing large scale studiesusing grid and group. Two future research experiments that newindicators could be used for seem particularly interesting andimportant: mapping cultural change over time throughout coun-tries to find trends and possibly predict future change and trying toshow how rational choice, institutionalist, and culturalist theoriestogether make a powerful tool for explaining how individual’smake decisions.
However, one must be careful trying to use these indicatorsfor future research. The data gathered should be used to determinepercent of the different typologies within a country and not just thata country is mostly a particular typology. The intricate workings ofgrid/group analysis in everyday cultural interactions are highlydependent on the interaction between groups, not just that mostlyone group is present in a society.26
26 Douglas and Ney say, "A culture builds its legitimacy on its own foundation ofcertainties that contradict the certainties of each of the other cultures…The theorynow assumes that in any community all four kinds of culture are potentially present,usually actualized, and in continual conflict" (Douglas and Ney 1998: 104). Basedon this quote it is apparent that for grid/group analysis to work correctly all the cul-tures are present interacting and shaping each other constantly.

Res Publica 137Therefore, these indicators can be used to test the spread of
the different typologies throughout a society, but not just that asociety is mostly of one culture or another, due the importance ofthe interaction between cultures. However, if used correctly, theseindicators should work as an indicator of grid and group, and hope-fully, help future researchers further establish grid/group analysisas a powerful tool in individual’s decision making.

138 Culture

Res Publica 139

140 Culture

Res Publica 141

142 Culture

Res Publica 143

144 Culture

Res Publica 145

146 CultureAppendix 3: Variance: Graphically and Statiscally Shown

Res Publica 147

148 Culture

Res Publica 149Works Cited
Caulkins, Douglas. "Is Mary Douglas’s Grid/Group Analysis Useful for Cross-Cultural Research?" Cross-Cultural Research. 33.1 Feb. 1999: 108-129.
Douglas, Mary. Cultural Bias. London: Royal Anthropological Institute, 1978.
Douglas, Mary. "Introduction to Grid/Group Analysis." Essays inthe Sociology of Perception. London: Routledge and Kegan Paul, 1982.
Douglas, Mary and Aaron Wildavsky. Risk and Culture: An essayon the selection of technological and environmental dangers. Berkeley: University of California Press, 1982.
Douglas, Mary and Steven Ney. Missing Persons: A Critique of the Social Sciences. Berkeley: University of California Press, 1998.
Eckstein, Harry. "A Culturist Theory of Political Change." The American Political Science Review. 82.3 Sep. 1988: 789-804.
Ellis, Richard J. and Fred Thompson. "Culture and the Environment in the Pacific Northwest." American PoliticalScience Review. 91.4 Dec. 1997: 885-895.
Gross, Jonathan L., and Steve Rayner. Measuring Culture: AParadigm for the Analysis of Social Organization. New York: Columbia University Press, 1985.
Lockhart, Charles. "Cultural Contributions to Explaining Institutional Form, Political Change, and Rational Decisions." Comparative Political Studies. 32.7 Oct. 1999:862-894.
Ney, Steven and Nadia Molenaars. "Cultural Theory as a Theory of Democracy." Innovation: The European Journal of Social Sciences. 12.4 Dec. 1999: 489-510.
Thompson, Michael, Richard Ellis, and Aaron Wildavsky. CultureTheory. Boulder: Westview, 1990.

Wildavsky, Aaron. "Choosing Preferences by Constructing Institutions: A Culturist Theory of Preference Formation."The American Political Science Review. 81.1 March 1987:3-22.
World Values Study Group. World Values Survey, 1981-1984 and 1990-1993 [Computer File]. 2nd ICPSR version. Ann Arbor, MI: Institute for Social Research [producer], 1999.Ann Arbor, MI: Inter-university Consortium for Political and Social Research [distributor], 1999.
150 Culture